
Development of a New Method to Support a Participatory Planning for Piped Water Supply Infrastructure in Informal Settlements

1
Chair of Water Supply and Groundwater Protection, Darmstadt University of Technology, 64289 Darmstadt, Germany
2
IWW Water Centre, 64584 Biebesheim, Germany
*
Author to whom correspondence should be addressed.
Water 2022, 14(8), 1316; https://doi.org/10.3390/w14081316
Submission received: 12 March 2022
/
Revised: 12 April 2022
/
Accepted: 14 April 2022
/
Published: 18 April 2022
(This article belongs to the Section Urban Water Management)
Abstract
:For decades, infrastructure planning in informal settlements has been a major challenge for urban planners and engineers. In particular, the planning process for the rapidly changing heterogeneous structures in these areas usually require individual and non-sustainable solutions. In this report, a method for the sustainable and practical planning of a piped water distribution system (WDS) that generates different expansion variants as a planning support tool is presented. In this tool, all real-world routing options are included in the decision-making process, based on the existing infrastructure, settlement structure, and identifiable open spaces. Additionally, proposals for the localization of the future public water points are supported by methods from Logistics. The consideration of the existing settlement structure and real route lengths (pedestrian walking distance) to a potential water point location lead to very practical and realizable results. The principle of participatory planning was considered, to easily include individual adjustments at any given timeframe. At the same time, automated processes generate fast results. The method is modular and linked to a geographic information system (GIS) to directly visualize the impacts and effects of the planning and decision-making process.
1. Introduction
Due to the rapid increase in population in conjunction with ongoing urbanization, developing and emerging cities and countries, especially in Africa, Asia, and South America, have been facing growing challenges in terms of providing suitable infrastructure in cities for decades. Although more than half of the population living in these countries inhabited rural areas in 2018, the total population living in cities is forecasted to increase by around 20% (Africa) and 10% (Asia) by the year 2030, meaning that most of the world’s fastest-growing cities are located on these two continents [1]. The reasons for the formation and development of informal settlements are manifold and not part of this report. The percentage of the urban population living in informal settlements has decreased from 46% to 26% between 1990 and 2016. However, this supposed progress is deceptive, as it is largely offset by continued population growth and urbanization, resulting in over 1 billion people presently living in slums or informal settlements [2]. The upgrading of these settlements to improve the living conditions of the people has been a declared a goal of numerous actors (authorities, non-governmental organizations, population, etc.) for decades. With the inclusion of the right to access to clean drinking water in the United Nations Sustainable Development Goals [3] in 2010, its provision is considered a human right, but it is not binding. Nevertheless, it is seen as an important political signal.
The inhabitants of informal settlements and slums usually live in very confined spaces and under low living standards. Above all, the lack of adequate electricity, water supply, sewer systems, sanitation facilities, wastewater treatment plants, and developed road networks play a major role to their living conditions. The approach of centralized WDS and sanitation concepts has been in place for around 150 years and often neglects informal settlements due to financial, ecological, and social aspects [4]. On the other hand, physical improvements and the introduction of basic services are an essential part of improving the living conditions of the population residing in these settlements [5,6]. However, it must be taken into account that informal settlements cannot be treated as homogeneous units [7], which results in different requirements for the introduction of infrastructures. While some settlement areas may have had a functioning water supply infrastructure for years, there are a lack of necessities in others.
The development or revision of new or existing strategies for the successful planning and implementation of upgrading measures has been a much-discussed topic for decades. Whereas in the past, solutions were met with demolition and relocation measures [8], today’s approaches try to keep these to a minimum or to possibly avoid them [9,10]. Upgrading strategies responding to local conditions and opportunities are now considered to be more effective [11]. This approach, also known as the “in situ” approach, is characterized by the involvement of the population in planning and implementing progress [9]. Assuming that informal settlements are to be developed into formal areas, the biggest challenge with regard to a WDS and sanitation concept is the introduction of these systems to existing built-up areas and unstructured, densely populated areas that are subject to constant change (expansion, densification, resettlement, immigration). The sewer system is not explained in more detail in this paper, but can basically be carried out in the same way with the developed method. The development of a masterplan is, therefore, a lengthy and time-consuming process. As a result of the complex dynamics, it is possible that the masterplan is outdated at the start of construction. Therefore, the development of planning tools that generate rapid expansion proposals based on an area analysis is becoming increasingly important [10]. Engaging the public in the planning process also requires the use of tech-support systems to understand the impact of various decisions (Abbott [7]: “technical support needed to understand the implications of different decisions.”). As such, they do not replace expert knowledge on site, but can be used as a supporting tool in the planning process.
In the following, a method for a fast and automated generation of topology options for a WDS is presented, which takes individual planning specifications in unplanned or unstructured areas into account. It is aimed at informal settlements without fixed structures or settlement areas, where reaching a public water point is only possible with considerable effort. The spatial planning process is based on available open space and existing roads, such that demolition or relocation of the population is avoided. The close coupling to a GIS visualizes the initial spatial situation and the effects of decisions regarding the routing. Thus, it enables the inclusion of various stakeholders in the planning process. The tool can be used to create a basis for discussion, as well as to investigate varying boundary conditions in an advanced planning stage. The method is implemented in the programming language Python and combines tools from algorithmic geometry, graph theory, Logistics, and mathematical optimization. The method is exemplarily applied to an informal settlement area of the city of Windhoek (Namibia), which is facing major challenges with respect to future water supply.
The paper is divided into five sections. In Section 2, a brief review of the state-of-the- upgrading measures and approaches to automated water network generation is given. Next, based on the case study, the data and software, as well as the method itself, are presented in Section 3. The report concludes with a critical review of the results (Section 4) and a discussion of possible further developments (Section 5).
2. State-of-the-Art
The development of a method for planning support for the introduction of a piped water supply in informal settlements results in an interdisciplinary problem. While on the one hand, automated processes should deliver fast results, the method has to be able to integrate individual (and possibly non-optimal) constraints. The method developed in Section 3 combines a participative upgrading approach with an automated network generation. For both approaches, a brief overview is given below. For a detailed description, please refer to the corresponding sources.
2.1. Informal Settlement Upgrade and Water Supply
The term “informal” settlement has no fixed definition. In this report, it is to be understood as the antithesis of a formal settlement. It refers to unplanned, illegally occupied areas that have development built without regard to formal specifications. Depending on the literature, one can also find the synonymous terms “marginal settlements”, “slums”, or more rarely “illegal settlements”. Depending on the usage, the focus in the given context is more on a legal, social, or humanitarian approach. They are often located in the periphery of a city and are founded haphazardly and without land ownership in the context of urbanization and population growth. A “slum”, on the other hand, is a settlement that meets one of the following criteria [12]:
- Insecure residence status;
- Inadequate access to safe water;
- Inadequate access to sanitation and other infrastructure;
- Overcrowding.
Unlike informal settlements, slums can arise in originally planned, formal areas. In this report, however, the two terms are used synonymously.
The focus of today’s upgrading approaches for informal settlements is on incremental development strategies based on physical plans with the involvement of the population (“participatory planning”) and a conversion/redesign of areas [13]. In areas without water supply or a water point in the immediate vicinity, phased development means that initial activities are designed to improve the accessibility of the water points. The World Health Organization [11] broke down the accessibility of a water point and a person-related daily water consumption into four categories. They are the result of a review of numerous studies and relate water quantity, coverage, and health. It indicates that water consumption per household is primarily determined by accessibility, expressed as the distance (pedestrian walking distance) to the water point. Other influencing factors are continuity, reliability, and the price to be paid. A strong increase in water consumption is particularly evident after the introduction of house connections. This supports the findings of Cairncross [14], who already pointed out that, especially in the immediate vicinity of an water point or its accessibility within a few minutes, consumption increases, while it remains constant (low) for a longer time at a distance >5 min (running time on foot). The information given in Table 1 is from the categorization of the World Health Organization [11], but only includes the data necessary for this report. In informal settlements with low service levels, water is drawn from the water supply network via public water points (standpipes/communal taps). Public water points are taps/standpipes that provide water through, for example, a prepaid system. This type of supply is established in most Sub-Saharan countries and is widely accepted by the population. In this context, Sarkar [15] emphasizes that the introduction of public standpipes results in lower capital costs per household served for a utility than an equivalent amount of individual connections.
Participation and transparency mean that collective planning, social interaction, communication, and discussion must be considered in the planning process. Abbott [7] highlights the use of GIS systems in the context of community-based decision-making processes. GIS systems enable the inclusion and processing of geo-referenced information and provide project participants access to this information. Furthermore, the visualization possibilities of spatial contexts via GIS make it possible to provide a good information base regarding planning, upgrading measures, and consequences. This strengthens the local community’s engagement with the municipality and creates a basis for an interaction between the stakeholders. This approach ultimately strengthens acceptance for individual decisions and thus contributes to the success of an upgrading measure.
Nevertheless, the introduction of an underground infrastructure is complex and expensive. The often low income levels of the population residing in these areas leaves little room for possible refinancing of the measure, so a pragmatic solution that effectively minimizes the costs must be found. In addition, there is often a lack of information that is essential for the planning of infrastructures or the provision of services. In terms of gaining geographic information, new approaches such as Rausch et al. [16] and Leonita et al. [17] used aerial photography. In general, there are numerous research approaches for slum recognition, its mapping and classification from high-resolution aerial photography [18,19,20,21,22,23], etc. Remote sensing research approaches also exist for the automated mapping of roads and trails. Wang et al. [24] present some of these approaches and highlight existing challenges. This form of data generation has advantages over traditional data collection due to its local reference, timelines, and transparency. It allows for the quick generation of preliminary plans based on actual existing conditions, or at least a base for discussion, which can be used for further planning. Moreover, as shown by Lucci et al. [25] and Leonita et al. [17], traditional data collection (questionnaires/census data, manual surveys, and mapping, etc.) is prone to errors for a variety of reasons and can, therefore, make consistent planning difficult, thus compromising the success of an upgrading effort. The use of image recognition technology is not an explicit component of this report. However, it should be noted that georeferenced data is what enables the use of automated territory planning processes in the first place, and automated aerial photo interpretation can provide rapid results.
2.2. Approaches to the Automated Planning of a Piped Water Supply System
In recent years, several approaches for automated network generation that specifically target formal and urban settlement areas and enable the analysis and comparison of different water supply structures have been developed. The background of automated network generation is that water supply is a critical infrastructure, so that data for research purposes and publications are usually not readily available, especially on a large scale [26]. However, even if data from utilities are made available for research purposes, their modeling or the creation of a hydraulic model is very time-consuming depending on the size of the settlement.
Sitzenfrei [27] presents a summary of different network generation approaches and developed the software tool WDS Designer [28]. It is a tool for the algorithmic generation of water distribution systems based on GIS data. By using raster data for population, building density, geodetic heights, and predefined network structure blocks, different virtual networks or case studies can be generated and can subsequently be used to investigate the performance of existing systems. The approach is part of the projects VIBe and DynaVIBe [29], and was further developed by implementing a graph concatenation approach (GCA) and integrated into a MATLAB® environment. The mesh is created based on a grid structure, where each grid point can be assigned a stochastic deviation to vary its position. The predefined grid structure blocks differ in the degree of connectivity, number of branches, structural differences, number of nodes in a block, and number of redundant connections [30]. An interface to the hydraulic solver EPANET 2 allows the hydraulic investigation of the network, as well as diameter optimization. According to Sitzenfrei et al. [30], the tool shows good results when comparing the hydraulic properties of the automatically generated network with a real network. Thus, it allows the investigation of different expansion variants from a hydraulic point of view or with regard to performance capacities. Furthermore, it allows a rough estimation of the construction costs of water supply systems in urban areas based on GIS data. However, it must be noted that the use of raster data shows that the routing does not represent the real settlement structure. In addition, informal settlements are very heterogeneous [7]. As a result, the predefined network structure blocks may not be able to properly represent the settlement structure.
Zischg et al. [31] present an approach for the automated creation of future water distribution networks. Starting from the current network, potential future city structures from master plans or the future targeted road network are integrated into the model. Scenarios can be simulated and hydraulically evaluated with regard to uncertainties related to population development and stepwise disconnection and connection of network elements. Subsequently, planning and adaptation concepts for the replacement of pipes are derived from this to ensure future performance.
Furthermore, Rehm et al. [26] use the concept of parallel infrastructures [32] and generate a maximum possible WDS, which is modeled as a graph, based on data about the existing traffic infrastructure/road network from OpenStreetMap data. In contrast to the algorithmic network generation of Sitzenfrei et al. [30] and Zischg et al. [31], optimization methods are used to generate a realistic urban distribution system. The spatial distribution of water demand is broken down by land use/local climate zone data of the study area, consumption data within a given time period, and location of the closest node. Next, a minimum cost water network connecting all consumption nodes is determined. The optimization problem is formulated as a mixed integer program and results in an interconnected branching network that is fed from multiple sources. Overall, the approach impressively illustrates the potential of georeferenced open-source data for the creation of water supply systems.
With regard to the automated creation of a piped water supply infrastructure in informal settlements, however, there are still a few more approaches. The previously presented approaches cannot be transferred to these settlements without further adaptations. In particular, due to the mostly unstructured, heterogeneous development of informal settlements, which are only partially served by mapped roads, as well as due to varying requirements for the provision of water to the consumer, there are other challenges compared to the routing in formal settlements.
Rausch et al. [16] and Rausch [33] use remote sensing data to create an optimized water supply network with an optimal combination of different supply options. The supply options comprise the provision of drinking water through pipes as well as by different vehicles. The work is focused on the mathematical optimization of a supply network in the form of a cost model that determines an optimal water distribution between different slums, which were identified and subsequently classified from high-resolution satellite data. However, actual possible supply routes, as well as the positions of the individual consumers/shacks, are not part of the model. Supply points and storage facilities are considered in terms of the center point of the previously identified slum area. The optimization model is modeled as a mixed-integer linear problem and solved using the IBM CPLEX optimization solver [34]. Additionally, graphs and cluster algorithms from computer science are integrated into the method.
Brelsford et al. [10] develop a method for the subsequent introduction of a road network that minimizes demolition and costs. The method targets slums with insufficient space to introduce a road or sewer network due to dense development. Based on the actual development, shacks that need to be relocated/reblocked are identified in order to provide proper access to the infrastructure.
The sources show that an automated network generation with different objectives is part of the research. With the exception of the approach of Brelsford et al. [10], these tend to be theoretical approaches or approaches to replicate existing systems. The authors are not aware of a method for the automated generation of a piped water supply infrastructure in informal settlements that is based on the actual settlement topology or individual objects (shacks) and that meets the requirements listed in Section 2.1.
3. Materials and Methods
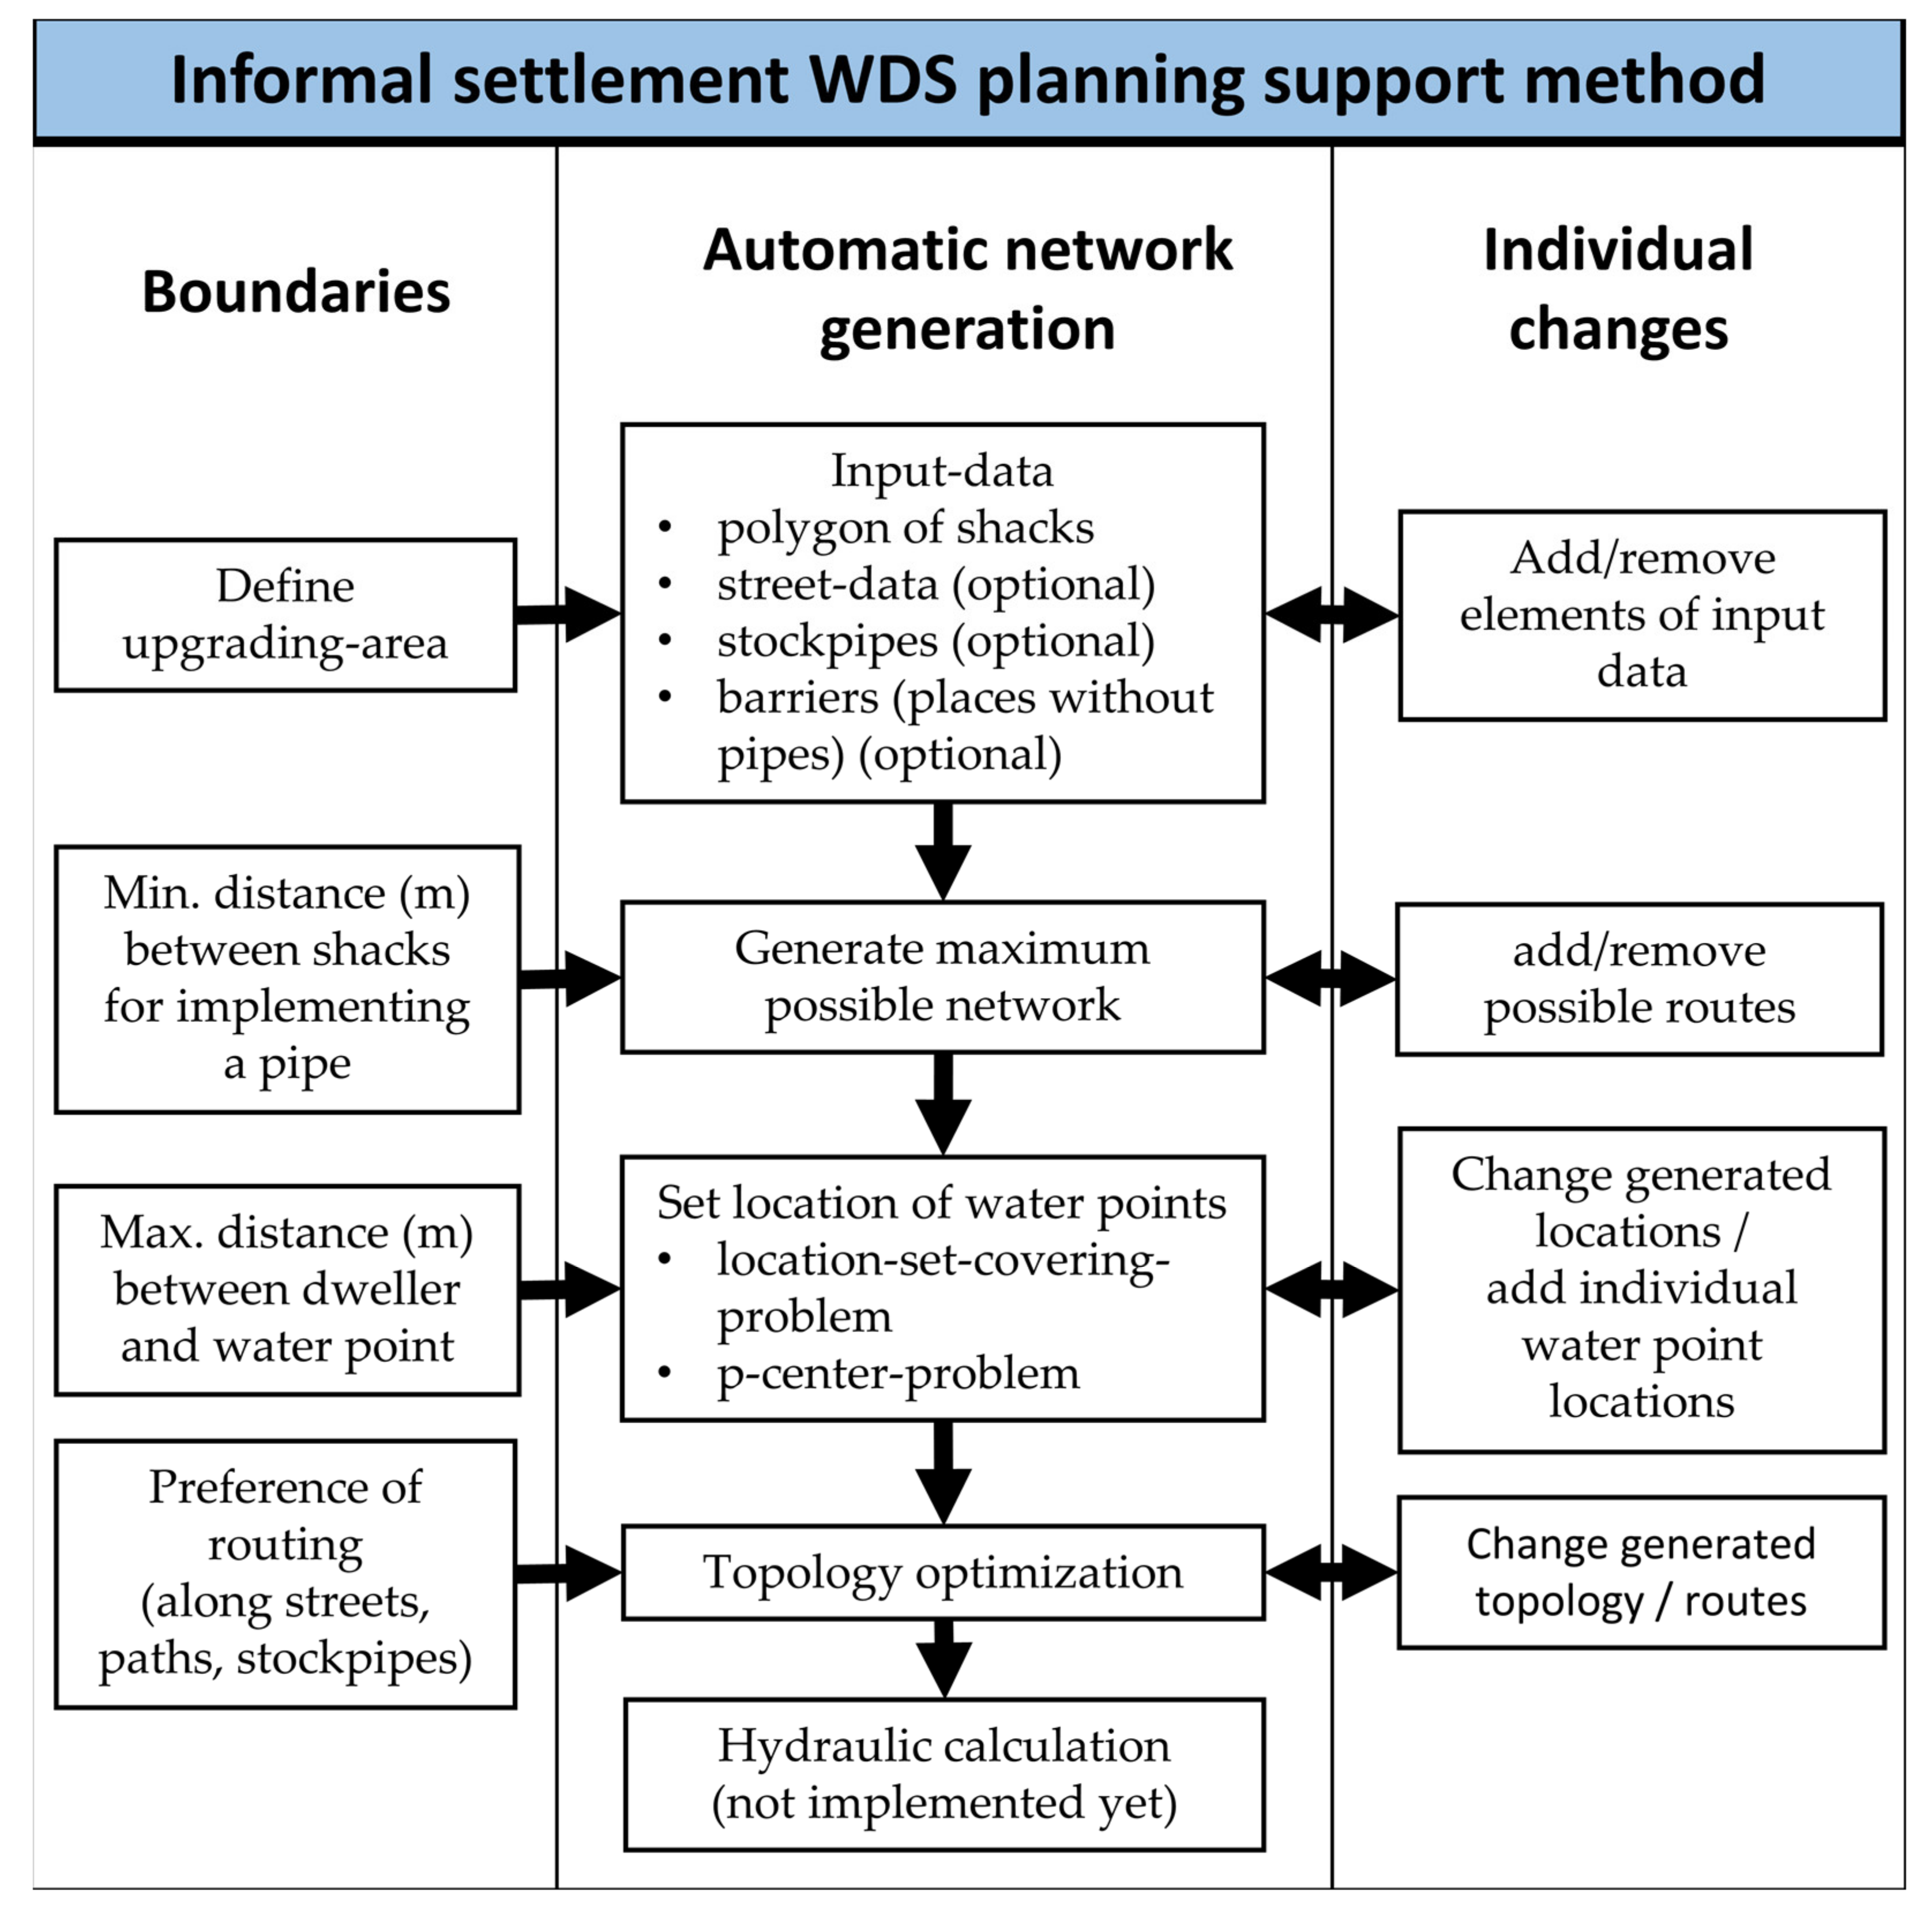
In the following, a method for the automated network generation of a WDS is presented. The method is divided into five consecutive steps, which are discussed in detail in Section 3.2, Section 3.3, Section 3.4 and Section 3.5. Its modular structure is shown in Figure 1. The close coupling of the method to QGIS allows manual interventions at any time based on the visualized processing status.
First, all available input-data on the building structure, road network, existing pipes, and barriers are loaded. The user then determines the area to be investigated and, if desired, can add or remove the input data individually. Based on the input data, the maximum possible network that includes all theoretically possible routes is created. The user can then define a minimum width between the buildings, which will be considered in the network generation. If (theoretically) possible routes have to be excluded from the outset, they can be removed individually. By integrating methods from Logistics with the maximum possible routes and nodes of the network, locations for water points are then determined. For this purpose, a maximum distance must be selected within which a dweller can reach a water point. If some of the generated locations should be changed due to deviating criteria, individual interventions in the QGIS environment can be done. In the subsequent topology optimization, the most cost-effective route is determined to connect the water points with the feed. Lastly, the method allows one to differentiate the costs of a route along roads, paths, or the use of already-existing pipes. If desired, the generated routing can be modified individually by the user. It must be noted that the optimization of the diameters and hydraulic calculation is not part of this report.
The method does not generate one fixed layout, but offers extension suggestions that can be integrated into the decision-making process in each step. It is, therefore, seen as a planning support tool that determines the network topology through an interaction of defined boundary conditions, automated processes, and individual engineering intervention options. Thus, it clarifies the effects of different planning decisions. The individual modules are described in the following subsections and applied in an accompanying case study of an informal settlement area of the City of Windhoek (Namibia). According to the supply categorization of World Health Organization [11] (see Table 1), it is assumed that the area should be assigned to the category “intermediate access” (daily personal water demand = 50 L; distance to a public water point not more than 100 m) in terms of water supply after the upgrade. The connection and location of the new supply area to the existing WDS is assumed to be given. The localization of reservoirs, pumps, valves, and the hydraulic calculations are not part of the method. However, they can be integrated into a hydraulic calculation (e.g., EPANET 2) at any time.
3.1. Software
To use the newly developed method in practice requires practicable solutions that may not correspond to a global optimum. The application is possible on common computer capacities (Intel Core i7-7920HG CPU @ 3.10 GHz, 16GB SSD-RAM used here) and not dependent on special, high-performance computers in terms of optimization results. The open-source software QGIS [35] is used as the geographic information system and for processing, using the available tools contained in the program by default. All data are freely available from OpenStreetMap [36], containing roads as line vectors and shacks as polygons (.dbf or .shp files). In practice, the data can be replaced by specially generated, and possibly more accurate, datasets. For automated network generation, the method is implemented in the Python programming language [37]. An interface between Python and QGIS allows the use of QGIS editing tools directly from the Python environment. At the same time, QGIS is used to visualize the intermediate results and allows for manual interventions to be integrated into the subsequent processing steps. The network is modeled by approaches from graph theory using the Python library NetworkX [38]. If not specified individually, the localization of the water points is done by a location set covering problem in interaction with an unweighted vertex p-center problem. The location set covering problem can be formulated using Google Python’s open-source OR-Tools software suite [39] and solved in acceptable time using the open-source COIN-OR Branch and Cut solver [40]. Our own research shows that the open-source solver solves the p-center problem in acceptable time, but only for smaller study areas (approximately 180 shacks and 260 nodes). If an arrangement of water points (see Section 3.4) for larger survey areas is required, a Gurobi solver [41] will be used for the p-center problem.
3.2. Delimitation of the Upgrading Area and Data Import
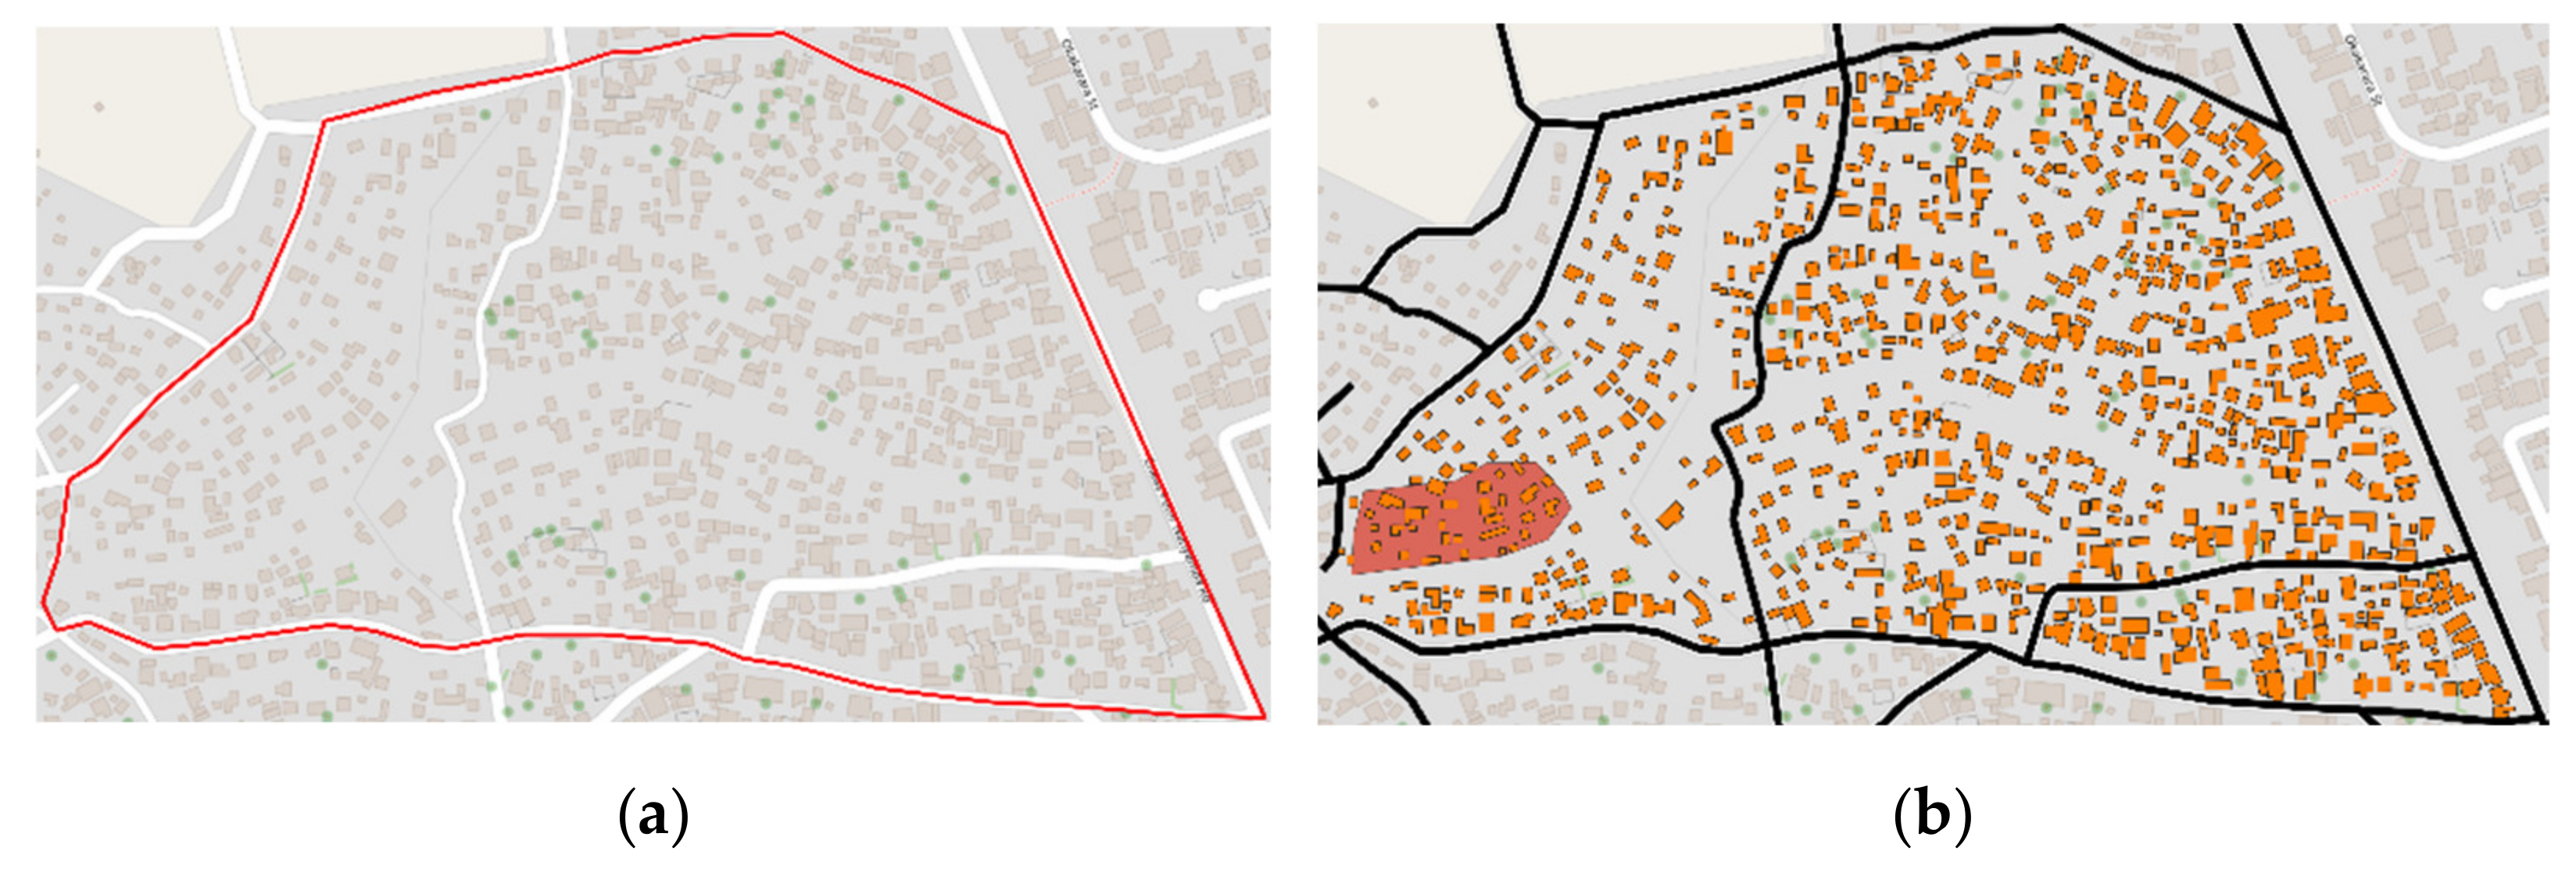
The first step is to delineate the area of interest (Figure 2a) and import the available data into QGIS. The minimum requirement for this method is georeferenced data on the building structure in the form of building boundaries (as polygons). Depending on data availability, the built-up structures can be taken from GIS systems, imported from OpenStreetMap data, generated using georeferenced aerial photography and image recognition software, or digitized manually from georeferenced aerial photography. For the selected case study, the building boundaries of the shacks are available in the form of georeferenced, two-dimensional polygons. Optionally, mapped streets/roads (as line vectors), existing pipes (as line vectors), and insurmountable obstacles can be integrated. Insurmountable obstacles or settlement areas that have to be excluded from consideration, referred to as “barriers”, are imported into QGIS as polygons and/or line vectors, or are digitized from aerial photographs. An area marked as a barrier is not available as a potential route. If a barrier is modeled as a line element (e.g., railroad track), it may not be intersected by any potential route. Barriers may include: rivers, floodplains, steep slopes, railroad tracks, multi-lane highways, or subsoil conditions. Elevation data, which will also be used for the hydraulic calculation (not part of this report) later, can be integrated and evaluated to identify steep slopes that cannot be built on. Due to the close coupling of each processing step with QGIS, unwanted routes can also be manually removed or modified later in the generated, and in the QGIS visualized, network.
The data used in this report are shown in Figure 2b. This includes the shacks (orange) as well as existing roads (black). As an example, a non-buildable area was added as a barrier (red-transparent). The selected area under consideration includes 731 shacks in an area of about 0.15 km2.
3.3. Derivation of Potential Routes and Creation of the Maximum Possible Network
Research by Mair et al. [32] shows that the WDS, as well as the sewer system, often run parallel under the urban transportation network consisting of roads and sidewalks. As in Zischg et al. [31], Lorenz et al. [42] and Rehm et al. [26], the concept of parallel infrastructures is applied so that already-mapped roads and paths are considered as potential routes. The data are modeled as line elements. However, in contrast to formal settlement areas, not all paths are mapped in informal areas. In addition, dwellers also use footpaths, backyards, or gardens (summarized as “open spaces” in the following) for movement. Therefore, the concept of parallel infrastructures is expanded to include all undeveloped land as potential route spaces. Based on the settlement structure in the form of the shacks and their distance from each other, it is examined whether sufficient space is available for a potential route. At the same time, the shacks correspond to the position of the consumers for the future supply. Since the method does not include resettlement measures, potential routes are plotted between the shacks so that all medial axis/centerlines between the objects can be generated. This results in a network skeleton model. Gold et al. [43] show that Voronoi polygons can be used for this purpose and highlight their importance in digitizing line objects such as roads, rivers, etc. Voronoi polygons (also Voronoi regions, Thiessen polygons) originate from algorithmic geometry and are used for modeling space, especially for solving geometric distance problems [44,45]. Points p of a point set P in a plane are assigned regions via neighborhood relations, considering their Euclidean distances to each other. A Voronoi polygon describes an area in the plane in which each point is closer to the corresponding center pi than to any other center of the point set P. For two Points pi and pj with i ≠ j of a point set P = {p1, …, pn} in the Euclidian plane and the Euclidean distance d (p,x), the half space Bi,j is defined according to Hiyoshi [46]:
The Voronoi region Vi of the point pi is defined according to Hiyoshi [46]:
Neighboring Voronoi regions are separated by Voronoi edges, whose endpoints are called Voronoi vertices. The course of the Voronoi-edge corresponds to the medial axis between the considered points pi and pj of the point set P.
The heterogeneous arrangement and form of the shacks in informal settlements leads to the fact that several distance relations must be established for neighboring buildings on the basis that the medial axis is determined. If the medial axes were formed using only the centerpoint of the shacks, the orientation and size of the shack would not be taken into account. Hiyoshi [46] investigated the use of Voronoi edges, or rather the dual Delaunay edges, in connection with the curve reconstruction problem, which is closely related to the skeleton model/medial axis. It is shown that Voronoi edges can be used to approximate the medial axis between objects depending on the density of the point set. Therefore, to generate the medial axes between buildings, support vertices at defined intervals along the building boundaries and barrier geometry are created. Starting from these support vertices, the Voronoi polygons are created. Depending on the desired approximation of the medial axes, the distances of the support vertices should be ≤1 m. Subsequently, the medial axis/the elements of the skeleton model correspond to the potential routes. In order to realize the construction measures, specifically the site facilities (minimum width of the trench, dumping of the excavated material for backfilling, accessibility for construction vehicles, etc.), the potential routes must be set to a minimum width. By taking into account a distance buffer, route elements that fall below a minimum distance from the built-up area are removed. In this way, the maximum possible network is reduced according to the actual space conditions and the remaining medial axes are adopted as line elements.
If pipes already exist in the area under consideration, they are also integrated into the model as line elements. The subsequent maximum possible network is then composed of already mapped roads/paths, existing pipes, and the routes identified from open spaces. If existing pipes are to be retained in the future network and/or a routing along mapped roads/paths is to be considered separately, the corresponding elements are given an identifier in the attribute table (Figure 3). This enables a differentiation of the costs in the later optimization (see Section 3.5). The values of the columns “diameter”, “roughness”, and “status” are default values, which are needed for diameter optimization and hydraulic calculation (not part of this publication).
To develop the upgrading area, the new network must either be connected to the existing network at a feeding point or fed via a reservoir. The pressure conditions in the existing network, as well as the topology, determine whether a pumping station or a pressure reducing valve has to be provided at the feeding point, so that, as in the case of feeding via a reservoir, a hydraulically decoupled area (pressure zone) is created. The investigation of an optimal feeding point into the upgrading area is not a subject of this publication. If the terrain topology (max. height difference) permits, for reasons of costs (zone valves, pumping, pressure reducing valves, etc.) and with a view to simple operation, the pipes of the relatively small, newly created upgrading area should be located within one pressure zone. The goal of the network generation is, therefore, to model a coherent network. For this purpose, all line elements are processed with editing tools from QGIS to form a coherent network, which is modeled as a graph. For this purpose, the line elements are broken up at their intersections and nodes are generated at these points, resulting in a planar, undirected, weighted graph that is modeled in the Python package NetworkX [38]. The visualization of the maximum possible network in QGIS allows for predetermined, manual interventions in the routing options.
The computation time of the subsequent optimization algorithm is largely determined by the size of the solution space. Therefore, the maximum possible network is reduced by merging and removing line elements without changing its connectivity. Short line elements are removed or neighboring nodes are merged within a defined radius. If a node connects only two edges (node degree = 2), the node is removed and the two edges are merged into one. However, this cannot be done indefinitely because on the one hand, the nodes represent potential water points, which should be located at a certain distance from the consumers, and on the other hand, the terrain topology is neglected during the hydraulic calculation if the line elements are too long. Furthermore, potential weak points in the network (high points, low points) may remain undetected. Further rules in the network preparation are:
- Removal of parallel edges between two nodes;
- Removal of line elements without a connection to main network;
- Removal of “self loops” (line with identical start and end nodes) by inserting a node in the middle of the line.
After the network modeling, the line lengths are determined and stored in the attribute table.
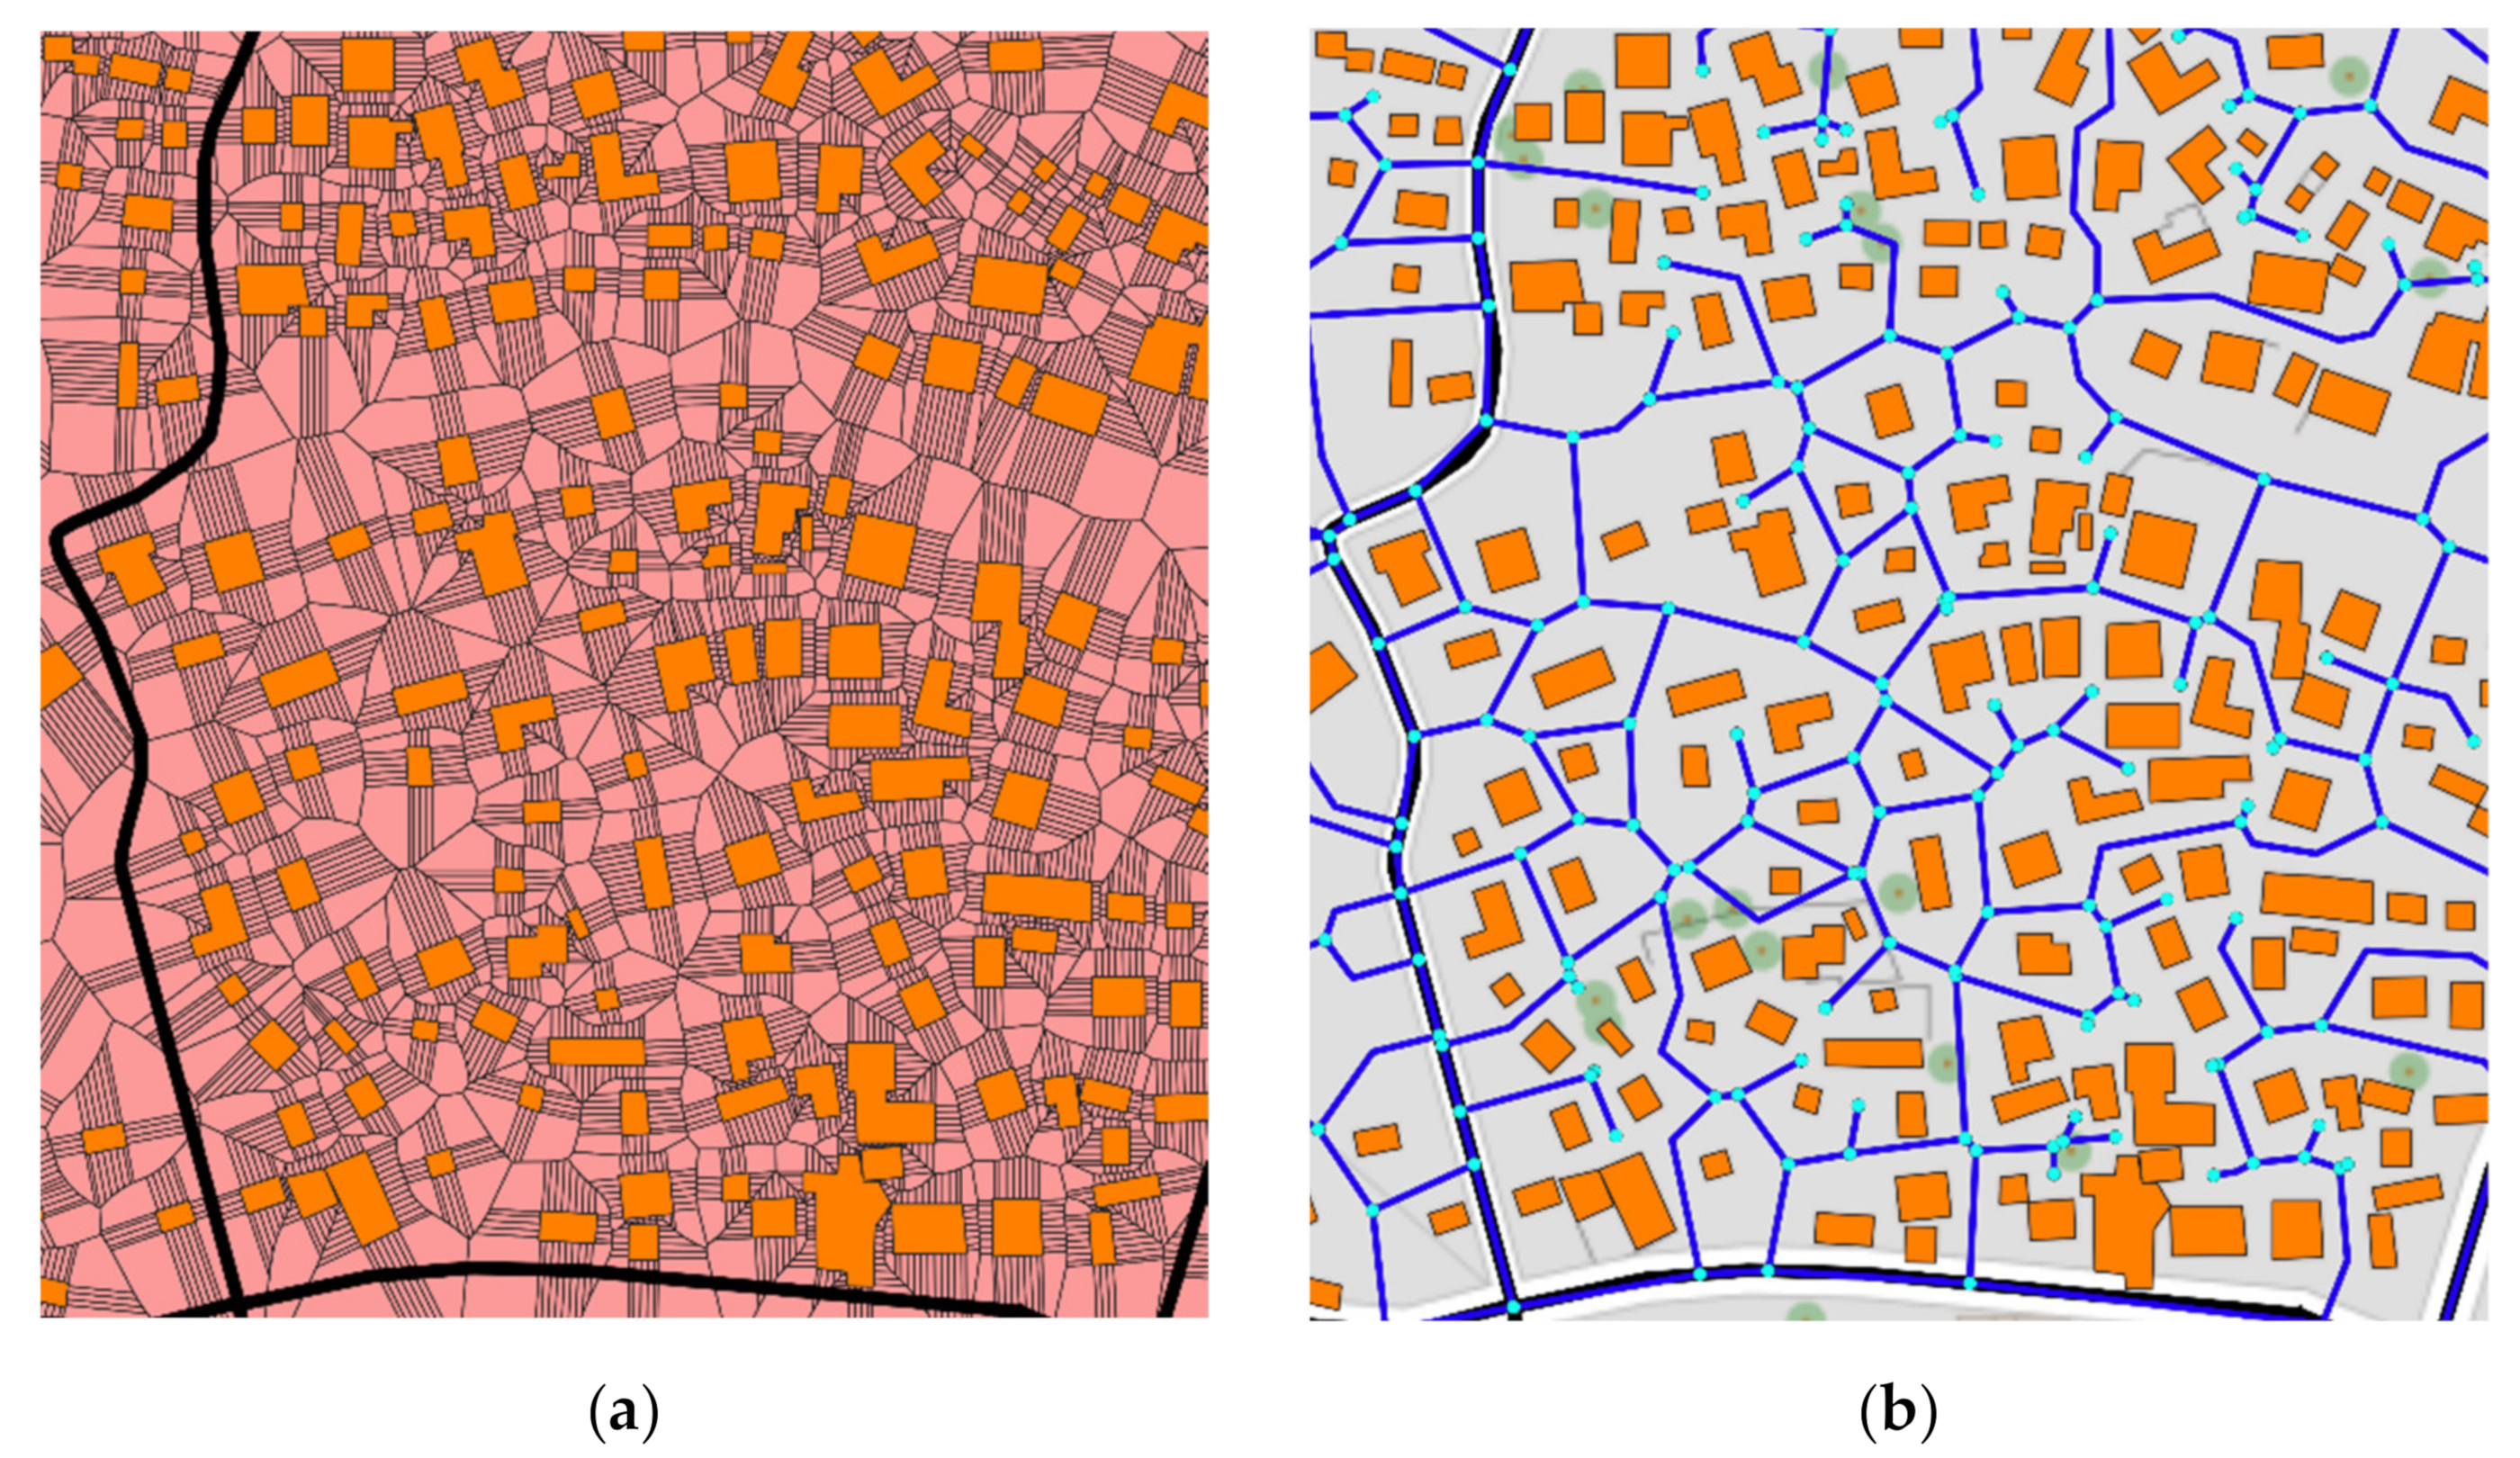
The process of maximum possible network generation is illustrated by means of a section of the area under consideration (Figure 4). Based on the built-up area (orange) [36], Voronoi polygons are generated (Figure 4a) to form a maximum possible network from the mapped-out roads/paths and the generated Voronoi-edges (Figure 4b). The edges of the maximum possible network are displayed as blue lines with cyan nodes. Since water supply is a critical infrastructure, the routing of existing pipes is not shown separately here. The comparatively more direct routing (fewer vertices) in Figure 4b results from the network reduction after the criteria described above. The route lengths remain unchanged. The maximum possible network developed here is comprised of 823 lines and 686 nodes with a total network length of 11.6 km.
3.4. Determination of Water Point Locations
The identification of the “most favorable” routes is a large discrete combinatorial problem for the underlying maximum possible network containing 823 routes as well as 686 potential tap locations (nodes). Rausch [33] also highlights the issue of the very large combinatorial problem in their approach. In order to reduce the computation time, she proposes a decomposition of the overall problem into smaller subproblems. For this purpose, the overall problem, or rather the network possibilities, are reduced using clustering and solved using a heuristic approach. Clustering of shacks into supply blocks would be possible too, but only at the expense of potential routes that run between these shacks and possible water point locations.
If the locations of the water points are not individually predefined, the large number of lines is compounded by the difficulty of locating them in the area under consideration. This means that all nodes within a specific radius of each shack must be considered as potential water point locations, since water demand is modeled by nodes in the network modeling. However, this problem can be turned into an advantage by localizing the water point locations in advance (before starting the topology optimization). In this way, the solution space is reduced. Rezapour [47] uses an example from telecommunications to show that, due to the interaction of decision variables, separating location planning and topology optimization does not generate a mathematically optimal solution. A significant difference to his example, however, is that, there, the pipe is laid right up to the customer, so that costs can be expressed in monetary terms. In the case at hand, the customer has to walk to the water point, so that the costs are personal and, therefore, non-monetary and difficult to quantify (time, water consumption depending on the distance to the tap, health, etc.). Moreover, the practice shows that in a participatory upgrading approach, the localization of the water points is discussed in advance in communication with the population. The method aims at making suggestions and illustrating the impact of such decisions instead of calculating a theoretical optimal outcome. As a result, the location planning of the water points is considered separately from the topology optimization.
The methods for optimized location determination originate from Logistics and Location Science. When setting up logistical networks or planning distribution networks, the question arises on how consumer goods can be optimally distributed or temporarily stored. For this purpose, locations in the planning area have to be identified based on selected criteria. In this case, the consumer good, water, is to be transported via the created maximum possible (water) network to the water points. Thereby, the minimum number of water points that fulfill the condition of a maximum permissible distance of 100 m to the consumers/customers (=category “inter-mediate access”, cf. Table 1) has to be determined. As these are public facilities for water supply, they have to be distributed as “fairly” as possible with regard to their accessibility in the area of interest.
The determination of the number and location of the water points can be solved as a location set covering problem in combination with an unweighted vertex p-center problem. Both methods are part of numerous research activities and have been established in the field of Logistics and Location Science. The location problem is modeled as a discrete model of an undirected network in which all nodes are available as potential water points. The use of a semi-discrete model, in which potential sites can be located in nodes, but also on arbitrary points along an edge, would also be conceivable at this point. However, assuming larger open spaces at intersections for the establishment of water points, as well as the possibility of automated generation of additional nodes at arbitrary distances along an edge, this case can also be approximated with a discrete model [48].
Taking into account a maximum permissible distance between the customer and the water point, the location set covering problem determines the minimum required number of water points, which are later localized via the p-center problem. The distance between the customer and the water point corresponds to the actual distance over the maximum possible network. For this purpose, all connections between the respective center points of each shack and the surrounding nodes of the maximum possible network are generated as paths in order to connect the shacks to the network (Figure 5, red).
Subsequently, the distances to all nodes are determined by using the shortest path method according to Dijkstra from NetworkX. Whether a water point-node is within a distance or not, the information is stored via binary variables in a distance matrix. Due to the underlying network structure, the location set covering problem can consequently be formulated as an integer programming problem [48] using OR tools [39] and solved using the COIN-OR Branch and Cut solver [40]. With a given maximum distance DC to a water point and a distance between the consumer and a water point (=facility) , the location set covering problem is formulated according to Mattfeld et al. [48]:
The allocation variables in (3) and the distance define whether the consumer i can be assigned to the node j ( = 1) nor not ( = 0). The location variable in (4) defines whether node j is a water point ( = 1) or not ( = 0), and is binary (7). Via the objective function in (5), the sum of the water point locations is minimized under the condition that all consumers are assigned to at least one tap (6). The symbol “∀” in (6) and (7) denotes “for all”.
The p-center problem is used in urban planning, for example, to determine the location of public facilities such as hospitals, fire stations, or police stations [49]. While minimizing the total (p-absolute) or average (p-median) distance favors customers living in densely populated areas [49], the p-center problem identifies locations for which a customer’s maximum distance to the water point is minimal (minimax). In other words, the farthest customer is placed as close as possible. With regard to the choice of location of the water points and their associated accessibility, the p-center problem thus supports the chosen principle of as “equitable” an arrangement as possible. The possible water point locations are limited to the nodes of the maximum network. The water points are not weighted, so each location is treated equally regardless of consumption. This results in an unweighted vertex p-center problem, which is formulated according to Mattfeld et al. [48] as an integer programming problem. A binary allocation variable, , is introduced (9), which defines whether a consumer i can be allocated to a water point j ( or not ( (8):
The objective function results in:
It is minimized under the following constraints. Here, is a binary location variable (14) that indicates whether a node is water point location ( = 1) or not ( = 0):
The number of water point locations, p, were previously determined using the location set covering problem. This is taken into account in (11) by making the sum of the water point locations equal to p. Equation (12) states that each consumer may be assigned to exactly one water point, while (13) allows an assignment of a consumer ( = 1) only if the node corresponds to a water point location ( = 1).
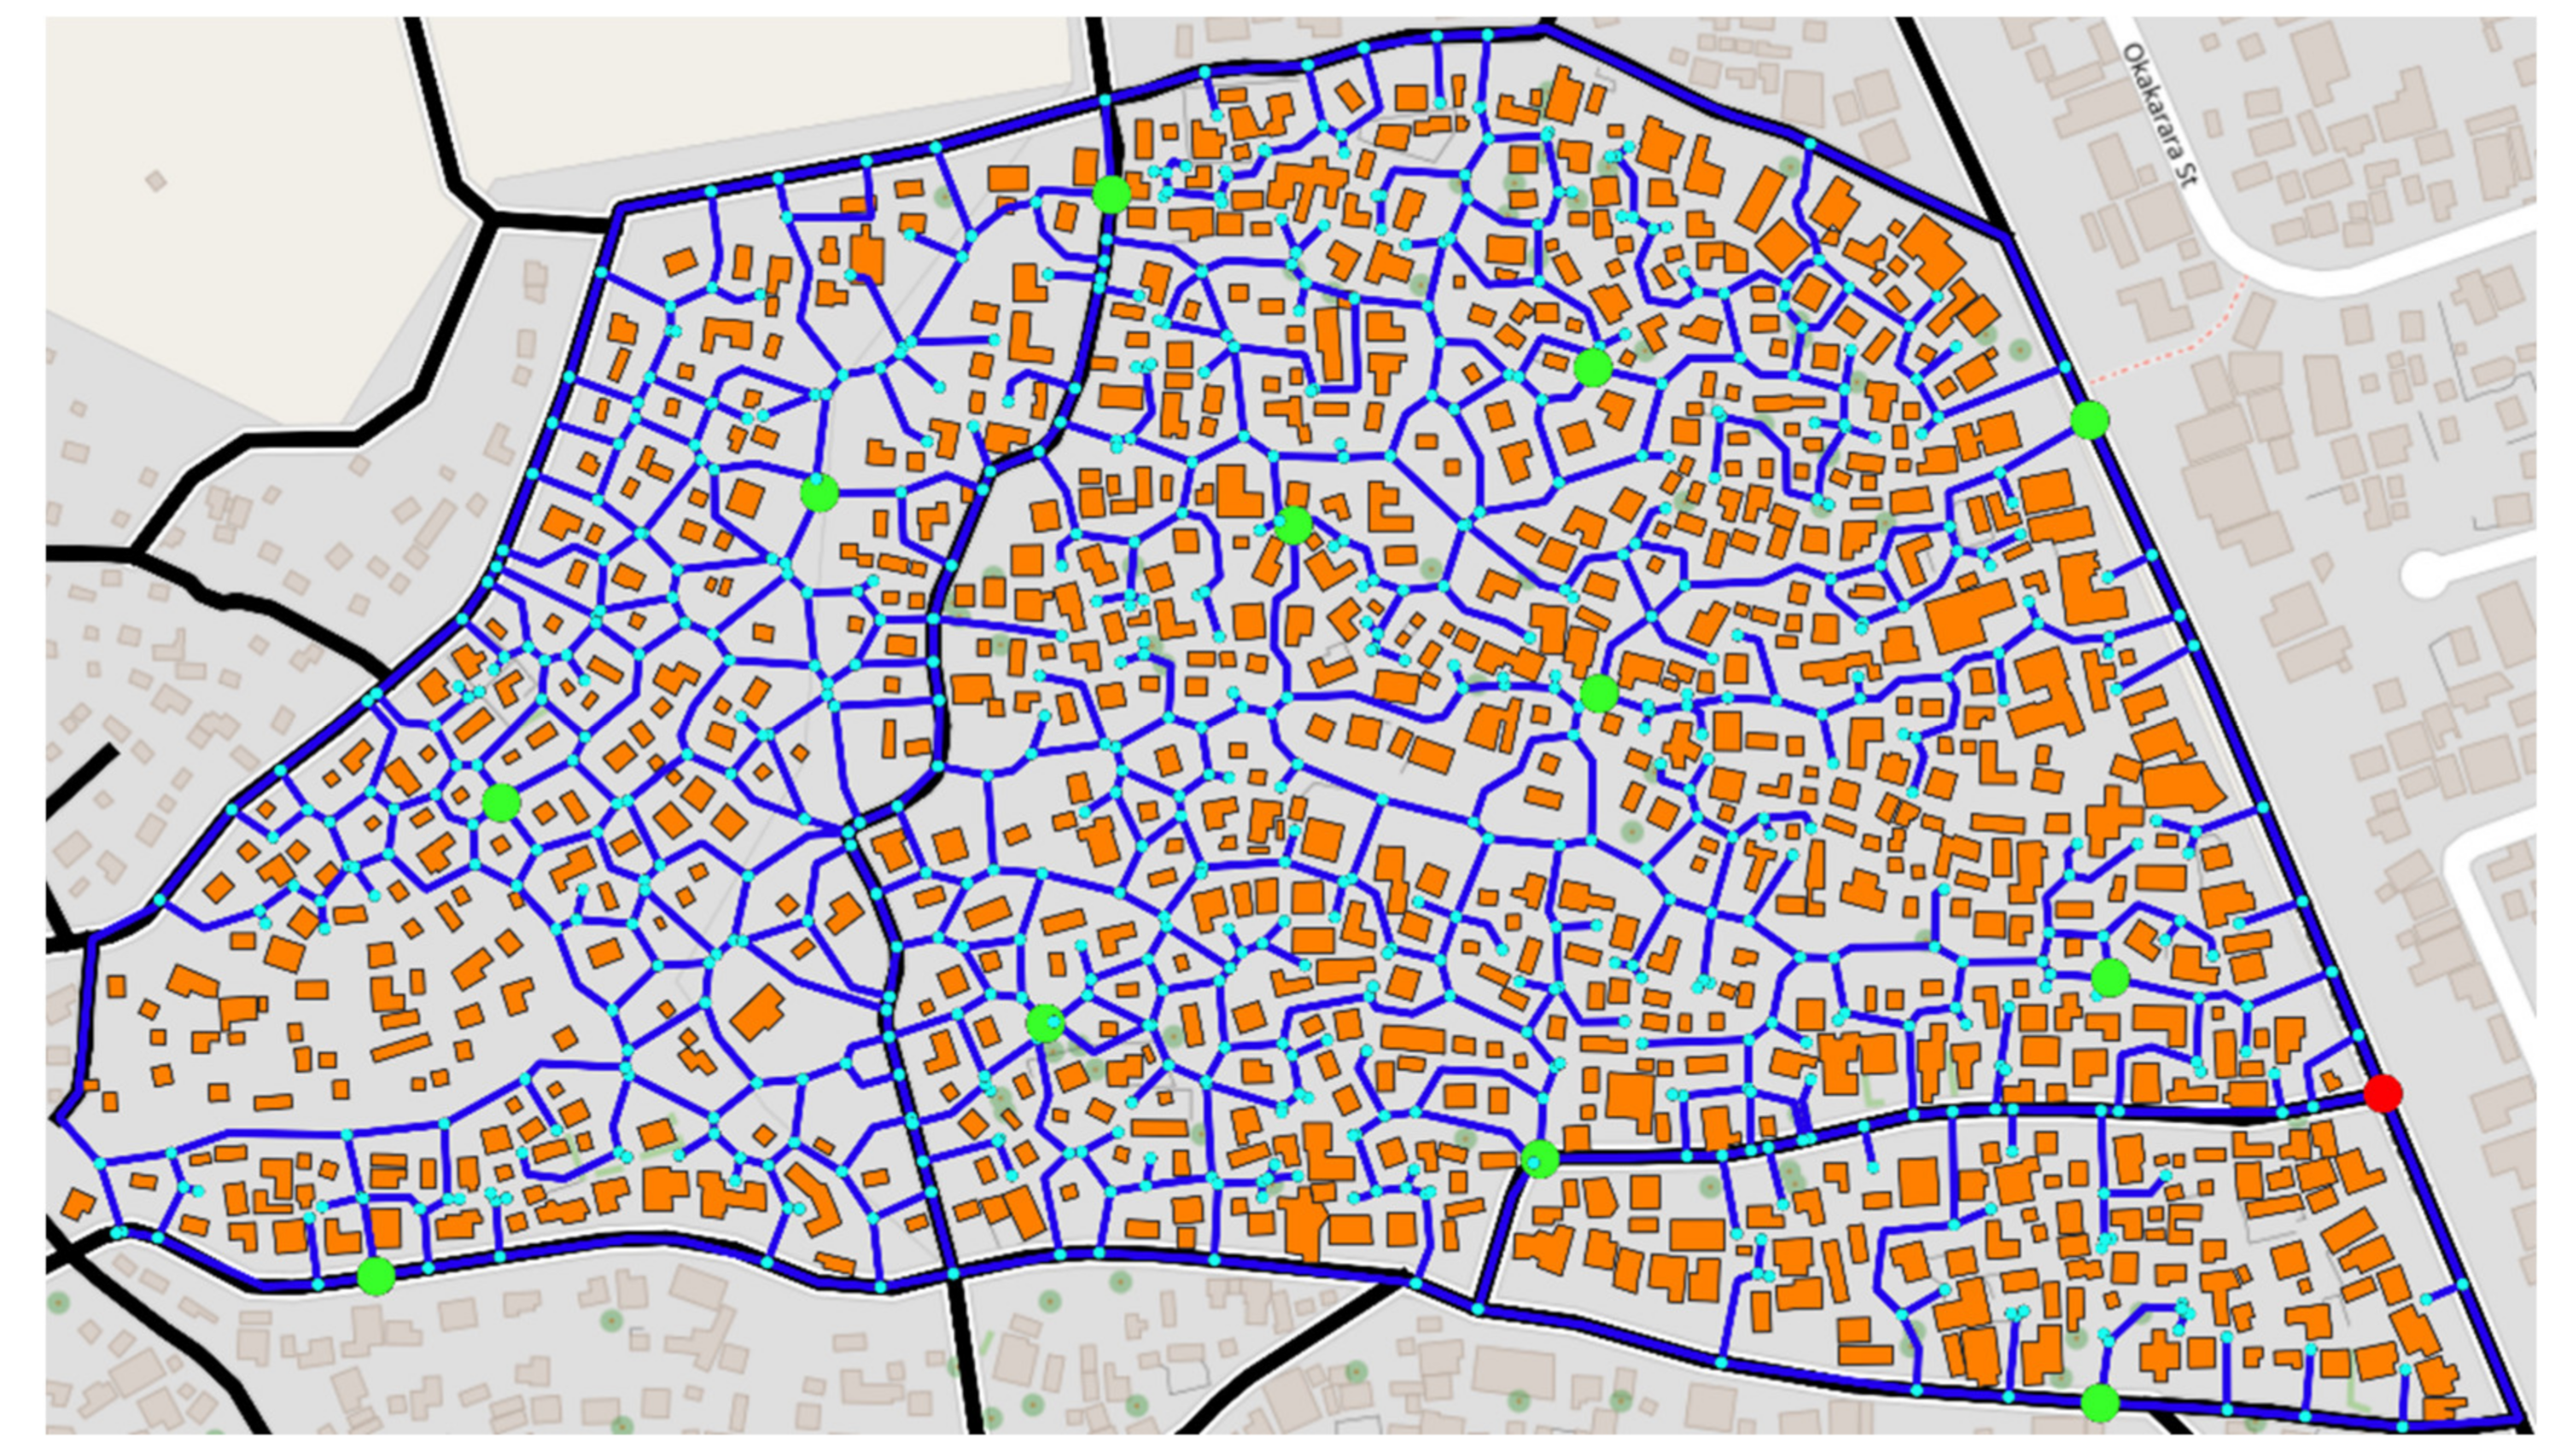
The solution provided by the location set covering problem shows that 12 water points are required for the selected case study in order to meet the upgrade target “intermediate access” (distance from consumer to water point ≤100 m, see Table 1). The p-center problem is used to locate the water points in the network and to place the most unfavorably located consumer as well as possible. In this example, this consumer is located 97.7 m from the nearest water point. The water points are shown in green in Figure 6 and the transfer point to the new supply area is highlighted in red.
In this report, the location of the water points is selected by taking the criterion of the most equitable accessibility for each consumer into account. The locations are chosen so that the maximum distance of a customer to a water point is minimal. However, this means that in more densely populated areas, several consumers will have to share a water point, so waiting times may occur. Here, the installation of multiple water points at one location would be conceivable. Another approach to be examined is the consideration of waiting times in front of service facilities by integrating queuing theory into location theory [48].
3.5. Topology Optimization
In a participatory upgrading approach, the interests of the dwellers, as well as the decision-makers, have to be reconciled. A common ground between the public demand (localization of the water points, pipe routing, and supply security) and the financial feasibility must be considered. In this report, costs are expressed in terms of pipe length (m), so that a supply network is sought that meets the supply objectives with as few pipe meters as possible (network topology optimization). This results in a branched network. An additional diameter optimization (pipe size optimization) considering hydraulics will be realized in the near future. The consideration of pumps, reservoirs, and valves are not part of this report. In general, most of the numerous approaches focus on minimizing economic costs. The article of Mala-Jetmarova et al. [50] contains a comprehensive review of various approaches and existing publications on this topic within the last 30 years. For interactive planning including all project participants and the associated visualization of the impacts of decisions, the topology optimization must find good solutions in a short (computational) time.
The determination of the minimum-cost or minimum-length branching network connecting n-water points with m-feeding points can be formally described by the graph-theoretic Steiner-Tree-Problem [51]. The Steiner-Tree-Problem is a generalization of the Minimum-Spanning-Tree-Problem and shortest path problem. While the Minimum-Spanning-Tree-Problem determines a subset of edges connecting all nodes of a connected, weighted, undirected graph by the shortest path, a Steiner-Tree-Problem results in a subgraph of the maximal network connecting many finitely (pre)given terminal nodes by their shortest paths. Here, the terminal nodes correspond to the feeding-nodes and the water points (=demand nodes). Since the Steiner-Tree-Problem is an NP-hard combinatorial problem [52], finding the optimal solution is not guaranteed. However, appropriate solutions can be found through approximation. Müller et al. [53] investigate several recent approaches to solve the Steiner-Tree-Problem in the context of a cost-effective fiber-to-home network expansion. The results show that a different approach for each of the chosen case study networks provides the best solution. The solver from the Python library NetworkX serves as the reference solver, generating nearly equivalent results with respect to the best solution in all case studies and the best solution itself for the network with the most line elements. According to the documentation, the result of the NetworkX-approximate-Steiner-Tree-solver lies within a factor of (2−(2/t)) of the optimal Steiner Tree. Here, t corresponds to the number of target nodes [38], which, in this example, correspond to the sum of water points and feeding-nodes.
The maximal possible network corresponds to an undirected graph G = (V, E) with non-negative edge weights w: Ε → ℝ+. The Steiner-Tree-Problem spans a minimal network with respect to the edge weights between the terminal nodes T, which corresponds to a subset of all nodes of the graph G: T ⊆ E. By labeling the routes of the maximal possible network according to the prevailing environmental conditions (free_path, road, stock pipe) in the attribute table (see Figure 3), the edge weights can be influenced, thus affecting the results. For this purpose, weighting factors f (fstockpipe, froad, ffreepath) are introduced for the respective environmental conditions, which when multiplied to the respective edge length, result in the edge weight in the Steiner-Tree-Problem. For each factor, fj applies: {fj|0 ≤ fj ≤ 1}. This allows decision makers to influence the routing. For example, routes along existing roads can be placed more favorably than routes over open areas (between the shacks) or if an area already contains pipes that can continue to be used in the future without additional expenditure, the factor for this route would be fstockpipe = 0. The costs of a route along the existing pipes i thus correspond to costi = fstockpipe × lengthi = 0. The effects of different weighting of the environmental conditions are presented in the following section.
4. Results and Discussion
One of the biggest challenges in integrating dwellers into an engineering planning process is to present the information in an appropriate form and provide access to it [7]. Once this is achieved, the different visions of the stakeholders have to be integrated into the planning process and decisions have to be weighed. By coupling the method to a GIS system, the visualization of spatial and attribute data is enabled, such that the interaction between the different stakeholders is supported. The objective of the method is the automated generation of WDS expansion proposals that take into account individual changes and show the impact of such changes in terms of the WDS topology. In this way, the method aids in understanding the implications of different decisions. Thus, the method is not a new participatory concept. Rather, it can be used as a tool in an existing participatory process or integrated into a participatory approach to support the planning.
A case study of an informal settlement in Windhoek (Namibia) was used to apply the method in a practical way. The creation of the maximum possible network shows that there are numerous routing options for the introduction of a piped-based water supply infrastructure for the selected upgrading area. These can serve as an initial basis for discussion in a participatory upgrading process. The location of water points is supported by methods from Logistics. If not specified individually, a location set covering problem in combination with a p-center problem determines the minimum required number and the locations of the water points in the maximum possible network. The locations are determined according to the criterion of the most equitable accessibility. The catchment area of a water point is not determined by a radius, but by the real distance a customer has to walk to reach it. This approach is particularly advantageous in more densely populated areas, as there can be a considerable difference between the real walking distance and the straight-line distance. The results of both the network generation, as well as of the identification of the water point locations, are included in Section 3.2, Section 3.3 and Section 3.4. The present section focuses on the results of the topology optimization.
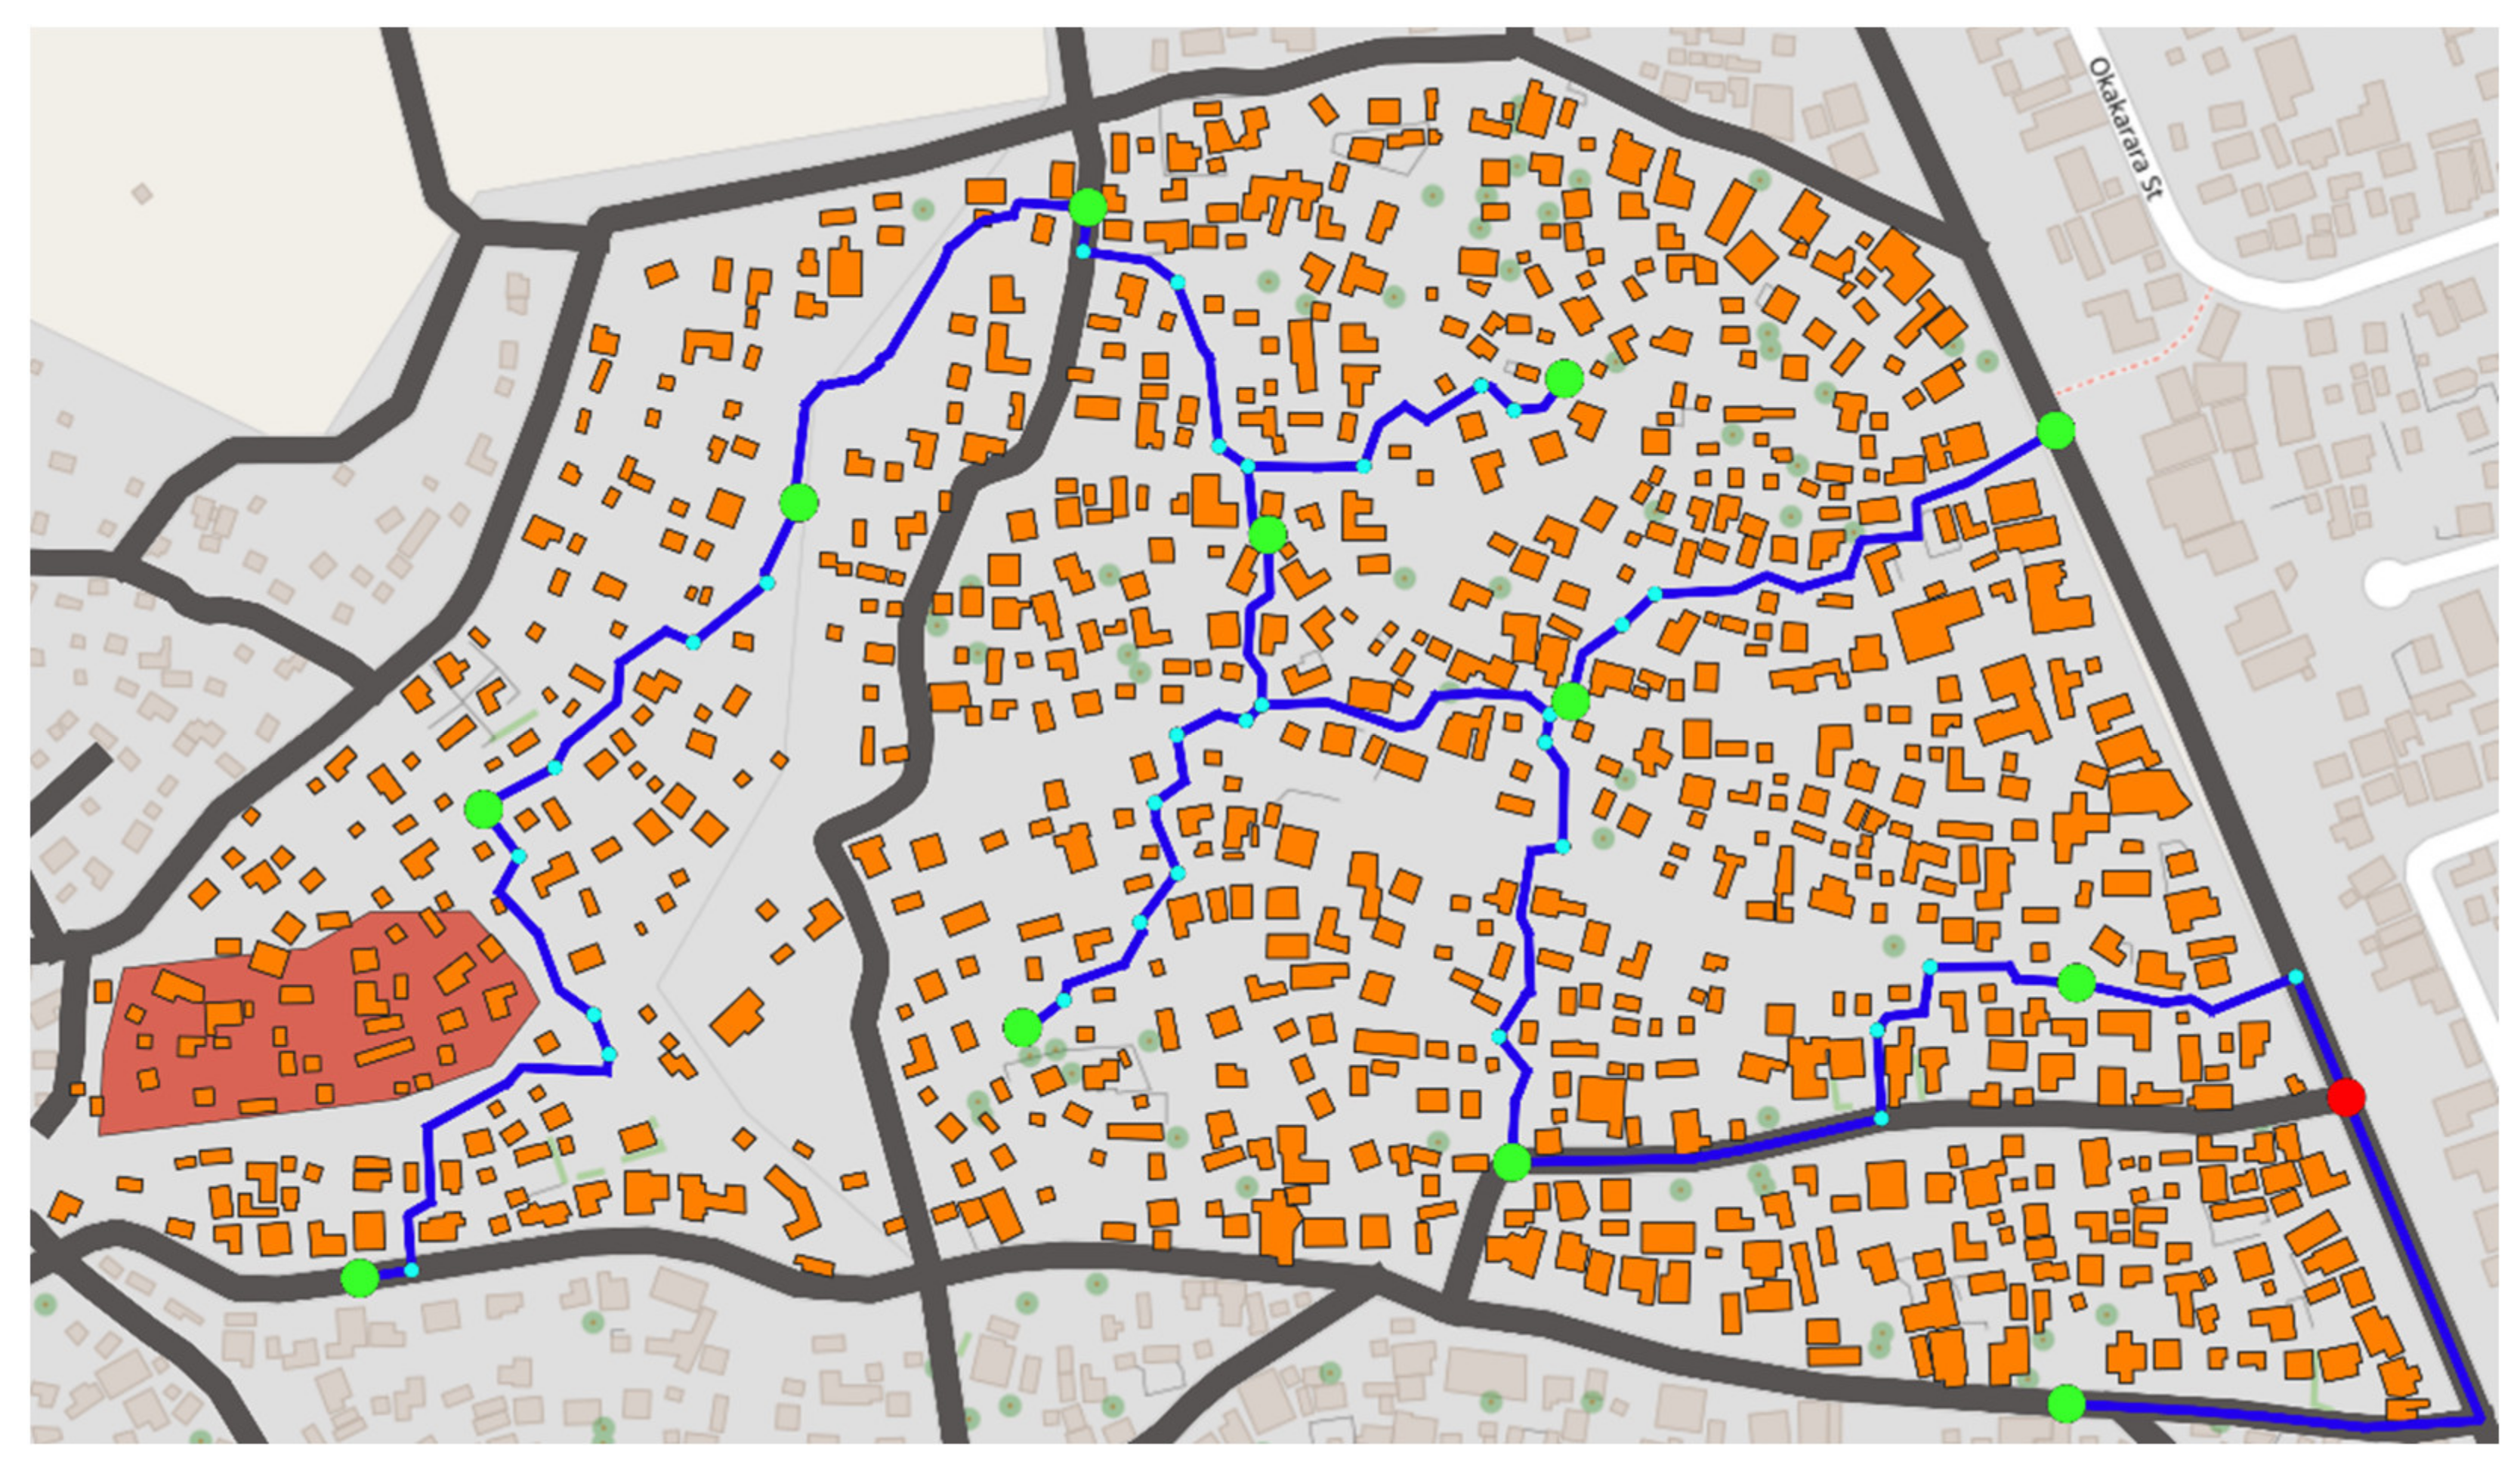
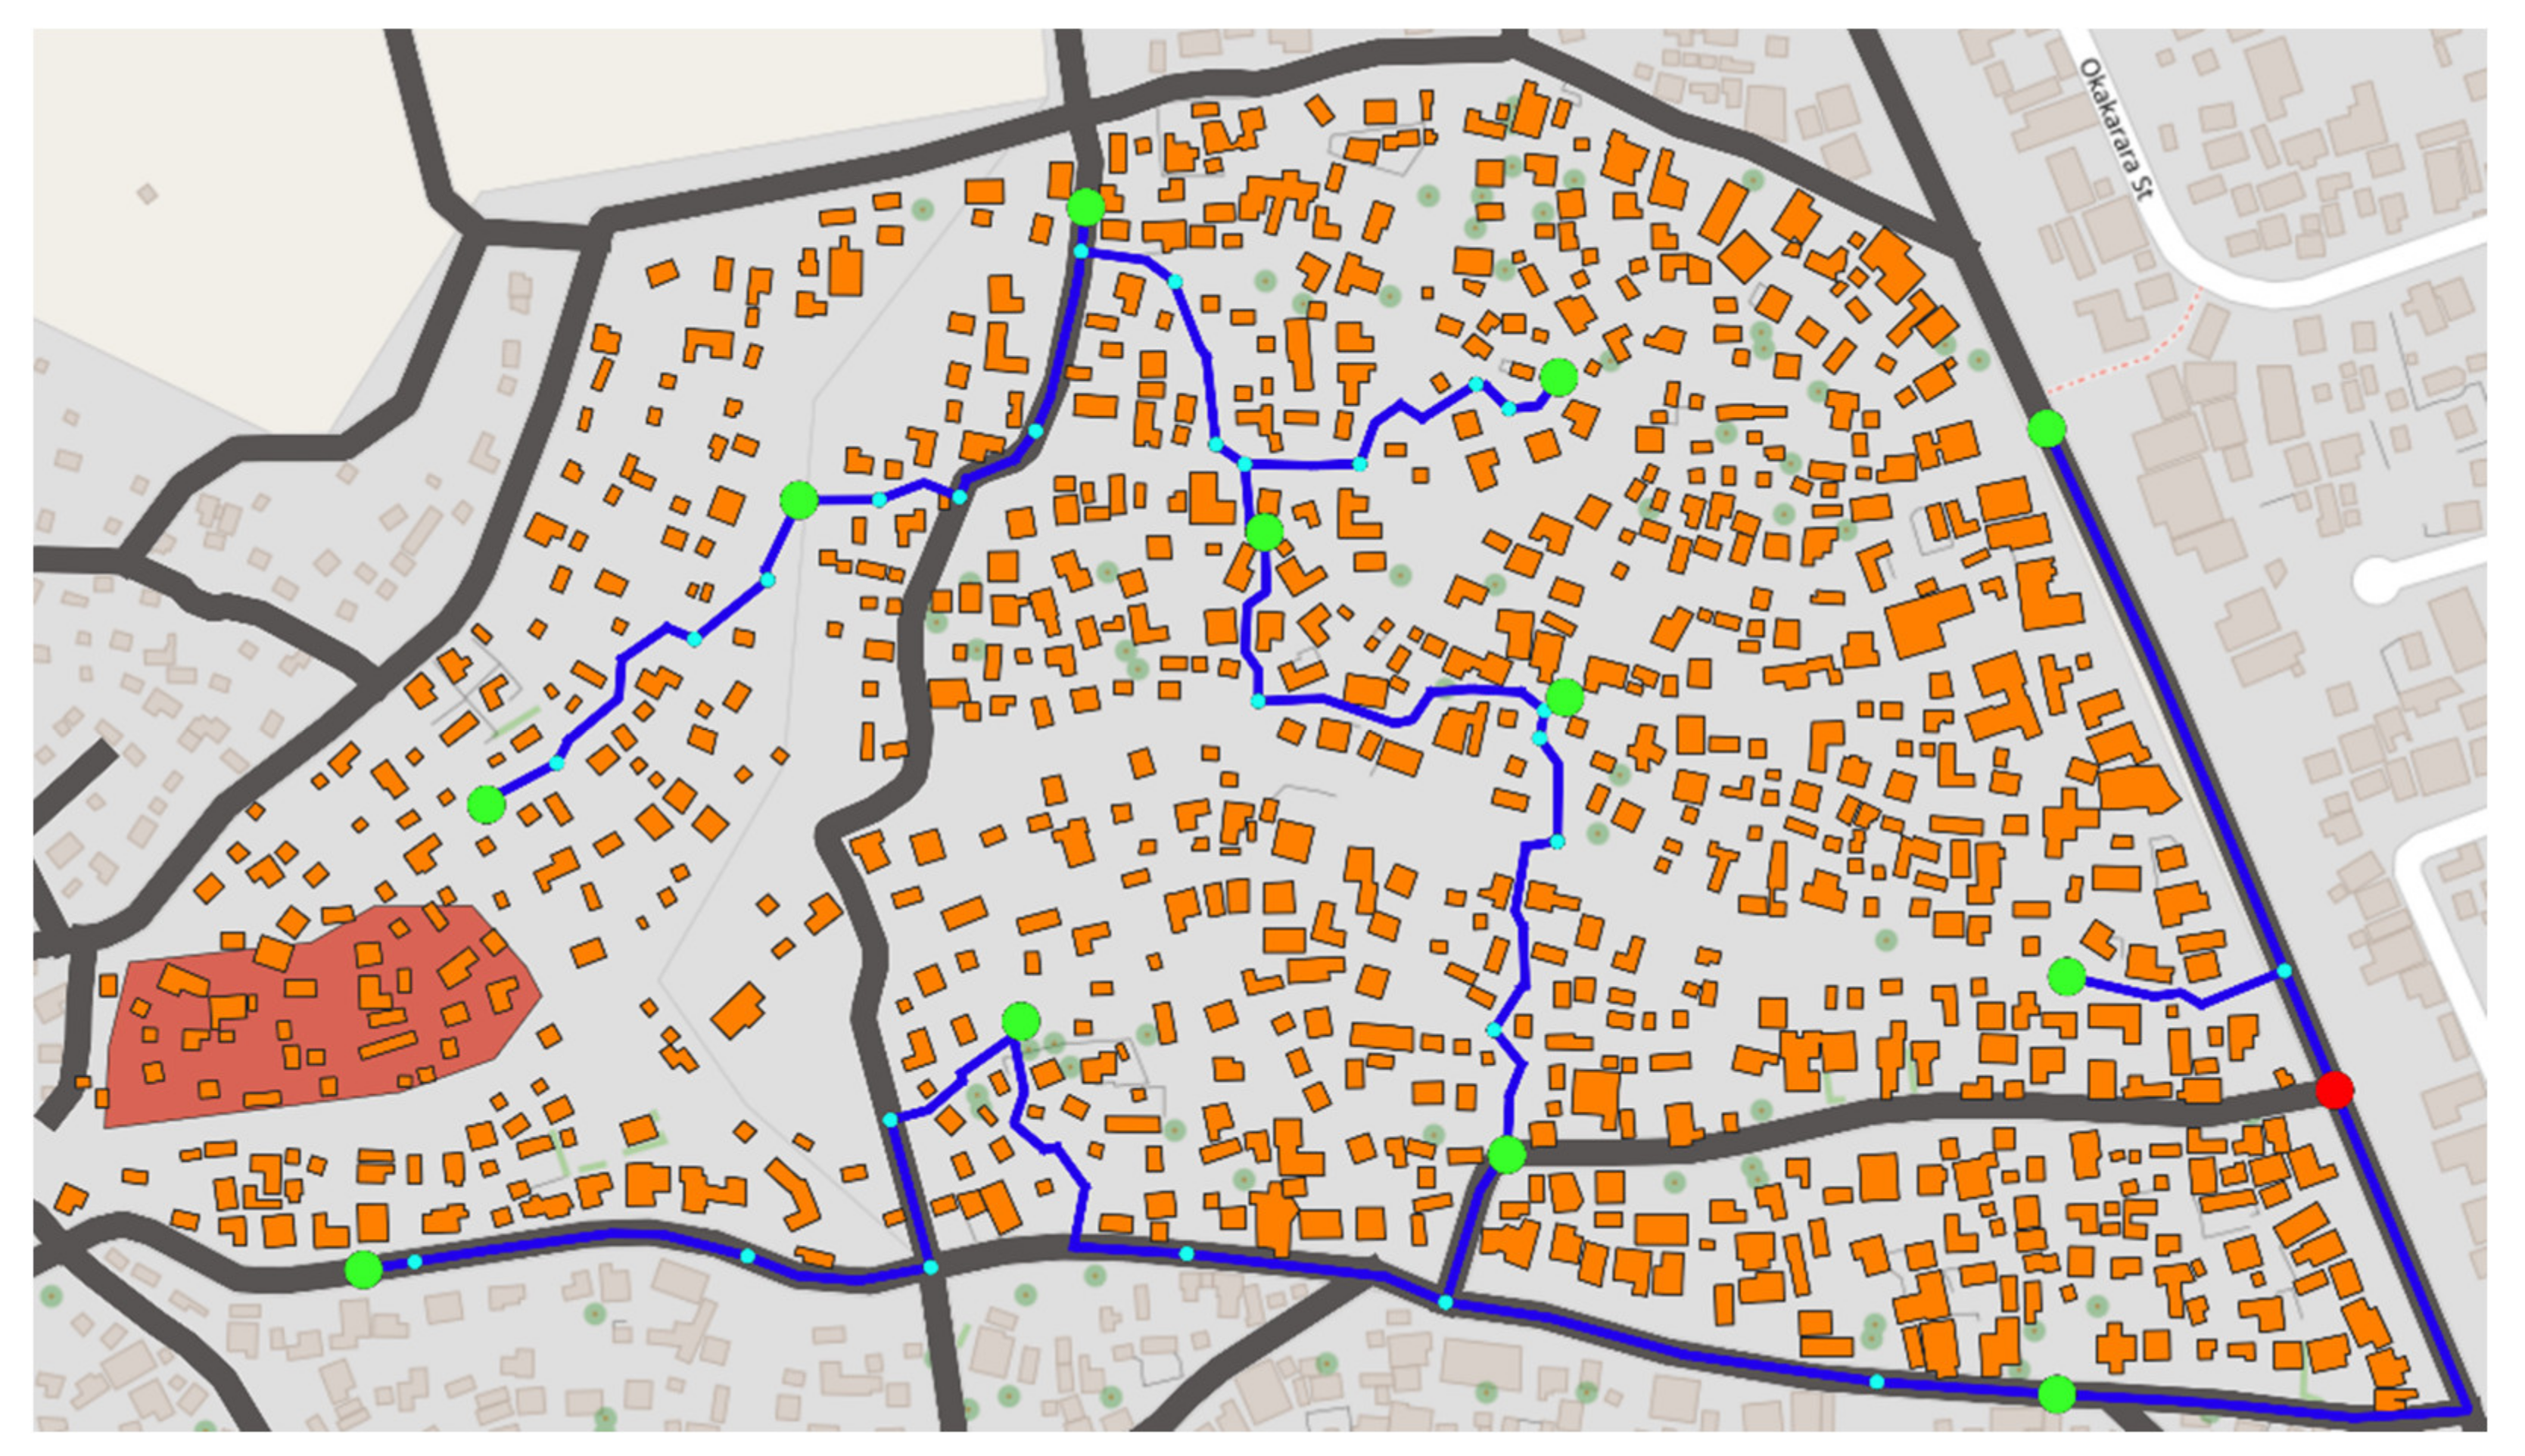
Under the selected boundary conditions and approaches from graph theory, a coherent WDS with minimum costs in terms of pipe meters is generated. A differentiated consideration of potential routes along existing roads, across open areas, or the inclusion of existing pipelines is possible by weighting the edges in the graph. The effects of different weightings are shown in Figure 7, Figure 8 and Figure 9. Here, the water point locations are shown in green, the determined pipe-route in blue, the feeding point in red, the built-up area in orange, the exemplary barrier in red, and the existing road network in dark gray.
Figure 7 shows the generated result without differentiation. The WDS covers a length of 1688 m, of which 331 m run along existing roads.
If pipes along existing roads are to be preferred, their length can be weighted using the factor froad in the graph. In Figure 8, froad = 0.5 was set. This means that one meter of pipe route along an existing road is equivalent to two meters of pipe route across open areas. The WDS has a total length of 1780 m, 965 m of which run along existing roads.
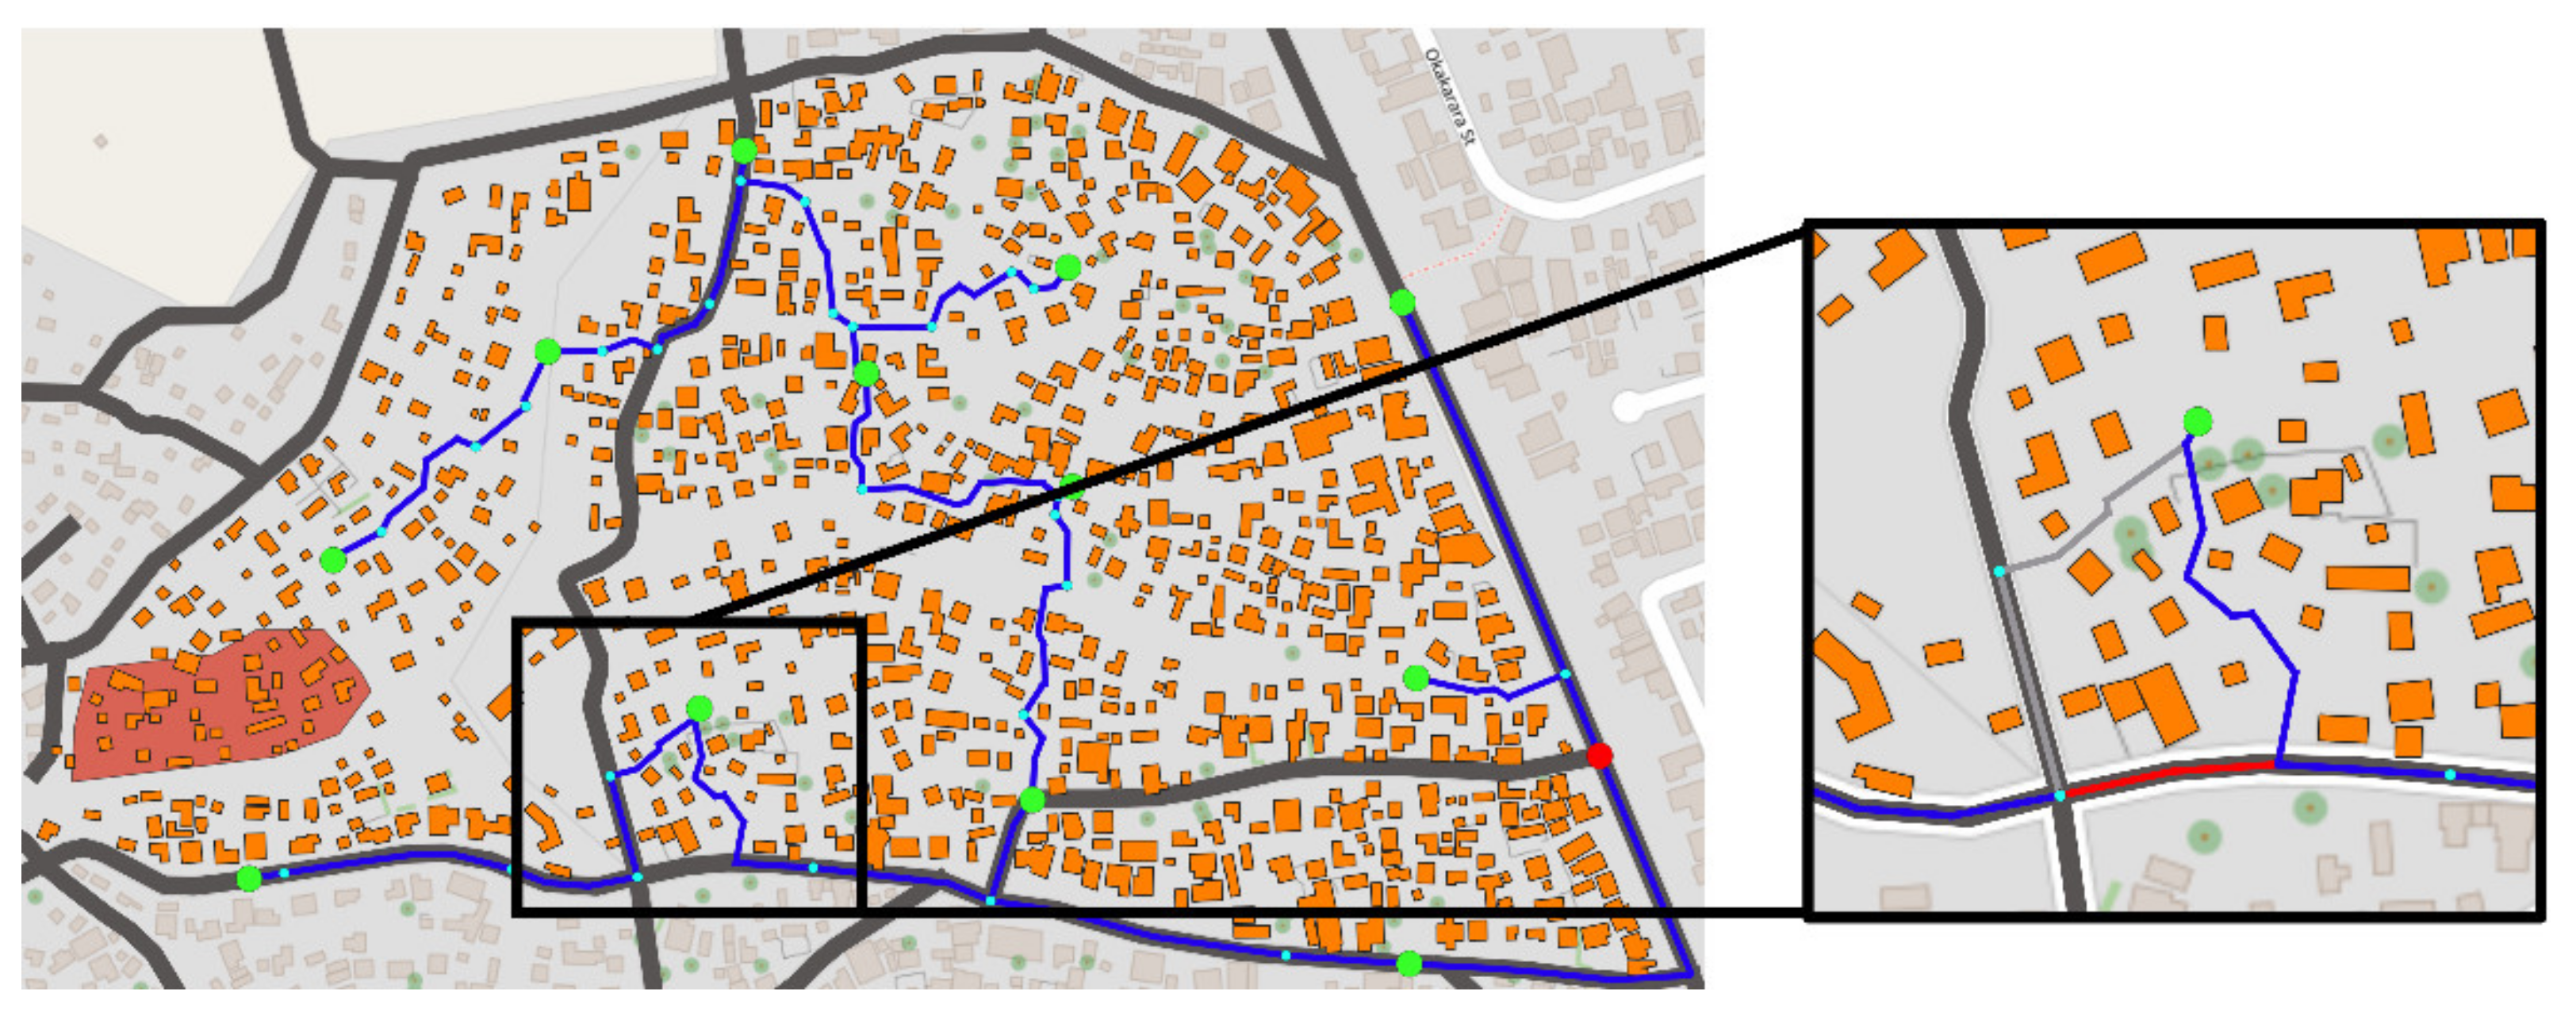
If the upgrading area is to be developed mainly via the existing road network, the weighting factor froad is further reduced or selected to be correspondingly small. Figure 9 shows the result with froad = 0.1. The WDS covers a total length of 2116 m, 1598 m of which run along existing roads. It becomes clear that only relatively short line elements for connecting the water points to the network run off existing roads.
The results show that the method provides fast results of different network variants. Due to the NP-hard problem, finding a global optimum by the used NetworkX-approximate-Steiner-Tree-solver is not guaranteed. This can be seen in the example of the solution for froad = 0.5. The correction of the route in Figure 10 on the right (red) is 26.53 m (weighted) shorter than from the automatically generated result. This corresponds to about 1.5% of the total network length. Currently, a heuristic is being worked on which takes the result of the NetworkX-approximate-Steiner-Tree-solver and optimizes it if necessary.
5. Conclusions
This report presents a new method for the practical planning of a piped-based WDS in informal settlements, taking into account the existing settlement structure. The objective of the method was to provide a fast and largely automated network generation, allowing visualizations and manual modifications at each step by tightly coupling it to a GIS system. Thus, it follows a participatory upgrading approach. Its general approach based on georeferenced polygons allows it to be flexibly transferred to other study areas in order to generate practical and sustainable network expansion proposals based on actual topology. The modular structure allows their use in different planning stages. While this report examined a case study using freely available OpenStreetMap data, aerial photography from drone flyovers and image recognition software can be used to generate day-by-day expansion options. In this way, the unmapped areas of a settlement become visible and the constant change of a settlement is taken into account by the topicality of an aerial photograph. For areas with a closed roof ceiling and no mapped pathways, the method is not applicable. However, in inner-city, highly post-densified areas, its use in combination with an approach similar to Brelsford et al. [10] is conceivable, such that shacks to be removed/reblocked are identified in order to introduce infrastructure. As urbanization is expected to continue in the future, the lack of available land in inner-city areas is forcing newcomers to settle in the surrounding areas. For these strongly growing settlement areas in the peri-urban area, appropriate measures must be taken as early as possible in order to implement an infrastructure. For this purpose, the presented method, integrated in a comprehensive urban planning approach, can make an important contribution.
Extensions of the method are planned for the near future. In order to increase the security of water supply in case of pipe bursts, an optimization approach for looped networks is being worked on. However, in order to use the method in on-site planning, the challenge here is to solve the large combinatorial problem in a very short time. Parallel to this, a diameter optimization and hydraulic investigation of the network is proposed by linking the method to the hydraulic solver EPANET 2.
Author Contributions
Conceptualization, J.M.; methodology, J.M.; software, J.M.; writing—original draft preparation, J.M.; writing—review and editing, J.M., W.U., A.S. and J.E.F.; supervision, W.U. and A.S.; All authors have read and agreed to the published version of the manuscript.
Funding
This research received no external funding.
Institutional Review Board Statement
Not applicable.
Data Availability Statement
Not applicable.
Acknowledgments
Map data copyrighted OpenStreetMap contributors and available from https://www.openstreetmap.org (accessed on 11 March 2022). We acknowledge support by the Open Access Publishing Fund of Technical University of Darmstadt.
Conflicts of Interest
The authors declare no conflict of interest.
References
- United Nations. The World’s Cities in 2018: Data Booklet ST/ESA/SER.A/417. 2018. Available online: https://www.un.org/en/events/citiesday/assets/pdf/the_worlds_cities_in_2018_data_booklet.pdf (accessed on 19 October 2021).
- United Nations. Special Edition: Progress towards the Sustainable Development Goals: Report of the Secretary-General E/2019/68. 2019. Available online: https://www.un.org/ga/search/view_doc.asp?symbol=E/2019/68 (accessed on 21 October 2021).
- United Nations. Sustainable Development Goals—17 Goals to Transform Our World: SDG6—Ensure Availability and Sustainable Management of Water and Sanitation for All. Available online: https://www.un.org/sustainabledevelopment/water-and-sanitation/ (accessed on 4 April 2022).
- Brown, R.; Leder, K.; Wong, T.; French, M.; Ramirez-Lovering, D.; Chown, S.L.; Luby, S.; Clasen, T.; Reidpath, D.; El Sioufi, M.; et al. Improving human and environmental health in urban informal settlements: The Revitalising Informal Settlements and their Environments (RISE) programme. Lancet Planet. Health 2018, 2, S29. [Google Scholar] [CrossRef]
- Brown-Luthango, M.; Reyes, E.; Gubevu, M. Informal settlement upgrading and safety: Experiences from Cape Town, South Africa. J. Hous. Built Environ. 2017, 32, 471–493. [Google Scholar] [CrossRef]
- United Nations Human Settlements Programme. Enhancing Urban Safety and Security: Global Report on Human Settlements 2007; Earthscan: London, UK, 2007; ISBN 978-92-113-1920-0. [Google Scholar]
- Abbott, J. The use of GIS in informal settlement upgrading: Its role and impact on the community and on local government. Habitat Int. 2003, 27, 575–593. [Google Scholar] [CrossRef]
- Jaitman, L.; Brakarz, J. Evaluation of Slum Upgrading Programs: Literature Review and Methodological Approaches. Available online: https://publications.iadb.org/publications/english/document/Evaluation-of-Slum-Upgrading-Programs-Literature-Review-and-Methodological-Approaches.pdf (accessed on 18 October 2021).
- Morrow, E. Exploring the Concept of a GIS-Based Decision Support System for the Upgrading of Informal Settlements in South Africa’s North West Province; Georgia Institute of Technology: Atlanta, GA, USA, 2010. [Google Scholar]
- Brelsford, C.; Martin, T.; Hand, J.; Bettencourt, L.M.A. Toward cities without slums: Topology and the spatial evolution of neighborhoods. Sci. Adv. 2018, 4, eaar4644. [Google Scholar] [CrossRef] [Green Version]
- World Health Organization. Domestic Water Quantity, Service Level and Health, 2nd ed.; World Health Organization: Geneva, Switzerland, 2020; ISBN 978-92-4-001524-1. [Google Scholar]
- United Nations Human Settlements Programme. Expert Group Meeting on Urban Indicators: Secure Tenure, Slums and Global Sample of Cities; United Nations Human Settlements Programm (UN-Habitat): Nairobi, Kenya, 2002; Available online: https://www.citiesalliance.org/sites/default/files/expert-group-meeting-urban-indicators%5B1%5D.pdf (accessed on 20 October 2021).
- United Nations Human Settlements Programme. Streets as Tools for Urban Transformation in Slums: A Street-Led Approach to Citywide Slum Upgrading; United Nations Human Settlements Programm (UN-Habitat): Nairobi, Kenya, 2012. [Google Scholar]
- Cairncross, S. The benefits of water supply. In Developing World Water; Pickford, J., Ed.; Grosvenor Press: London, UK, 1987; pp. 46–63. [Google Scholar]
- Sarkar, A. Can shared standpipes fulfil the Sustainable Development Goal of universal access to safe water for urban poor in Kenya? Water Policy 2019, 21, 1034–1049. [Google Scholar] [CrossRef]
- Rausch, L.; Friesen, J.; Altherr, L.C.; Meck, M.; Pelz, P.F. A Holistic Concept to Design Optimal Water Supply Infrastructures for Informal Settlements Using Remote Sensing Data. Remote Sens. 2018, 10, 216. [Google Scholar] [CrossRef] [Green Version]
- Leonita, G.; Kuffer, M.; Sliuzas, R.; Persello, C. Machine Learning-Based Slum Mapping in Support of Slum Upgrading Programs: The Case of Bandung City, Indonesia. Remote Sens. 2018, 10, 1522. [Google Scholar] [CrossRef] [Green Version]
- Kohli, D.; Sliuzas, R.; Kerle, N.; Stein, A. An ontology of slums for image-based classification. Comput. Environ. Urban Syst. 2012, 36, 154–163. [Google Scholar] [CrossRef]
- Kuffer, M.; Pfeffer, K.; Sliuzas, R. Slums from Space—15 Years of Slum Mapping Using Remote Sensing. Remote Sens. 2016, 8, 455. [Google Scholar] [CrossRef] [Green Version]
- Wurm, M.; Taubenböck, H. Detecting social groups from space—Assessment of remote sensing-based mapped morphological slums using income data. Remote Sens. Lett. 2018, 9, 41–50. [Google Scholar] [CrossRef]
- Gram-Hansen, B.; Helber, P.; Varatharajan, I.; Azam, F.; Coca-Castro, A.; Kopackova, V.; Bilinski, P. Mapping Informal Settlements in Developing Countries using Machine Learning and Low Resolution Multi-spectral Data. In Proceedings of the AAAI/ACM Conference on AI, Ethics, and Society (AIES), Honolulu, HI, USA, 27–28 January 2019. [Google Scholar]
- Enk, A.; de Wasseige, C. Identification of appropriate data sources and analysis software to monitor the growth of informal settlements in Namibia. In Proceedings of the Joint Urban Remote Sensing 2019, Vannes, France, 22–24 May 2019; pp. 1–4. [Google Scholar]
- Stark, T.; Wurm, M.; Zhu, X.X.; Taubenböck, H. Satellite-Based Mapping of Urban Poverty with Transfer-Learned Slum Morphologies. IEEE J. Sel. Top. Appl. Earth Obs. Remote Sens. 2020, 13, 5251–5263. [Google Scholar] [CrossRef]
- Wang, W.; Yang, N.; Zhang, Y.; Wang, F.; Cao, T.; Eklund, P. A review of road extraction from remote sensing images. J. Traffic Transp. Eng. 2016, 3, 271–282. [Google Scholar] [CrossRef] [Green Version]
- Lucci, P.; Bhatkal, T.; Khan, A. Are we underestimating urban poverty? World Dev. 2018, 103, 297–310. [Google Scholar] [CrossRef]
- Rehm, I.-S.; Friesen, J.; Pouls, K.; Busch, C.; Taubenböck, H.; Pelz, P.F. A Method for Modeling Urban Water Infrastructures Combining Geo-Referenced Data. Water 2021, 13, 2299. [Google Scholar] [CrossRef]
- Sitzenfrei, R. A Review on Network Generator Algorithms for Water Supply Modelling and Application Studies. In Proceedings of the World Environmental and Water Resources Congress 2016, West Palm Beach, FL, USA, 22–26 May 2016; Pathak, C.S., Reinhart, D., Eds.; American Society of Civil Engineers: Reston, VA, USA, 2016; pp. 505–515, ISBN 9780784479865. [Google Scholar]
- Sitzenfrei, R. Stochastic Generation of Urban Water Systems for Case Study Analysis. Ph.D. Thesis, University of Innsbruck, Innsbruck, Austria, 2010. [Google Scholar]
- Sitzenfrei, R.; Fach, S.; Kleidorfer, M.; Urich, C.; Rauch, W. Dynamic virtual infrastructure benchmarking: DynaVIBe. Water Sci. Technol. Water Supply 2010, 10, 600–609. [Google Scholar] [CrossRef]
- Sitzenfrei, R.; Möderl, M.; Rauch, W. Automatic generation of water distribution systems based on GIS data. Environ. Model. Softw. 2013, 47, 138–147. [Google Scholar] [CrossRef] [Green Version]
- Zischg, J.; Rauch, W.; Sitzenfrei, R. Morphogenesis of Urban Water Distribution Networks: A Spatiotemporal Planning Approach for Cost-Efficient and Reliable Supply. Entropy 2018, 20, 708. [Google Scholar] [CrossRef] [Green Version]
- Mair, M.; Zischg, J.; Rauch, W.; Sitzenfrei, R. Where to Find Water Pipes and Sewers?—On the Correlation of Infrastructure Networks in the Urban Environment. Water 2017, 9, 146. [Google Scholar] [CrossRef] [Green Version]
- Rausch, L. Mathematische Optimierung von Wasserversorgungsnetzwerken für Informelle Siedlungen in Mega Cities; Shaker: Aachen, Germany, 2019; ISBN 978-3-8440-6687-6. [Google Scholar]
- IBM. ILOG CPLEX Optimizer. Available online: https://www.ibm.com/de-de/analytics/cplex-optimizer (accessed on 4 April 2022).
- QGIS Association. QGIS Geographic Information System; QGIS.org. 2021. Available online: https://www.qgis.org/en/site/index.html (accessed on 19 October 2021).
- OpenStreetMap Contributors. Planet Dump. Available online: https://planet.openstreetmap.org/ (accessed on 10 March 2022).
- Python Software Foundation. Python Language Reference; Version 3.7. 2021. Available online: https://www.python.org/downloads/ (accessed on 30 September 2021).
- Hagberg, A.A.; Schult, D.A.; Swart, P.J. Exploring network structure, dynamics, and function using NetworkX. In Proceedings of the 7th Python in Science Conference (SciPy2008), Pasadena, CA, USA, 19–24 August 2008. [Google Scholar]
- Perron, L.; Furnon, V. OR-Tools; Version 7.2. Google, 2019. Available online: https://developers.google.com/optimization (accessed on 13 December 2021).
- Forrest, J.J.; Vigerske, S.; Gambini Santos, H.; Ralphs, T.; Hafer, L.; Kristjansson, B.; Jpfasano; Straver, E.; Lubin, M.; Rlougee; et al. coin-or/Cbc: Version 2.10.5; Zenodo, 2020. Available online: https://github.com/coin-or/Cbc (accessed on 13 December 2021).
- Gurobi Optimization, L.L.C. Gurobi Optimizer Reference Manual; 2022. Available online: https://www.gurobi.com (accessed on 18 November 2021).
- Lorenz, I.-S.; Pelz, P. Optimal Resilience Enhancement of Water Distribution Systems. Water 2020, 12, 2602. [Google Scholar] [CrossRef]
- Gold, C.M.; Mioc, D.; Anton, F.; Sharma, O.; Dakowicz, M. A Methodology for Automated Cartographic Data Input, Drawing and Editing Using Kinetic Delaunay/Voronoi Diagrams. In Generalized Voronoi Diagram: A Geometry-Based Approach to Computational Intelligence; Gavrilova, M.L., Ed.; Springer: Berlin/Heidelberg, Germany, 2008; ISBN 9783540851257. [Google Scholar]
- Hans-Martin Heck, R.B. Netzentwurf und Netzoptimierung. 2006. Available online: http://www.optiv.de/Fallbsp/05-Netzentwurf/05-Netzentwurf/05-Netzentwurf.pdf (accessed on 12 March 2021).
- Aurenhammer, F.; Klein, R. Voronoi Diagrams. In Handbook of Computational Geometry, 1st ed.; Elsevier: New York, NY, USA, 2000; pp. 201–290. ISBN 9780080529684. [Google Scholar]
- Hiyoshi, H. Intelligent Solutions for Curve Reconstruction Problem. In Generalized Voronoi Diagram: A Geometry-Based Approach to Computational Intelligence; Gavrilova, M.L., Ed.; Springer: Berlin/Heidelberg, Germany, 2008; ISBN 9783540851257. [Google Scholar]
- Rezapour, M. Network Design with Facility Location: Approximation and Exact Techniques. Ph.D. Thesis, Technischen Universität Berlin, Berlin, Germany, 2015. [Google Scholar]
- Mattfeld, D.; Vahrenkamp, R. Logistiknetzwerke; Springer Fachmedien Wiesbaden: Wiesbaden, Germany, 2014; ISBN 978-3-8349-2269-4. [Google Scholar]
- Calik, H.; Labbé, M.; Yaman, H. p-Center Problems. In Location Science; Laporte, G., Nickel, S., Saldanha da Gama, F., Eds.; Springer International Publishing: Cham, Switzerland, 2015; pp. 79–92. ISBN 978-3-319-13110-8. [Google Scholar]
- Mala-Jetmarova, H.; Sultanova, N.; Savic, D. Lost in Optimisation of Water Distribution Systems? A Literature Review of System Design. Water 2018, 10, 307. [Google Scholar] [CrossRef] [Green Version]
- Prömel, H.J.; Steger, A. The Steiner Tree Problem; Vieweg + Teubner Verlag: Wiesbaden, Germany, 2002; ISBN 978-3-528-06762-5. [Google Scholar]
- Garey, M.R.; Graham, R.L.; Johnson, D.S. The Complexity of Computing Steiner Minimal Trees. SIAM J. Appl. Math. 1977, 32, 835–859. [Google Scholar] [CrossRef]
- Müller, T.; Schmid, K.; Schuman, D.; Gabor, T.; Friedrich, M.; Geitz, M. Solving Large Steiner Tree Problems in Graphs for Cost-Efficient Fiber-to-the-Home Network Expansion. 2021. Available online: http://arxiv.org/pdf/2109.10617v1 (accessed on 24 November 2021).
Figure 1.
Structure of the method: The central element of the method is the automatic network generation. For this, boundary conditions must be specified by the user. If desired, individual changes can be integrated at any time, which are taken into account in the subsequent step of automatic network generation.

Figure 2.
(a) Aerial view of the study area; (b) Method input data from OpenStreetMap [36]: shacks are represented as polygons (orange) and existing paths/roads are represented as line elements (black).
Figure 2.
(a) Aerial view of the study area; (b) Method input data from OpenStreetMap [36]: shacks are represented as polygons (orange) and existing paths/roads are represented as line elements (black).

Figure 3.
Detail of an attribute table of possible routes: Route-specific properties in the columns “free_path”, “road”, and “stock_pipe”, which are taken into account in the subsequent topology optimization, can be stored.
Figure 3.
Detail of an attribute table of possible routes: Route-specific properties in the columns “free_path”, “road”, and “stock_pipe”, which are taken into account in the subsequent topology optimization, can be stored.

Figure 4.
(a) The shacks (orange) are the starting position for the formation of Voronoi polygons. (b) Possible routes (blue) are derived from the Voronoi edges. For network modeling, nodes (cyan) are inserted at line intersections (basemap and buildings/polygons: [36]).
Figure 4.
(a) The shacks (orange) are the starting position for the formation of Voronoi polygons. (b) Possible routes (blue) are derived from the Voronoi edges. For network modeling, nodes (cyan) are inserted at line intersections (basemap and buildings/polygons: [36]).

Figure 5.
Generated paths (red) from the center point of each shack to the respective surrounding nodes (cyan) of the maximum possible network (blue) (basemap and buildings/polygons: [36]).
Figure 5.
Generated paths (red) from the center point of each shack to the respective surrounding nodes (cyan) of the maximum possible network (blue) (basemap and buildings/polygons: [36]).

Figure 6.
Result of optimal water point-locations (green) in the maximum possible WDS (pipes: blue, nodes: cyan) in the upgrading-area (basemap and buildings/polygons: [36]).
Figure 6.
Result of optimal water point-locations (green) in the maximum possible WDS (pipes: blue, nodes: cyan) in the upgrading-area (basemap and buildings/polygons: [36]).

Figure 7.
Result of the generated WDS (pipes: blue, water: points green, feeding point: red) without differentiation of ambient conditions (basemap and buildings/polygons: [36]).
Figure 7.
Result of the generated WDS (pipes: blue, water: points green, feeding point: red) without differentiation of ambient conditions (basemap and buildings/polygons: [36]).

Figure 8.
Result of the generated WDS (pipes: blue, water: points green, feeding point: red) where a cost factor of froad = 0.5 was applied for routing along existing paths/roads (basemap and buildings/polygons: [36]).
Figure 8.
Result of the generated WDS (pipes: blue, water: points green, feeding point: red) where a cost factor of froad = 0.5 was applied for routing along existing paths/roads (basemap and buildings/polygons: [36]).

Figure 9.
Result of the generated WDS (pipes: blue, water: points green, feeding point: red) where a cost factor of froad = 0.1 was applied for routing along existing paths/roads. (basemap and buildings/polygons: [36]).
Figure 9.
Result of the generated WDS (pipes: blue, water: points green, feeding point: red) where a cost factor of froad = 0.1 was applied for routing along existing paths/roads. (basemap and buildings/polygons: [36]).

Figure 10.
Correction (red) of the generated WDS of the Steiner-Tree-approximation (pipes: blue, water points: green) (basemap and buildings/polygons: [36]).
Figure 10.
Correction (red) of the generated WDS of the Steiner-Tree-approximation (pipes: blue, water points: green) (basemap and buildings/polygons: [36]).


Table 1.
Water supply categories by consumption and accessibility (data: [11]).
Table 1.
Water supply categories by consumption and accessibility (data: [11]).
| Access Level | Typical Volumes of Water Used in the Home 1 | Accessibility of Water Supply |
|---|---|---|
| Inadequate access | Quantity collected can be below 5.3 L/person/day | More than 1000 m in distance or 30 min total collection time |
| Basic access | Average quantity unlikely to exceed 20 L/person/day | 100–1000 m in distance or 5–30 min total collection time |
| Intermediate access | Average quantity about 50 L/person/day | Water delivered through one tap on- plot, or within 100 m or 5 min total collection time |
| Optimal access | Average quantity more than 100 L/person/day | Water supplied through multiple taps and continuously available |
1 Quantities used are likely to be lower if the primary water source is not continuous or reliable, or if water is unaffordable.
Publisher’s Note: MDPI stays neutral with regard to jurisdictional claims in published maps and institutional affiliations. |
© 2022 by the authors. Licensee MDPI, Basel, Switzerland. This article is an open access article distributed under the terms and conditions of the Creative Commons Attribution (CC BY) license (https://creativecommons.org/licenses/by/4.0/).
Share and Cite
MDPI and ACS Style
Mosbach, J.; Sonnenburg, A.; Fiedler, J.E.; Urban, W. Development of a New Method to Support a Participatory Planning for Piped Water Supply Infrastructure in Informal Settlements. Water 2022, 14, 1316. https://doi.org/10.3390/w14081316
AMA Style
Mosbach J, Sonnenburg A, Fiedler JE, Urban W. Development of a New Method to Support a Participatory Planning for Piped Water Supply Infrastructure in Informal Settlements. Water. 2022; 14(8):1316. https://doi.org/10.3390/w14081316
Chicago/Turabian StyleMosbach, Julian, Alexander Sonnenburg, Justus Ernst Fiedler, and Wilhelm Urban. 2022. "Development of a New Method to Support a Participatory Planning for Piped Water Supply Infrastructure in Informal Settlements" Water 14, no. 8: 1316. https://doi.org/10.3390/w14081316
Note that from the first issue of 2016, this journal uses article numbers instead of page numbers. See further details here.