1. Introduction
Smart Water Grids (SWG) represent a newly proposed generation of water management. These consist of a new infrastructure integrating Information Communication and Techonologies (ICT) [
1] within water distribution networks (WDNs) [
2]. SWGs ensure a secure and an efficient water supply, accounting for uncertainties and future risks, such as population growth, hydrological variability, extreme events, and the intensification of demand in water supply infrastructures, agriculture, industry, and ecosystems [
3].
Strategic and transparent decision making in the exploitation of water resources is fundamental to achieve a sustainable water use [
4]. In SWGs, the transmission and distribution of a water resource is monitored and controlled through sensors, meters, digital controls, and analytic tools in order to achieve greater efficiency through quality operation and controls [
5,
6,
7]. Digitalization and automation enables the remote collection and transmission of data for the water management [
8]. Such big data, combined with artificial intelligence and Digital Twin (DT), can be used to perform powerful predictive analysis, which in turn contributes to greater effectiveness and efficiency in water management [
9]. Traditionally, operational processes such as leakage, water quality, and pressure control and management are undertaken manually. Redesigning work processes by automating these tasks will significantly reduce the reaction-time and effort, resulting in an increased overall efficiency [
10].
Smart Water Management (SWM) aims for the sustainability and self-sufficiency exploitation of water systems [
11]. It results in leakage and losses reduction, as well as water quality assurance, improved customer experience, and operational optimization [
12]. Moreover, the advanced information technologies that are used in the SWM systems ensure the following benefits: better understanding of the water system, early detection of leaks and efficient control of water losses, constant monitoring of water quality, economic benefits to water and energy conservation, reduction of financial losses (up to 30% reductions in water bills), improvement of system efficiency and customer service quality, among others [
13].
In this study, an optimization procedure was performed in order to complement a DT implementation in case of leakage occurrence. With reference to a case study water network, the optimal regulation of existing pressure control valves is investigated in order to minimize the amount of water wasted due to leakages. A non-linear programming (NLP) model is developed, consisting of both optimization constraints and equations modeling the hydraulic resolution of the network. The benefits in terms of pressure and leakage reduction are finally discussed. The obtained results prove the importance of equipping a WDN with DT technology to increase the overall effiency of the water system.
2. Smart Water Management (SWM) and Digital Twin Technology
A SWM system consists of the following technologies, briefly explained below:
Smart pipes and sensors: the smart wireless sensor network is a viable solution for monitoring the state of pressure and controlling water losses in water systems. Compared to other methods, the main advantage of water loss control is the continuous monitoring of the network without local operator intervention. The low energy consumption of the wireless sensor means that it can keep in operation for long periods without relevant energy costs associated [
14].
Smart water metering: intelligent water metering allows for the improvement of the balance between providing access to drinking water, the right of a management entity to receive payment for rendered services, and the shared responsibility to preserve scarce water resources [
15]. It is a support tool to make real-time decisions based on registered database and helps to reach a better balance between demand satisfaction and increased efficiency in WDNs. A smart water meter includes the follow components: flow detection hardware, a transmitter and a memory to store data and compensate for the disadvantages of traditional water meters [
16].
Geographic Information System (GIS): provides a complete list of all the network components and their spatial locations. GIS allows for the inclusion of the spatial components in an oriented model improving planning and management through a clear evolution of such components in the network. The simulation of real features is the main advantage of GIS, based on a data system designed to collect, store, receive, share, manipulate, analyze, and present information that is geographically referenced [
17].
Supervisor, control and data acquisition (SCADA): it refers to the use of memory and storage capacities and the calculation of computers and servers, shared and linked through the Internet [
18]. It typically relies on the collection of historical sensor readings to centrally control spatially distributed assets. SCADA system architecture consists of computers, data communication systems from sensors to human–machine interfaces and graphical user interfaces for supervisory management [
19].
A digital twin is a virtual representation of a physical asset, process, or system [
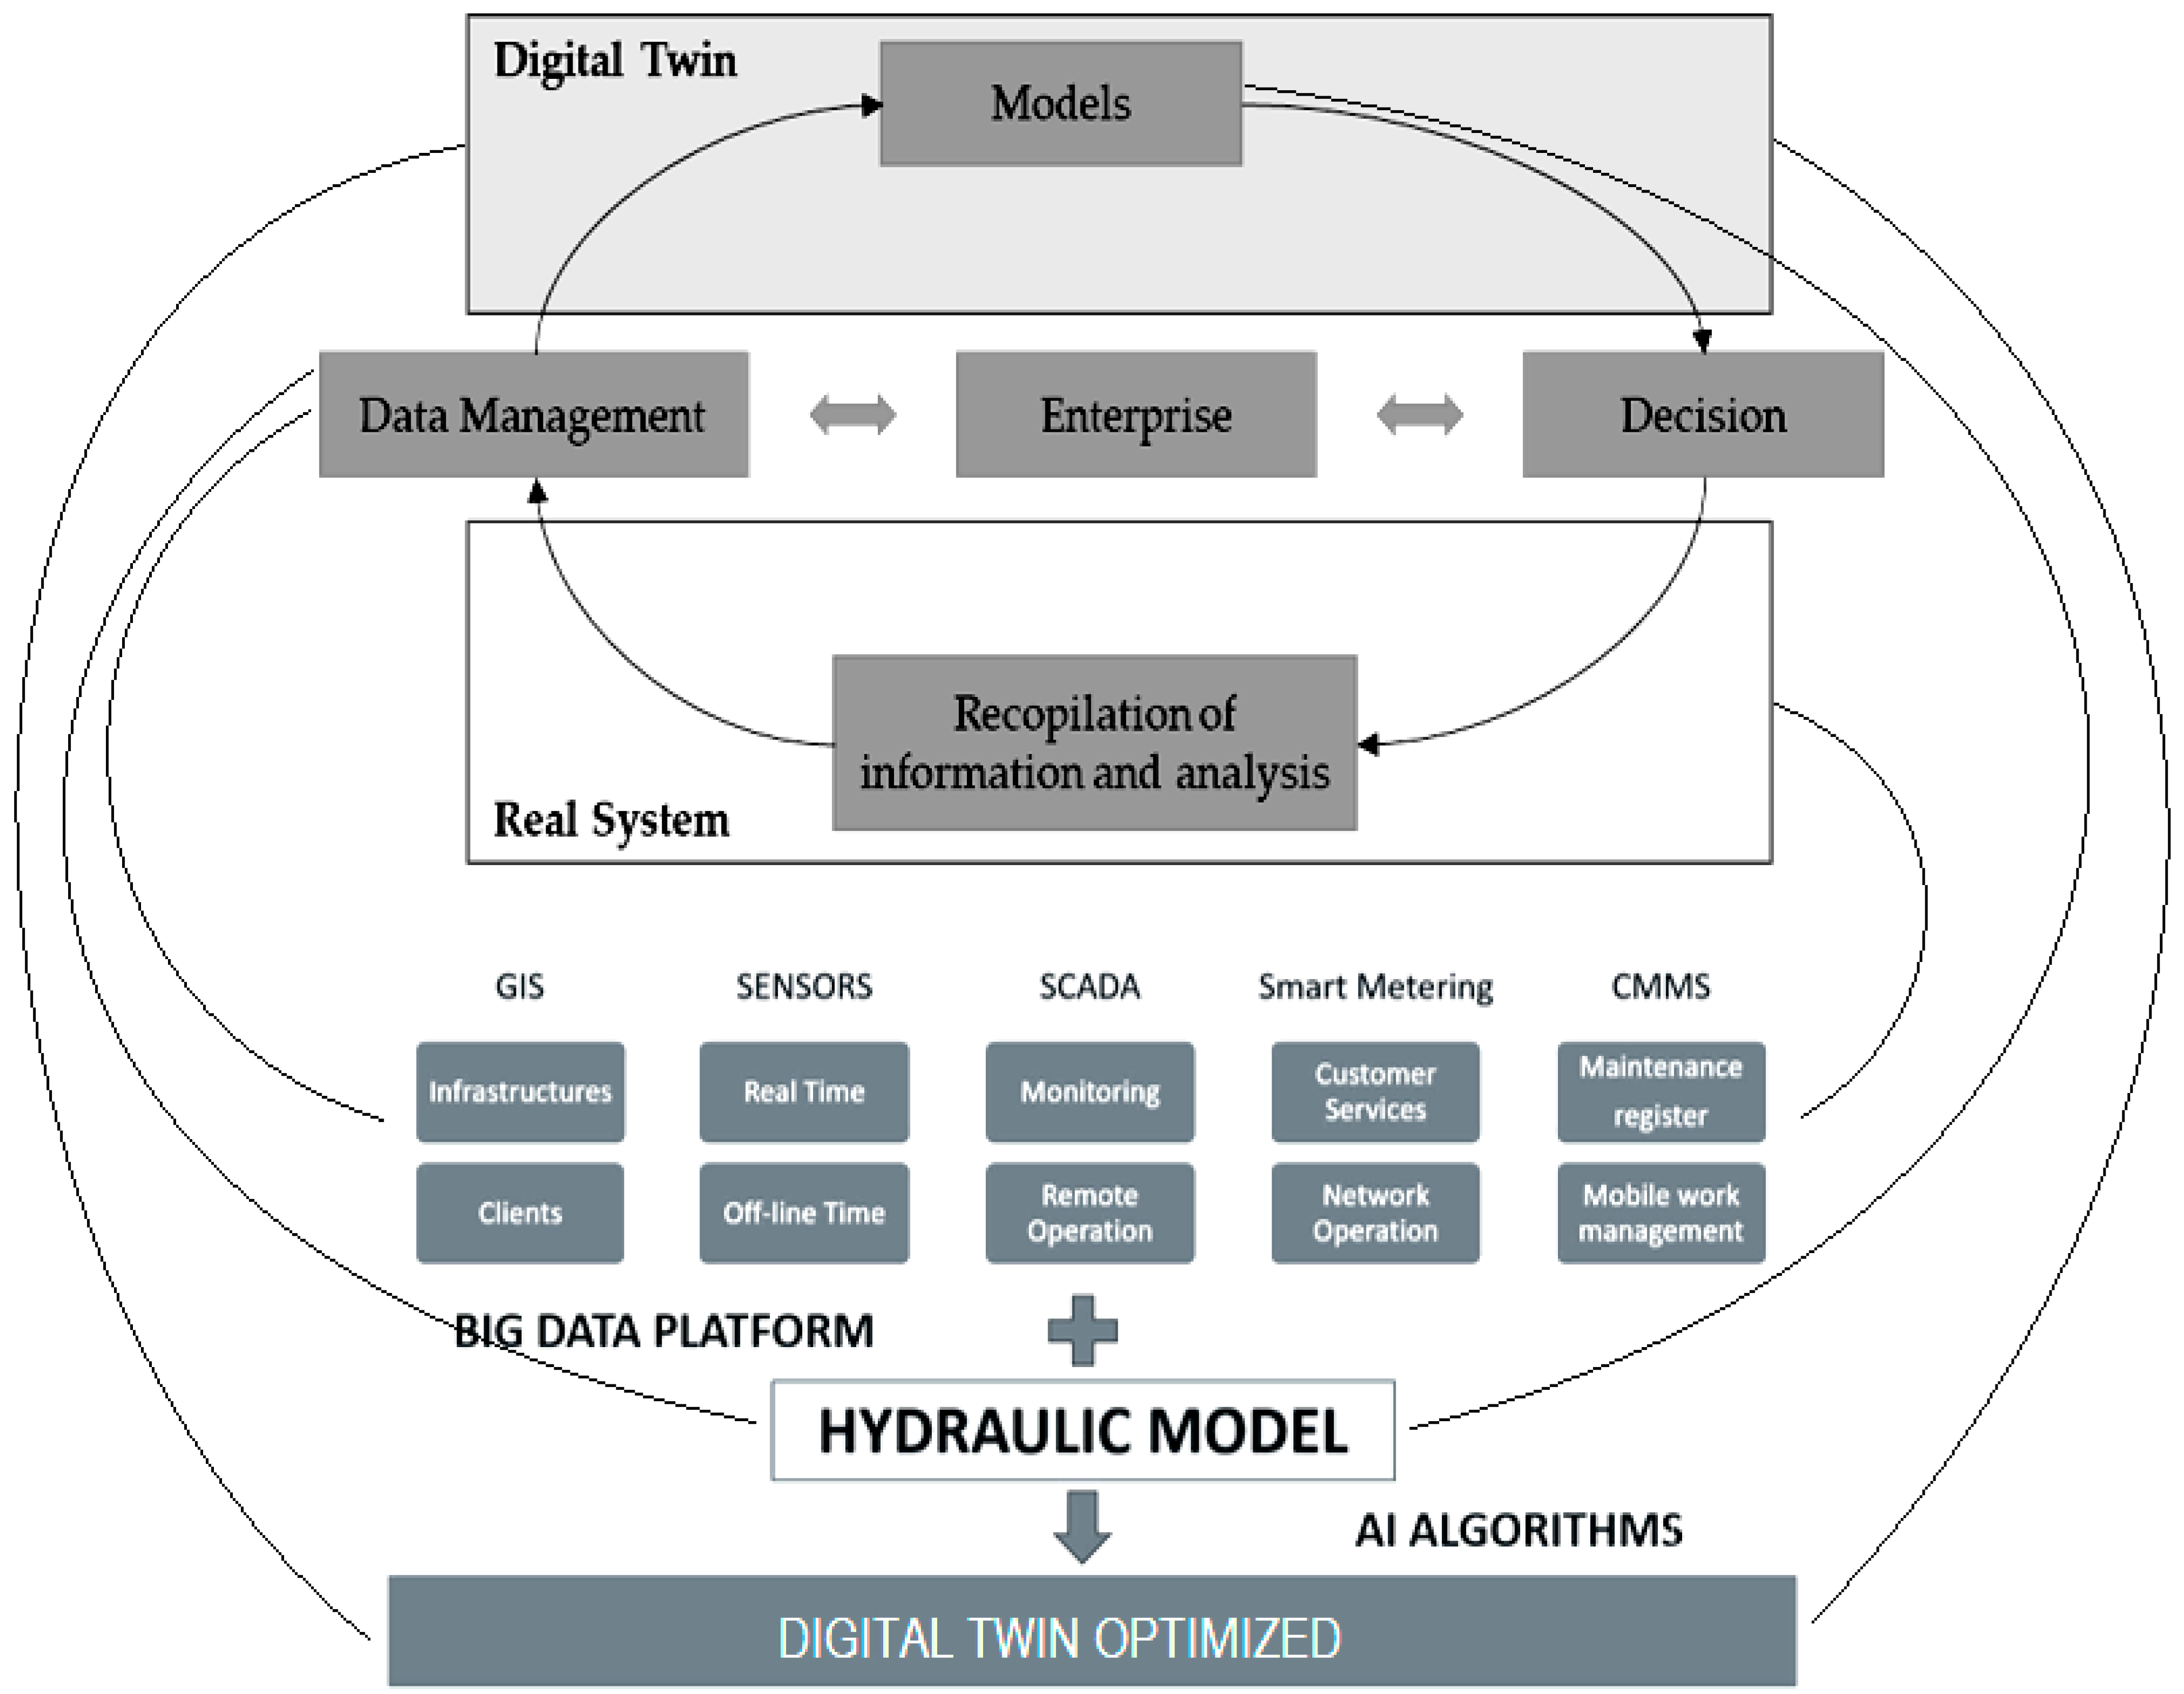
20]. A water system’s digital twin involves integrating virtual engineering models with optimization applied in city-scale reality models and GIS data (
Figure 1).
Additionally, digital twins are continuously updated with virtual operational data from SCADA, sensors, meters, and other artificial intelligent (AI) controlled sources and actuators. A digital twin system is used to reproduce real-time models of the water network to support the planning, design, construction, and operations towards smarter water networks. Digital twin also provides accurate and reliable data that utilities can use to perform analysis throughout the lifecycle of a water system [
21]. The aim for digital twins’ models of a water distribution system is to reproduce disruption scenarios for resilience assessment purposes in order to analyze asset prognosis and health-status to determine proactive maintenance models [
22].
A big data platform is needed to filter, normalize, and integrate useful information to develop Digital Twin. The main sources to create the platform are (i) GIS, which provides information about spatial locations; (ii) Sensors, receiving the information from the hydraulic network; (iii) SCADA, which is engaged to supervise, monitor and control the collected data; (iv) Smart Metering, with the aim of controlling the network operation and customer service in independent metered areas; (v) Computerized Maintenance Management System (CMMS), which allows one to track and maintain stationary assets. All the information sources are integrated within a hydraulic model by means of artificial intelligence (AI) algorithms and optimization procedures [
21].
Offline models do not represent the actual operations over a longer period of time, since many inputs need to be properly estimated, such as pumps and valves´ settings. In presence of an online model, such inputs do not require to be estimated, but rather are obtained from real-time field measurements. Data from field instruments are provided to the model via SCADA and used to perform hydraulic simulations, whose results can be then customized to implement optimization procedures. For the sake of example, the output of optimizations could be pumps or valves set points, which could be sent back to SCADA: the resulting set points allow the network to be operated in the most optimum manner in an automated closed loop way [
23]. Conversely, within an online model, the process is hourly repeated, allowing for the continuous update of information about the water consumption status, pressure at nodes, as well as possible supply disruptions.
The optimization procedures represent a crucial factor within Digital Twins [
24] and can be performed for many purposes, such as (i) minimum pressure retention in the water network by means of optimal setting points of valves, in order to reduce the water losses, as well as to extend asset life-time and contain the energy usage; (ii) optimal pump scheduling with the aim of reducing the operational costs; (iii) demand forecast model relying on historical demand data, which can be of help for the operator to take precautionary measures within low pressure zones.
Digital Twin technology provides a complete picture of the water infrastructure allowing for a better understanding of the water network behavior, as well as the prediction, planning, and prepareation for future events. The access to an accurate and complete set of information in real-time allows for the management of the assets, the reduction of lifecycle costs, the optimization of asset performance and lifespan, and the improvement of service levels. Moreover, digital twin provides a 360-degree view of all the infrastructure, helping to perform diagnostics and build models, as well as to establish ideal maintenance schedules, to conduct predictive and prescriptive analytics, to test and evaluate different scenarios, and finally to generate actionable insights in real-time for critical and efficient decision making [
25].
Longer-term benefits can result from DT technology, such as improved planning and preparedness, enhanced infrastructure resilience and sustainability, more reliable water service, and prediction of future renewal needs [
21]. Further benefits are represented by permanent reductions in costs for production, maintenance, emergency, and operation [
15].
Some examples of DT application in WDN can be found in the cities of Valencia (ES), Oporto (PT), and San Diego (CA). In Valencia, a digital transformation resulted in a complete overview of the network in real-time, with informative 24 h/7 d actionable dashboards. This allows for simulatons of previous, present, and future scenarios under all kind of operating conditions [
26]. In Oporto, the public company uses DT integrating information across multiple software systems in order to manage both the water supply and sewage systems, as well as two wastewater treatment plants, water quality, and stormwater drainage. The platform is used to forecast flooding and water quality issues, as well as to improve services and ensure resilience of the water infrastructure [
27]. Finally, San Diego relies on DT technology to improve commissioning and long-term operations as an operator training platform for a water purification facility. The model is used to verify control points, such as pump actuations/deactivations or rotational speed regulation, depending on process operations and online instrumentation [
28].
3. Digital Twin (DT) Methodology
The digital model is a virtual representation of water network, reproducing the exact behavior of the real model. The view of digital water turns from a web complexity to a map of opportunities. Successfully this map has a big potential to transform the economics of water management. In
Table 1 there is an overview of the Digital Water creation value.
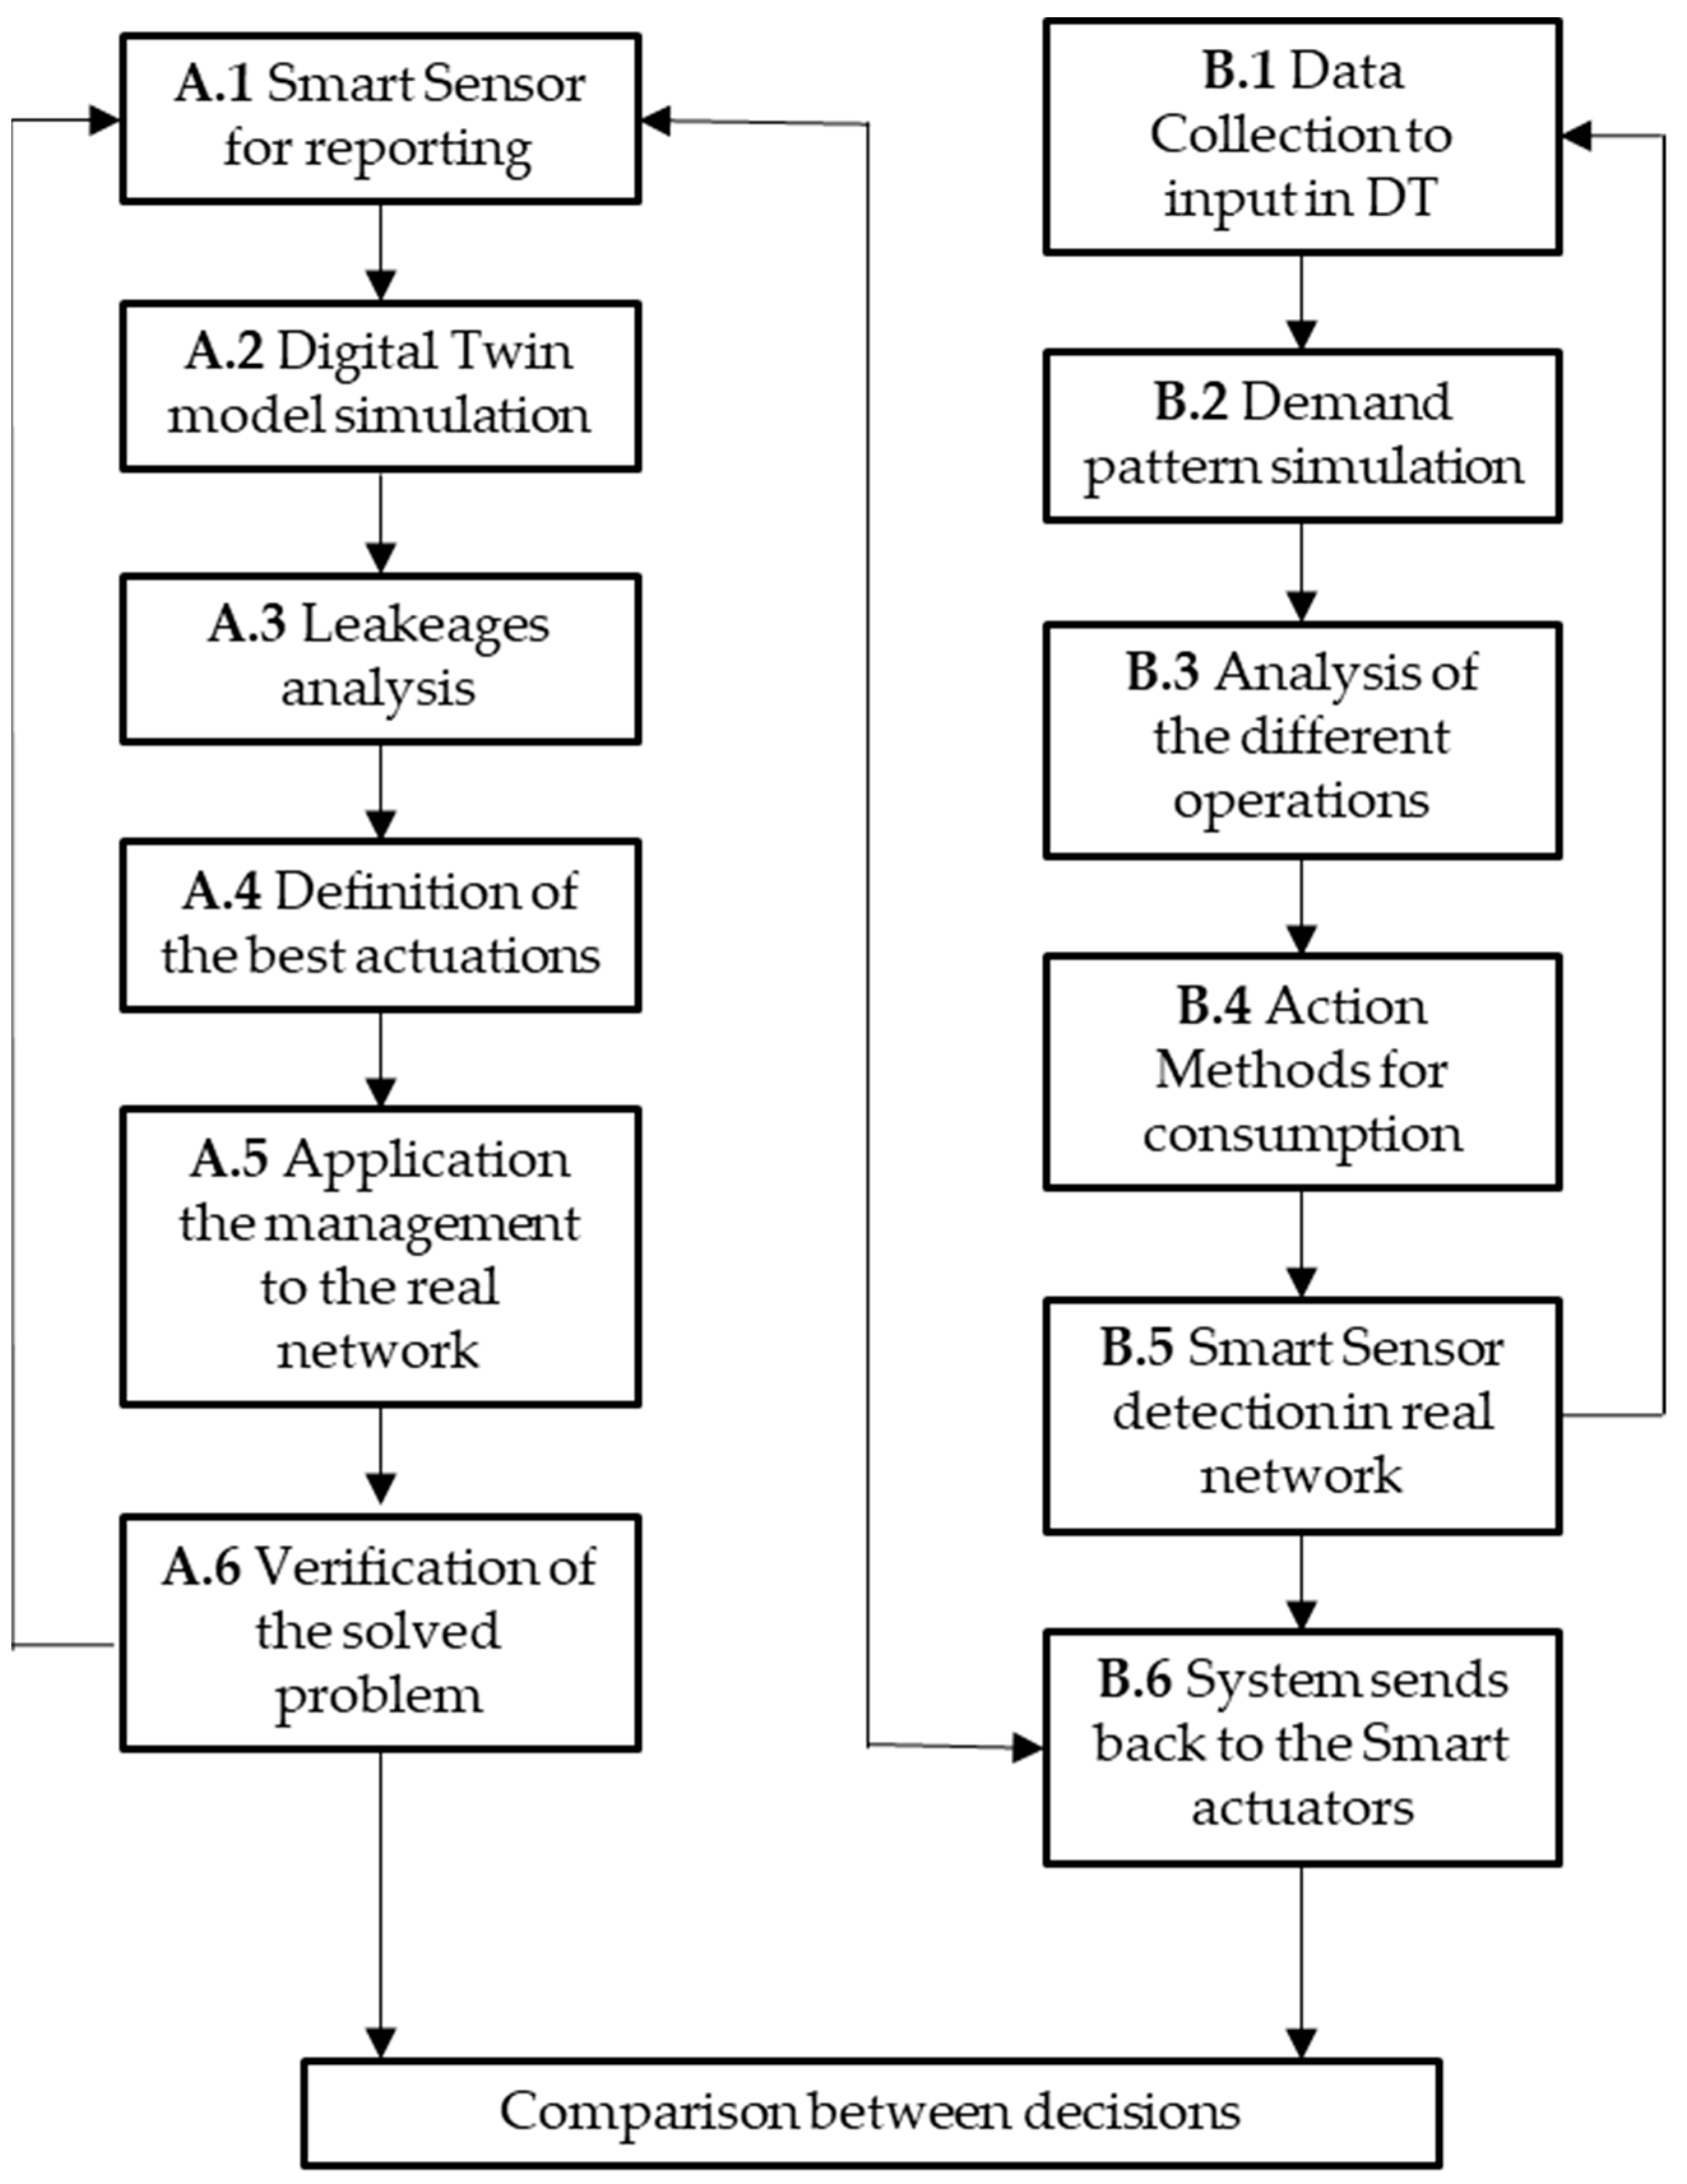
Two methodologies are typically applied to control leakages in water networks: reduction losses methodology and consumption prediction models. Both methodologies can be integrated within DTs by following different steps, as showed in the flowchart in
Figure 2. A detailed decription of each single step is following provided:
Step A.1, smart sensors are distributed along the water network to detect anomalies, such as a leak or an abnormal loss of water. These sensors report the alert to the DT and transmit the information to the data platform. Thus, the data collection for future events is updated and the virtual model receives the necessary information to process and identify such kind of problems in the network.
Step A.2, the virtual system reproduces all the information received from the sensors and localizes the leakage in the real network. The parameters used in DT are the differences in flow, pressure and head losses detected at different points of the network.
Step A.3, once the DT has simulated the leakage, the causes responsible for leakage, such as defects in supply points, bursts or illegal connections, are investigated to find better solutions.
Step A.4, different solutions are considered and simulated in order to find the best reducing intervention water losses.
Step A.5, the DT model provides the actuators with the information about the chosen solution. The complexity, as well as the time spent to undertake the selected solution, depend on the kind of intervention.
Step A.6, once the actuators perform the intervention, feedbacks are required to verify whether the problem is properly solved. These information are then collected within the data platform and could be crucial to improve the response efficiency in case of future anomalies.
The right branch of the flowchart in
Figure 2 is focused on the prediction of water consumption and consists of several steps as well.
According to step B.1, the Data Platform collects all the information received from smart water metering (e.g., GIS and SCADA information about costomer locations, network operation, and peaks of demand), which are stored to build a data warehouse. The data are filtered, sorted, and summarized for analyses in the virtual model.
Step B.2, the DT model is simulated according to the data collected at step B.1. At this stage, several consumption patterns, differing for location and time, are obtained.
Step B.3, in order to investigate future peak demands, different critical scenarios are simulated in the virtual model, such as an abrupt increase or decrease of the water demand. The behavior of the network in these conditions is analyzed to determine which parameters are affected and which ones need to be regulated to maintain constant values of pressure and flow.
Step B.4, once the analyses of the virtual network is performed, action methods are defined in order to deal with future peaks of demand in the real network. The selected procedures are established according to all the information received from the smart sensors, thus anticipating future abrupt changes and enhancing the efficiency of water supply.
Step B.5: Every time the smart sensors detect any change in the demand pattern, the related information is properly analyzed, and new actions are recommended in order to ensure a water sapply as constant as possible. In case of a change in demand, the virtual model chooses the best among possible solutions defined at step B.4. On the other hand, in case of new anomalies that have never been detected before, new data are collected, and the process returns backs to step B.1, defining a new procedure to deal with the new pattern change.
Step B.6, once the best procedure is defined, either because the DT has already simulated one before or a new procedure has been just defined, the actions resulting from the solutions established by the virtual model are transmitted to the smart actuators.
4. Case Study—DMA 320 in WDN of Lisbon
4.1. Characteristics of the DMA
In EPAL, water distribution network in Lisbon, the measures in terms of flow, demand and pressure are recorded in District Metering Areas (DMAs). Leakage detection and WDN efficiency are significantly improved when DMAs are supported by electronic devices and AI model (DT + Optimization).
This study relies on specific data available for a DMA in Lisbon, with the aim of studying the behavior of the water system. Among the possible analyses, the following ones are (i) Evolution of the water network throughout the day; (ii) Differences between consumptions, depending on the time of the day; (iii) Peaks of consumption along the day and further periods (e.g., workdays or weekends); (iv) Segregation of water consumptions (real and apparent losses); (v) Flow and pressure in the WDN along the time.
The analysis of water losses was carried out with reference to DMA 320 of Lisbon in 2005, and the related measures are used in this study to support the proposed research. Although there has been an improvement in terms of water losses since 2005, the leakage trend is considered and still represents an interesting example of study [
29].
The data based on real measurements recorded by EPAL are used in this study to explore the benefits of DT implementation within WDNs. A particular focus is given on the amount of water loss due to leakages.
Data collection in different points of the network allows one to localize the losses and leakages. Nevertheless, whether the data collection and analysis are not carried out in real-time, the intervention may require long time and this implies a further amount of water that is lost between the time at which the leakage occurs, its detection and repair.
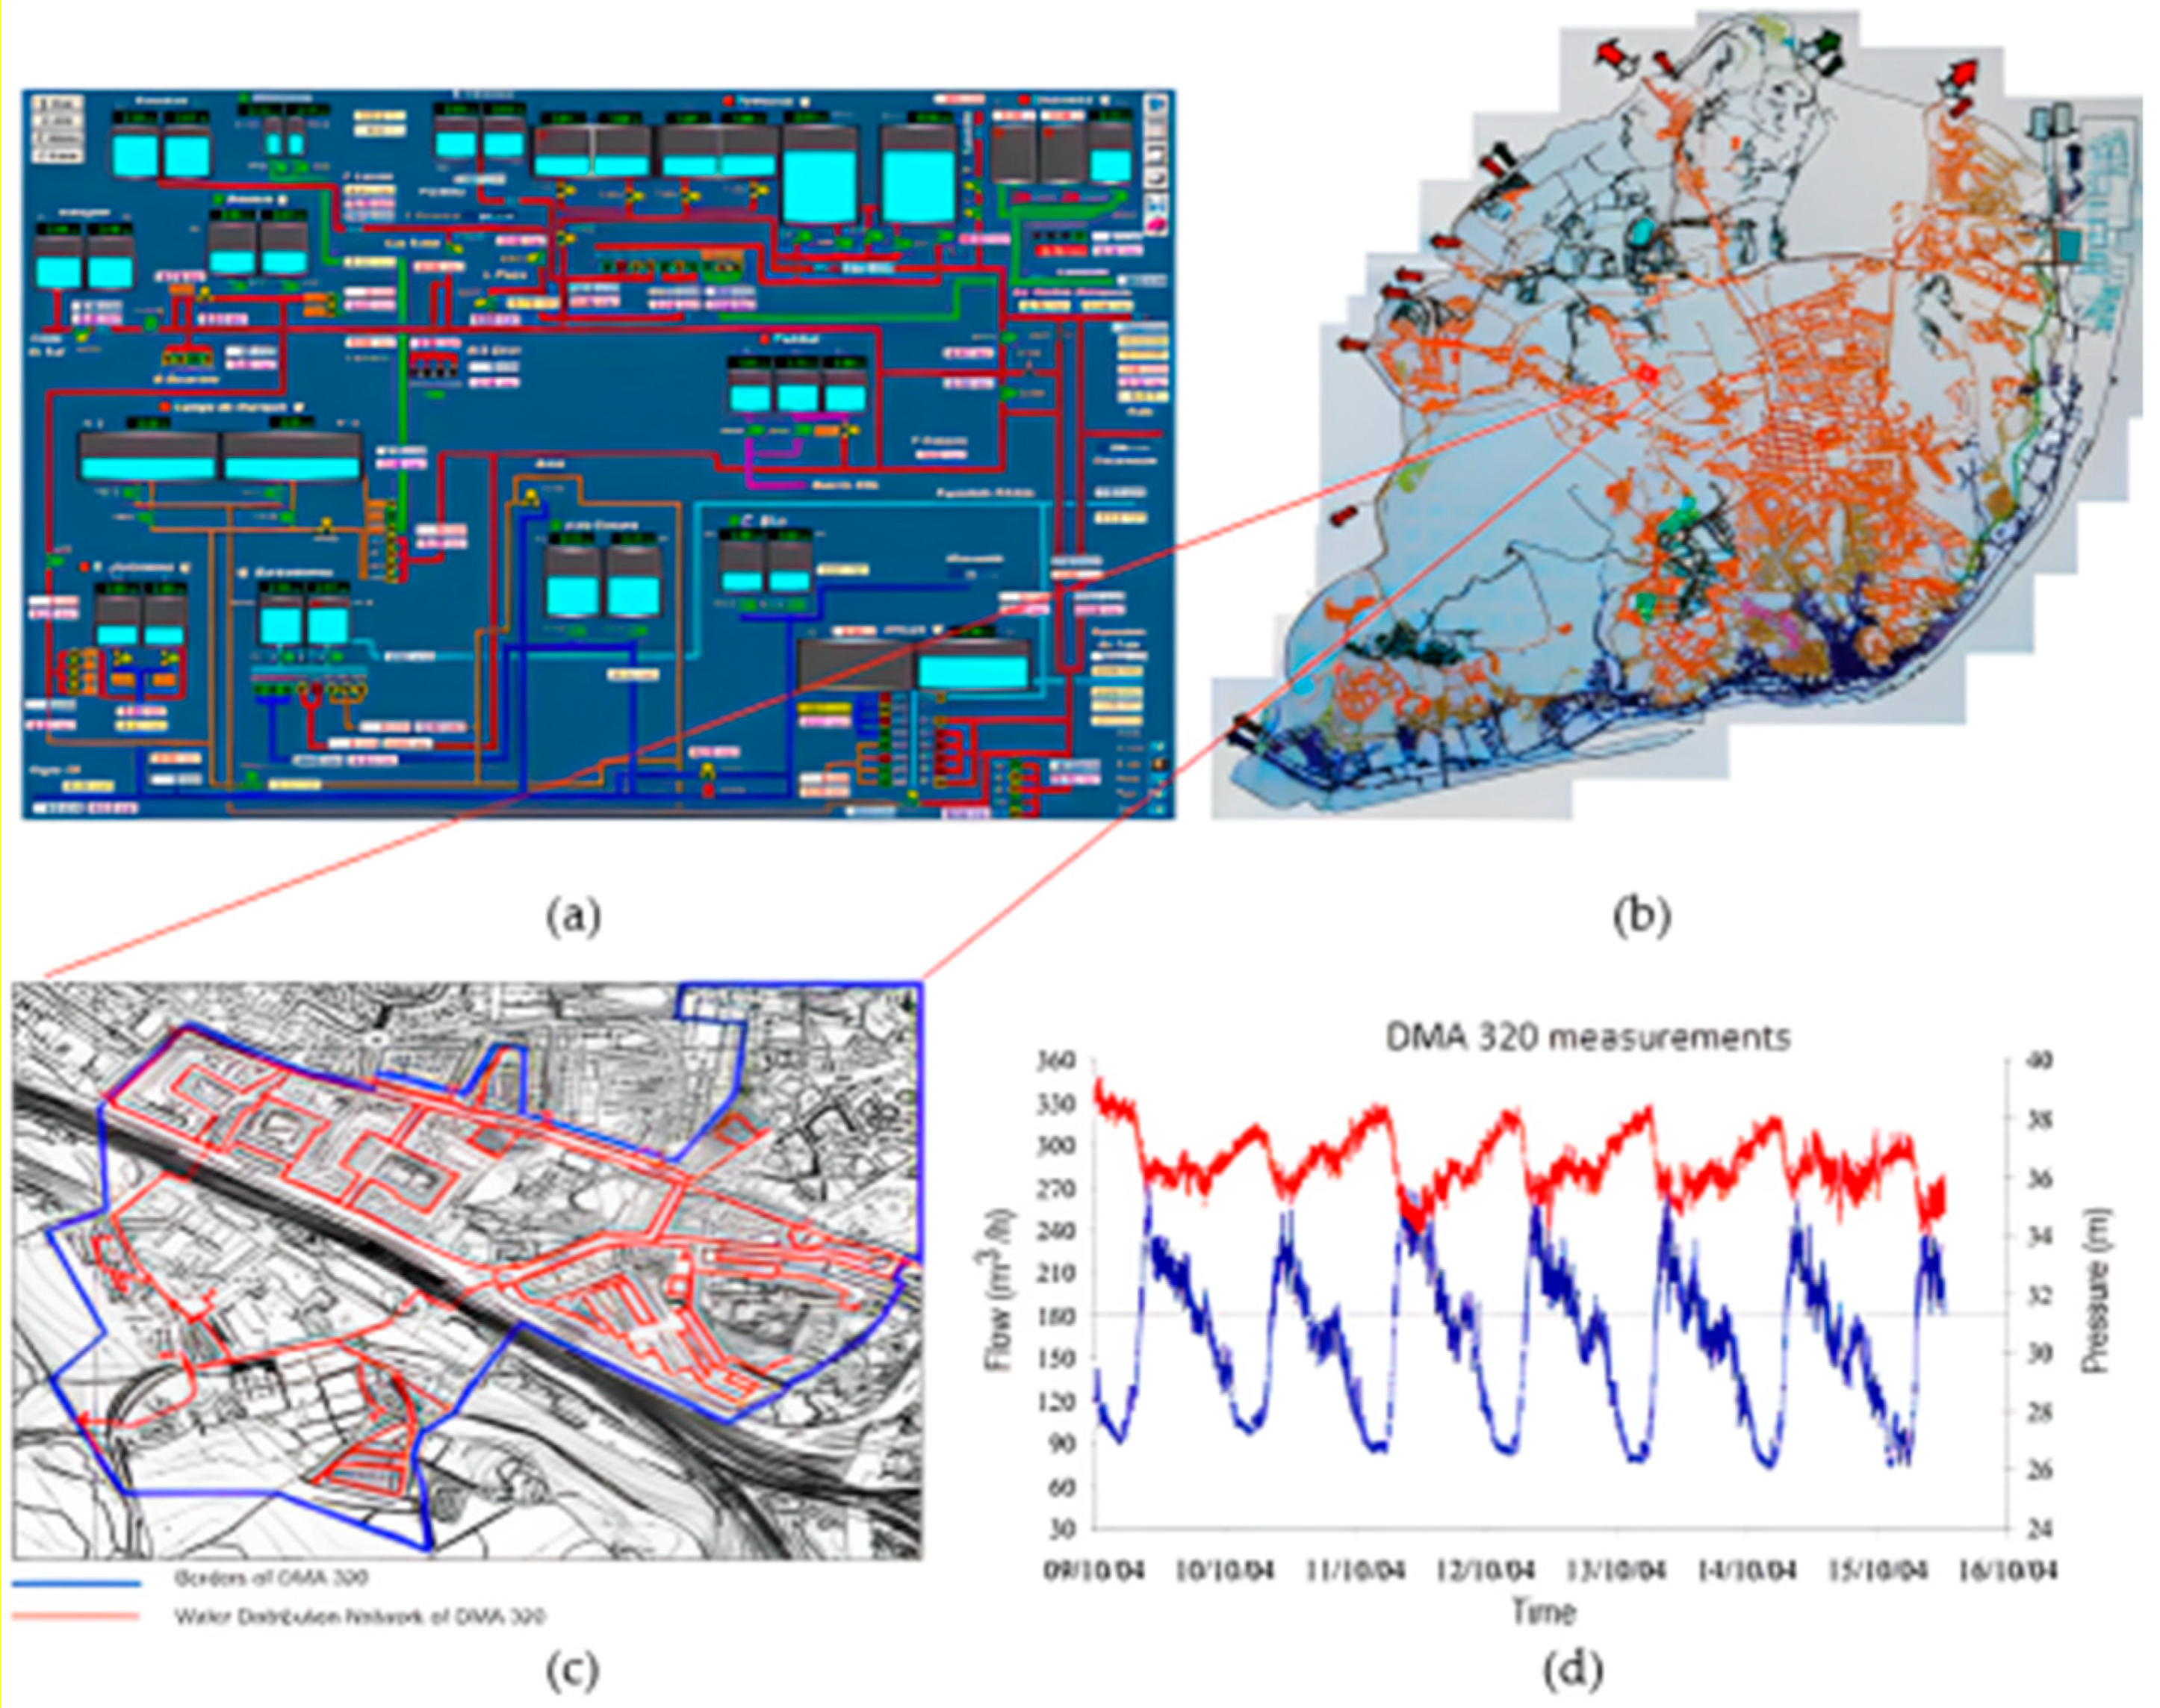
In
Figure 3a the WDN complex system is presented, as well the altimetric distribution (
Figure 3b), the whole DMA 320 (
Figure 3c) and flow and pressure measurements in DMA320 (
Figure 3d).
Figure 3d refer to measurements carried out during the week 9/10–16/10 in 2004. The data were acquired by a digital datalogger with a sampling frequency of 30 records per hour. According to
Figure 3d, it is worth focusing on the water consumption during the night period, when most of the registered flow is due to the leakages in the network.
Hence, all of the study was based on the night flow, the daily consumption curve without the actual losses, the daily variation of real losses, the daily invoiced consumption curve, the daily variation of apparent losses, and the non-invoiced authorized consumption. This allowed a balance of the consumption of daily water as presented by [
30] and supported this investigation.
4.2. Identification of the Analyzed Zone
The city of Lisbon, located in Southern Europe, is characterized by a subtropical-Atlantic climate, with mild winters and hot summers. Hence, in such a city, the water efficiency is a factor of paramount importance. Reducing the leakages within the network, as well as the amount of ‘non-revenue water’, can be of help to increase the water use efficiency of the system and improve the customer experience. A crucial aspect to account for is the growing demand for drinking water due to the constant population growth. Nowadays, the network supplies drinkable water to around 350,000 customers (both domestic and commercial) within the inner city, as well as around 2,500,000 people in the Greater Lisbon area.
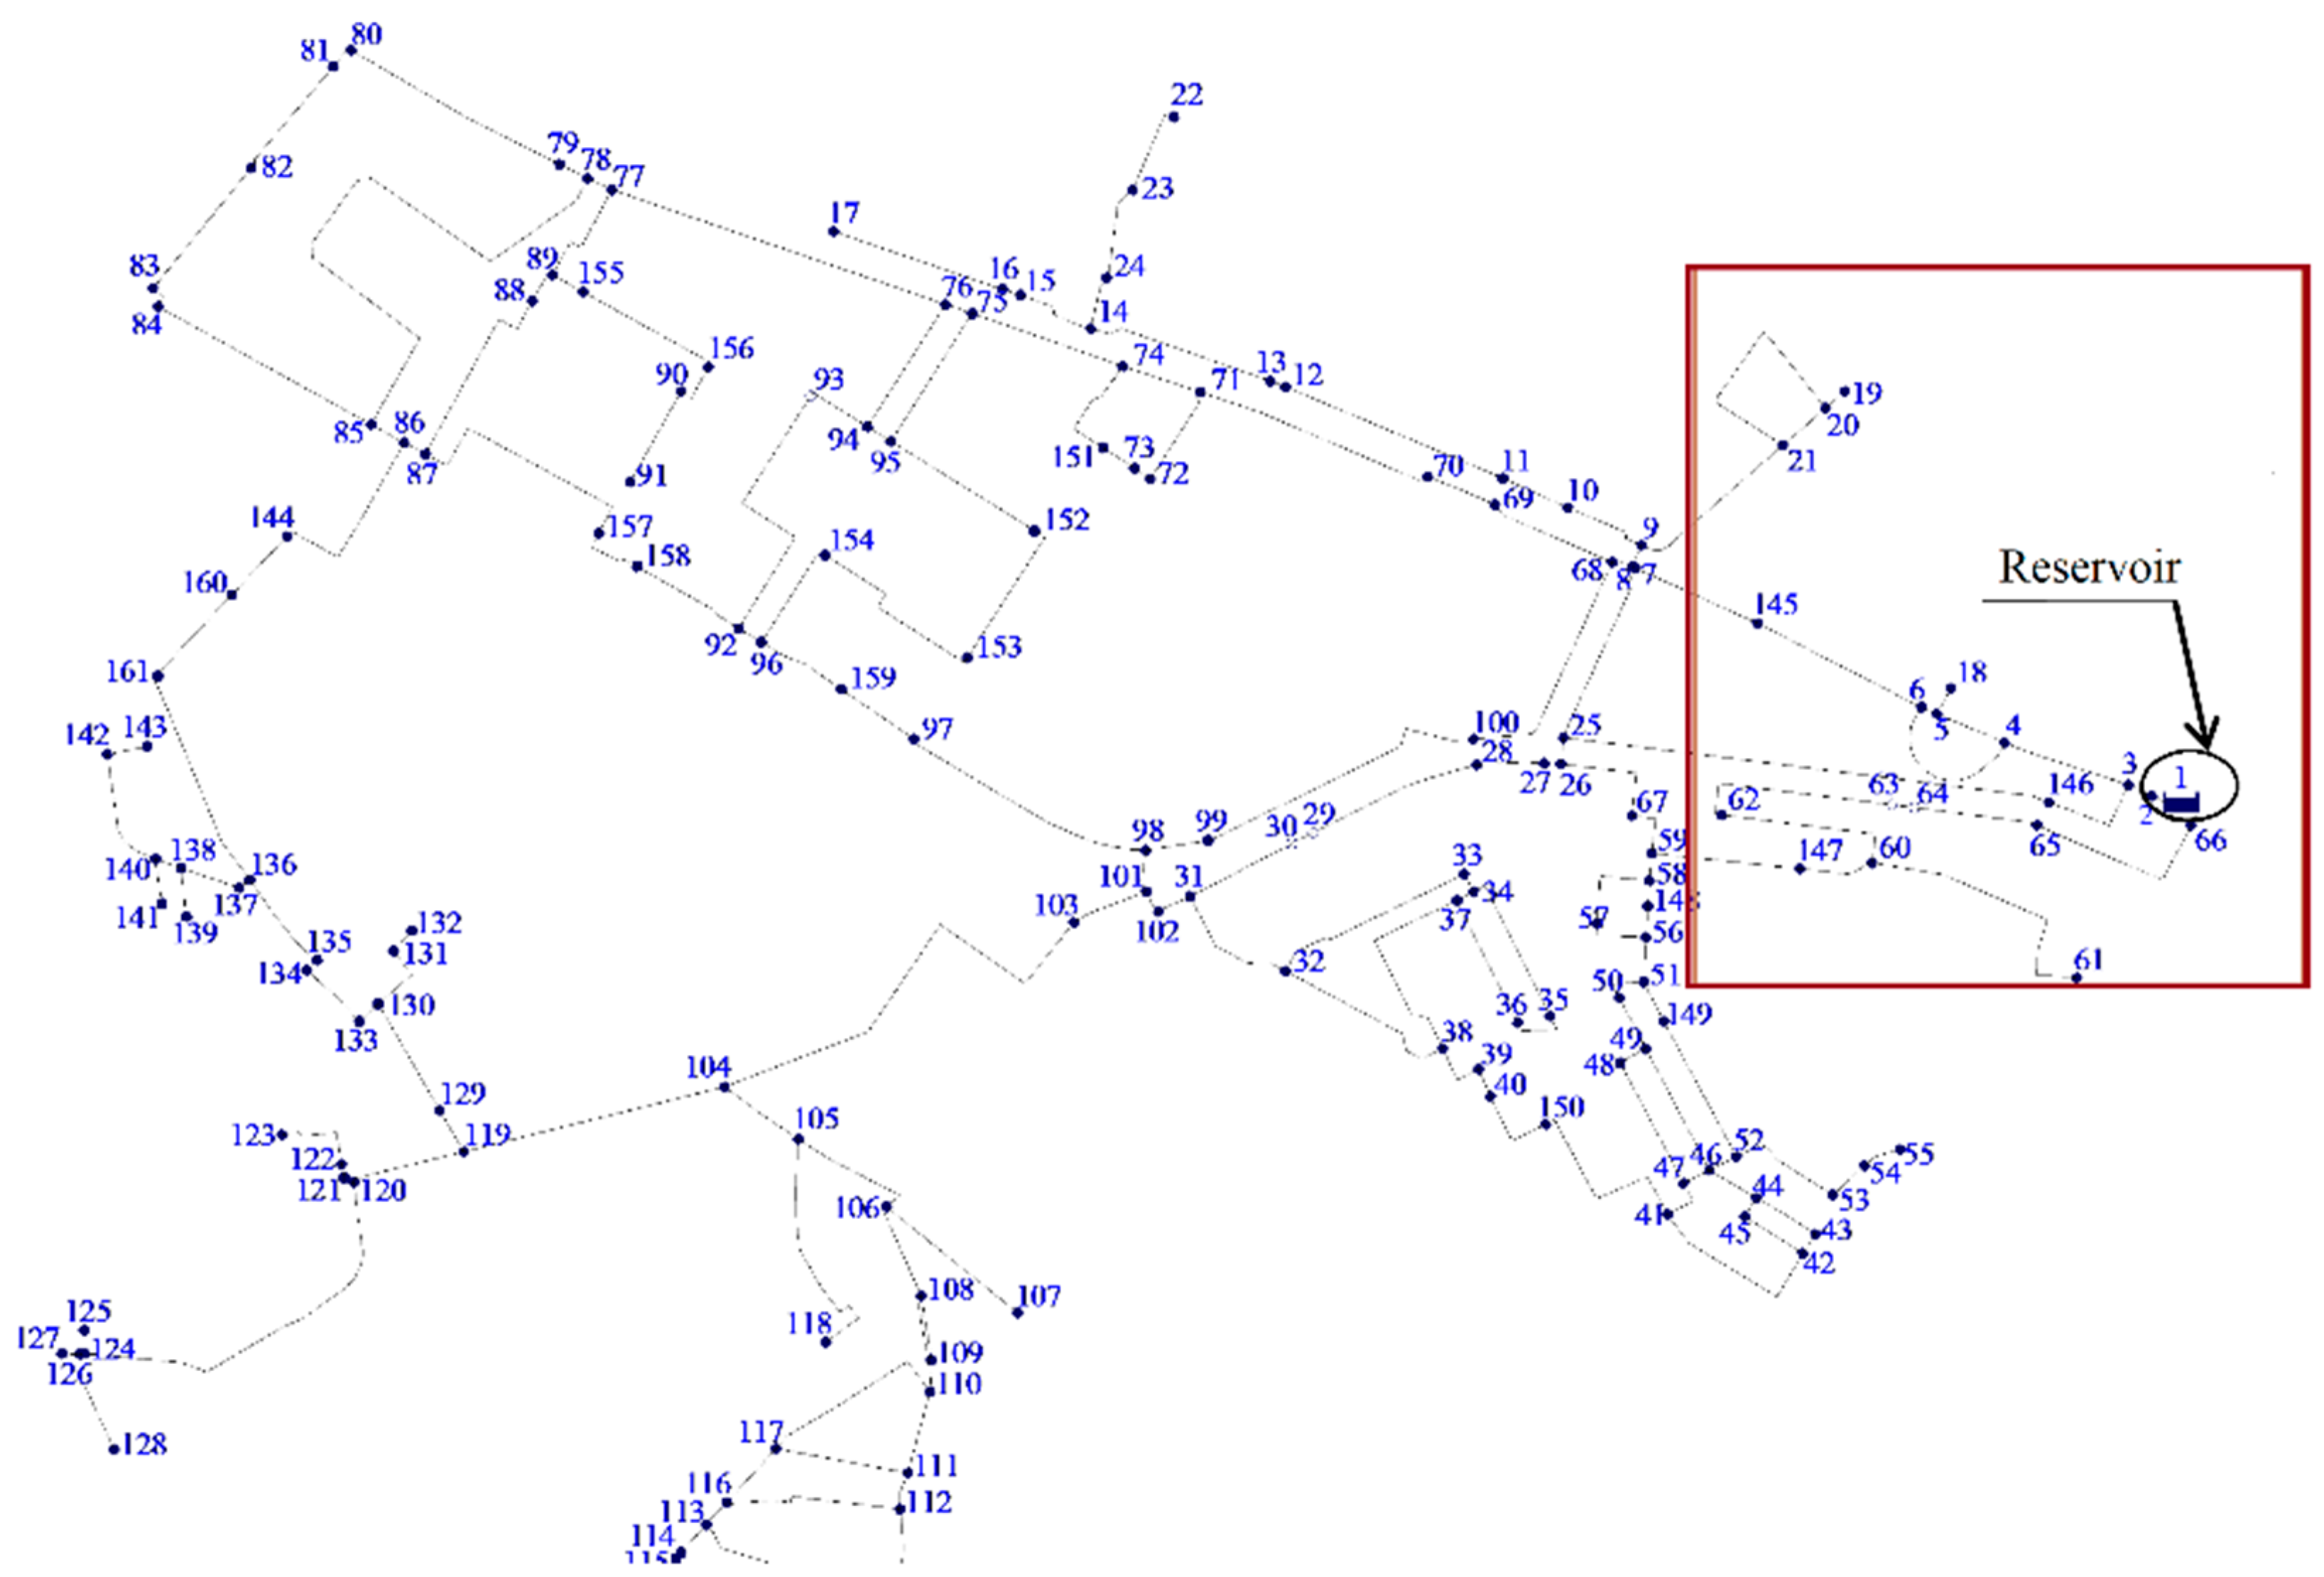
This study is focused on a part of the districted metered area 320 in Lisbon (red rectangle in
Figure 4). This area covers a surface of 4.30 km
2 and supplies around 34,000 users.
It is worth clarifiying the DMA has not been entirely analyzed to simplify the implementation of this new methodology, which consists of the integration of DT along with the optimization procedure, making it easier and understandable, enabling to enhance the system efficiency and the real time response with lesser complexity.
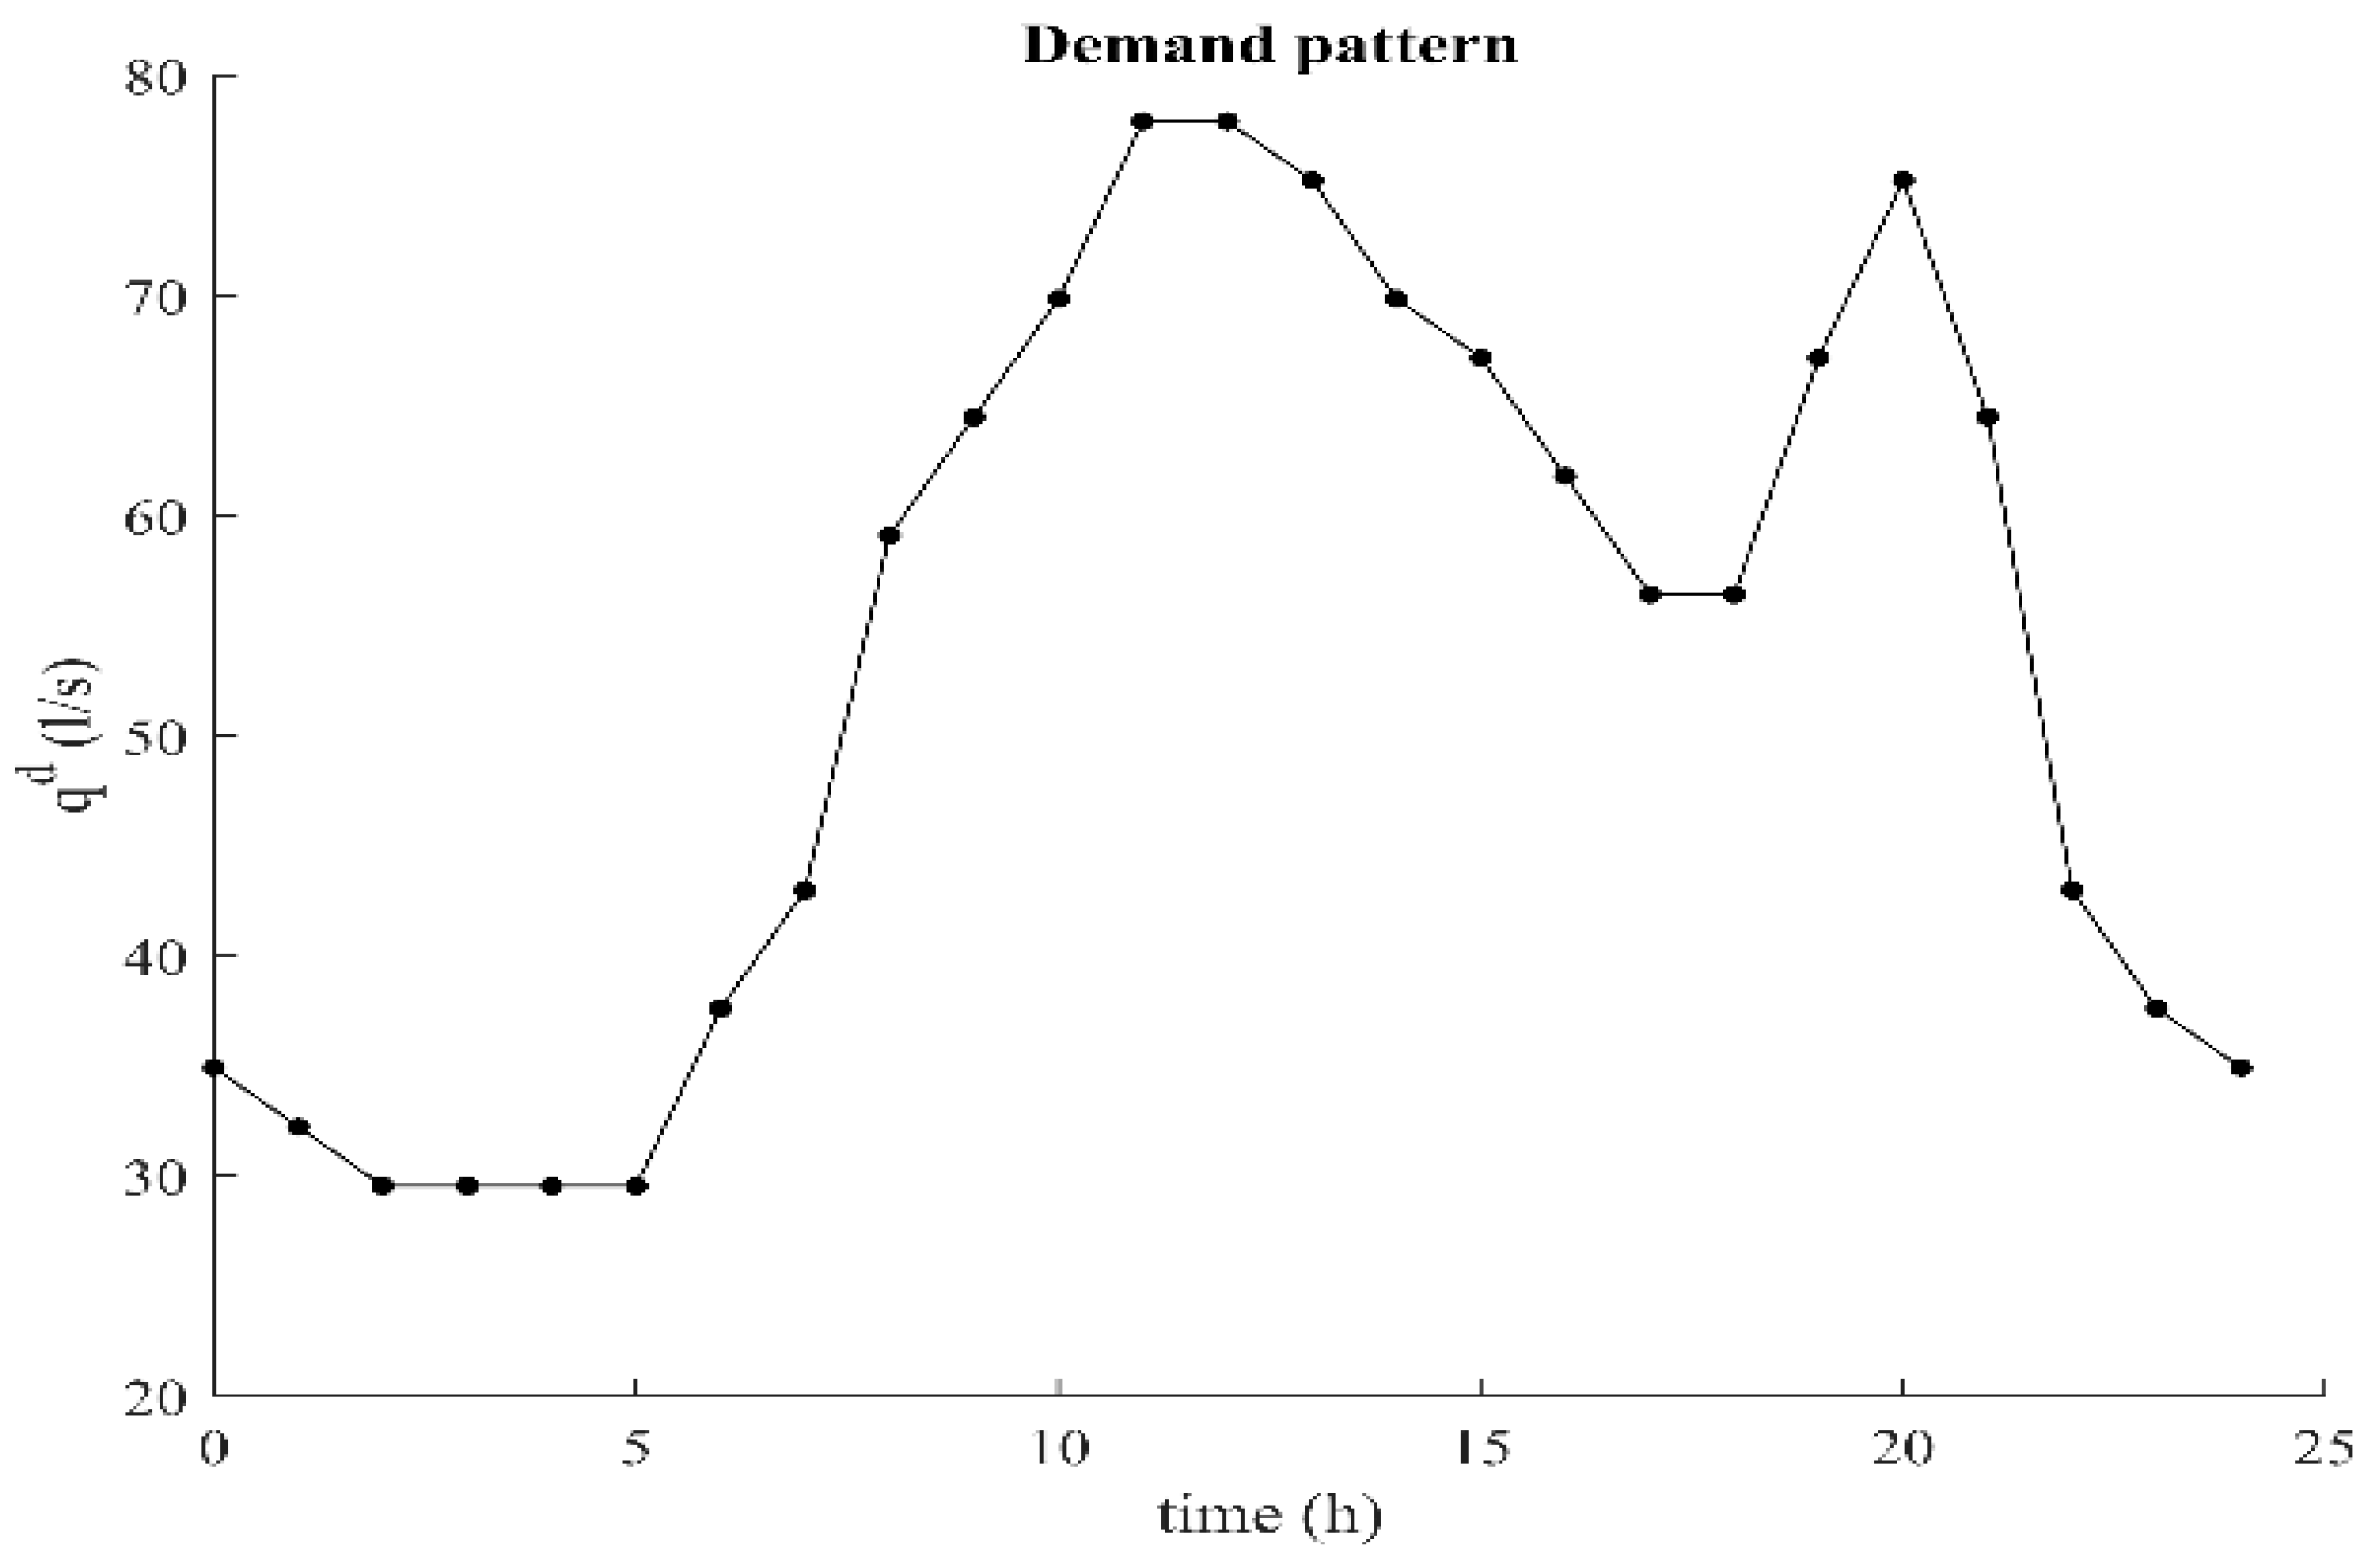
The water network is supplied by one reservoir, which is assumed having an unlimited capacity. Different water demands have been simulated, being divided into three categories (i.e., low, high, and medium demand) in order to simulate different consumptions. The total water demanded by the nodes is an approximation of real consuption of the DMA. The pipes of the network are characterized by the Hazen–Williams coefficient of 100 and a diameter equal to 200 mm. The daily pattern of the water demand in the whole network is shown in
Figure 5.
Since it is not straightforward to simulate such a network along with the changes patterns of water supply and demand at each node, in this study, several hypotheses were made in order to better highlight the effect of AI and advanced electronics on this real water network response.
4.3. The Optimization Procedure
The optimization tools represent a crucial aspect of DT technology. Indeed, a well-posed optimization may contribute to significantly increase the water-energy nexus efficiency of WDNs. However, it is worth underlining that the optimization procedures need to be properly tailored and detailed, based on requirements and characteristics of the reference networks.
Regarding the analyzed case study, the proposed optimization aims at searching for the optimal settings of three existing PRVs, in order to ensure minimum pressure values at the nodes, thus reducing the total amount of leaked water without compromising the correct operation of the system.
4.3.1. Variables
Since the valves already exist, the variable of the problem is represented by the valve settings, represented by the head loss within the device ().
In this study, the optimization procedure is carried out by the computation of flow in pipes and head at nodes, by modeling the momentum balance equations within pipes and continuity equations at nodes as constraints of the optimization problem. As a result, the discharge flowing within the pipes () and the head at the nodes () represent variables of the optimization as well.
Moreover, the optimization procedure requires to be performed along the day. The network is modeled in quasi-steady conditions, which means that the hydraulic transient due to the demand variation is neglected. With reference to
Figure 4, the pattern can be divided into
demand steps, with
equal to 24.
To sum up, known the demand at the nodes of the network, the variables of the optimization procedure are the head loss within the device (), the flow through the pipes (), and the head at the nodes (). Such variabes are all continuous. Moreover, and are computed for each link and for each time interval θ (θ=1…), whereas is defined in each node and each time interval θ (θ=1…).
4.3.2. Constraints
Given a node i (i = 1…n), the mass continuity equation can be expressed as follows:
where
is the total discharge in the
-th link included in the set
of links approaching the node
, and the superscripts
and
refer to a discharge flowing into and out of the
-th node, respectively. Moreover,
represents the water demand at the i-th node, and
is the amount of leaked water expressed according to the formulation proposed by Araujo et al. (2006) [
31], with
exponent equal to 1.18 and
equal to
With reference to Equation (2),
is a coefficient equal to
[
31,
32] and
is the number of pipes approaching the
-th node and linking nodes
and
with a length
. Regarding the term
in Equation (1), it represents the pressure at the i-th node:
where
is the elevation of the i-th node.
In addition, for each k-th (k = 1…l) the momentum balance equation was written according to Equation (4):
where
and
are the head in the initial (
-th) and final (
-th) node, respectively, of the
-th link;
is the length of the k-th pipe and
is the resistance term, expressed according to the Hazen–Williams formula:
With reference to Equation (5), and are the roughness coefficient and the diameter of the -th pipe, respectively.
In Equation (4), the term is the equivalent of the sign function, in order to ensure that the head loss within the valve has the same direction as the flow.
For the sake of brevity notation, the dependence on the demand step in both the continuity and momentum balance equations was omitted. However, the mass continuity equation (see Equation (1)) was written for each node i (i = 1…n) and for each demand step Θ (), whereas the momentum balance equation was written for each link k (k = 1…l) and for each demand step Θ (). The total number of hydraulic constraints can be therefore accounted as and , for mass continuity equation and momentum balance equation, respectively.
A set of linear constraints was introduced in order to keep the pressure in the whole network above a minimum required value and belove a maximum allowable:
where
and
were set as 25 m and 60 m, respectively. Such a maximum pressure vaue was set according to ERSAR technical guidance (
https://www.ersar.pt/pt/publicacoes/publicacoes-tecnicas/guias (accessed on 1 April 2022)). These constaints were written for each node i (i = 1…n) and for each demand step Θ (
), thus the total number can be accounted as
.
To contain the maximum excursion of pressure, the following set of non-linear constraints was introduced:
with
equal to 30 m.
A further set of linear constraints was introduced in order to properly model the variable
:
where
is the maximum head-loss within the valve, and
is a parameter fixed equal to 1 in the pipes where the valves are installed, 0 otherwise. The set of constraints presented in Equations (8) and (9) are essentially intended to force
to be equal to 0 where the valves are not located, as well as to properly bound the variable in the pipes where the valves are instead located, in order to shrink the research space of the optimization.
4.3.3. The Mathematical Model
The complete mathematical model is presented in Equation (10). As objective function, the minimization of the daily flow rate leaked in the whole network was assumed.
Since the variables of the problem are all continuous, and the constaints are both linear and non-linear, the resulting mathematical model is non-linear programming (NLP). The model has been written by a Mathematical Programming Language (MPL) [
33], which is an algebraic modeling language supporting many solvers, both open source and commercial softwares. As optimization solver, the Interior Point OPTimizer (IPOPT) [
34] was selected, being a very efficient solver for NLPs resolution. It is worth underlining that standard NLP solvers only guarantee local optima. In non-convex problems, indeed, the NLP solver may find different local optima when started from different starting points. Only in convex problems, the local and global optima coincide. With reference to the analyzed problem, since a convexity study is not easily attainable, the found solution is likely to be a local optimum. This solution consists of the head drop within the valves, as well as the hydraulic model of the network (i.e.,
through the pipes and
at the nodes) within the reference day.
5. Results
5.1. Water Losses Analysis
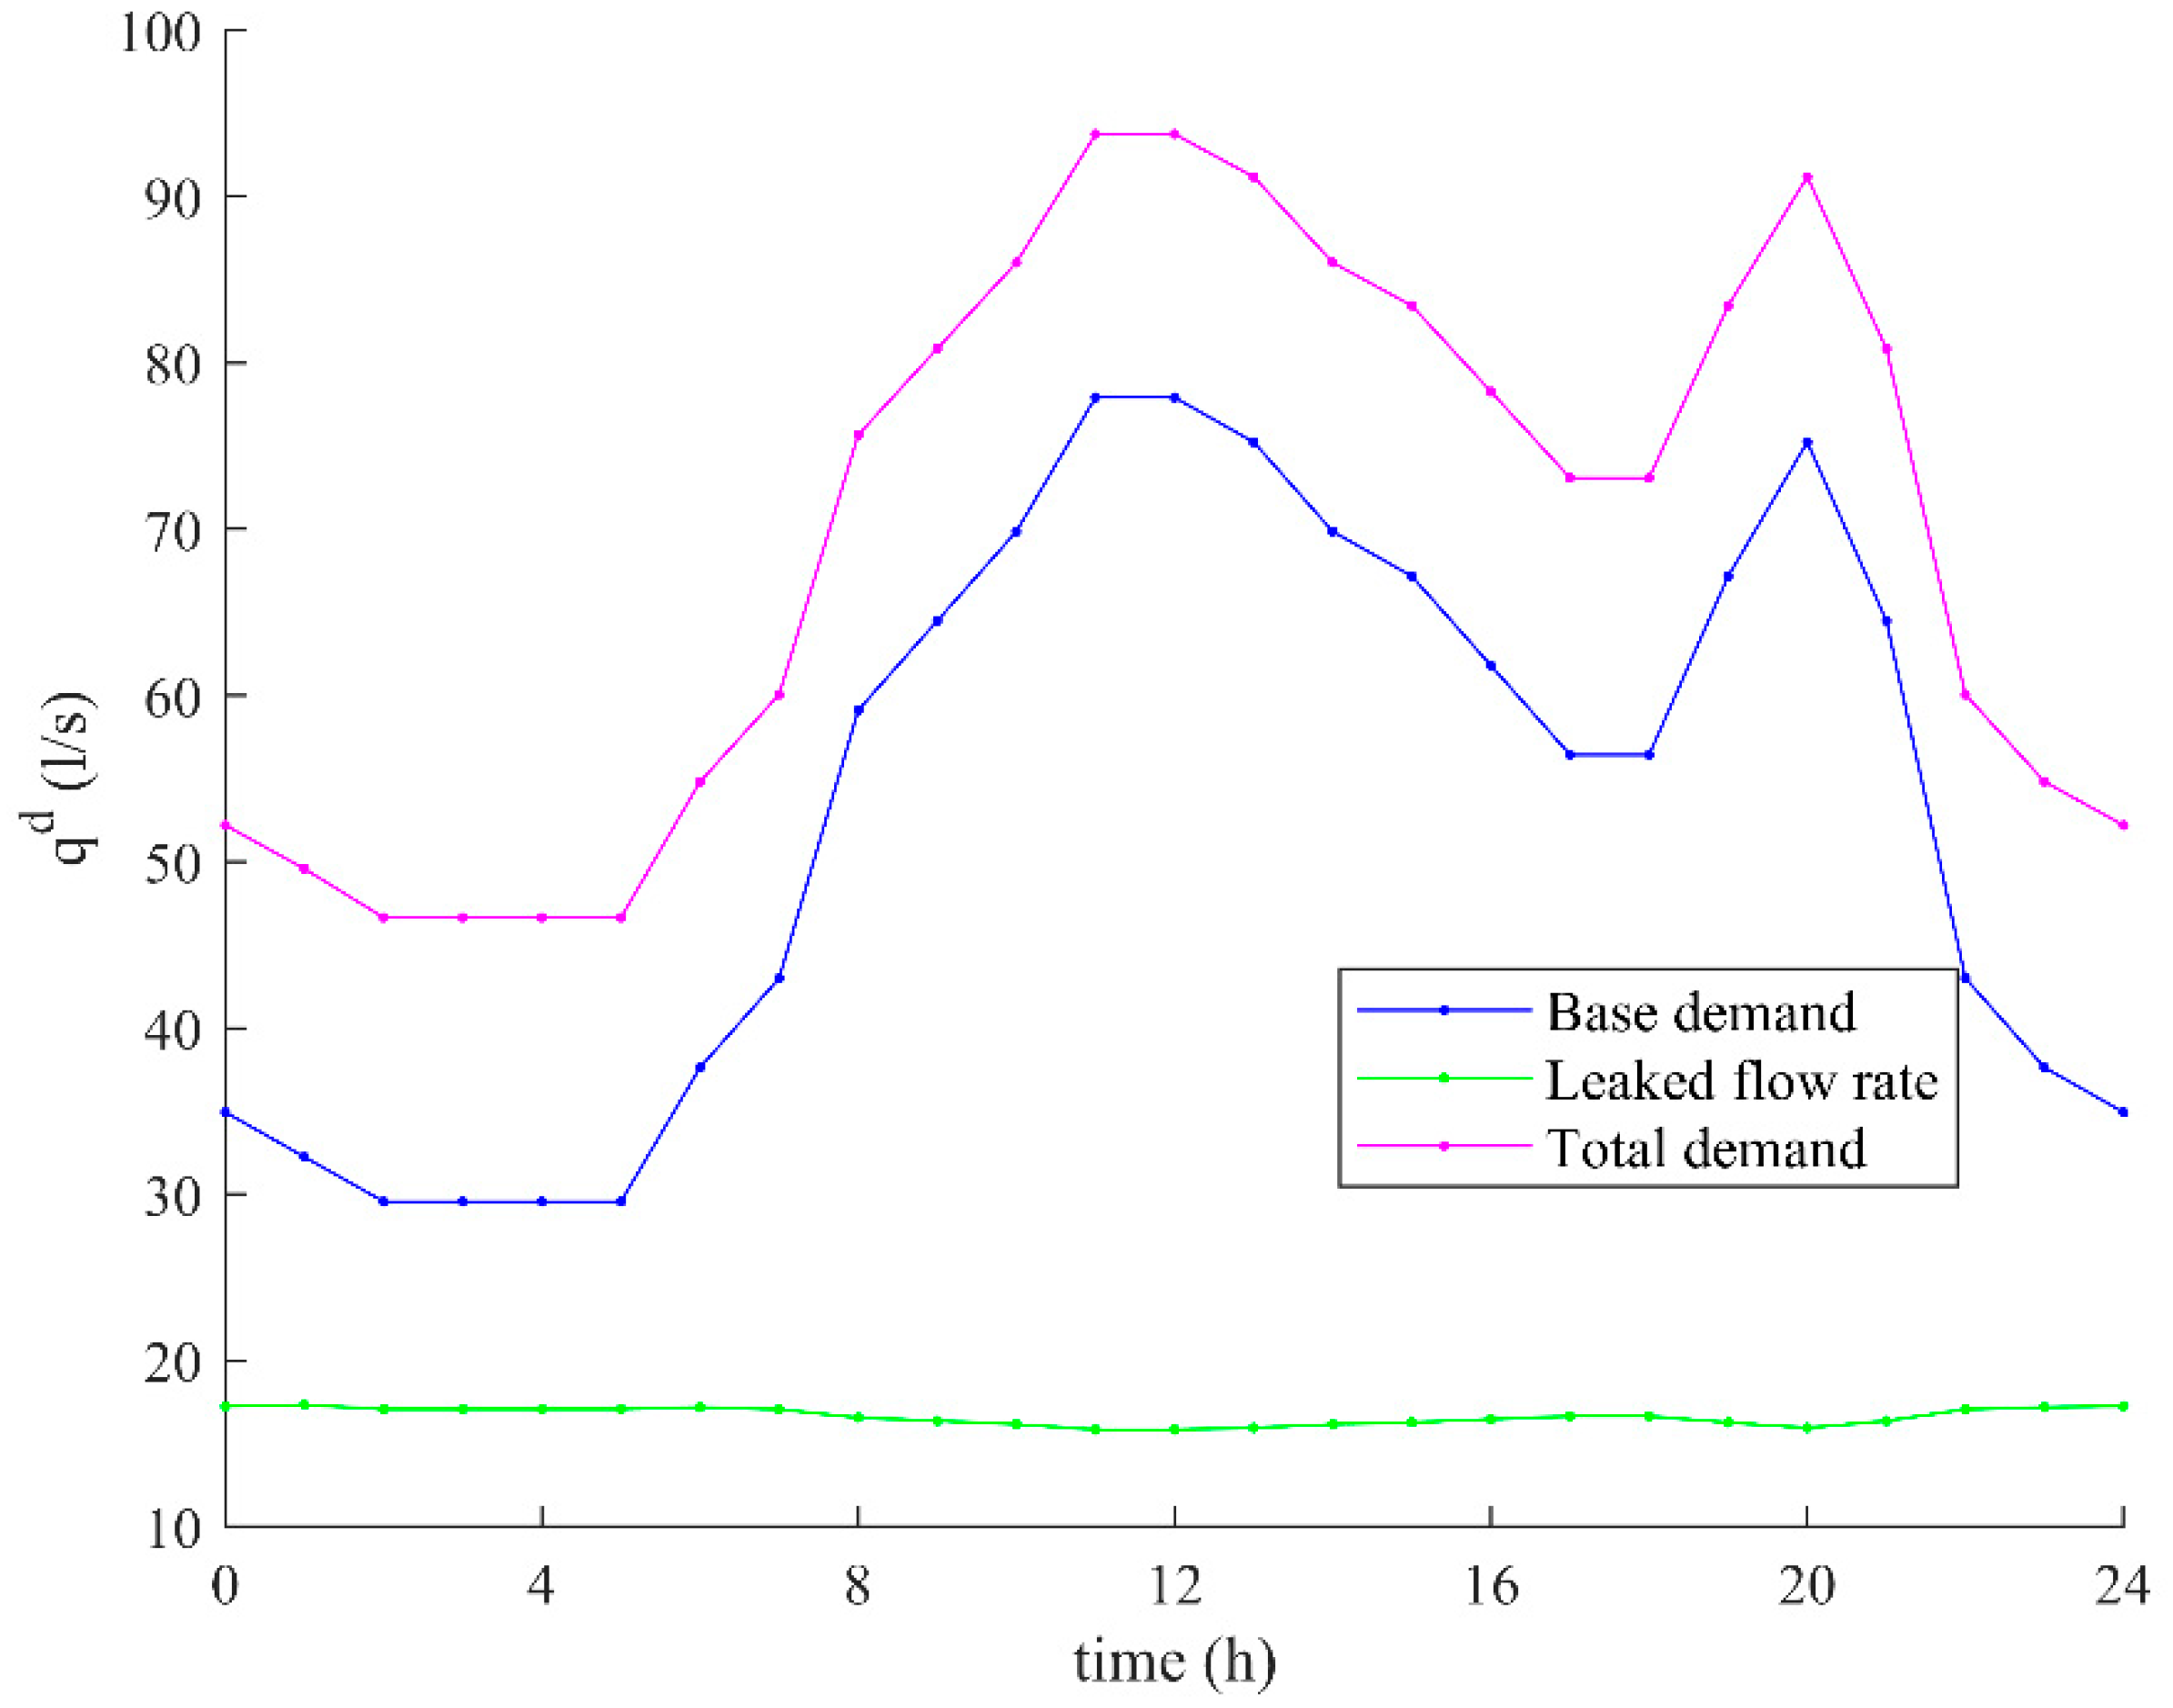
As already clarified, the simulation of DT implementation was performed by an optimization procedure, with the aim of investigating the improvements in terms of leakages and water consumption in the whole network. The behavior of the network is analyzed, without and with DT implementation, in order to understand the changes in the demand and water consumption, as well as the ability of DT in detecting anomalies and helping to solve them.
Figure 6 shows the daily network demand and refers to the scenario without DT implementation. The blue line represents the demand pattern without leakage, whereas the green line represents the trend of the leaked flow rate. Finally, the violet line represents the sum of the aforesaid flow rates, thus the total flow rate demanded in presence of leakages. The total amount of water consumed during a day (in absence of leakages) is 4769 m
3 per day, corresponding to an average flow rate of 55.2 l/s. The total amount of requested water is 6267 m
3 per day, which implies that around 1498 m
3 of water is lost per day, which corresponds to an increase in demand of around 24%.
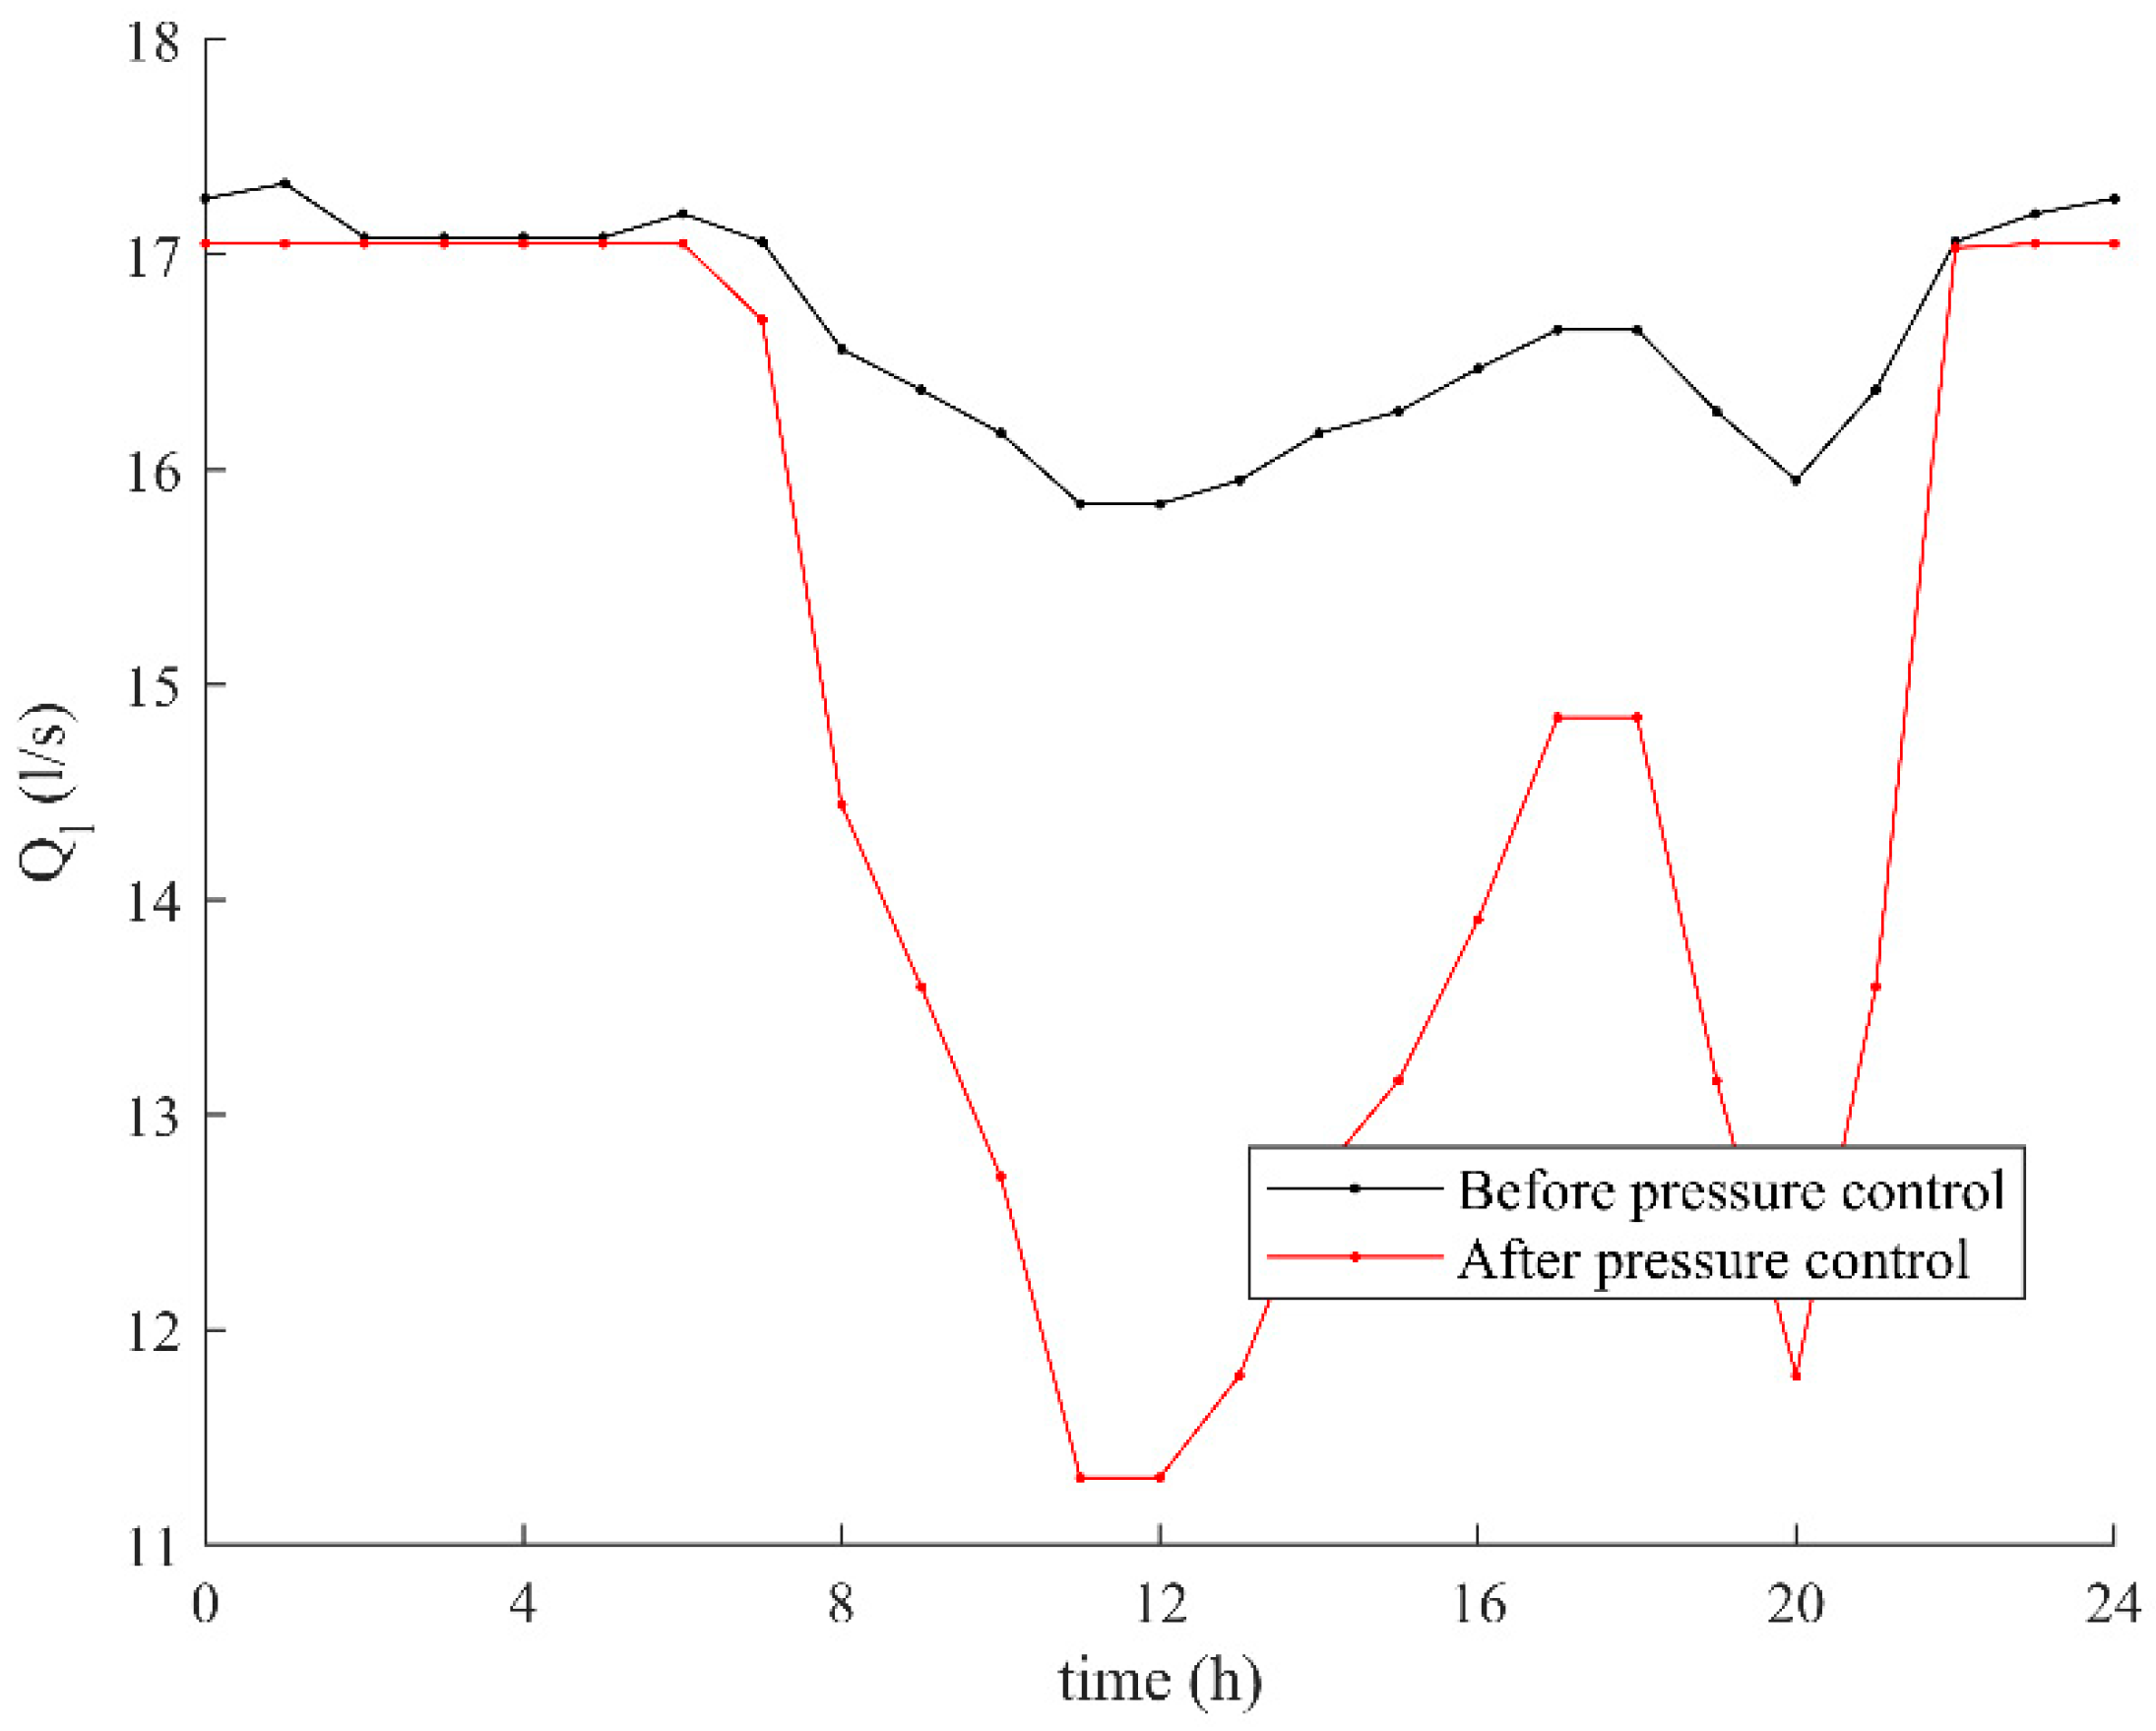
Figure 7 shows the daily trend of leaked flow rate before valve operation (black curve) and after performing the pressure control strategy (red line). The pressure control stragy allows to decrease the leaked volume from 1498 m
3 per day to 1272 m
3 per day. As a result, the total volume of saved water amounts to 226 m
3 per day, which means that the total leaked flow rate is decreased by 15%.
5.2. Analysis of Pressure Control
Pressure is one of the main parameters in hydraulic networks. As already underlined, a pressure control strategy allows to guarantee a correct service to the consumers and the maximum energy efficiency of the hydraulic system. Monitoring and controlling the pressure of the water is one of the main purposes of DT implementation in a WDN.
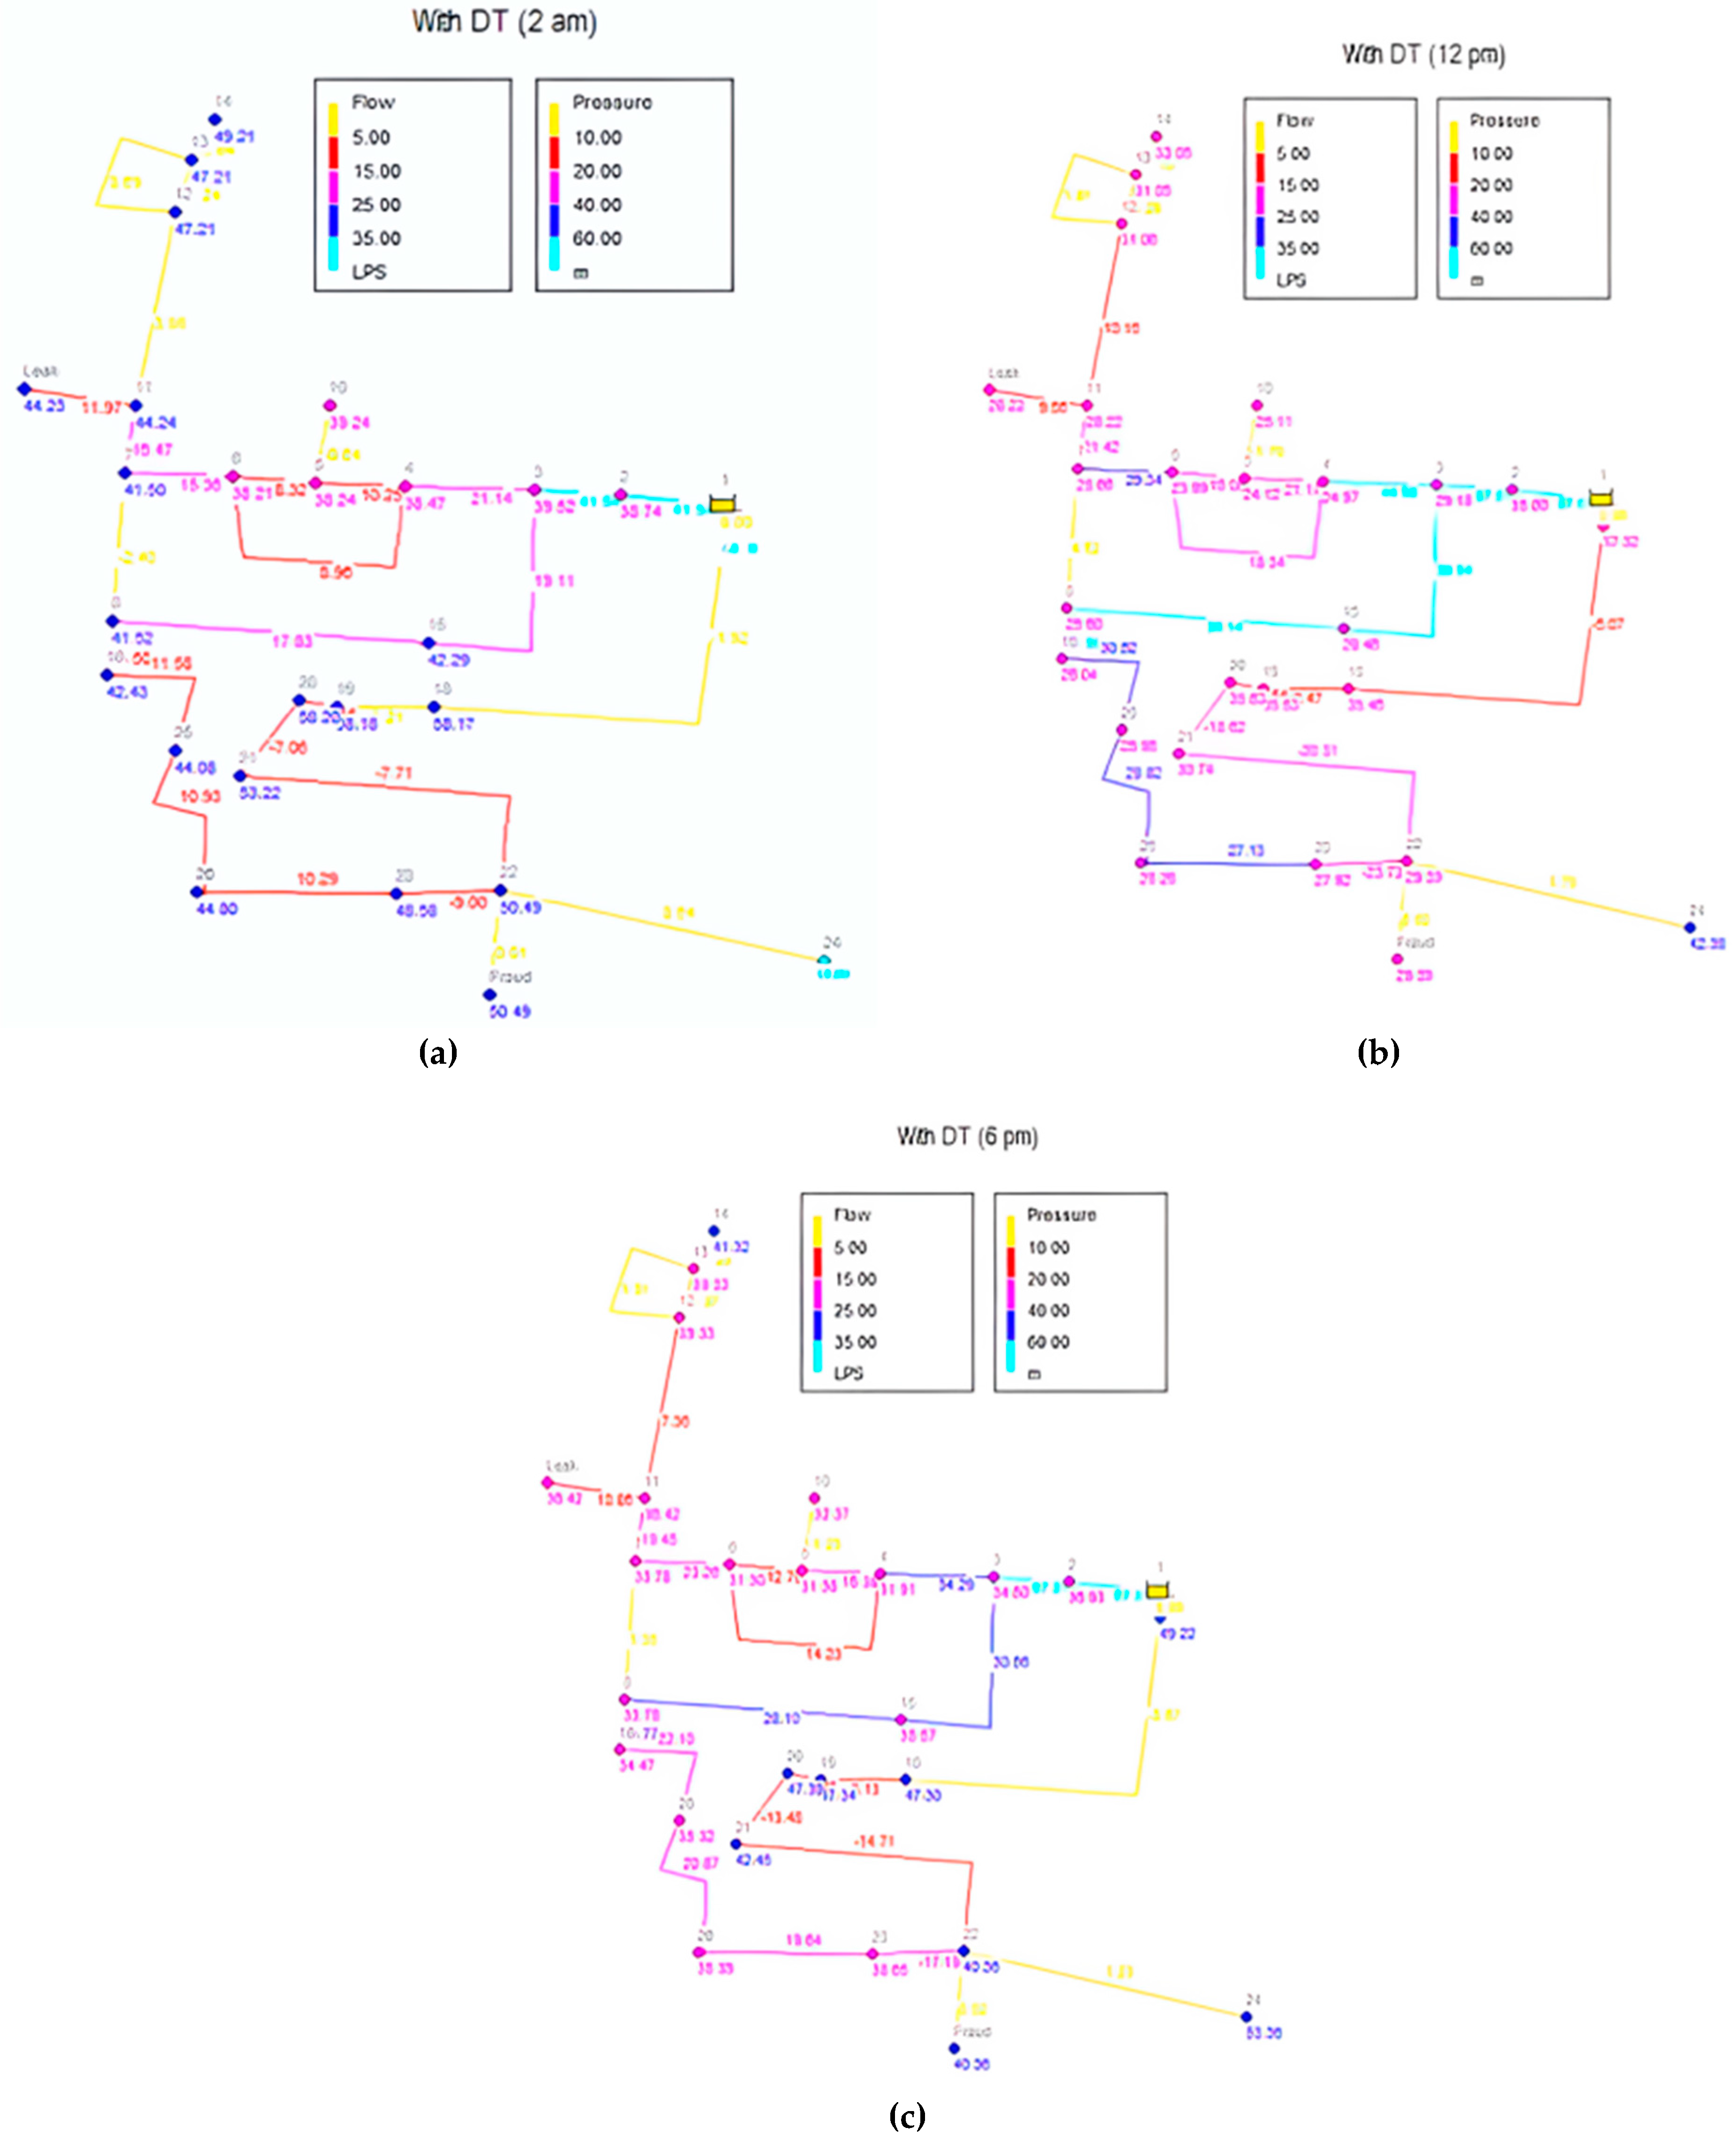
Figure 8 shows the pressure distribution within the network at different hours. According to
Figure 8, at different hours of the day the pressure is always smaller than the allowable maximum, set as 60 m.
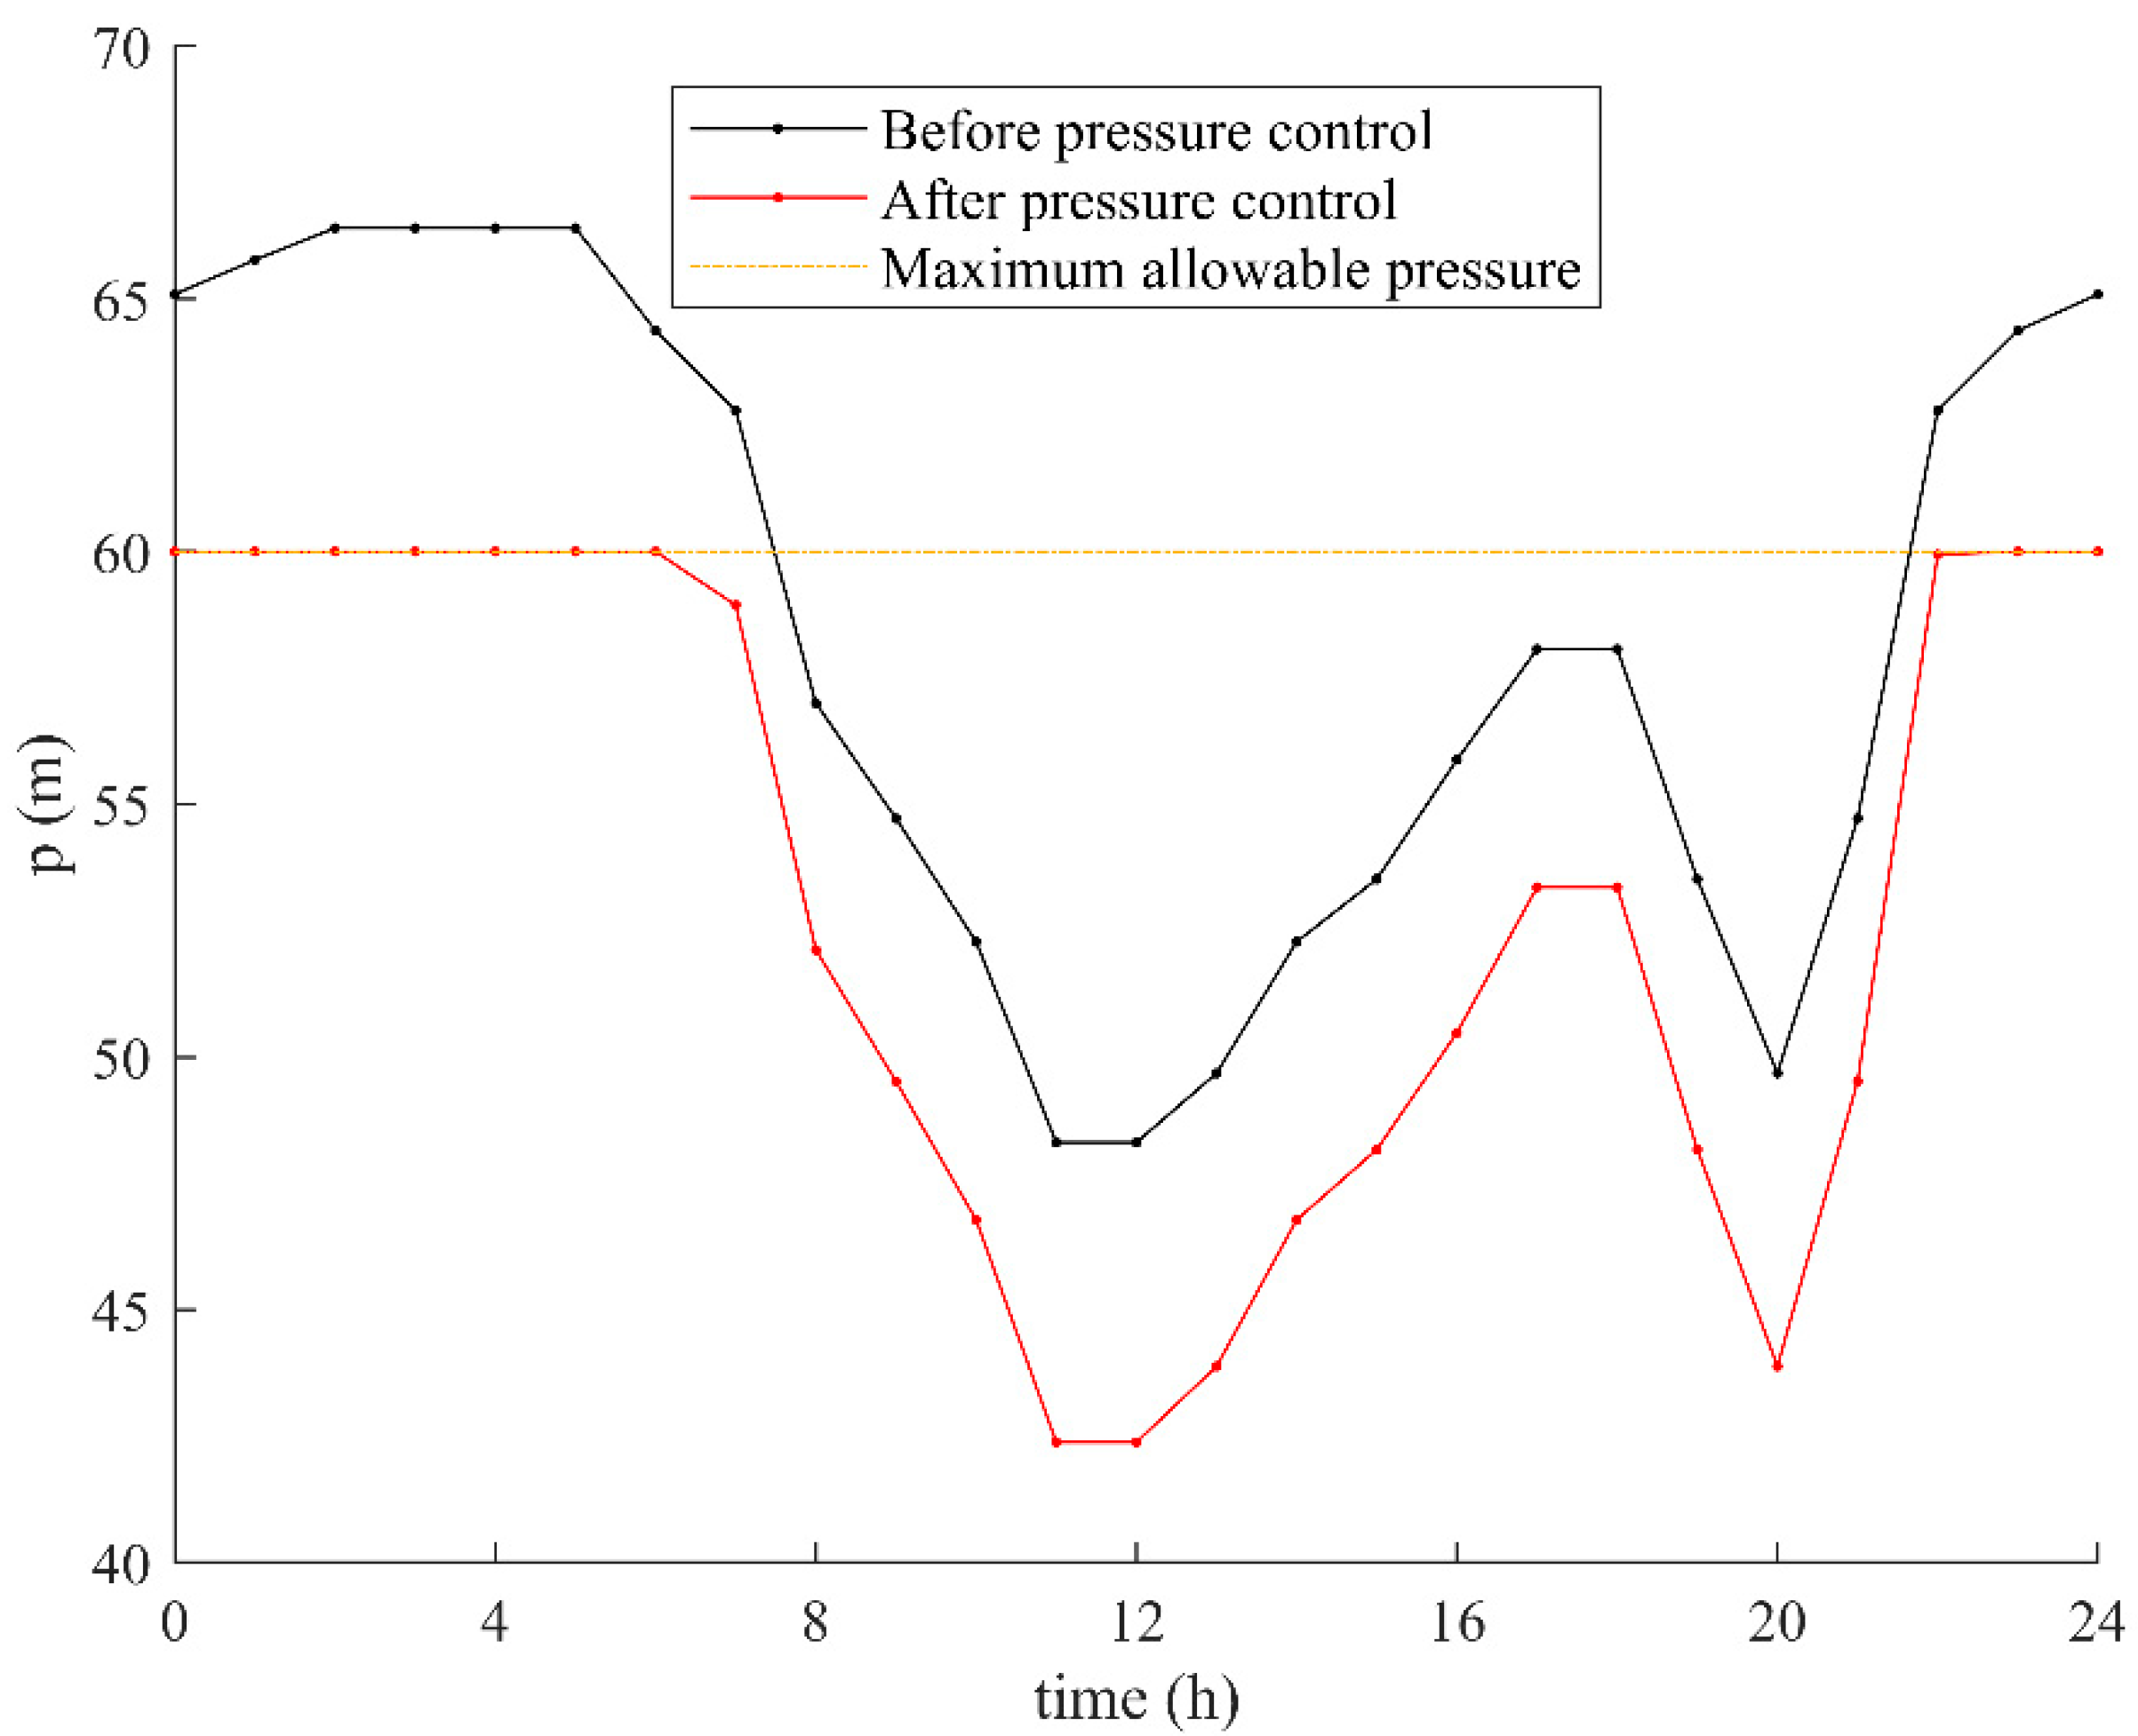
Pressure trend along the day is presented in
Figure 9 with reference to the most critical node of the network (i.e., node 24). According to
Figure 9, the black line represents the pressure trend before pressure control strategy, whereas the red line is the pressure trend once the pressure is kept below the maximum value of 60 m by means of valve settings.
With such a strategic model the operators are able to simulate the real-time decisions, as well as to analyze the system behavior at any past time and also program the actions to be carried out in the near future. In this way, such a cyclical system, relying on constant updates of pressure values, allows one to control and reduce losses, increasing the overall system efficiency.
6. Conclusions
In this paper, the benefits of applying digital twin technology in a water distribution system is investigated through the digital transition to be implemented in WDNs. A real case study was used to investigate the characteristics of smart water management and, in particular, the effects of applying DT technology in the field of hydraulic networks. As case study, a District Metered Area of Lisbon water drinking systems was chosen.
The real-time monitoring of Digital Twin, on account of the incorporation of smart sensors, GIS, and SCADA tools, results in fast loss or burst detection and repair, allowing to achieve significant water savings. This results is enormous advantages, such as reduced water losses and operational costs, as well as contained social and environmental impacts.
In this study, a DT implementation has been simulated by performing an optimization procedure, searching for optimal valve regulations in order to minimize the water leakage within the analyzed network. The need for optimization arises as soon as the leakage is detected and a strategy to contain the amount of leaked water is required. Once the leakage is detected, the search for the optimal settings, as well as the intervention can require a few hours. According to these results, the total leaked volume decreases from 1498 m3 per day to 1272 m3 per day with a resulting saving of 15%.
As highlighted in this study, the potential benefit of Digital Twin in the water sector towards digital transition and system efficiency improvement are significant, directly impacting on water economy, improving customer experience, and ensuring better maintenance and environmental protection. DT technology also allows for the consumption prediction during peak demands, providing a better management of pressure and flow, and significantly enhancing the system reliability and the operation flexibility. Moreover, it is worth underlining that DT results in reduced costs for maintenance, energy operations, and for unexpected water main breaks.
In conclusion, the increased water efficiency resulting from loss (leakages and frauds) control represents a positive economic impact on both water-energy nexus and systems reliability.


 ,
, 


