Article

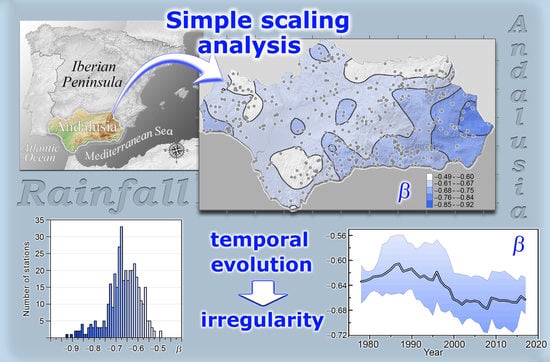
A Simple Scaling Analysis of Rainfall in Andalusia (Spain) under Different Precipitation Regimes

by
María del Carmen Casas-Castillo
1,*,
Raül Rodríguez-Solà
2,
Alba Llabrés-Brustenga
3,
Amanda Penélope García-Marín
4,
Javier Estévez
4 and
Xavier Navarro
5
1
Department of Physics, ESEIAAT, Universitat Politècnica de Catalunya·BarcelonaTech, Colom 1, 08222 Terrassa, Spain
2
Department of Physics, ETSEIB, Universitat Politècnica de Catalunya-BarcelonaTech, Diagonal 647, 08028 Barcelona, Spain
3
Barcelona Supercomputing Center, Jordi Girona 29-31, 08034 Barcelona, Spain
4
Engineering Projects Area, Campus Rabanales, Universidad de Córdoba, Nacional IV km 396, 14071 Córdoba, Spain
5
Department of Physics, EPSEVG, Universitat Politècnica de Catalunya-BarcelonaTech, Víctor Balaguer s/n, 08800 Vilanova i la Geltrú, Spain
*
Author to whom correspondence should be addressed.
Water 2022, 14(8), 1303; https://doi.org/10.3390/w14081303
Submission received: 20 February 2022 / Revised: 13 April 2022 / Accepted: 14 April 2022 / Published: 16 April 2022

Abstract

:
A simple scaling analysis was performed in Andalusia (Spain) using daily records from 377 selected stations covering the temporal period between 1870 and 2018. Since Andalusia is a region of considerable climatic variety, with notably wet areas as well as extremely dry zones, this study is useful to investigate the relationship between the simple scaling parameter value and the characteristic rainfall regime of a place. Despite the great correspondence with the average annual precipitation (PRCPTOT), a clear dependence on rainfall irregularity was observed, revealed by the ratio of the maximum daily precipitation and PRCPTOT, as well the wet spells frequency index CWD. The spatial distribution of the simple scaling parameter captured the increasing influence of the Mediterranean Sea towards the East. The easternmost dry areas are clearly influenced by Mediterranean disturbances, with a high proportion of convective rainfall and an irregular rainfall pattern. Using a simple scaling parameter, the generalized equations of the intensity-duration-frequency (IDF) curves, of great hydrological interest were calculated for the eight Andalusian provincial capitals. Moreover, the temporal trends of this parameter in the four past decades were studied in the different areas with the aim of determining if changes in their rainfall patterns due to global warming could be detected.

Graphical Abstract

1. Introduction

Rainfall is one of the most studied hydrometeorological variables because of its intrinsic variability in time and space, with the succession of dry and rainy periods leading to water runoff and drought with adverse environmental and social consequences [1,2]. It is the result of complex atmospheric processes that vary around the world and determine different rainfall regimes according to climate conditions. In that sense, an area can be classified depending on the amount of precipitation it receives, from rainy equatorial areas that receive more than 2000 mm of annual precipitation to deserts that accumulate less than 100 mm. Semi-arid and humid regions are between these extremes, recording less and more than 700 mm of precipitation, respectively [3].
The invariance of properties in any process over a range of scales is called scaling. Scaling systems can be described by fractal and multifractal theories, the latter being an evolution of the former. Fractal theory [4] deals with simple scaling, and can describe complex phenomena using few parameters. Rainfall can be described by stochastic constructions based on scaling, such as a fractal-type model that can explain the strong scale dependence of the rain rate [5].
The natural rain generation process is usually considered a fractal type due to the statistical self-similarity shown by rainfall, i.e., it looks the same regardless of the scale, and its properties can be described using probability distributions that exhibit scale relationships [6,7,8,9]. For instance, annual maximum rainfall intensity is commonly known to satisfy simple scaling relationships [10,11,12,13] for which a single scaling parameter is needed. In this work the simple scaling parameter will be referred to as β .
The value of the simple scaling parameter β was shown to be related to the rainfall regime of the place [12,14,15,16,17], generally in concordance with total pluviosity but also with rainfall irregularity and the proportion of convective rainfall. Examples that can be found in the literature have values of β = −0.65 and β = −0.76 obtained from daily rainfall, the first for the mid-latitude temperate city of Melbourne (Australia) with rainfall all through the year, and the second for the semi-arid city of Bela-Bela (South Africa, named Warmbaths until 2002) [12], or the values around −0.75 found in Slovakia [18]. From daily rainfall, a general agreement between the spatial distributions of β and the mean annual rainfall was obtained in Spain [15], with values ranging from −0.55 and −0.66 in rainy areas, and lower values between −0.84 and −0.92, for drier areas where the contribution of convective rainfall is higher and torrential episodes are common. In accordance with these results, a good correspondence between β and the mean annual rainfall in Catalonia (Spain) was found [17], as well as a correlation of this parameter with latitude throughout the territory ( β increasing to the north), with altitude ( β increasing with height), and with the distance to the Mediterranean coastline ( β increasing with distance).
In addition to this role as a simple descriptor of the rainfall pattern characteristics, the main practical application of the scaling parameter is temporal downscaling; for instance, to estimate sub-daily rainfall amounts when only daily data are available, in order to obtain suitable intensity-duration-frequency curves (IDF curves), of great hydrological interest [6,14,15]. It can also be useful to temporally downscale the precipitation forecasts from numerical weather prediction models, usually to a daily scale. In [19], simple scaling analysis was used to obtain hourly rainfall from daily projected rainfall series for the 21st century in Barcelona (Spain). In that work, a slightly lower scaling parameter was found for future series compared to that for historical series, implying a greater increase of the expected extreme rainfall in Barcelona for shorter durations than for daily periods.
One of the effects of global warming and the consequent hypothetical intensification of the hydrologic cycle [20,21] might be a change in the frequency and intensity of precipitation extremes. The Intergovernmental Panel on Climate Change [22] stated that the proportion of heavy rainfalls on total precipitation, as well as the frequency of heavy rainfall episodes, are likely to increase in the 21st century in many areas of the planet. In some areas, an increase in heavy precipitation is also expected despite possible decreases in total rainfall [23]. This is the case for the Mediterranean area, and particularly the Iberian Peninsula, where a significant decrease in annual precipitation in the last decades has been reported [24] while the occurrence of extreme rainfall events seems to be increasing. This expected relative increase in extreme rainfall means a general change of the rainfall pattern, and should be detected when a scaling analysis is performed. In that sense, a slight temporal decreasing trend of the mean value of the simple scaling parameter β was obtained for Catalonia (Spain) [17] in the northwest of the Iberian Peninsula, during most of the past century and the early 21st century. For monthly series from this same region, a temporal increasing trend of rainfall irregularity was observed by the study of several parameters, β among them, which might be associated with the remarkable increase and evolution of CO2 emissions into the atmosphere [25]. Temporal drifts towards different values of the scaling parameter β may indicate changes in precipitation patterns, an important issue nowadays when notable efforts are being made to detect possible consequences of climate change.
In the present work, daily rainfall data from 377 high-quality stations of Andalusia (Spain) for more than a century of measurements (1870–2018) were used to perform a scaling analysis. Andalusia being a region of considerable climatic variety with notably wet areas as well as extremely dry zones, this study is useful to investigate the relationship between the simple scaling parameter β value and the characteristic rainfall regime of its different areas.

2. Materials and Methods

Andalusia is a region of almost 90,000 km2 with high interannual variability in rainfall and located in the south of the Iberian Peninsula. It is characterized by a Mediterranean climate with a continental character in the inland areas and a more typical Mediterranean climate in the coastal ones. The rain is concentrated in the coldest months, between October and April, because of the flow of moist air from the Atlantic with rain fronts, and it is inappreciable during the summer period [26]. Convective storms are concentrated in the late summer and early autumn and are especially representative in eastern areas such as Almeria, which is also one of the most arid regions.
Daily rainfall data from 1947 stations of three networks (Spanish Meteorological Agency (AEMET), Agroclimatic Information Network of Andalusia (RIA) and Phytosanitary Information Alert Network (RAIF)) operating in Andalusia (southern Iberian Peninsula, see Figure 1) were available. The dataset had an average number of 8157 daily observations per station (with a minimum of 6 days and a maximum of 45,798 days) and a total of 15,857,892 measurements. The first available observation was taken in 1870 at the San Fernando station (Cádiz). Other stations with old data were Jaén-Instituto, which started to operate in 1901, Granada (Cartuja) and Granada-Universidad, both started in 1902, and Huelva and Sanlúcar de Barrameda, in 1903. The station of Grazalema (Cádiz) is worthy of mention since its series began in 1912 with a completeness of 98.9%. A three-stage quality control procedure (e.g., [27]) was applied with the objective of selecting series with the best quality.
In the present work, a compromise between the spatial density of stations considered in the study area and the temporal length of each of the measurement points was sought. For this reason, a total of 377 stations with a minimum of 20 years, each of them fulfilling the high-quality criteria required [27], were selected. A multiplicative correction factor was applied to data to correct rainfall amounts obtained from measurements taken at fixed times as if they had been obtained from a sliding window of the considered duration [28,29,30,31,32,33].
The scaling relationships known to be satisfied by annual maximum rainfall intensity has a statistical nature. The probability distribution of the annual maximum intensity for a duration t , I t , and the distribution for another duration t 0 = λ t , I λ t , can be related by a factor that is a power function of the scale parameter λ , as in Equation (1):
I t = d i s t λ K ( q ) I λ t
where K ( q ) is a scaling function [3,6,7,8,9]. In the monofractal or simple scaling case, this function is linear (non-linear for multifractals) [11,12,13] and can be written as β q , β being the scaling parameter to which we have been referring in the previous section. The symbol = d i s t of Equation (1) is used to indicate the probabilistic equality between the two distributions on both sides of the equation [9,13]. The statistical moments of both distributions, as well as their quantiles and the rest of statistical characteristics, satisfy this equality. In terms of the order- q statistical moments of rainfall intensity for a duration t , I t q , the simple scaling relationship can be written as Equation (2):
I t q = λ β q I λ t q
To determine   β from daily data, the order- q statistical moments of maximum annual series for 2, 3, 4… days obtained by aggregation from daily series must be calculated, then a linear regression between the logarithmic values of these moments and the logarithm of the duration t provides straight lines with a slope of value β q , evidencing scale invariance.
By definition, the values of β have to be higher than the limit value of 1 , which corresponds to an isolated intensity peak among the sample; for instance, a maximum daily value P 1 surrounded by dry days. In this case, the aggregated series for n days presents the same precipitation amount, and the intensity would be I n = I 1 / n , giving a value of β = 1 when compared with Equation (2) for q = 1 (mean value), which is I n = n β I 1 . The hypothetical opposite case would be a regular sample with the same precipitation amount every day (always raining) and the same intensity for all the aggregated durations, giving a value of β = 0 . For real daily rainfall samples, the scaling parameter ranges from a value close to β = 0.5 to the limit value of β = 1 . For longer durations, such as monthly series, the coarser aggregation leads to more regular samples than daily aggregates and higher values of the parameter β are obtained [25]. For a specific duration, the value of the scaling parameter can be related to regularity in the rainfall series, its value being expected to be higher in rainy areas where the rainfall regime is usually regular, and lower in the irregular ones, being the closest values to 1 in correspondence to areas with very irregular rainfall; usually dry areas which eventually present sudden isolated rainfall peaks.
The value of the simple scaling parameter β was determined for the 377 selected stations of Andalusia. First, aggregated series with maximum annual rainfall amounts for 2, 3, 4… days were obtained from the daily series. Then, the order- q statistical moments of these series were calculated and linear regressions between the logarithmic values of these moments and the logarithm of the duration t were performed. The straight lines obtained indicate scale invariance, and their slopes, β q , allow determination of the value of the β parameter at every station. A kriging interpolation procedure can then be used to obtain the spatial distribution of β over Andalusia and compare it with the spatial distribution of its diverse climatological areas.
As an example of practical application of the temporal downscaling using simple scaling, the generalized equations of the IDF curves for the eight provincial capitals of Andalusia were calculated. The method used consists of writing Equation (2) in terms of the intensity I ( t ,   T ) for a duration t and a return period T from the specific intensity for the daily duration [15,17,18] using Equation (3):
I ( t ,   T ) = ( t 24 ) β I ( 24 ,   T )
In Equation (3) duration is expressed in hours, β is the scaling parameter, and the term I ( 24 ,   T ) can be found from the statistical analysis of the daily rainfall series.
The possible temporal evolution of the scaling parameter in Andalusia was also analyzed using sliding intervals of 30 years with a sliding step of one year. In the next section this evolution is shown for the mean value of β , and for specific very long series of the Andalusian dataset.

3. Results and Discussion

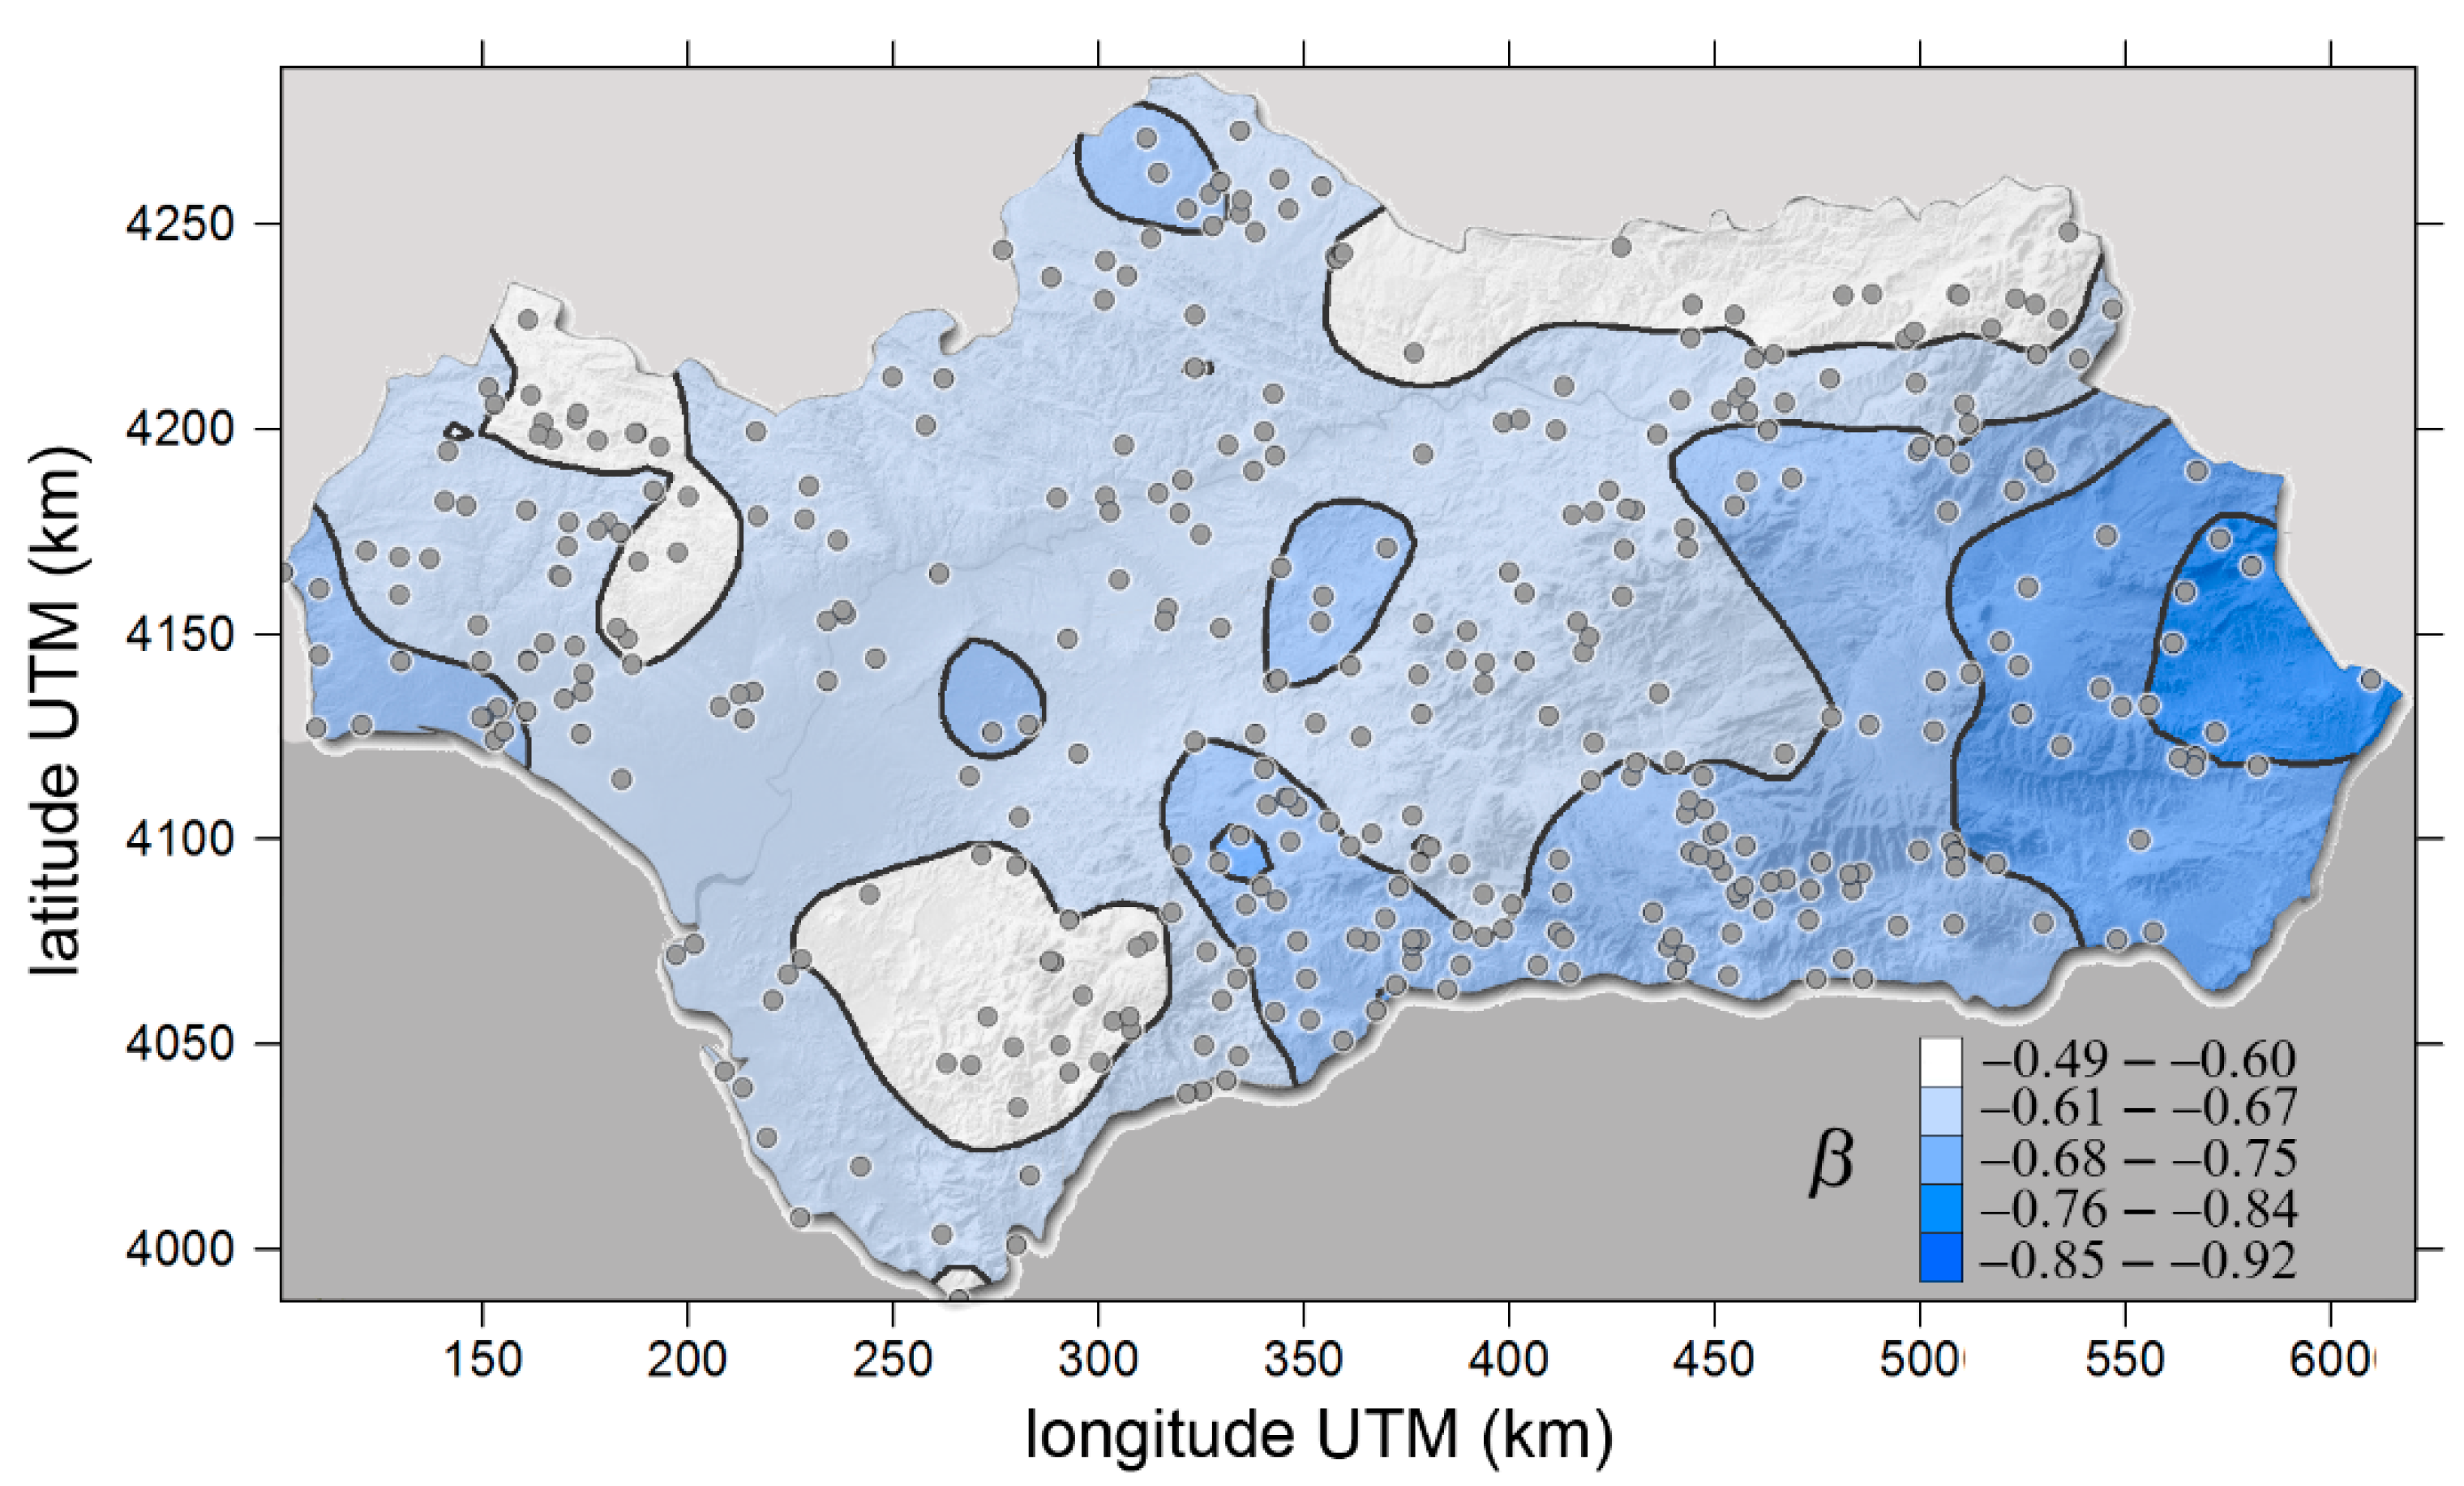
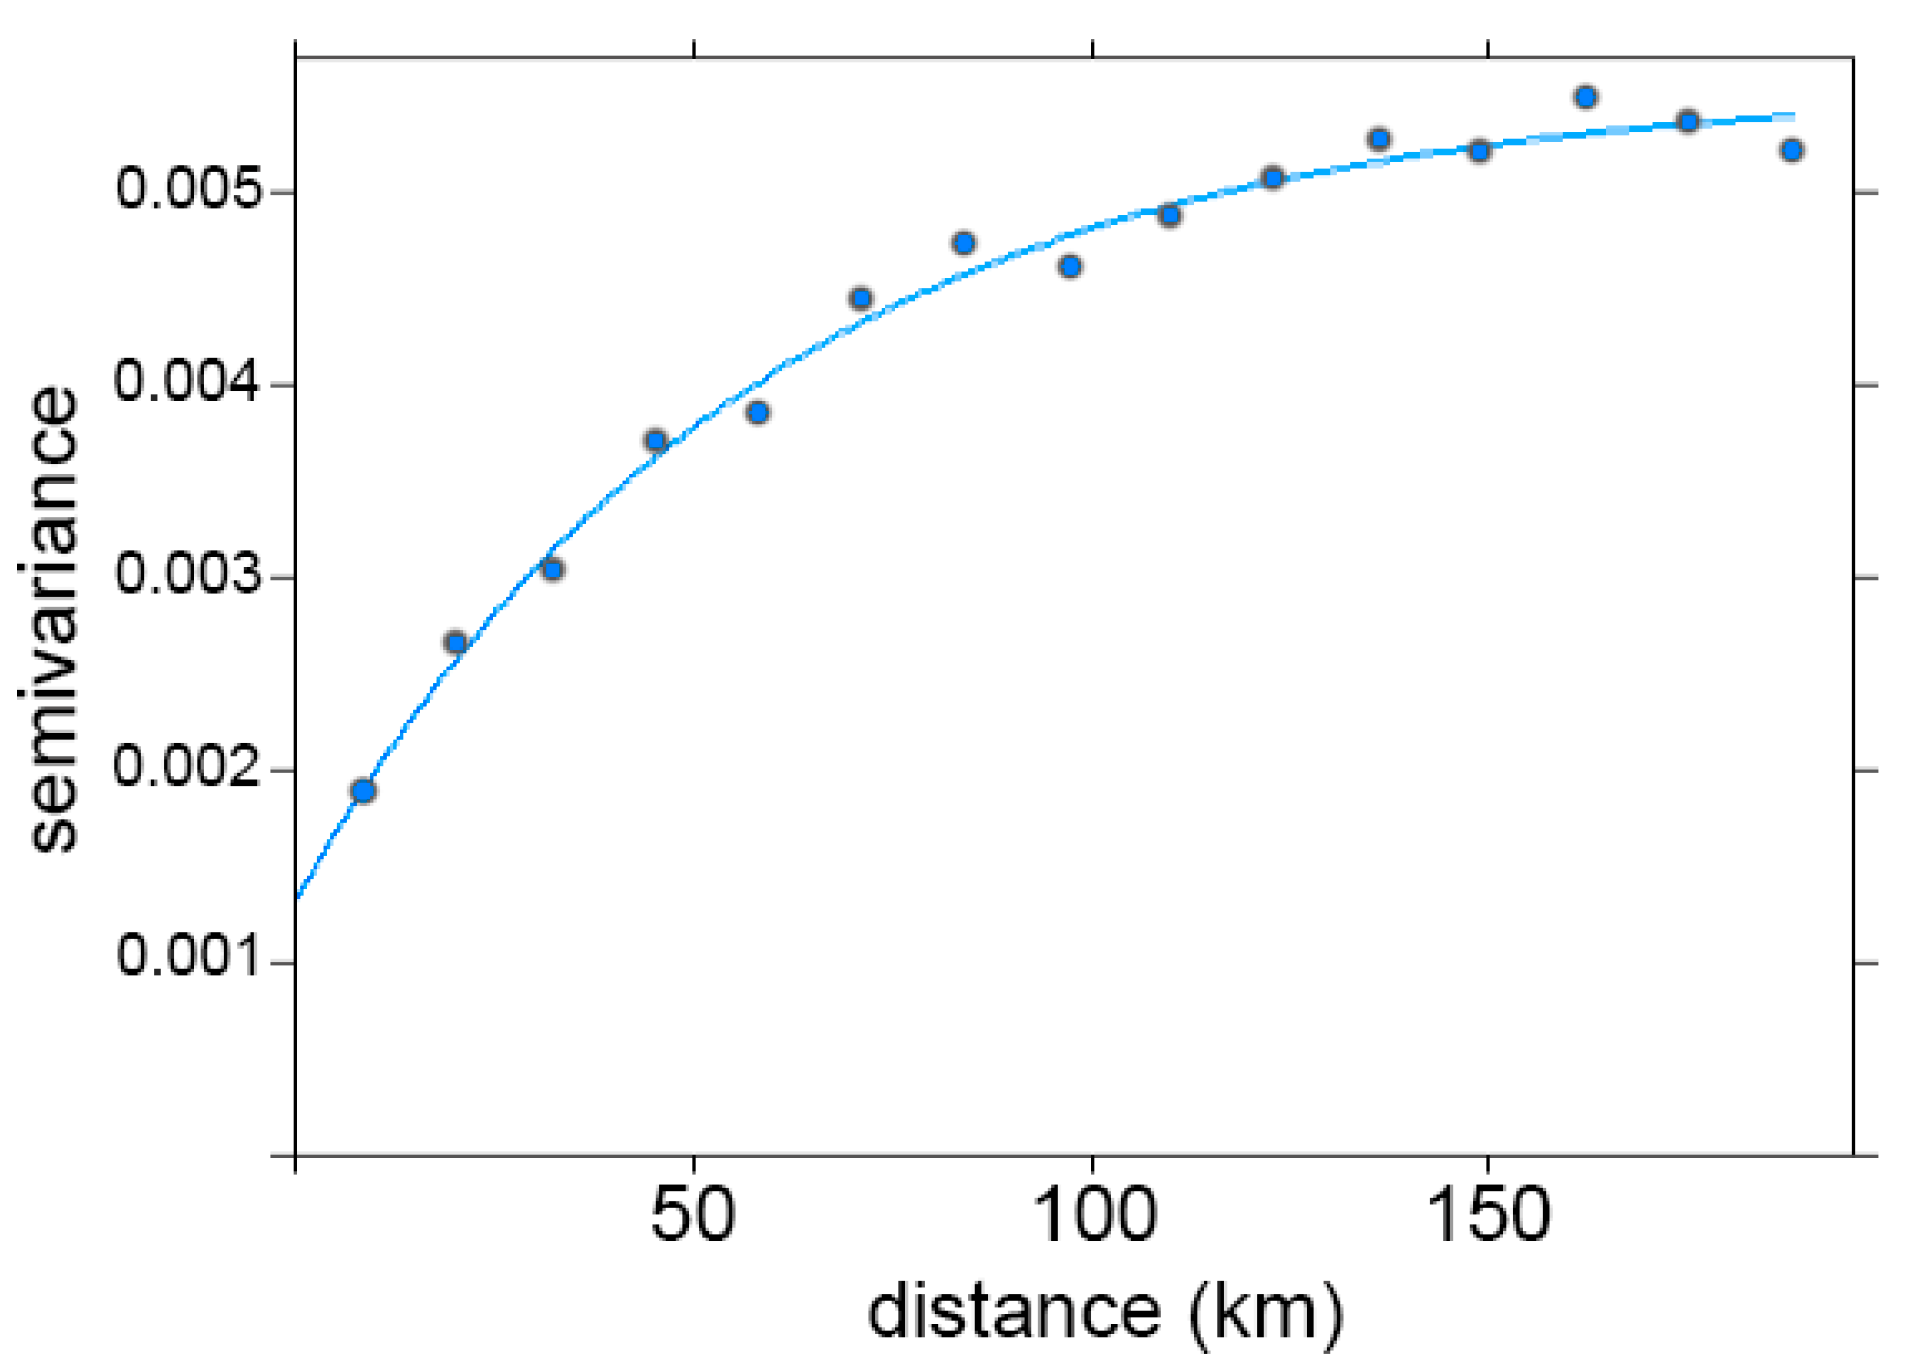
3.1. Spatial Distribution of the Scaling Parameter β

Figure 2 shows, as an example, the statistical moments of the rainfall intensity for different values of q calculated from the annual maximum rainfall series recorded at Grazalema, a location with a characteristic high pluviosity, and at the airport of Málaga. Straight lines evidencing scale invariance were fitted by linear regression over a temporal range from 1 to 15 days. Figure 3 shows the linear relationship between the scale function K ( q ) and the order-q moments for these two locations.
The values of β obtained for the 377 selected series range from 0.49 at the southern locality of Alcalá de los Gazules (Cádiz), to 0.92 at Pulpí (Almería), an extremely arid location. The whole set of empirical values shows high variability, with a mean value of 0.67 and a standard deviation of 0.07 . Figure 4 shows the histogram of the empirical set. Of all the steps in the determination process of β , the largest source of uncertainty occurs in the calculation of K ( q ) . The R-squared distribution for all the involved linear regressions presents a mean value of 0.997 with an interquartile range IQR of 0 .003 . As for the error associated with β , it can be estimated at ± 0.02 .
A certain spatial pattern can be observed in accordance with different geographical and climatological zones. A percentage of 88.6% of the values of β resulted above 0.75 , whereas the 11.4% lower are mostly located at the eastern part of the region (Figure 5), being lowest (under 0.85 ) at its most eastern end. At the other end of the range, there are two mountainous zones where the parameter has values higher than 0.60 : in the extremes east and west of Sierra Morena in the north, and in Sierra de Grazalema in the south, a mountain massif which forces the humid air masses from the Atlantic Ocean to lift, leading to intense amounts of precipitation. The values of β are in great concordance with pluviosity, as can be seen in Figure 6a where the mean annual rainfall (Total precipitation: PRCPTOT) is represented for every station. However, there is also a clear dependence with rainfall irregularity. The ratio between every annual maximum daily and its corresponding annual PRCPTOT is related to irregularity; high values mean that a single maximum amount contributes greatly to the total annual amount, while low values correspond to rainy places where the rainfall regime is more regular, and the daily maximum does not contribute as much to total annual rainfall, so there are often other secondary maxima with high amounts. Figure 6b represents dependence between β and the averaged value of this ratio in every station. Notice how in Figure 6b the maximum value of the scaling parameter, 0.92 , corresponds to a station (Pulpí) where this ratio is 0.2, i.e., the maximum daily amount contributes, on average, more than 20% to the annual rainfall amount in this station.
An analysis of the number of rain-free days (or other temporal scales) has been widely discussed [5] and it is relevant in Mediterranean zones where rainfall occurrence shows great variability [34]. In Figure 7 the parameter β is represented vs. two known rainfall indices: (a) the drought index CDD (Consecutive Dry Days) indicating the maximum number of dry days, and (b) the CWD (Consecutive Wet Days) index with the maximum number of consecutive wet days. While no dependence can be observed between the CDD index and the scaling parameter, Figure 7b shows a certain correlation (linear correlation coefficient of 0.52) between β and index CWD; an expected result since this index is specially linked to rainfall regularity. A correlation between the CDD index and the scaling parameter might be possibly found in very rainy regions. However, rain is very scarce in many Andalusian areas where two or three dry months per year are usual. Therefore, the index able to capture the differences in rainfall irregularity in this region is the wet spells length index CWD.
Figure 8 shows the spatial distribution of β over Andalusia after kriging interpolation through a wave exponential model to fit the variogram ([17], fitting detail in Figure 9). This spatial distribution captures the relationship between the scaling parameter and the diverse climatological areas, showing a large part of the territory with values between 0.61 and 0.67 , including the large triangular-shaped basin of the Guadalquivir River in the Baetic Depression. The rainy mountainous areas mentioned earlier, as well as the eastern part of the region characterised by an arid climate and an irregular rainfall regime, are also represented.
These results are aligned with others obtained for the entire Iberian Peninsula [15], with values of the β parameter lower than 0.77 in its eastern part; an eastern façade where Mediterranean depressions cause highly contrasting daily rainfall amounts and often very intense and torrential precipitation [35]. The most eastern zones of Andalusia, with values lower than 0.75 , are dry areas clearly influenced by Mediterranean disturbances, with a high proportion of convective precipitation and an irregular rainfall pattern.

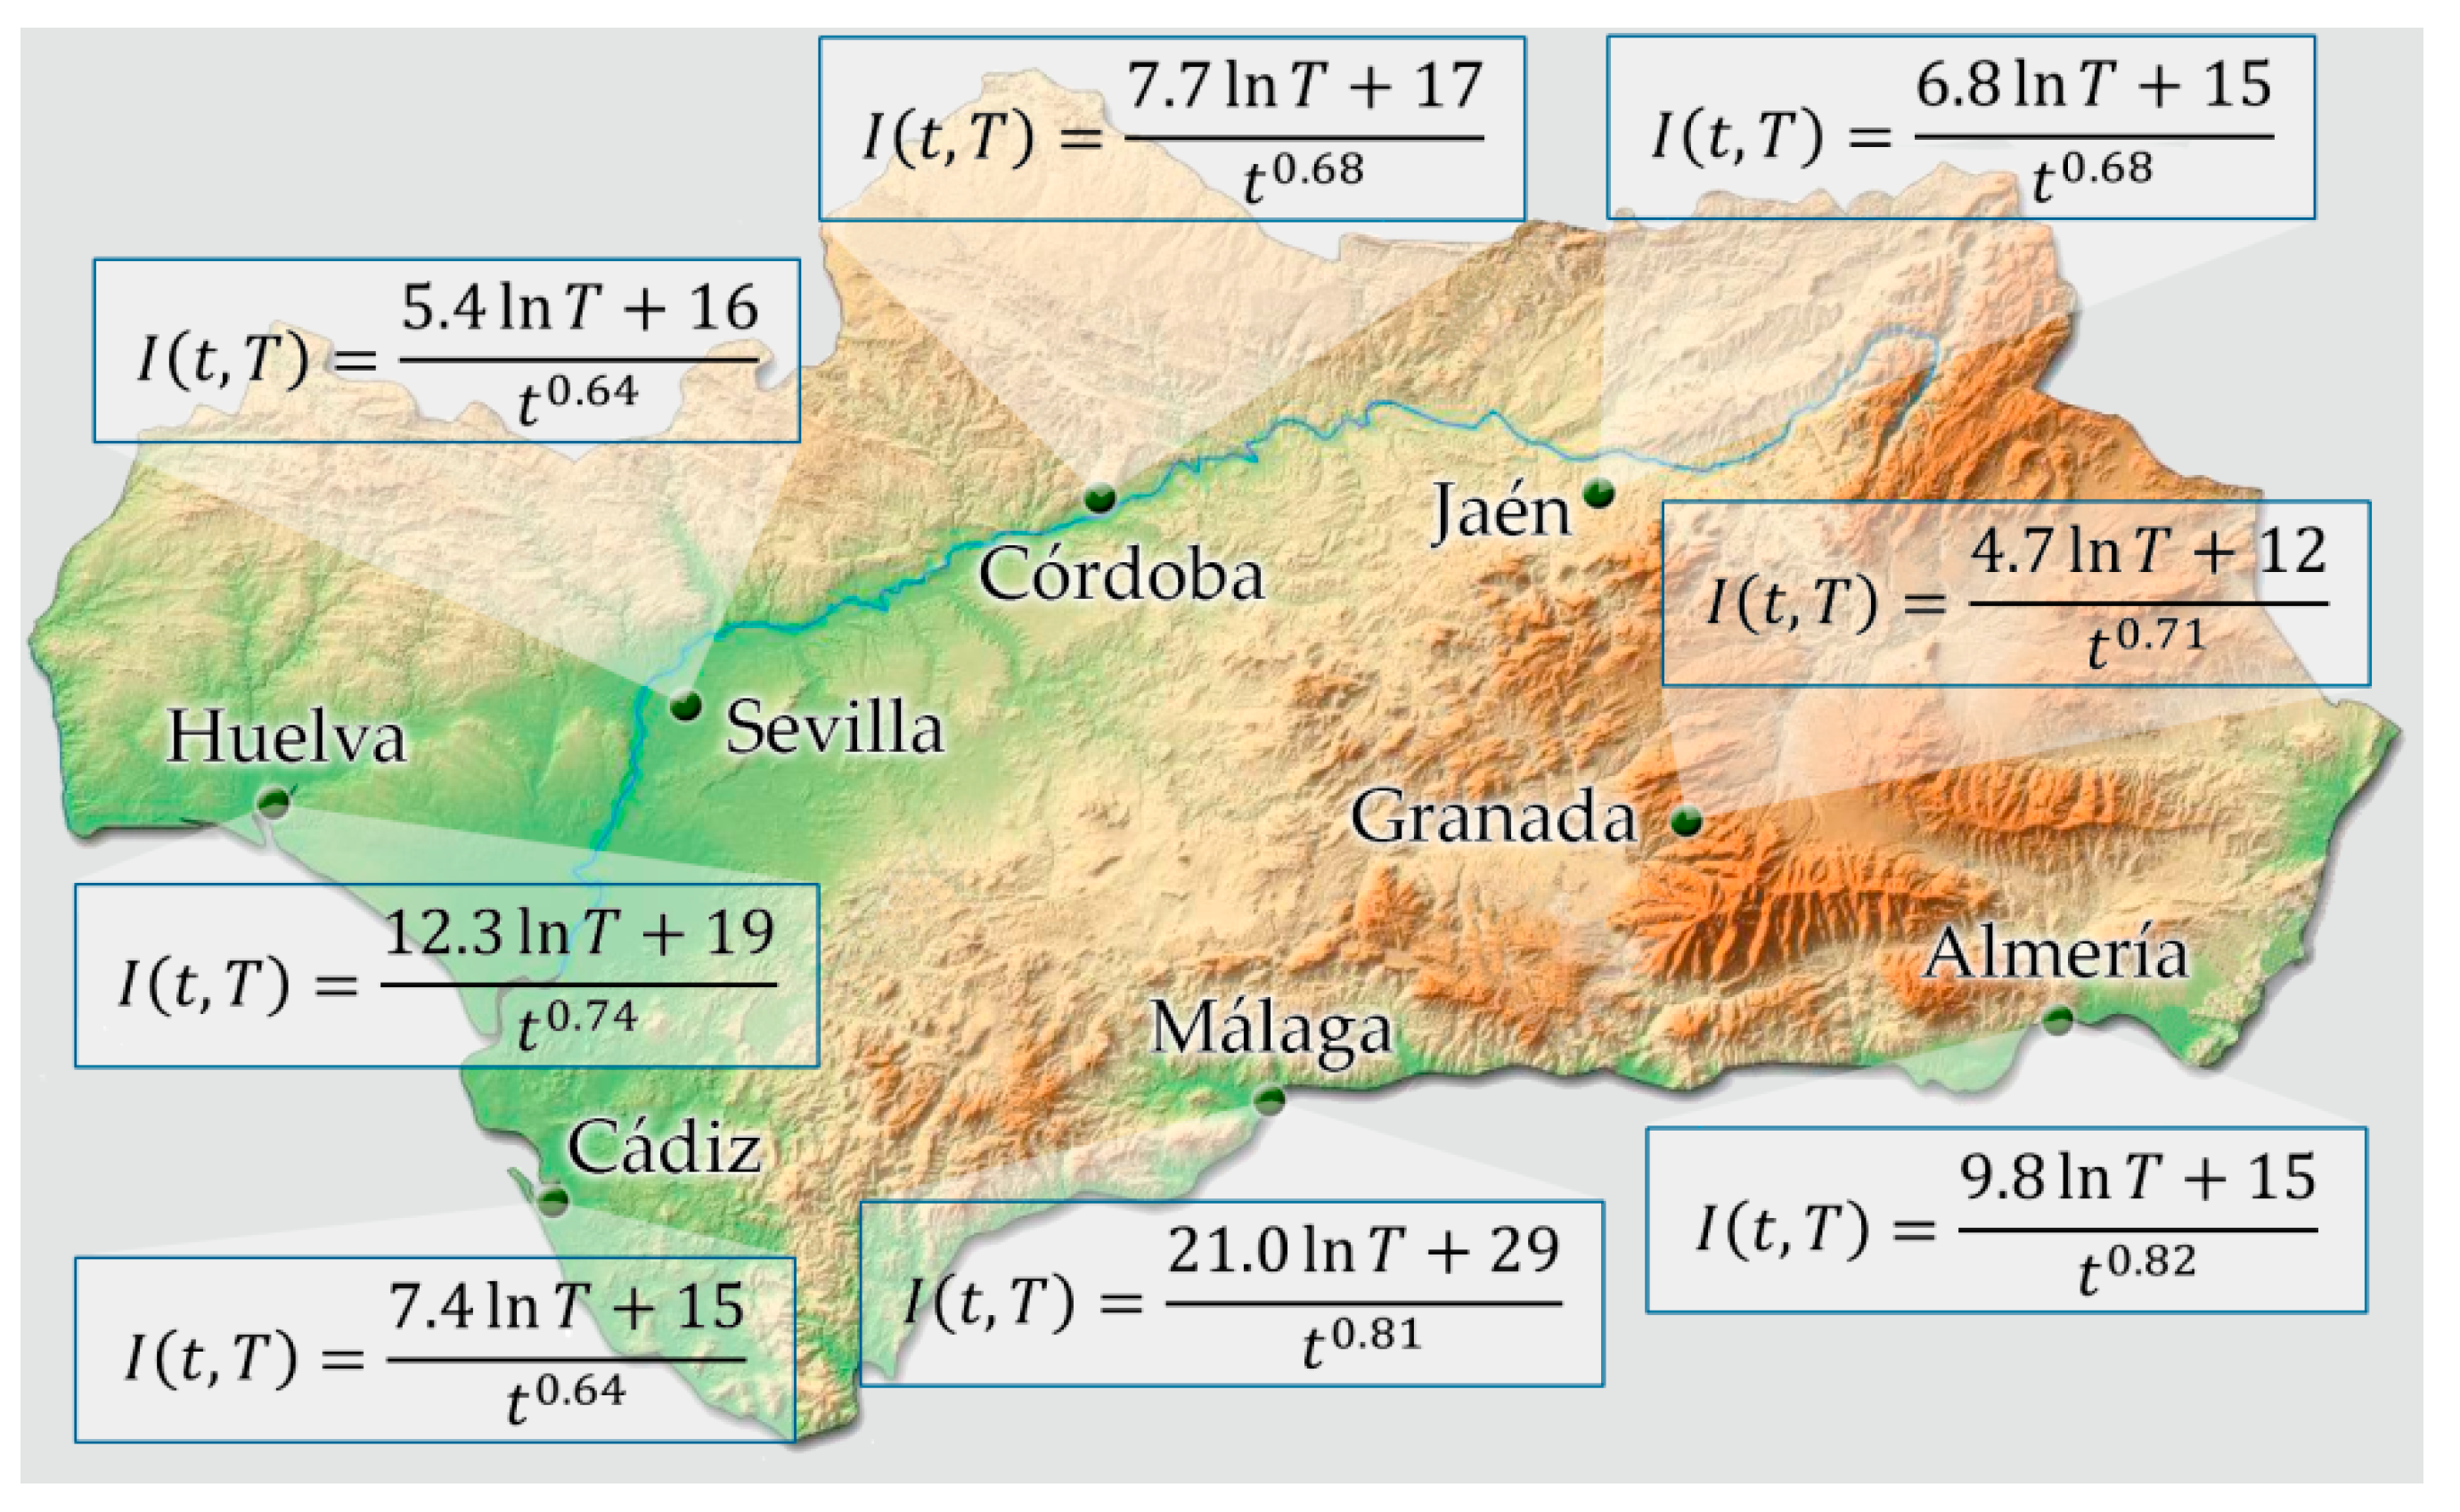
3.2. Generalized IDF Equations for the Provincial Capitals of Andalusia

A statistical analysis was performed on the daily rainfall series registered at the eight provincial capitals of Andalusia to obtain rainfall intensities for several return periods T [36,37] from 2 to 500 years, fitted to logarithmic functions I ( 24 ,   T ) . The provincial capitals are Almería, Cádiz, Córdoba, Granada, Huelva, Jaén, Málaga and Sevilla (Figure 10), for which the simple scaling parameter was already calculated. The IDF equations for these cities can be found using Equation (3) and are shown in Figure 10.

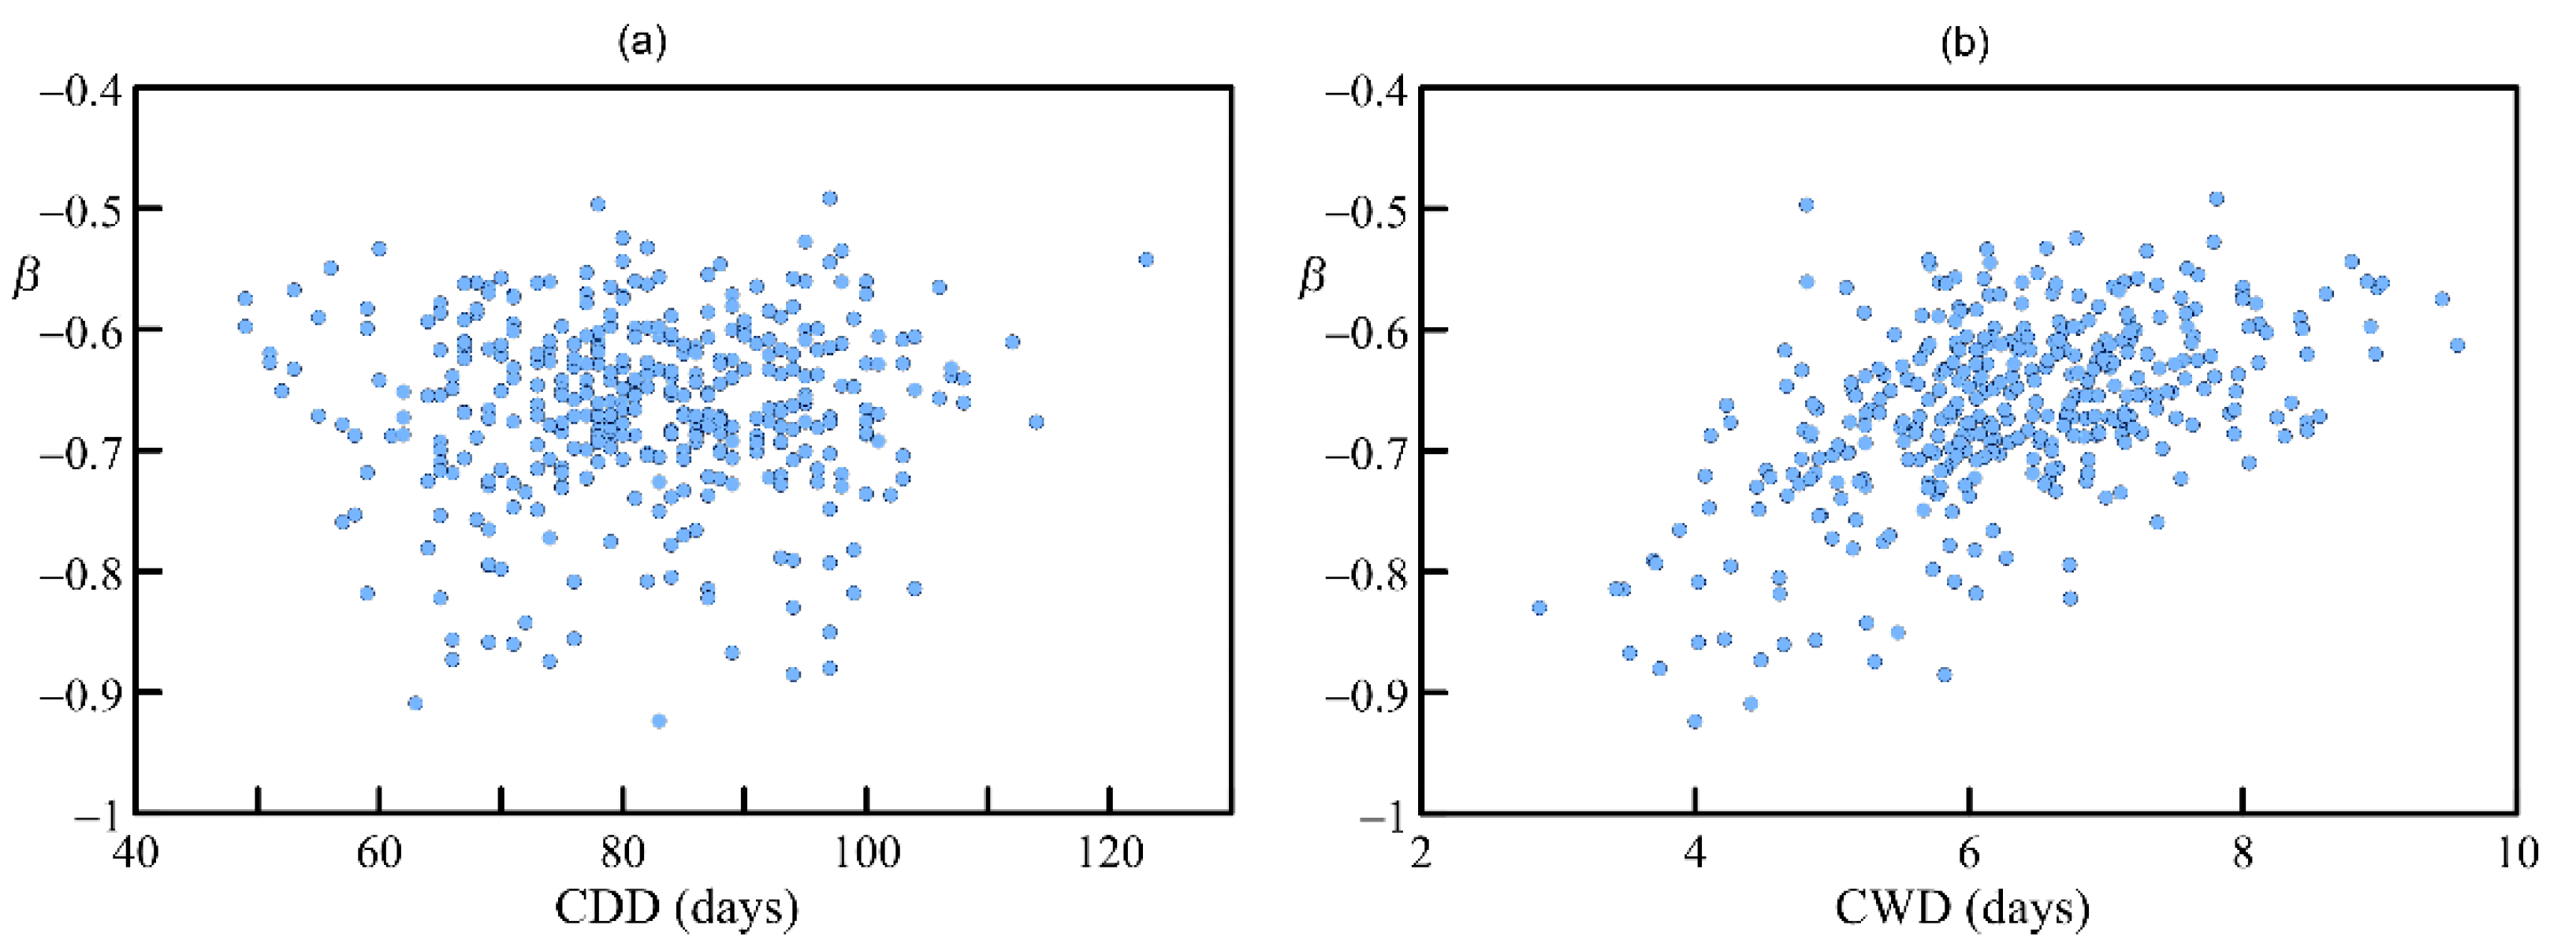
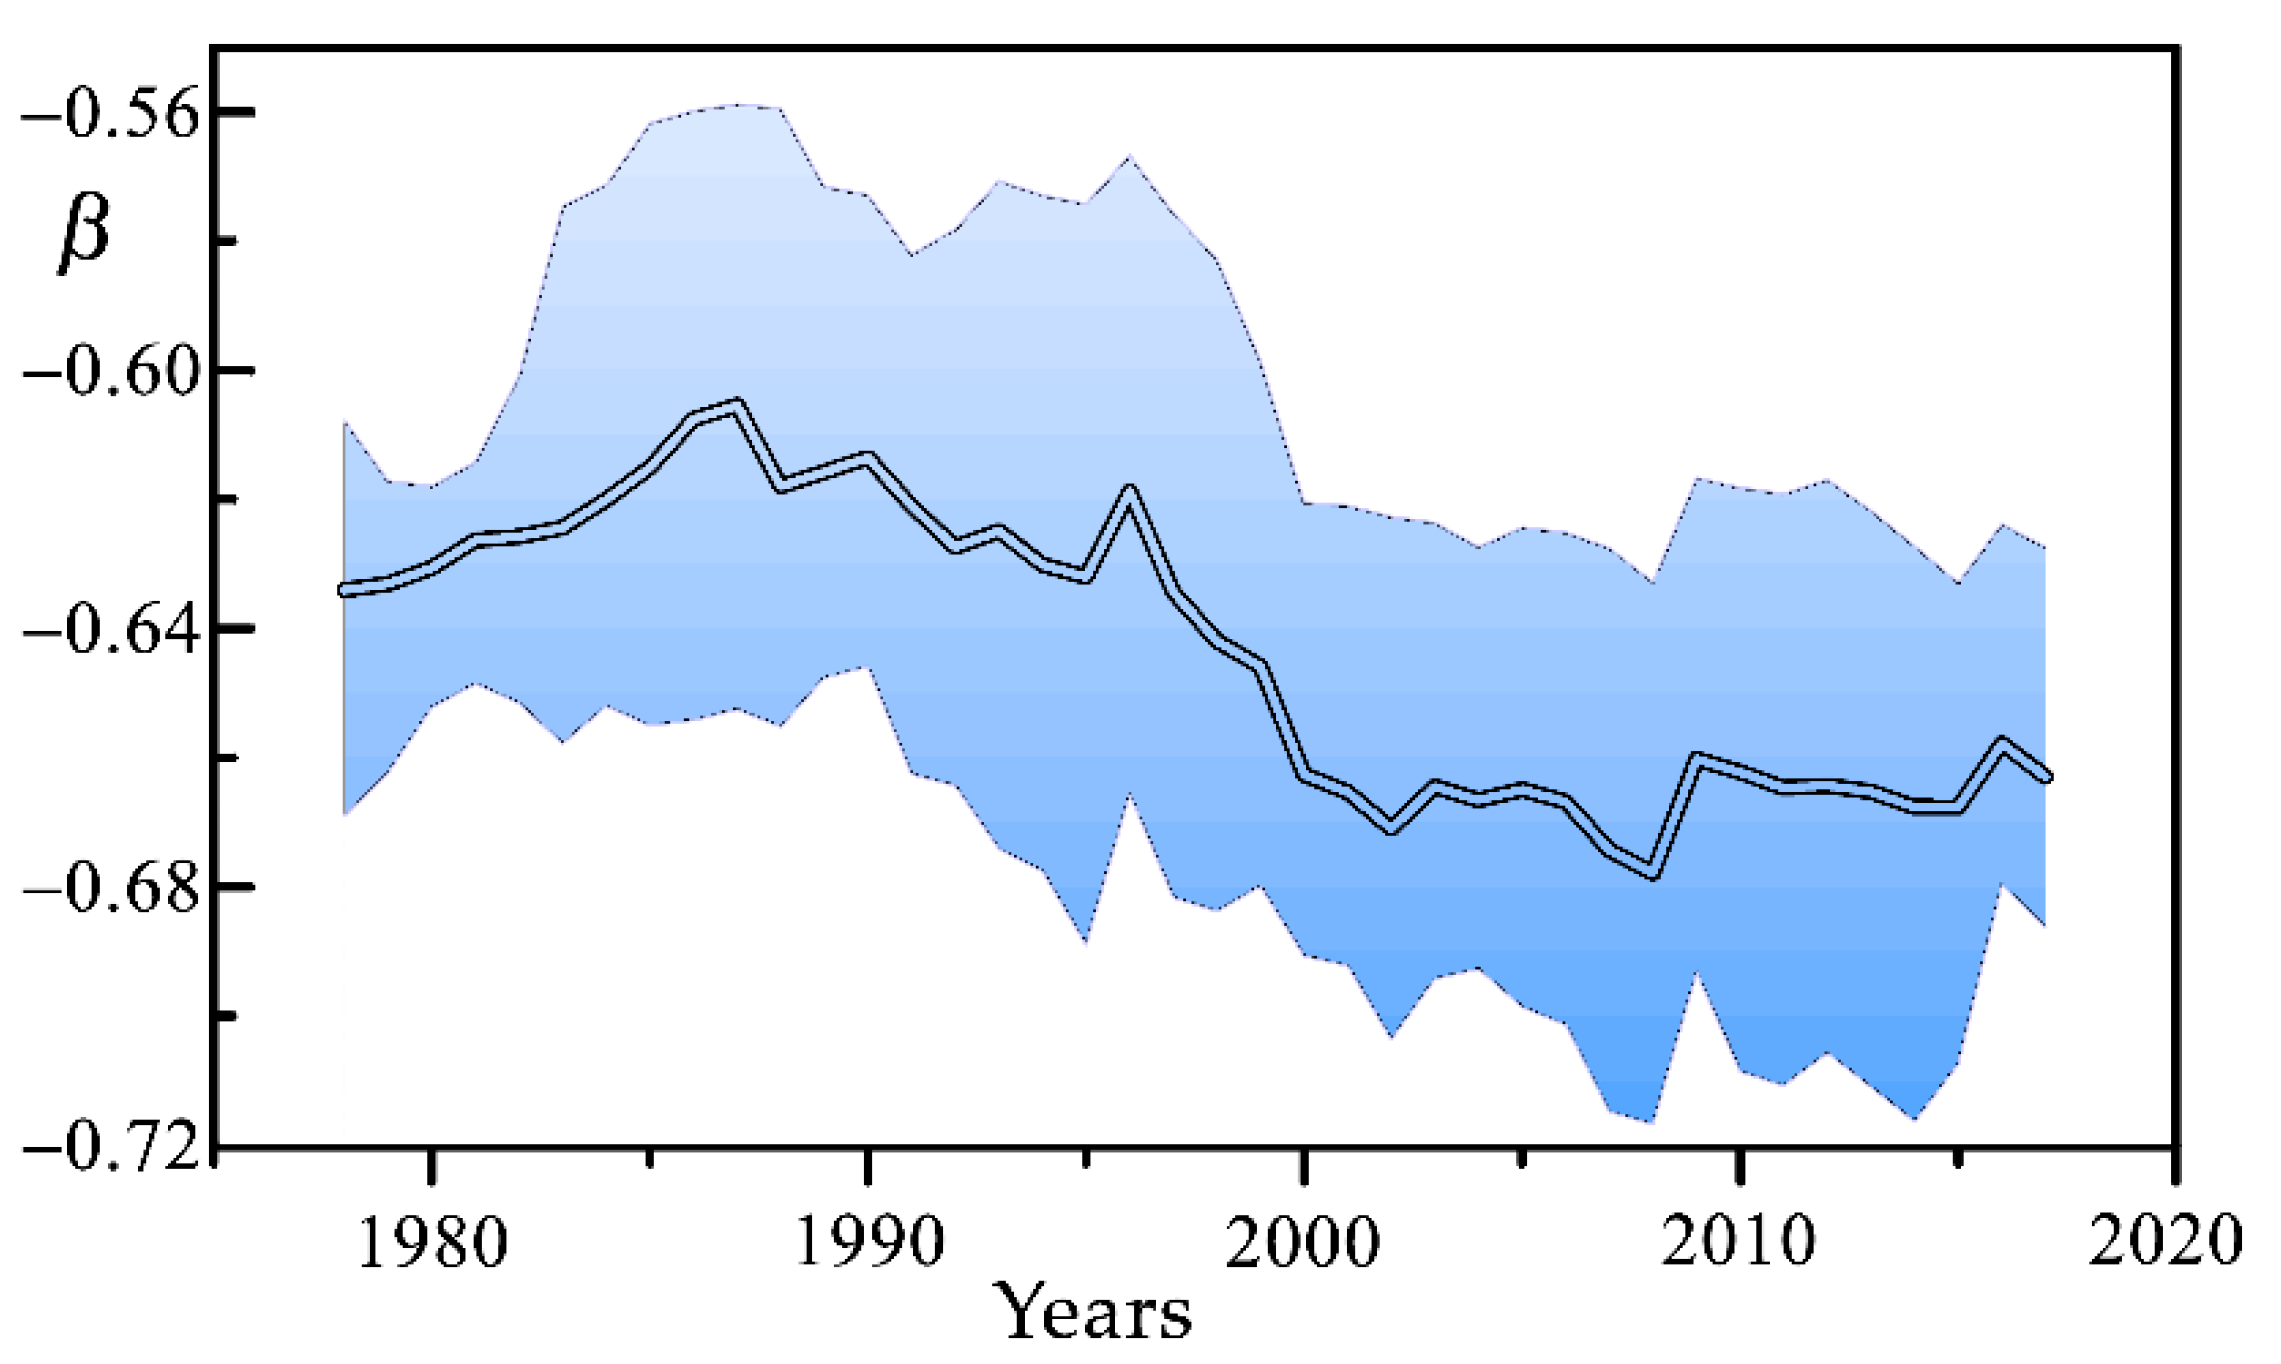
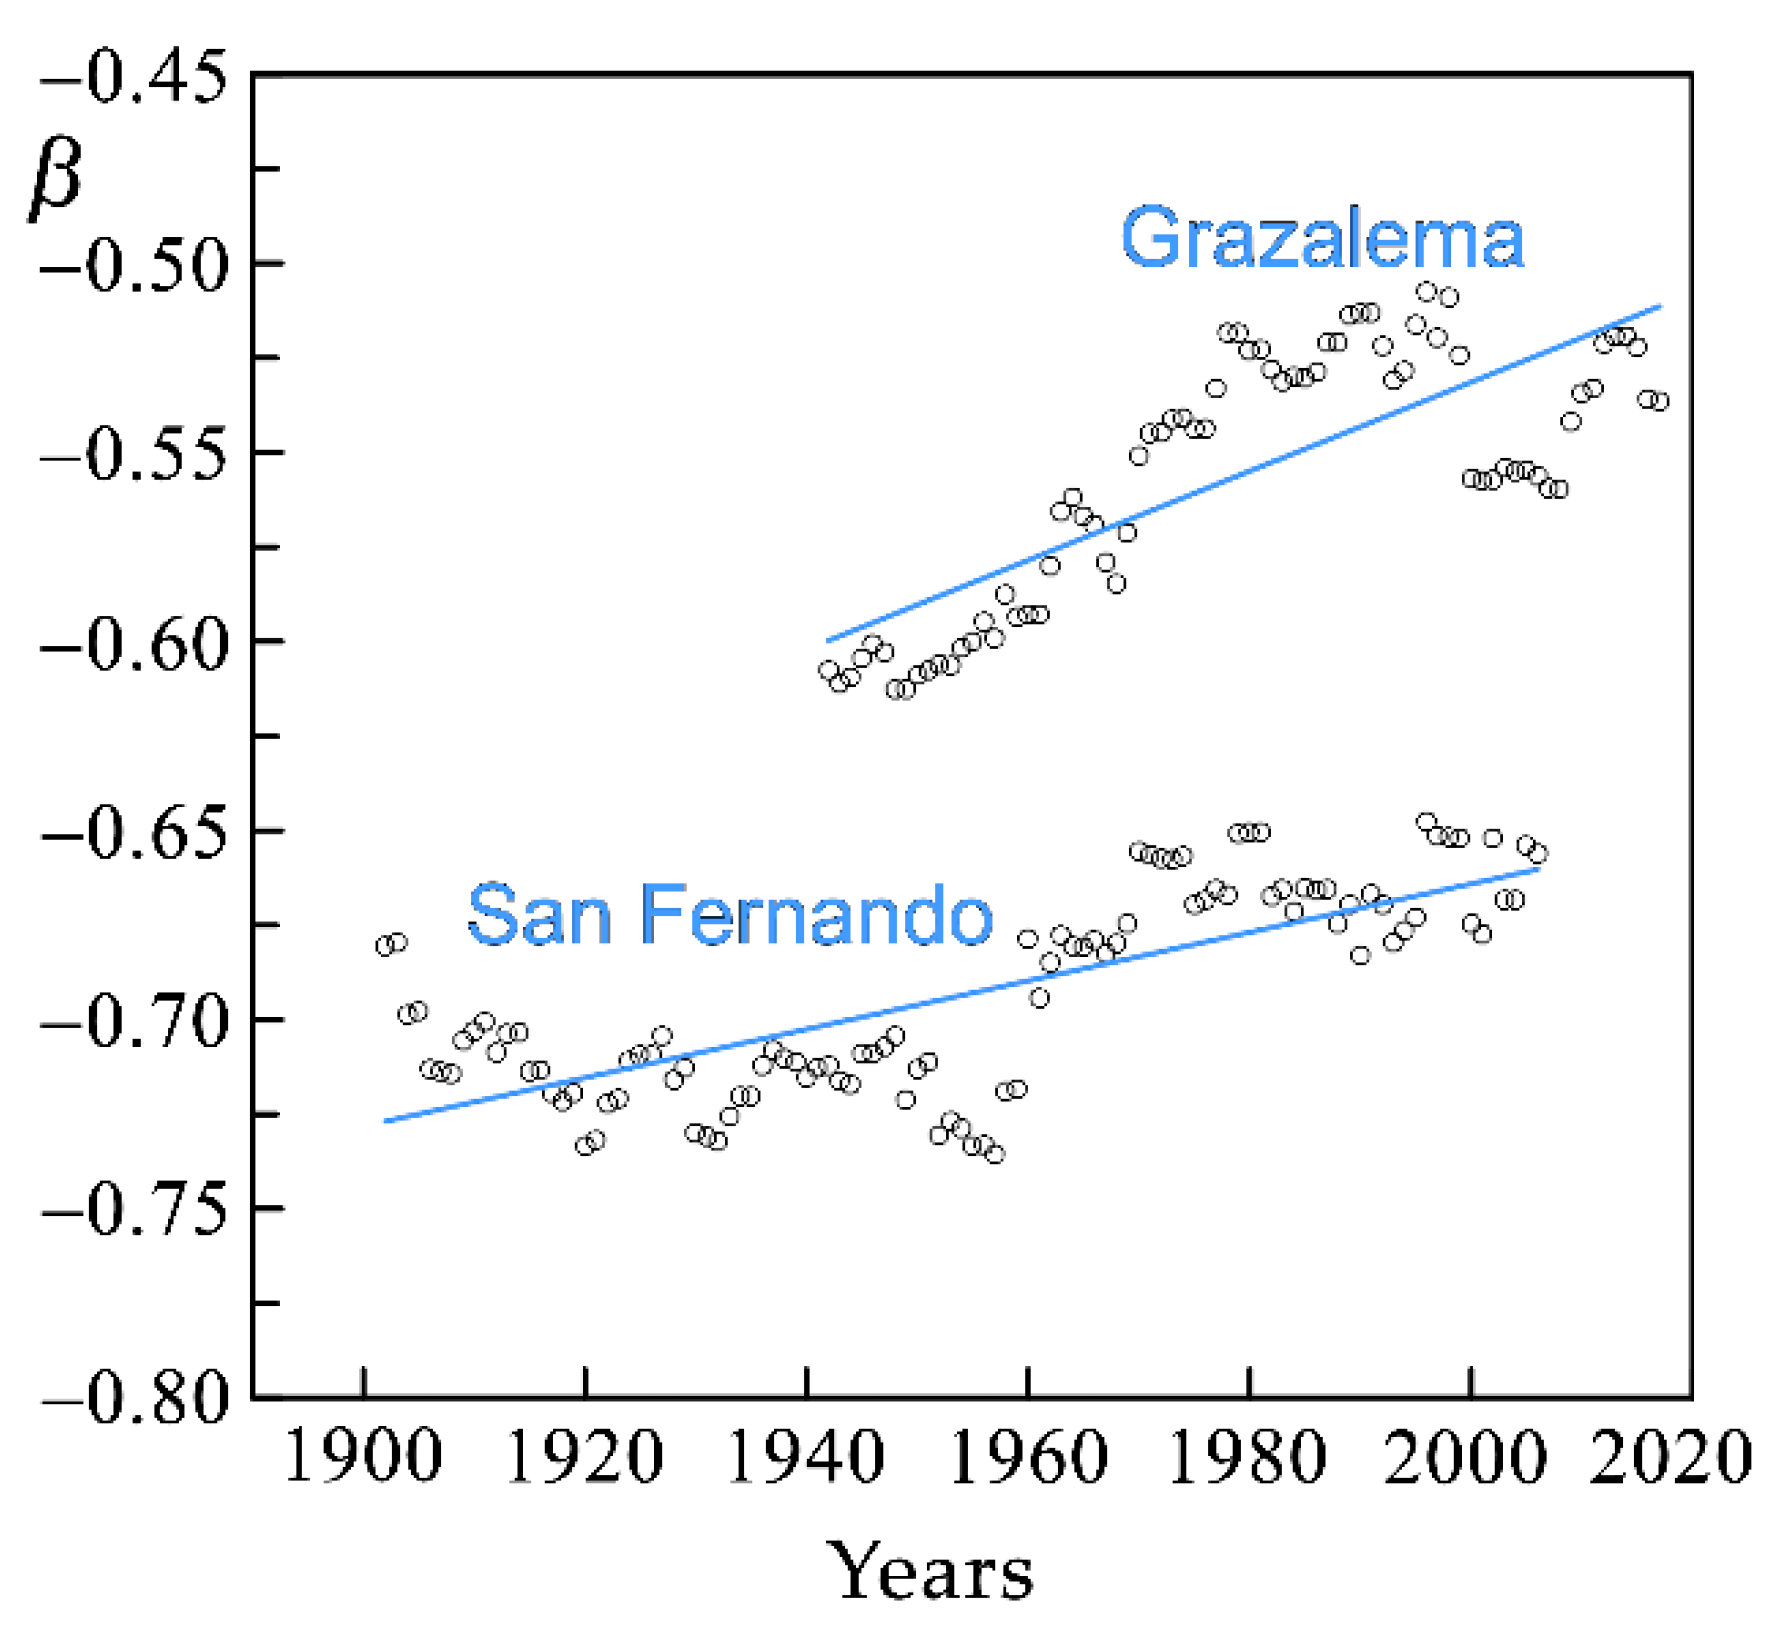
3.3. Climate Trends of the Scaling Parameter β

The possible temporal evolution of the scaling parameter was analyzed in Andalusia following the procedure of using sliding intervals of 30 years with a step of one year [17]. Figure 11 shows the temporal evolution of the mean value of β in Andalusia from 1978 until 2017. The reason for beginning this analysis in 1978 was because it is the year from which more than 10 stations with records length longer than 30 years were available.
As found in Catalonia [17], the mean value of the scaling parameter β seems to show a decreasing trend over the past 40 years globally, compatible with a possible increase of certain areas of the region towards irregularity in rainfall patterns. However, this global analysis might present two problems: (1) several areas with very different climates and possibly different temporal trends are considered together, and (2) the analysis only covers the last six decades (each point represents the end of a 30-year window) of the past twentieth century due to the length of the series considered, so the apparent decreasing trend might only be a part of a fluctuation if a bigger picture could be represented. Thus, the individual analysis of long records could lead to a different outcome. For instance, Figure 12 shows the temporal analysis after discarding some outliers calculated for the two stations with the longest and most complete records of the study: Grazalema (Cádiz), located in a mountainous and very rainy region, and San Fernando (Cádiz), a coastal location subject to a great Atlantic influence. In both cases the general trend is a slight temporal increase of β .
A more robust analysis can be made with a selection of twenty-one stations with more than 50 consecutive years of data. The scaling parameters of their corresponding records were calculated for the intervals 1968–1997 and 1988–2017, considering ten common years to obtain an appropriate number of records. For this selection, the differences in the scaling parameter between temporal intervals were analyzed using a t-test for two related samples (paired t-test). Although there was not a significant difference at the 95% confidence level (p = 0.069) between the mean values of β obtained for each temporal interval, the T-test outcome is extremely suggestive, given the small sample of stations used, and adds weight to the overall picture of a changing β . The mean value of β for the 1988–2017 interval was 0.02 lower than that for the 1968–1997 interval, which seems to be in agreement with our previous results, indicating a slight, widespread increase of rainfall irregularity in the region, possibly more pronounced in the areas with more Mediterranean influence.

4. Conclusions

A simple scaling analysis performed in Andalusia (Spain), a region that has considerable climatic variety with notably wet areas as well as extremely dry zones, was useful to investigate the relationship between the simple scaling parameter value and the distinctive rainfall regime of a place. The spatial distribution obtained after kriging interpolation was in accordance with different geographical and climatological zones, the highest values, above 0.60 , being observed in mountainous areas such as the extremes east and west of Sierra Morena in the north and Sierra de Grazalema in the south, with their lowest values, below 0.85 , corresponding to the most arid area of Andalusia at its most eastern end. Despite the great relation found between the mean annual rainfall (PRCPTOT) and the values of β at every station, a clear dependence with rainfall irregularity was observed. For instance, using the ratio between the maximum daily and annual rainfall as an indicator of irregularity, the maximum value of the scaling parameter, 0.92 , corresponded to a station (Pulpí) located in the eastern arid area where the daily maximum amount contributed, on average, more than 20% to the annual rainfall amount in this location. Related to rainfall irregularity, a certain correlation between β and the index CWD was also observed, while no dependence on the drought index, CDD, was detected.
The increasing influence of the Mediterranean Sea towards the east was seen. The most eastern zones of Andalusia are dry areas clearly influenced by the Mediterranean disturbances, with a high proportion of convective precipitation and an irregular rainfall pattern. These areas are part of the eastern façade of the Iberian Peninsula where Mediterranean depressions usually cause highly contrasting daily rainfall amounts, and very intense and torrential precipitation occurs.
Temporal trends of the scaling parameter β may indicate changes in precipitation patterns, an important issue nowadays when notable efforts are being made to detect possible consequences of climate change due to global warming. The mean value of the scaling parameter β for all Andalusia has shown a decreasing trend over the past 40 years, compatible with a possible increase towards rainfall pattern irregularity for some areas of the region. However, this global analysis combines areas with different climates and possibly different temporal individual trends, and must be considered carefully.

Author Contributions

Conceptualisation, R.R.-S. and M.d.C.C.-C.; methodology, R.R.-S. and M.d.C.C.-C.; software, R.R.-S., A.L.-B. and X.N.; validation, M.d.C.C.-C., R.R.-S., A.P.G.-M. and J.E.; formal analysis, R.R.-S., A.L.-B. and M.d.C.C.-C.; investigation, J.E.; resources, J.E. and A.P.G.-M.; data curation, A.L.-B.; writing—original draft preparation, M.d.C.C.-C.; writing—review & editing, M.d.C.C.-C., R.R.-S., A.P.G.-M. and J.E.; figures and visualization, M.d.C.C.-C. and R.R.-S.; supervision, M.d.C.C.-C., R.R.-S., J.E. and A.P.G.-M.; funding acquisition, A.P.G.-M. and J.E. All authors have read and agreed to the published version of the manuscript.

Funding

This research was funded by the Spanish Ministry of Science, Innovation and Universities, grant number AGL2017-87658-R.

Data Availability Statement

Rainfall data used to support the findings of this study were supplied by the Spanish Agency of Meteorology (AEMET), available by request.

Acknowledgments

The authors thank the anonymous referees for their constructive comments and suggestions.

Conflicts of Interest

The authors declare no conflict of interest. The funders had no role in the design of the study, in the collection, analyses, or interpretation of data, in the writing of the manuscript, or in the decision to publish the results.

References

  1. Walther, G.R.; Post, E.; Convey, P.; Menzel, A.; Parmesan, C.; Beebee, T.J.; Bairlein, F. Ecological responses to recent climate change. Nature 2002, 416, 389–395. [Google Scholar] [CrossRef] [PubMed]
  2. Yu, Z.G.; Leung, Y.; Chen, Y.D.; Zhang, Q.; Anh, V.; Zhou, Y. Multifractal analyses of daily rainfall time series in Pearl River basin of China. Phys. A Stat. Mech. Appl. 2014, 405, 193–202. [Google Scholar] [CrossRef] [Green Version]
  3. García-Marín, A.P.; Jiménez-Hornero, F.J.; Ayuso, J.L. Applying multifractality and the self-organized criticality theory to describe the temporal rainfall regimes in Andalusia (southern Spain). Hydrol. Process. 2008, 22, 295–308. [Google Scholar] [CrossRef]
  4. Mandelbrot, B.B. The Fractal Geometry of Nature; W.H.Freeman & Co Ltd.: New York, NY, USA, 1982. [Google Scholar]
  5. Gires, A.; Tchiguirinskaia, I.; Schertzer, D.; Lovejoy, S. Development and analysis of a simple model to represent the zero rainfall in a universal multifractal framework. Nonlin. Process. Geophys. 2013, 20, 343–356. [Google Scholar] [CrossRef] [Green Version]
  6. García-Marín, A.P.; Ayuso-Muñoz, J.L.; Jiménez-Hornero, F.J.; Estévez, J. Selecting the best IDF model by using the multifractal approach. Hydrol. Process. 2013, 27, 433–443. [Google Scholar] [CrossRef]
  7. García-Marín, A.P.; Estévez, J.; Medina-Cobo, M.T.; Ayuso-Muñoz, J.L. Delimiting homogeneous regions using the multifractal properties of validated rainfall data series. J. Hydrol. 2015, 529, 106–119. [Google Scholar] [CrossRef]
  8. Rodríguez, R.; Casas, M.C.; Redaño, Á. Multifractal analysis of the rainfall time distribution on the metropolitan area of Barcelona (Spain). Meteorol. Atmos. Phys. 2013, 121, 181–187. [Google Scholar] [CrossRef] [Green Version]
  9. Gupta, V.K.; Waymire, E. Multiscaling properties of spatial rainfall and river flow distributions. J. Geophys. Res. Atmos. 1990, 95, 1999–2009. [Google Scholar] [CrossRef]
  10. Koutsoyiannis, D.; Foufoula-Georgiou, E. A scaling model of storm hyetograph. Water Resour. Res. 1993, 29, 2345–2361. [Google Scholar] [CrossRef]
  11. Burlando, P.; Rosso, R. Scaling and multiscaling models of depth-duration-frequency curves for storm precipitation. J. Hydrol. 1996, 187, 45–64. [Google Scholar] [CrossRef]
  12. Menabde, M.; Seed, A.; Pegram, G. A simple scaling model for extreme rainfall. Water Resour. Res. 1999, 35, 335–339. [Google Scholar] [CrossRef]
  13. Yu, P.S.; Yang, T.C.; Lin, C.S. Regional rainfall intensity formulas based on scaling property of rainfall. J. Hydrol. 2004, 295, 108–123. [Google Scholar] [CrossRef]
  14. Panthou, G.; Vischel, T.; Lebel, T.; Quantin, G.; Molinié, G. Characterising the space–time structure of rainfall in the Sahel with a view to estimating IDAF curves. Hydrol. Earth Syst. Sci. 2014, 18, 5093–5107. [Google Scholar] [CrossRef] [Green Version]
  15. Rodríguez-Solà, R.; Casas-Castillo, M.C.; Navarro, X.; Redaño, Á. A study of the scaling properties of rainfall in Spain and its appropriateness to generate intensity-duration-frequency curves from daily records. Int. J. Climatol. 2017, 37, 770–780. [Google Scholar] [CrossRef]
  16. Innocenti, S.; Mailhot, A.; Frigon, A. Simple scaling of extreme precipitation in North America. Hydrol. Earth Syst. Sci. 2017, 21, 5823–5846. [Google Scholar] [CrossRef] [Green Version]
  17. Casas-Castillo, M.C.; Llabrés-Brustenga, A.; Rius, A.; Rodríguez-Solà, R.; Navarro, X. A single scaling parameter as a first approximation to describe the rainfall pattern of a place: Application on Catalonia. Acta Geophys. 2018, 66, 415–424. [Google Scholar] [CrossRef]
  18. Bara, M.; Kohnová, S.; Gaál, L.; Szolgay, J.; Hlavčová, K. Estimation of IDF curves of extreme rainfall by simple scaling in Slovakia. Contrib. Geophys. Geod. 2009, 39, 187–206. [Google Scholar]
  19. Rodríguez, R.; Navarro, X.; Casas, M.C.; Ribalaygua, J.; Russo, B.; Pouget, L.; Redaño, Á. Influence of climate change on IDF curves for the metropolitan area of Barcelona (Spain). Int. J. Climatol. 2014, 34, 643–654. [Google Scholar] [CrossRef] [Green Version]
  20. Loaiciga, H.A.; Valdés, J.B.; Vogel, R.; Garvey, J.; Schwarz, H. Global warming and the hydrologic cycle. J. Hydrol. 1996, 174, 83–127. [Google Scholar] [CrossRef]
  21. Huntington, T.G. Evidence for intensification of the global water cycle: Review and synthesis. J. Hydrol. 2006, 319, 83–95. [Google Scholar] [CrossRef]
  22. Field, C.B.; Barros, V.; Stocker, T.F.; Qin, D.; Dokken, D.J.; Ebi, K.L.; Mastrandrea, M.D.; Mach, K.J.; Plattner, G.-K.; Allen, S.K.; et al. (Eds.) IPCC 2012—Managing the Risks of Extreme Events and Disasters to Advance Climate Change Adaptation; Cambridge University Press: Cambridge, UK, 2012; 582p. [Google Scholar]
  23. Christensen, J.H.; Christensen, O.B. Severe summertime flooding in Europe. Nature 2003, 421, 805–806. [Google Scholar] [CrossRef] [PubMed]
  24. Pérez, F.F.; Boscolo, R. (Eds.) Clima en España: Pasado, Presente y Futuro. Informe de Evaluación del Cambio Climático Regional; CLIVAR; Ministerio de Medio Ambiente y Medio Rural y Marino; Ministerio de Ciencia e Innovacion (MICINN), Spain: 2010; 83p; Available online: http://hdl.handle.net/10261/23600 (accessed on 15 April 2021).
  25. Lana, X.; Casas-Castillo, M.C.; Rodríguez-Solà, R.; Serra, C.; Martínez, M.D.; Kirchner, R. Rainfall regime trends at annual and monthly scales in Catalonia (NE Spain) and the possible effects of the increasing CO2 emissions into the atmosphere. Theor. Appl. Climatol. 2021, 146, 981–996. [Google Scholar] [CrossRef]
  26. Herrera-Grimaldi, P.; García-Marín, A.P.; Ayuso-Muñoz, J.L.; Flammini, A.; Morbidelli, R.; Ayuso-Ruíz, A.L. Detection of trends and break points in temperature: The case of Umbria (Italy) and Guadalquivir Valley (Spain). Acta Geophys. 2018, 66, 329–343. [Google Scholar] [CrossRef]
  27. Llabrés-Brustenga, A.; Rius, A.; Rodríguez-Solà, R.; Casas-Castillo, M.C.; Redaño, Á. Quality control process of the daily rainfall series available in Catalonia from 1855 to the present. Theor. Appl. Climatol. 2019, 137, 2715–2729. [Google Scholar] [CrossRef]
  28. Hershfield, D.M. Rainfall Frequency Atlas of the United States for Durations from 30 Minutes to 24 Hours and Return Periods from 1 to 100 Years; Weather Bureau Technical Paper 40; U.S. Weather Bureau: Washington, DC, USA, 1961; 115p. Available online: www.weather.gov/media/owp/oh/hdsc/docs/TechnicalPaper_No40.pdf (accessed on 15 April 2021).
  29. Weiss, L.L. Ratio of true to fixed-interval maximum rainfall. J. Hydraul. Div. 1964, 90, 77–82. [Google Scholar] [CrossRef]
  30. Papalexiou, S.M.; Dialynas, Y.G.; Grimaldi, S. Hershfield factor revisited: Correcting annual maximum precipitation. J. Hydrol. 2016, 542, 884–895. [Google Scholar] [CrossRef]
  31. Morbidelli, R.; Saltalippi, C.; Flammini, A.; Cifrodelli, M.; Picciafuoco, T.; Corradini, C.; Casas-Castillo, M.C.; Fowler, J.H.; Wilkinson, S.M. Effect of temporal aggregation on the estimate of annual maximum rainfall depths for the design of hydraulic infrastructure systems. J. Hydrol. 2017, 554, 710–720. [Google Scholar] [CrossRef] [Green Version]
  32. Morbidelli, R.; Saltalippi, C.; Flammini, A.; Picciafuoco, T.; Dari, J.; Corradini, C. Characteristics of the underestimation error of annual maximum rainfall depth due to coarse temporal aggregation. Atmosphere 2018, 9, 303. [Google Scholar] [CrossRef] [Green Version]
  33. Llabrés-Brustenga, A.; Rius, A.; Rodríguez-Solà, R.; Casas-Castillo, M.C. Influence of regional and seasonal rainfall patterns on the ratio between fixed and unrestricted measured intervals of rainfall amounts. Theor. Appl. Climatol. 2020, 140, 389–399. [Google Scholar] [CrossRef]
  34. Jiménez-Hornero, F.J.; García-Marín, A.P.; Ayuso, J.L. Description of the Daily Number of Rain-Free Hours Series from a Location in Southern Spain by Using the Multifractal Turbulence Formalism. J. Hydrol. Eng. 2008, 13, 987–991. [Google Scholar] [CrossRef]
  35. Martín-Vide, J. Spatial distribution of a daily precipitation concentration index in peninsular Spain. Int. J. Climatol. 2004, 24, 959–971. [Google Scholar] [CrossRef]
  36. Pérez-Zanón, N.; Casas-Castillo, M.C.; Rodríguez-Solà, R.; Peña, J.C.; Rius, A.; Solé, J.G.; Redaño, À. Analysis of extreme rainfall in the Ebre Observatory (Spain). Theor. App. Climatol. 2015, 124, 935–944. [Google Scholar] [CrossRef] [Green Version]
  37. Casas-Castillo, M.C.; Rodríguez-Solà, R.; Navarro, X.; Russo, B.; Lastra, A.; González, P.; Redaño, À. On the consideration of scaling properties of extreme rainfall in Madrid (Spain) for developing a generalized intensity-duration-frequency equation and assessing probable maximum precipitation estimates. Theor. Appl Climatol. 2018, 131, 573–580. [Google Scholar] [CrossRef]
Figure 1. Location of Andalusia at the south of the Iberian Peninsula. At the right, some of the orographic features mentioned in the text.
Water 14 01303 g001
Figure 2. Statistical moments of the rainfall intensity at Grazalema (a) and the airport of Málaga (b). Straight lines indicate scale invariance.
Water 14 01303 g002
Figure 3. Linear relationship between the scale function K ( q ) and the order- q of the moments for Grazalema (a) and the airport of Málaga (b).
Water 14 01303 g003
Figure 4. Histogram of the empirical values of the scaling parameter β .
Water 14 01303 g004
Figure 5. Empirical values of the scaling parameter β at every station.
Water 14 01303 g005
Figure 6. Dependence of the scaling parameter β on (a) mean annual rainfall PRCPTOT and (b) the mean ratio between the maximum daily and the annual rainfall in every station.
Water 14 01303 g006
Figure 7. Representation of the scaling parameter β vs. (a) the CDD drought index and (b) the CWD index.
Water 14 01303 g007
Figure 8. Spatial distribution of the parameter β over Andalusia.
Water 14 01303 g008
Figure 9. Kriging variogram.
Water 14 01303 g009
Figure 10. Generalized intensity-duration-frequency equations for the provincial capitals of Andalusia, where intensities I are in mm, duration t in hours and the return period T is in years.
Water 14 01303 g010
Figure 11. Temporal evolution of the mean value of the scaling parameter β in Andalusia. The shaded area represents dispersion ( ± σ ).
Water 14 01303 g011
Figure 12. Temporal evolution of the scaling parameter β in Grazalema and San Fernando (Cádiz). Blue lines indicate slightly increasing trends.
Water 14 01303 g012
Publisher’s Note: MDPI stays neutral with regard to jurisdictional claims in published maps and institutional affiliations.

