
Monitoring the Process of Anaerobic Digestion of Native and Microwave Pre-Treated Sludge by Dielectric and Rheological Measurements


1
Department of Biosystems Engineering, Faculty of Engineering, University of Szeged, H-6725 Szeged, Hungary
2
Faculty of Science and Informatics, Doctoral School of Environmental Sciences, University of Szeged, H-6720 Szeged, Hungary
*
Author to whom correspondence should be addressed.
Water 2022, 14(8), 1294; https://doi.org/10.3390/w14081294
Submission received: 10 March 2022
/
Revised: 11 April 2022
/
Accepted: 13 April 2022
/
Published: 15 April 2022
(This article belongs to the Topic Anaerobic Digestion Processes)
Abstract
:The anaerobic digestion (AD) of wastewater sludge presents a promising and efficient method of wastewater and sludge treatment, as it can lower the organic content of sludge while producing a renewable source of energy—biogas—at the same time. However, using native, non-treated industrial wastewater sludge as a substrate for AD may present difficulties, hence we focused our research primarily on the applicability of measuring techniques—viscosity and dielectric measurement. One of our research goals was to investigate the presence of any connection between the aforementioned properties and the overall biogas production, in order to prove whether these measurement techniques were capable of monitoring the process of AD. Our other aim was to investigate how microwave (MW) pre-treatment affected the anaerobic fermentation. Our results revealed that in terms of total biogas yield, microwave irradiation could enhance fermentation by 14%, and also reduced the viscosity of the fermentation media by 13%. However, microwave irradiation did not change the overall tendencies of the AD process regarding these aspects. Moreover, it was discovered that dielectric and absolute viscosity measurements were effective methods for monitoring the fermentation. Additionally, a correlation was found between the accumulating biogas yield, the dielectric constant and loss factor, and the absolute viscosity of the digested media—each of these share a similarity in tendency and can indicate the occurrence of different phases during batch anaerobic fermentation.
1. Introduction
The rising water consumption of the population and industry continues to generate increasing amounts of wastewater and sludge every year, with this tendency predicted to continue further in the near future [1]. Since both sources contain various types of pollutants (organic and inorganic substances, pathogenic microorganisms, and other toxicologically hazardous materials), they are potentially harmful to the environment, as well as to health. Therefore, the proper stabilization and treatment process of wastewater sludge is crucial. The conventional form of this process, however, comes with a rather high cost and energy demand; the expense of waste-activated sludge treatment in a traditional waste-activated sludge (WAS) process can even account for 50–60% of the total cost of a treatment plan [2,3].
Biological utilization methods, such as composting or anaerobic digestion (AD), represent promising alternatives to reduce the organic matter content of wastewater sludge and have long been in the line of sight of scientific research. In contrast to composting, anaerobic digestion or fermentation can be used for energetic purposes as well; the biogas or biomethane produced during AD is a promising and environmentally friendly energy source alternative to natural gas [4].
During anaerobic fermentation, specific microorganisms convert the organic content of the substrate to methane (40–65%), carbon dioxide (35–55%), and other gaseous compounds (0.1–3%), such as hydrogen sulfide, carbon monoxide, and nitrogen through three main biochemical processes [5]. Several key factors affect the successful completion of biogas fermentation, among others these include the C:N:P ratio of the substrate, temperature, TS concentration, pH, and the (bio)availability of compounds involved in the biochemical transformation [6]. In the stage of hydrolysis, complex carbohydrates, lipids, and proteins are converted to sugars, fatty acids, and amino acids. In the next acidifying phase, these different compounds are used by facultative anaerobic and obligate anaerobic microorganisms to produce organic acids and alcohols, which are then almost entirely converted to acetic acid. During the last main stage called methanogenesis, acetic acid is transformed into methane and CO2 (acetotrophic methanogenesis), hydrogen and CO2 are converted to methane (hydrogenotrophic methanogenesis), and during methylotrophic methanogenesis, methanol is transformed into methane and H2O.
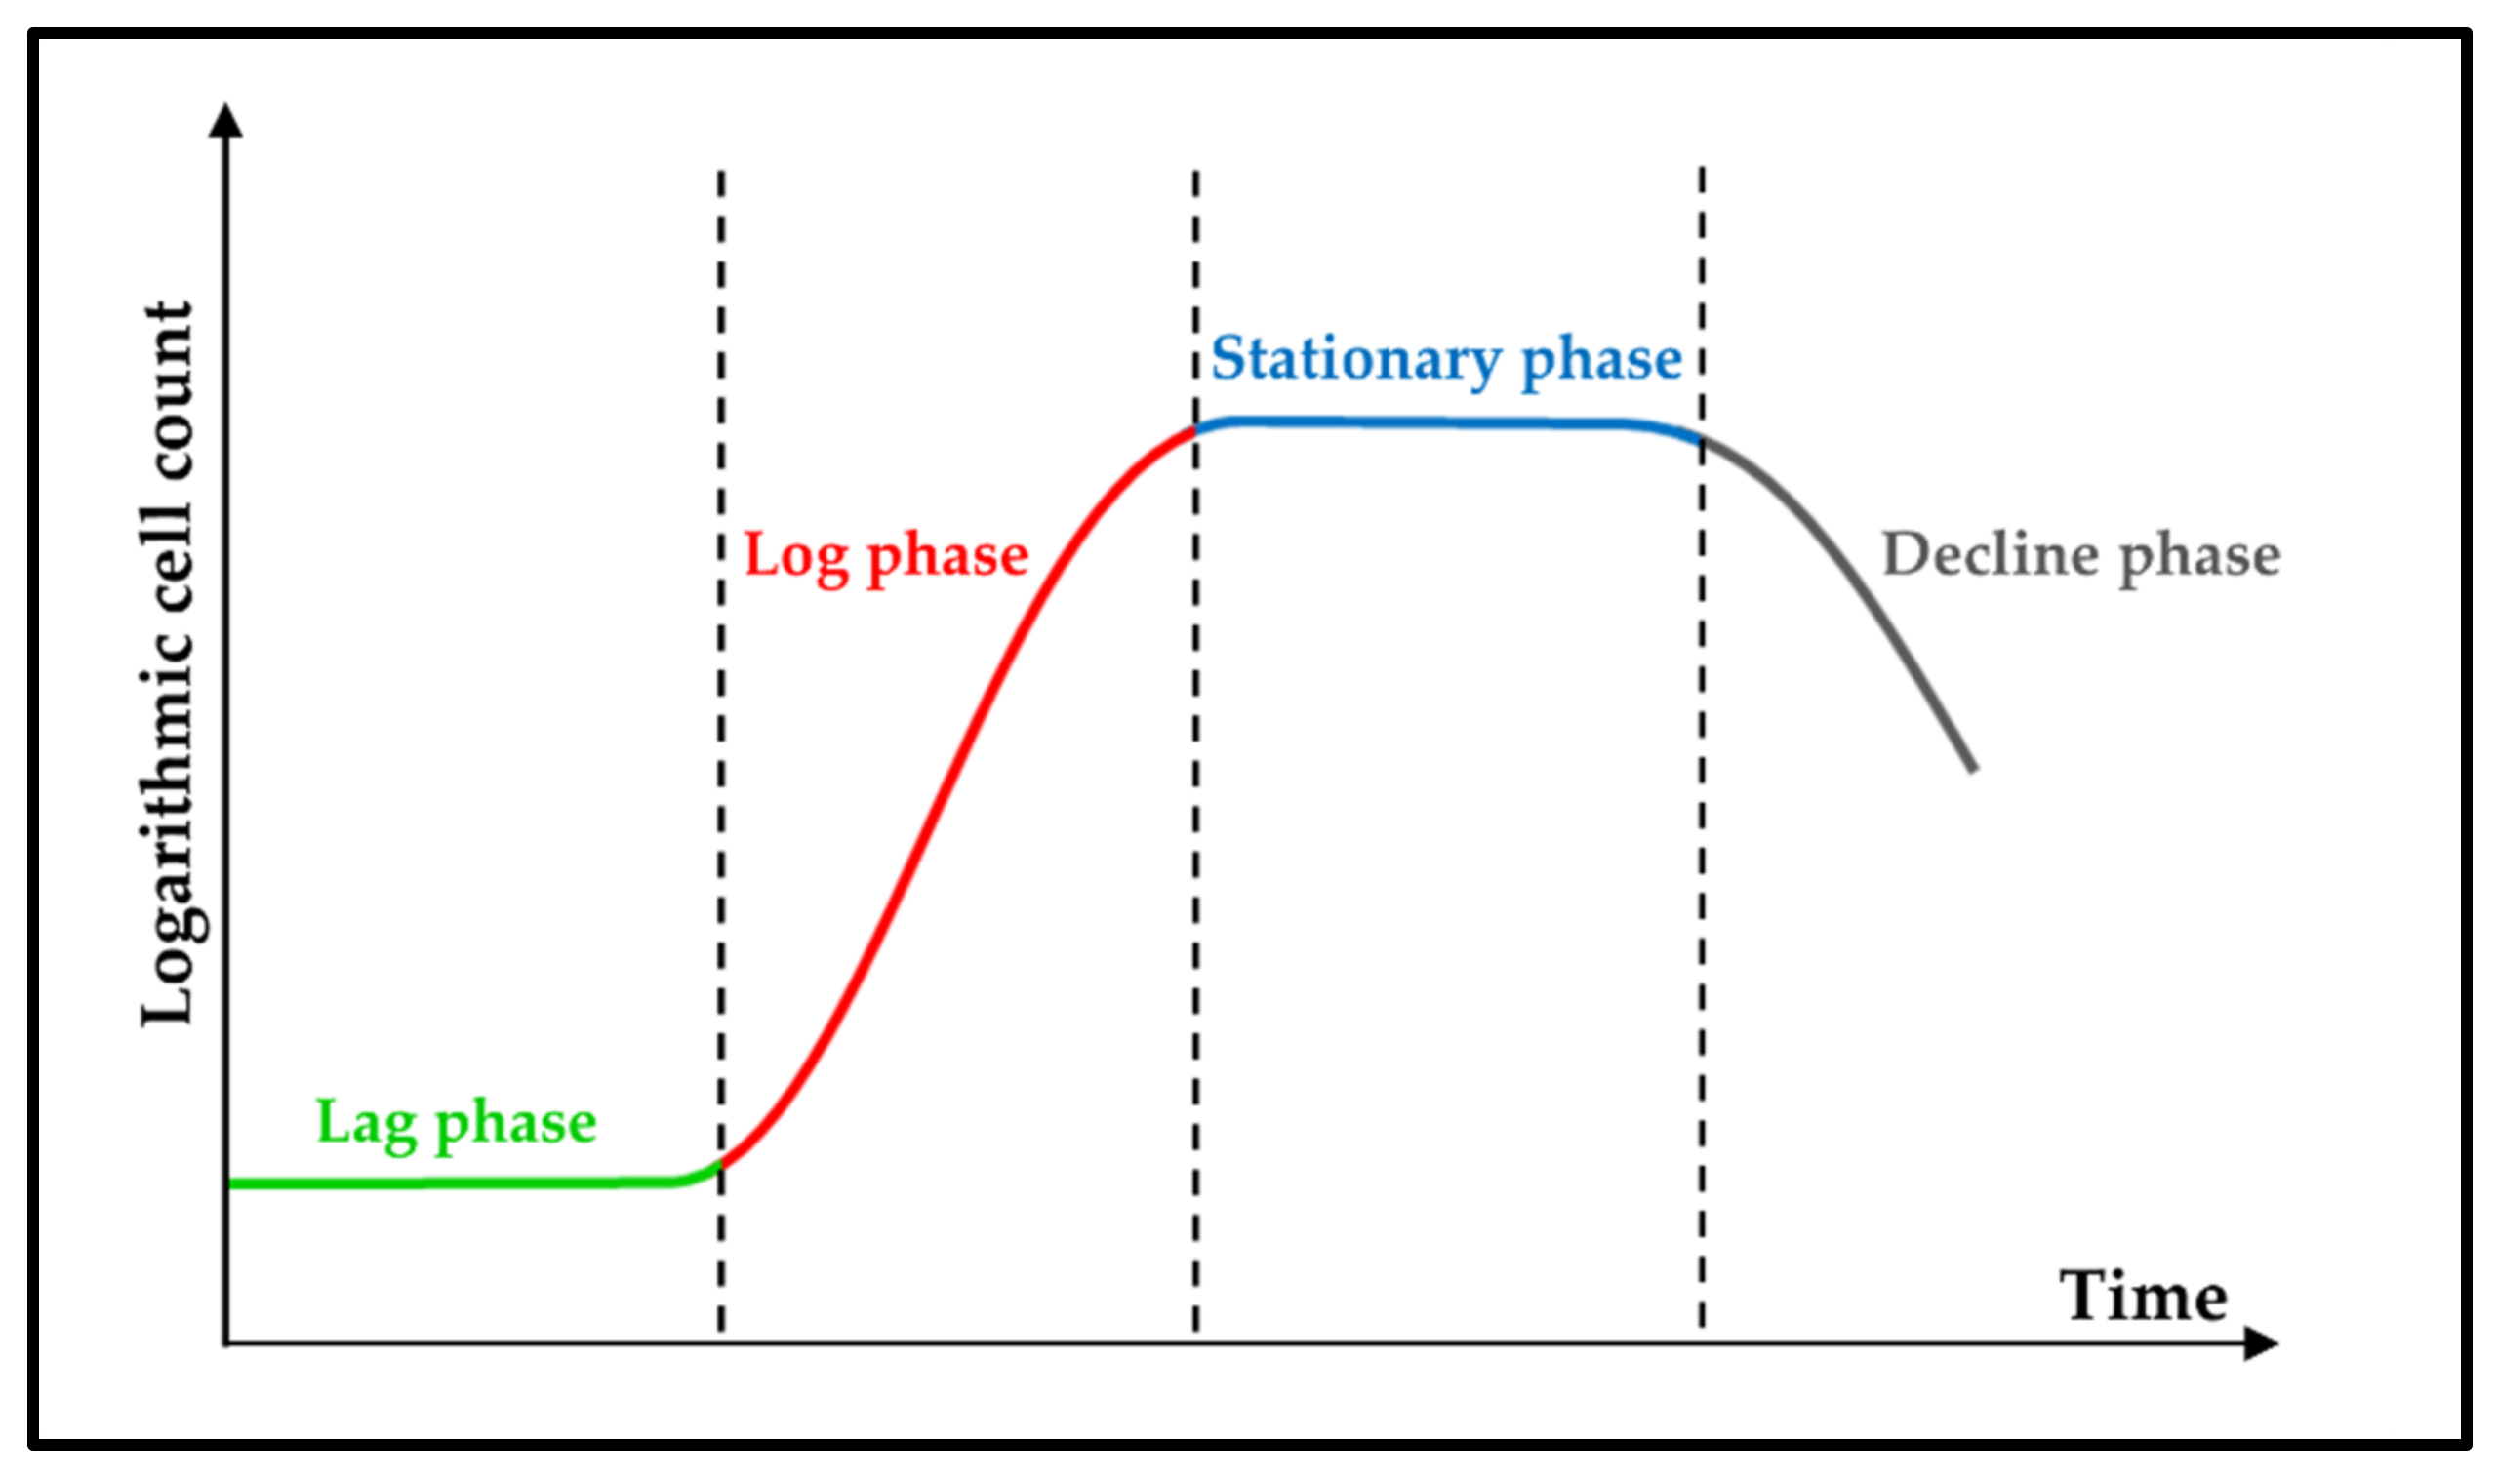
Batch fermentation is commonly used in laboratory experiments to investigate various factors which can affect the process of anaerobic digestion, since it is simple to control and monitor, and the different initial parameters are easy to set up. During this type of fermentation, four main stages can be distinguished by microbial growth (Figure 1). In the first few days (or hours in some cases), the cell count does not change significantly, as during this period the microbes are adapting to their environment—this stage is called the lag or adapting phase. At the end of the lag phase, the adapted cells begin to reproduce, and the cell count grows exponentially—this period is the log phase. Due to the dwindling of carbon and nitrogen sources, and/or the accumulating toxic compounds being released during microbial metabolism, the growth gradually slows down; this phase is called the stationary phase. In the last stage, known as the death or decline phase, the available energy sources deplete, microbial metabolism progressively stops, and cells eventually start perishing [7].
Municipal sludge is commonly used for biogas fermentation as its composition is roughly constant and provides a broadly favorable biochemical environment for the fermentation microbiome [8]. However, the usage of industrial sludge can sometimes present difficulties in terms of AD. This is mainly due to the different, usually non-homogenous material composition of the industrial sludge, the presence of toxic compounds, or the limited bioavailability of certain components, and thus, one or more treatment/pre-treatment processes are frequently needed to achieve adequate efficiency in AD [9].
Materials behave differently when placed into an electromagnetic field. A dielectric material, such as wastewater sludge, stores electrical charge, and certain dielectric properties (dielectric constant, loss factor, loss tangent, reflection coefficient) describe the interaction between the electromagnetic field and the material itself [10]. These interactions define the dielectric behavior of a given material, and depend on various factors, mostly the physicochemical properties of the material matrix, structure, frequency of the electromagnetic field the material is exposed to, and temperature. Complex relative permittivity (ε) contains the characteristics which affect the reflection of electromagnetic waves (EMW) and the energy loss that occurs during the absorption of the EMW inside the material. The dielectric constant (ε′) indicates how much electrical energy can be absorbed in the dielectric material, while the dielectric loss factor (ε″) shows how much electrical energy is converted into heat, i.e., describes the dissipation ability. The connection between the relative permittivity, dielectric constant and loss factor is defined via the following equation (i is the imaginary unit):
Measuring the dielectric properties of a material is a non-destructive, rapid, and chemical-free method, and since it is quite sensitive to changes in physicochemical and structural alterations, provides a promising alternative to monitor the process of AD. Various studies have shown that dielectric measurements can be applied in several scientific or industrial fields. These include foresting to identify the moisture content of wood [11], to estimate the permittivity of coal in mining [12], to detect enzymatic and chemical reactions [13], and as shown in one of our previous studies, to detect the organic matter removal in industrial wastewater [14]. The dielectric properties of waste-activated sludge were also investigated by Bobowski et al. with an open-ended coaxial system, similar to our case, and it was proven that the solid content of the samples determined the dielectric behavior [15]. Brodie et al. also examined the dielectric properties of sewage sludge and defined a dielectric mixing model based on free water, bound water and dried biosolid content [16]. However, the dielectric behavior of the fermentation media during anaerobic fermentation has not been broadly investigated yet.
Rheological properties, such as viscosity, can also play a key role in the overall efficiency of anaerobic digestion, and both its standalone value, and the change in the value itself depends on various factors, such as TS content, fermentation system characteristics, and naturally, temperature [17,18,19]. Because several chemical reactions and molecular interchanges occur during the different phases of AD, the gradual change in viscosity of the fermentation media is reasonably expected. Measuring the viscosity of sludge has an important role in characterization, especially in membrane bioreactor operations [20], and also in process monitoring [21]. However, the change in viscosity during anaerobic fermentation has not been extensively investigated.
Microwaves are electromagnetic waves in the frequency interval between 0.3 and 300 GHz, with a corresponding wavelength of 1 mm–1 m. When absorbed, microwaves at frequencies commonly used in laboratory experiments (2450 MHz or 945 MHz) do not carry enough energy to break primary chemical bonds [22], but are considered to be a promising alternative as a pre-treatment method in material processing, for instance, in sludge treatment. Several studies have shown that MW radiation can be applied in environmental technologies [23,24], as well as in the enhancement of disintegration and biodegradability of wastewater sludge [25,26,27]. It has been shown that microwaves can be used for disintegrating WAS, and the impact they have on the physicochemical properties mainly depend on the extent of radiated energy and power [28]. Microwave radiation can also affect the concentration of organic acids during the acidifying phase of AD [29]. Microwaves can also decrease the viscosity of sludge [30], enhance dewaterability [31], and intensify the solubilization of organic matter, which enhances the bioavailability of essential compounds for microbes involved in AD [32]. However, several studies indicate that using microwave irradiation can reduce the content of microorganisms up to even 99% [33,34,35,36]. Therefore, it is evident and absolutely essential to either set the radiation conditions properly (i.e., monitor the temperature during the process and prevent overheating) and/or provide an adequate microbiome for the digestion after pre-treatment, for example with the addition of seed sludge.
Scientific research has not extensively investigated either the change in rheological properties or the change in dielectric behavior during the anaerobic digestion of sludge, despite the important information they might provide. The measurement of these two parameters can deliver alternative monitoring techniques to the commonly used ones in regard to AD, for example, GC, HPLC, spectrometry, or microbial analysis [37]. The importance of this is that it may provide useful and easily obtainable information about the state of the whole fermentation, and can indicate if an intervention is needed in the process due to unexpected changes or circumstances, e.g., the microbial growth is not sufficient, or the biogas yield falls below expectations, etc.
One of our main research goals was to investigate two laboratory-scale monitoring methods—namely the measurement of dielectric parameters and absolute viscosity of the fermentation medium—to see whether they are applicable to determine the various phases mentioned above during anaerobic digestion. We wanted to seek any connection between the values obtained for absolute viscosity, dielectric constant and dielectric loss factor and the overall biogas volume during the fermentation process to prove whether they were applicable alternatives in monitoring the process of AD. Another main aim of ours was to investigate how microwave irradiation can affect the anaerobic fermentation of sludge, and how it may change the investigated parameters (dielectric properties, viscosity, and biogas yield) that we intended to characterize the AD process with.
2. Materials and Methods
For the anaerobic digestion experiments, meat industry-based wastewater-sludge (MIWS) was used as a substrate originaing from a local meat-processing factory (Pick Szeged Zrt., Szeged, Hungary). The base characteristics of the MIWS were determined with standard analytical methods, and the results are presented in Table 1.
Before the anaerobic incubation, both the control samples and those that were affected by microwave irradiation were supplemented with seed sludge (originating from inoculum) in a volume of 10 cm3 to provide an adequate microbial environment for the fermentation. Naturally, the irradiated samples were supplemented with seed sludge after the MW pre-treatment to avoid the potential inactivation of microbial cells. Therefore, the AD experiments were carried out in a total volume of 110 cm3 of the fermentation medium in each case.
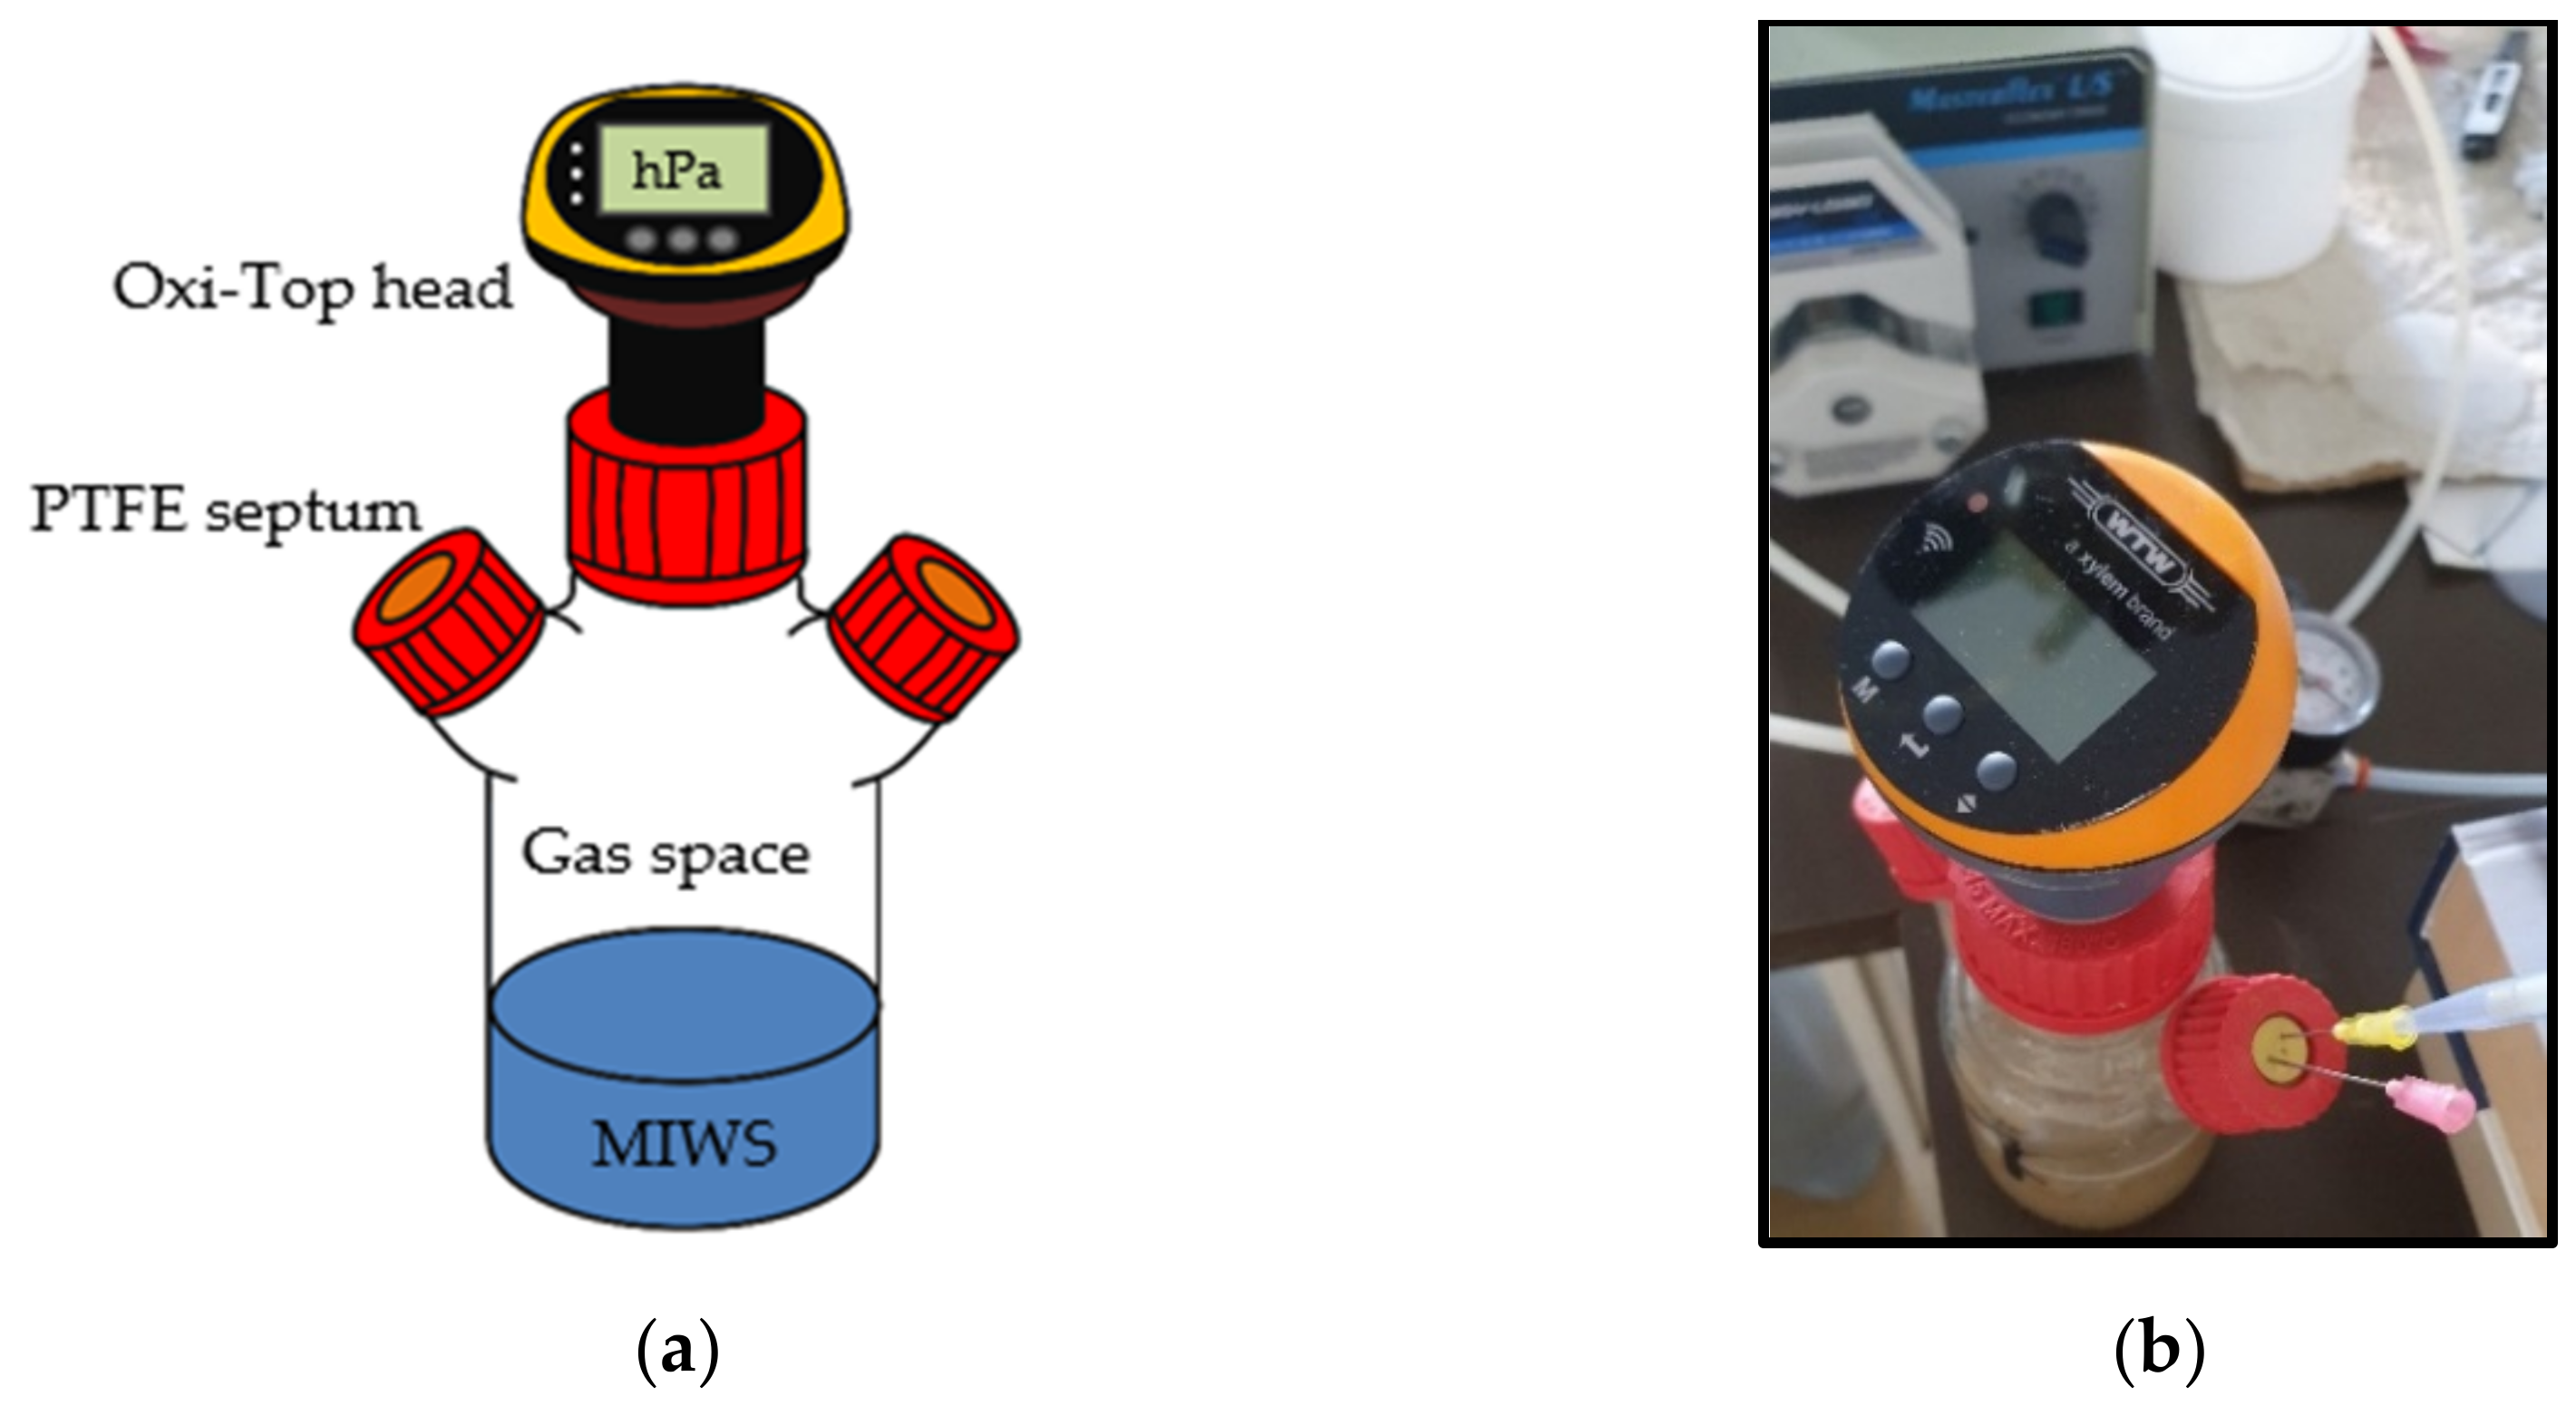
AD itself took place in laboratory-grade 250 cm3 anaerobic fermenters, sealed by PTFE septum, and on the top of the glass bottles, automatic manometric measuring heads (Oxi-Top IDS/B, WTW) were placed to measure the absolute pressure during the fermentation (Figure 2a). To ensure the anaerobic conditions, nitrogen gas was injected into the fermenters for a time duration of 3–4 min through the septum, as can be observed in Figure 2b.
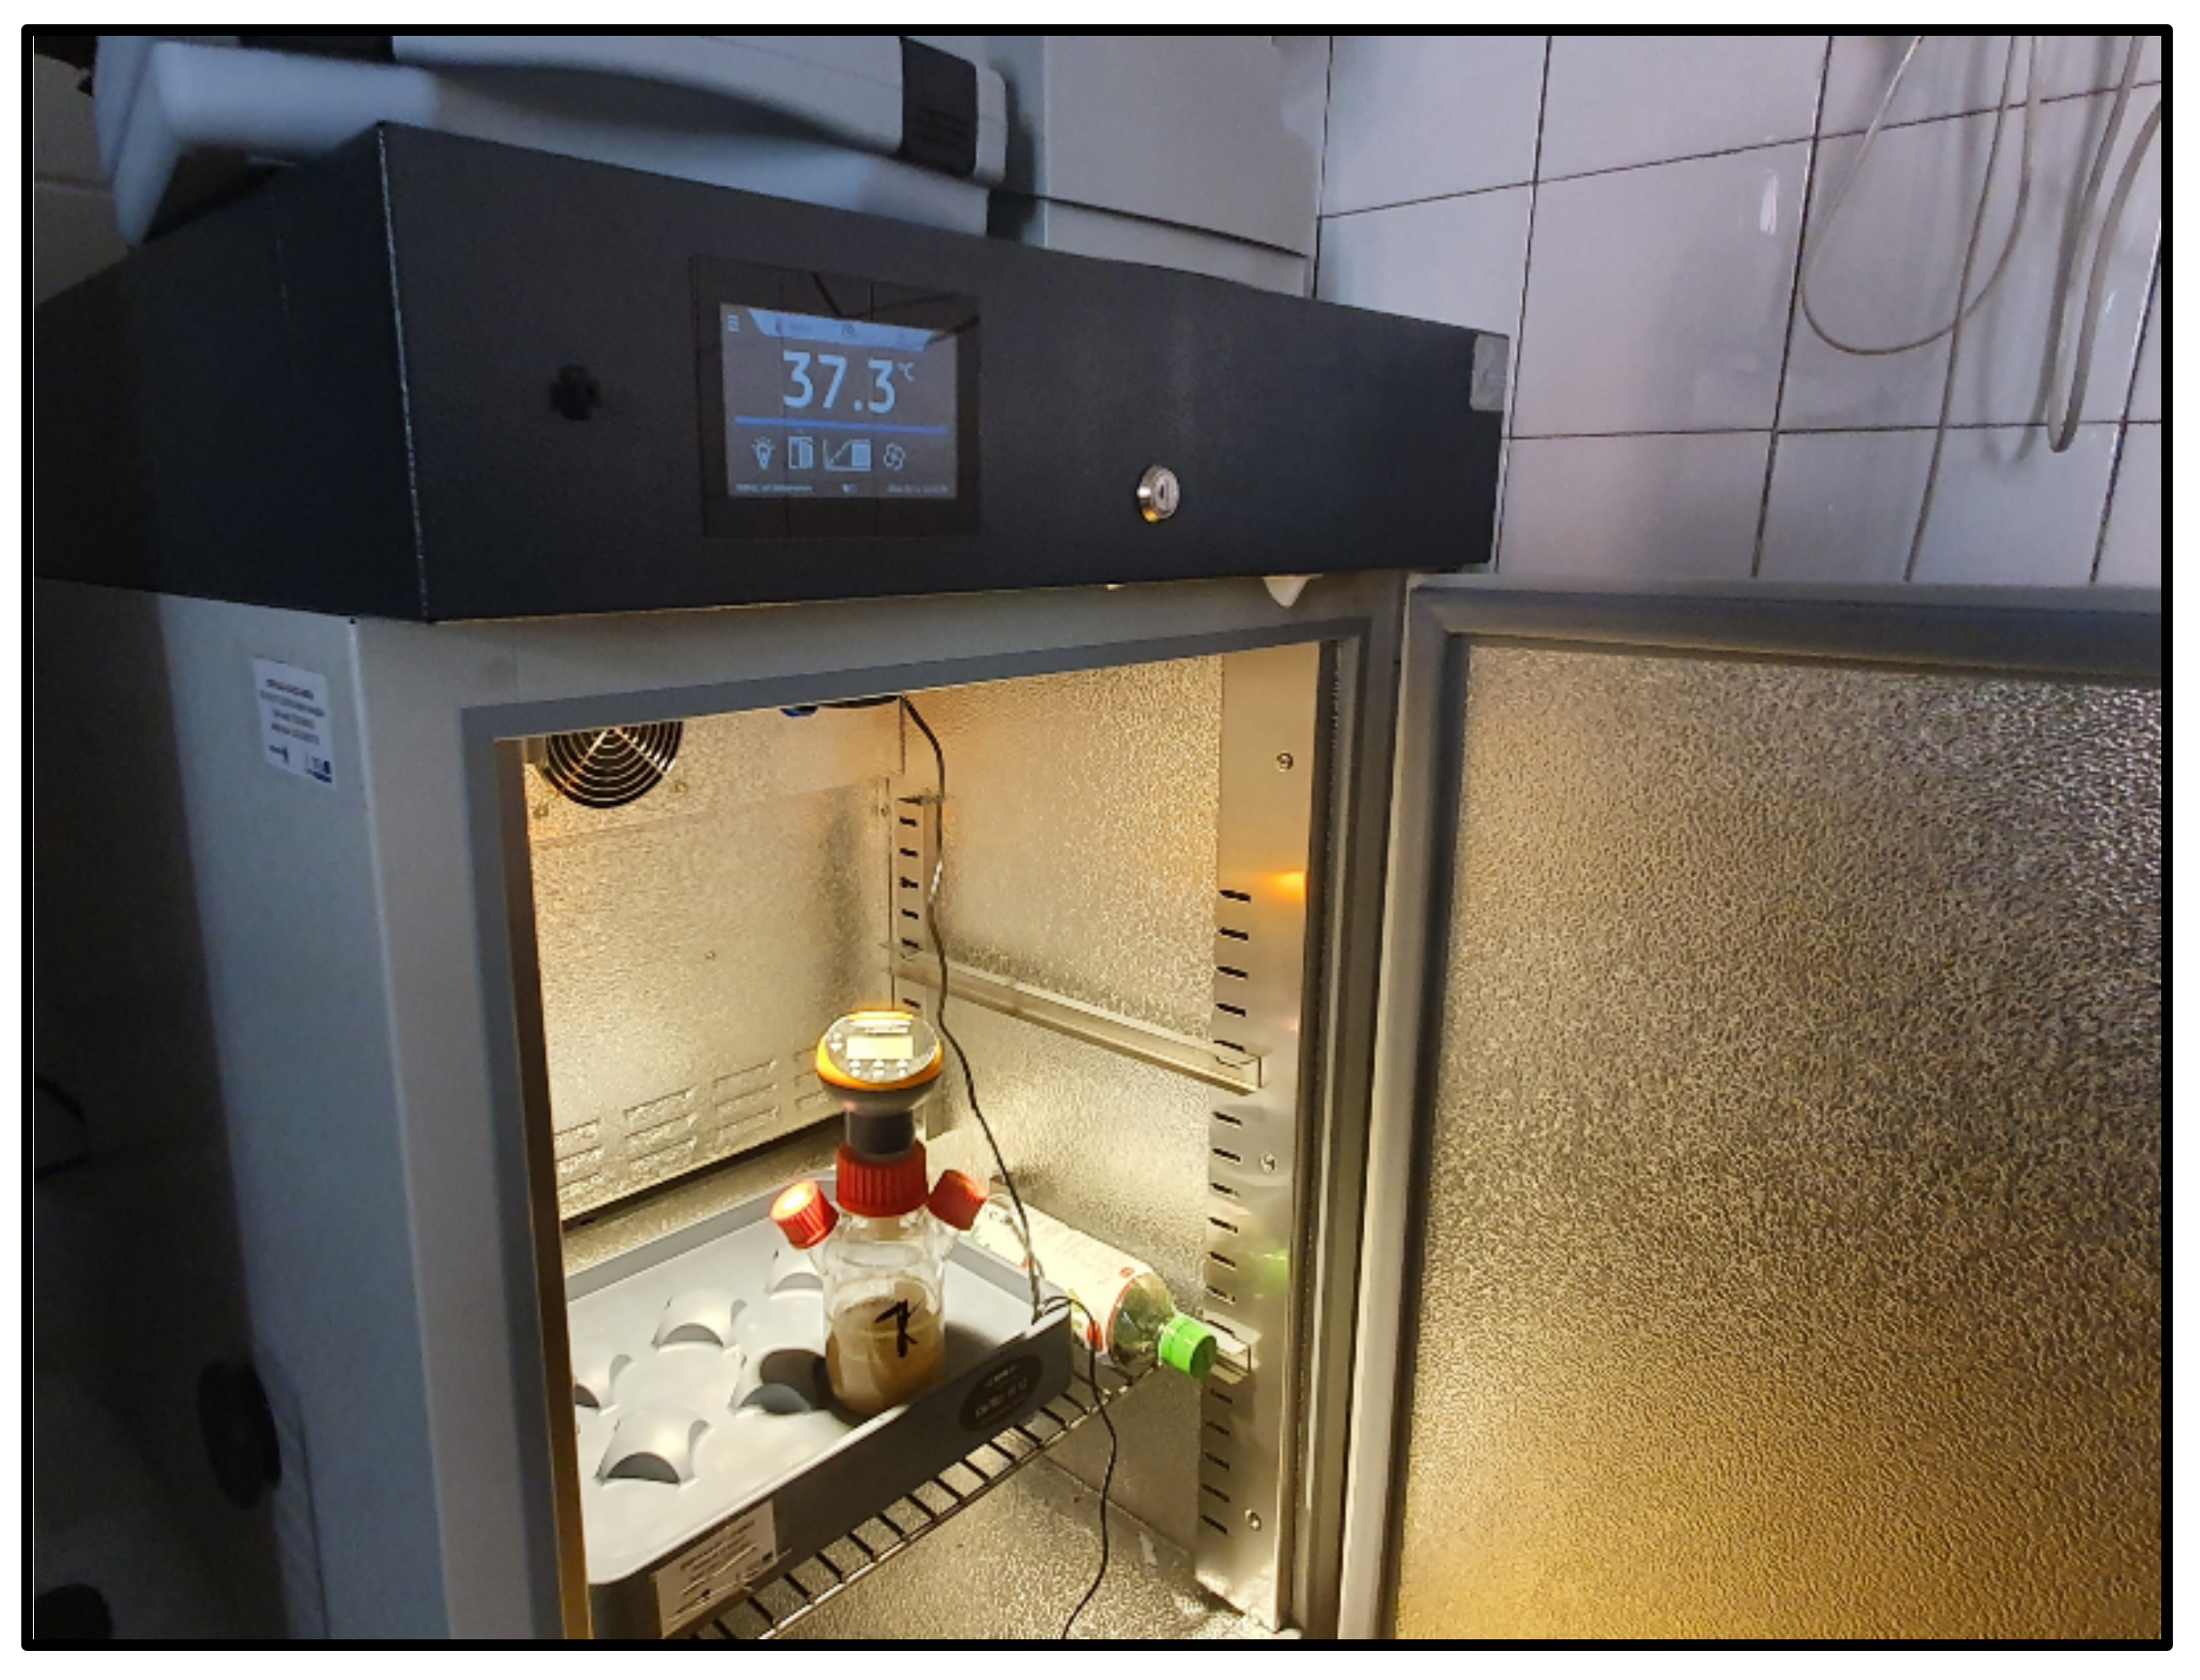
After the injection, the fermenter was placed in a thermostatic cabinet which kept the temperature at a constant value of 38.0 ± 0.5 °C. During AD, the sludge was constantly stirred with a magnetic stirrer to grant homogeneity (Figure 3).
The Oxi-Top measuring heads can continuously measure the absolute pressure generated inside the glass vessels, and store the values at predefined time intervals, for which we chose every 24–48 h. Because of the limited gas space, measuring limit of the heads, and the batch arrangement, the nascent biogas was released every 48 h, practically when the dielectric and rheological measurements took place (naturally, after these measurements, nitrogen was injected again into the fermenters to ensure and maintain anaerobic conditions). Therefore, it was necessary to calculate the cumulating biogas yield based upon the obtained pressure values, which was performed according to the modified ideal gas law:
In the equation, pabs indicates the absolute pressure inside the fermenter [Pa], Vgas is the volume of the gas space [cm3], Tn is the normal temperature (20 °C), patm is the atmospheric pressure (105 Pa), and Tf is the fermentation temperature (38 °C).
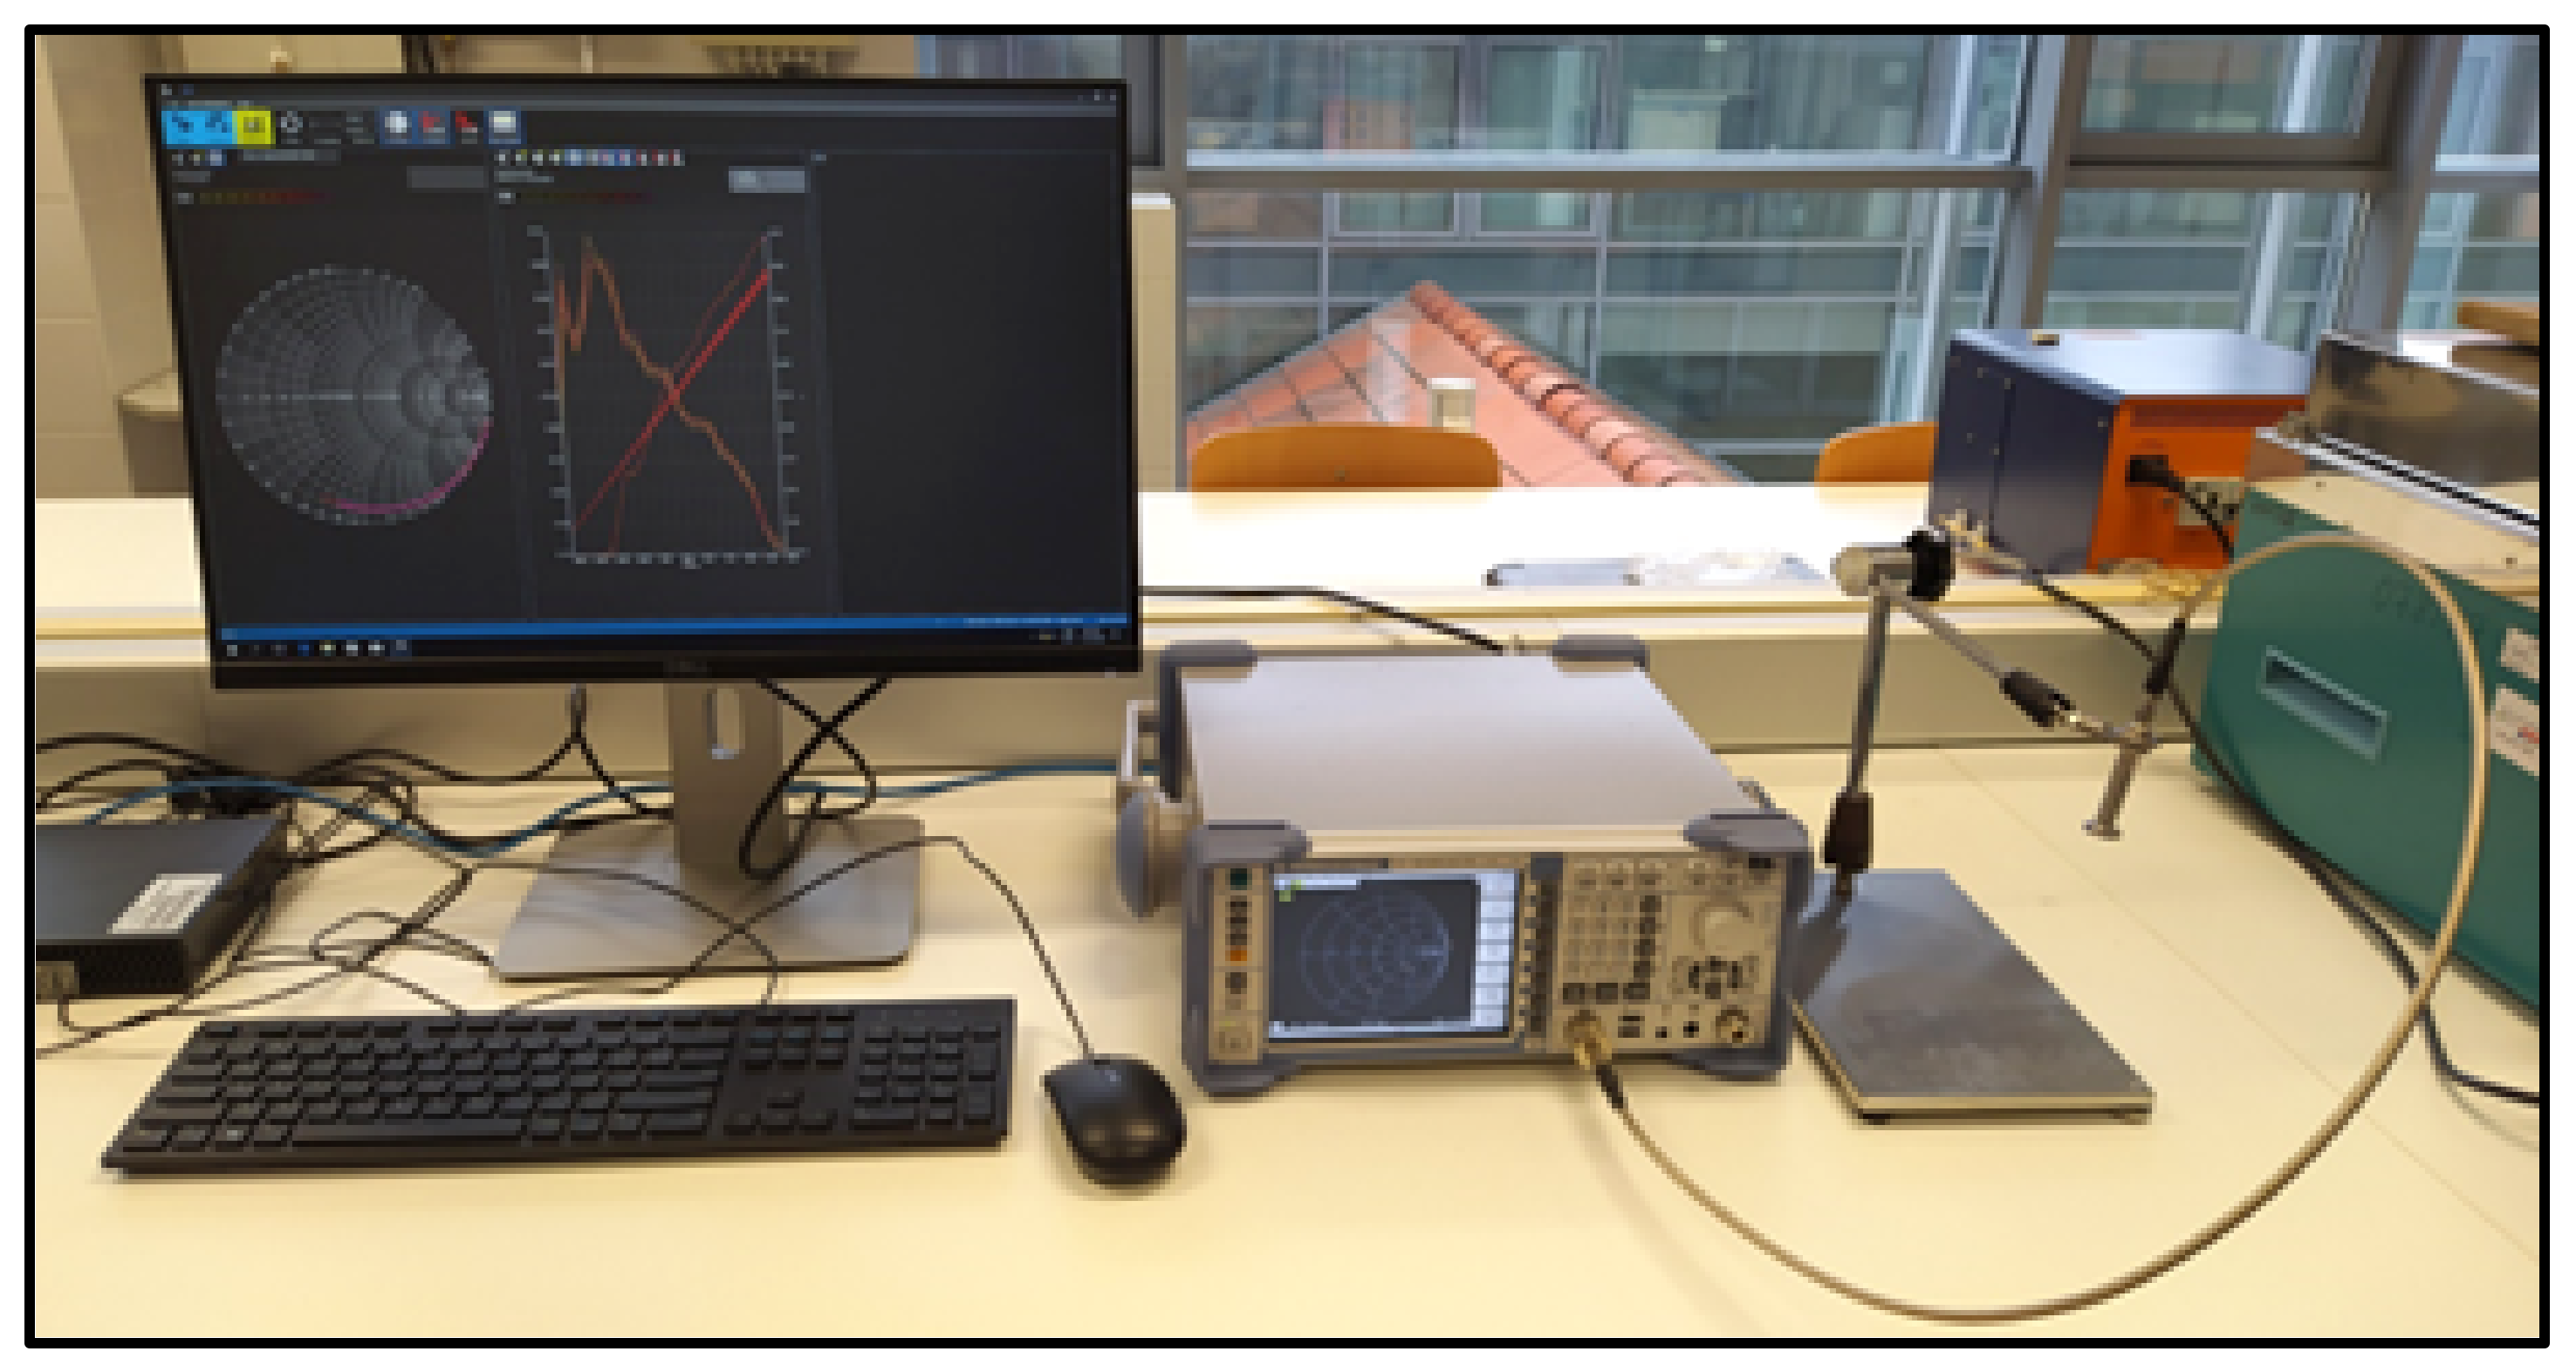
The dielectric properties (dielectric constant, ε′ and the dielectric loss factor, ε″) were measured every 48 h during AD with a DAK 3.5 (SPEAG, Zurich, Switzerland) open-ended coaxial dielectric probe, connected to a ZVL-3 (Rhode&Schwarz, Munich, Germany) vector network analyzer in the frequency range of 200–2400 MHz (Figure 4). The processing of the obtained data was achieved by the measurement-data collection and analysis software of SPEAG DAK. Every value represents an average of 30 consequent measurements. Since dielectric parameters depend on the temperature of a material, the fermentation liquid was kept at 38 °C during the measurement with a water bath, and the calibration was also conducted at 38 °C. The immersion depth of the sensor was 15 mm in each case.
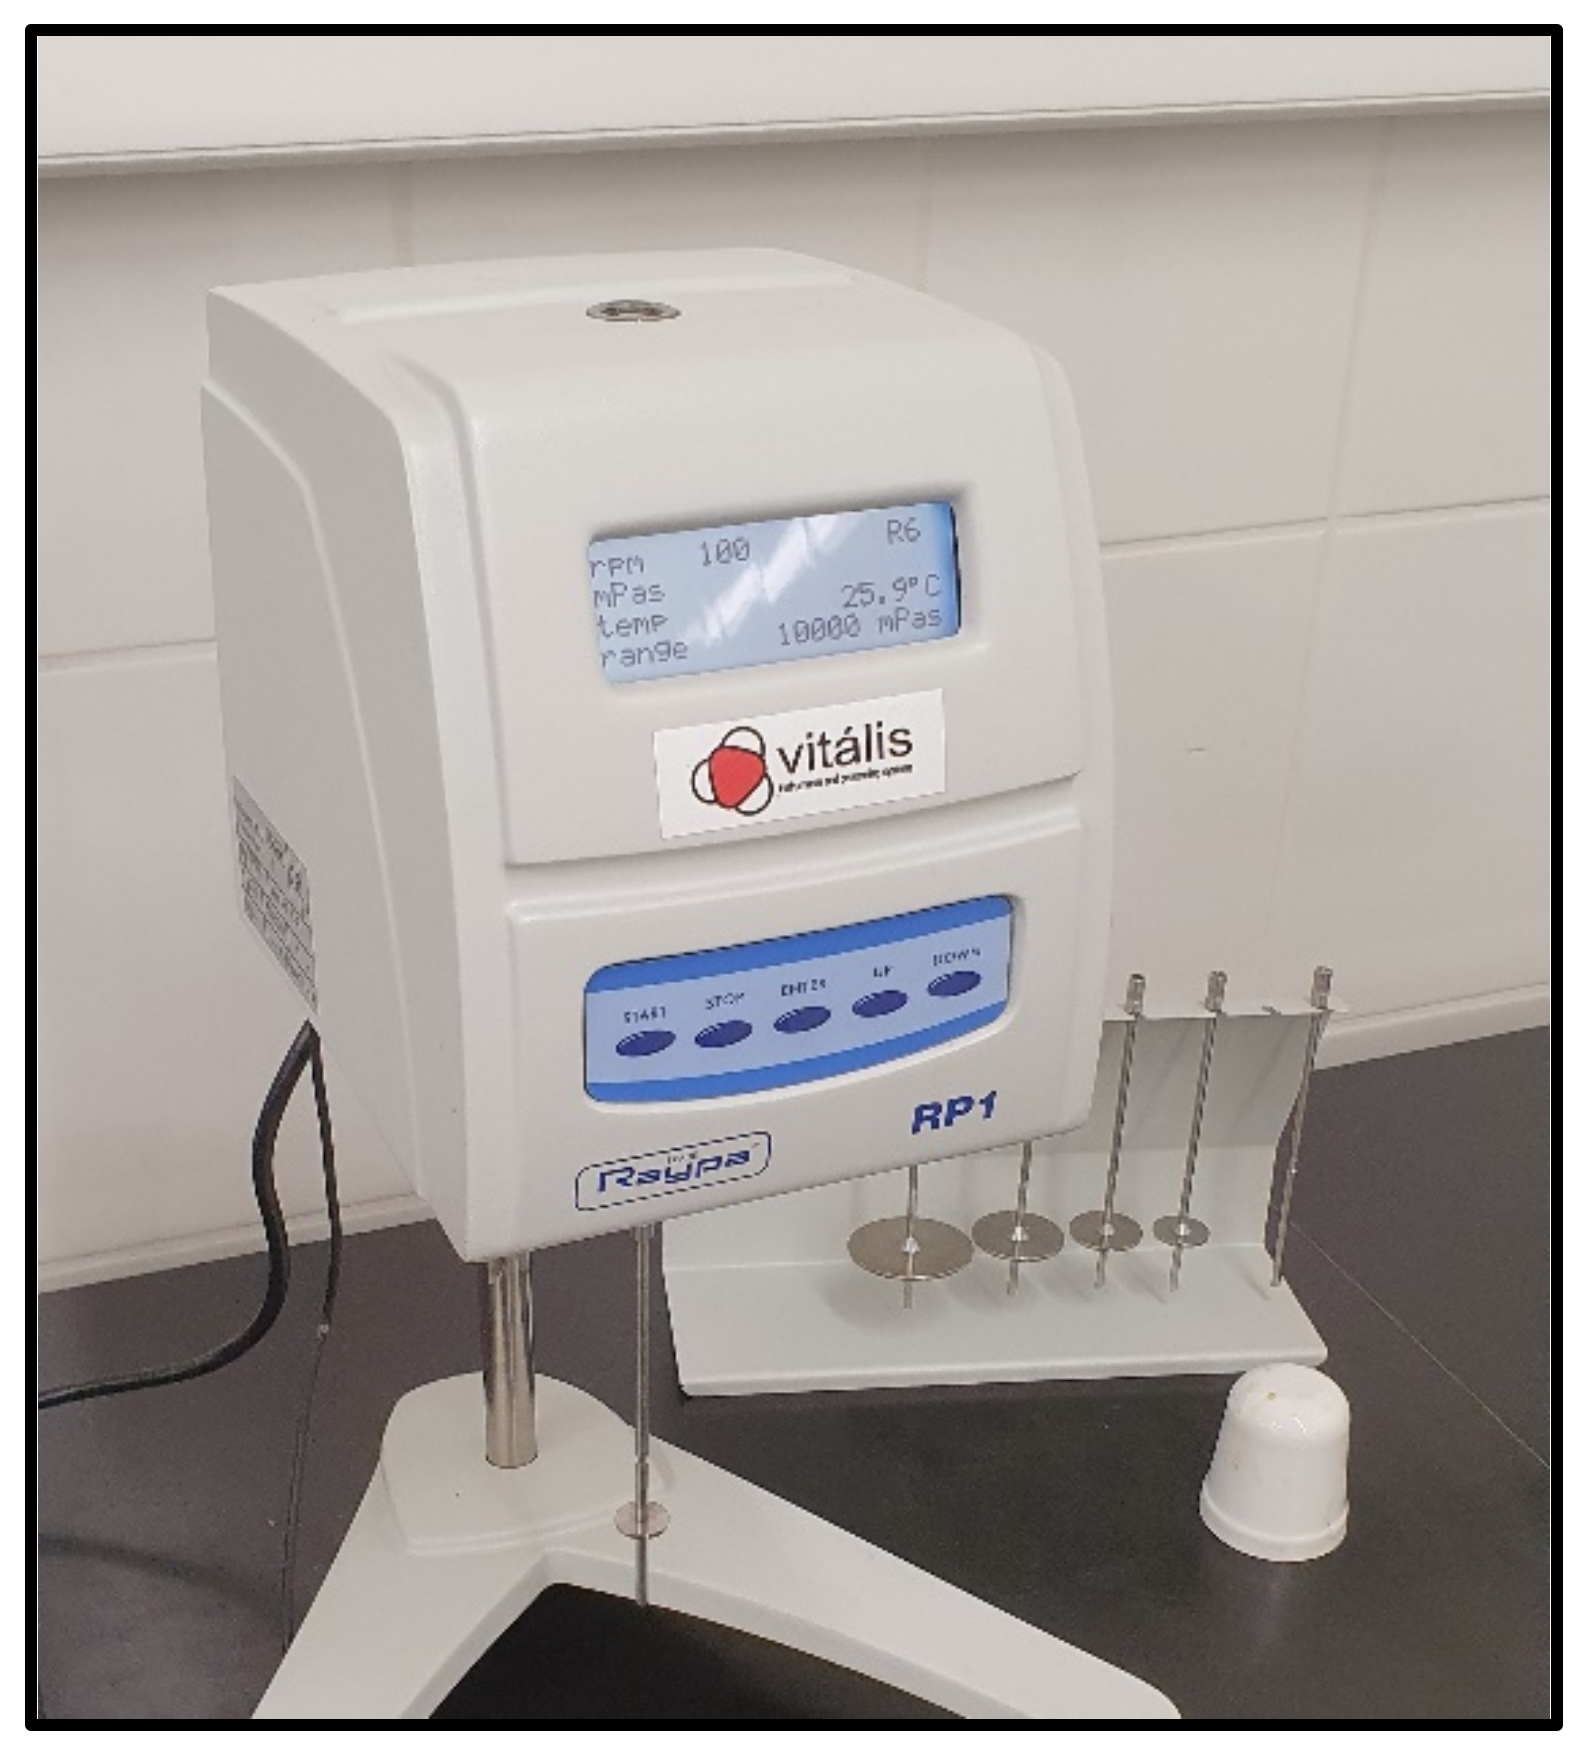
Measurement of absolute viscosity of the fermentation liquid was carried out with an RP1 (Raypa, Barcelona, Spain) rotational viscometer (Figure 5), which provides measurability in the viscosity range of 20–13 × 106 mPa·s with 6 different spindles and 19 speed levels. For our experiments, a type of R6 spindle was used (20–10,000 mPa·s) at 200 rpm in every case, and the temperature of the fermentation media was kept at 38 °C.
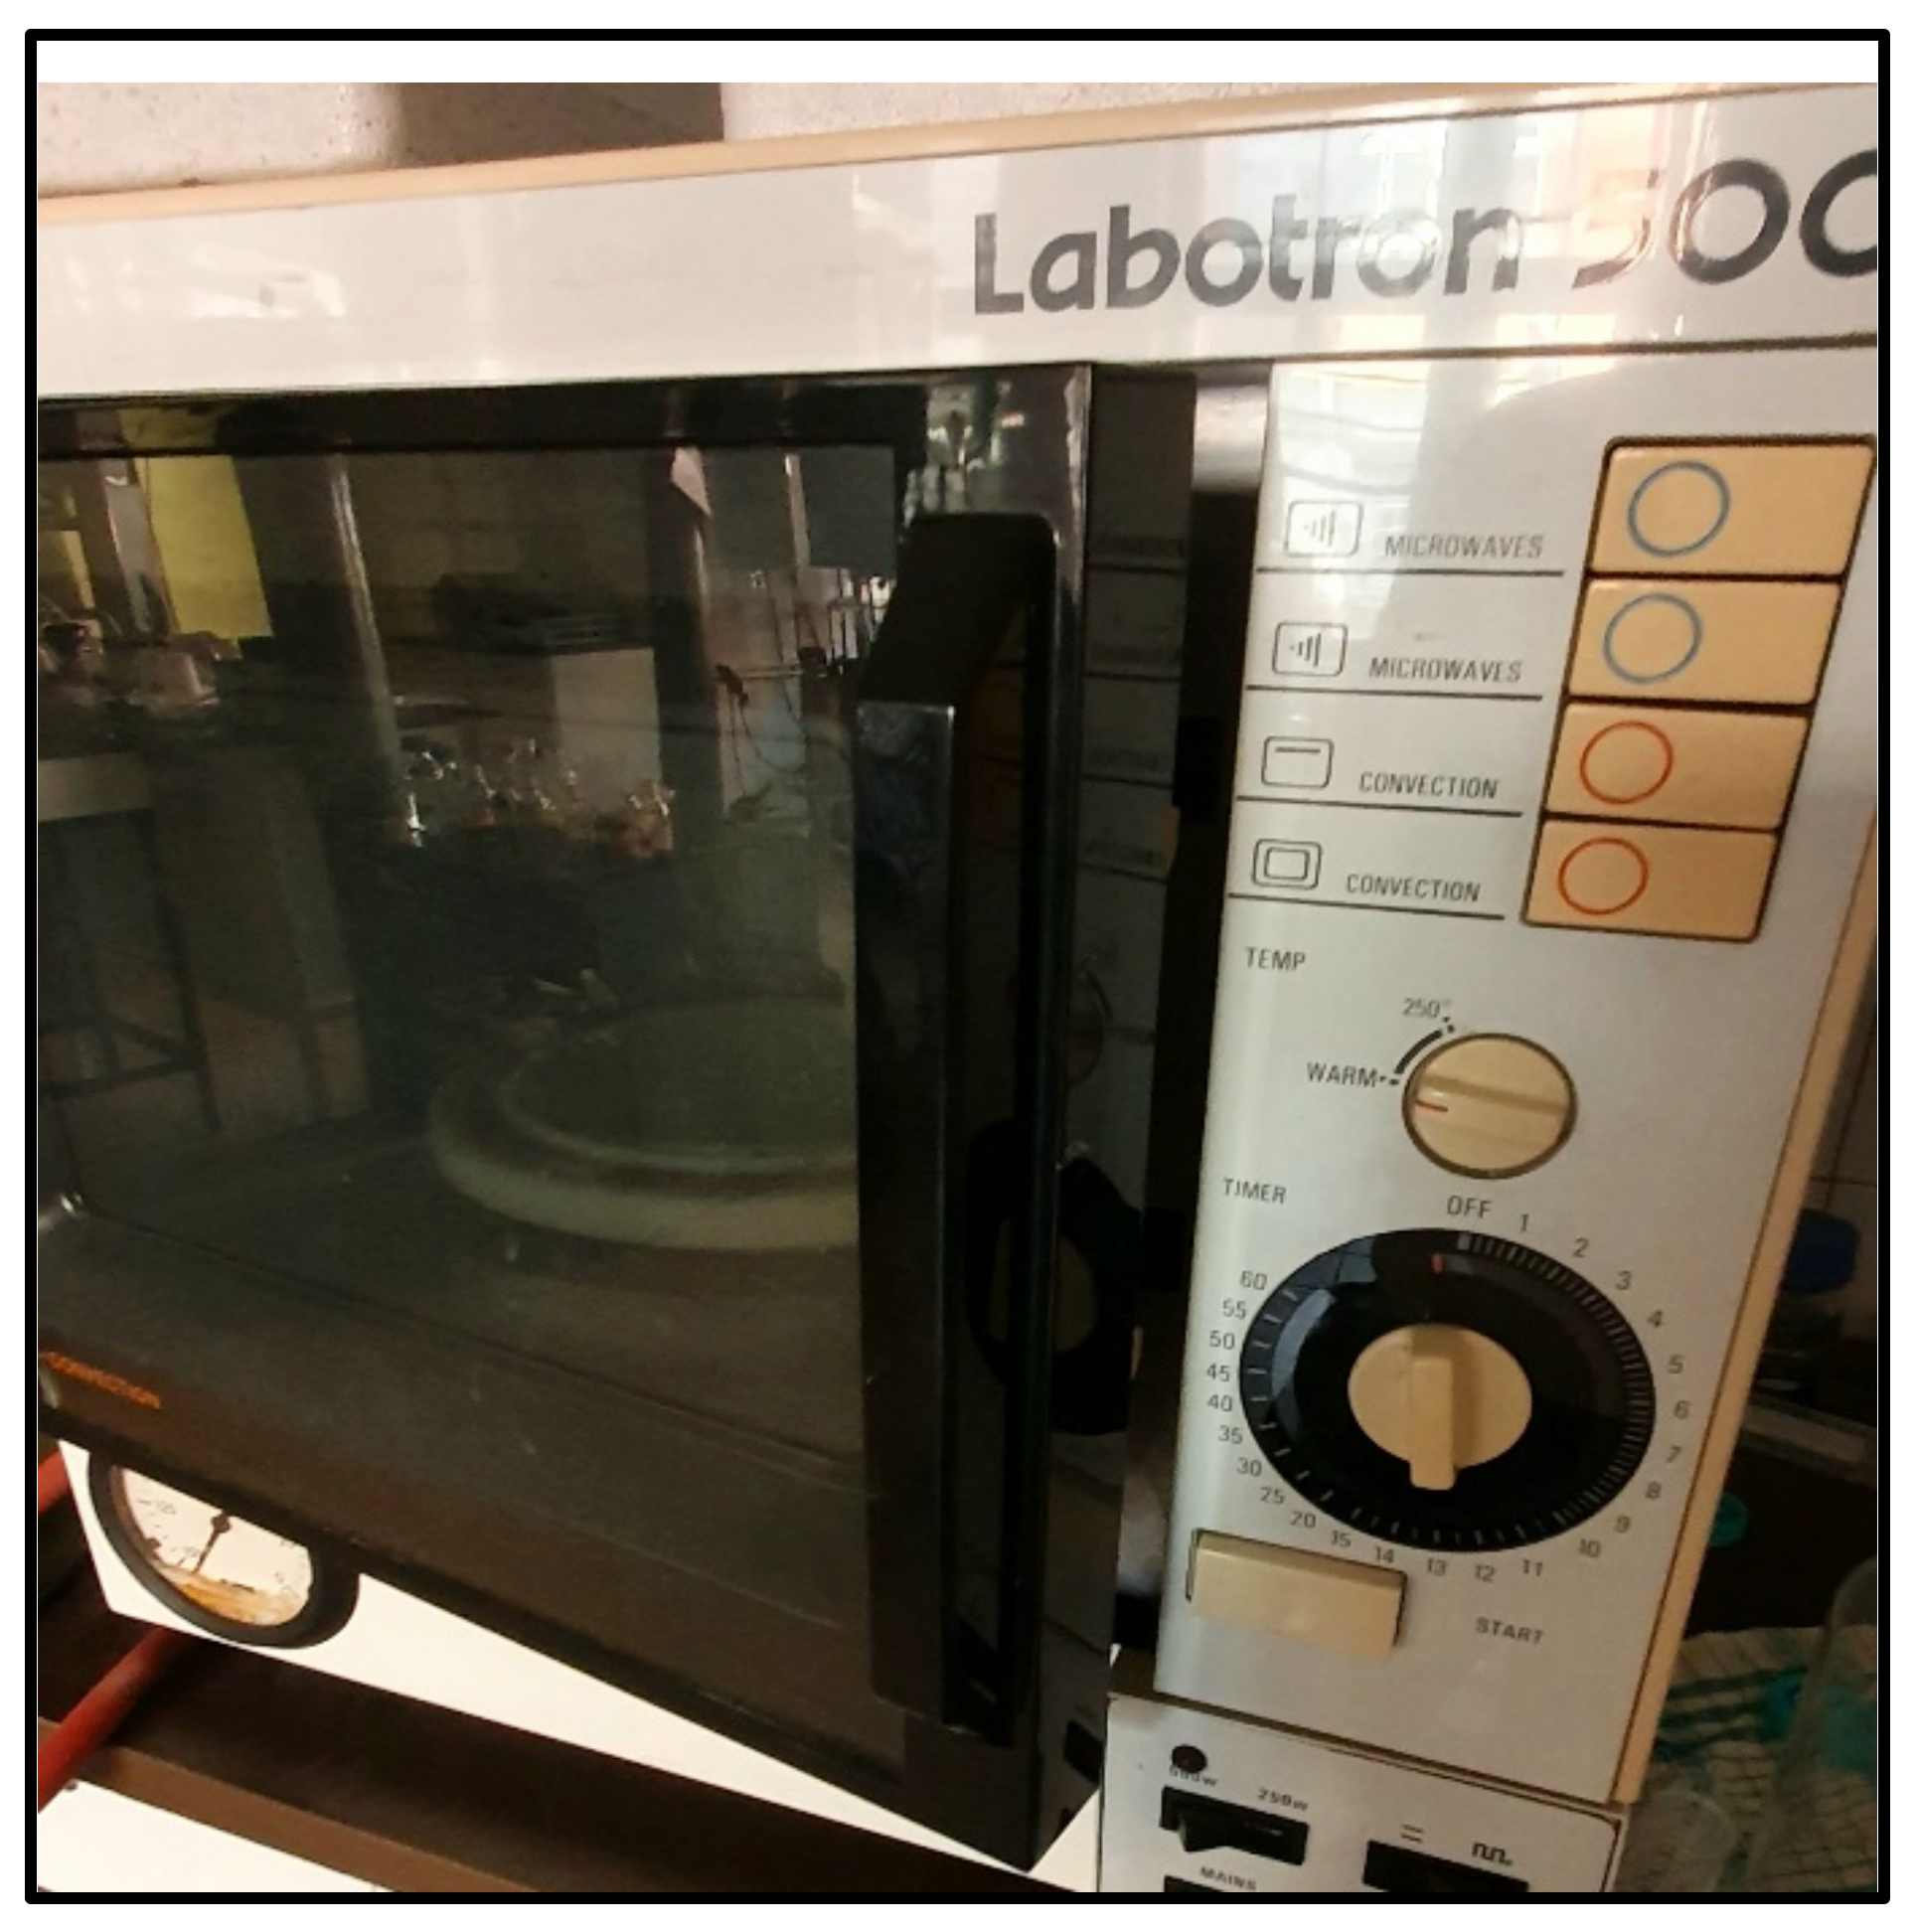
Since the scope of our investigation covered the effects of microwave irradiation on the anaerobic digestion and its certain properties, in the second series of the experiments the same volume of sludge sample (100 cm3) was being radiated by microwaves prior to the AD. Microwave treatment was carried out in a Labotron 500 laboratory batch microwave, which generates EMWs at 2.45 GHz frequency, and can be set at two different levels of power, 250 and 500 W (Figure 6). The microwave delivers the preset power with a continuously radiating magnetron. Based on our previous research data, the sludge sample was pre-treated at p = 250 W with 720 s radiation time in intermittent mode, with a 30–30 s on/off cycle. This means that the effective irradiation time was 360 s, and the total specific microwave energy was 0.9 kJ/cm3.
After MW treatment, the inoculum seed sludge was added to the MIWS in a volume of 10 cm3, as also performed in the case of the control sample. Afterwards, the exact same preparatory steps, fermentation conditions and measurement methods discussed above were applied to the MW-treated samples.
3. Results and Discussion
3.1. Biogas Yield and Absolute Viscosity
In this part of our experiments, we investigated the applicability of viscosity measurement to both control and MW-treated samples, and also examined how microwave irradiation affects the biogas production dynamics.
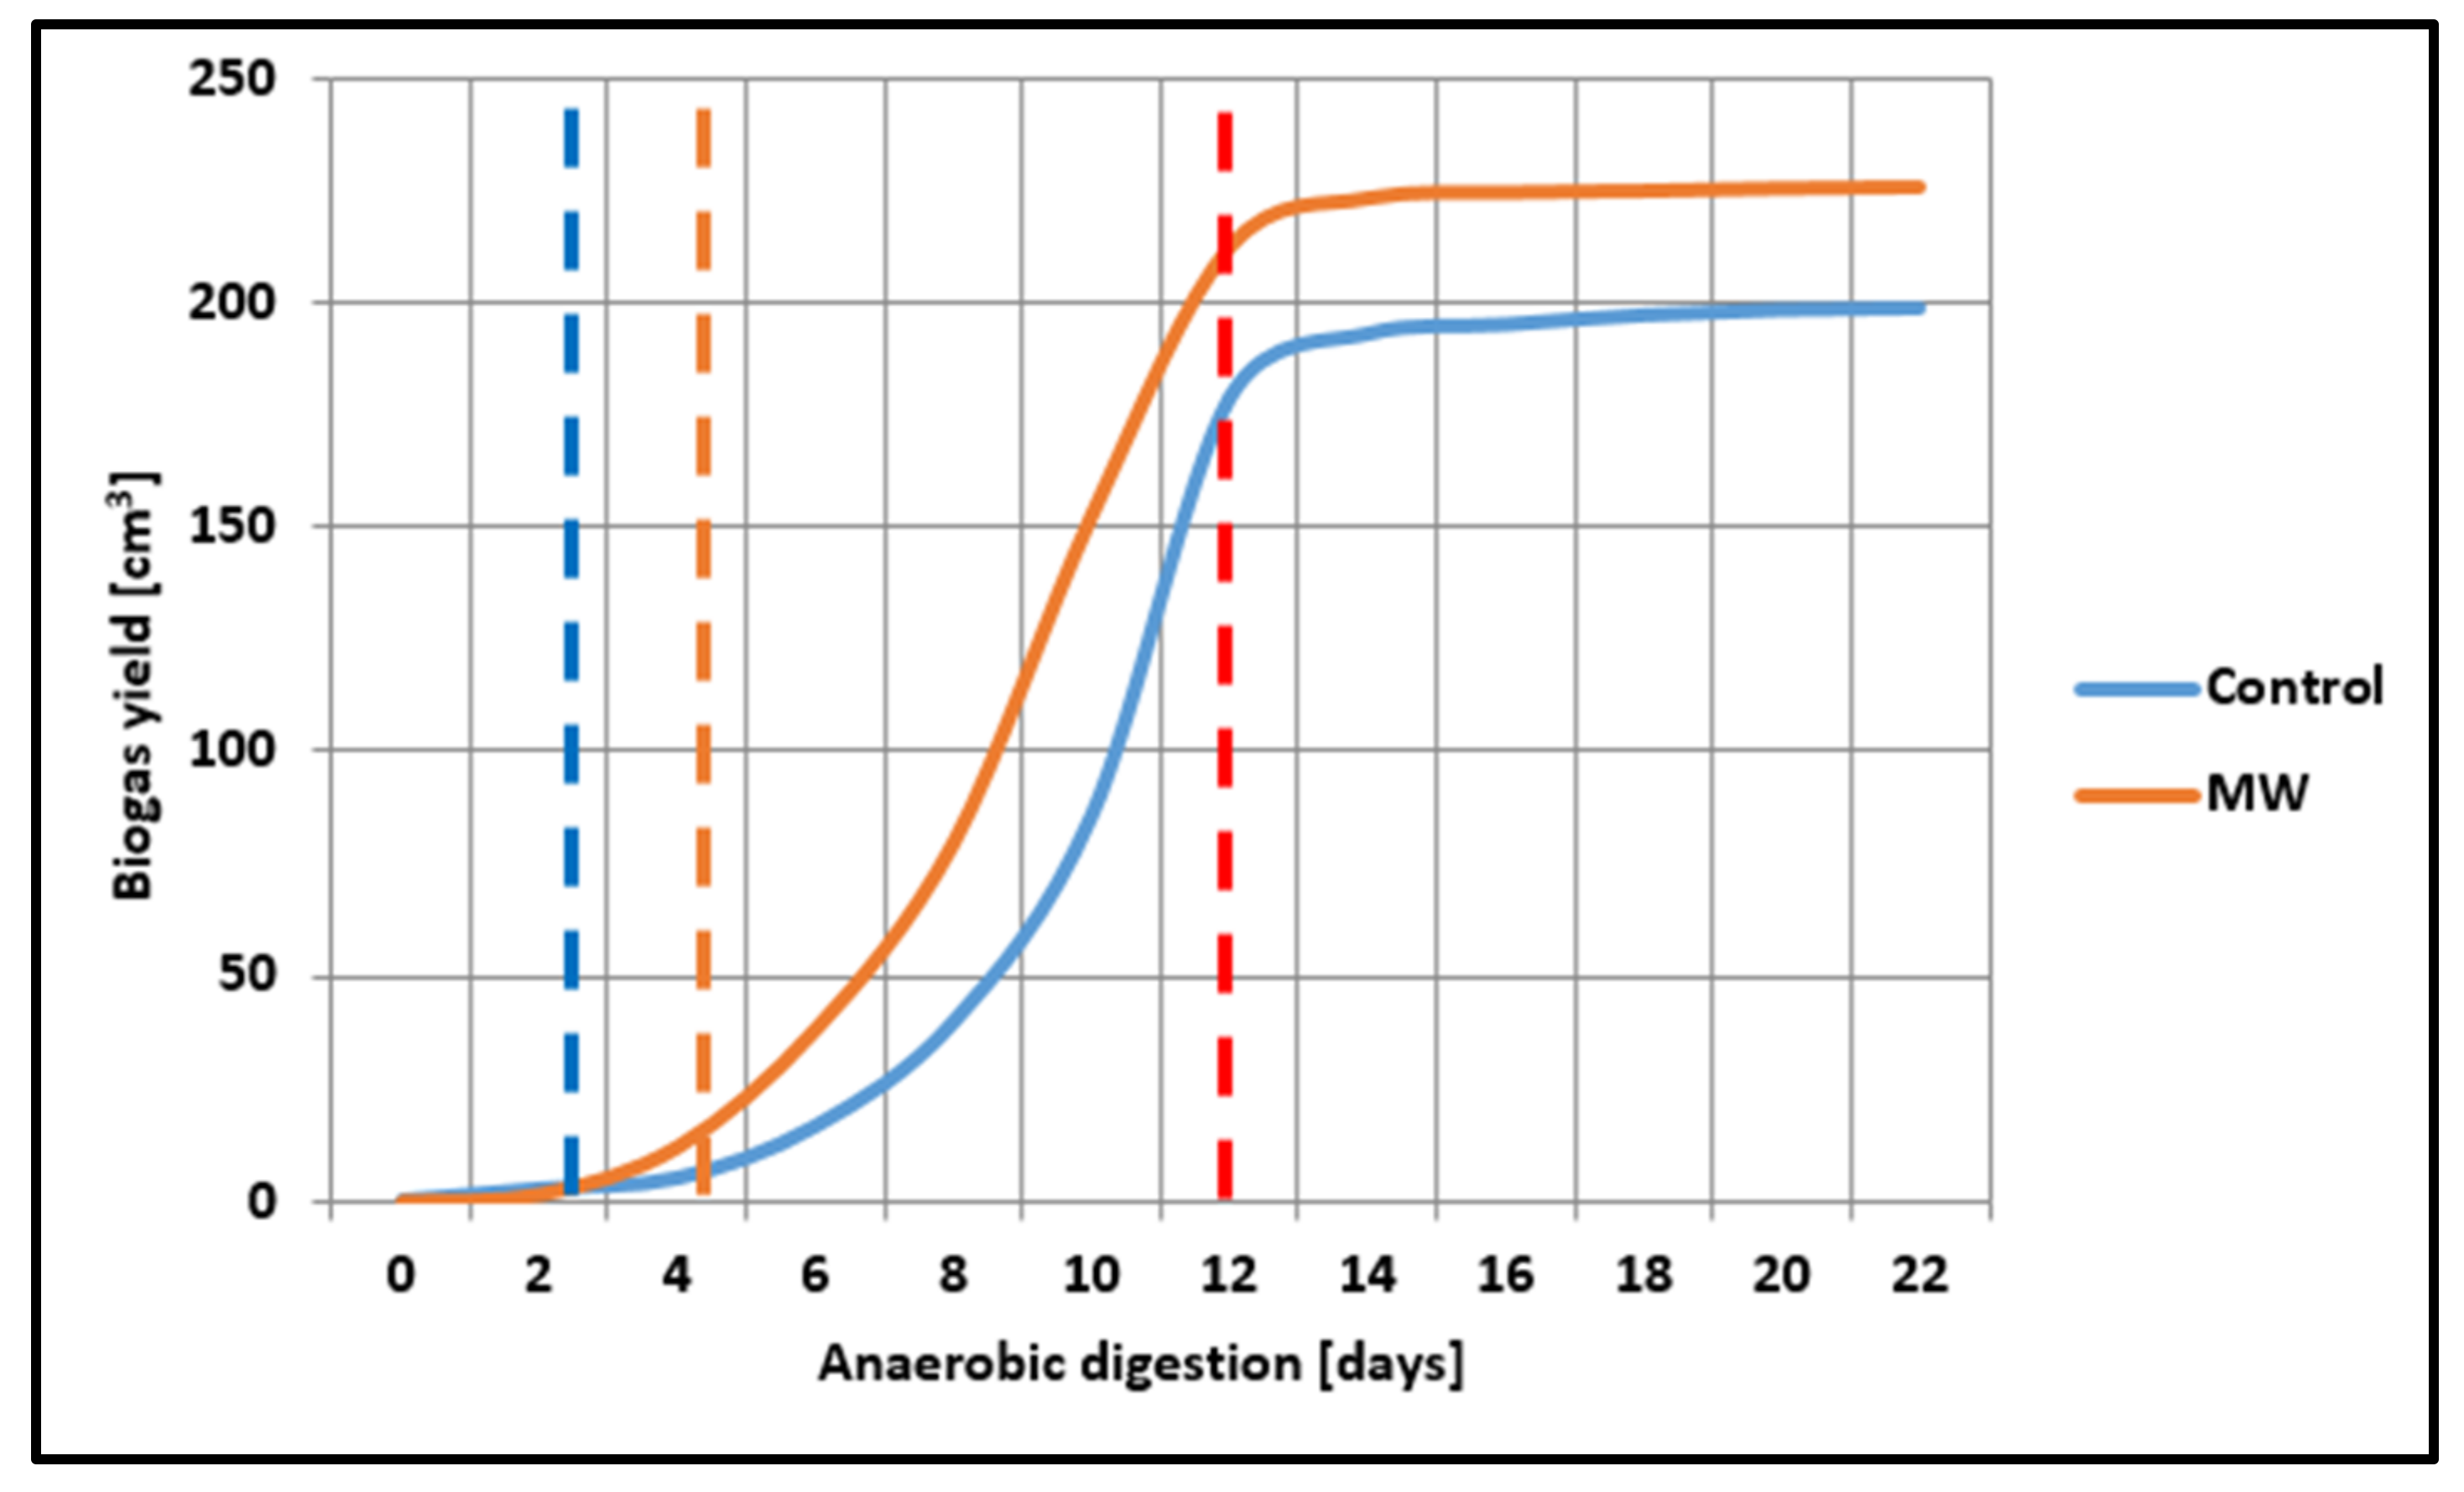
Figure 7 represents the data obtained for the biogas yield (i.e., cumulating biogas volume) during the anaerobic digestion. It can be seen that the biogas production dynamics follow the stages represented in Figure 1 (except for the decline stage, which is due to the 20-day-long fermentation period) for both the control and MW-treated sample. That is, after a rather short lag phase, an easily identifiable log phase is presented and at around day 10–12, the stationary phase sets. The effects of microwave pre-treatment can be clearly described based on the data represented in Figure 6. The overall biogas yield was higher during the whole fermentation process, and the additional achievable volume was approx. 14%, compared to the control sample (cf. 226.1 cm3 vs. 198.5 cm3). The microwave treatment also shortened the lag and the log phase by 1–2 days, meaning that the microbes could adapt to the fermentation environment more easily, and the reproduction rate was also higher. The possible reason behind this is that microwave irradiation, even though it does not carry enough energy to chemically modify the medium, most definitely took part in the disintegration of the MIWS. Thus, it improved the bioavailability of certain components for the digesting bacteria via the decomposition of cells and flocks presented in sludge [38]. This can also explain why the maximum in the biogas yield was only 14% higher in the pre-treated samples: meaning that the chemical composition was basically the same for the control and the MW-treated samples, but the obtainability was clearly better during the latter. Shortening the lag and the log phase is favorable in industrial scale applications as well as it can reduce the overall incubation time, and thus, also reduce the maintenance costs.
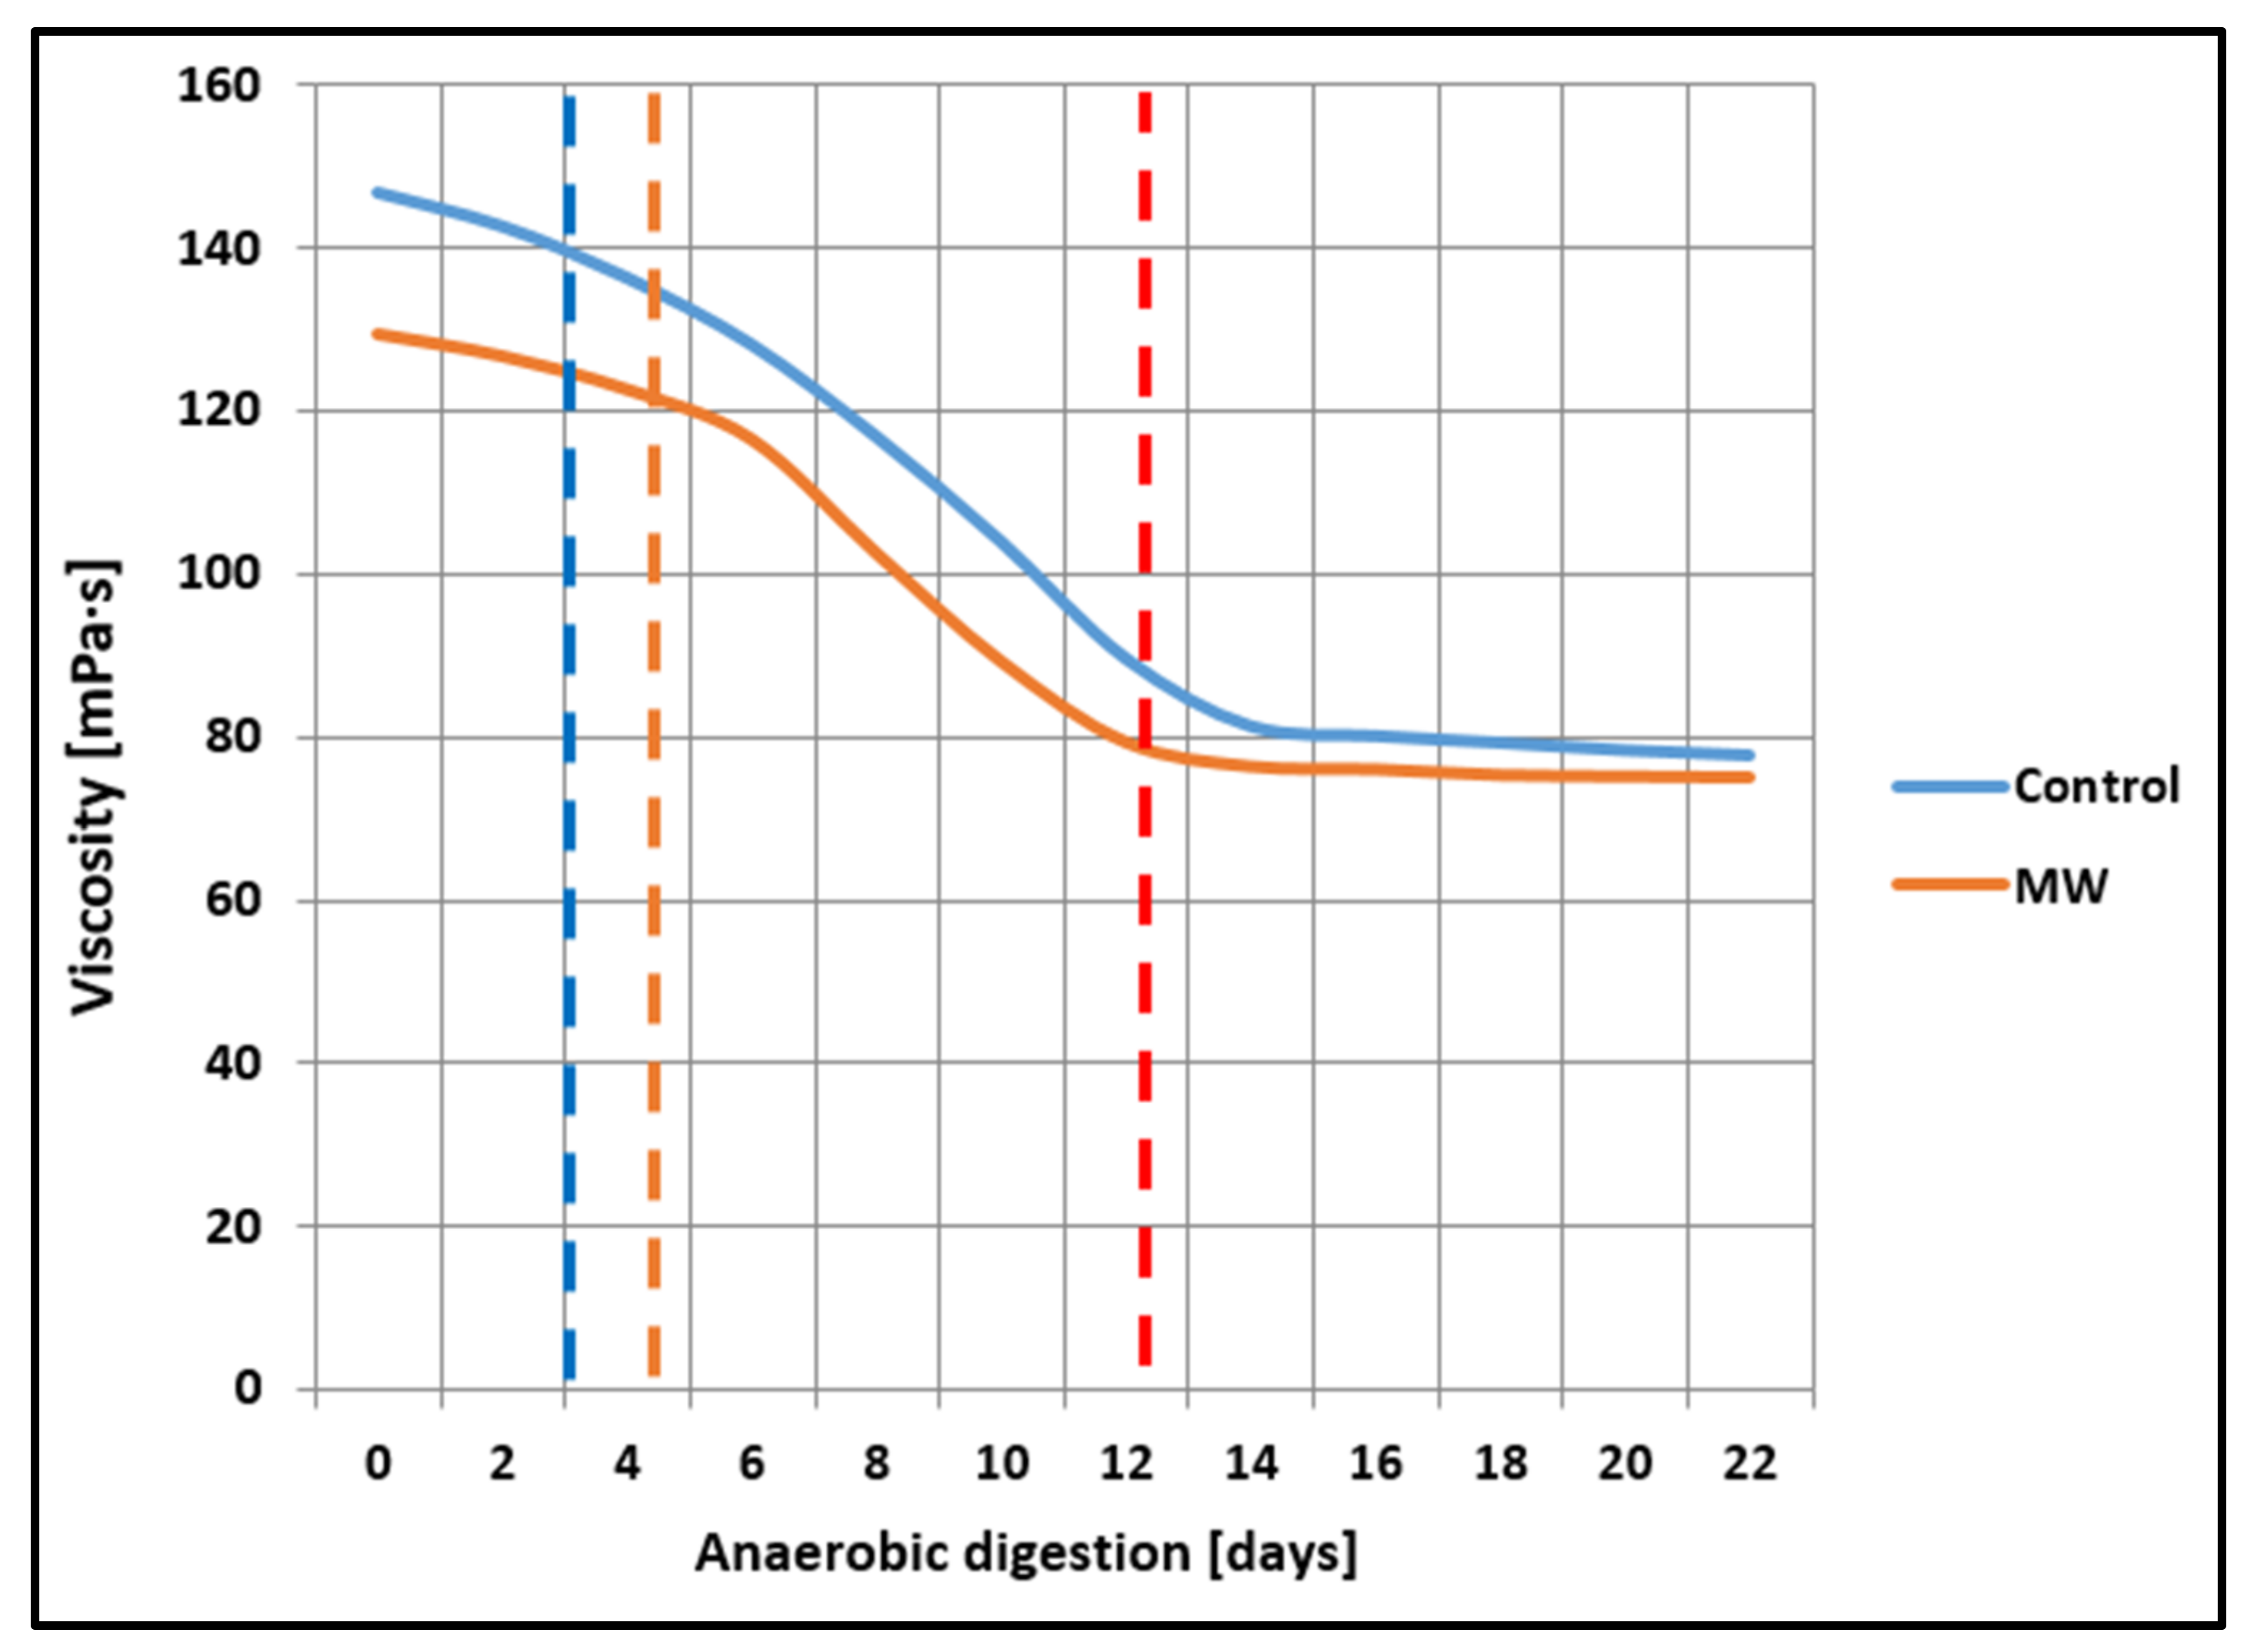
Figure 8 shows the data obtained for the change in the values of absolute viscosity during the fermentation process. It can be seen that both during the digestion of the control and MW-treated samples the viscosity declines gradually, and three different phases/sections can be observed. These stages share strong similarities in tendency with the curves of the biogas yield. This means that the decrease in viscosity occurs accordingly to the lag, log and stationary phase, i.e., during the short lag stage, a low rate of decline can be seen in the values of absolute viscosity, and after that, during the log phase, an exponential drop can be observed. During the stationary phase of AD, the viscosity also becomes nearly constant. This proves that the biochemical changes and processes that occur in the different stages of AD are in strong connection with the overall viscosity of the fermentation medium. The effects of MW pre-treatment also appear in the rheological properties, i.e., the same tendency was obtained for the change in viscosity, as well as for the biogas production rate regarding the MW-treated MIWS sample. However, the microwave treatment lowered the values of viscosity during the whole process by approximately 13% on average, as expected. That is, the physicochemical and structural changes caused by the irradiated MW energy rendered the fermentation medium more fluent, presumably via the release of some of the bounded water content, and by the disintegration of sludge flocks and microbial cells. By doing so, the sludge sample became more homogenous, and the stirring of the medium became easier, which might have also favorably affected the bioavailability of the necessary components.
3.2. Dielectric Properties
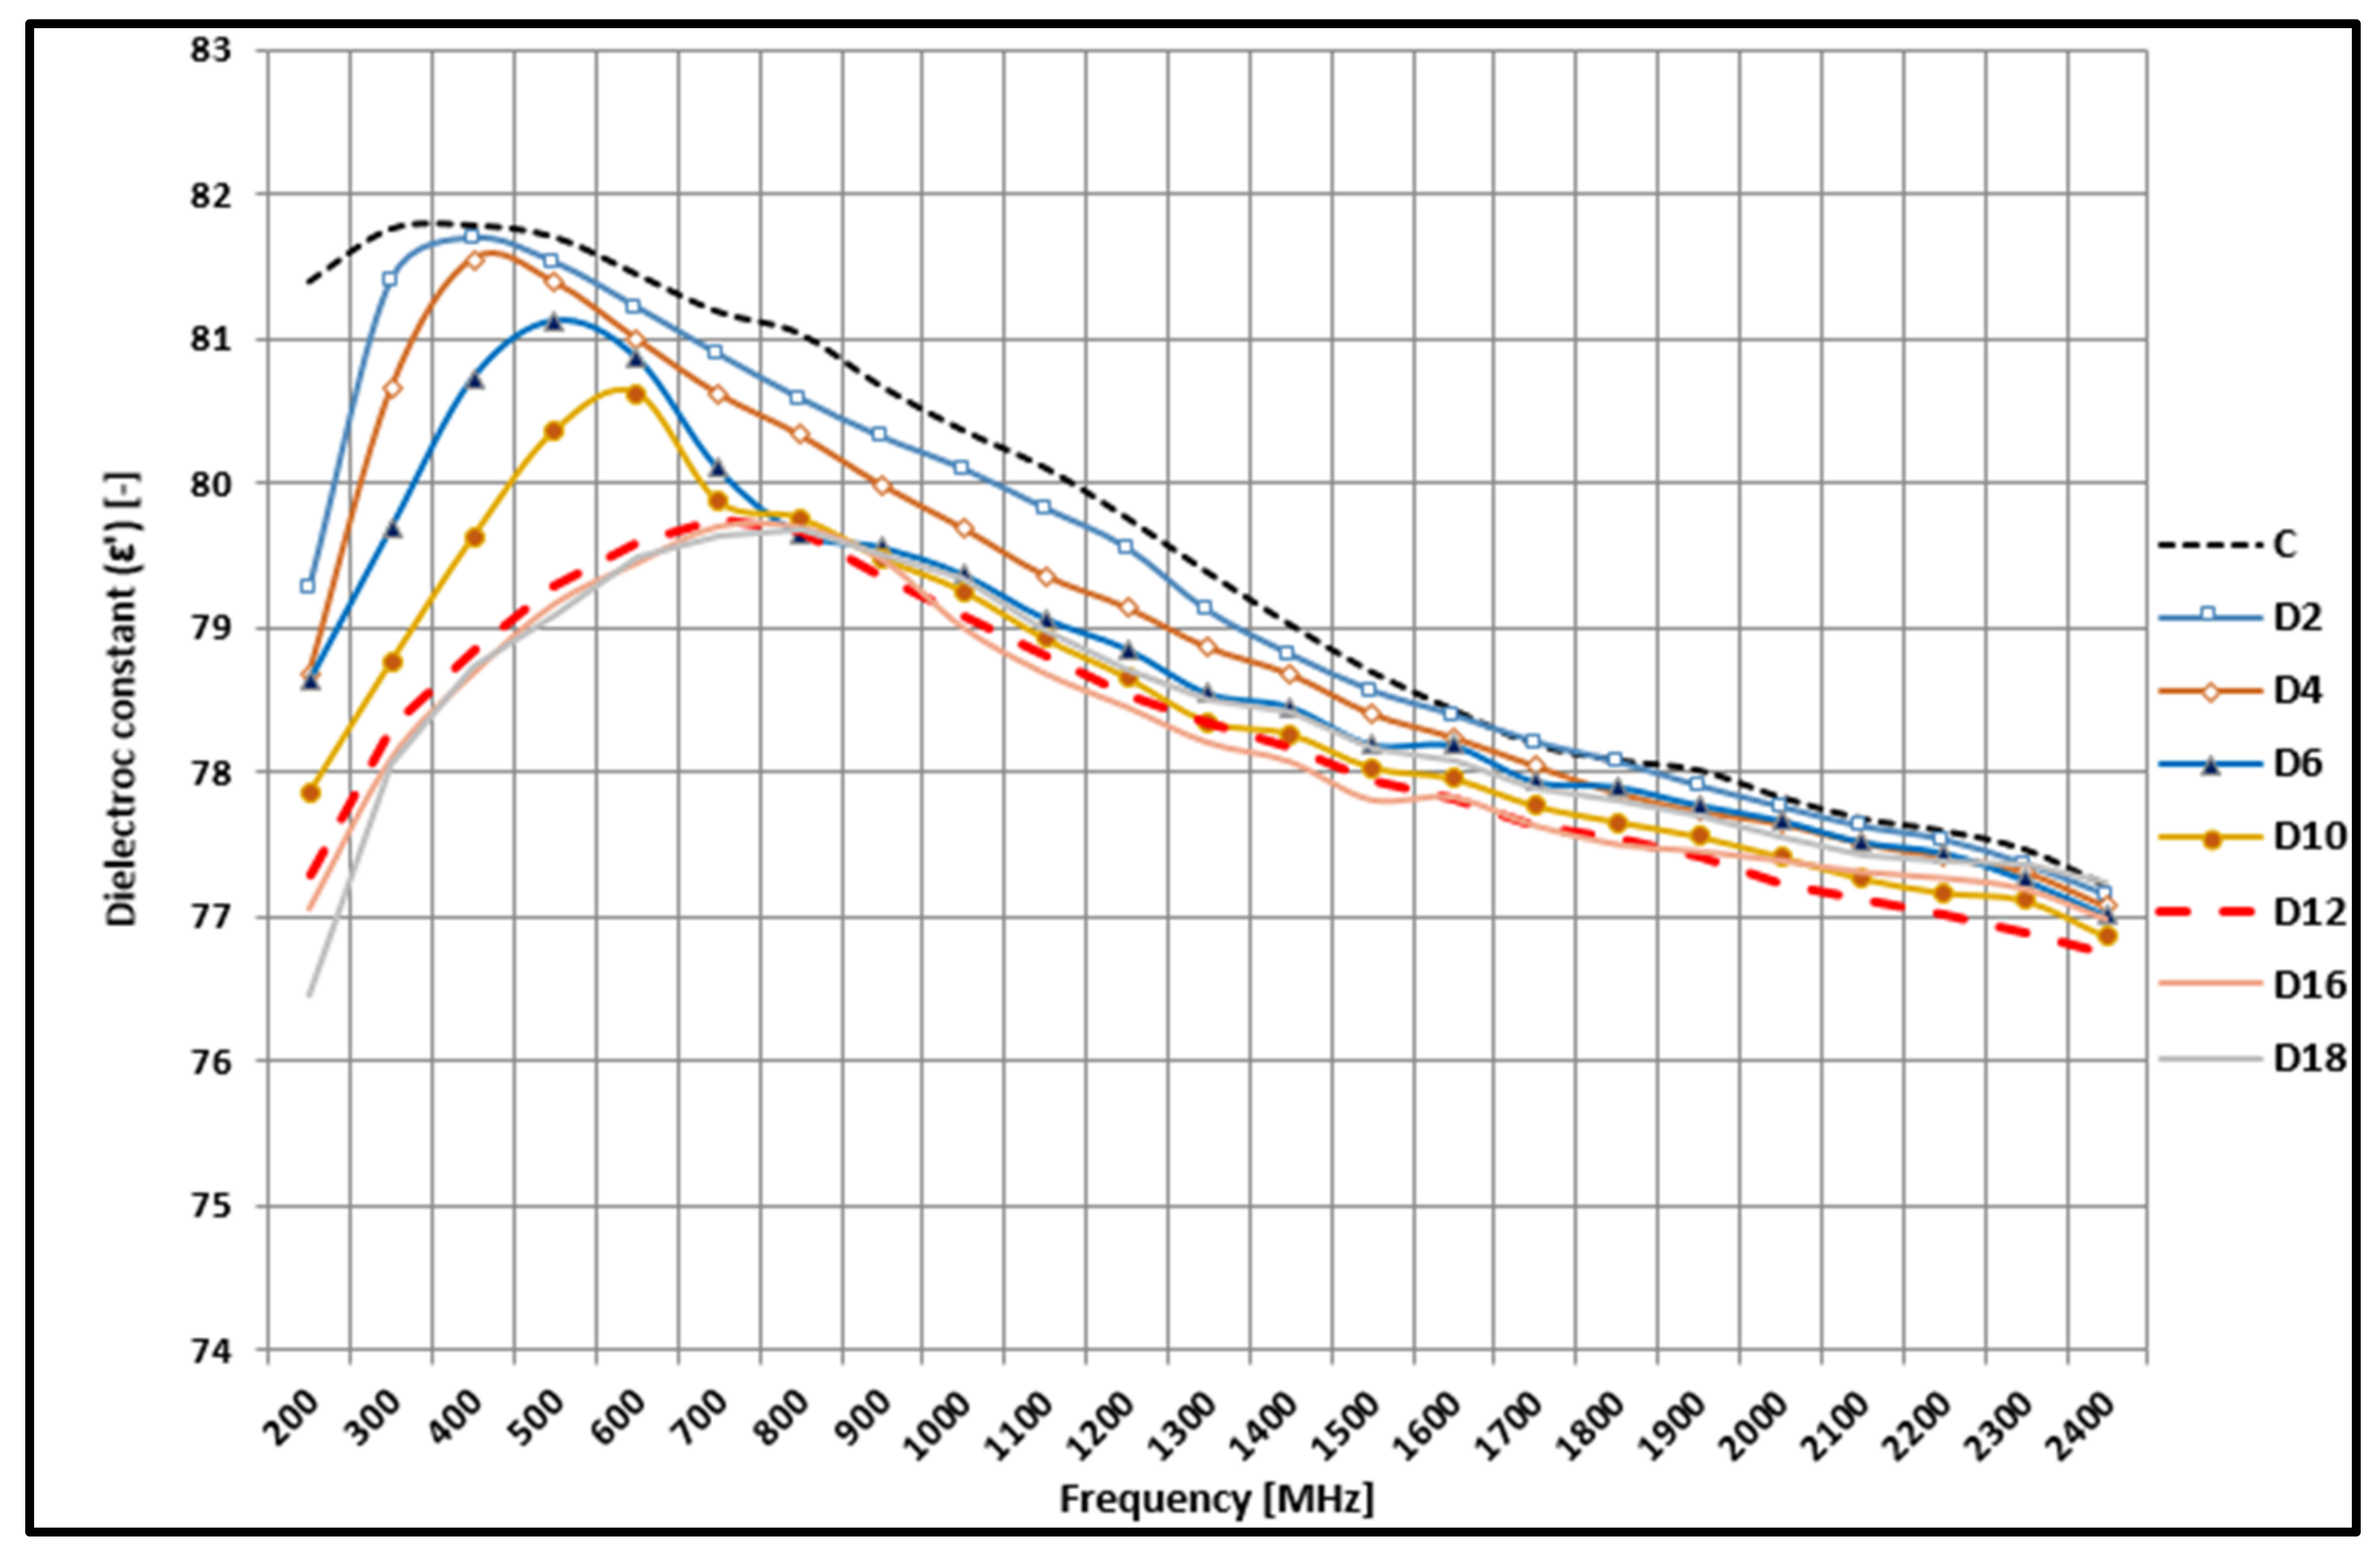
In addition to measuring the biogas yield and the variation in the absolute viscosity, our other main goal was to investigate the dielectric behavior of the fermentation media during the anaerobic digestion, and to determine the dielectric constant (ε′) and dielectric loss factor (ε″) on every second day of the fermentation process. We wanted to see whether the tendencies or changes in these dielectric parameters shared a correlation with the dynamics of the biogas production, and/or with the changes that occurred in the values of viscosity. In the figures, Dn (where n is 2, 4, 6, etc.) represents the day of the fermentation when the dielectric measurement took place, and C is the control, i.e., the MIWS sample before the AD (basically day 0 sample).
Figure 9 shows the tendency of the change in dielectric constant during the anaerobic digestion of the non-treated samples. It can be clearly observed that the values of the dielectric constant gradually decrease in the low-frequency range as the AD progresses, up until the 12th day of the fermentation. Moreover, as the time of the anaerobic digestion advances, the frequency that correlates to the maximum ε′ increases as well (C—300 MHz, D2—400 MHz, D4—approx. 500 MHz, etc.), until the 12th day of the AD. After that, the differences in the tendency of ε′ (and the dielectric constant itself) begin to shrink, and in the higher frequency range (1200–2400 MHz) the dielectric constant of the D12 media reaches the lowest point. These observations indicate that when the AD reaches the stationary phase, and thus the biochemical environment reaches steady state and no significant changes occur, the differences in dielectric constant also cease. This means that by measuring the dielectric parameters, more precisely the dielectric constant in our case, it is possible to detect the end of the log phase (or the start of the stationary phase) by which time the vast amount of biogas has been produced. This also indicates that this monitoring technique could be used to determine whether the AD process behaves differently than expected (i.e., the value of the dielectric constant on a given day is much lower or higher than that of the initial, for example), and thus, provides an easy, non-destructive and quick method to see if any intervention is needed during the overall process.
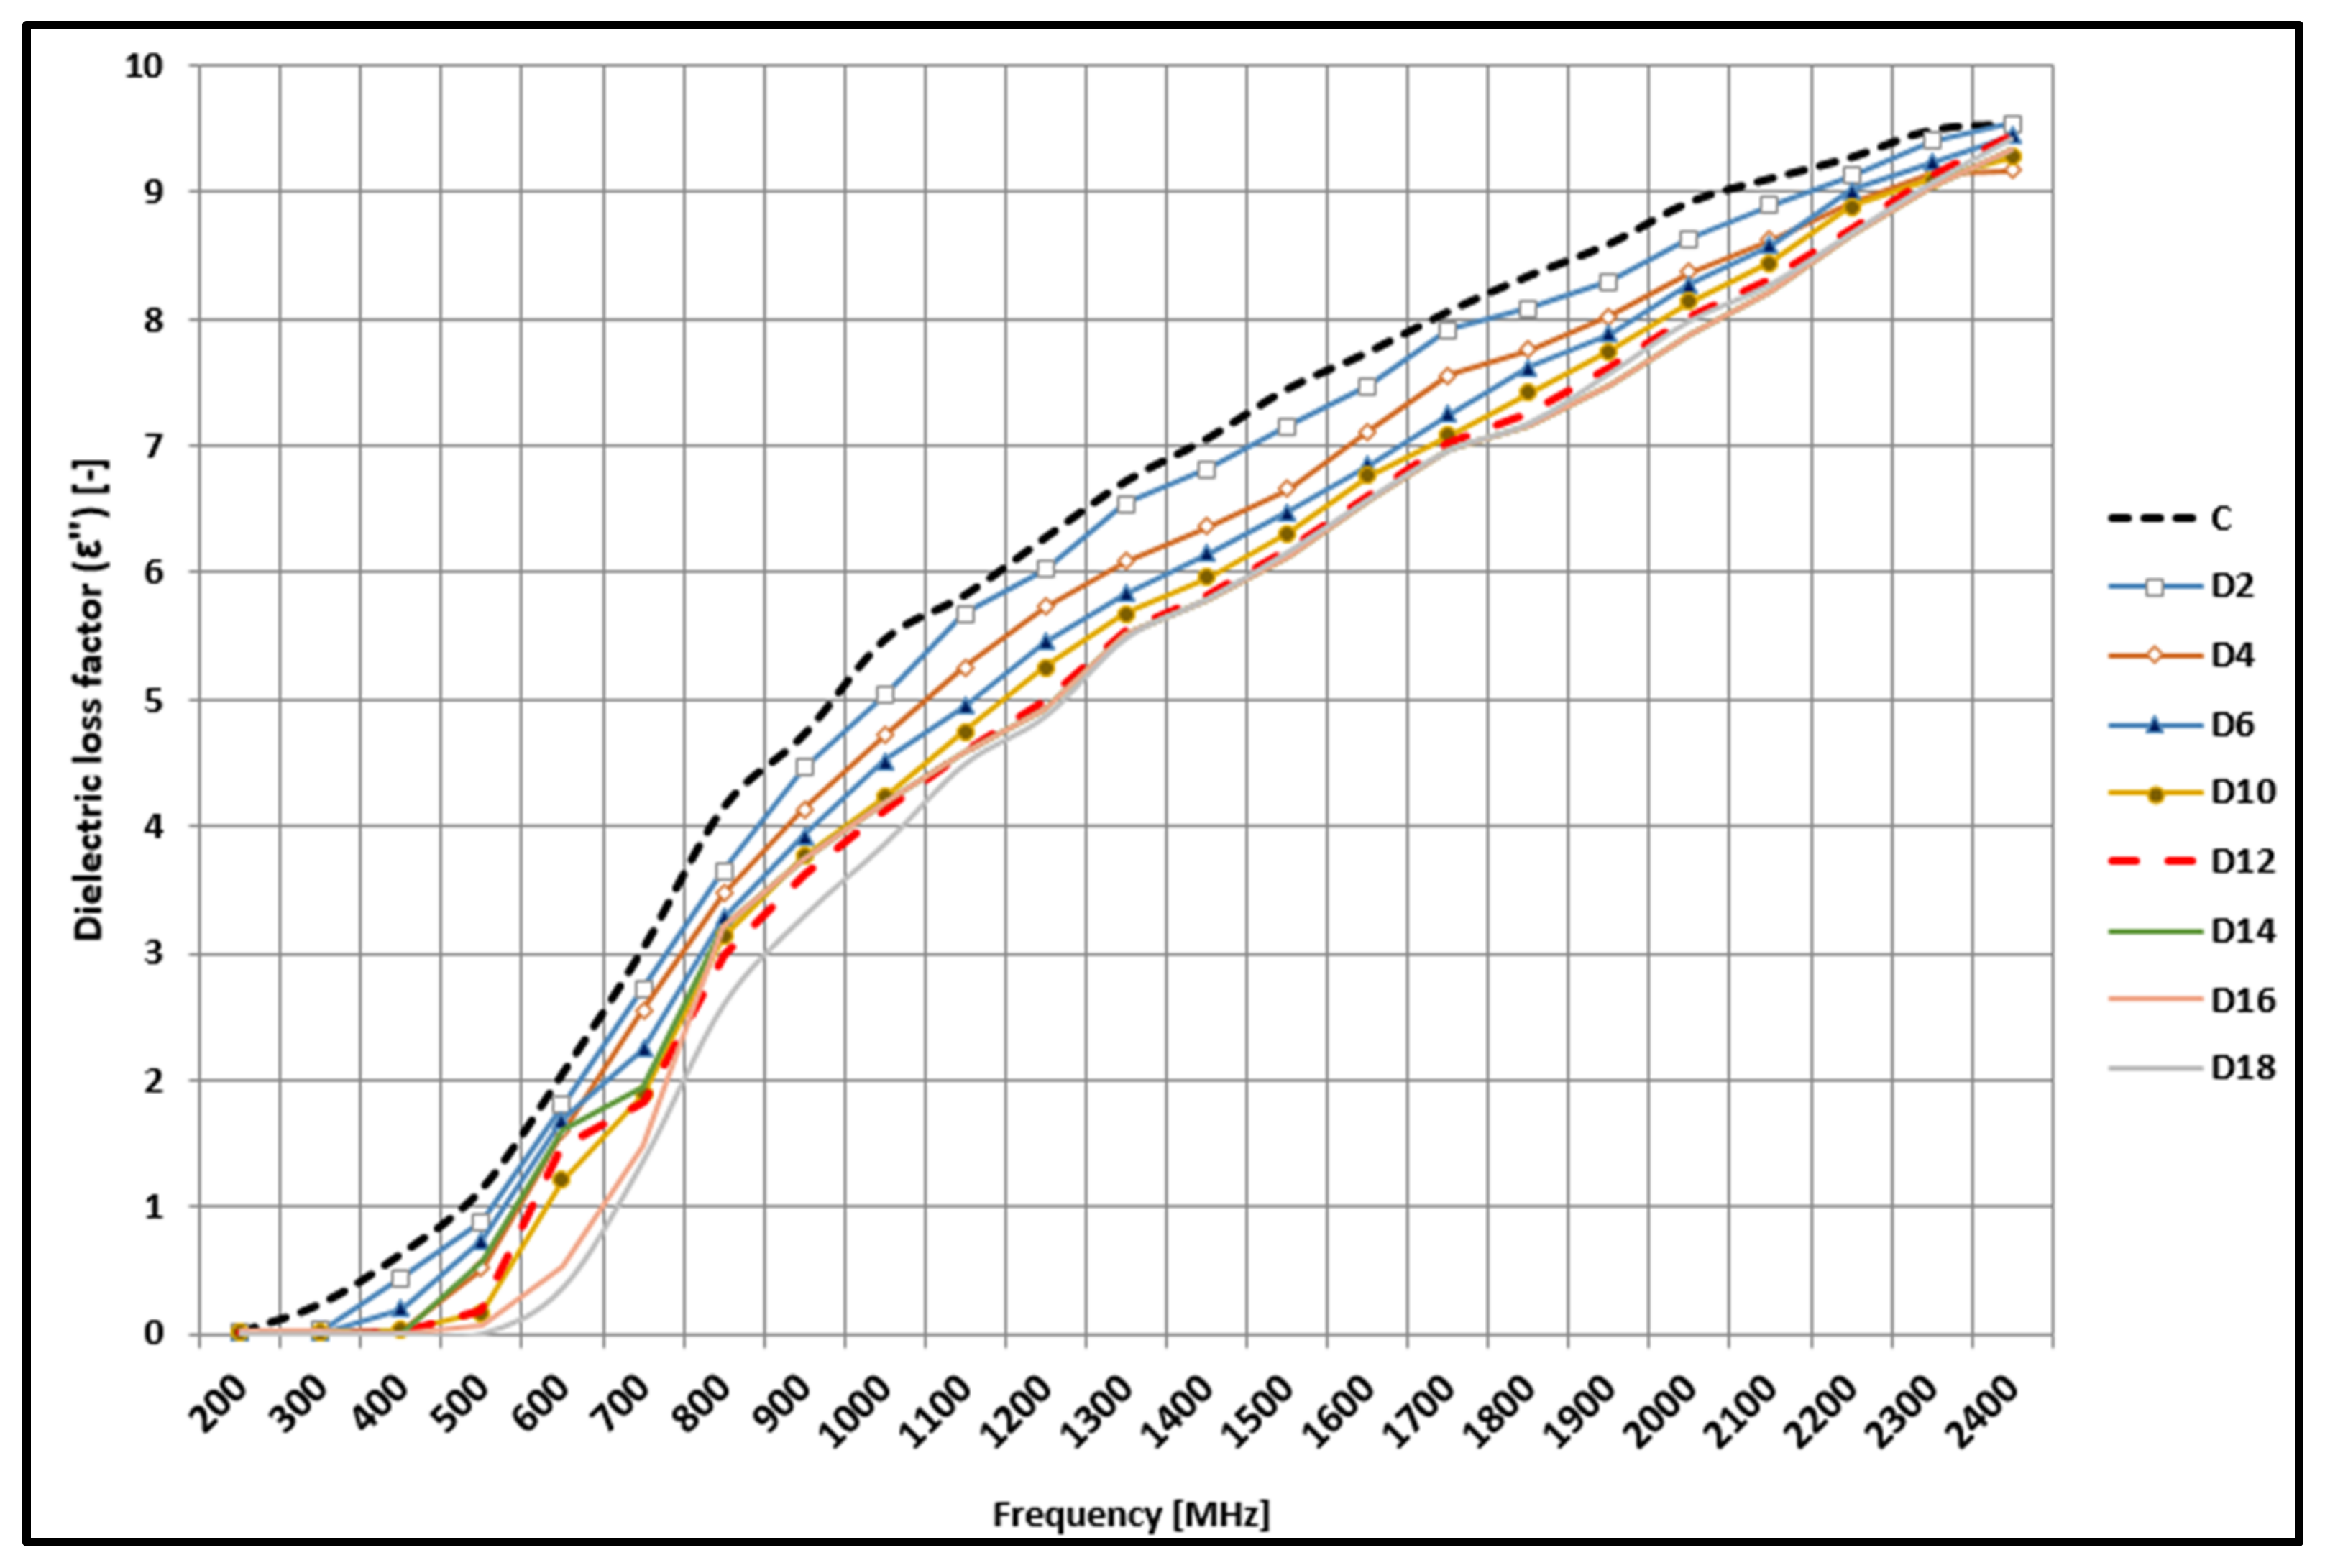
During our experiments, the dielectric loss factor (ε″), which represents the energy dissipation ability of a given material, was also measured every second day throughout the anaerobic digestion process. Figure 10 shows the tendencies obtained for the control (non-treated) sample regarding this dielectric property. It can be observed that the initial (day 0; C) sample had the highest dielectric loss factor during the entire frequency range. This indicates that the initial chemical and structural state of the MIWS media had the uppermost energy dissipation ability, meaning that a reasonable amount of absorbed energy transformed into heat during the measurement. As the AD process progressed, the value of the dielectric loss factor decreases increasingly with each measurement point, until the 12th day of the fermentation, after which the differences began to cease, as observed in the case of the dielectric constant. This means that the changes of the dielectric loss factor share similar tendencies with both the viscosity values and the dielectric constant, and therefore it is certainly in connection with the biogas production as well. Thus, the measurement of the dielectric loss can be also used to identify the earlier (lag–log) phases of the AD process.
It can be also seen that the values of the dielectric loss factor begin to increase sharply at a given, well-defined frequency, but this point varies with the day of the fermentation—as the AD moves forward, the initial frequency point at which the ε″ values start to increase becomes increasingly higher (e.g., 200 MHz at day 0; 300 MHz at day 2; around 400 MHz at day 6, and so on). The reason behind this is most likely the (bio)chemical, physicochemical changes that occur during the anaerobic digestion—as the complex carbohydrates, lipids and proteins are converted into smaller molecules [7], the fermentation media becomes more polarizable; therefore, the polarization and/or the conduction losses occur at higher frequencies.
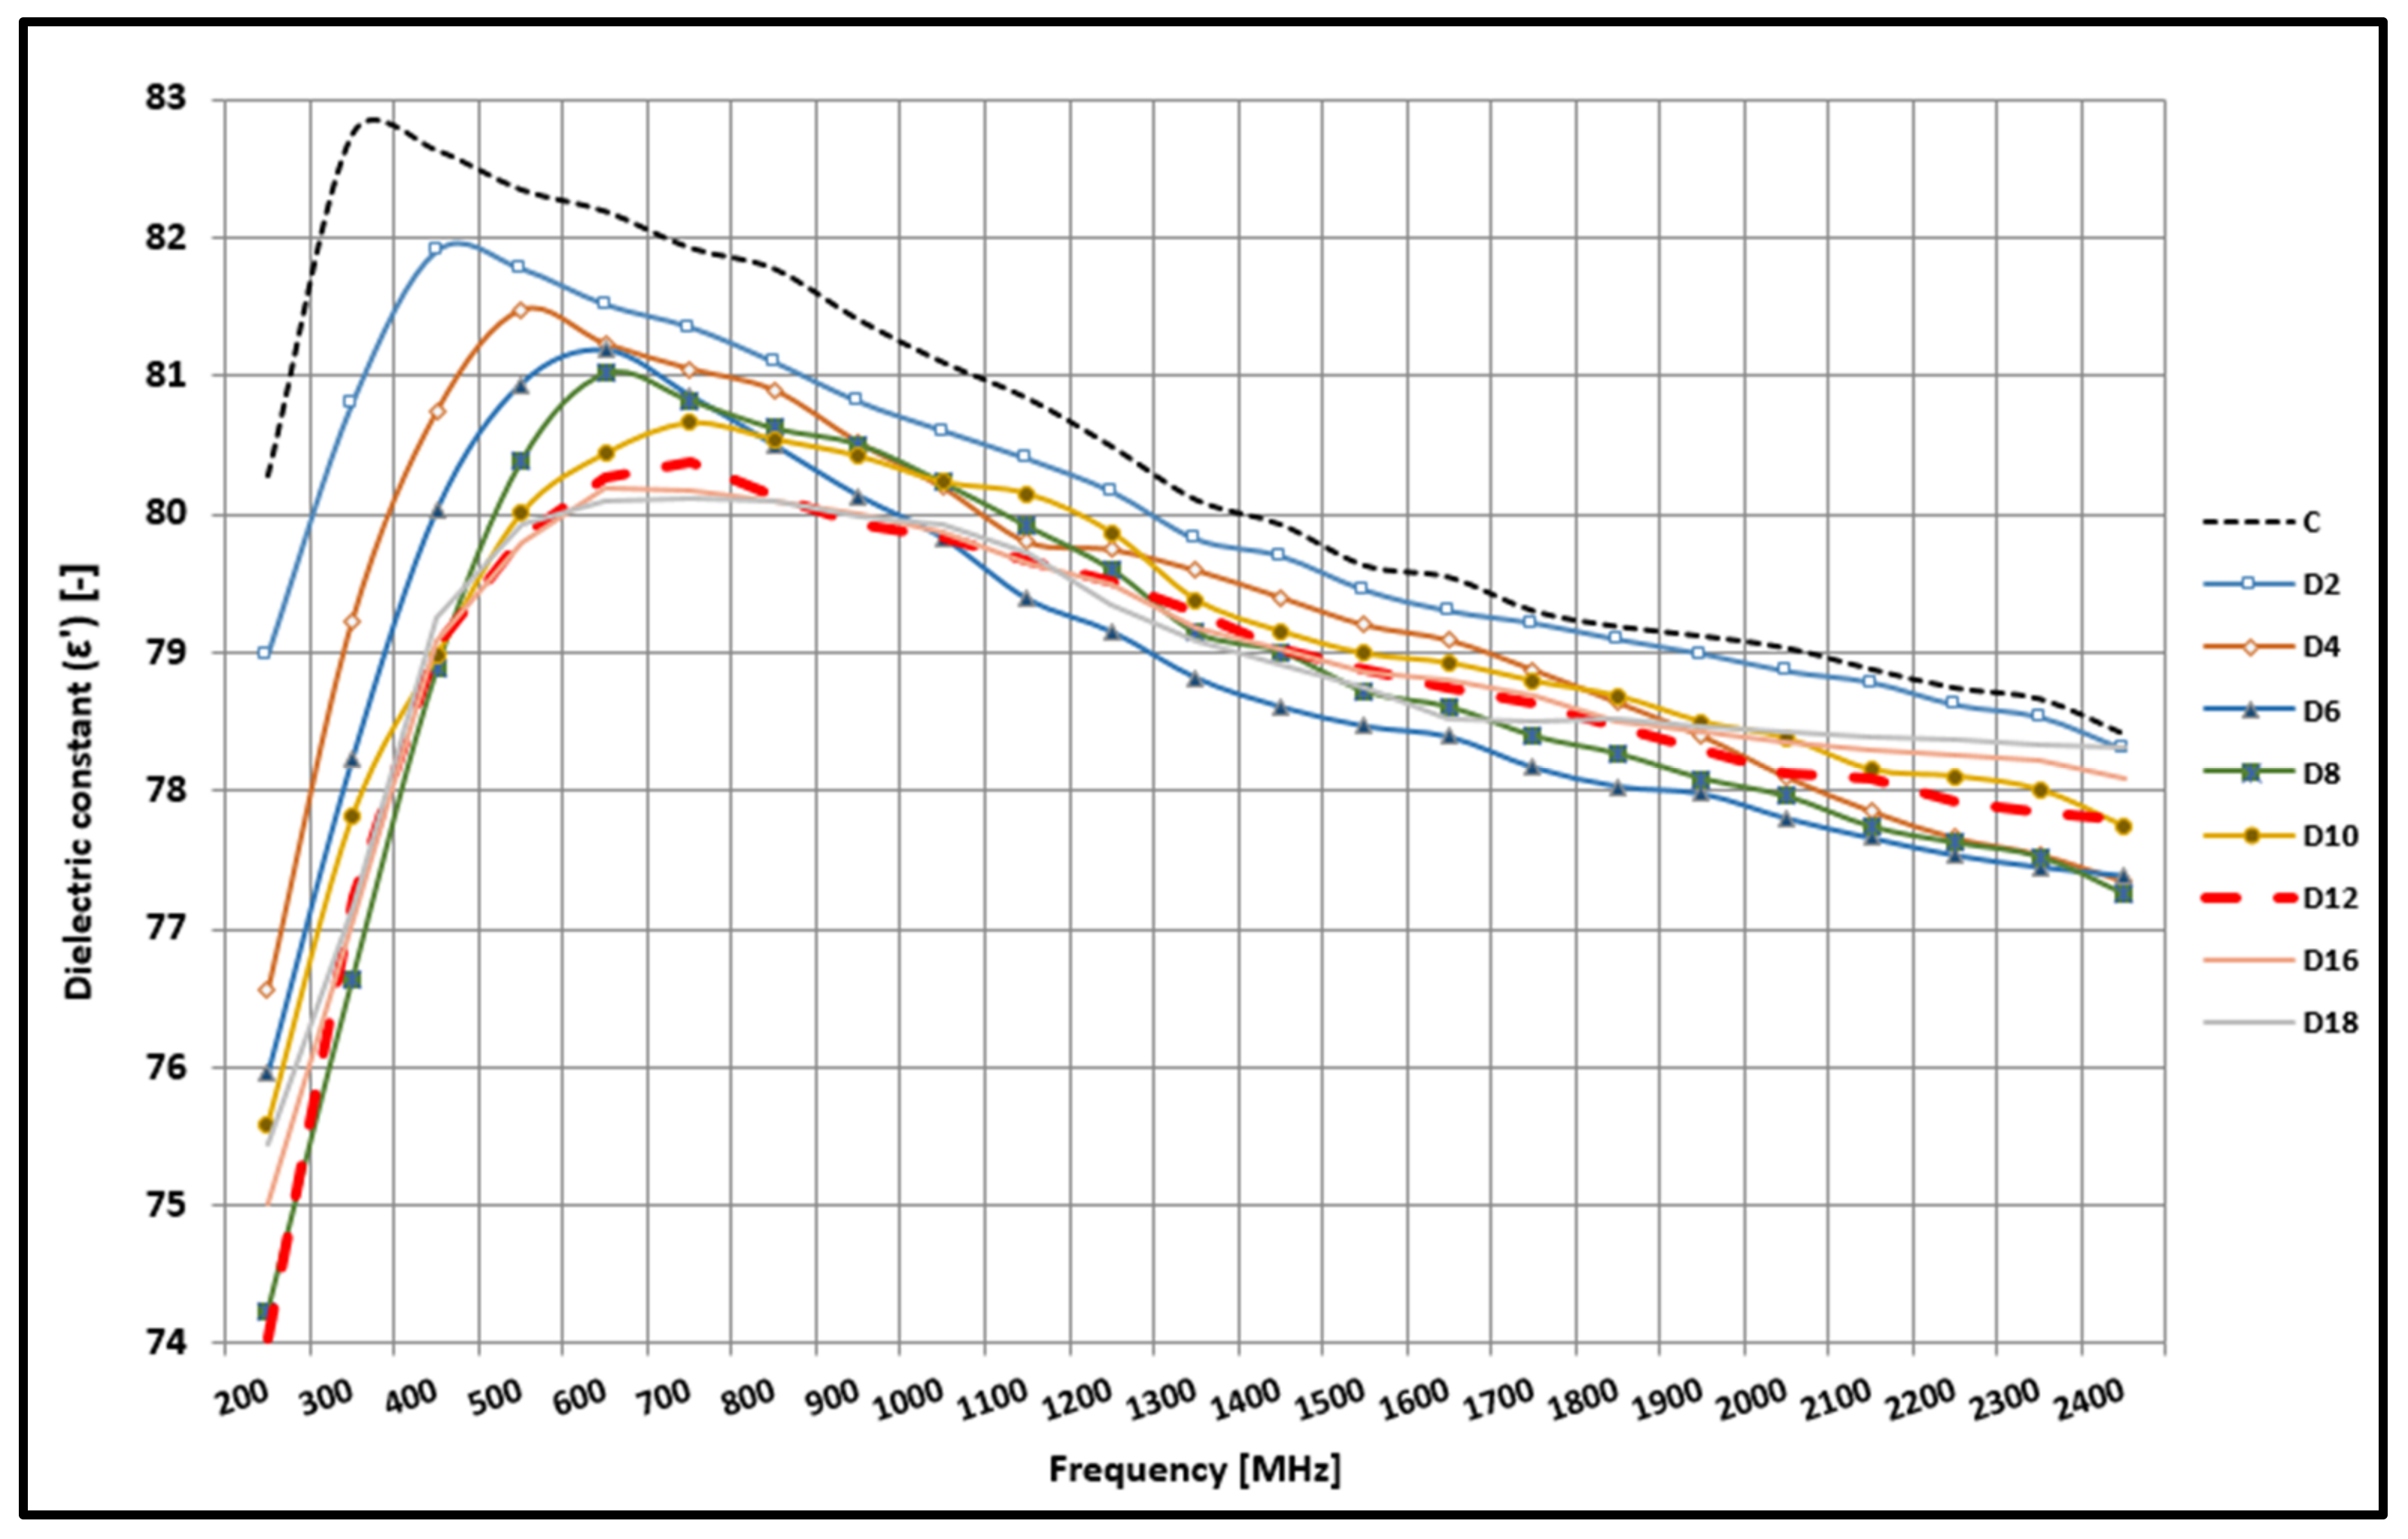
During the experiments, the dielectric properties of the microwave pre-treated samples were also measured to see if any changes caused by the microwave irradiation were detectable with this measuring technique. Figure 11 shows the results obtained for the dielectric constant of the MW-treated samples during the process of AD.
In contrast to the control (non-treated) sample, it can be seen that in the case of the MW irradiated MIWS, the values of the maximum dielectric contrast are generally a bit higher, regardless of the fermentation day observed, and the differences are slightly more prominent in the lower frequency range (200–600 MHz). This can be explained by the structural and/or physicochemical changes caused by the microwave irradiation [20,22]. Through the solubilization of certain organic molecules, by releasing some of the bounded water content, and generally by the disintegration the MW inflicts, the overall wet-solid phase ratio shifts, as reflected in the results obtained for the dielectric constant values. However, if we compare the tendencies of the dielectric constant in the measured frequency range in case of the MW-treated samples to the control samples, we can observe straightforward similarities. The maximum point/inflection point of dielectric constant shifts towards higher frequencies as the AD progresses, until the end of the lag phase (12th day)—as was observed in the case of the control sample.
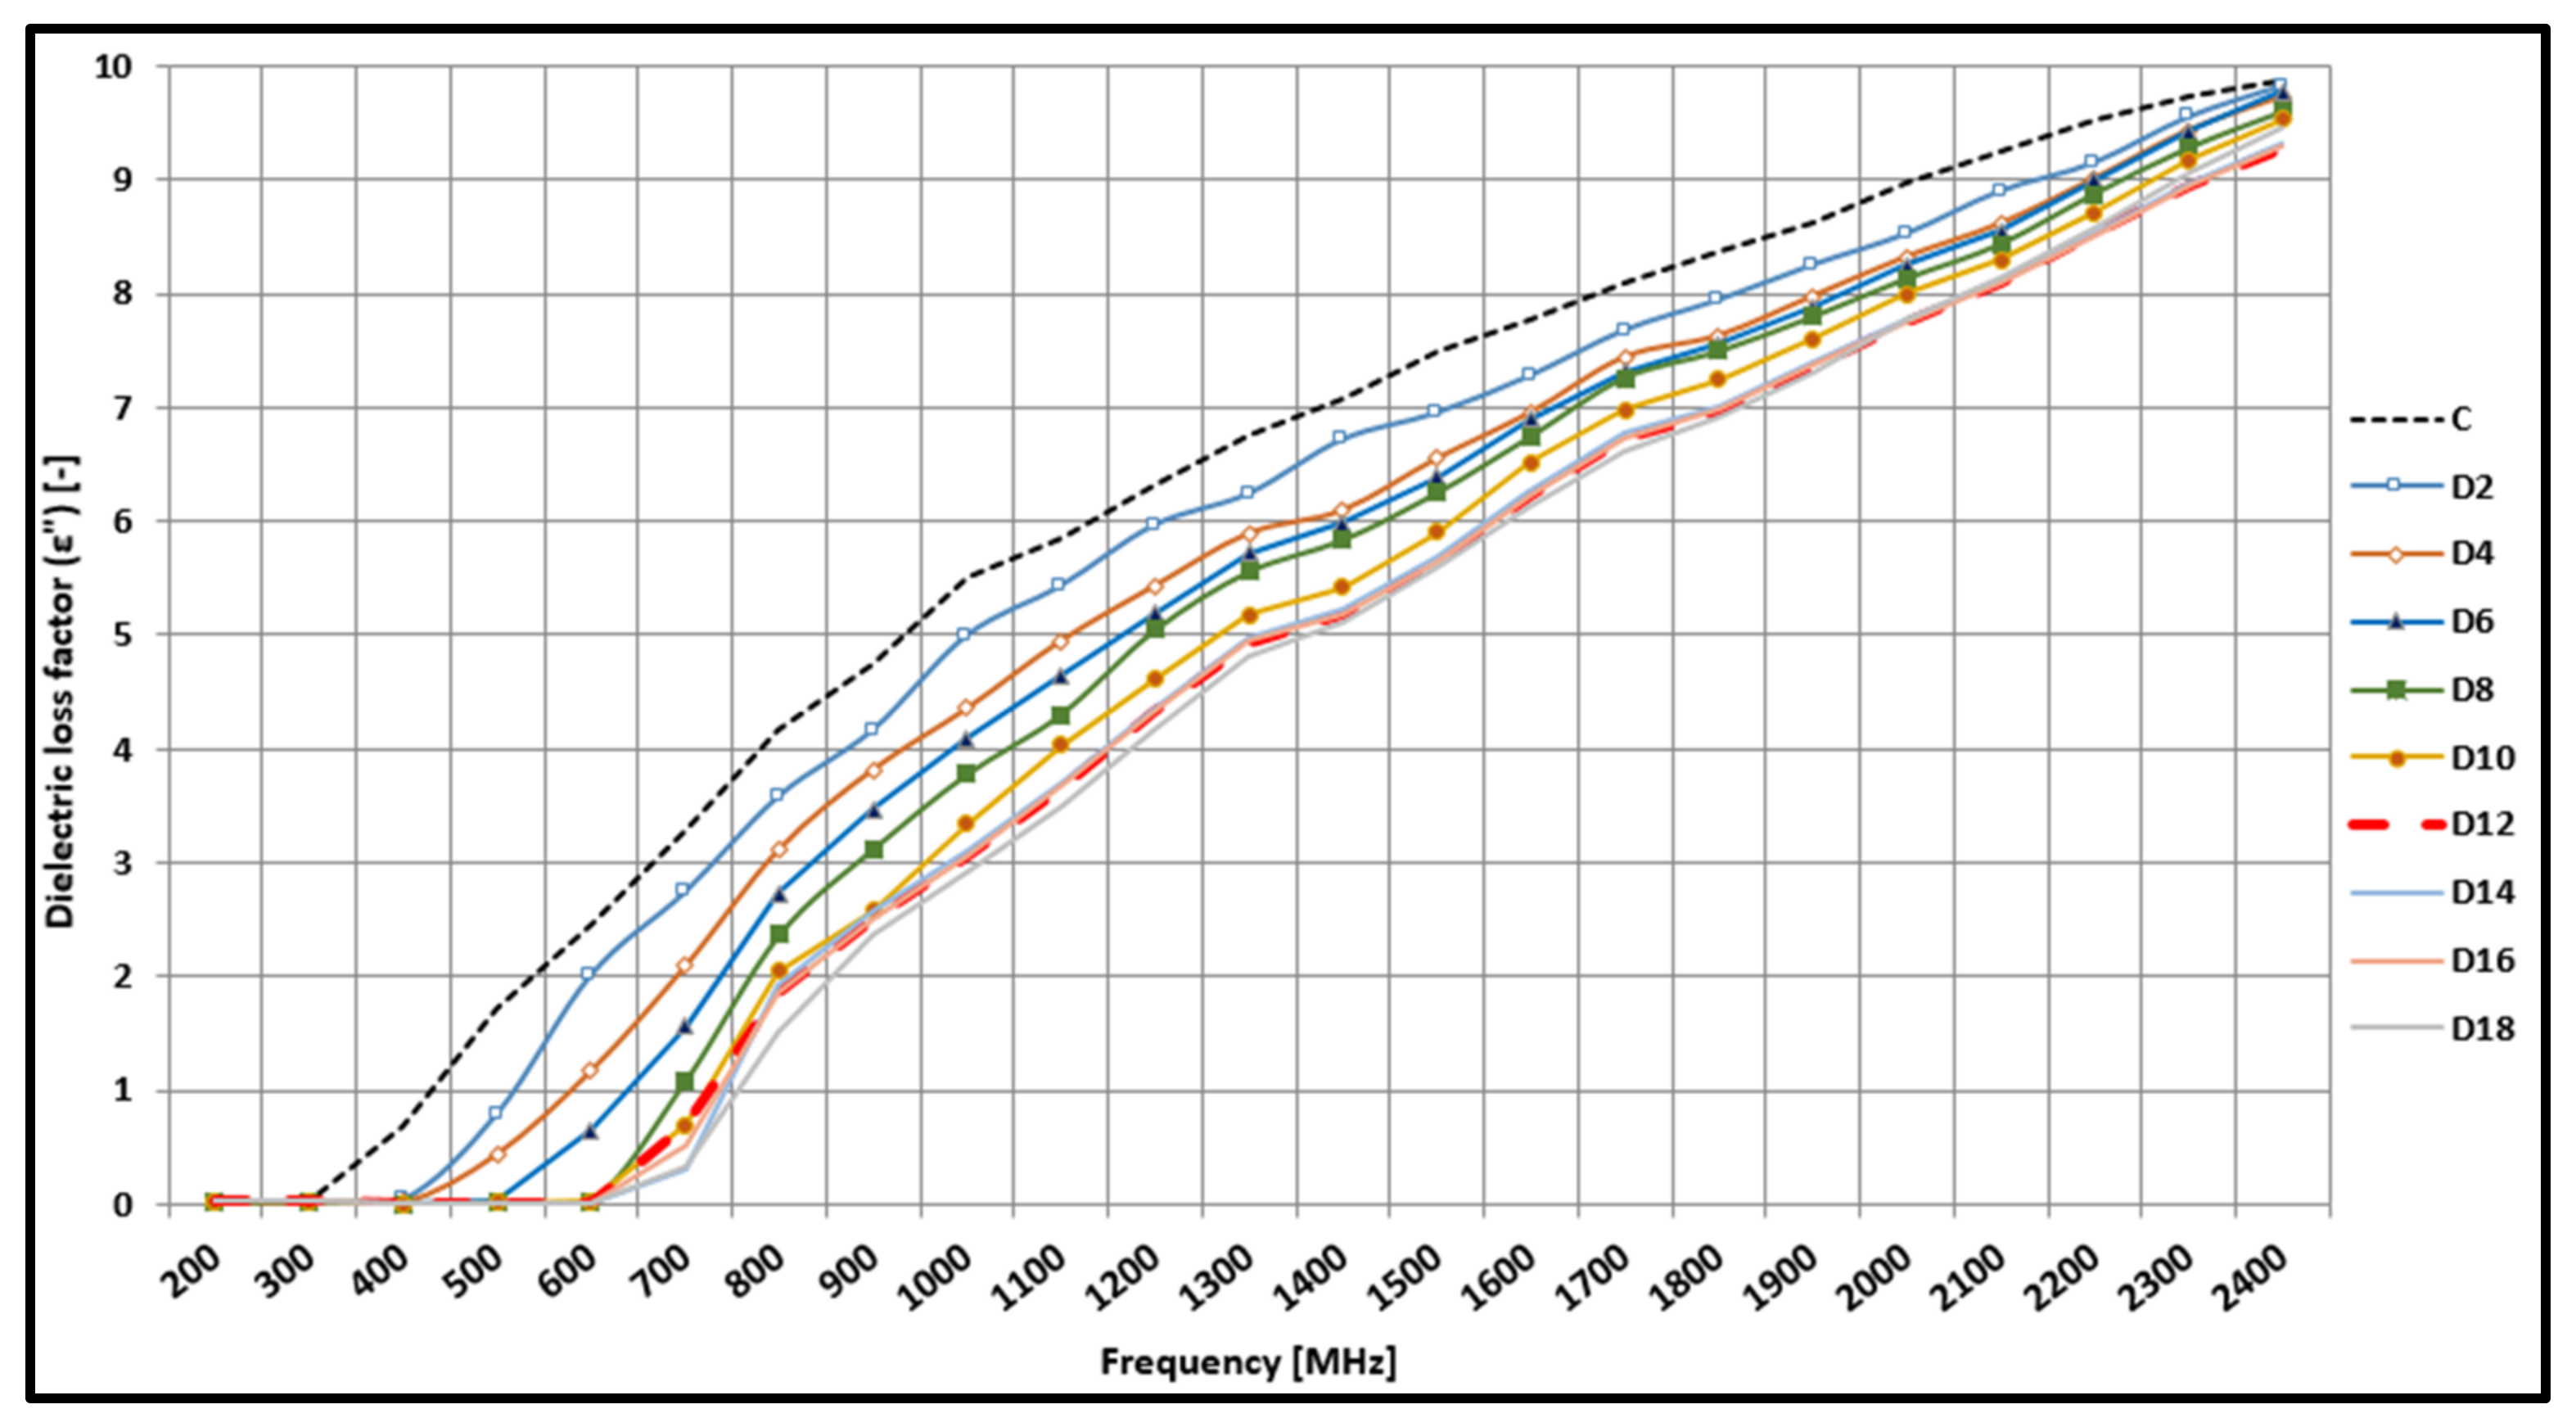
Regarding the results of the dielectric loss factor obtained for the MW-treated samples (Figure 12), we can see that in certain investigated frequency ranges the values of ε″ are generally higher than that of the control sample, especially in the lower frequency interval, and the differences between the fermentation days are more observable. The reason behind this can also be explained by the structural and physicochemical changes induced by the absorbed microwave energy [25,27]. The altered concentration of the dissolved components and the altered wet-solid phase ratio caused the dielectric loss factor to increase, and because of the more homogenous environment of the media, the differences in the excitation frequencies become more noticeable. These factors can also explain why the values of the dielectric loss factor begin to increase sharply at higher frequencies compared to the control samples (e.g., at day 6 it is around 500 MHz regarding the MW-treated sample, while in the case of the control, it is roughly 350–400 MHz).
However, the tendencies share similarities with the control sample, namely that the dielectric loss factor decreases as the AD continues until the 12th day of the fermentation. This indicates on one hand that the microwave radiation did not alter or change either the defined phases of the anaerobic digestion, or its overall tendencies, and on the other hand, the dielectric measurement technique can be applied to monitor the AD process of pre-treated samples as well.
4. Conclusions
In our present work, we investigated two monitoring techniques—viscosity and dielectric measurement—to determine whether they were capable of identifying and tracking the different phases of the anaerobic digestion of meat industry wastewater sludge. Moreover, we examined the effects of microwave irradiation pre-treatment on the biogas yield, biogas production dynamics, and the aforementioned rheological and dielectric properties of the fermentation media during the digestion. Our key findings are as follows:
- (1).
- It can be stated that the biogas production dynamics follow the typical stages of the anaerobic digestion, both during the AD of the control sample and during the MW-treated MIWS sample.
- (2).
- Standalone microwave irradiation could enhance the maximum achievable biogas yield by 14%, and could slightly shorten the lag phase of the AD by 1–2 days.
- (3).
- The changes in the viscosity values share strong similarities with the dynamics of the nascent biogas volume, i.e., the decrease in viscosity occurs accordingly to the lag, log, and stationary phase of the AD. Therefore, the measurement of this rheological property can identify and follow the different stages of the fermentation, either for the control or the pre-treated MIWS sample. Microwave irradiation did not alter the overall tendency of the viscosity values, but due to the disintegration it caused, the measured viscosity was lower in the case of the MW-treated sample.
- (4).
- The measurement of the dielectric constant (ε′) can be used for monitoring the process of anaerobic digestion, both in the case of the control and in the case of the microwave irradiated samples. The values of the dielectric constant gradually decrease in the low-frequency range as the AD progresses, until the 12th day of the fermentation—which additionally coincides with the day the viscosity becomes stationary. Moreover, the frequency that correlates to the highest dielectric constant value gradually increases as the AD continues, again, until the 12th day of the process. This means that the end of the log phase is identifiable with this method, by which time the majority of biogas has been produced.
- (5).
- Measuring the dielectric loss factor (ε″) is also applicable to monitor the process of the AD—as the fermentation moves forward, the value of the dielectric loss factor gradually decreases with each measurement day until day 12, which marks the end of the log phase in our case.
- (6).
- Differences caused by microwave energy radiation in the values of dielectric constant and loss factor are due to the structural and physicochemical changes that occur in the fermentation media due to the absorbed MW energy. However, to understand the exact molecular mechanisms, further investigations are needed.
Author Contributions
Conceptualization and methodology, Z.J., C.H. and S.B.; writing—original draft preparation, Z.J.; writing—review and editing, C.H. and S.B. All authors have read and agreed to the published version of the manuscript.
Funding
This scientific work and paper was funded by the following scholarships and programs: New National Excellence Programs UNKP-21-3-320-SZTE and UNKP-21-5-556-SZTE; Bolyai János Research Scholarship of the Hungarian Academy of Sciences BO/00161/21/4.
Institutional Review Board Statement
Not applicable.
Informed Consent Statement
Not applicable.
Data Availability Statement
The data presented in this study are available on request from the corresponding author. The data are not publicly available to avoid possible misuse or unauthorized use of them.
Acknowledgments
The authors are grateful for the financial support provided by the New National Excellence Program, under project numbers UNKP-21-5-556-SZTE and UNKP-21-3-320-SZTE. This project was supported by Bolyai János Research Scholarship of the Hungarian Academy of Sciences (BO/00161/21/4). The authors would like to express their special appreciation to Réka Dobozi for her extraordinary quality of work in constructing some of the figures presented in this study.
Conflicts of Interest
The authors declare no conflict of interest.
References
- Guo, W.Q.; Yang, S.S.; Xiang, W.S.; Wang, X.J.; Ren, N.Q. Minimization of excess sludge production by in-situ activated sludge treatment processes—A comprehensive review. Biotechnol. Adv. 2013, 31, 1386–1396. [Google Scholar] [CrossRef] [PubMed]
- Zhang, P.Y.; Zhang, G.M.; Wang, W. Ultrasonic treatment of biological sludge: Floc disintegration, cell lysis and inactivation. Bioresour. Technol. 2007, 98, 207–210. [Google Scholar] [CrossRef] [PubMed]
- Campos, J.L.; Otero, L.; Franco, A.; Mosquera-Corral, A.; Roca, E. Ozonation strategies to reduce sludge production of a seafood industry WWTP. Bioresour. Technol. 2009, 100, 1069–1073. [Google Scholar] [CrossRef] [PubMed]
- Pampillón-González, L.; Canepa, J. Biomass as an Alternative for Gas Production. In Advances in Natural Gas Emerging Technologies; Al-Megren, H., Altamimi, R., Eds.; IntechOpen: London, UK, 2017. [Google Scholar] [CrossRef] [Green Version]
- Sahota, S.; Shah, G.; Ghosh, P.; Kapoor, R.; Sengupta, S.; Singh, P.; Vijay, V.; Sahay, A.; Vijay, V.K.; Thakur, I.S. Review of trends in biogas upgradation technologies and future perspectives. Bioresour. Technol. Rep. 2018, 1, 79–88. [Google Scholar] [CrossRef]
- Paul, D.; Farcaş, N.; Florentina, M. Main factors affecting biogas production—An overview. Rom. Biotechnol. Lett. 2014, 19, 9283–9296. [Google Scholar]
- Ramaraj, R.; Dussadee, N. Biological Purification Processes for Biogas Using Algae Cultures: A Review. Int. J. Precis. Eng. Manuf.-Green Technol. 2015, 4, 20–32. [Google Scholar]
- Odirile, P.T.; Marumoloa, P.M.; Manali, A.; Gikas, P. Anaerobic Digestion for Biogas Production from Municipal Sewage Sludge: A Comparative Study between Fine Mesh Sieved Primary Sludge and Sedimented Primary Sludge. Water 2021, 13, 3532. [Google Scholar] [CrossRef]
- Zhang, P. Biogas Recovery from Anaerobic Digestion of Selected Industrial Wastes. In Advances in Biofuels and Bioenergy; Nageswara-Rao, M., Soneji, J., Eds.; IntechOpen: London, UK, 2017. [Google Scholar] [CrossRef] [Green Version]
- Buşra, T.; Sercan, D.; Filiz, A. Dielectric Properties of Foods. Turk. J. Agric.-Food Sci. Technol. 2019, 7. [Google Scholar] [CrossRef]
- Salas, W.A.; Ranson, J.K.; Rock, B.N.; Smith, K.T. Temporal and spatial variations in dielectric constant and water status of dominant forest species from New England. Remote Sens. Environ. 1994, 47, 109–119. [Google Scholar] [CrossRef]
- Nelson, S.O. Determining Dielectric Properties of Coal and Limestone by Measurements on Pulverized Samples. J. Microw. Power Electromagn. Energy 1996, 31, 15–220. [Google Scholar] [CrossRef]
- Lievonen, S.M.; Roos, Y.H. Comparison of dielectric properties and non-enzymatic browning kinetics around glass transition. Innov. Food Sci. Emerg. Technol. 2003, 4, 297–305. [Google Scholar] [CrossRef]
- Jákói, Z.; Hodúr, C.; László, Z.; Beszédes, S. Detection of the efficiency of microwave–oxidation process for meat industry wastewater by dielectric measurement. Water Sci. Technol. 2018, 78, 2141–2148. [Google Scholar] [CrossRef] [PubMed]
- Bobowski, J.; Johnson, T.; Eskicioglu, C. Permittivity of waste-activated sludge by an open-ended coaxial line. Prog. Electromagn. Res. Lett. 2012, 29, 139–149. [Google Scholar] [CrossRef] [Green Version]
- Brodie, G.; Destefani, R.; Schneider, P.A.; Airey, L.; Jacob, M.V. Dielectric Properties of Sewage Biosolids: Measurement and Modeling. J. Microw. Power Electromagn. Energy 2014, 48, 147–157. [Google Scholar] [CrossRef]
- Ding, Y.; Guo, Z.S.; Hou, X.G.; Mei, J.X.; Liang, Z.L.; Li, Z.P.; Zhang, C.P.; Jin, C. Performance Analysis for the Anaerobic Membrane Bioreactor Combined with the Forward Osmosis Membrane Bioreactor: Process Conditions Optimization, Wastewater Treatment and Sludge Characteristics. Water 2020, 12, 2958. [Google Scholar] [CrossRef]
- Cheng, Y.C.; Li, H. Rheological behavior of sewage sludge with high solid content. Water Sci. Technol. 2015, 71, 1686–1693. [Google Scholar] [CrossRef]
- Komesli, O.T.; Gokcay, C.F. Investigation of sludge viscosity and its effects on the performance of a vacuum rotation membrane bioreactor. Environ. Technol. 2014, 35, 645–652. [Google Scholar] [CrossRef]
- Lopez, J.; Moreau, A.; Gil, J.A.; van der Graaf, J.H.J.M.; van Lier, J.B.; Ratkovich, N. MBR activated sludge viscosity measurement using the Delft filtration characterization method. J. Water Process Eng. 2015, 5, 35–41. [Google Scholar] [CrossRef]
- Piani, L.; Rizzardini, C.B.; Papo, A.; Goi, D. Rheology Measurements for Online Monitoring of Solids in Activated Sludge Reactors of Municipal Wastewater Treatment Plant. Sci. World J. 2014, 2014, 590961. [Google Scholar] [CrossRef]
- Damm, M.; Nusshold, C.; Cantillo, D.; Rechberger, G.N.; Gruber, K.; Sattler, W.; Kappe, C.O. Can electromagnetic fields influence the structure and enzymatic digest of proteins? A critical evaluation of microwave-assisted proteomics protocols. J. Proteom. 2012, 75, 5533–5543. [Google Scholar] [CrossRef] [Green Version]
- Prevot, A.B.; Gulmini, M.; Zelano, V.; Pramauro, E. Microwave-assisted extraction of polycyclic aromatic hydrocarbons from marine sediments using nonionic surfactant solutions. Anal. Chem. 2001, 73, 3790–3795. [Google Scholar] [CrossRef] [PubMed]
- Zhang, X.L.; Hayward, D.O.; Mingos, D.M.P. Effects of microwave dielectric heating on heterogeneous catalysis. Catal. Lett. 2003, 88, 33–38. [Google Scholar] [CrossRef] [Green Version]
- Ahn, J.H.; Shin, S.G.; Hwang, S. Effect of microwave irradiation on the disintegration and acidogenesis of municipal secondary sludge. Chem. Eng. J. 2009, 153, 145–150. [Google Scholar] [CrossRef]
- Jang, J.H.; Ahn, J.H. Effect of microwave pretreatment in presence of NaOH on mesophilic anaerobic digestion of thickened waste activated sludge. Bioresour. Technol. 2013, 131, 437–442. [Google Scholar] [CrossRef]
- Yang, Q.; Yi, J.; Luo, K.; Jing, X.L.; Li, X.M.; Liu, Y.; Zeng, G.M. Improving disintegration and acidification of waste activated sludge by combined alkaline and microwave pretreatment. Process Saf. Environ. Prot. 2013, 91, 521–526. [Google Scholar] [CrossRef]
- Doğruel, S.; Özgen, A.S. Effect of ultrasonic and microwave disintegration on physico-chemical and biodegradation characteristics of waste-activated sludge. Environ. Technol. 2017, 38, 844–859. [Google Scholar] [CrossRef]
- Kor-Bicakci, G.; Ubay-Cokgor, E.; Eskicioglu, C. Comparative Analysis of Bacterial and Archaeal Community Structure in Microwave Pretreated Thermophilic and Mesophilic Anaerobic Digesters Utilizing Mixed Sludge under Organic Overloading. Water 2020, 12, 887. [Google Scholar] [CrossRef] [Green Version]
- Yu, Q.; Lei, H.; Li, Z.; Li, H.; Chen, K.; Zhang, X.; Liang, R. Physical and chemical properties of waste-activated sludge after microwave treatment. Water Res. 2010, 44, 2841–2849. [Google Scholar] [CrossRef]
- Liu, J.; Wei, Y.; Li, K.; Tong, J.; Wang, Y.; Jia, R. Microwave-acid pretreatment: A potential process for enhancing sludge dewaterability. Water Res. 2016, 90, 225–234. [Google Scholar] [CrossRef]
- Wong, T.W.; Iskhandar, A.; Kamal, M.; Jumi, S.J.; Kamarudin, N.H.; Zin, N.Z.M.; Salleh, N.H.M. Effects of Microwave on Water and Its Influence on Drug Dissolution. Prog. Electromagn. Res. C 2009, 11, 121–136. [Google Scholar] [CrossRef] [Green Version]
- Mawioo, P.M.; Rweyemamu, A.; Garcia, H.A.; Hooijmans, C.M.; Brdjanovic, D. Evaluation of a microwave based reactor for the treatment of blackwater sludge. Sci. Total Environ. 2016, 548–549, 72–81. [Google Scholar] [CrossRef] [PubMed] [Green Version]
- Mawioo, P.M.; Hooijmans, C.M.; Garcia, H.A.; Brdjanovic, D. Microwave treatment of faecal sludge from intensively used toilets in the slums of Nairobi, Kenya. J. Environ. Manag. 2016, 184, 575–584. [Google Scholar] [CrossRef] [PubMed] [Green Version]
- Rao, B.; Su, X.; Lu, X.; Wan, Y.; Huang, G.; Zhang, Y.; Xu, P.; Qiu, S.; Zhang, J. Ultrahigh pressure filtration dewatering of municipal sludge based on microwave pretreatment. J. Environ. Manag. 2019, 247, 588–595. [Google Scholar] [CrossRef] [PubMed]
- Karlsson, M.; Carlsson, H.; Idebro, M.; Eek, C. Microwave Heating as a Method to Improve Sanitation of Sewage Sludge in Wastewater Plants. IEEE Access 2019, 7, 142308–142316. [Google Scholar] [CrossRef]
- Madsen, M.; Holm-Nielsen, J.B.; Esbensen, K.H. Monitoring of anaerobic digestion processes: A review perspective. Renew. Sustain. Energy Rev. 2011, 15, 3141–3155. [Google Scholar] [CrossRef] [Green Version]
- Yildiz, S.; Oran, E. Sewage sludge disintegration by electrocoagulation. Int. J. Environ. Health Res. 2019, 29, 531–543. [Google Scholar] [CrossRef]
Figure 1.
Different phases of biogas formation in a batch fermenter.

Figure 2.
Schematic arrangement of the AD fermenter—manometric head system (a) and the actual arrangement during nitrogen injection (b).
Figure 2.
Schematic arrangement of the AD fermenter—manometric head system (a) and the actual arrangement during nitrogen injection (b).

Figure 3.
Incubation of AD fermenter.

Figure 4.
The open-ended coaxial probe, ZVL-3 vector network analyzer, and the SPEAG DAK analyzing software (from right to left).
Figure 4.
The open-ended coaxial probe, ZVL-3 vector network analyzer, and the SPEAG DAK analyzing software (from right to left).

Figure 5.
Raypa RP1 rotational viscometer.

Figure 6.
Labotron 500 laboratory grade batch microwave equipment.

Figure 7.
Accumulating biogas volume during AD (note: the term biogas yield refers to the cumulative biogas volume/biogas product during the fermentation).
Figure 7.
Accumulating biogas volume during AD (note: the term biogas yield refers to the cumulative biogas volume/biogas product during the fermentation).

Figure 8.
Change in absolute viscosity during the fermentation.

Figure 9.
Trends of the dielectric constant during the fermentation of the control (non-treated) samples.
Figure 9.
Trends of the dielectric constant during the fermentation of the control (non-treated) samples.

Figure 10.
Trends of the dielectric loss factor during the fermentation of the control (non-treated) samples.
Figure 10.
Trends of the dielectric loss factor during the fermentation of the control (non-treated) samples.

Figure 11.
Trends of the dielectric constant during the fermentation of the MW-treated samples.

Figure 12.
Trends of the dielectric loss factor during the fermentation of the MW-treated samples.


Table 1.
Analytical parameters of MIWS.
| Parameter | Value ± SD | Unit |
|---|---|---|
| TS | 11.9 ± 0.7 | % |
| pH | 6.3 ± 0.2 | [-] |
| COD | 514.2 ± 7.2 | g/L |
| BOD | 34.2 ± 2.4 | g/L |
| TOC | 74.6 ± 2.0 | g/L * |
| TN | 2.2 ± 0.2 | g/L ** |
* Asterisk denotes grams of C in 1 L; ** grams of N in 1 L.
Publisher’s Note: MDPI stays neutral with regard to jurisdictional claims in published maps and institutional affiliations. |
© 2022 by the authors. Licensee MDPI, Basel, Switzerland. This article is an open access article distributed under the terms and conditions of the Creative Commons Attribution (CC BY) license (https://creativecommons.org/licenses/by/4.0/).
Share and Cite
MDPI and ACS Style
Jákói, Z.; Hodúr, C.; Beszédes, S. Monitoring the Process of Anaerobic Digestion of Native and Microwave Pre-Treated Sludge by Dielectric and Rheological Measurements. Water 2022, 14, 1294. https://doi.org/10.3390/w14081294
AMA Style
Jákói Z, Hodúr C, Beszédes S. Monitoring the Process of Anaerobic Digestion of Native and Microwave Pre-Treated Sludge by Dielectric and Rheological Measurements. Water. 2022; 14(8):1294. https://doi.org/10.3390/w14081294
Chicago/Turabian StyleJákói, Zoltán, Cecilia Hodúr, and Sándor Beszédes. 2022. "Monitoring the Process of Anaerobic Digestion of Native and Microwave Pre-Treated Sludge by Dielectric and Rheological Measurements" Water 14, no. 8: 1294. https://doi.org/10.3390/w14081294
Note that from the first issue of 2016, this journal uses article numbers instead of page numbers. See further details here.