
Assessing Seagrass Restoration Actions through a Micro-Bathymetry Survey Approach (Italy, Mediterranean Sea)

 ,
,  , , , ,
  ,
, 
 ,
,
Abstract
:1. Introduction
1.1. Seagrass Mapping
1.2. Georeferencing and Scaling Techniques
1.3. Image and Point Cloud Classification
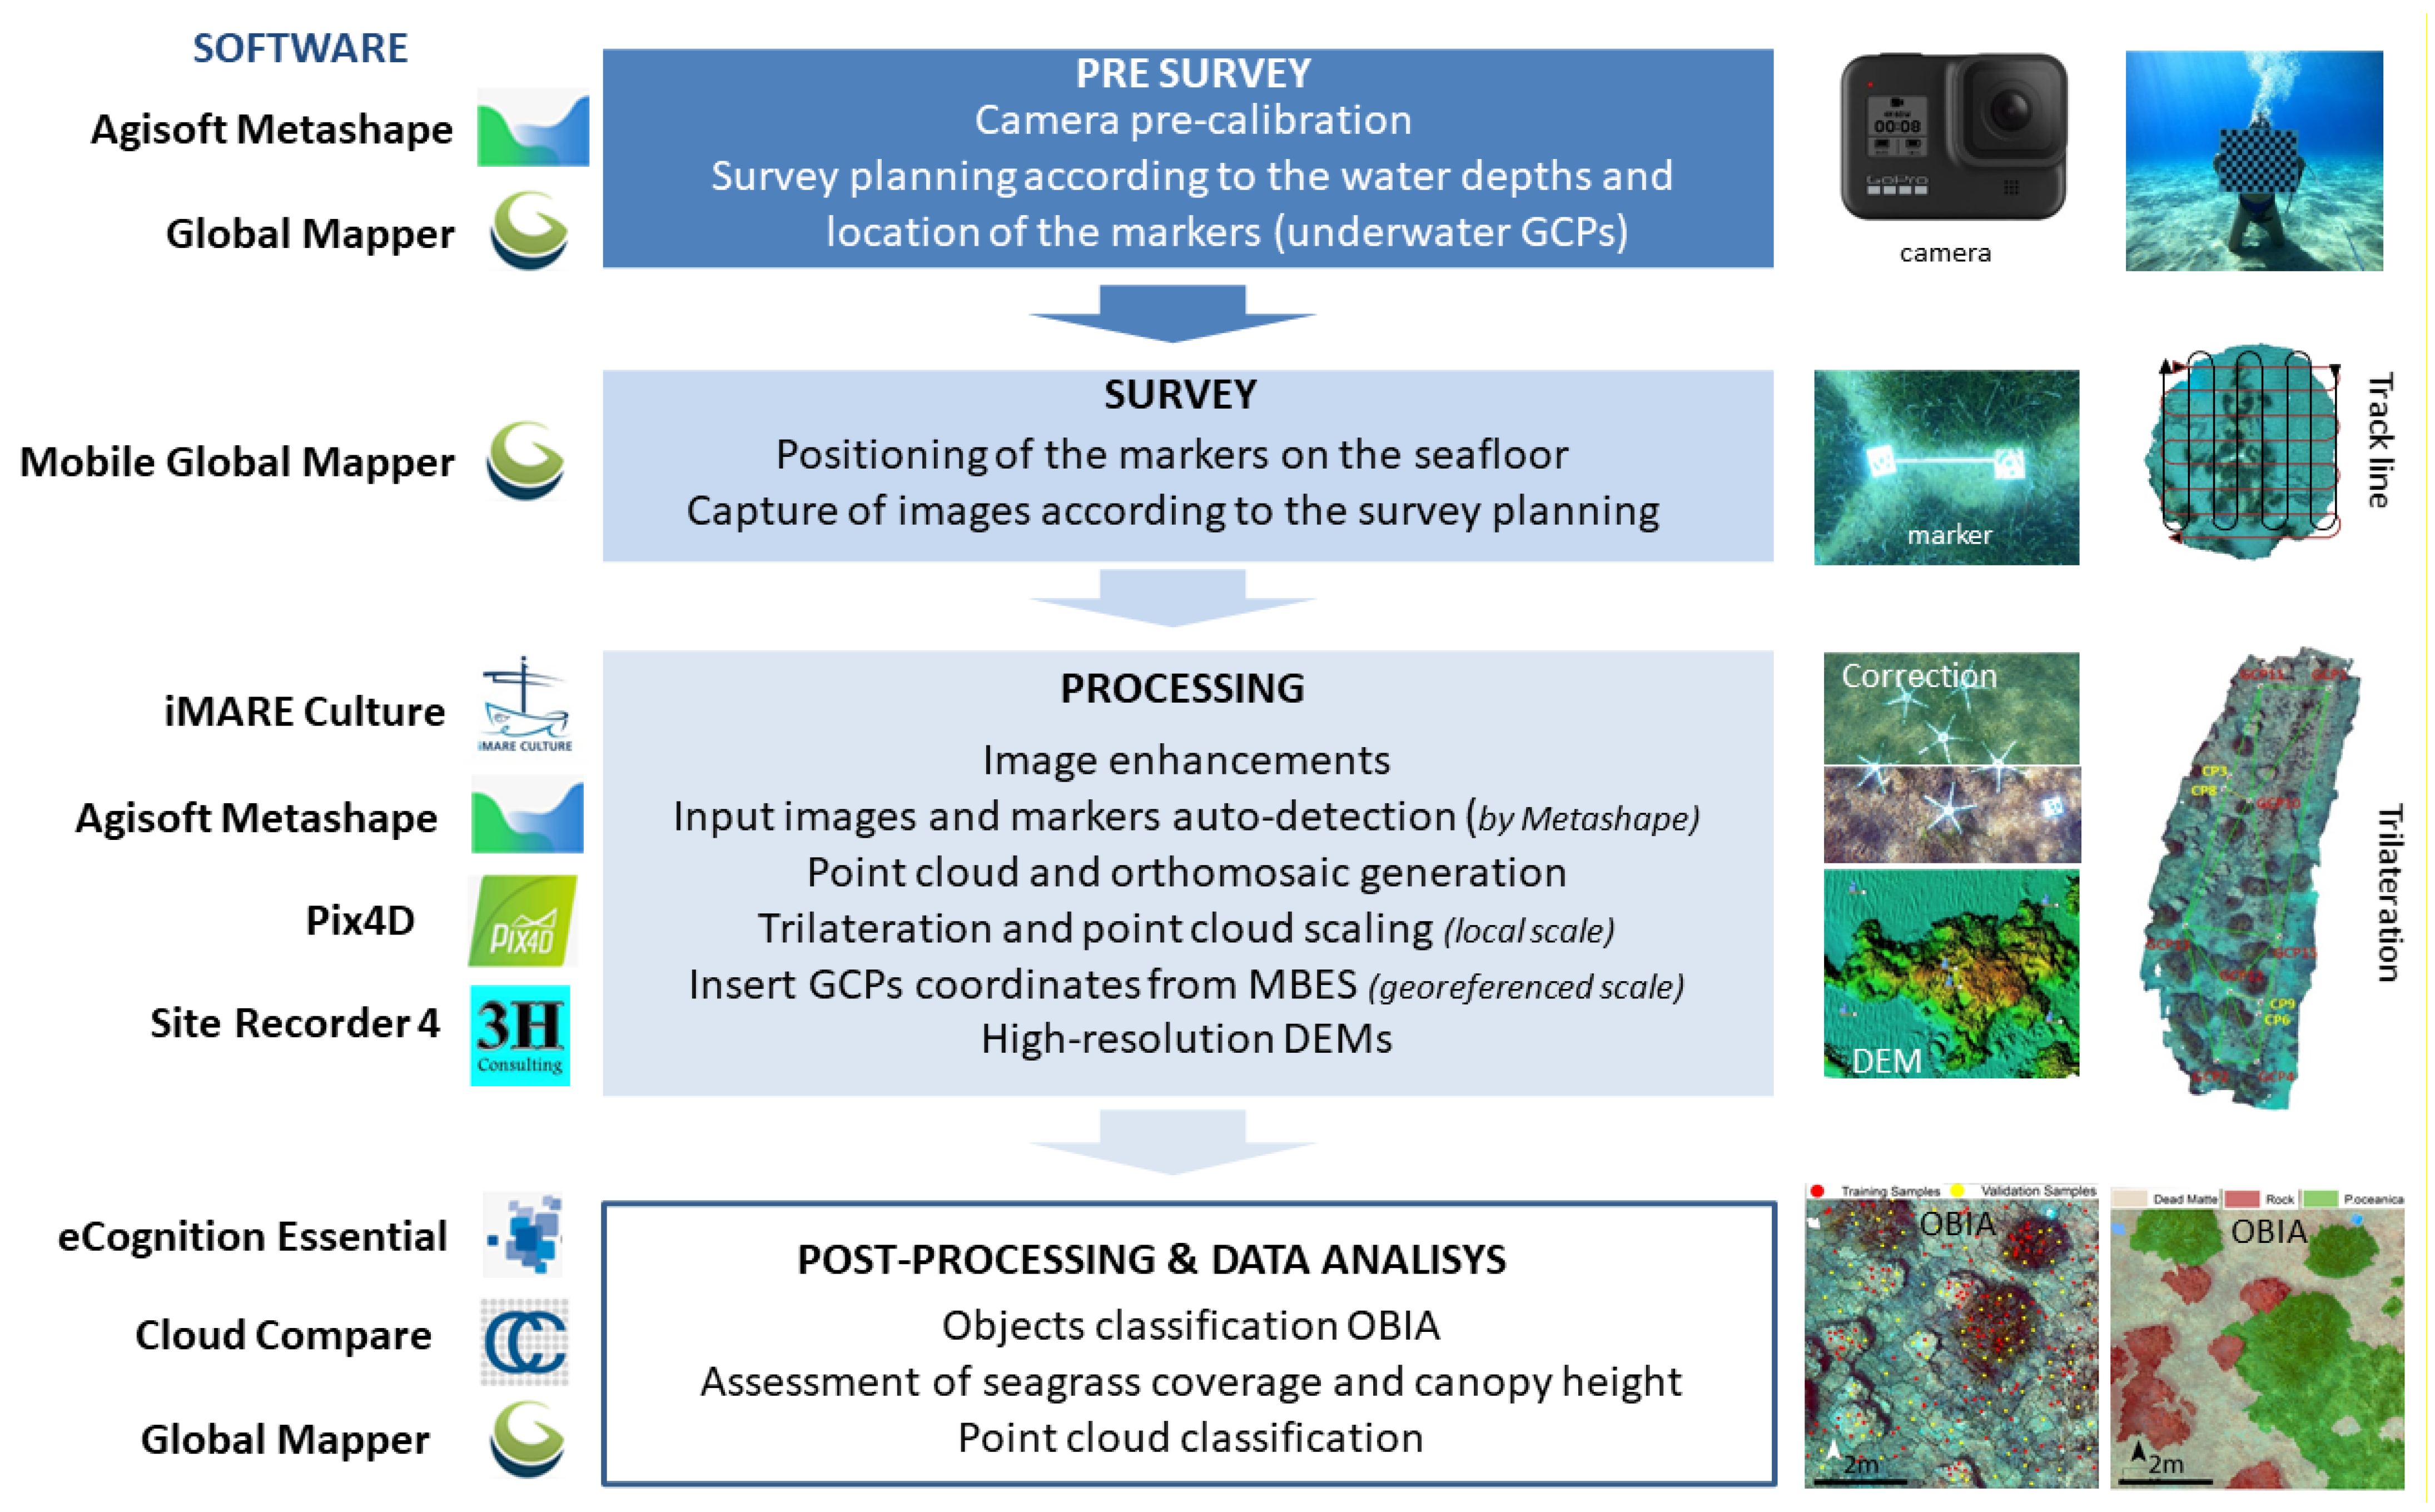
2. Materials and Methods
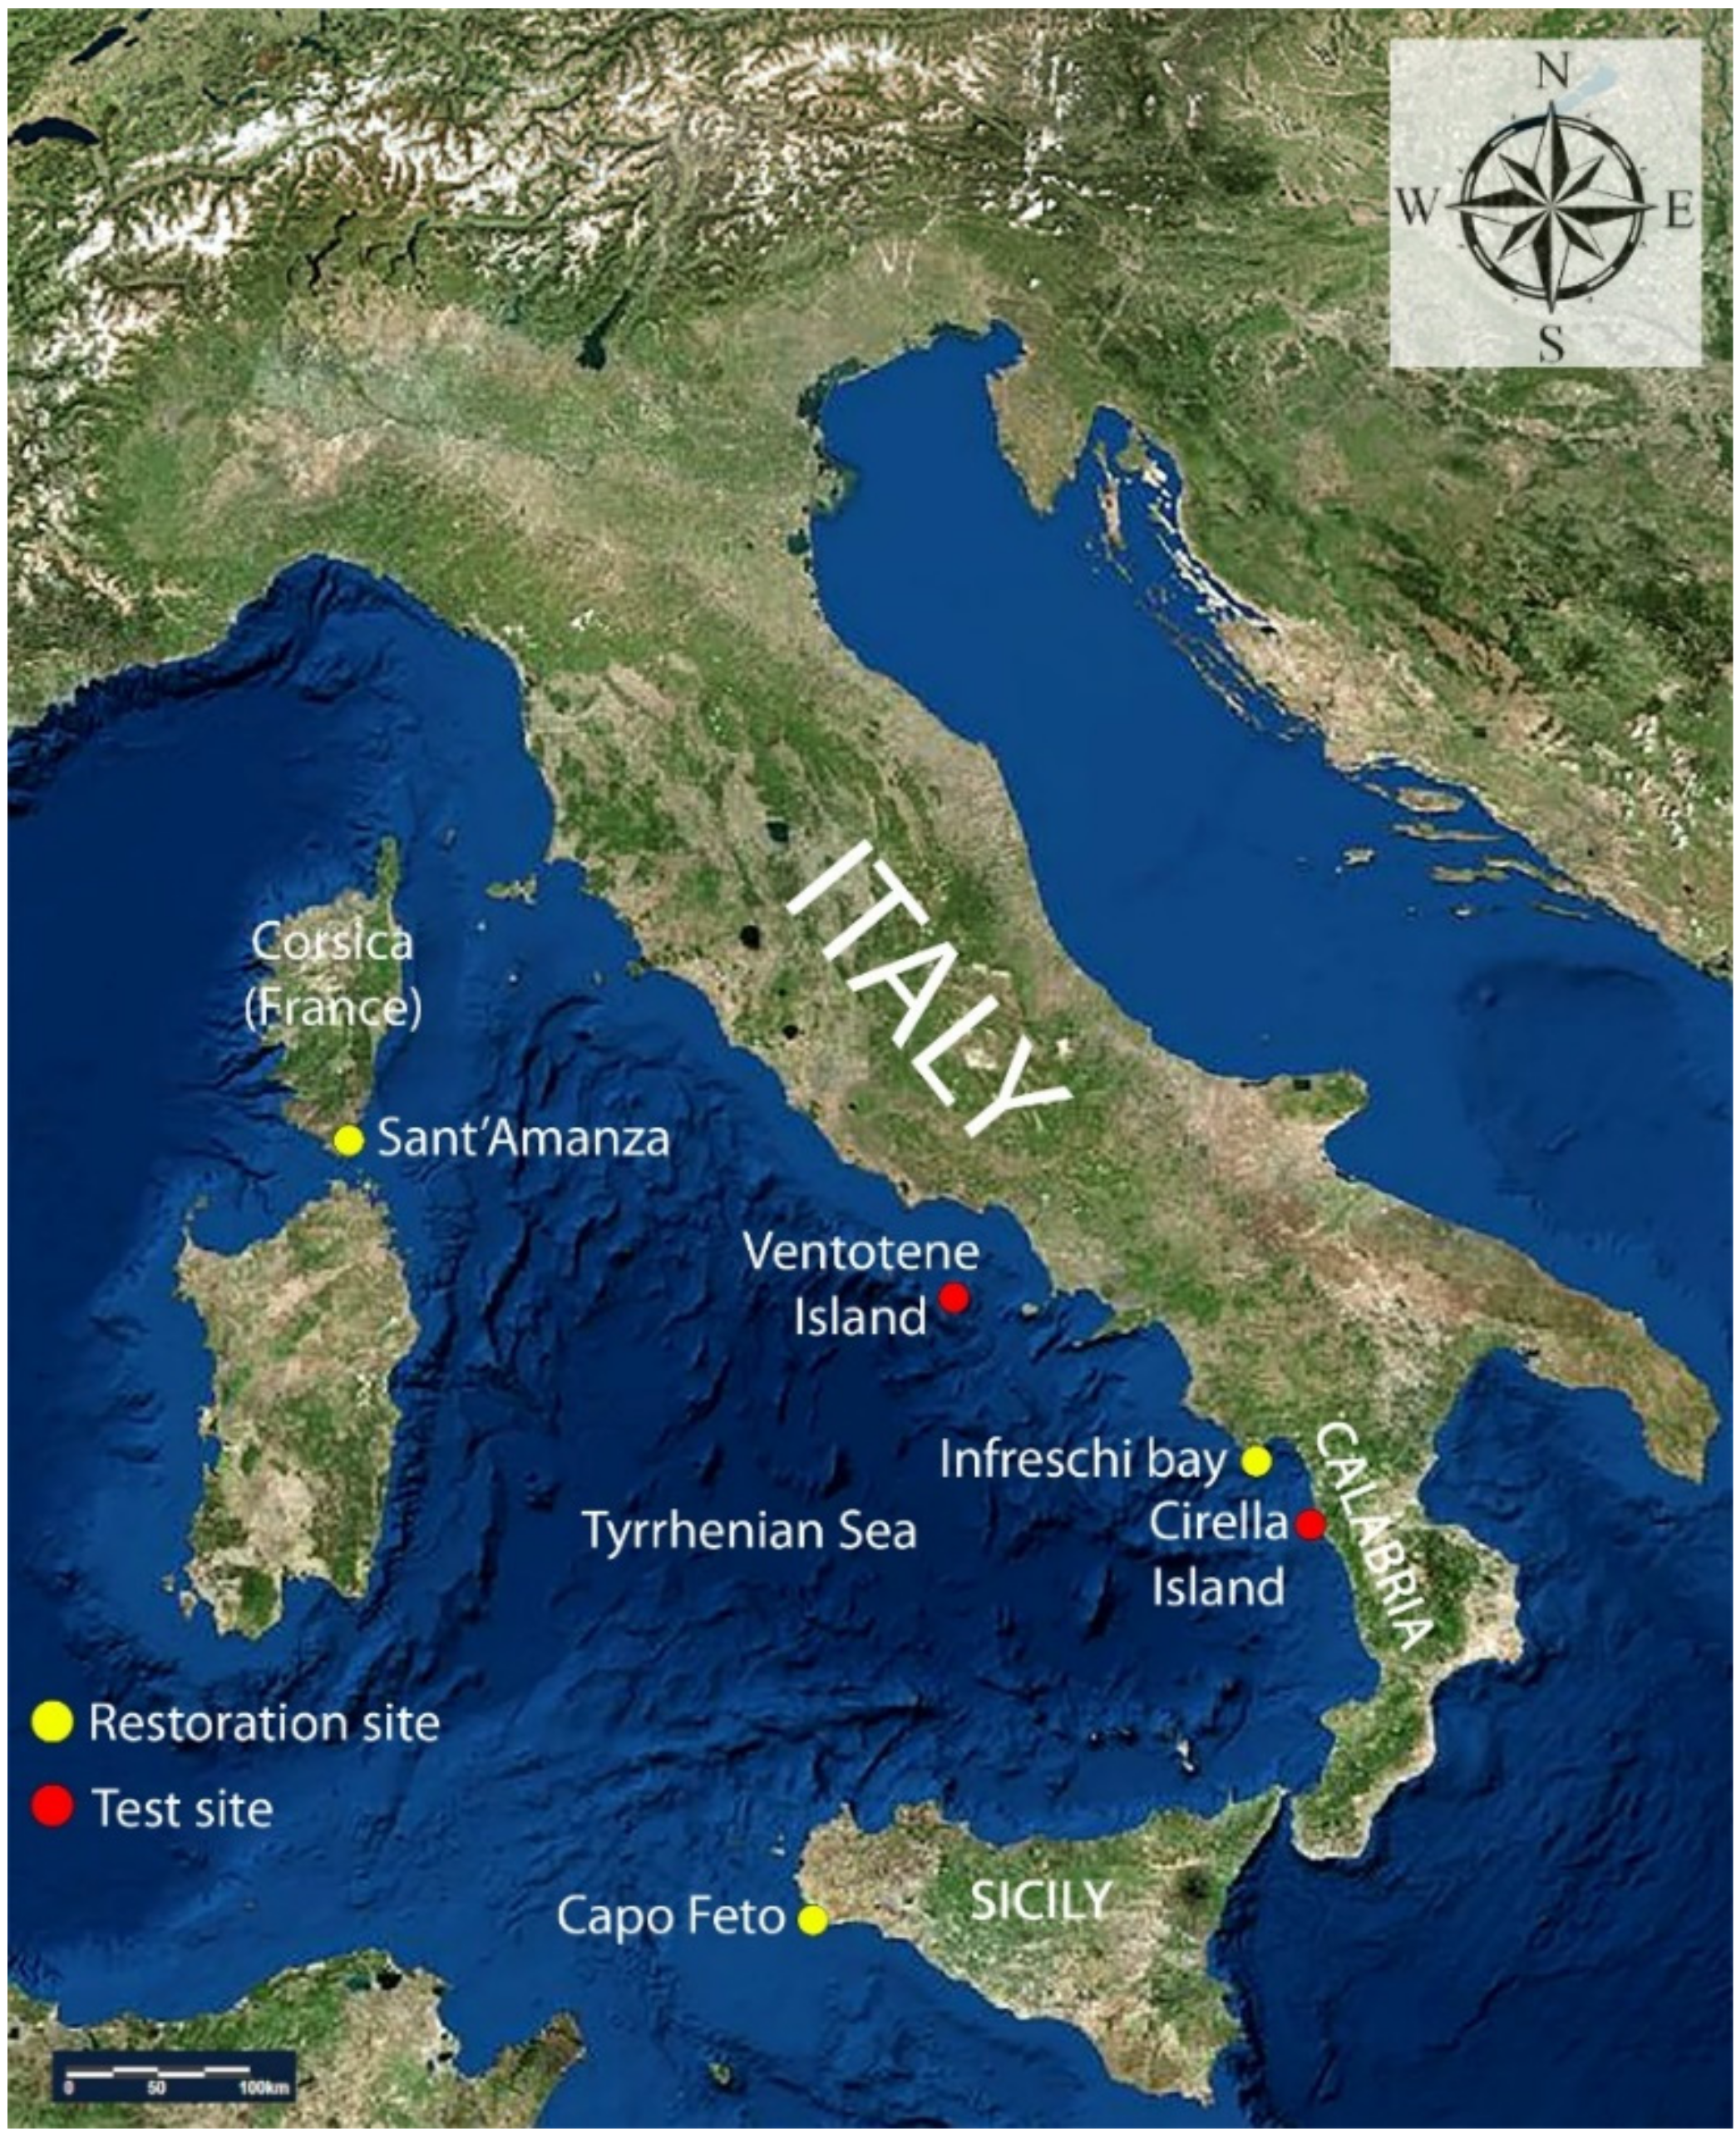
2.1. Study Sites
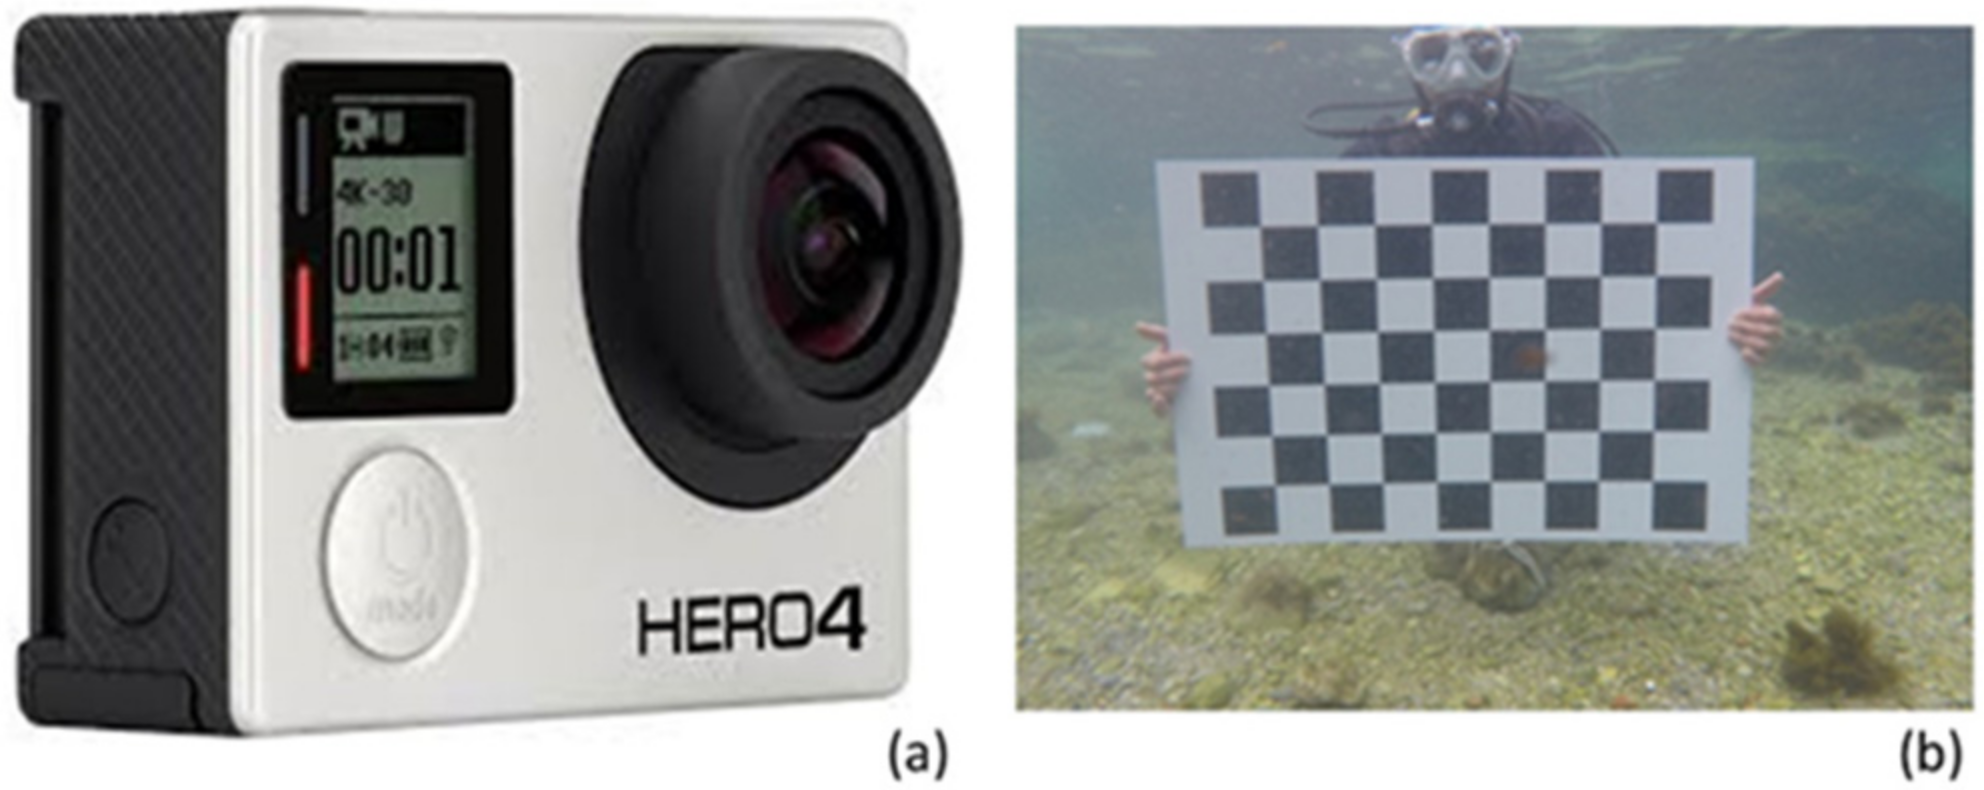
2.2. Equipment, Camera Calibration, and Survey Techniques
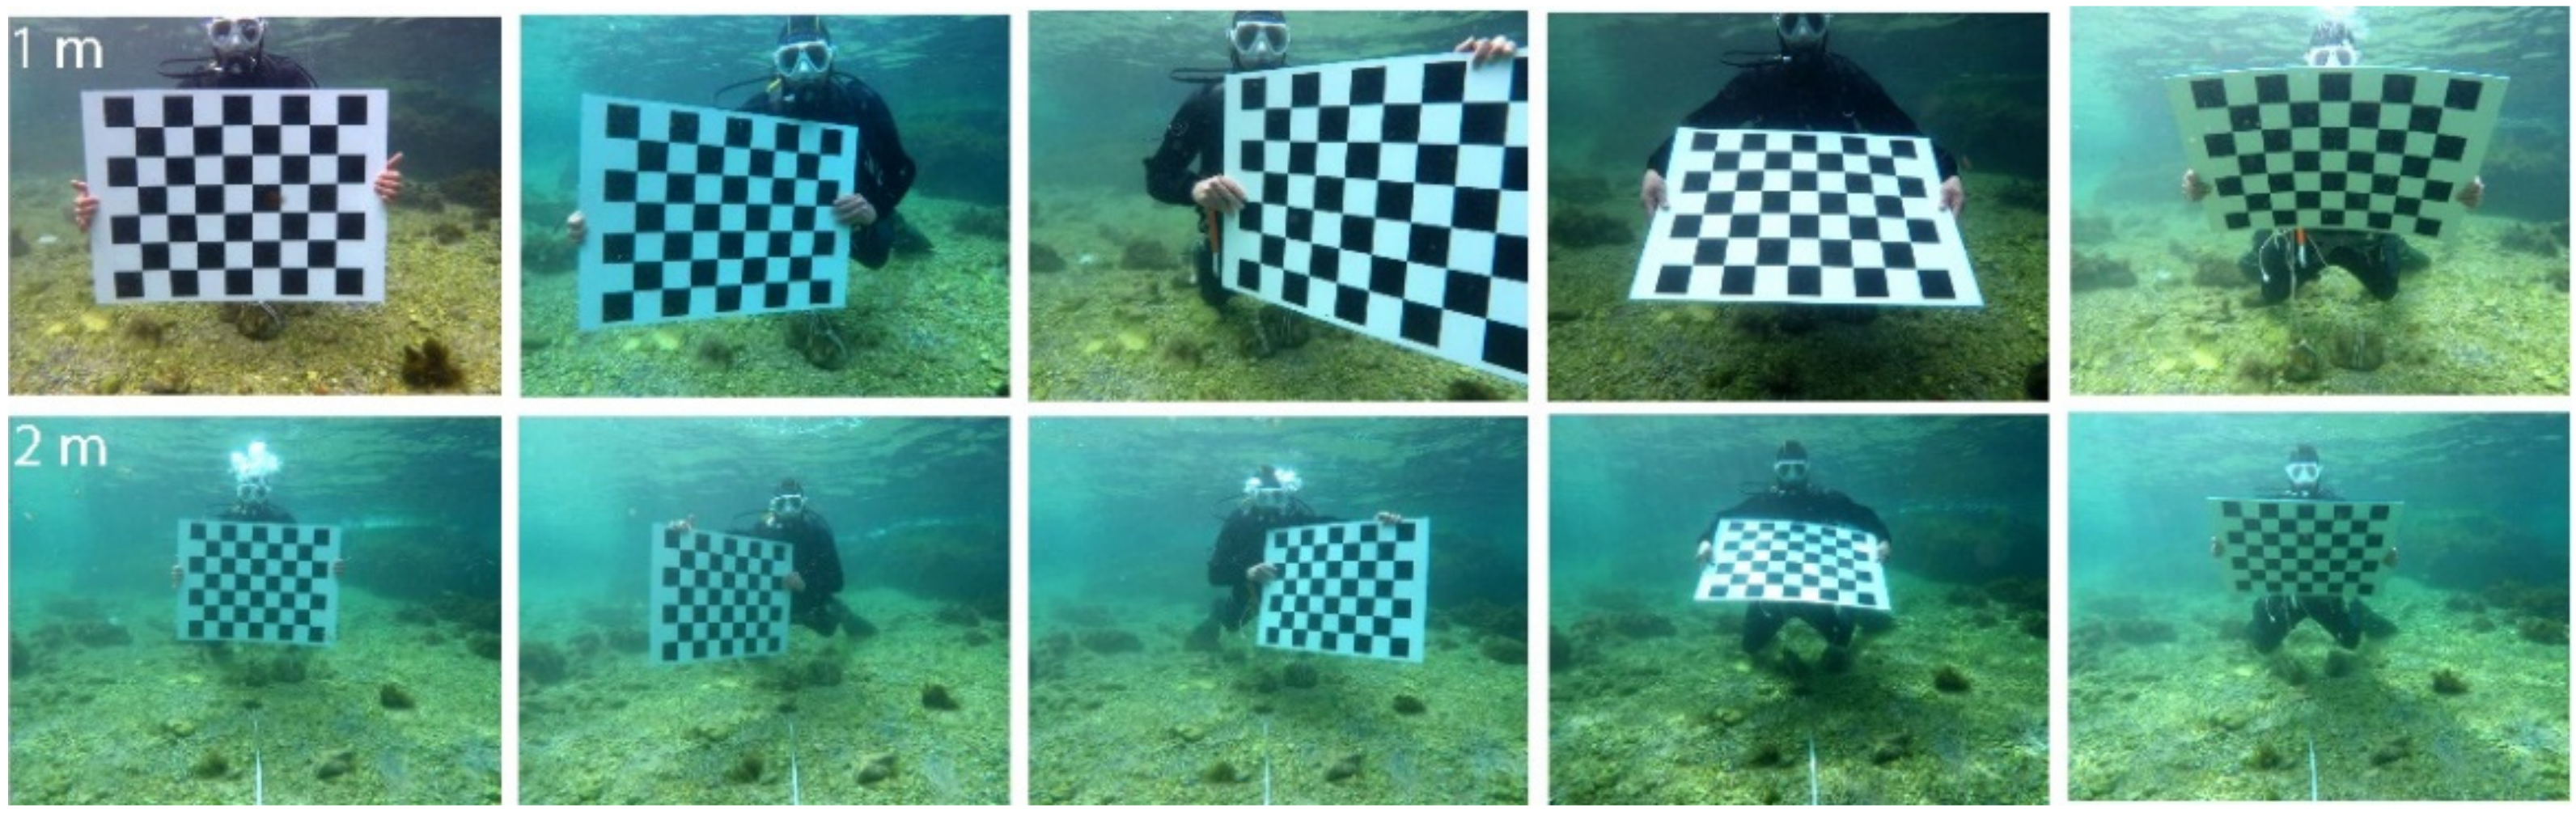
2.3. Camera Pre-Calibration
2.4. Underwater Photogrammetric Survey
2.5. Multibeam Data Collection and Accuracy
2.6. Image Enhancement Tools
2.7. Photogrammetric Processing
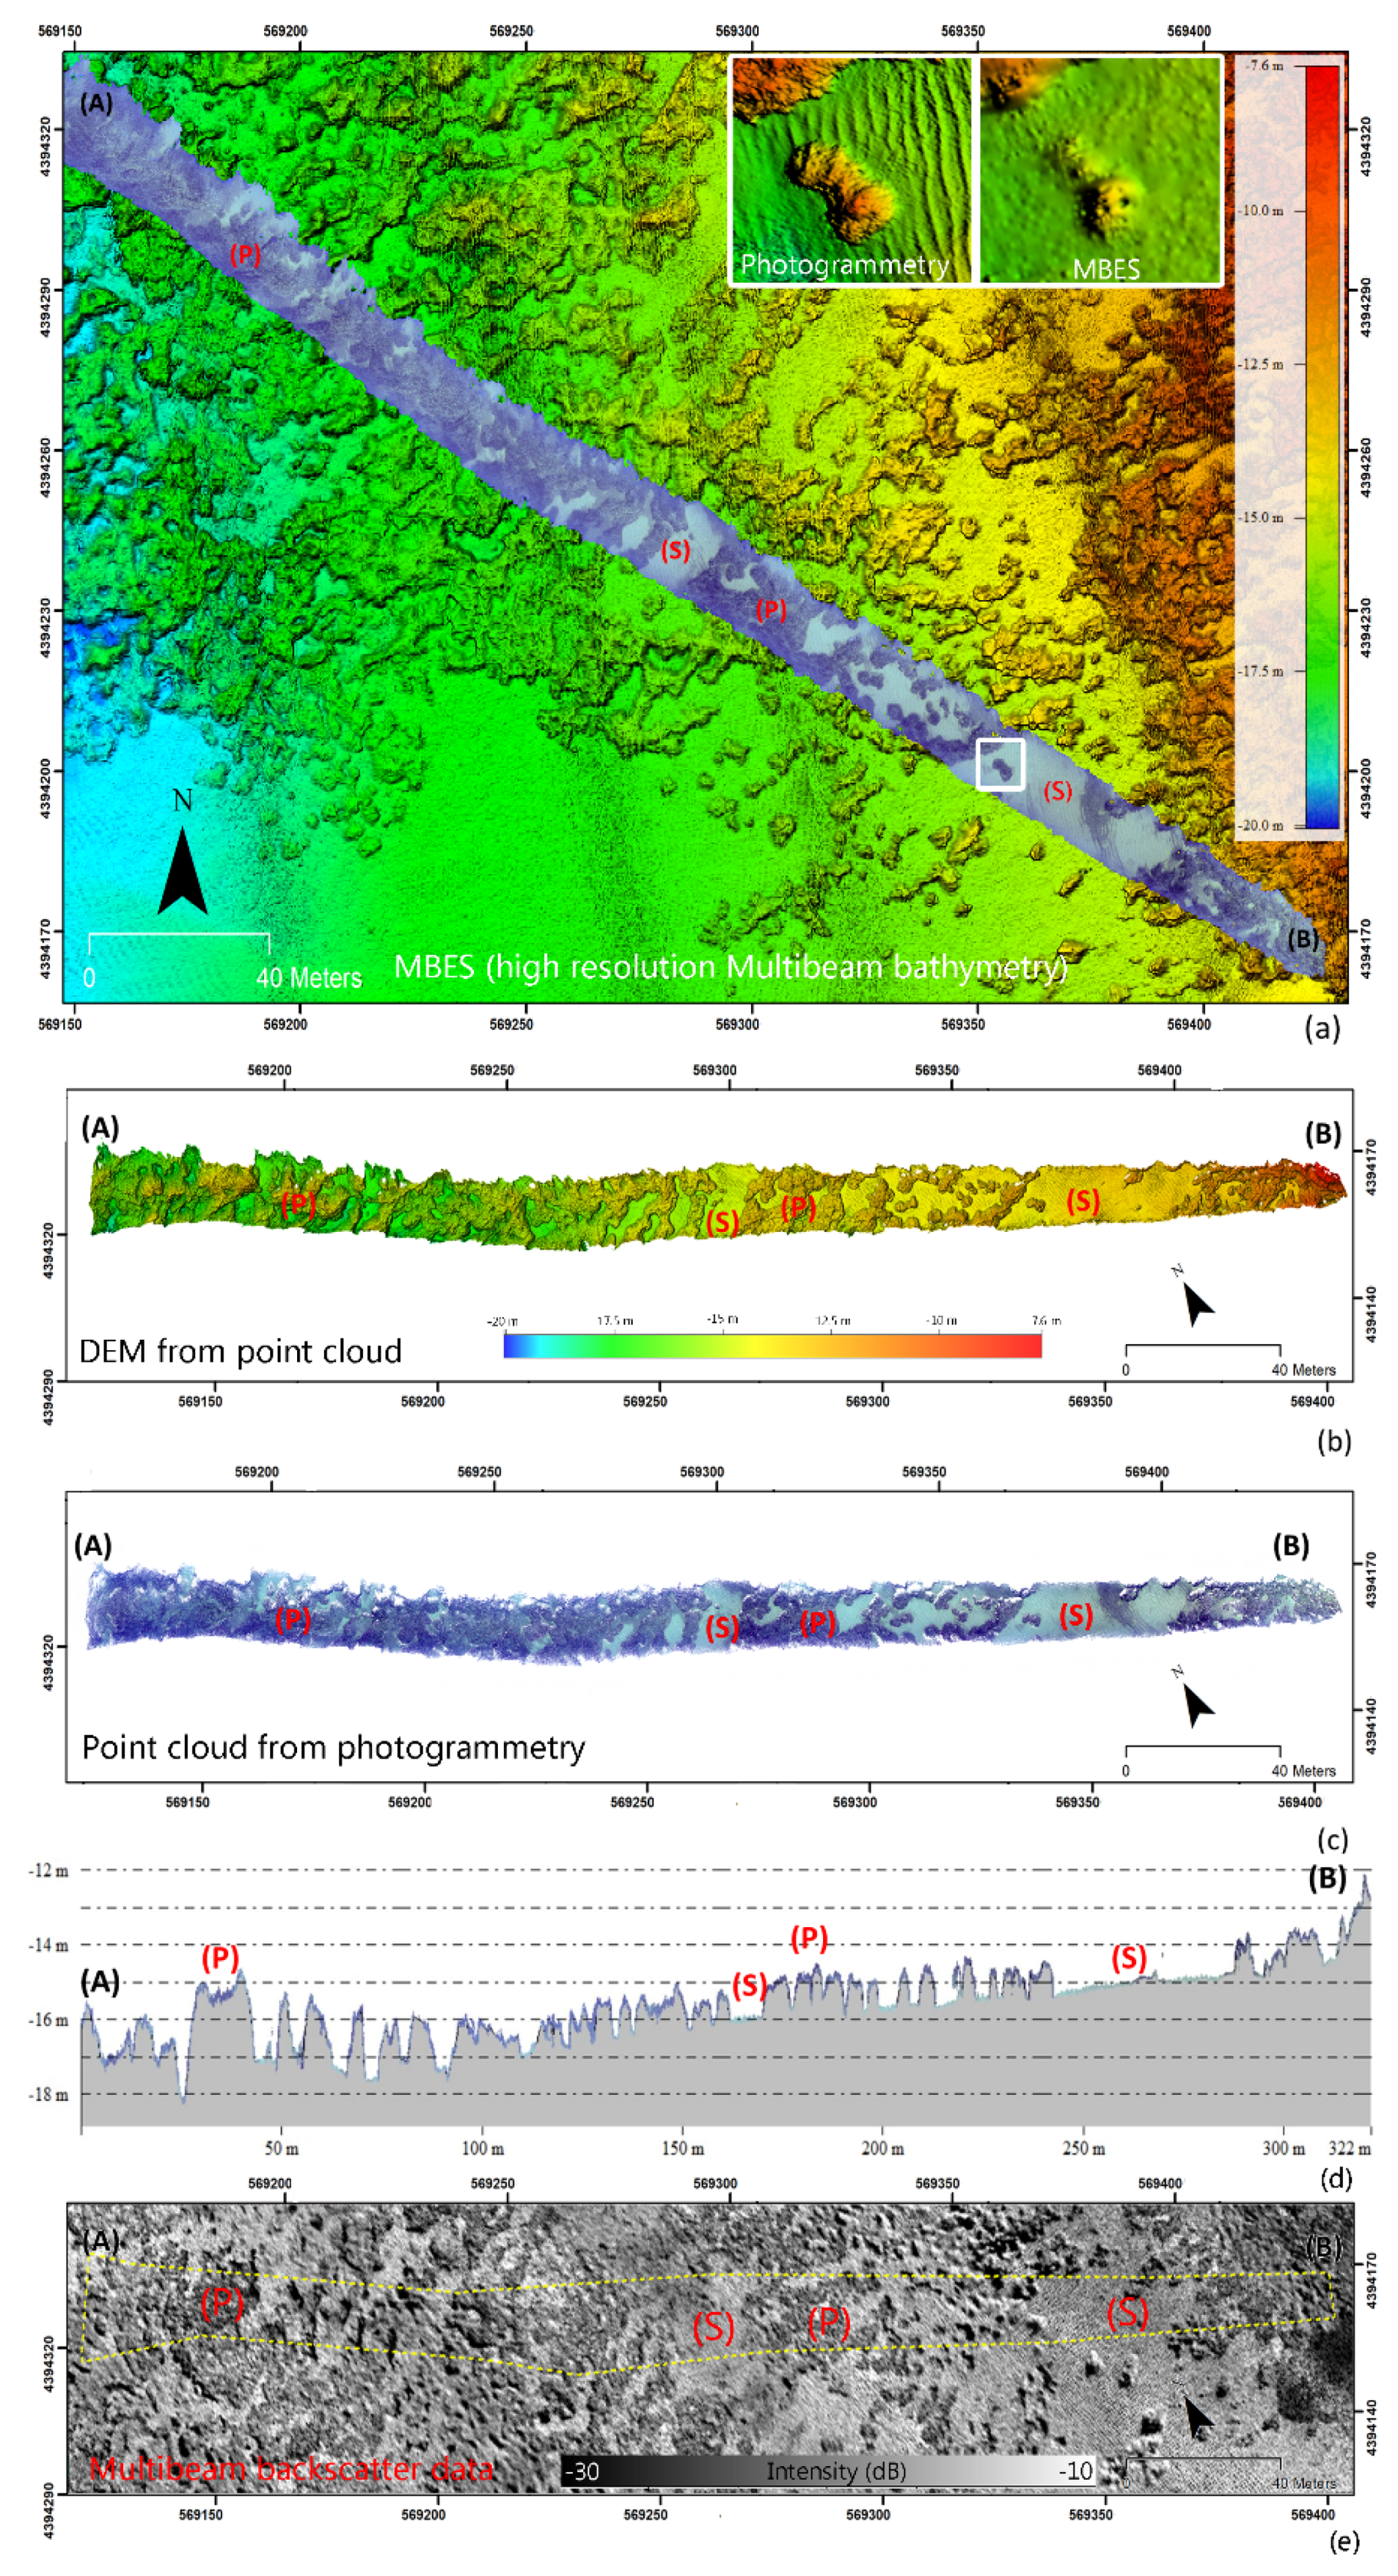
2.8. Co-Registration of Multibeam Bathymetry and 3D Trilateration Data at Local Scale
2.9. Data Classification and Analysis
3. Results
3.1. Object-Based Image Analysis (OBIA)
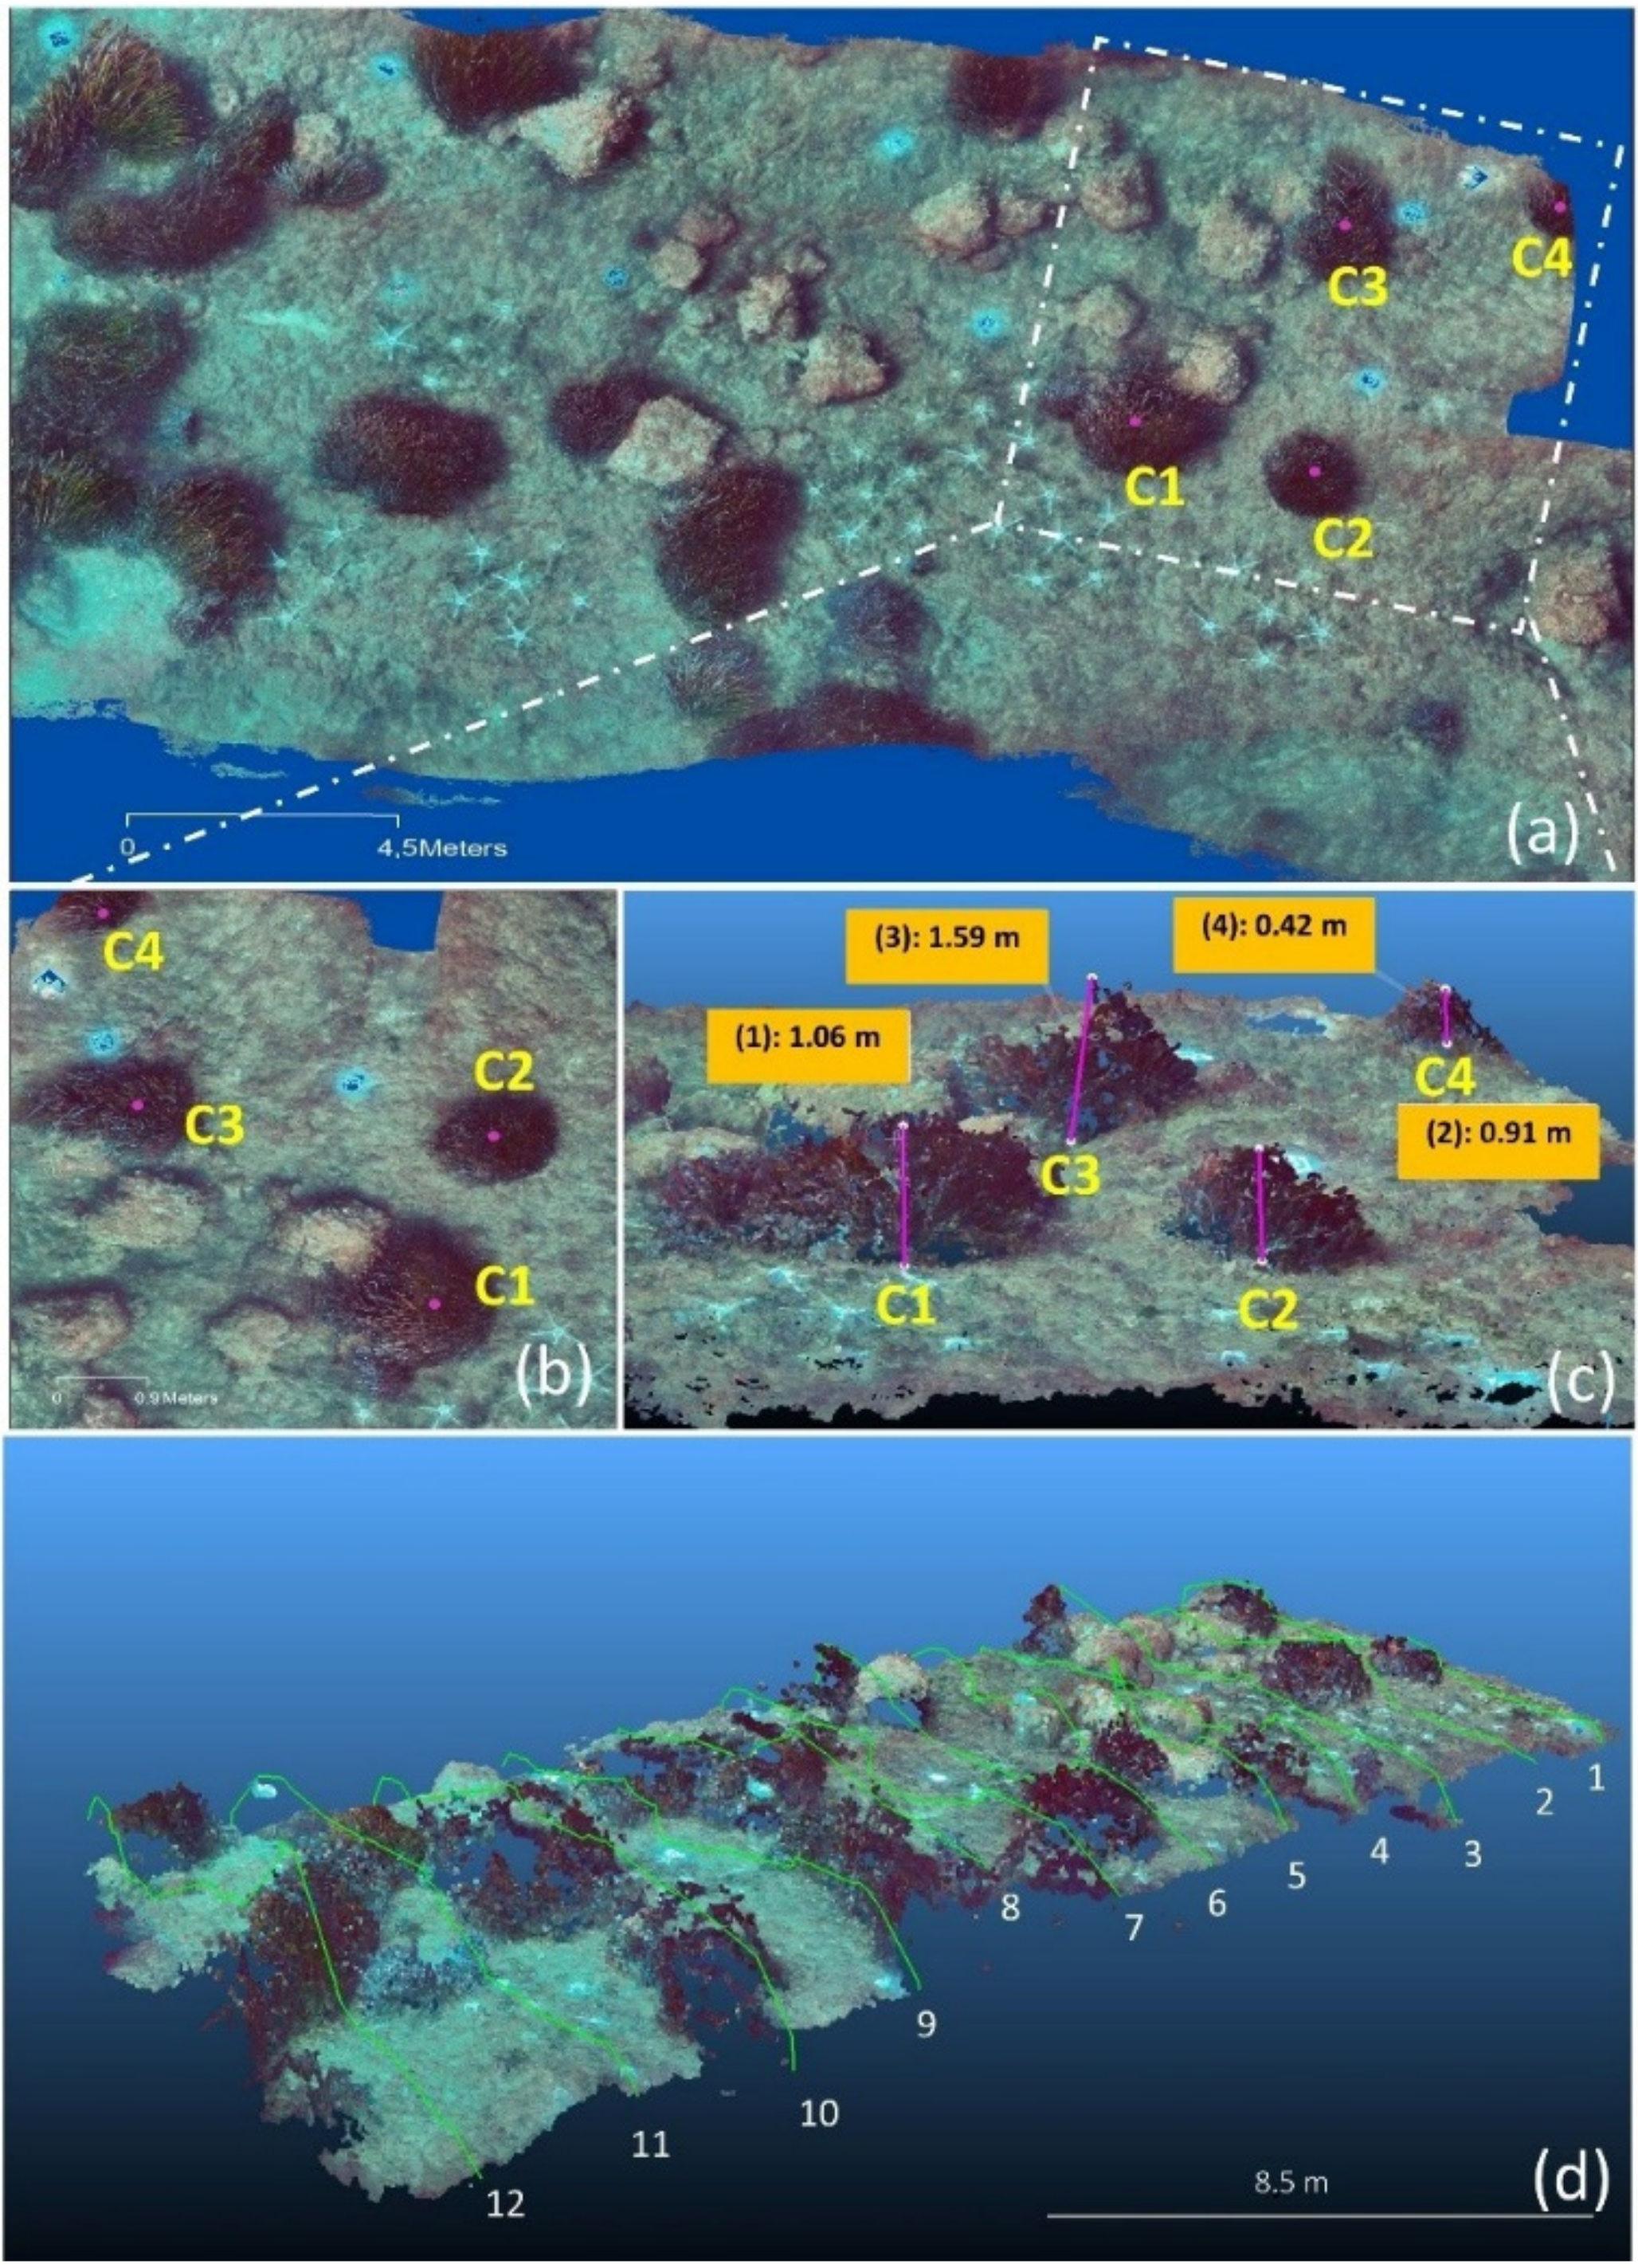
3.2. Three-Dimensional Measurements and Analysis
4. Discussion
5. Conclusions
Author Contributions
Funding
Institutional Review Board Statement
Informed Consent Statement
Data Availability Statement
Acknowledgments
Conflicts of Interest
References
- Monnier, B.; Pergent, G.; Valette-Sansevin, A.; Boudouresque, C.F.; Mateo, M.A.; Pergent-Martini, C. The Posidonia oceanica matte: A unique coastal carbon sink for climate change mitigation and implications for management. Vie et Milieu 2020, 70, 17–24. [Google Scholar]
- Costanza, R.; d’Arge, R.; de Groot, R.; Farber, S.; Grasso, M.; Hannon, B.; Limburg, K.; Naeem, S.; O’Neill, R.V.; Paruelo, J.; et al. The Value of the World’s Ecosystem Services and Natural Capital. Nature 1997, 387, 253–260. [Google Scholar] [CrossRef]
- Green, E.P.; Short, F.T. World Atlas of Seagrasses; University of California Press: Berkeley, CA, USA, 2003; ISBN 0-520-24047-2. [Google Scholar]
- Waycott, M.; Duarte, C.M.; Carruthers, T.J.B.; Orth, R.J.; Dennison, W.C.; Olyarnik, S.; Calladine, A.; Fourqurean, J.W.; Heck, K.L.; Hughes, A.R.; et al. Accelerating Loss of Seagrasses across the Globe Threatens Coastal Ecosystems. Proc. Natl. Acad. Sci. USA 2009, 106, 12377–12381. [Google Scholar] [CrossRef] [Green Version]
- Cullen-Unsworth, L.C.; Unsworth, R. A call for seagrass protection. Science 2018, 361, 446–448. [Google Scholar] [CrossRef] [PubMed]
- Katwijk, M.M.; Thorhaug, A.; Marbà, N.; Orth, R.J.; Duarte, C.M.; Kendrick, G.A.; Althuizen, I.H.J.; Balestri, E.; Bernard, G.; Cambridge, M.L.; et al. Global Analysis of Seagrass Restoration: The Importance of Large-scale Planting. J. Appl. Ecol. 2016, 53, 567–578. [Google Scholar] [CrossRef] [Green Version]
- Calvo, S.; Calvo, R.; Luzzu, F.; Raimondi, V.; Assenzo, M.; Cassetti, F.; Tomasello, A. Performance Assessment of Posidonia oceanica (L.) Delile Restoration Experiment on Dead Matte Twelve Years after Planting—Structural and Functional Meadow Features. Water 2021, 13, 724. [Google Scholar] [CrossRef]
- Boudouresque, C.-F.; Blanfuné, A.; Pergent, G.; Thibaut, T. Restoration of Seagrass Meadows in the Mediterranean Sea: A Critical Review of Effectiveness and Ethical Issues. Water 2021, 13, 1034. [Google Scholar] [CrossRef]
- Di Maida, G.; Tomasello, A.; Luzzu, F.; Scannavino, A.; Pirrotta, M.; Orestano, C.; Calvo, S. Discriminating between Posidonia oceanica Meadows and Sand Substratum Using Multibeam Sonar. ICES J. Mar. Sci. 2011, 68, 12–19. [Google Scholar] [CrossRef] [Green Version]
- Lo Iacono, C.; Mateo, M.A.; Gràcia, E.; Guasch, L.; Carbonell, R.; Serrano, L.; Serrano, O.; Dañobeitia, J. Very High-Resolution Seismo-Acoustic Imaging of Seagrass Meadows (Mediterranean Sea): Implications for Carbon Sink Estimates. Geophys. Res. Lett. 2008, 35, 18. [Google Scholar] [CrossRef]
- Veettil, B.K.; Ward, R.D.; Lima, M.D.A.C.; Stankovic, M.; Hoai, P.N.; Quang, N.X. Opportunities for Seagrass Research Derived from Remote Sensing: A Review of Current Methods. Ecol. Indic. 2020, 117, 106560. [Google Scholar] [CrossRef]
- Pasqualini, V.; Clabaut, P.; Pergent, G.; Benyoussef, L.; Pergent-Martini, C. Contribution of Side Scan Sonar to the Management of Mediterranean Littoral Ecosystems. Int. J. Remote Sens. 2000, 21, 367–378. [Google Scholar] [CrossRef]
- Pergent, G.; Monnier, B.; Clabaut, P.; Gascon, G.; Pergent-Martini, C.; Valette-Sansevin, A. Innovative Method for Optimizing Side-Scan Sonar Mapping: The Blind Band Unveiled. Estuar. Coast. Shelf Sci. 2017, 194, 77–83. [Google Scholar] [CrossRef]
- Rende, S.F.; Bosman, A.; Di Mento, R.; Bruno, F.; Lagudi, A.; Irving, A.D.; Dattola, L.; Giambattista, L.D.; Lanera, P.; Proietti, R.; et al. Ultra-High-Resolution Mapping of Posidonia oceanica (L.) Delile Meadows through Acoustic, Optical Data and Object-Based Image Classification. J. Mar. Sci. Eng. 2020, 8, 647. [Google Scholar] [CrossRef]
- Rende, F.S.; Irving, A.D.; Lagudi, A.; Bruno, F.; Scalise, S.; Cappa, P.; Montefalcone, M.; Bacci, T.; Penna, M.; Trabucco, B.; et al. Pilot application of 3D underwater imaging techniques for mapping Posidonia oceanica (L.) Delile meadows. Int. Arch. Photogramm. Remote Sens. Spat. Inf. Sci. 2015, 40, 177–181. [Google Scholar] [CrossRef] [Green Version]
- Ventura, D.; Bonifazi, A.; Gravina, M.F.; Belluscio, A.; Ardizzone, G. Mapping and Classification of Ecologically Sensitive Marine Habitats Using Unmanned Aerial Vehicle (UAV) Imagery and Object-Based Image Analysis (OBIA). Remote Sens. 2018, 10, 1331. [Google Scholar] [CrossRef] [Green Version]
- Tomasello, A.; Cassetti, F.P.; Savona, A.; Pampalone, V.; Pirrotta, M.; Calvo, S.; Signa, G.; Andolina, C.; Mazzola, A.; Vizzini, S.; et al. The use of very high resolution images for studying Posidonia oceanica reefs. Vie et Milieu 2020, 70, 25–35. [Google Scholar]
- Bryson, M.; Ferrari, R.; Figueira, W.; Pizarro, O.; Madin, J.; Williams, S.; Byrne, M. Characterization of Measurement Errors Using Structure-from-Motion and Photogrammetry to Measure Marine Habitat Structural Complexity. Ecol. Evol. 2017, 7, 5669–5681. [Google Scholar] [CrossRef]
- Nocerino, E.; Menna, F.; Gruen, A.; Troyer, M.; Capra, A.; Castagnetti, C.; Rossi, P.; Brooks, A.J.; Schmitt, R.J.; Holbrook, S.J. Coral Reef Monitoring by Scuba Divers Using Underwater Photogrammetry and Geodetic Surveying. Remote Sens. 2020, 12, 3036. [Google Scholar] [CrossRef]
- Piazza, P.; Cummings, V.; Guzzi, A.; Hawes, I.; Lohrer, D.; Marini, S.; Marriott, P.; Menna, F.; Nocerino, E.; Peirano, A.; et al. Underwater photogrammetry in Antarctica: Long-term observations in benthic ecosystems and legacy data rescue. Polar Biol. 2019, 42, 1061–1079. [Google Scholar] [CrossRef] [Green Version]
- Piazza, P.; Cummings, V.J.; Lohrer, D.M.; Marini, S.; Marriott, P.; Menna, F.; Nocerino, E.; Peirano, A.; Schiapa-relli, S. Divers-operated underwater photogrammetry: Applications in the study of antarctic benthos. Int. Arch. Photogramm. Remote Sens. Spat. Inf. Sci. 2018, 42, 885–892. [Google Scholar] [CrossRef] [Green Version]
- Rende, S.F.; Irving, A.D.; Bacci, T.; Parlagreco, L.; Bruno, F.; De Filippo, F.; Montefalcone, M.; Penna, M.; Trabucco, B.; Di Mento, R.; et al. Advances in Micro-Cartography: A Two-Dimensional Photo Mosaicing Technique for Seagrass Monitoring. Estuar. Coast. Shelf Sci. 2015, 167, 475–486. [Google Scholar] [CrossRef]
- Marre, G.; Holon, F.; Luque, S.; Boissery, P.; Deter, J. Monitoring Marine Habitats With Photogrammetry: A Cost-Effective, Accurate, Precise and High-Resolution Reconstruction Method. Front. Mar. Sci. 2019, 6, 1–15. [Google Scholar] [CrossRef]
- Marre, G.; Deter, J.; Holon, F.; Boissery, P.; Luque, S. Fine-Scale Automatic Mapping of Living Posidonia oceanica Seagrass Beds with Underwater Photogrammetry. Mar. Ecol. Prog. Ser. 2020, 643, 63–74. [Google Scholar] [CrossRef]
- Pasqualini, V.; Pergent-Martini, C.; Clabaut, P.; Marteel, H.; Pergent, G. Integration of aerial remote sensing, photogrammetry, and GIS technologies in seagrass mapping. Photogramm. Eng. Remote Sens. 2001, 67, 99–105. [Google Scholar]
- Mizuno, K.; Asada, A.; Matsumoto, Y.; Sugimoto, K.; Fujii, T.; Yamamuro, M.; Fortes, M.D.; Sarceda, M.; Jimenez, L.A. A Simple and Efficient Method for Making a High-Resolution Seagrass Map and Quantification of Dugong Feeding Trail Distribution: A Field Test at Mayo Bay, Philippines. Ecol. Inform. 2017, 38, 89–94. [Google Scholar] [CrossRef]
- Casella, E.; Collin, A.; Harris, D.; Ferse, S.; Bejarano, S.; Parravicini, V.; Hench, J.L.; Rovere, A. Mapping Coral Reefs Using Consumer-Grade Drones and Structure from Motion Photogrammetry Techniques. Coral Reefs 2017, 36, 269–275. [Google Scholar] [CrossRef]
- Ventura, D.; Mancini, G.; Casoli, E.; Pace, D.S.; Lasinio, G.J.; Belluscio, A.; Ardizzone, G. Seagrass Restoration Monitoring and Shallow-Water Benthic Habitat Mapping through a Photogrammetry-Based Protocol. J. Environ. Manag. 2022, 304, 114262. [Google Scholar] [CrossRef]
- Shortis, M. Camera Calibration Techniques for Accurate Measurement Underwater. In 3D Recording and Interpretation for Maritime Archaeology; Coastal Research Library; McCarthy, J.K., Benjamin, J., Winton, T., van Duivenvoorde, W., Eds.; Springer International Publishing: Cham, Switzerland, 2019; Volume 31, pp. 11–27. ISBN 978-3-030-03634-8. [Google Scholar]
- Menna, F.; Nocerino, E.; Fassi, F.; Remondino, F. Geometric and optic characterization of a hemispherical dome port for underwater photogrammetry. Sensors 2016, 16, 48. [Google Scholar] [CrossRef] [Green Version]
- Mangeruga, M.; Cozza, M.; Bruno, F. Evaluation of Underwater Image Enhancement Algorithms under Different Environmental Conditions. J. Mar. Sci. Eng. 2018, 6, 10. [Google Scholar] [CrossRef] [Green Version]
- Kwasnitschka, T.; Köser, K.; Sticklus, J.; Rothenbeck, M.; Weiß, T.; Wenzlaff, E.; Schoening, T.; Triebe, L.; Steinführer, A.; Devey, C.; et al. DeepSurveyCam—A Deep Ocean Optical Mapping System. Sensors 2016, 16, 164. [Google Scholar] [CrossRef] [Green Version]
- Johnson-Roberson, M.; Bryson, M.; Friedman, A.; Pizarro, O.; Troni, G.; Ozog, P.; Henderson, J.C. High-Resolution Underwater Robotic Vision-Based Mapping and Three-Dimensional Reconstruction for Archaeology. J. Field Robot. 2017, 34, 625–643. [Google Scholar] [CrossRef] [Green Version]
- Bonin-Font, F.; Campos, M.M.; Codina, G.O. Towards Visual Detection, Mapping and Quantification of Posidonia oceanica Using a Lightweight AUV. IFAC-PapersOnLine 2016, 49, 500–505. [Google Scholar] [CrossRef]
- Drap, P.; Seinturier, J.; Conte, G.; Caiti, A.; Scaradozzi, D.; Zanoli, S.M.; Gambogi, P. Underwater cartography for archaeology in the VENUS project. Geomatica 2008, 62, 419–427. [Google Scholar]
- Drap, P.; Seinturier, J.; Hijazi, B.; Merad, D.; Boi, J.-M.; Chemisky, B.; Seguin, E.; Long, L. The ROV 3D Project: Deep-Sea Underwater Survey Using Photogrammetry: Applications for Underwater Archaeology. J. Comput. Cult. Herit. 2015, 8, 1–24. [Google Scholar] [CrossRef]
- Menna, F.; Nocerino, E.; Nawaf, M.; Seinturier, J.; Torresani, A.; Drap, P.; Remondino, F.; Chemisky, B. Towards Real-Time Underwater Photogrammetry for Subsea Metrology Applications. In Proceedings of the OCEANS 2019—Marseille, Marseille, France, 17–20 June 2019; pp. 1–10. [Google Scholar] [CrossRef]
- Balletti, C.; Beltrame, C.; Costa, E.; Guerra, F.; Vernier, P. Underwater photogrammetry and 3D reconstruction of marble cargos shipwreck. Int. Arch. Photogramm. Remote Sens. Spat. Inf. Sci. 2015, XL-5-W5, 7–13. [Google Scholar] [CrossRef] [Green Version]
- Bass, G.F. Archaeology Under Water; Thames & Hudson and Praeger: London, UK; New York, NY, USA, 1966. [Google Scholar]
- Green, J.N. Maritime Archaeology: A Technical Handbook, 2nd ed.; Routledge: London, UK; New York, NY, USA, 2020; ISBN 978-0-367-60560-5. [Google Scholar]
- Bojakowski, P.; Bojakowski, K.C.; Naughton, P. A Comparison Between Structure from Motion and Direct Survey Methodologies on the Warwick. J. Marit. Archaeol. 2015, 10, 159–180. [Google Scholar] [CrossRef]
- Skarlatos, D.; Menna, F.; Nocerino, E.; Agrafiotis, P. Precision potential of underwater networks for archaeological excavation through trilateration and photogrammetry. Int. Arch. Photogramm. Remote Sens. Spat. Inf. Sci. 2019, 42, 175–180. [Google Scholar] [CrossRef] [Green Version]
- Calantropio, A.; Chiabrando, F.; Auriemma, R. Photogrammetric underwater and UAS surveys of archaeological sites: The case study of the roman shipwreck of Torre Santa Sabina. Int. Arch. Photogramm. Remote Sens. Spat. Inf. Sci. 2021, XLIII-B2-2021, 643–650. [Google Scholar] [CrossRef]
- Chemisky, B.; Menna, F.; Nocerino, E.; Drap, P. Underwater Survey for Oil and Gas Industry: A Review of Close Range Optical Methods. Remote Sens. 2021, 13, 2789. [Google Scholar] [CrossRef]
- Menna, F.; Agrafiotis, P.; Georgopoulos, A. State of the Art and Applications in Archaeological Underwater 3D Recording and Mapping. J. Cult. Herit. 2018, 33, 231–248. [Google Scholar] [CrossRef]
- Massot-Campos, M.; Oliver-Codina, G. Optical Sensors and Methods for Underwater 3D Reconstruction. Sensors 2015, 15, 9864. [Google Scholar] [CrossRef] [PubMed] [Green Version]
- Shortis, M.R.; Ravanbakskh, M.; Shaifat, F.; Harvey, E.S.; Mian, A.; Seager, J.W.; Culverhouse, P.F.; Cline, D.E.; Edgington, D.R. A Review of Techniques for the Identification and Measurement of Fish in Underwater Stereo-Video Image Sequences. In Proceedings of the Videometrics, Range Imaging, and Applications XII; and Automated Visual Inspection; SPIE: Munich, Germany, 2013; Volume 8791, pp. 107–116. [Google Scholar]
- Istenič, K.; Gracias, N.; Arnaubec, A.; Escartín, J.; Garcia, R. Automatic Scale Estimation of Structure from Motion Based 3D Models Using Laser Scalers in Underwater Scenarios. ISPRS J. Photogramm. Remote Sens. 2020, 159, 13–25. [Google Scholar] [CrossRef]
- Menna, F.; Nocerino, E.; Chemisky, B.; Remondino, F.; Drap, P. Accurate scaling and levelling in underwater photogrammetry with a pressure sensor. Int. Arch. Photogramm. Remote Sens. Spat. Inf. Sci. 2021, XLIII-B2-2021, 667–672. [Google Scholar] [CrossRef]
- Rule, N. The Direct Survey Method (DSM) of Underwater Survey, and Its Application Underwater. Int. J. Naut. Archaeol. 1989, 18, 157–162. [Google Scholar] [CrossRef]
- Costa, E. The progress of survey techniques in underwater sites: The case study of Cape Stoba shipwreck. Int. Arch. Photogramm. Remote Sens. Spat. Inf. Sci. 2019, 42, 69–75. [Google Scholar] [CrossRef] [Green Version]
- Neyer, F.; Nocerino, E.; Gruen, A. Monitoring Coral Growth—The Dichotomy Between Underwater Photogrammetry and Geodetic Control Network. Int. Arch. Photogramm. Remote Sens. Spat. Inf. Sci. 2018, 422, 759–766. [Google Scholar] [CrossRef] [Green Version]
- Azzopardi, E.; Sayer, M. Estimation of Depth and Temperature in 47 Models of Diving Decompression Computer. Underw. Technol. 2012, 31, 3–12. [Google Scholar] [CrossRef]
- Cramer, M.; Stallmann, D.; Haala, N. Direct georeferencing using GPS/inertial exterior orientations for photogrammetric applications. Int. Arch. Photogramm. Remote Sens. 2000, 33, 198–205. [Google Scholar]
- Abadie, A.; Boissery, P.; Viala, C. Georeferenced Underwater Photogrammetry to Map Marine Habitats and Submerged Artificial Structures. Photogramm. Rec. 2018, 33, 448–469. [Google Scholar] [CrossRef]
- Bruno, F.; Lagudi, A.; Passaro, S.; Saggoimo, R. Opto-acoustic 3D reconstruction of the “Punta Scifo D” shipwreck. In 1st IMEKO TC4 International Workshop on Metrology for Geotechnics; MetroGeotechnics: Benevento, Italy, 2016; pp. 327–333. [Google Scholar]
- Hossain, M.D.; Chen, D. Segmentation for Object-Based Image Analysis (OBIA): A Review of Algorithms and Challenges from Remote Sensing Perspective. ISPRS J. Photogramm. Remote Sens. 2019, 150, 115–134. [Google Scholar] [CrossRef]
- Roelfsema, C.M.; Lyons, M.; Kovacs, E.M.; Maxwell, P.; Saunders, M.I.; Samper-Villarreal, J.; Phinn, S.R. Multi-Temporal Mapping of Seagrass Cover, Species and Biomass: A Semi-Automated Object Based Image Analysis Approach. Remote Sens. Environ. 2014, 150, 172–187. [Google Scholar] [CrossRef]
- Badenko, V.; Zotov, D.; Muromtseva, N.; Volkova, Y.; Chernov, P. Comparison of software for airborne laser scanning data processing in smart city applications. Int. Arch. Photogramm. Remote Sens. Spat. Inf. Sci. 2019, XLII-5-W2, 9–13. [Google Scholar] [CrossRef] [Green Version]
- Pirrotta, M.; Tomasello, A.; Scannavino, A.; Maida, G.D.; Luzzu, F.; Bellissimo, G.; Bellavia, C.; Costantini, C.; Orestano, C.; Sclafani, G.; et al. Transplantation Assessment of Degraded Posidonia oceanica Habitats: Site Selection and Long-Term Monitoring. Mediterr. Mar. Sci. 2015, 16, 591–604. [Google Scholar] [CrossRef] [Green Version]
- Lester, S.E.; Dubel, A.K.; Hernán, G.; McHenry, J.; Rassweiler, A. Spatial Planning Principles for Marine Ecosystem Restoration. Front. Mar. Sci. 2020, 7, 328. [Google Scholar] [CrossRef]
- Short, F.; Davis, R.; Kopp, B.; Short, C.; Burdick, D. Site-Selection Model for Optimal Transplantation of Eelgrass Zostera Marina in the Northeastern US. Mar. Ecol. Prog. Ser. 2002, 227, 253–267. [Google Scholar] [CrossRef]
- Calvo, S.; Pirrotta, M.; Tomasello, A. Letter to the editor regarding the article “Taking advantage of seagrass recovery potential to develop novel and effective meadow rehabilitation methods” by Alagna et al., published in Marine Pollution Bulletin, 149: 2019 (110578). Mar. Pollut. Bull. 2020, 158, 111395. [Google Scholar] [CrossRef]
- Brown, D.C. Close-Range Camera Calibration. Photogramm. Eng. 1971, 37, 855–866. [Google Scholar]
- Menna, F.; Nocerino, E.; Remondino, F. Flat versus hemispherical dome ports in underwater photogrammetry. Int. Arch. Photogramm. Remote Sens. Spat. Inf. Sci. 2017, 42, 481. [Google Scholar] [CrossRef] [Green Version]
- Nocerino, E.; Menna, F.; Remondino, F. Accuracy of typical photogrammetric networks in cultural heritage 3D modeling projects. Int. Arch. Photogramm. Remote Sens. Spat. Inf. Sci. 2014, 40, 465. [Google Scholar] [CrossRef] [Green Version]
- Shortis, M. Calibration techniques for accurate measurements by underwater camera systems. Sensors 2015, 15, 9831. [Google Scholar] [CrossRef] [Green Version]
- Helmholz, P.; Long, J.; Munsie, T.; Belton, D. Accuracy assessment of GOPROHero 3 (black) camera in underwater environment. Int. Arch. Photogramm. Remote Sens. Spat. Inf. Sci. 2016, 41, 477–483. [Google Scholar] [CrossRef] [Green Version]
- Nocerino, E.; Menna, F.; Farella, E.; Remondino, F. 3D virtualization of an underground semi-submerged cave system. Int. Arch. Photogramm. Remote Sens. Spat.-Form. Sci. 2019, XLII-2/W15, 857–864. [Google Scholar] [CrossRef] [Green Version]
- Nocerino, E.; Nawaf, M.M.; Saccone, M.; Ellefi, M.B.; Pasquet, J.; Royer, J.P.; Drap, P. Multi-camera system calibration of a low-cost remotely operated vehicle for underwater cave exploration. Int. Arch. Photogramm. Remote Sens. Spat. Inf. Sci. 2018, 42, 329–337. [Google Scholar] [CrossRef] [Green Version]
- Nocerino, E.; Neyer, F.; Grün, A.; Troyer, M.; Menna, F.; Brooks, A.; Capra, A.; Castagnetti, C.; Rossi, P. Comparison of diver-operated underwater photogrammetric systems for coral reef monitoring. ISPRS-Int. Arch. Photogramm. Remote Sens. Spat. Inf. Sci. 2019, 42, 143–150. [Google Scholar] [CrossRef] [Green Version]
- AgisoftMetashape. Available online: https://www.agisoft.com/ (accessed on 16 July 2021).
- Bosman, A.; Casalbore, D.; Anzidei, M.; Carmisciano, C.; Chiocci, F. The first ultra-high resolution digital terrain model of the shallow-water sector around Lipari Island (Aeolian Islands, Italy). Ann. Geophys. 2015, 58, 5. [Google Scholar] [CrossRef]
- Bosman, A.; Romagnoli, C.; Madricardo, F.; Correggiari, A.; Remia, A.; Zubalich, R.; Fogarin, S.; Kruss, A.; Trincardi, F. Short-Term Evolution of Po Della Pila Delta Lobe from Time Lapse High-Resolution Multibeam Bathymetry (2013–2016). Estuar. Coast. Shelf Sci. 2020, 233, 106533. [Google Scholar] [CrossRef]
- Image Enhancement Process Tool. Available online: https://imareculture.eu/downloads/project-tools/image-enhancement-process-tool/ (accessed on 16 July 2021).
- Getreuer, P. Automatic Color Enhancement (ACE) and Its Fast Implementation. Image Process. Line 2012, 2, 266–277. [Google Scholar] [CrossRef] [Green Version]
- Global Mapper. Available online: https://www.bluemarblegeo.com/global-mapper/ (accessed on 16 July 2021).
- Site Recorder 4. Available online: http://www.3hconsulting.com/ProductsRecorderMain.html (accessed on 16 July 2021).
- Trimble eCognition Essentil. Available online: https://geospatial.trimble.com/products-and-solutions/ecognition-essentials (accessed on 16 July 2021).
- Cloud Compare. Available online: http://cloudcompare.org/ (accessed on 16 July 2021).
- Van Katwijk, M.M.; Bos, A.R.; de Jonge, V.N.; Hanssen, L.S.A.M.; Hermus, D.C.R.; de Jong, D.J. Guidelines for Seagrass Restoration: Importance of Habitat Selection and Donor Population, Spreading of Risks, and Ecosystem Engineering Effects. Mar. Pollut. Bull. 2009, 58, 179–188. [Google Scholar] [CrossRef]
- Gumusay, M.U.; Bakirman, T.; TuneyKizilkaya, I.; Aykut, N.O. A Review of Seagrass Detection, Mapping and Monitoring Applications Using Acoustic Systems. Eur. J. Remote Sens. 2019, 52, 1–29. [Google Scholar] [CrossRef] [Green Version]
- Hu, W.; Zhang, D.; Chen, B.; Liu, X.; Ye, X.; Jiang, Q.; Zheng, X.; Du, J.; Chen, S. Mapping the Seagrass Conservation and Restoration Priorities: Coupling Habitat Suitability and Anthropogenic Pressures. Ecol. Indic. 2021, 129, 107960. [Google Scholar] [CrossRef]
- Uhrin, A.V.; Kirsch, K. Prioritizing seagrass restoration sites: Study examines predictors of seagrass bed recovery. In GIS for the Oceans; ESRI: Redlands, CA, USA, 2011; pp. 49–54. [Google Scholar]
- Klemas, V. Using Remote Sensing to Select and Monitor Wetland Restoration Sites: An Overview. J. Coast. Res. 2013, 289, 958–970. [Google Scholar] [CrossRef]
- Ridge, J.T.; Johnston, D.W. Unoccupied Aircraft Systems (UAS) for Marine Ecosystem Restoration. Front. Mar. Sci. 2020, 7, 438. [Google Scholar] [CrossRef]
- Figueira, W.; Ferrari, R.; Weatherby, E.; Porter, A.; Hawes, S.; Byrne, M. Accuracy and Precision of Habitat Structural Complexity Metrics Derived from Underwater Photogrammetry. Remote Sens. 2015, 7, 5859. [Google Scholar] [CrossRef] [Green Version]
- Hatcher, G.A.; Warrick, J.A.; Ritchie, A.C.; Dailey, E.T.; Zawada, D.G.; Kranenburg, C.; Yates, K.K. Accurate Bathymetric Maps From Underwater Digital Imagery Without Ground Control. Front. Mar. Sci. 2020, 7, 525. [Google Scholar] [CrossRef]
- Tan, Y.M.; Dalby, O.; Kendrick, G.A.; Statton, J.; Sinclair, E.A.; Fraser, M.W.; Macreadie, P.I.; Gillies, C.L.; Coleman, R.A.; Waycott, M.; et al. Seagrass Restoration Is Possible: Insights and Lessons From Australia and New Zealand. Front. Mar. Sci. 2020, 7, 617. [Google Scholar] [CrossRef]
- Bianco, S.; Ciocca, G.; Marelli, D. Evaluating the Performance of Structure from Motion Pipelines. J. Imaging 2018, 4, 98. [Google Scholar] [CrossRef] [Green Version]
- Moniruzzaman, M.; Islam, S.M.S.; Lavery, P.; Bennamoun, M.; Lam, C.P. Imaging and Classification Techniques for Seagrass Mapping and Monitoring: A Comprehensive Survey. arXiv 2019, arXiv:1902.11114. [Google Scholar]
- Rossi, P.; Castagnetti, C.; Capra, A.; Brooks, A.J.; Mancini, F. Detecting Change in Coral Reef 3D Structure Using Underwater Photogrammetry: Critical Issues and Performance Metrics. Appl. Geomat. 2020, 12, 3–17. [Google Scholar] [CrossRef]
- Chemisky, B.; Nocerino, E.; Menna, F.; Nawaf, M.M.; Drap, P. A portable opto-acoustic survey solution for mapping of underwater targets. Int. Arch. Photogramm. Remote Sens. Spat. Inf. Sci. 2021, XLIII-B2-2021, 651–658. [Google Scholar] [CrossRef]
- Gatta, C.; Rizzi, A.; Marini, D. ACE: An automatic color equalization algorithm. In Proceedings of the First European Conference on Color in Graphics Image and Vision (CGIV02), University of Poitiers, Poitiers, France, 2–4 April 2002. [Google Scholar]
- Lathrop, R.G.; Montesano, P.; Haag, S. A Multi-Scale Segmentation Approach to Mapping Seagrass Habitats Using Airborne Digital Camera Imagery. Photogramm. Eng. Remote Sens. 2006, 72, 665–675. [Google Scholar] [CrossRef] [Green Version]
- Moreno, D.; Aguilera, P.; Castro, H. Assessment of the Conservation Status of Seagrass (Posidonia oceanica) Meadows: Implications for Monitoring Strategy and the Decision-Making Process. Biol. Conserv. 2001, 102, 325–332. [Google Scholar] [CrossRef]
- Montefalcone, M. Ecosystem Health Assessment Using the Mediterranean Seagrass Posidonia oceanica: A Review. Ecol. Indic. 2009, 9, 595–604. [Google Scholar] [CrossRef]
- Irving, A.D.; Tanner, J.E.; Gaylard, S.G. An Integrative Method for the Evaluation, Monitoring, and Comparison of Seagrass Habitat Structure. Mar. Pollut. Bull. 2013, 66, 176–184. [Google Scholar] [CrossRef]
- Greiner, J.T.; McGlathery, K.J.; Gunnell, J.; McKee, B.A. Seagrass Restoration Enhances “Blue Carbon” Sequestration in Coastal Waters. PLoS ONE 2013, 8, e72469. [Google Scholar] [CrossRef] [Green Version]
- Thorhaug, A.; Poulos, H.M.; López-Portillo, J.; Ku, T.C.W.; Berlyn, G.P. Seagrass Blue Carbon Dynamics in the Gulf of Mexico: Stocks, Losses from Anthropogenic Disturbance, and Gains through Seagrass Restoration. Sci. Total Environ. 2017, 605–606, 626–636. [Google Scholar] [CrossRef]
- Pergent-Martini, C.; Pergent, G.; Monnier, B.; Boudouresque, C.-F.; Mori, C.; Valette-Sansevin, A. Contribution of Posidonia oceanica meadows in the context of climate change mitigation in the Mediterranean Sea. Mar. Environ. Res. 2021, 165, 105236. [Google Scholar] [CrossRef]


| Distance (m) | Width (m) | Height (m) | Surface (m2) | GSD cm |
|---|---|---|---|---|
| 1 | 1.23 | 0.91 | 1.12 | 0.3 |
| 2 | 2.47 | 1.82 | 4.49 | 0.6 |
| 3 | 3.70 | 2.73 | 10.11 | 0.9 |
| 4 | 4.94 | 3.64 | 17.97 | 1.2 |
| 5 | 6.17 | 4.55 | 28.07 | 1.5 |
| 6 | 7.40 | 5.46 | 40.43 | 1.9 |
| 7 | 8.64 | 6.37 | 55.02 | 2.2 |
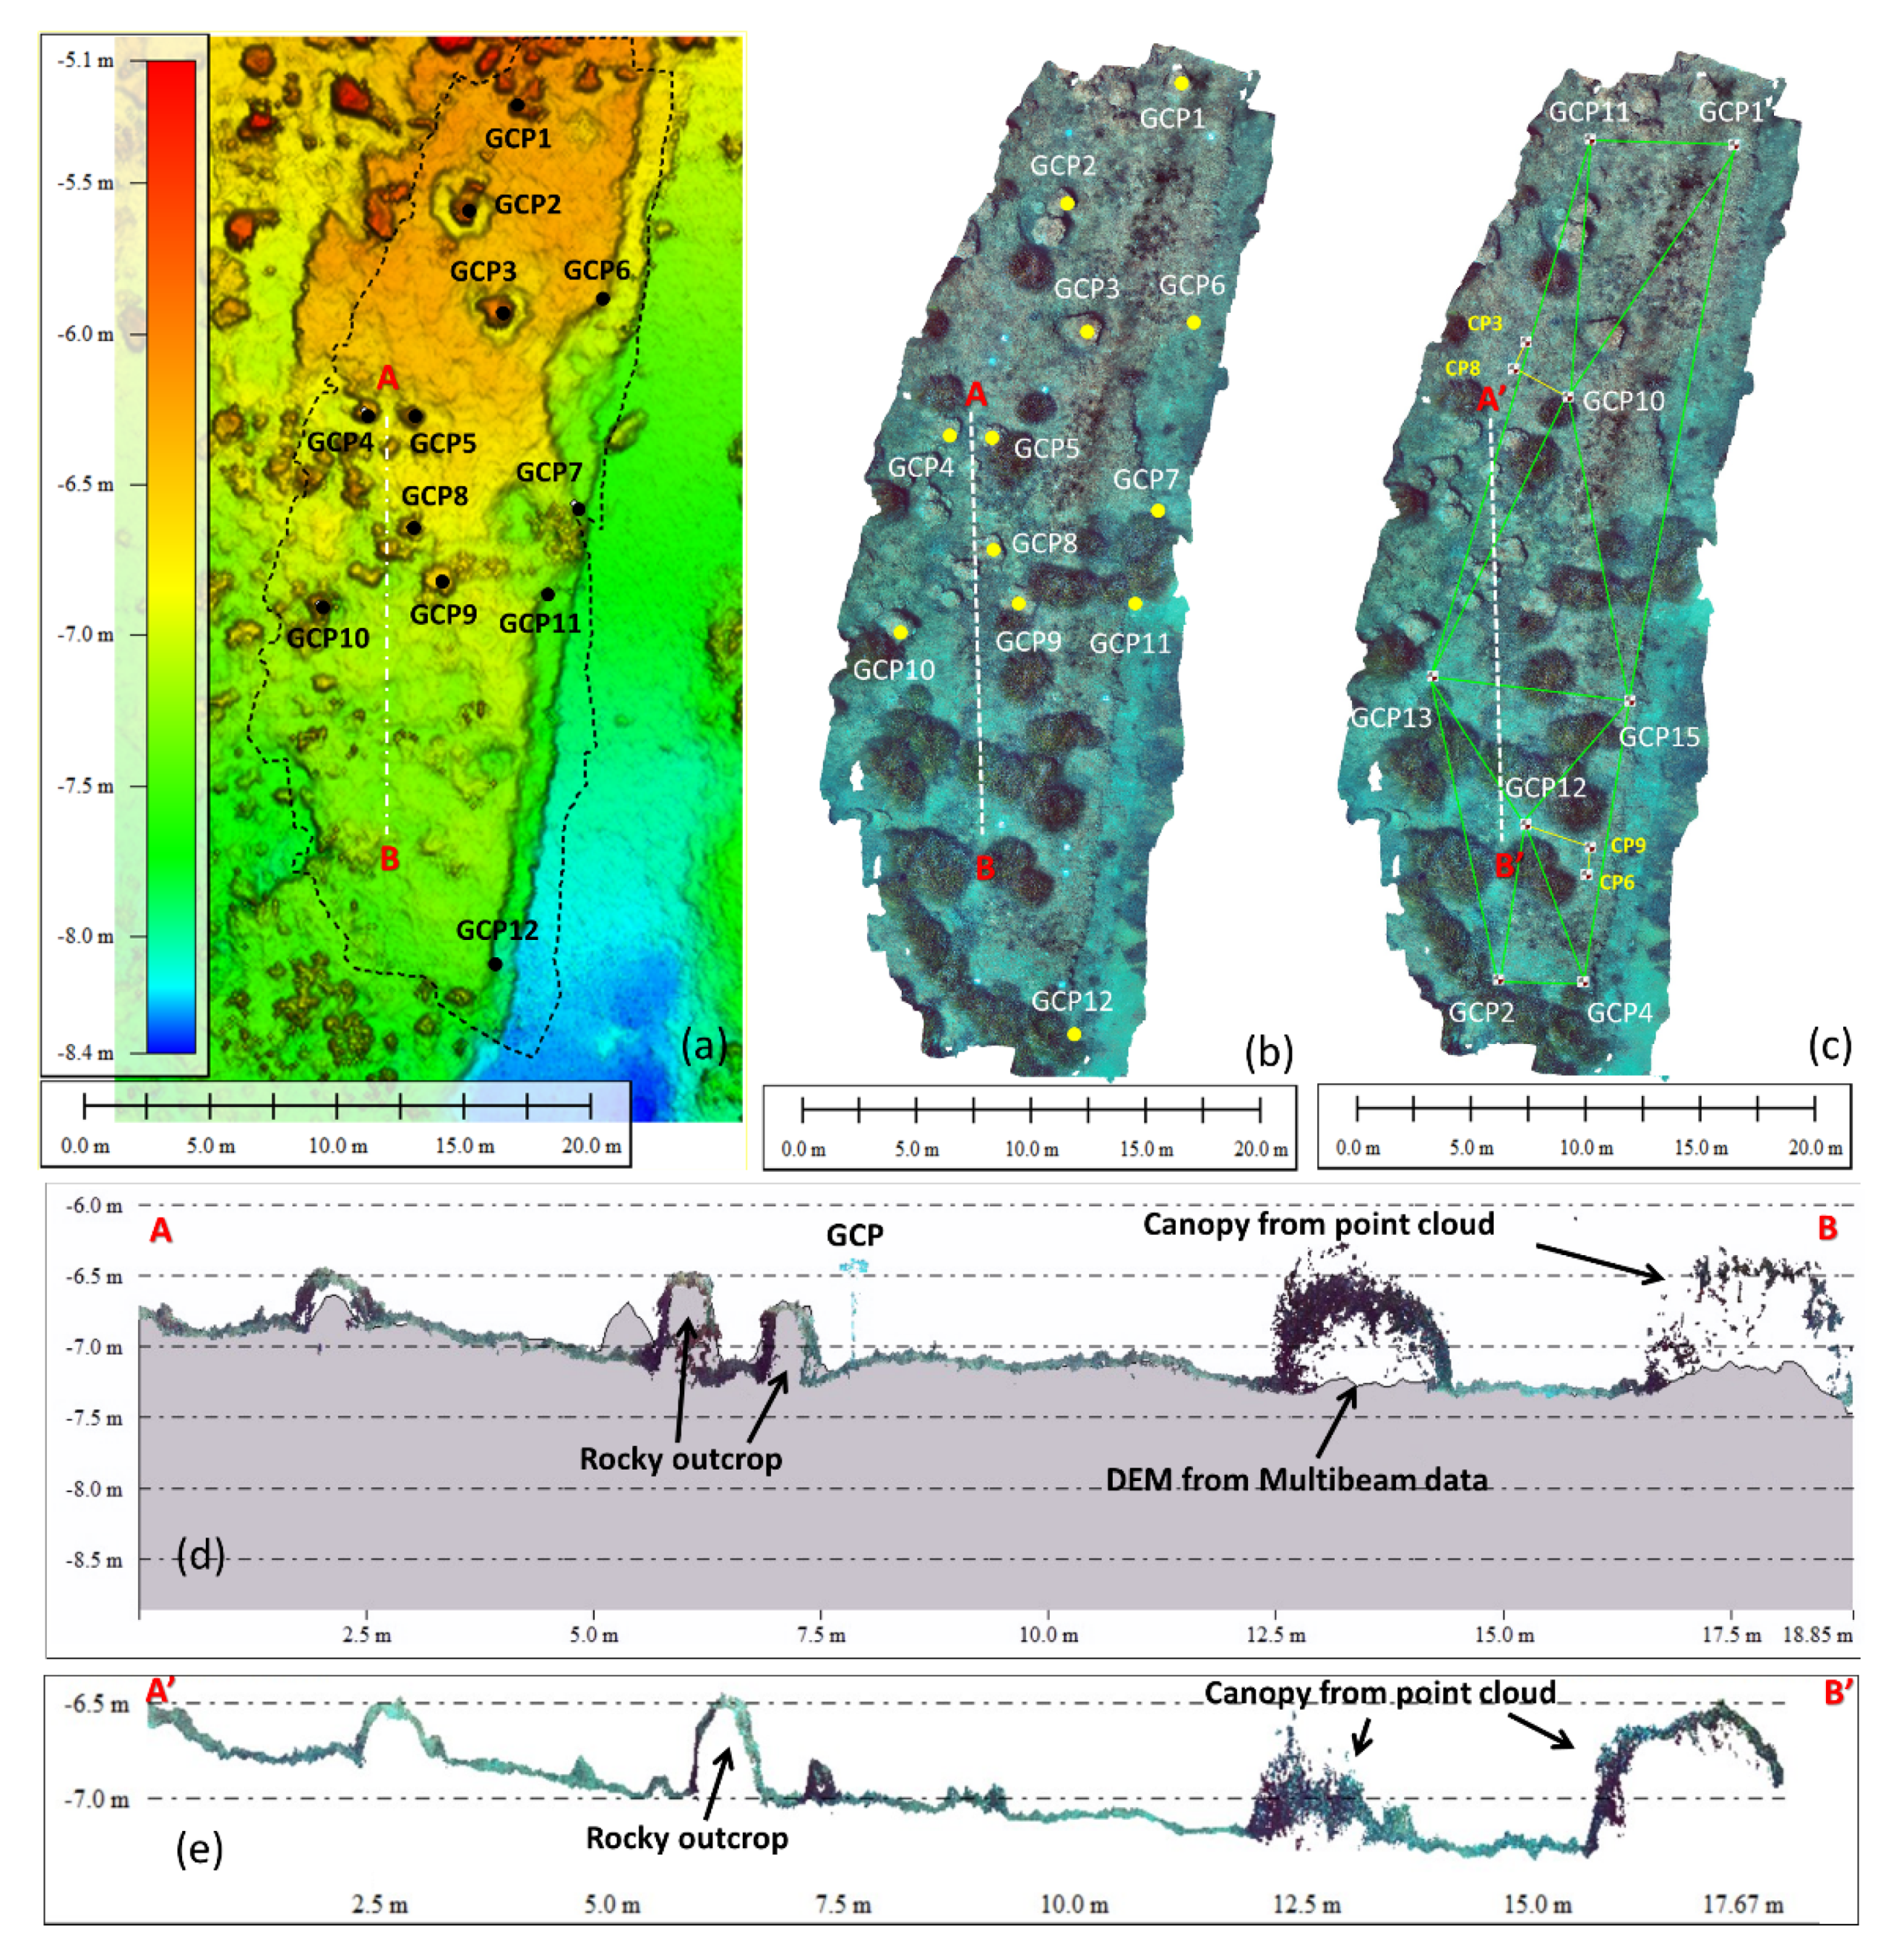
| Target | LAS Corrected from MBES | LAS Corrected from 3D Trilateration | Difference X, Y |
|---|---|---|---|
| GCP1-GCP11 | 5.46 m | 5.41 m | 0.05 m |
| GCP1-GCP15 | 22.20 m | 22.16 m | 0.04 m |
| GCP11-GCP13 | 21.80 m | 21.78 m | 0.02 m |
| GCP1-GCP10 | 11.70 m | 11.68 m | 0.02 m |
| GCP10-GCP11 | 9.97 m | 9.91 m | 0.06 m |
| GCP10-GCP13 | 12.20 m | 12.18 m | 0.02 m |
| GCP10-GCP15 | 12.20 m | 12.16 m | 0.04 m |
| GCP13-GCP15 | 7.51 m | 7,.48 m | 0.03 m |
| GCP2-GCP13 | 12.10 m | 12.18 m | −0.08 m |
| GCP2-GCP4 | 3.27 m | 3.24 m | 0.03 m |
| GCP4-GCP15 | 11.20 m | 11.15 m | 0.05 m |
| GCP13-GCP12 | 6.79 m | 6.73 m | 0.06 m |
| GCP15-GCP12 | 6.37 m | 6.30 m | 0.07 m |
| GCP2-GCP12 | 6.11 m | 6.04 m | 0.07 m |
| GCP4-GCP12 | 6.57 m | 6.55 m | 0.02 m |
| Target | LAS Corrected on MBES | LAS Corrected from 3D Trilateration | Difference Z |
|---|---|---|---|
| GCP1 | 6.65 m | 6.53 m | 0.12 m |
| GCP2 | 7.40 m | 7.53 m | −0.13 m |
| GCP3 | 6.46 m | 6.30 m | 0.16 m |
| GCP4 | 7.40 m | 7.34 m | 0.06 m |
| GCP6 | 7.10 m | 7.01 m | 0.09 m |
| GCP8 | 6.54 m | 6.41 m | 0.13 m |
| GCP9 | 7.09 m | 6.98 m | 0.11 m |
| GCP10 | 6.59 m | 6.45 m | 0.14 m |
| GCP11 | 6.49 m | 6.33 m | 0.16 m |
| GCP12 | 7.13 m | 7.16 m | −0.02 m |
| GCP13 | 7.06 m | 7.22 m | −0.16 m |
| GCP15 | 7.01 m | 6.98 m | 0.03 m |
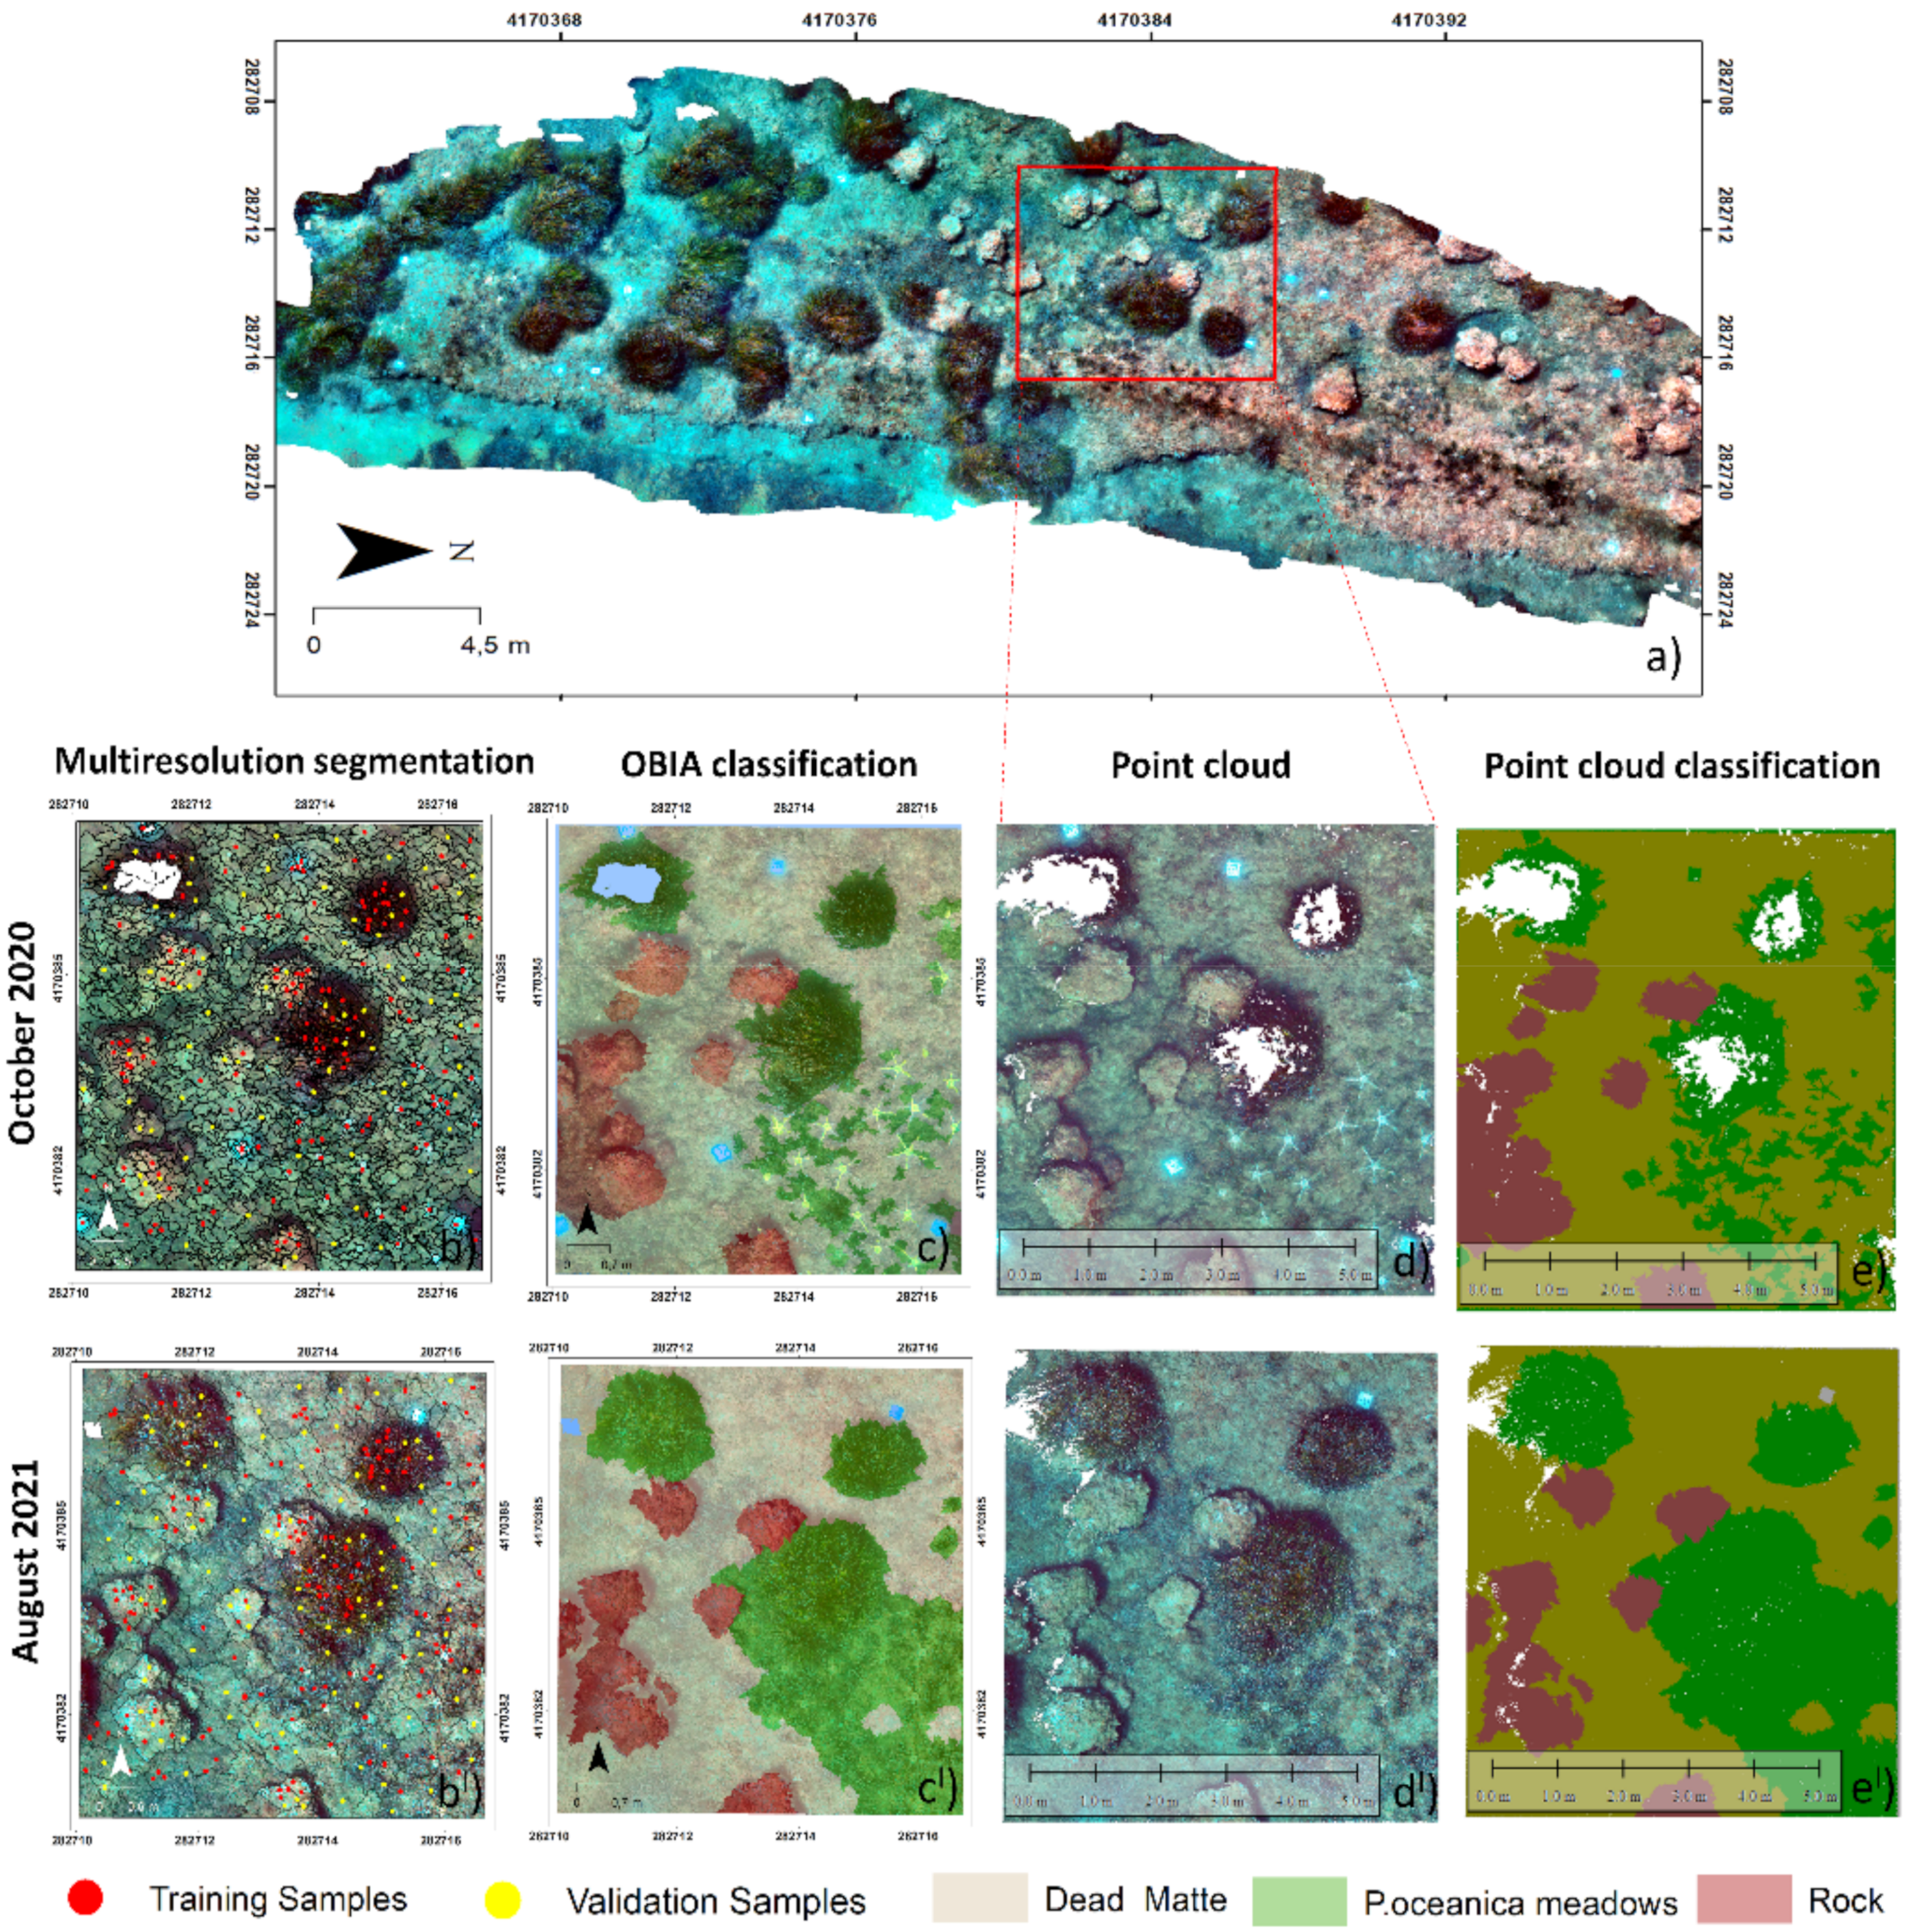
| (October 2020) Overall Accuracy: 93.67% K = 0.90 | (August 2021) Overall Accuracy: 99.02% K = 0.98 | |||
|---|---|---|---|---|
| Thematic Classes | User’s Accuracy Producer’s Accuracy | User’s Accuracy Producer’s Accuracy | ||
| Dead matte | 83.87% | 100% | 96.97% | 100% |
| P. oceanica meadows | 100% | 86.67% | 100% | 100% |
| Rock | 100% | 95.65% | 100% | 95.45% |
Publisher’s Note: MDPI stays neutral with regard to jurisdictional claims in published maps and institutional affiliations. |
© 2022 by the authors. Licensee MDPI, Basel, Switzerland. This article is an open access article distributed under the terms and conditions of the Creative Commons Attribution (CC BY) license (https://creativecommons.org/licenses/by/4.0/).
Share and Cite
Rende, S.F.; Bosman, A.; Menna, F.; Lagudi, A.; Bruno, F.; Severino, U.; Montefalcone, M.; Irving, A.D.; Raimondi, V.; Calvo, S.; et al. Assessing Seagrass Restoration Actions through a Micro-Bathymetry Survey Approach (Italy, Mediterranean Sea). Water 2022, 14, 1285. https://doi.org/10.3390/w14081285
Rende SF, Bosman A, Menna F, Lagudi A, Bruno F, Severino U, Montefalcone M, Irving AD, Raimondi V, Calvo S, et al. Assessing Seagrass Restoration Actions through a Micro-Bathymetry Survey Approach (Italy, Mediterranean Sea). Water. 2022; 14(8):1285. https://doi.org/10.3390/w14081285
Chicago/Turabian StyleRende, Sante Francesco, Alessandro Bosman, Fabio Menna, Antonio Lagudi, Fabio Bruno, Umberto Severino, Monica Montefalcone, Andrew D. Irving, Vincenzo Raimondi, Sebastiano Calvo, and et al. 2022. "Assessing Seagrass Restoration Actions through a Micro-Bathymetry Survey Approach (Italy, Mediterranean Sea)" Water 14, no. 8: 1285. https://doi.org/10.3390/w14081285