
Destratification of a Eutrophic Reservoir in South Korea Using a Novel Convectional Water Circulation System (CWCS)
by
 and
and
Bokjin Lee
1,2, 
Heejun Kang
1,2,
Hye-cheol Oh
2,
Jaehwan Ahn
2,
Sang-Leen Yun
2 and
Seogku Kim
1,2,* 1
Civil and Environmental Engineering, University of Science and Technology (UST), Daejeon 34113, Korea
2
Department of Environment Research, Korea Institute of Civil Engineering and Building Technology (KICT), Goyang 10223, Korea
*
Author to whom correspondence should be addressed.
Water 2022, 14(8), 1282; https://doi.org/10.3390/w14081282
Submission received: 27 March 2022
/
Revised: 10 April 2022
/
Accepted: 14 April 2022
/
Published: 15 April 2022
(This article belongs to the Section Water Quality and Contamination)
Abstract
:Replication of natural mixing through artificial water circulation techniques, such as convectional water circulation systems (CWCS), can break thermal stratification in stagnant water and suppress algal blooms. Here, the field performance of a novel CWCS was evaluated in a eutrophic reservoir (Shingal reservoir, South Korea) for three seasons between September 2016 and September 2018. The CWCS was deployed in a corner of stagnated water in the reservoir. The changes in water temperature and dissolved oxygen (DO) concentrations at different water depths were examined at the deployment site and two control sites within the stagnant area during the 2016 and 2017 seasons. In 2018, the performance of the CWCS in replicating natural mixing was assessed by monitoring water temperature changes at different depths at the CWCS unit deployment site and a comparison site with natural water flow. The differences in water temperature and DO concentrations between the epilimnion and the hypolimnion were significantly smaller at the deployment site than at the control sites, demonstrating the effectiveness of the CWCS in vertical and horizontal mixing as well as in oxygen transfer. The findings of the field study revealed that the CWCS effectively induced natural-like mixing without disturbing the hypolimnion.
1. Introduction
Thermal stratification in water bodies is a natural phenomenon caused by temperature changes forced by seasonal variations in solar radiation [1,2]. During summer, especially in eutrophic water bodies, the increased temperature and stable water conditions of the surface layer, the epilimnion, create an ideal environment for the occurrence of algal blooms [3,4,5,6]. Stagnant areas along the edges of lakes and reservoirs void of natural flow are particularly vulnerable to excessive algal growth. While atmospheric reaeration is restricted in the benthic layer in thermally stratified water bodies, activities and reactions that require oxygen consumption, for example microbial degradation of sediment deposits (including algal biomass), cause oxygen depletion in the hypolimnion [7,8]. Moreover, under anoxic conditions, phosphorus (an essential nutrient for algae) can be released from the sediment, leading to eutrophication and algal blooms [9]. Dissolved oxygen (DO) concentration is considered as one of the factors related to algal blooms [10].
Mechanical and ecological approaches have been utilized for lake restoration and to control algal blooms by providing artificial water circulation, destratification, and aeration [11,12,13,14]. Artificial water circulation techniques have gained attention since Hooper et al. [15] first reported the results of an artificial water circulation experiment conducted in a small lake in Michigan in 1952. Several studies have since focused on artificial circulation techniques and their effects [16,17,18,19]. However, if artificial water circulation techniques are applied in shallow water bodies or excessive turbulence is created, sediment suspension and nutrient release may occur and induce more extreme water quality degradation [20,21]. Thus, given the potential for such negative impacts, it is crucial that the sediment remains undisturbed when implementing full circulation.
Another important aspect to consider when applying artificial water circulation techniques is the location and the operation time of the installed system. Additionally, results obtained from laboratory-based or small pond studies could be limited in their insights in how a given technique can resolve water quality issues in water bodies. Moreover, an algal bloom is a natural phenomenon that occurs when environmental conditions are met; thus, predicting its occurrence and intensity can be difficult. Accordingly, the application of water circulation techniques needs to be investigated in large water bodies with water quality concerns and across many seasons.
The aim of this study was to evaluate the field performance of a newly developed convectional water circulation system (CWCS) at replicating natural water circulation for destratification and suppression of algal blooms. Laboratory-scale tests were conducted to identify the generation of currents. Then, the proposed CWCS was deployed in a eutrophic reservoir and the vertical and horizontal circulation efficiency were assessed based on changes in water temperature and DO concentrations. Additionally, the artificial circulation generated from the CWCS was compared to natural mixing by monitoring water temperature and chlorophyll-a concentrations at each corresponding site within the reservoir.
2. Experimental Methods
2.1. Convectional Water Circulation System
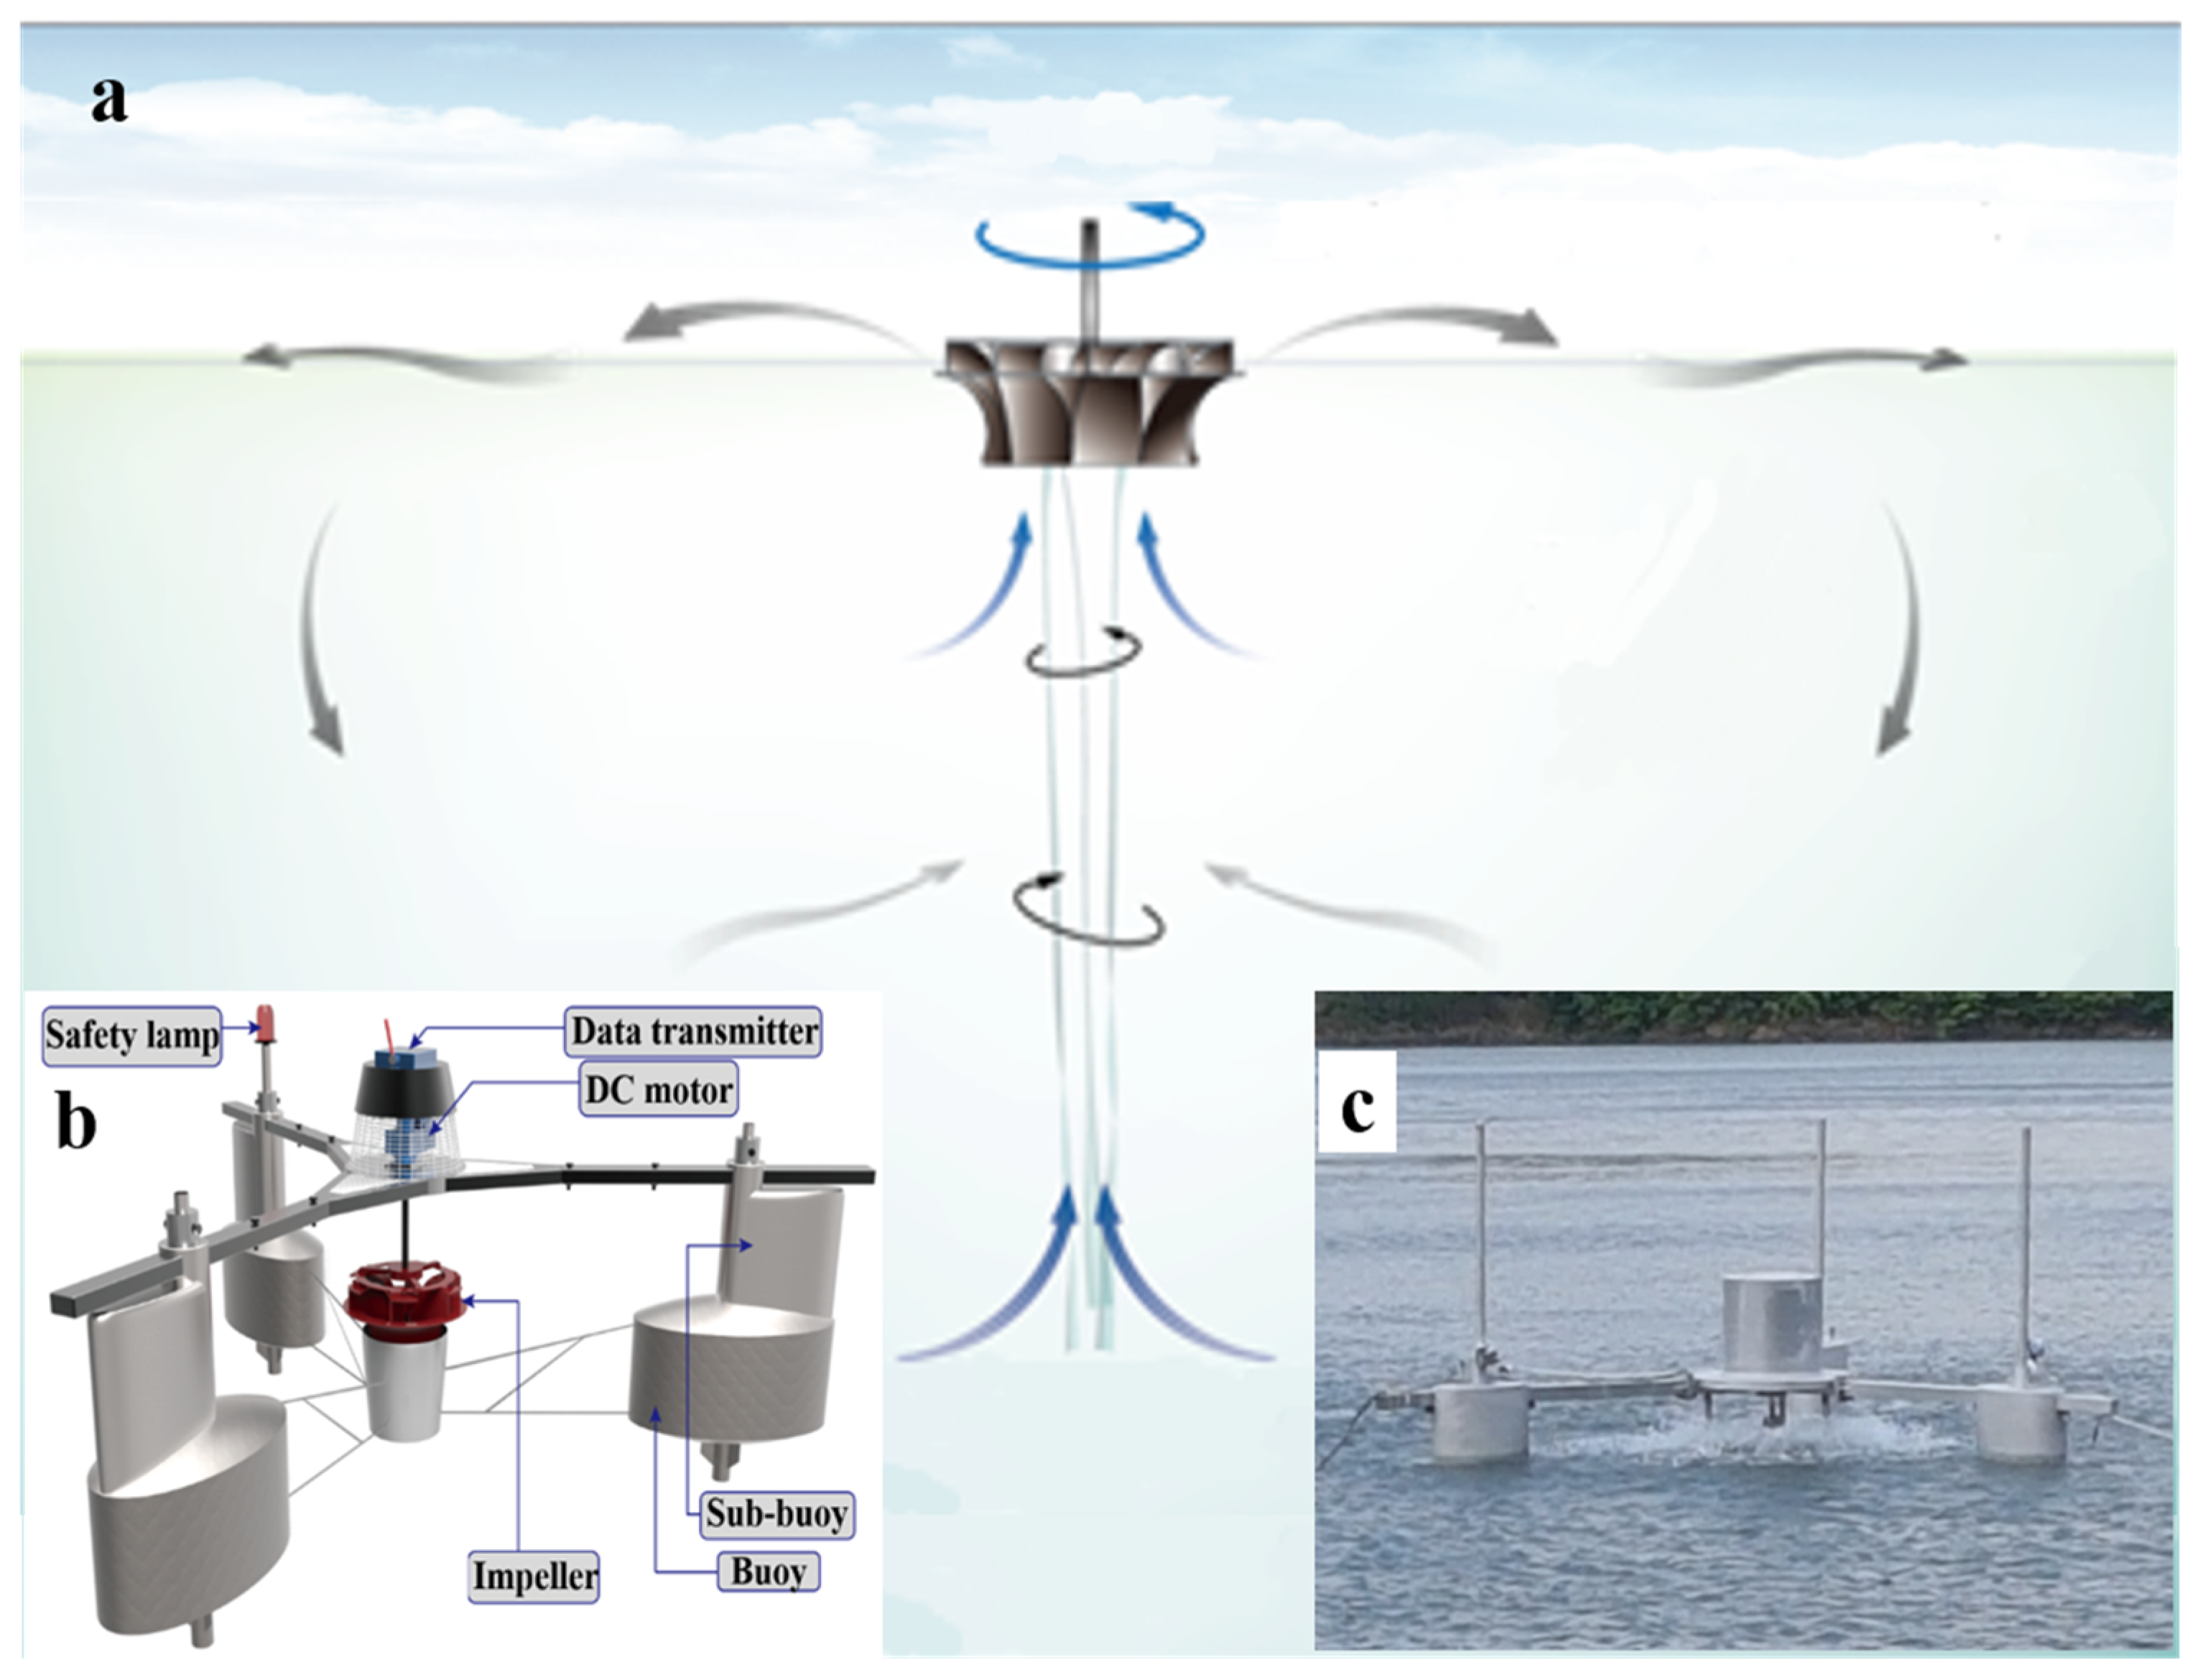
The key feature of the novel CWCS is the generation of upward currents from the impeller rotation that eventually induces convectional circulation as well as transfer of oxygen via surface aeration. The CWCS has a total diameter of 3.3 m and a height of 2.5 m, and consists of four parts: power supply, body, floater, and protection (Figure 1). The power part includes a 2.2 kW speed reducer motor; approximately 30–45 kW was used for 22 h of operation per day, 2 h of stop time was taken for the safety of the system, with 70% of efficiency. The mainframe was designed as a triangular structure that increases stability of the central motor and device impeller, which has a diameter of 500 mm. The floater part was designed to be submersible with a buoyancy ratio of 100%. In addition, the stability of the CWCS was further enhanced by adding a spare floater (buoyancy ratio of 30%) above the main floater. The protection unit prevents macro-size debris, such as moths, aquatic litter, and leaves, from entering the unit and the impeller.
2.2. Performance Evaluation of Laboratory-Scale CWCS
Prior to the field study, the vertical flow generation and the mixing performance of the CWCS were evaluated at laboratory-scale with a miniaturized CWCS in a closed system in a 1.35 m3 water tank with dimensions of 1.16 m (width) × 1.16 m (length) × 1 m (height) and water depth of 0.7 m. The water temperature and DO concentrations were artificially stratified using an immersion water heater and anhydrous sodium sulfite, which was used as a deoxygenator [22,23,24]. The miniaturized system, with an impeller diameter of 100 mm, was operated at the center of the tank. The changes in water temperature and DO concentrations at the surface and the bottom of the tank were measured using thermometers and DO-meters (M-100, Technology & Environment Corp, Seoul, Korea) located in the epilimnion, metalimnion, and hypolimnion layers. The evaluation methods and detailed results were described in a previous study [25]. The operation conditions in this field study were determined based on laboratory-scale experiments (Table 1).
2.3. Field Study
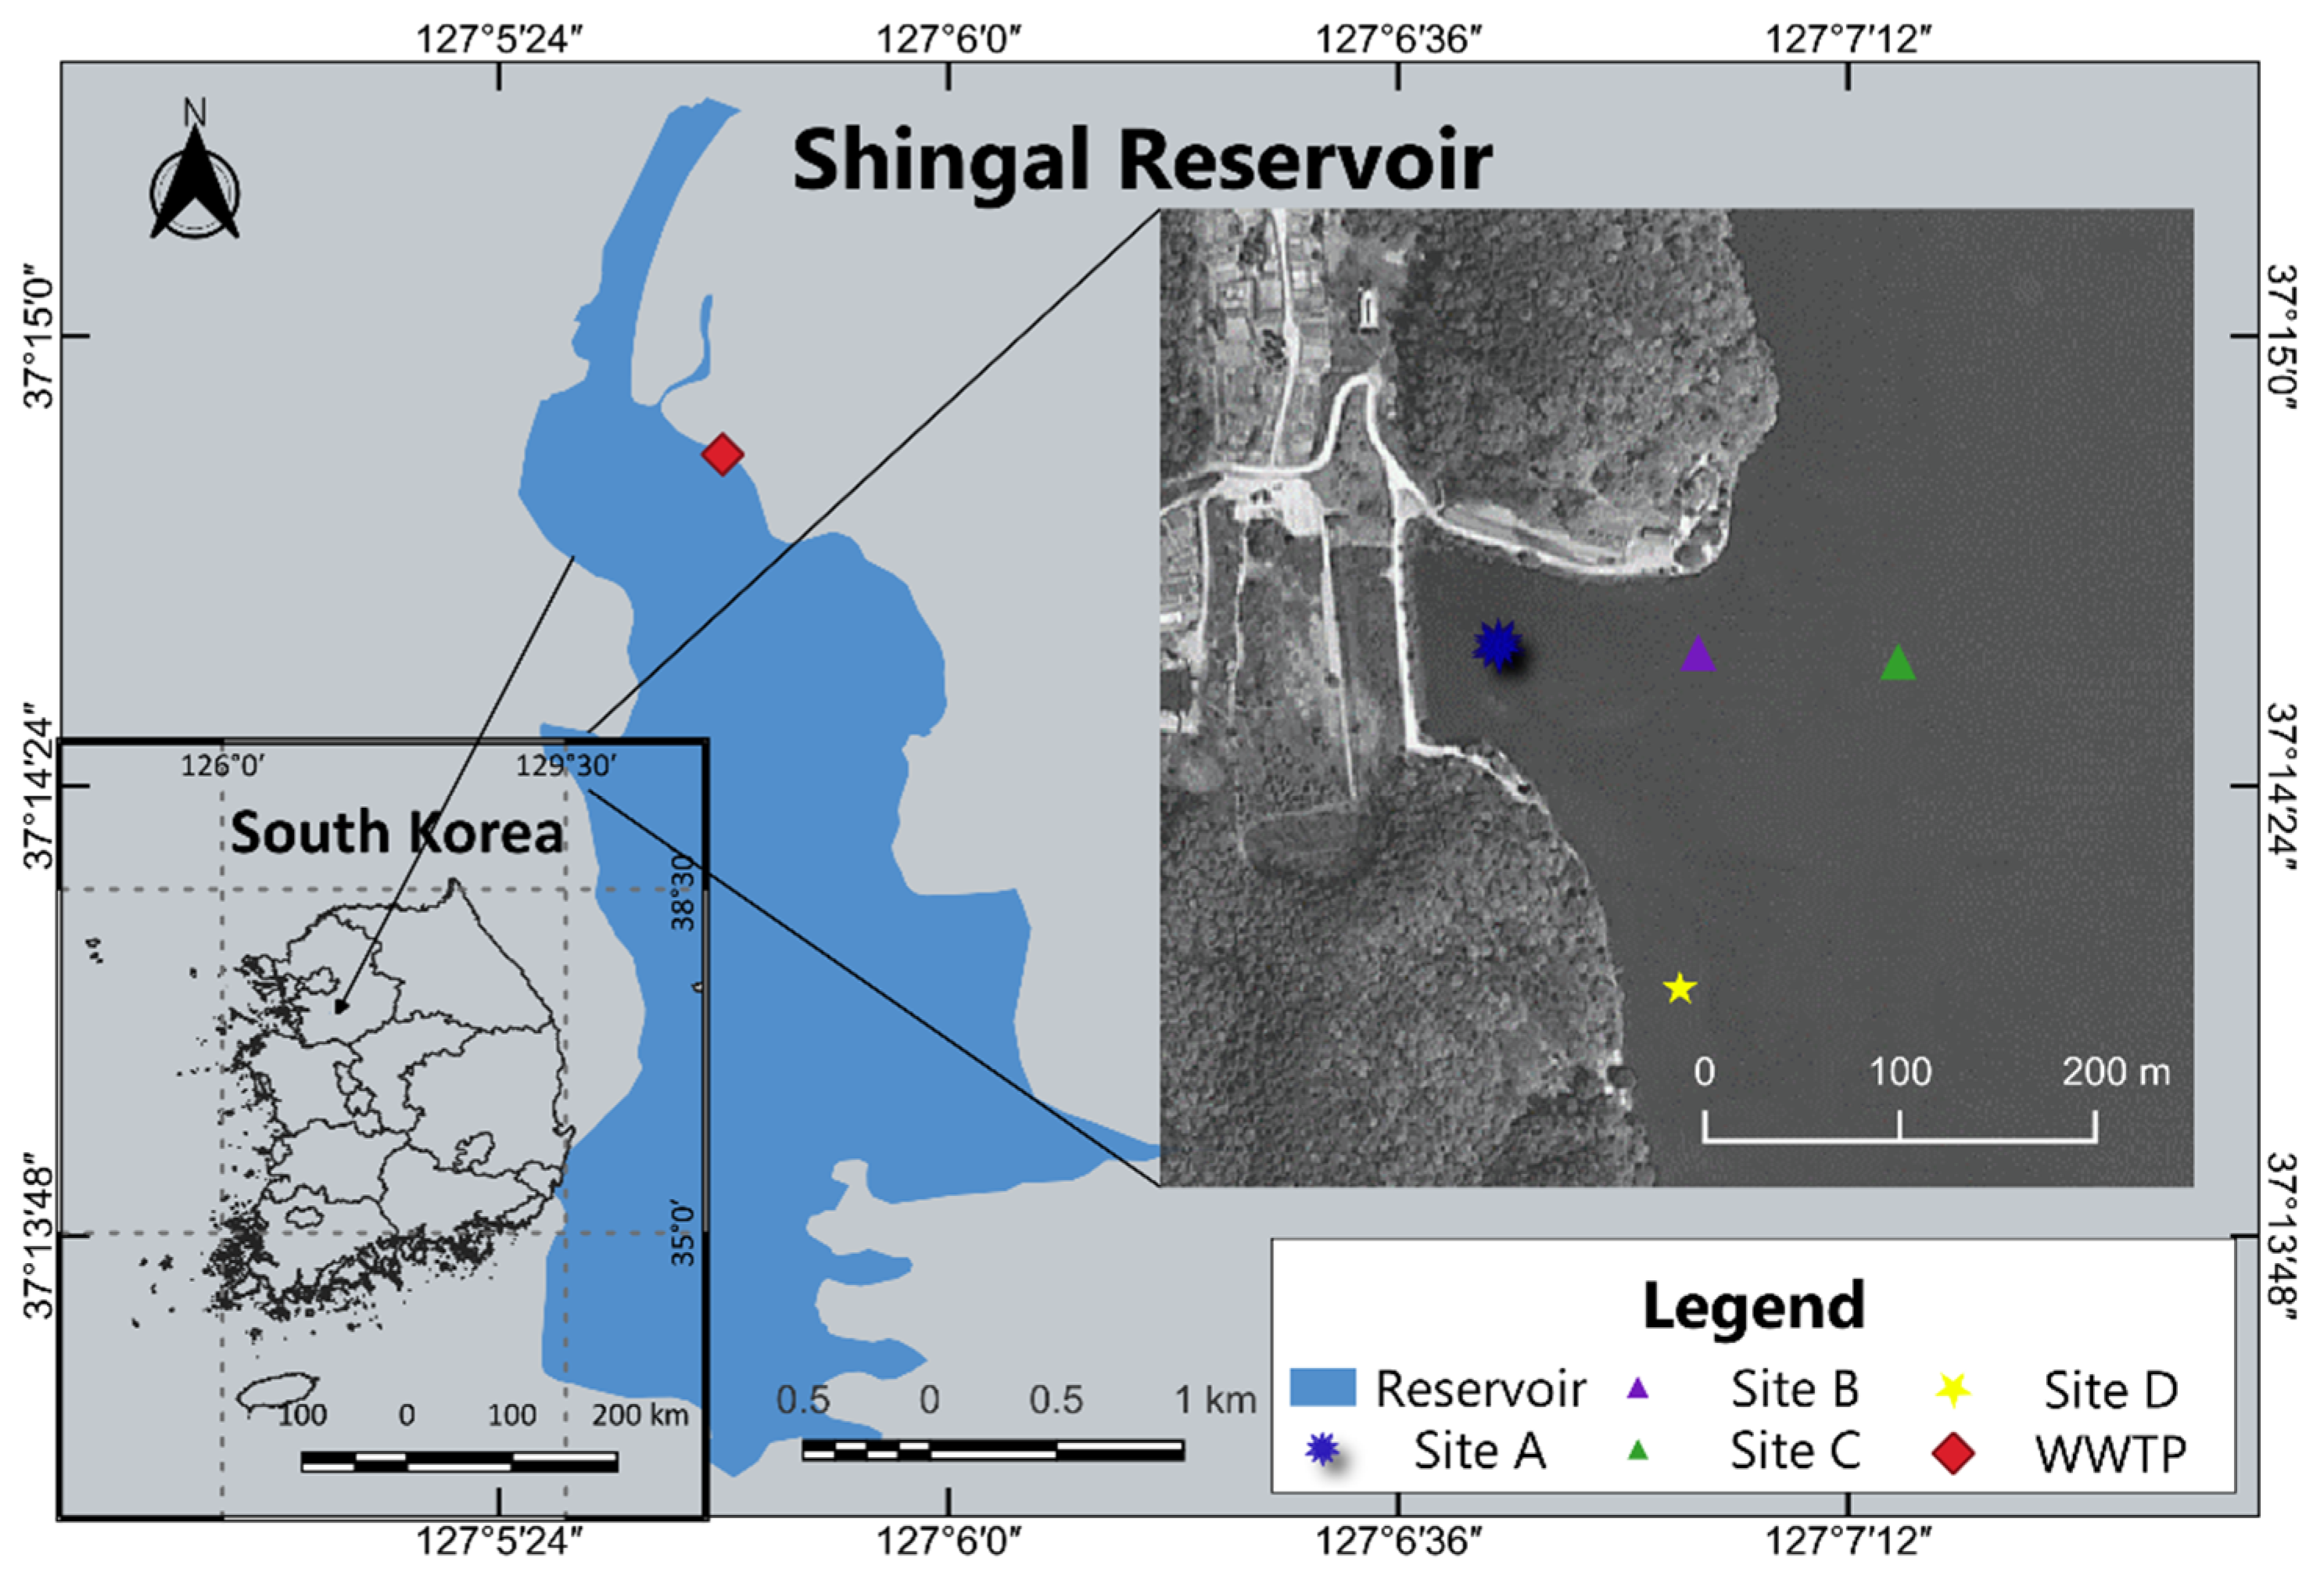
To evaluate the field performance of the CWCS, Shingal reservoir (also known as Giheung reservoir) in Yongin City was selected as the study area. The reservoir has a surface area of 2.31 km2 with an embankment height of 14.3 m and can store 11 × 106 m3 of water at full capacity. A golf course, several industrial facilities, residential areas, and a municipal wastewater treatment plant (WWTP), which has a capacity of 50,000 tons per day, are located near the reservoir. The nutrient load from both point (WWTP, a red diamond symbol in Figure 2) and non-point pollution sources has led to serious eutrophication and annual algal blooms [26,27,28].
Field studies were conducted during the summer and late fall seasons between 2016 and 2018, when thermal stratification normally occurs, to investigate the field performance of the CWCS on water circulation and algal bloom suppression. The CWCS was deployed in a stagnated area in a corner of the reservoir where severe algal blooms often occur. As shown in Figure 2, site A represents the CWCS installation point, and site B and C are the controls, with the same water conditions as site A, which were 100 m and 200 m away from site A, respectively (Figure 2). Water temperature and DO concentrations of the surface, the epilimnion, metalimnion, and hypolimnion (water depths listed in Table S1) were measured at three sites while the CWCS was operating. The data were collected six times between September and October in 2016 and four times from July to September in 2017. To understand the influence of sunlight on water temperature, temperature measurements were taken at 2 h intervals from 10:00 a.m. on 8 September 2017. The CWCS operated continuously from September 2016.
In 2018, real-time monitoring systems were installed at the deployment site and a natural circulation site (site D) to monitor the temporal changes in chlorophyll-a values and to measure the water temperature at depths of 0, 1, 2, 3, and 5 m. Site D had a high flow rate influenced by natural circulation; it was expected that the operation of the CWCS would produce flows similar to the natural circulation observed at site D. This natural circulation-inducing performance of the CWCS was examined by comparing water temperatures and chlorophyll-a values at sites A and D. Chlorophyll-a values were measured using chlorophyll-a detection devices (Technology & Environment Corp., Seoul, Korea), and water temperatures were measured using multi-temperature measuring devices (M-100, Technology & Environment Corp., Korea). Calibration and validation of these devices were conducted on 17 July and 16 September following the standard procedure provided by the manufacturer.
2.4. Statistical Analysis
Descriptive statistics and a paired samples t-test were conducted to assess differences in the measured parameters between the CWCS deployment site (site A) and the comparison site (site D). The operation of the CWCS induced vertical mixing, which, during the warmer seasons, resulted in a decrease in water temperatures in the top layers and an increase in the temperatures in the bottom layers. Therefore, the dataset for each parameter and season was separated into measurements taken at 0 and 1 m depth and those taken at 3 and 5 m depth. For this reason, one-tailed p values were calculated for water temperature in a paired samples t-test whereas two-tailed p values were calculated for DO concentration values. The performance of CWCS in inducing natural-like flows was also evaluated by conducting correlation analysis between site A and site D (n = 163). All statistical analyses were performed using Microsoft Excel. Results are reported as mean ± standard deviation.
3. Results
3.1. Changes in Dissolved Oxygen Concentrations Resulting from CWCS Operation
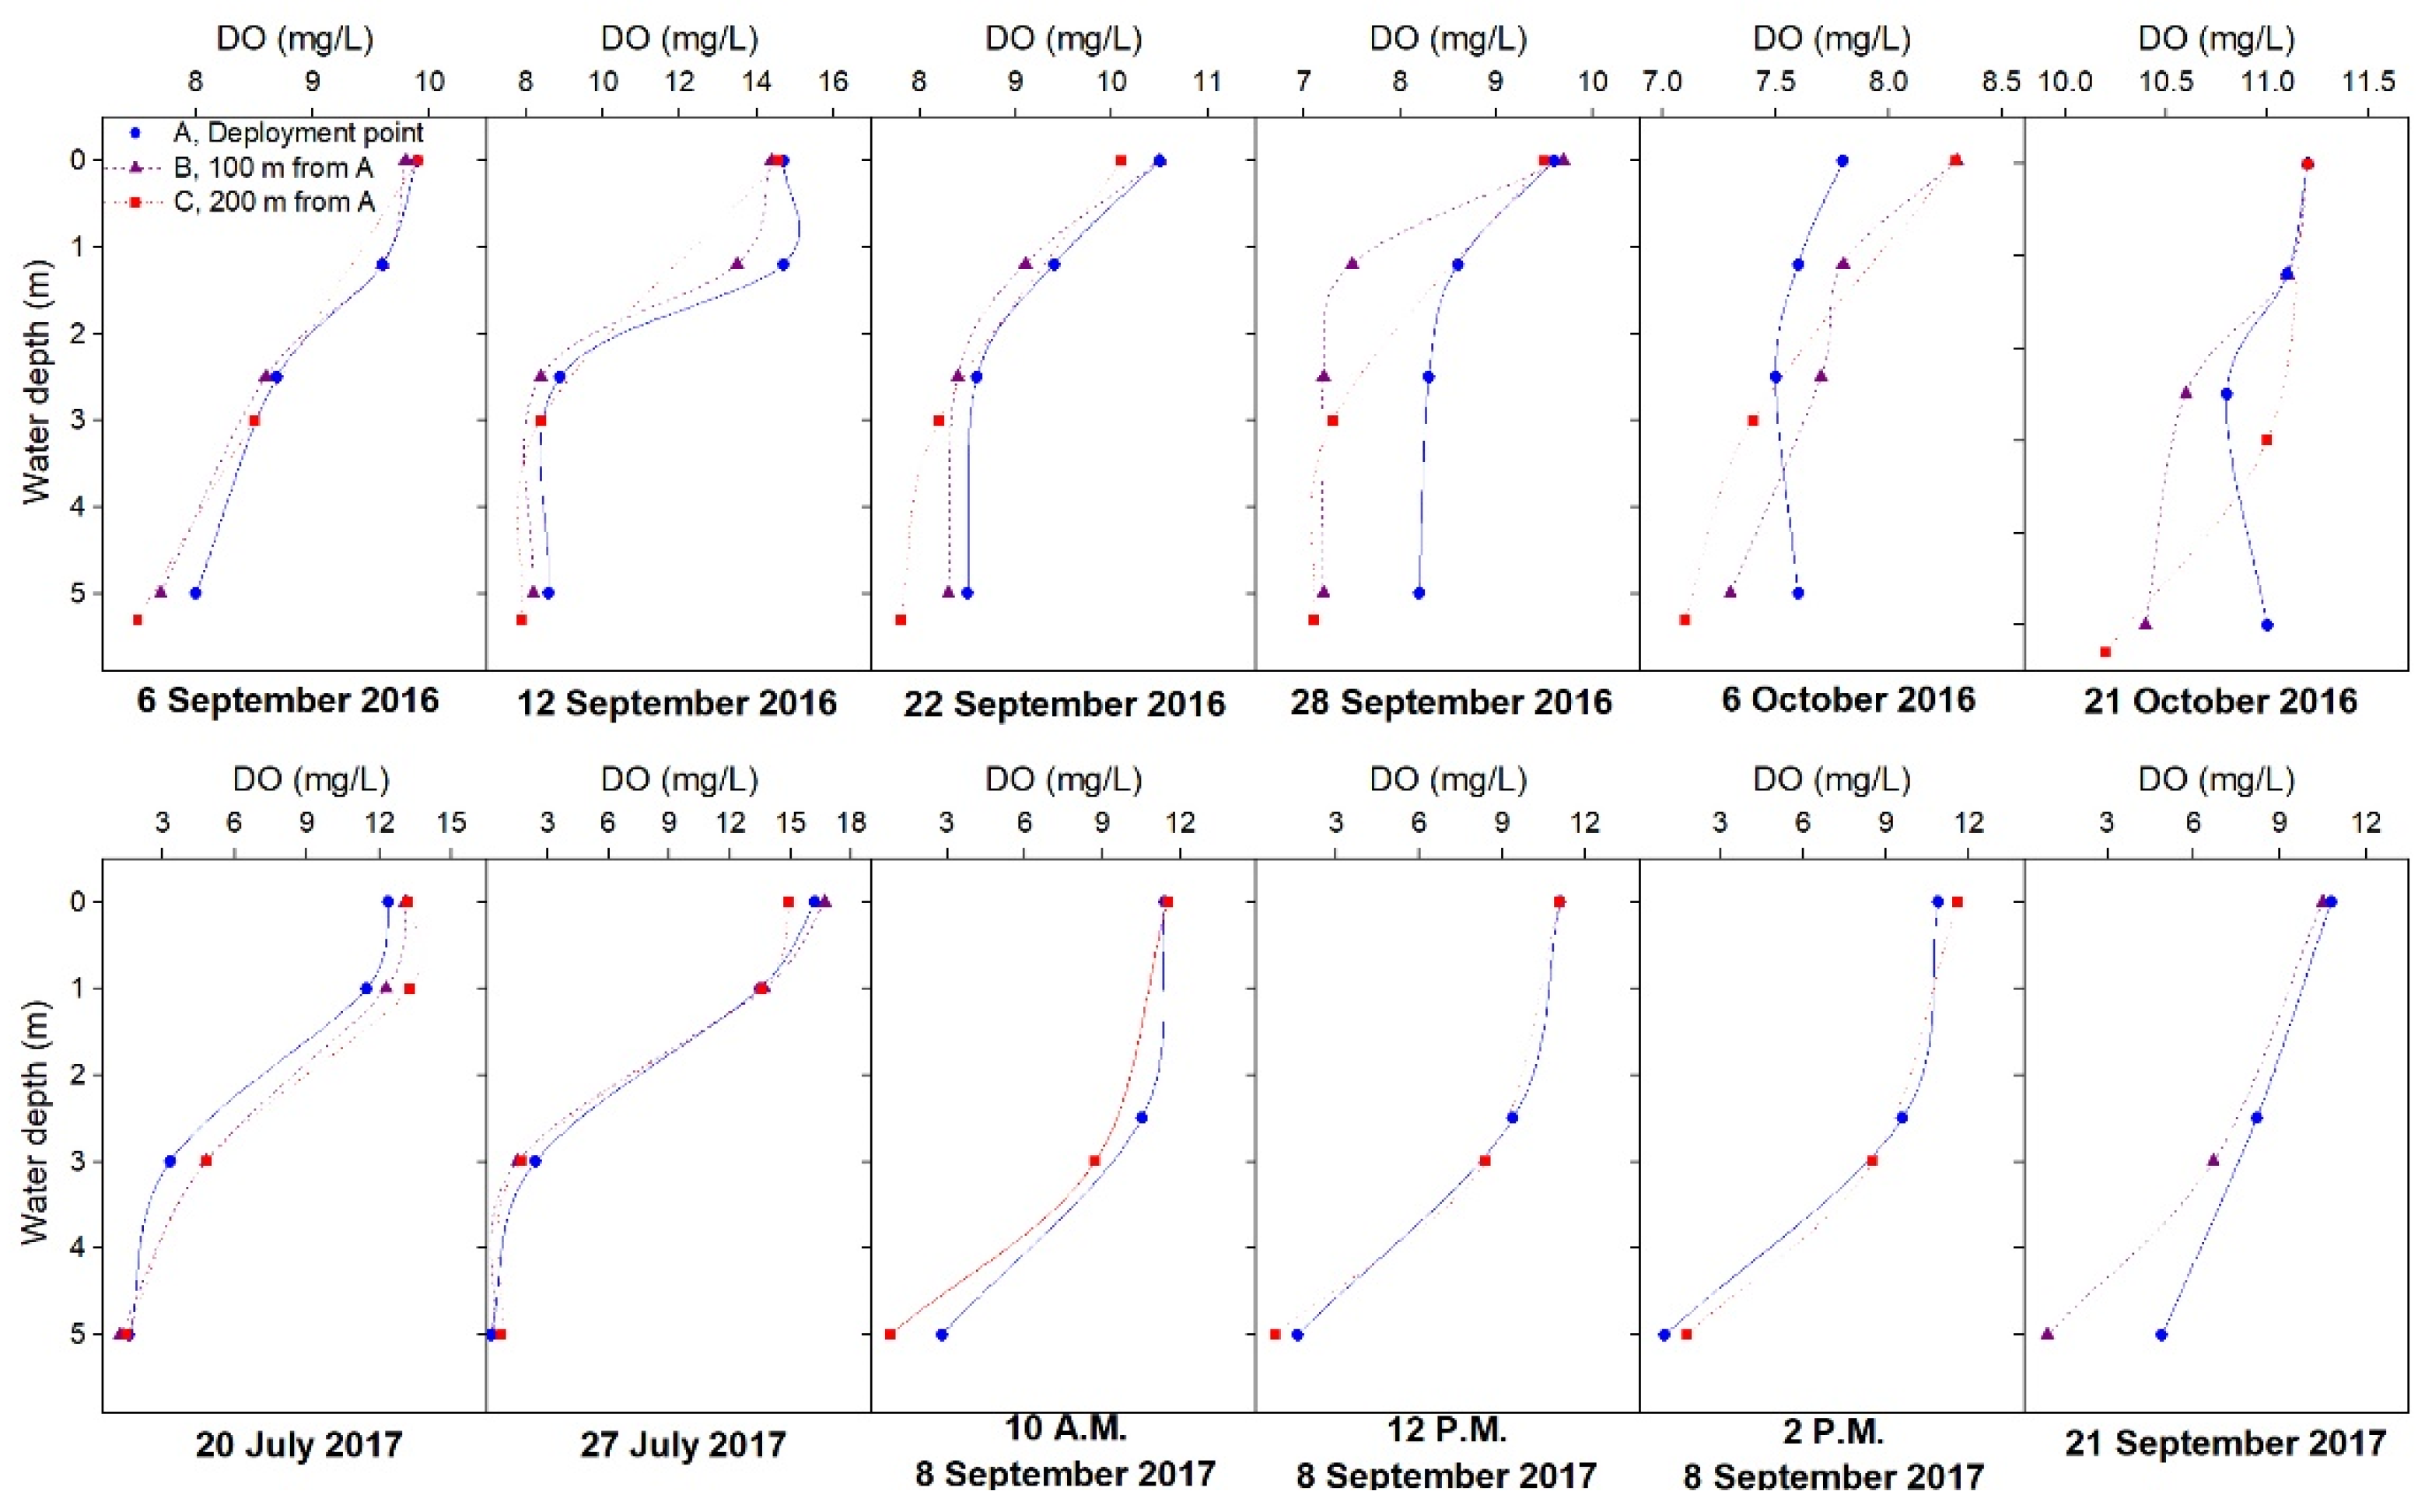
To validate the performance of the CWCS with regards to oxygen transfer, DO concentration was measured at different water depths at each site. When comparing sites, although DO values varied on each experiment day, the values at site A were higher than site C, especially in the hypolimnion (Figure 3). As the CWCS continued to operate, DO levels in the hypolimnion continued to increase at site A. The variation in DO values recorded at site B and site C displayed similar trends, but the DO values at site B were slightly higher than the values at site C. On 6 October 2016, site A exhibited lower DO values in the epilimnion than those recorded at site B and C, but higher values were recorded in the hypolimnion. In 2017, DO values in the epilimnion at all sites were not significantly different, whereas the values in the hypolimnion were extremely low at less than 1 mg/L, which is considered anoxic [25,26]. Similar to those in the previous season, the DO values in the hypolimnion at site A increased gradually, up to 5 mg/L on 21 September 2017, whereas the values in the hypolimnion at site B and site C remained close to zero.
The paired t-test results revealed that there was a significant difference between the DO values measured in 2016 at the CWCS deployment site (site A, 9.36 mg/L, SD = 1.78 mg/L) and those from control site C (site C, 9.0 mg/L, SD = 1.93 mg/L) (t(17) = 3.60, p < 0.002) (Table 2). However, in 2017 there was no significant difference in DO values between sites A and C (t(7) = −0.87, p < 0.41).
3.2. Changes in Water Temperature Based on CWCS Operation
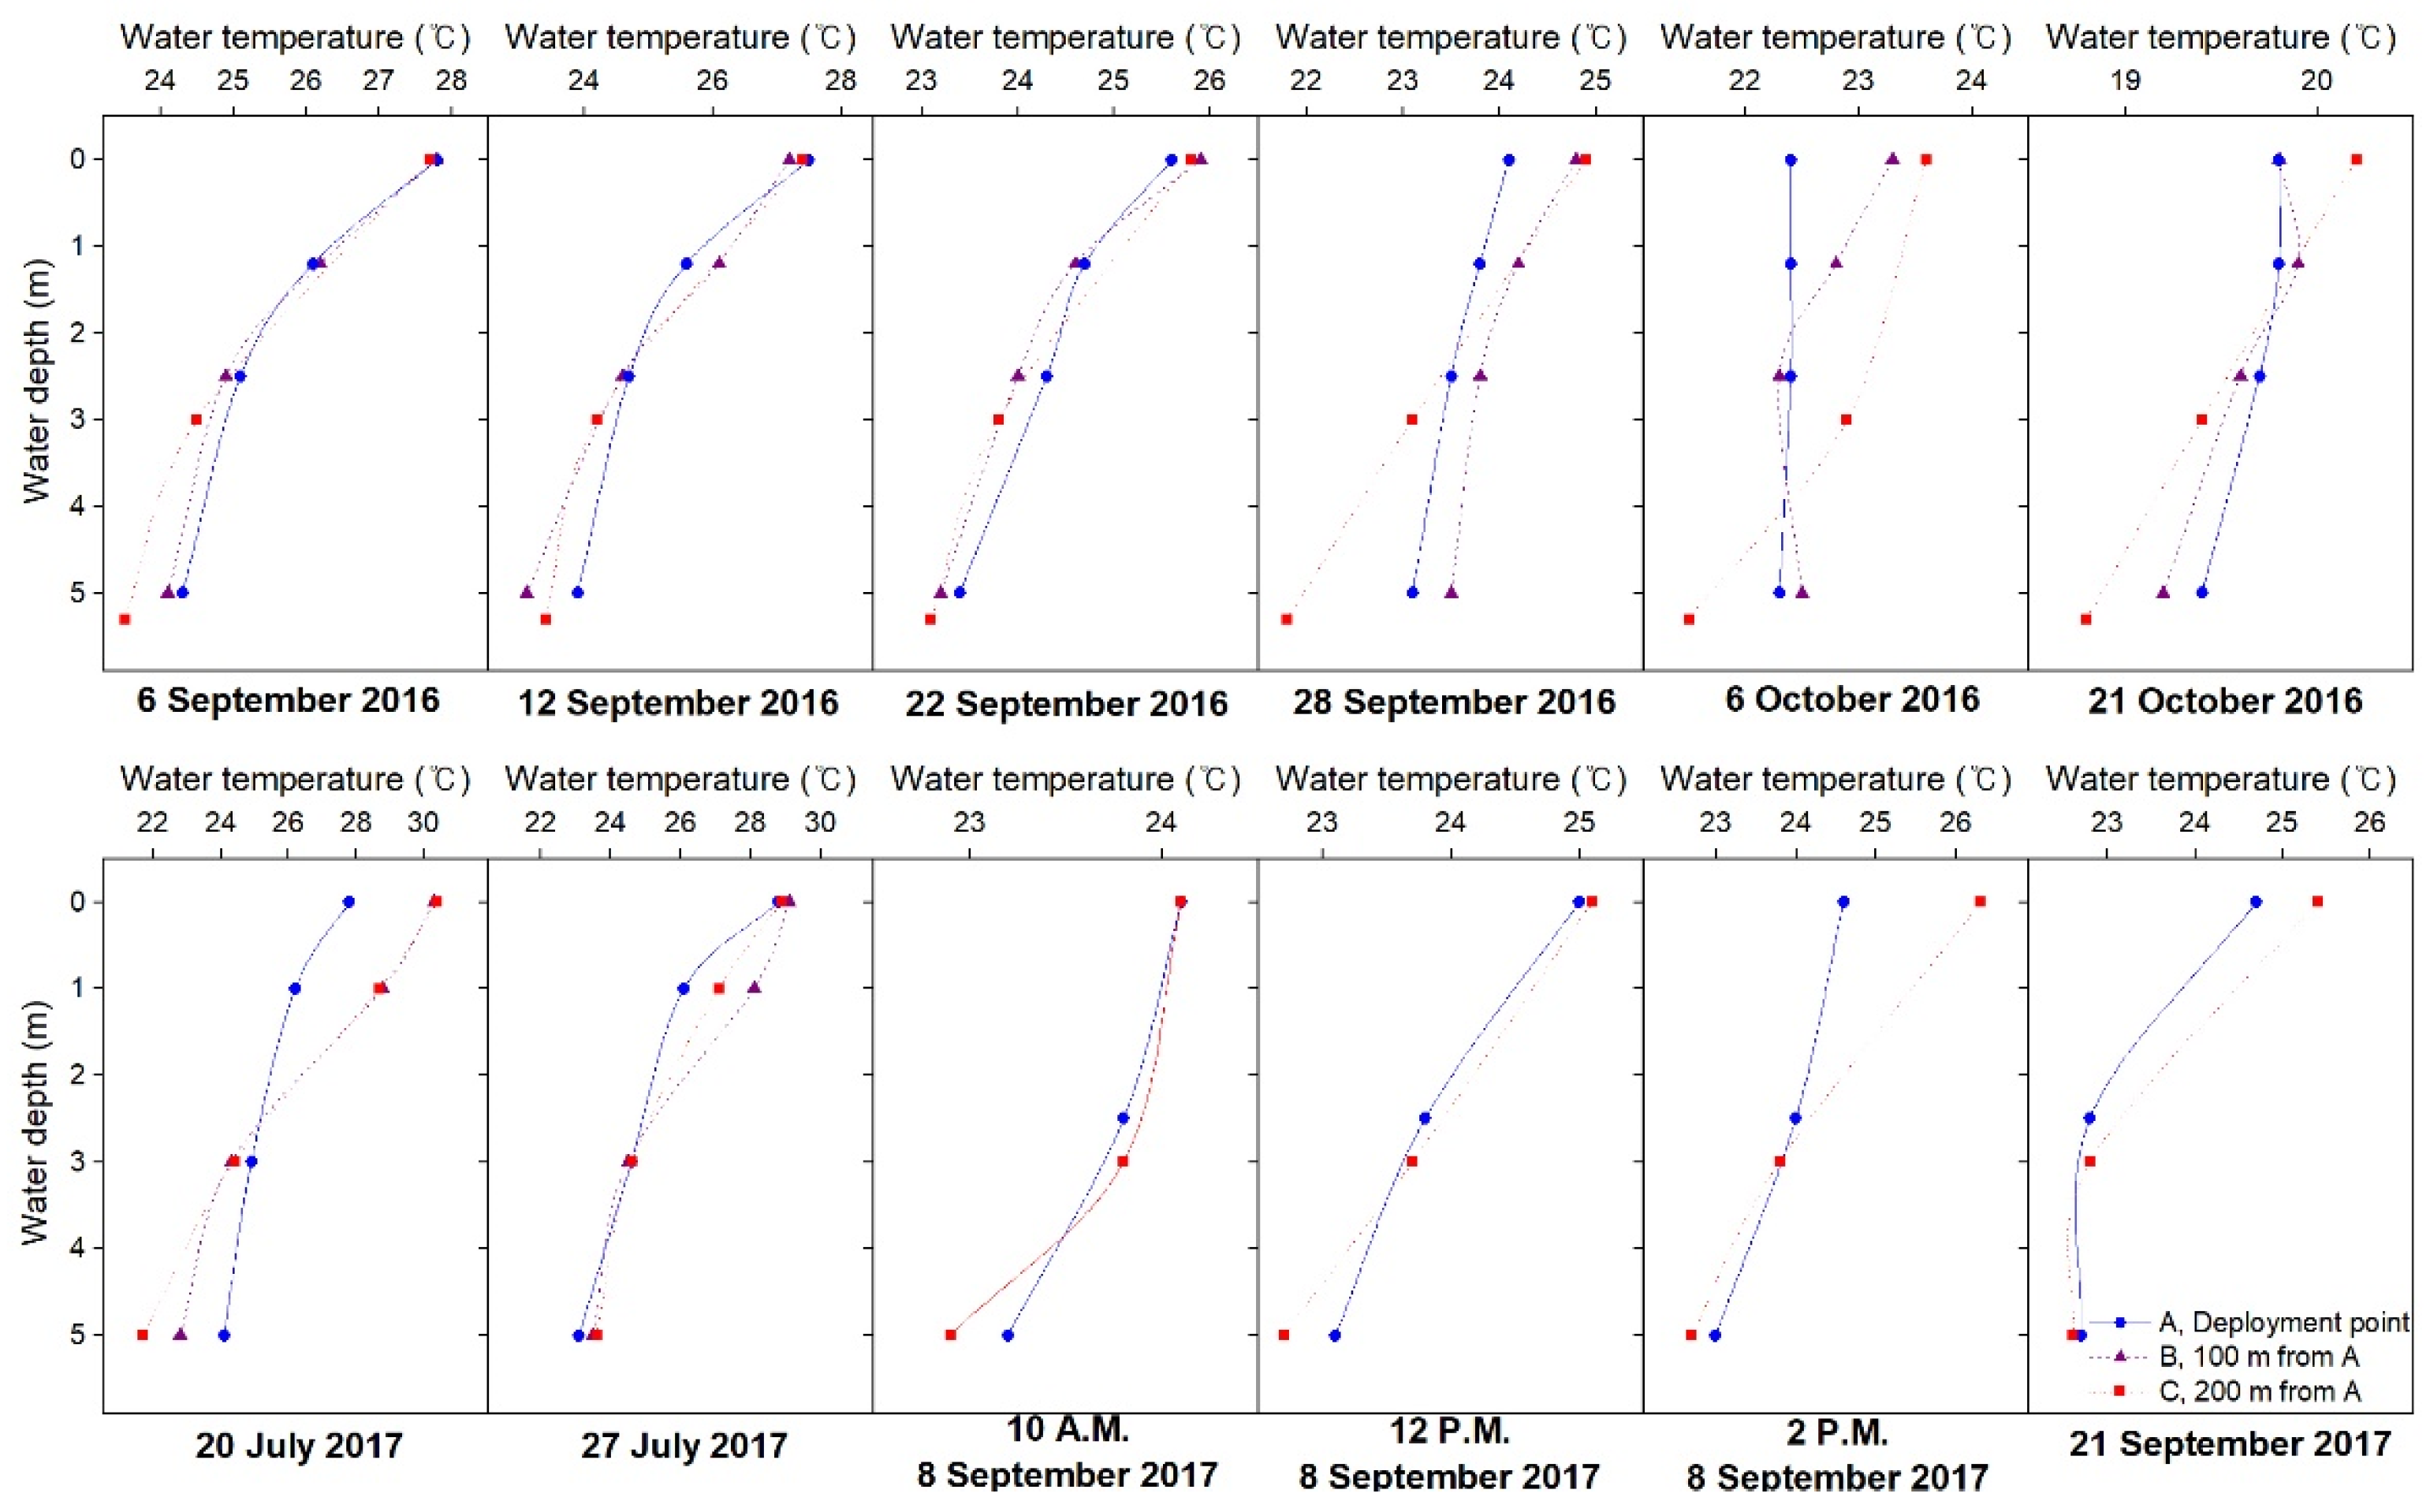
The destratification performance of the CWCS was evaluated by measuring water temperature at different water depths at each site. A gradual decrease in the surface water temperature over time was observed due to the atmospheric temperature decline from seasonal changes (Figure 4). The temperature gradients at each measurement site (Figure 4) indicate the changes in water temperature from the epilimnion to the hypolimnion. The steeper the gradient the closer the surface and hypolimnion water temperatures were. Steeper gradients were observed at site A, the deployment site, than at sites B and C.
The vertical mixing performance of the CWCS can be demonstrated by comparing the average and the maximum differences in water temperature between the epilimnion and the hypolimnion of each site. In 2016, the average and maximum epilimnion-hypolimnion temperature difference were 1.6 °C and 2.6 °C, respectively, while those at site C were 2.6 °C and 3.6 °C, respectively (Table S2). This was most apparent on 6 October 2016, when epilimnion–hypolimnion temperature differences at sites A and C were 0.1 °C and 2.1 °C, respectively. On 20 July 2017, the epilimnion–hypolimnion temperature difference at site A was 4.8 °C, whereas it was 8.7 °C at site C, almost twice as high (Table S2). On 8 September 2017, water temperatures were measured at 2 h intervals. At site D, the temperature of the hypolimnion remained the same, whereas the epilimnion temperature increased at site D. At site A, however, at 2 p.m. on the same day, the epilimnion temperature decreased by over 1 °C due to CWCS operation.
The paired t-test indicated that there were significant differences between the water temperature data from the CWCS deployment site (A) and that from the control site (C) (Table 2). Through operation of the CWCS, destratification was achieved at site A, with a decrease in water temperature in the top layer and an increase in the bottom layers. Meanwhile, site C remained stratified. The paired t-test showed that the surface water temperatures (0 m) at site A were significantly lower than those at site C in 2016 (t(5) = −1.89, p < 0.1). As expected, the paired t-test revealed that the water temperature of the bottom two layers (3, 5 m) at site A were significantly higher than the corresponding values at site C (t(11)= 4.20, p < 0.0007). Similar results were obtained in 2017. The water temperature of the top two layers (0, 1 m) at site A was significantly lower than at site C (t(3) = −1.28, p < 0.09). The water temperature of the bottom two layers at site A was significantly higher than that at site C (t(3) = 1.19, p < 0.16).
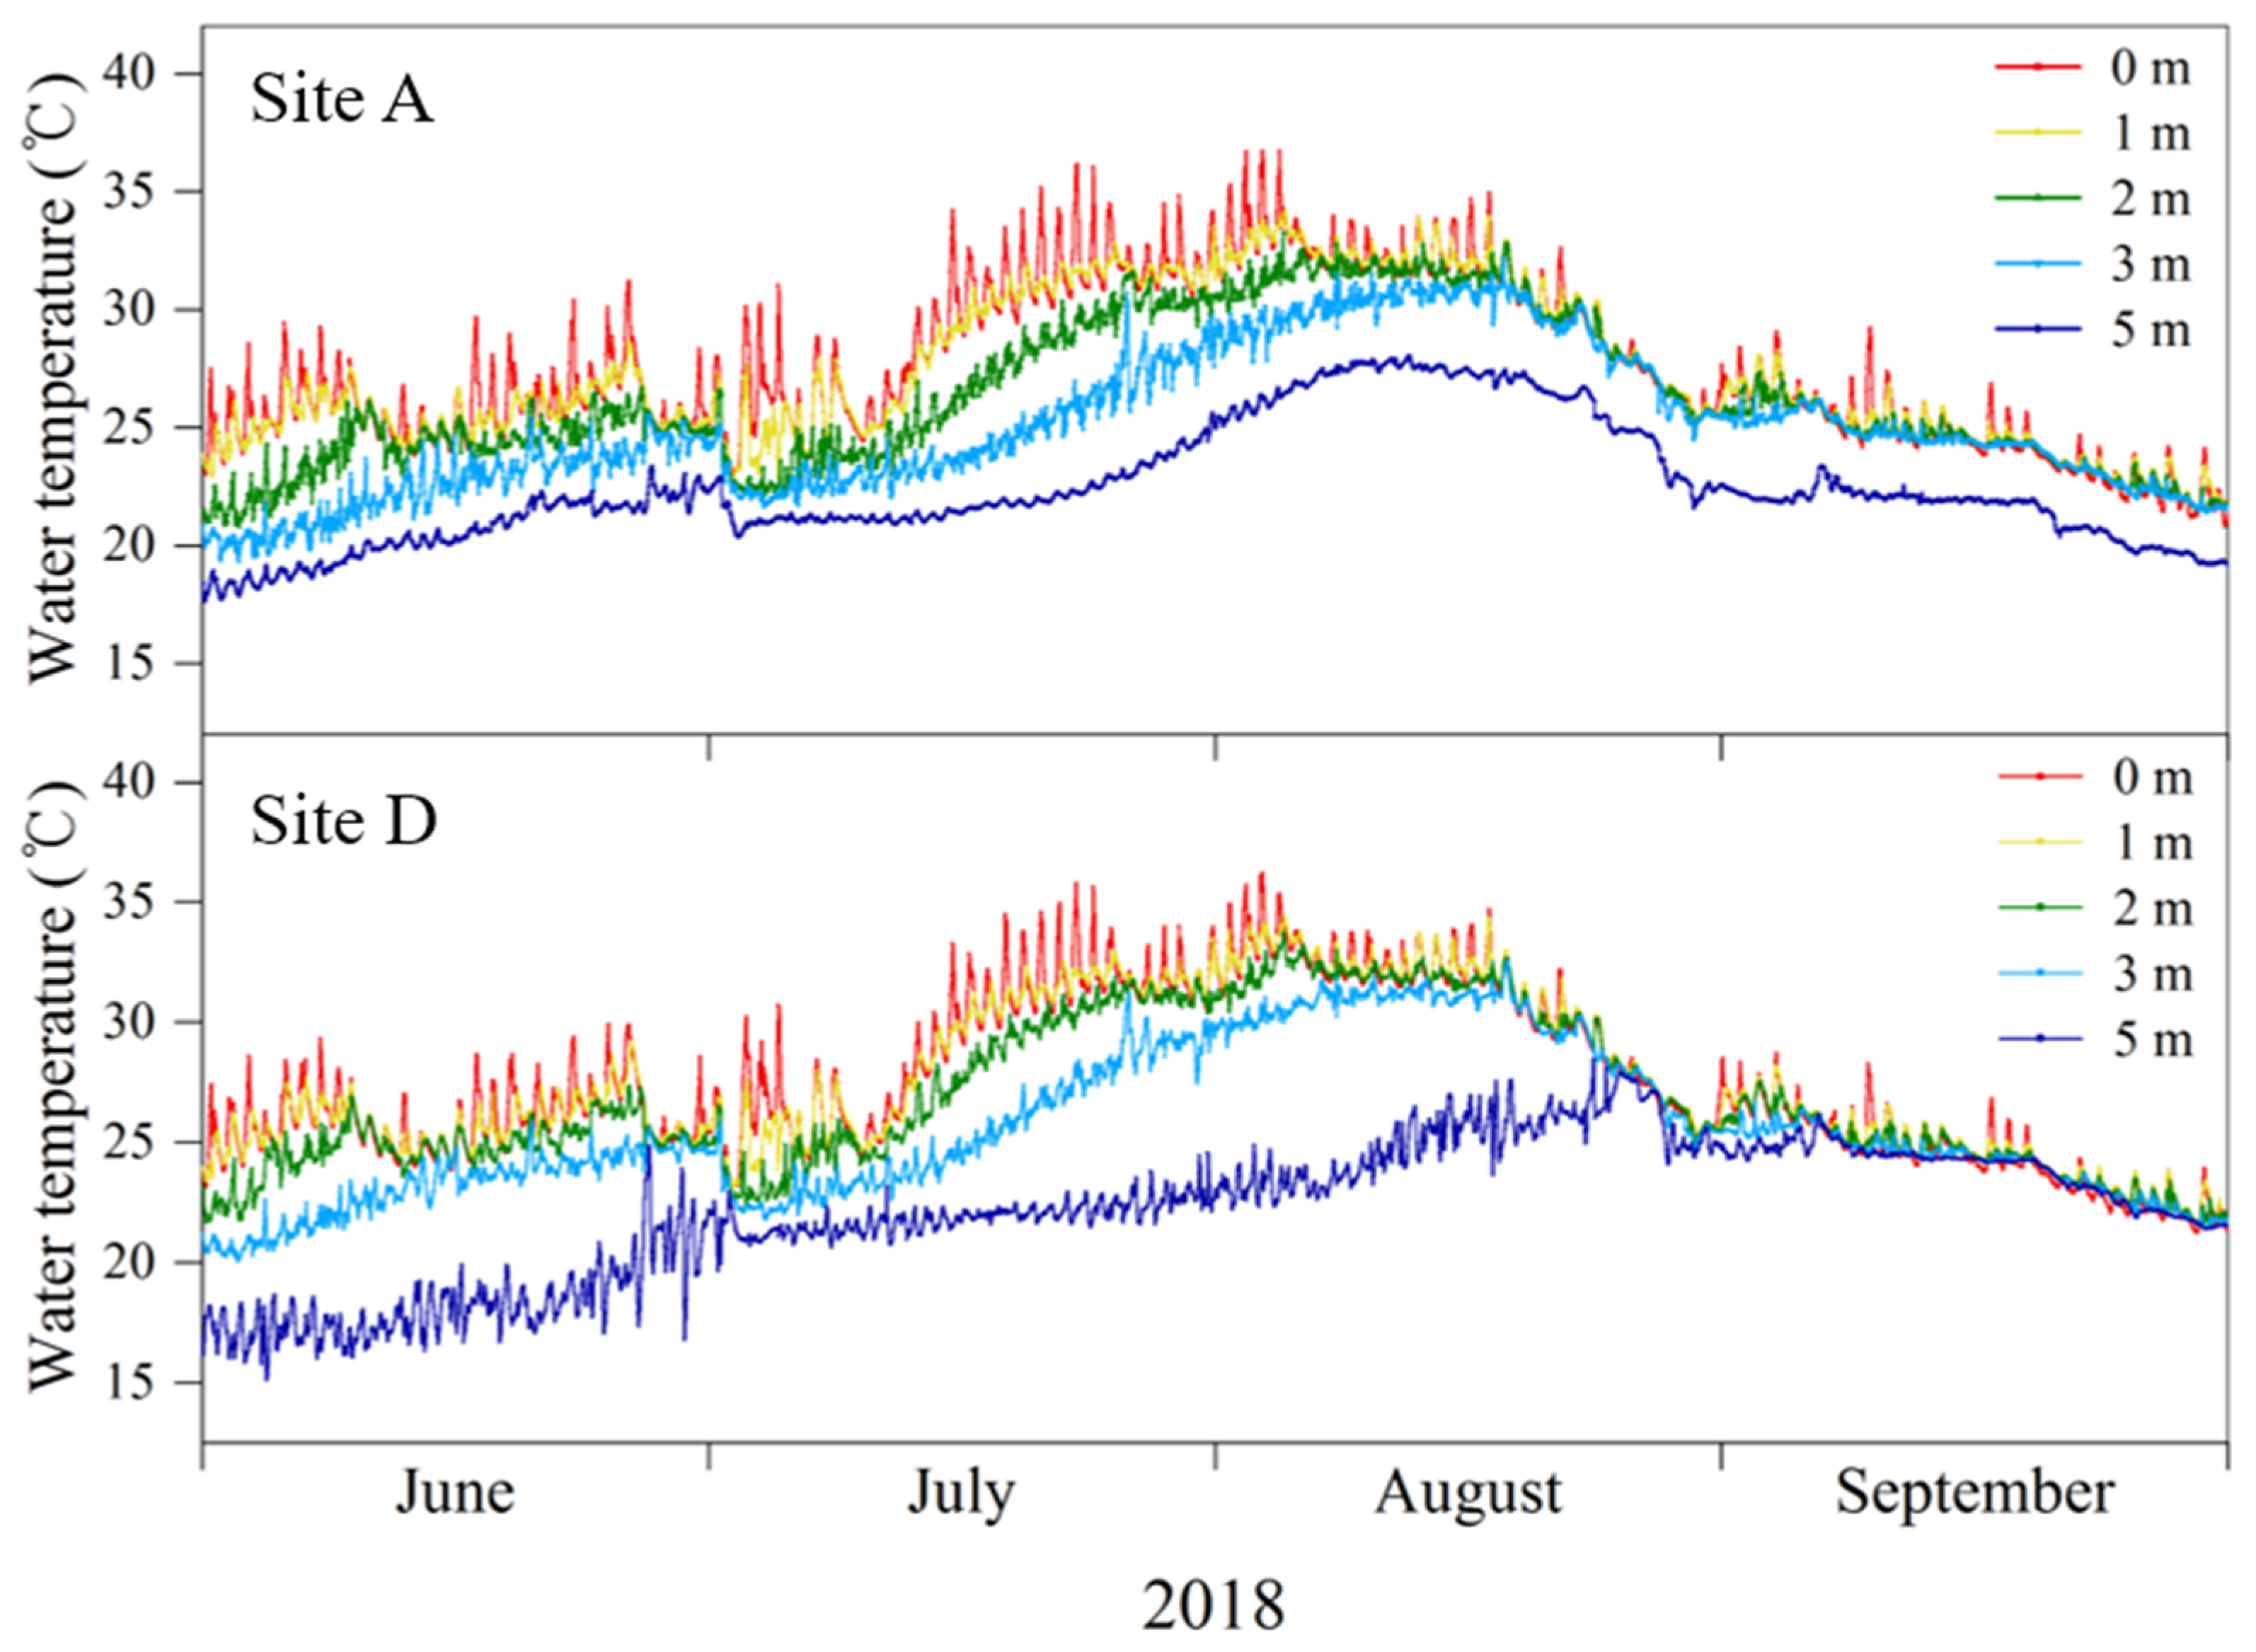
To compare the artificial circulation generated by the operation of the CWCS with natural circulation conditions, in 2018, a natural circulation control site, site D, was established. Measurements at control sites B and C ceased. The water temperatures at each water depth displayed similar trends in site A and site D (Figure 5). Sensor maintenance was responsible for abrupt changes at the beginning of July and the end of August in the graph. The apparent fluctuations were caused by diurnal-nocturnal changes. Due to the intense sunlight in the summer, the water temperature on the surface of each site increased to 36 °C. The influence of solar radiation during the summer was more evident at site D, as water temperature fluctuations were more drastic there compared to site A. Especially, site A at a 5 m depth exhibited relatively gentle variations. Furthermore, in September, a complete mixing occurred and lasted until the end of the month at site D. However, at a 5 m depth, site A remained undisturbed.
3.3. Changes in Chlorophyll-a Concentrations Based on CWCS Operation
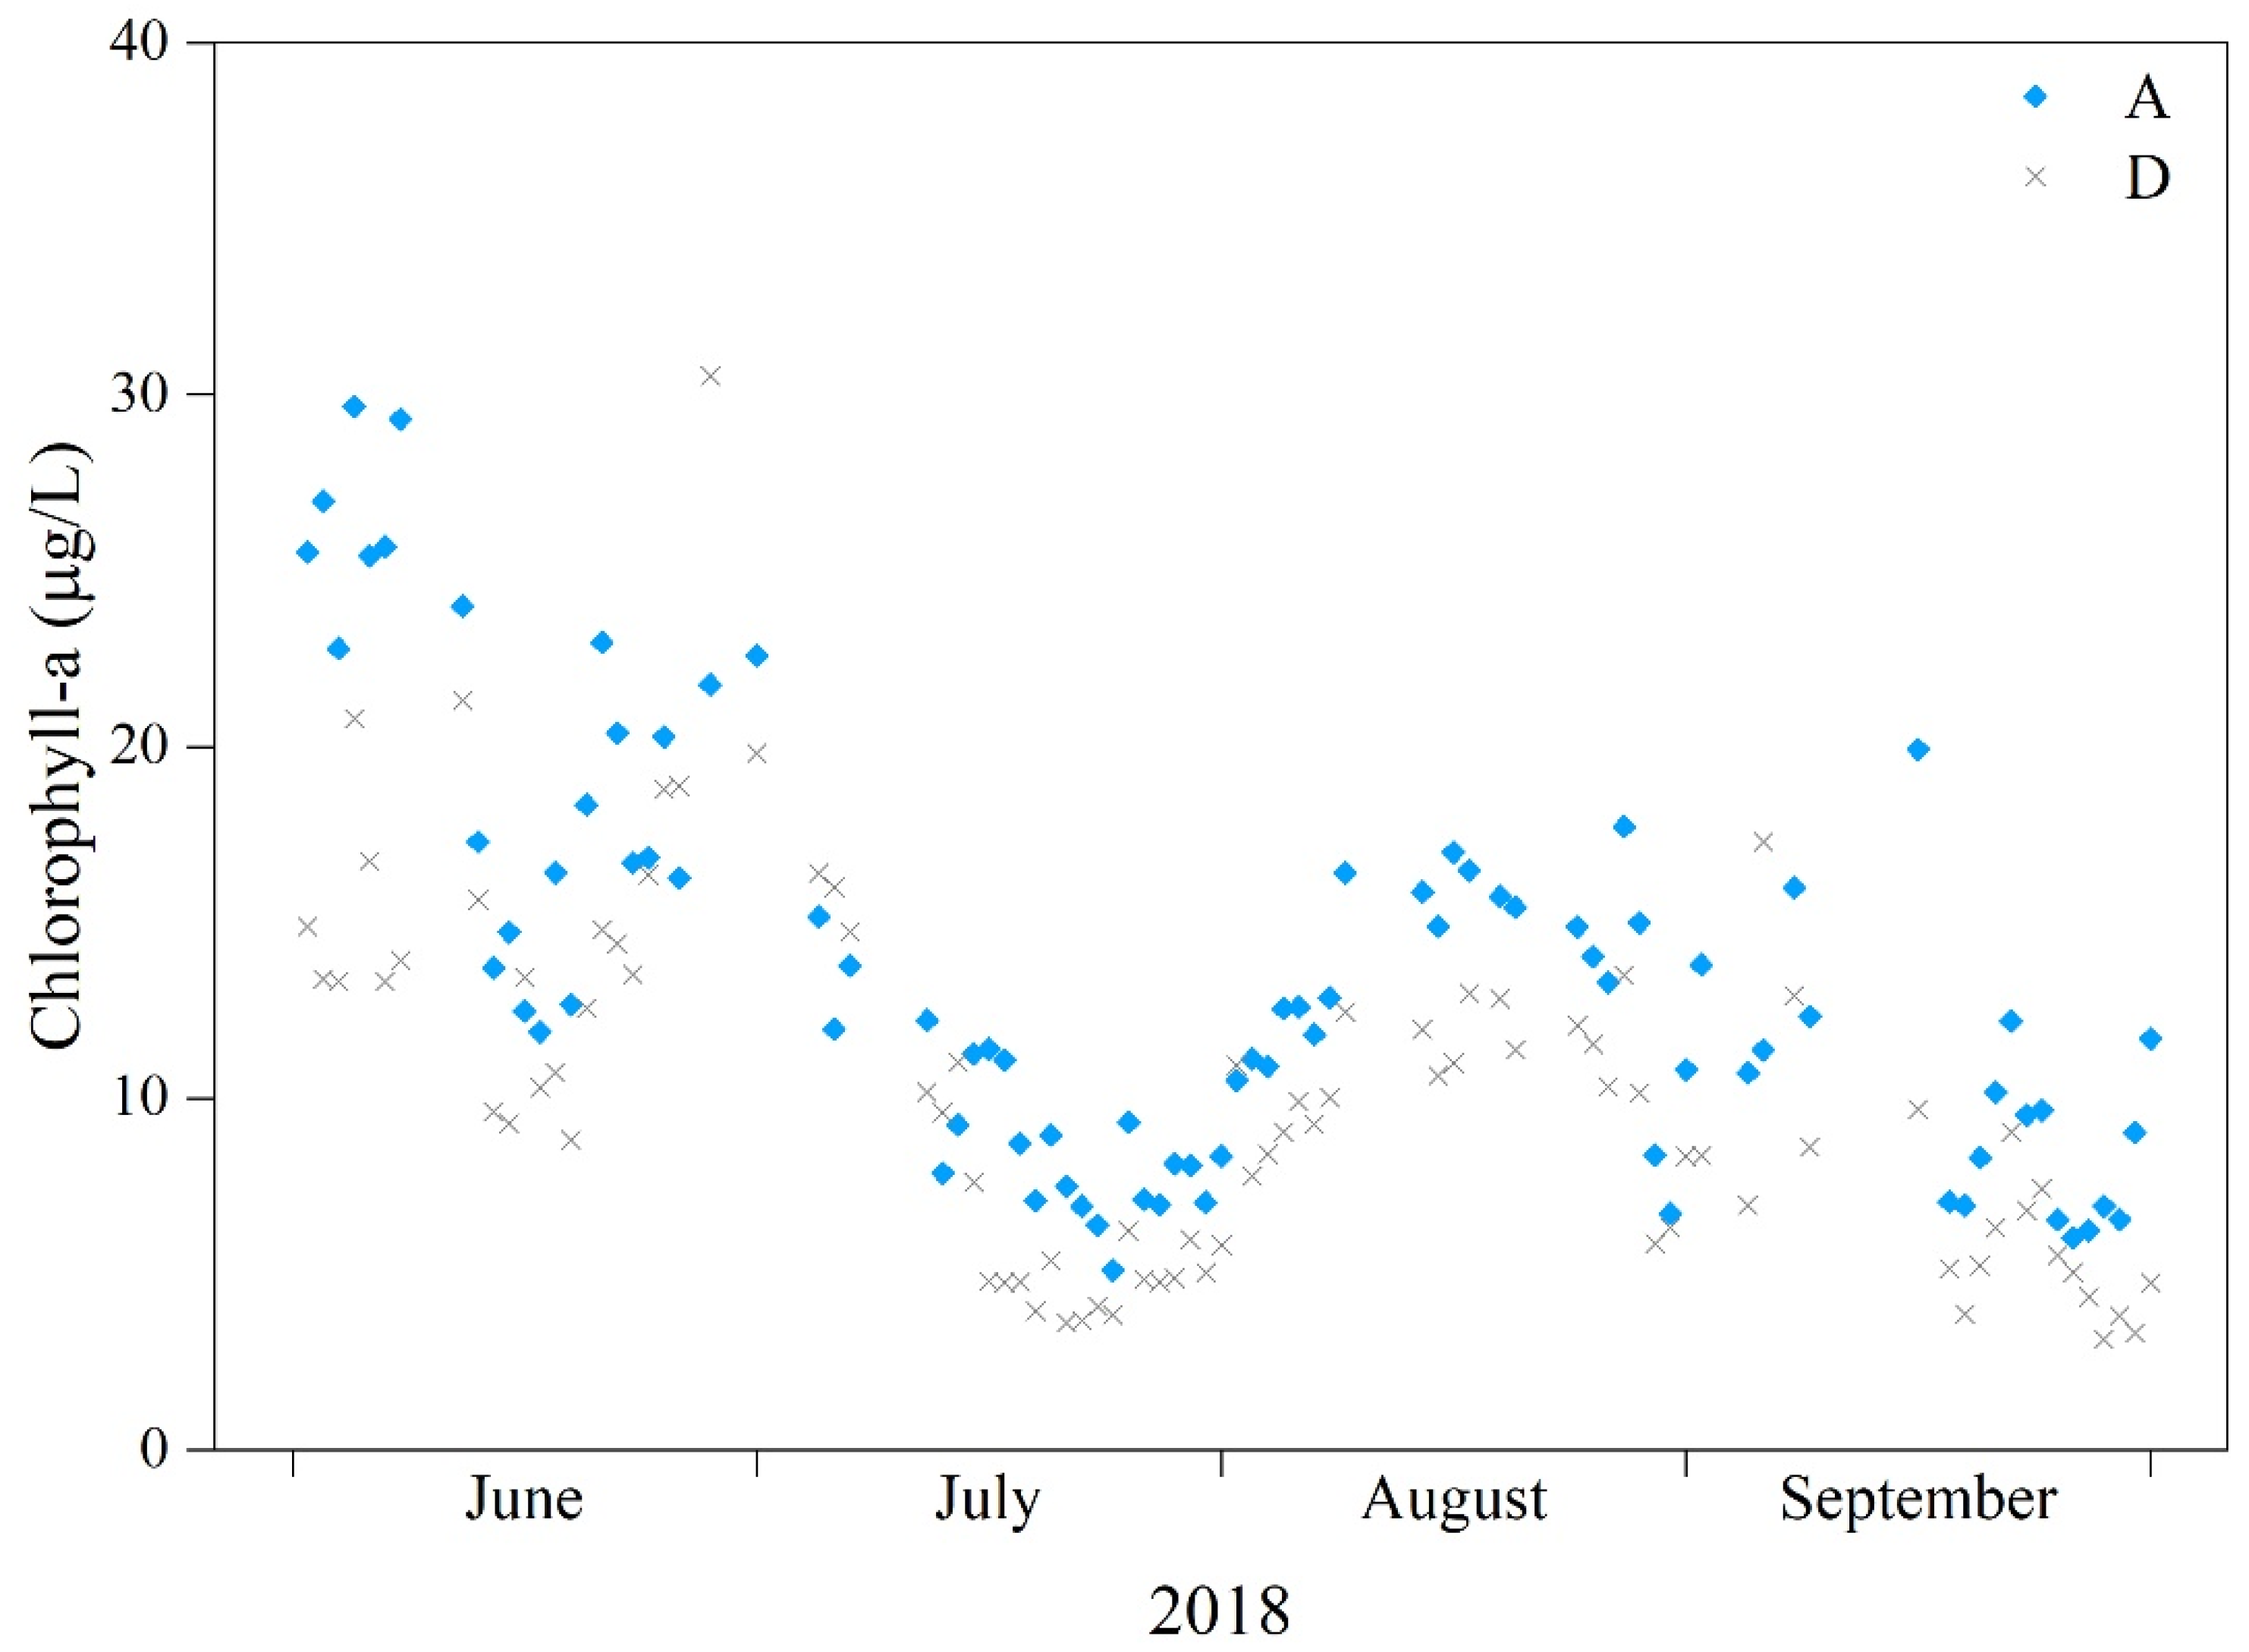
Chlorophyll-a concentration is an indicator of algal biomass and also reflects the water’s trophic status [29]. Overall, chlorophyll-a concentrations measured at both monitoring sites exhibited similar trends, but the values from site A were slightly higher than at site D (Figure 6). The highest chlorophyll-a value of 29.7 µg/L was detected in June at site A and the lowest value was 3.1 µg/L at site D in September. No significant algal bloom was observed during the monitoring period.
4. Discussion
Water stratification and DO concentration are related to algal bloom occurrences. Therefore, the performance of a novel CWCS, designed for algal bloom suppression, in water destratification and oxygen transfer was investigated. In 2016 and 2017, the destratification performance of the CWCS was evaluated based on variations in water temperatures and DO concentrations between the epilimnion and the hypolimnion at a CWCS deployment site and two control sites. The smaller differences in epilimnion–hypolimnion water temperatures between site A and the paired t-test results signify a weakened thermal stratification due to vertical mixing by the CWCS. The operation of the CWCS not only promoted vertical mixing of water columns but also induced horizontal circulation. Specifically, the water temperatures and DO concentrations at the hypolimnion of site B were higher than those at site C. As site B is 100 m closer to site A than site C, these results demonstrate that site B was influenced by the CWCS operation (Figure 3 and Figure 4). The CWCS created surface water flow at the top of the impeller that enabled outward waves and flows, thus expanding its area of influence. In 2017, CWCS operation continued through winter, when the reservoir began to freeze, to improve water quality by continuous disturbance of stagnant water and derive more efficient operation conditions for the system. In December 2017, an area of approximately 200 m radius around site A (Figure S1c, yellow circle) did not freeze, indicating the extent of the CWCS influence.
The CWCS was deployed in a corner of the reservoir, where water was stagnant; severe accumulation of algal biomass was observed in this area in 2016 (Figure S1a). In 2017, the DO values at the hypolimnion were close to zero at all experiment sites, emphasizing a demand for water quality improvement in the Shingal reservoir. It is considered that the low DO concentrations were due to the presence of decaying organic matter, including algal cells from the previous season. This agrees with the paired t-test results of the 2017 DO values, which revealed no significant difference between site A and site C (Table 2). On 21 September 2017, however, the DO concentration in hypolimnion at site A increased to 4.9 mg/L, whereas it was 0.9 mg/L at site B. DO concentration can be increased by surface water movement at the air–water interface, but it generally occurs in flowing water rather than in stagnant water [30]. As there was no significant difference in water temperatures between site A and site B in the hypolimnion on the same day, the DO increase demonstrates the contribution of the CWCS unit operation in oxygen transfer to the bottom of the reservoir. This result is consistent with previous studies where artificial water circulation has been effective in supplying oxygen [12,31,32].
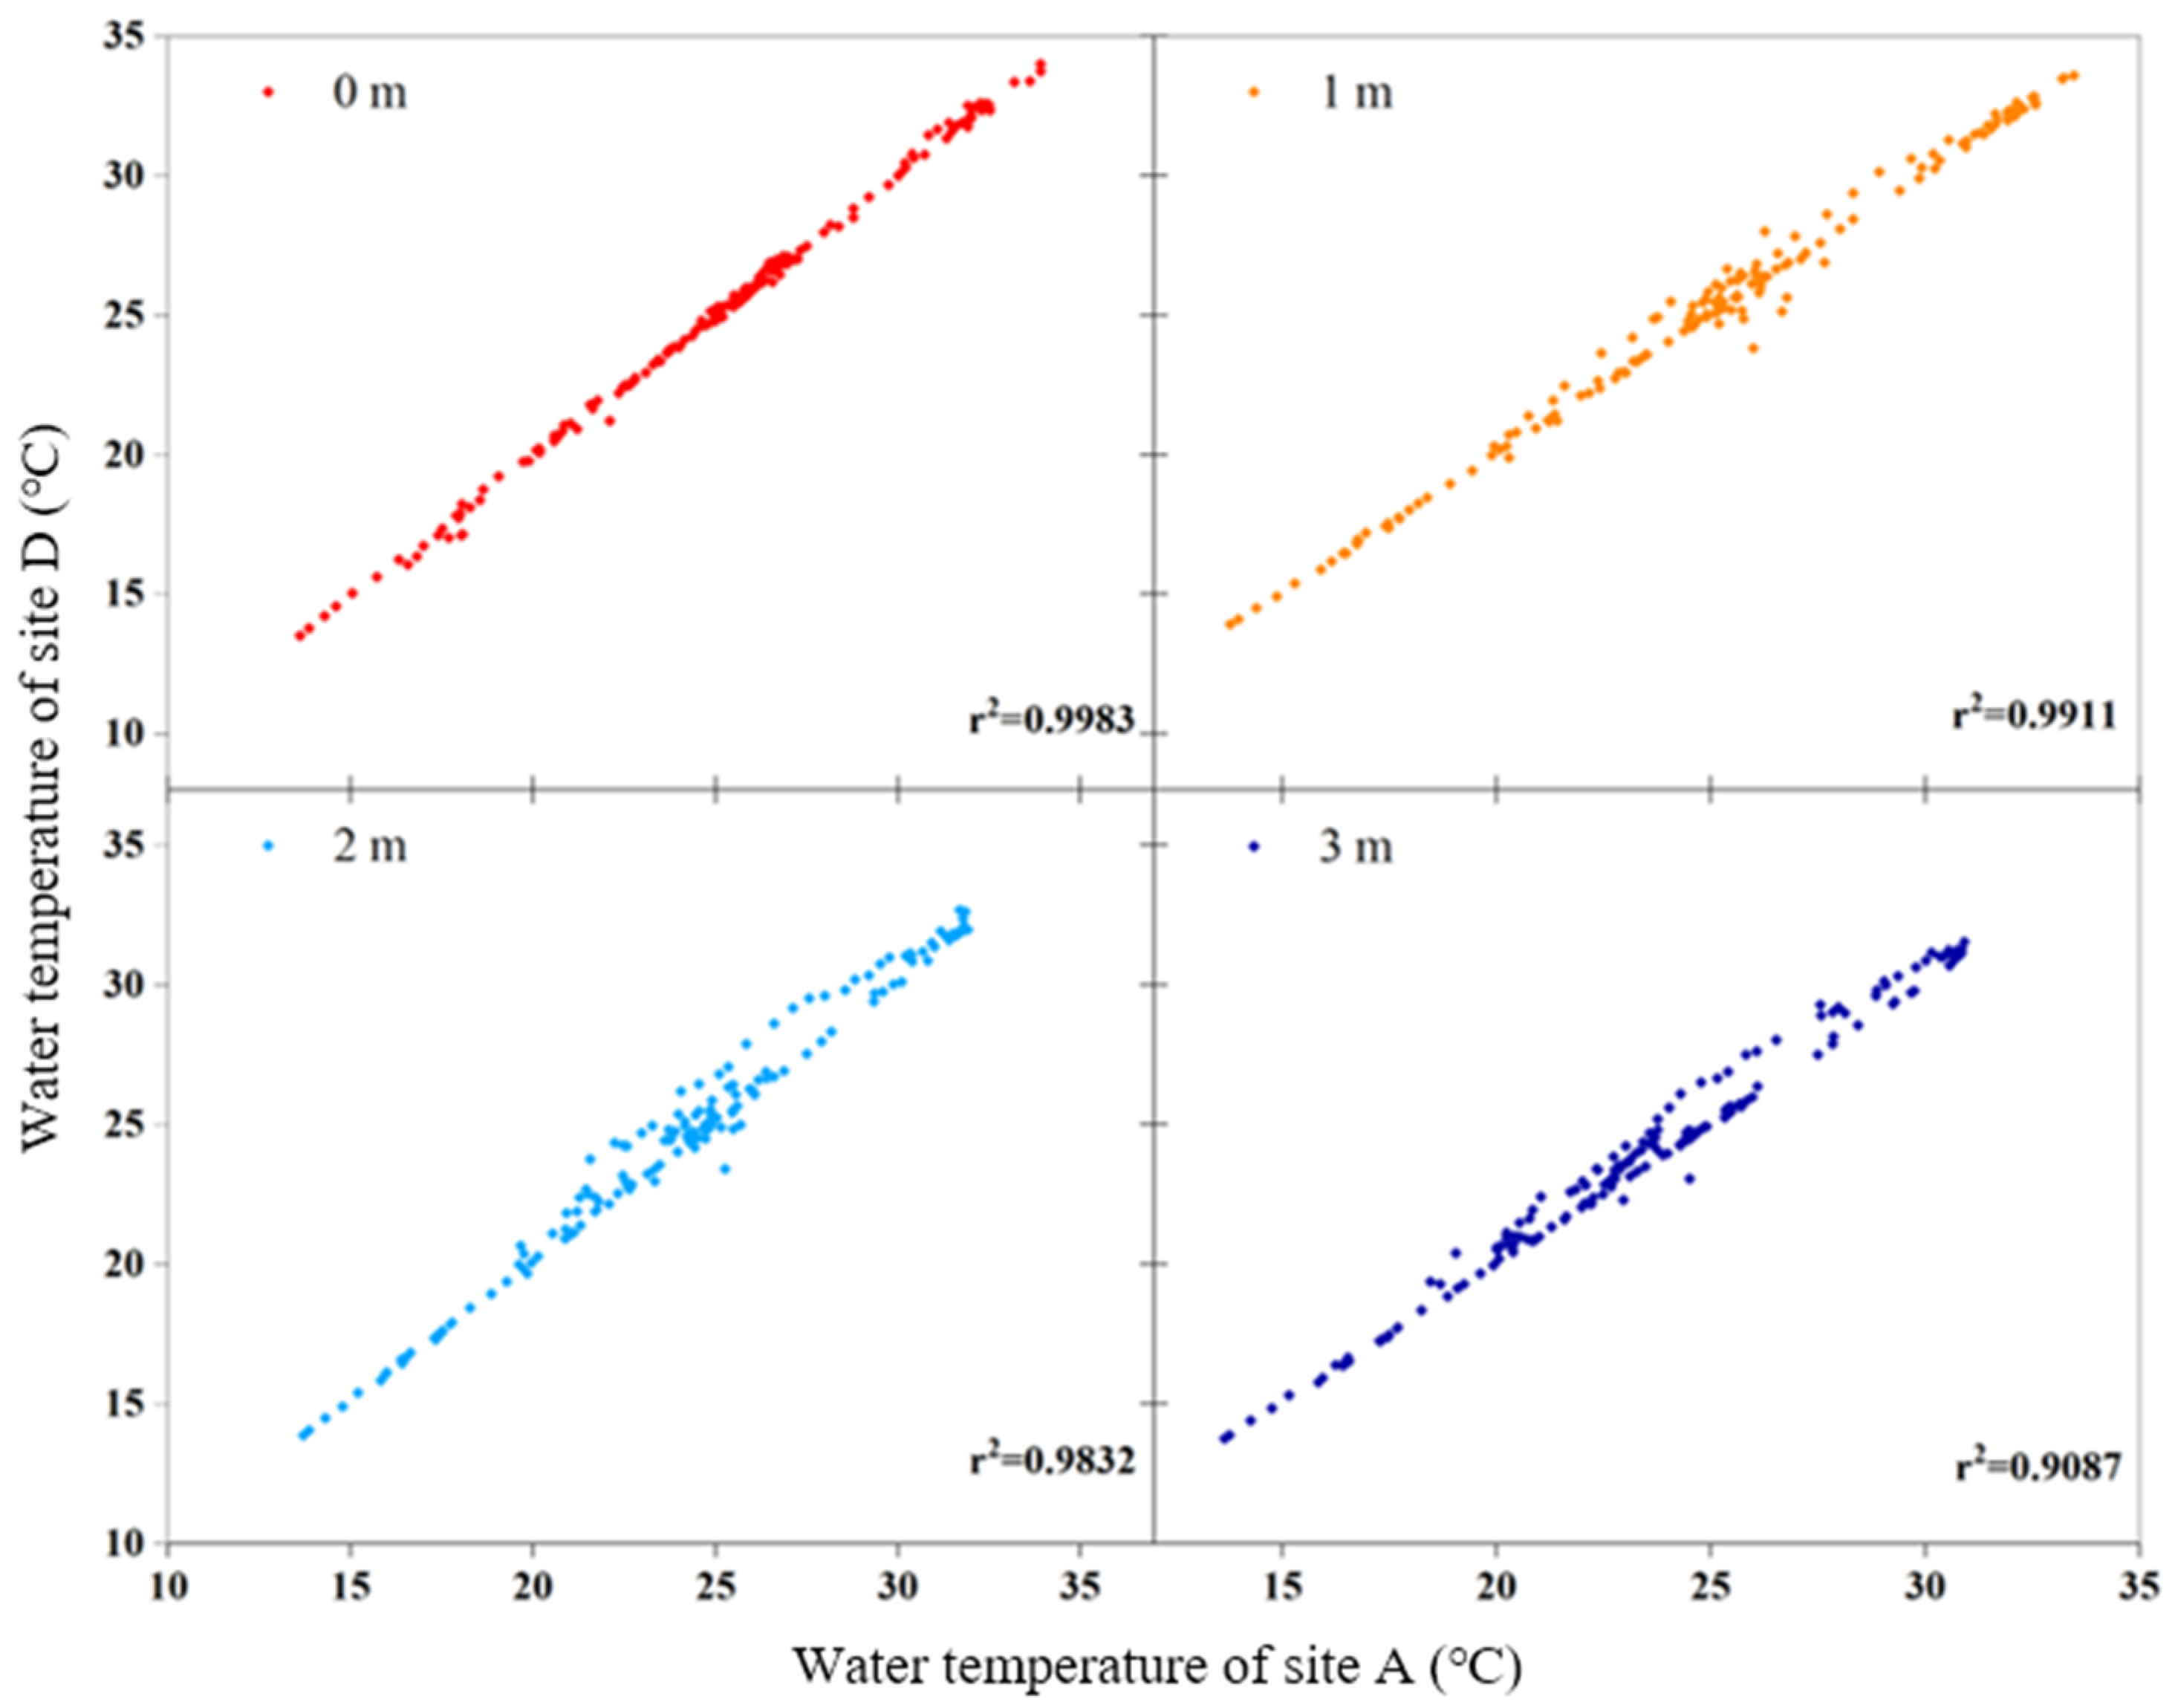
Water destratification can be achieved by applying artificial water circulation techniques to generate currents in stagnant areas and replicate natural circulation. Therefore, it is critical to understand how the artificial mixing induced by the CWCS compares with natural circulation conditions. In 2018, further investigation was conducted in the same corner of the reservoir as the CWCS deployment site. A natural circulation control site, site D, was established, and measurement at sites B and C ceased. The results of the water temperature measurements at 0, 1, 2, and 3 m from June to August 2018 at both sites presented similar trends, implying that the CWCS can generate flows that replicate natural circulation (Figure 5). Fluctuation in temperature at a depth of 5 m was larger at site D than at site A. Though this represents a deviation from natural circulation replication, it also suggests the steady operation of the CWCS. Furthermore, the correlation of water temperatures between site A and site D were compared at each depth using descriptive analysis to illustrate the natural flow replication of the CWCS (Figure 7). The correlation graphs of the four water depths displayed reasonably linear lines and their r2 values were greater than 0.9. The epilimnion water temperature at the two sites has a stronger correlation than the hypolimnion water temperature, because the influences of solar radiation and energy flux are higher at the surface of the water [33]. Considering the size of the data (n = 206), the high r2 values from the hypolimnion indicated that the water temperature data from the two sites were significantly correlated, which indicates that the CWCS created water circulations very similar to natural circulations.
Weather is one of the most important influences of artificial circulation efficiency. Previous studies show that strong winds can induce internal and surface seiches, which are oscillations in the water body [31,32]. The data obtained on 27 July 2017, showed no significant differences in variations of water temperature with water depth at either site A or site C (Figure 4). This destratification was attributable to the heavy rain that occurred for three days, including the day of field data collection. Hence, natural water circulation of lakes and reservoirs occurs on rainy and windy days due to increased flow rates and elevated wind velocities. However, intense circulation can induce benthic disturbance and resuspension of nutrient-enriched sediment which can result in nutrient release to overlying water and further induce eutrophication and algal bloom occurrences [20,21,33]. In this context, circulation by artificial water circulation technologies can compound natural circulation caused by weather, which is considered a major drawback in their application.
Notably, in September 2018, complete mixing occurred at site D but not at site A, from autumn turnover (Figure 5). The field study was conducted through the end of September; no observations of complete mixing were made, indicating the stable mixing performance of the CWCS. This indicates that the CWCS did not compound the natural circulation caused by the weather event, and in this instance sediment suspension and nutrient release were avoided at site A while vertically mixing the above layers. Nevertheless, it is critical to understand the characteristics of a proposed site for an artificial circulation system because complete mixing could have occurred in other water bodies (e.g., smaller or shallower lakes and reservoirs). Influence range of the artificial circulation system is also an important factor in that it determines how many units should be deployed to cover the water body. In this study, the estimated influence radius of CWCS was 200 m. In large, stagnant water bodies, more CWCS units are required for destratification. In addition, laboratory-scale or pilot-scale tests should be performed prior to field operations to determine the optimal operation conditions for the given system.
In 2017, the algal blooms were not as severe as in the 2016 conditions in the Shingal reservoir (Figure S1b). This difference may be explained by the CWCS operation. However, it may also be due to the level of anthropogenic activities that influence nutrient concentrations in the reservoir or changes in meteorological elements (wind, sunlight, and precipitation), such as the heavy rainfall event that occurred at the end of July 2017. However, it has been suggested that rainfall events sometimes promote the growth of cyanobacteria from increasing input of nutrients and resuspension of cyanobacterial cells from the sediment. This again demonstrates the importance of leaving benthic zones undisturbed [34].
Water circulation tends to shift phytoplankton profiles, e.g., from cyanobacteria to green algae or diatoms [11,35]. Algal identification, analysis of the relationship between algal cell density nutrient concentrations, and investigation of community transitions according to temporal and seasonal changes may provide a better understanding of CWCS performance. This study was only conducted in one reservoir. Further research on the application of CWCSs in multiple (or networks of) large water bodies prone to eutrophication would enable more detailed and direct evaluation of the utility of artificial water circulation techniques.
5. Conclusions
The following conclusions can be drawn from this article:
- Paired samples t-test revealed that the CWCS operation induced vertical and horizontal mixing in stagnant water. Water temperature and DO concentrations at different water depths at the CWCS deployment site were compared to the control sites.
- Oxygen was supplied to the hypolimnion at the CWCS deployment site.
- The CWCS replicated natural mixing while preventing negative impacts of benthic disturbance from complete mixing.
- The estimated influence radius of the CWCS was 200 m.
- In future studies, more algae-related indicators such as algal identification, algal cell density, and phycocyanin concentrations should be analyzed to gain better insight into the performance of CWCS for algal bloom suppression.
Supplementary Materials
The following supporting information can be downloaded at: https://www.mdpi.com/article/10.3390/w14081282/s1, Figure S1: taken at the study site, Shingal reservoir, in (a) 6 September 2016, (b) 8 September 017, and (c) as viewed from the west in December 2017. Yellow circle indicates the CWCS unit in operation; Table S1: Water depths of each layer in Shingal reservoir; Table S2: Water temperature differences at experiment sites and water depths on each data experiment date.
Author Contributions
Conceptualization, H.-c.O. and J.A.; data curation, H.K.; formal analysis, B.L., H.K. and H.-c.O.; methodology, B.L. and H.K.; investigation, H.K.; resources, J.A.; writing—original draft preparation, B.L.; writing—review and editing, B.L.; visualization, B.L. and H.K.; supervision, J.A., S.-L.Y. and S.K.; project administration, H.-c.O.; funding acquisition, S.-L.Y. All authors have read and agreed to the published version of the manuscript.
Funding
This work was supported by the National Research Council of Science & Technology (NST) grant by the Korea government (MSIT) (No. CAP-18-07-KICT).
Conflicts of Interest
The authors declare no conflict of interest.
References
- Gorham, E.; Boyce, F.M. Influence of lake surface area and depth upon thermal stratification and the depth of the summer thermocline. J. Great Lakes Res. 1989, 15, 233–245. [Google Scholar] [CrossRef]
- Chen, C.; Beardsley, R.C.; Franks, P.J.S.; Van Keuren, J. Influence of diurnal heating on stratification and residual circulation of Georges bank. J. Geophys. Res. Oceans 2003, 108. [Google Scholar] [CrossRef]
- Furuya, K.; Iwataki, M.; Lim, P.T.; Lu, S.; Leaw, C.-P.; Azanza, R.V.; Kim, H.-G.; Fukuyo, Y. Overview of harmful algal blooms in Asia. In Global Ecology and Oceanography of Harmful Algal Blooms; Glibert, P.M., Berdalet, E., Burford, M.A., Pitcher, G.C., Zhou, M., Eds.; Springer International Publishing: Berlin/Heidelberg, Germany, 2018; pp. 289–308. [Google Scholar] [CrossRef]
- Park, Y.; Pyo, J.; Kwon, Y.S.; Cha, Y.; Lee, H.; Kang, T.; Cho, K.H. Evaluating physico-chemical influences on cyanobacterial blooms using hyperspectral images in inland water, Korea. Water Res. 2017, 126, 319–328. [Google Scholar] [CrossRef] [PubMed]
- Cha, Y.; Cho, K.H.; Lee, H.; Kang, T.; Kim, J.H. The relative importance of water temperature and residence time in predicting cyanobacteria abundance in regulated rivers. Water Res. 2017, 124, 11–19. [Google Scholar] [CrossRef] [PubMed]
- Kim, S.; Kim, S.; Mehrotra, R.; Sharma, A. Predicting cyanobacteria occurrence using climatological and environmental controls. Water Res. 2020, 175, 115639. [Google Scholar] [CrossRef]
- Higgins, J.M.; Gary, B.W. Overview of reservoir release improvements at 20 TVA dams. J. Energy Eng. 1999, 125, 1–17. [Google Scholar] [CrossRef]
- Li, N.; Huang, T.; Chang, Z.; Li, K. Effects of benthic hydraulics on sediment oxygen demand in a canyon-shaped deep drinking water reservoir: Experimental and modeling study. J. Environ. Sci. 2021, 102, 226–234. [Google Scholar] [CrossRef]
- Gu, S.; Gruau, G.; Dupas, R.; Petitjean, P.; Li, Q.; Pinay, G. Respective roles of Fe-oxyhydroxide dissolution, pH changes and sediment inputs in dissolved phosphorus release from wetland soils under anoxic conditions. Geoderma 2019, 338, 365–374. [Google Scholar] [CrossRef]
- Jalil, A.; Li, Y.; Du, W.; Wang, W.; Wang, J.; Gao, X.; Khan, H.O.S.; Pan, B.; Acharya, K. The role of wind field induced flow velocities in destratification and hypoxia reduction at Meiling Bay of large shallow Lake Taihu, China. Environ. Pollut. 2018, 232, 591–602. [Google Scholar] [CrossRef]
- Hudnell, H.K.; Jones, C.; Labisi, B.; Lucero, V.; Hill, D.R.; Eilers, J. Freshwater harmful algal bloom (FHAB) suppression with solar powered circulation (SPC). Harmful Algae 2010, 9, 208–217. [Google Scholar] [CrossRef]
- Bormans, M.; Maršálek, B.; Jančula, D. Controlling internal phosphorus loading in lakes by physical methods to reduce cyanobacterial blooms: A review. Aquat. Ecol. 2016, 50, 407–422. [Google Scholar] [CrossRef]
- Lawson, R.; Anderson, M.A. Stratification and mixing in lake Elsinore, California: An assessment of axial flow pumps for improving water quality in a shallow eutrophic lake. Water Res. 2007, 41, 4457–4467. [Google Scholar] [CrossRef] [PubMed]
- Singleton, V.L.; Little, J.C. Designing hypolimnetic aeration and oxygenation systems—A review. Environ. Sci. Technol. 2006, 40, 7512–7520. [Google Scholar] [CrossRef] [PubMed]
- Hooper, F.F.; Ball, R.C.; Tanner, H.A. An experiment in the artificial circulation of a small Michigan lake. Trans. Am. Fish. Soc. 1953, 82, 222–241. [Google Scholar] [CrossRef]
- Upadhyay, S.; Bierlein, K.A.; Little, J.C.; Burch, M.D.; Elam, K.P.; Brookes, J.D. Mixing potential of a surface-mounted solar-powered water mixer (SWM) for controlling cyanobacterial blooms. Ecol. Eng. 2013, 61, 245–250. [Google Scholar] [CrossRef]
- Lorenzen, M.W.; Mitchell, R. An evaluation of artificial destratification for control of algal blooms. J. Am. Water Works Assoc. 1975, 67, 373–376. [Google Scholar] [CrossRef]
- Imteaz, M.A.; Asaeda, T. Artificial mixing of lake water by bubble plume and effects of bubbling operations on algal bloom. Water Res. 2000, 34, 1919–1929. [Google Scholar] [CrossRef]
- Pacheco Carlos, H.A.; Lima Neto Iran, E. Effect of artificial circulation on the removal kinetics of cyanobacteria in a hypereutrophic shallow lake. J. Environ. Eng. 2017, 143, 06017010. [Google Scholar] [CrossRef]
- Wang, J.; Pang, Y.; Li, Y.; Huang, Y.; Luo, J. Experimental study of wind-induced sediment suspension and nutrient release in Meiliang Bay of Lake Taihu, China. Environ. Sci. Pollut. Res. Int. 2015, 22, 10471–10479. [Google Scholar] [CrossRef]
- Arfi, R.; Guiral, D.; Bouvy, M. Wind induced resuspension in a shallow tropical lagoon. Estuar. Coast. Shelf Sci. 1993, 36, 587–604. [Google Scholar] [CrossRef] [Green Version]
- Diaz Garcia, M.E.; Sanz-Medel, A. Facile chemical deoxygenation of micellar solutions for room temperature phosphorescence. Anal. Chem. 1986, 58, 1436–1440. [Google Scholar] [CrossRef]
- Li, L.; Zhao, Y.; Wu, Y.; Tong, A. Non-protected fluid room temperature phosphorescence of several naphthalene derivatives. Talanta 1998, 46, 1147–1154. [Google Scholar] [CrossRef]
- Plumeré, N.; Henig, J.; Campbell, W.H. Enzyme-catalyzed O2 removal system for electrochemical analysis under ambient air: Application in an amperometric nitrate biosensor. Anal. Chem. 2012, 84, 2141–2146. [Google Scholar] [CrossRef] [PubMed]
- Lee, B.; Oh, H.; Kim, Y.; Ahn, J.; Kim, S. Lab-scale evaluation of spiral vortex artificial circulation. Energy Procedia 2017, 141, 677–680. [Google Scholar] [CrossRef]
- Oh, K.H.; Kim, S.J.; Choi, Y.C. Analysis of sediment contamination levels in the giheung reservoir. J. Korean Soc. Water Environ. 2018, 34, 26–32. [Google Scholar] [CrossRef]
- Byun, J.H.; Kim, H.K.; Mun, S.K.; Kim, B.H. Water quality improvement by natural plant-mineral composites and field temperatures of a eutrophic lake in South Korea. J. Environ. Biol. 2014, 35, 807–813. [Google Scholar]
- Kim, B.-H.; Byun, J.-H.; Hwang, S.-O.; Mun, S.-K.; Hwang, S.-J. Effect of temperature on water quality improvement of natural plant-mineral composites (PMC) in a eutrophic lake, lake shingal, Korea. Korean J. Ecol. Environ. 2013, 46, 225–233. [Google Scholar] [CrossRef]
- Boyer, J.N.; Kelble, C.R.; Ortner, P.B.; Rudnick, D.T. Phytoplankton bloom status: Chlorophyll a biomass as an indicator of water quality condition in the southern estuaries of Florida, USA. Ecol. Indic. 2009, 9, S56–S67. [Google Scholar] [CrossRef]
- Radwan, M.; Willems, P.; El-Sadek, A.; Berlamont, J. Modelling of dissolved oxygen and biochemical oxygen demand in river water using a detailed and a simplified model. Int. J. River Basin Manag. 2003, 1, 97–103. [Google Scholar] [CrossRef]
- Soltero, R.A.; Sexton, L.M.; Ashley, K.I.; McKee, K.O. Partial and full lift hypolimnetic aeration of medical lake, WA to improve water quality. Water Res. 1994, 28, 2297–2308. [Google Scholar] [CrossRef]
- Gantzer, P.A.; Preece, E.P.; Nine, B.; Morris, J. Decreased oxygenation demand following hypolimnetic oxygenation. Lake Reserv. Manag. 2019, 35, 292–307. [Google Scholar] [CrossRef]
- Shinohara, R.; Tanaka, Y.; Kanno, A.; Matsushige, K. Relative impacts of increases of solar radiation and air temperature on the temperature of surface water in a shallow, eutrophic lake. Hydrol. Res. 2021, 52, 916–926. [Google Scholar] [CrossRef]
- Reichwaldt, E.S.; Ghadouani, A. Effects of rainfall patterns on toxic cyanobacterial blooms in a changing climate: Between simplistic scenarios and complex dynamics. Water Res. 2012, 46, 1372–1393. [Google Scholar] [CrossRef] [PubMed]
- Zhang, Y.; Liu, X.; Qin, B.; Shi, K.; Deng, J.; Zhou, Y. Aquatic vegetation in response to increased eutrophication and degraded light climate in eastern lake Taihu: Implications for lake ecological restoration. Sci. Rep. 2016, 6, 23867. [Google Scholar] [CrossRef]
Figure 1.
(a) Pattern of flow generated from the operation of the convectional water circulation system (CWCS), (b) schematic of the CWCS, and (c) depiction of in-field operation.
Figure 1.
(a) Pattern of flow generated from the operation of the convectional water circulation system (CWCS), (b) schematic of the CWCS, and (c) depiction of in-field operation.

Figure 2.
Study sites in Shingal reservoir. Site A: CWCS deployment site (artificially circulated), site B: control site 100 m away from the deployment site, site C: control site 200 m away from the deployment site (2016 and 2017), and site D: natural circulation site 200 m away from the deployment site where natural circulation occurs (2018).

Figure 3.
Vertical profiles of dissolved oxygen concentrations in 2016 and 2017 seasons. A—The CWCS deployment site (site A), B—100 m away from the deployment site (site B), and C—200 m away from the deployment site (site C).
Figure 3.
Vertical profiles of dissolved oxygen concentrations in 2016 and 2017 seasons. A—The CWCS deployment site (site A), B—100 m away from the deployment site (site B), and C—200 m away from the deployment site (site C).

Figure 4.
Vertical profiles of water temperature in the 2016 and 2017 seasons. A—The CWCS deployment site (site A), B—100 m away from the deployment site (site B), and C—200 m away from the deployment site (site C).
Figure 4.
Vertical profiles of water temperature in the 2016 and 2017 seasons. A—The CWCS deployment site (site A), B—100 m away from the deployment site (site B), and C—200 m away from the deployment site (site C).

Figure 5.
Changes in water temperature with depth in 2018 at (A) the CWCS deployment site and (D) the natural circulation site (200 m away from site A).
Figure 5.
Changes in water temperature with depth in 2018 at (A) the CWCS deployment site and (D) the natural circulation site (200 m away from site A).

Figure 6.
Changes in chlorophyll-a values in 2018 at (A) the CWCS deployment site and (D) the natural circulation site (200 m away from site A).
Figure 6.
Changes in chlorophyll-a values in 2018 at (A) the CWCS deployment site and (D) the natural circulation site (200 m away from site A).

Figure 7.
Correlation between the water temperature at the CWCS deployment site (site A) and the site with natural flow (site D) at various depths.
Figure 7.
Correlation between the water temperature at the CWCS deployment site (site A) and the site with natural flow (site D) at various depths.


Table 1.
Operation conditions of the convectional water circulation system.
| Operation Parameter | Season | |||
|---|---|---|---|---|
| 2016 | 2017 | 2018 | ||
| Speed (rpm) | Low | 100 | 120 | 150 |
| High | 180 | 180 | 180 | |
| Operation duration (h/day) | 15.5 | 21.0 | 21.5 | |
| Speed variables ratio (low:high) | 6:1 | 1:1 | ||
Table 2.
Paired t-test results for water temperature and dissolved oxygen (DO) at each location and water depth in 2016 and 2017 seasons.
Table 2.
Paired t-test results for water temperature and dissolved oxygen (DO) at each location and water depth in 2016 and 2017 seasons.
| Descriptive Statistics | Paired t-Test Statistics | |||||||||
|---|---|---|---|---|---|---|---|---|---|---|
| Mean | Std. Dev. | Std. Err. | Mean Diff. | Std. Dev. | Std. Err. | 95% Conf. Interval | t (DF) | p-Value | ||
| Lower | Upper | |||||||||
| ′16, Temp. A 0 m | 24.53 | 3.09 | 1.26 | −0.4 | 0.52 | 0.21 | - | −0.09 | −1.89 (5) | 0.06 |
| ′16, Temp. C 0 m | 24.93 | 2.78 | 1.14 | |||||||
| ′16, Temp. A 3, 5 m | 23.01 | 1.82 | 0.53 | 0.51 | 0.42 | 0.12 | 0.29 | - | 4.20 (11) | 0.00 |
| ′16, Temp. C 3, 5 m | 22.50 | 1.81 | 0.52 | |||||||
| ′17, Temp. A 0, 1 m | 27.50 | 1.09 | 0.54 | −1.28 | 1.48 | 0.74 | - | -0.07 | −1.73 (3) | 0.09 |
| ′17, Temp. C 0, 1 m | 28.78 | 1.35 | 0.68 | |||||||
| ′17, Temp. A 3, 5 m | 24.28 | 0.51 | 0.25 | 0.70 | 1.17 | 0.58 | −0.26 | - | 1.20 (3) | 0.16 |
| ′17, Temp. C 3, 5 m | 23.58 | 1.32 | 0.66 | |||||||
| ′16, DO, A | 9.36 | 1.78 | 0.42 | 0.36 | 0.42 | 0.10 | 0.15 | 0.56 | 3.60 (17) | 0.00 |
| ′16, DO, C | 9.00 | 1.93 | 0.45 | |||||||
| ′17, DO, A | 7.64 | 6.36 | 2.25 | −0.325 | 1.05 | 0.37 | −1.20 | 0.55 | −0.87 (7) | 0.41 |
| ′17, DO, C | 7.96 | 6.32 | 2.23 | |||||||
Publisher’s Note: MDPI stays neutral with regard to jurisdictional claims in published maps and institutional affiliations. |
© 2022 by the authors. Licensee MDPI, Basel, Switzerland. This article is an open access article distributed under the terms and conditions of the Creative Commons Attribution (CC BY) license (https://creativecommons.org/licenses/by/4.0/).
Share and Cite
MDPI and ACS Style
Lee, B.; Kang, H.; Oh, H.-c.; Ahn, J.; Yun, S.-L.; Kim, S. Destratification of a Eutrophic Reservoir in South Korea Using a Novel Convectional Water Circulation System (CWCS). Water 2022, 14, 1282. https://doi.org/10.3390/w14081282
AMA Style
Lee B, Kang H, Oh H-c, Ahn J, Yun S-L, Kim S. Destratification of a Eutrophic Reservoir in South Korea Using a Novel Convectional Water Circulation System (CWCS). Water. 2022; 14(8):1282. https://doi.org/10.3390/w14081282
Chicago/Turabian StyleLee, Bokjin, Heejun Kang, Hye-cheol Oh, Jaehwan Ahn, Sang-Leen Yun, and Seogku Kim. 2022. "Destratification of a Eutrophic Reservoir in South Korea Using a Novel Convectional Water Circulation System (CWCS)" Water 14, no. 8: 1282. https://doi.org/10.3390/w14081282
Note that from the first issue of 2016, this journal uses article numbers instead of page numbers. See further details here.