Article

Tributary Loadings and Their Impacts on Water Quality of Lake Xingyun, a Plateau Lake in Southwest China

1
Institute for Ecological Research and Pollution Control of Plateau Lakes, School of Ecology and Environmental Science, Yunnan University, Kunming 650504, China
2
Research Institute for Plateau Lakes, Dianchi Management Bureau, Kunming 650504, China
3
Environmental Research Institute, The University of Waikato, Hamilton 3240, New Zealand
4
Waikato Institute of Technology, Hamilton 3204, New Zealand
5
Yuxi Environmental Research Institute, Yuxi 653100, China
6
Financial Department, Hunan University of Humanities, Science and Technology, Loudi 417000, China
7
Nanjing Institute of Geography and Limnology, Chinese Academy of Sciences, Nanjing 210008, China
*
Authors to whom correspondence should be addressed.
Water 2022, 14(8), 1281; https://doi.org/10.3390/w14081281
Submission received: 23 February 2022 / Revised: 29 March 2022 / Accepted: 11 April 2022 / Published: 15 April 2022
(This article belongs to the Special Issue Plateau Lake Water Quality and Eutrophication: Status and Challenges)

Abstract

:
Lake Xingyun is a hypertrophic shallow lake on the Yunnan Plateau of China. Its water quality (WQ) has degraded severely during the past three decades with catchment development. To better understand the external nutrient loading impacts on WQ, we measured nutrient concentrations in the main tributaries during January 2010–April 2018 and modelled the monthly volume of all the tributaries for the same period. The results show annual inputs of total nitrogen (TN) had higher variability than total phosphorus (TP). The multi-year average load was 183.8 t/year for TN and 23.3 t/year for TP during 2010–2017. The average TN and TP loads for 2010–2017 were 36.6% higher and 63.8% lower, respectively, compared with observations in 1999. The seasonal patterns of TN and TP external loading showed some similarity, with the highest loading during the wet season and the lowest during the dry season. Loads in spring, summer, autumn, winter, and the wet season (May–October) accounted for 14.2%, 48.8%, 30.3%, 6.7%, and 84.9% of the annual TN load and 14.1%, 49.8%, 28.1%, 8%, and 84.0% of the annual TP load during 2010–2017. In-lake TN and TP concentrations followed a pattern similar to the external loading. The poor correlation between in-lake nutrient concentrations and tributary nutrient inputs at monthly and annual time scales suggests both external loading and internal loading were contributing to the lake eutrophication. Although effective lake restoration will require reducing nutrient losses from catchment agriculture, there may be a need to address a reduction of internal loads through sediment dredging or capping, geochemical engineering, or other effective measures. In addition, the method of producing monthly tributary inflows based on rainfall data in this paper might be useful for estimating runoff at other lakes.

1. Introduction

Eutrophication refers to the enrichment of aquatic systems by nutrients, usually nitrogen (N) and phosphorus (P) [1]. Both N and P are required to support aquatic plant growth and are the key limiting nutrients in most aquatic ecosystems [1]. Eutrophication is an economic, recreational, and aesthetic problem that affects many lakes worldwide [2], resulting in high primary productivity, impaired WQ, and often leading to harmful algal blooms (HABs) [1,3,4]. Lake eutrophication is mainly caused by anthropogenic processes through industrial sewage discharge, agricultural farming, air deposition, and soil erosion [5,6] as well as internal nutrient releases [7] or sediment resuspension in shallow waterbodies [8,9,10,11,12]. These processes may be further exacerbated by climate change, which is predicted to result in more rainstorms that increase the frequency and strength of stormwater inflows and nutrient inputs through surface water runoff [13,14].
The nutrient sources and processes leading to freshwater eutrophication have been well described [10,11,12,15,16]. Excessive nutrient inputs lead to the degradation of ecological function, which was reported in large lakes, e.g., Victoria [17,18], Peipsi [19], Taihu [20], Winnipeg [21], and Erie [22], as well as small ponds [23]. The nutrients entering lake water through tributaries could sink to the bottom and readily enter the trophogenic zone of shallow lakes through sediment resuspension and the periodic anoxia conditions promoted by calm, warm weather [24]. Due to the longevity of internal loading, eutrophic shallow lakes have more difficulty decreasing algal biomass and increasing transparency than deep water bodies [24], which maintain seasonal plaguey HABs in shallow lakes (e.g., Lake Taihu [25]).
The Yunnan Plateau (YP) is located in Southwestern China, with a subtropical–temperate climate [26] and distinct wet and dry seasons. The YP receives an annual precipitation of 916 mm distributed as 133, 522, 219, and 42 mm through spring, summer, autumn, and winter, respectively [27]. There are nine great plateau lakes (NGPLs) with water surface areas > 30 km2 distributed through the northwest and middle of the YP. The NGPLs are tectonic in origin, formed from crustal movement from the Pliocene to Holocene periods [28,29]. Most of the NGPLs have experienced considerable WQ deterioration in recent decades. Lake Xingyun is one of the NGPLs and is located at the center of the YP at an elevation of 1740 m a.s.l. (Figure 1). More than 2 million people work in the local vegetable farming industry, creating potential point and non-point nutrient sources to waterways and drawing water from the lake for irrigation. The primary water sources for Lake Xingyun are riverine inputs and precipitation, mainly during the wet season. HABs were documented in the lake as early as August 1957 [30]. The lake eutrophication reportedly accelerated from 2002 to 2012 [31], and now it is hypertrophic, with an average TP of 0.36 mg/L, TN of 1.0 mg/L, and chlorophyll a (Chl-a) of 82.4 µg/L in 2017, although the local government has initiated many lake restoration projects since 2000, including riverine nutrient input reductions through sewage treatment plant construction, sewage water deposition in settling ponds before direct discharge into the lake, sediment dredging, water hyacinth planting and harvest, algae collection for treatment, fishery regulations, water flushing, and wetland construction [32,33].
The paleolimnology of Lake Xingyun has been a topic of several recent studies, with reports that include the soil erosion history caused by human activities [34], sediment organic content [35], and environmental change in relation to local human activities [36]. There have been also many papers documenting algae [37], microcystins [38], biological responses and WQ [38], and air deposition [39,40], but due in part to a lack of tributary discharge measurements, there has been only one paper addressing external loading as early as 1999 [41]. In this paper, our objective was to calculate the tributary nutrients entering the lake from 2010 to 2017 based on the WQ measurements and modelled inflows of the 12 main tributaries at monthly and annual time scales and to understand the external load variation from the 1990s to 2017. The calculated tributary nutrient loads for 2010–2017 represent a key reference for future lake environmental management, and the methodology described here should be applicable for other NGPLs.

2. Materials and Methods
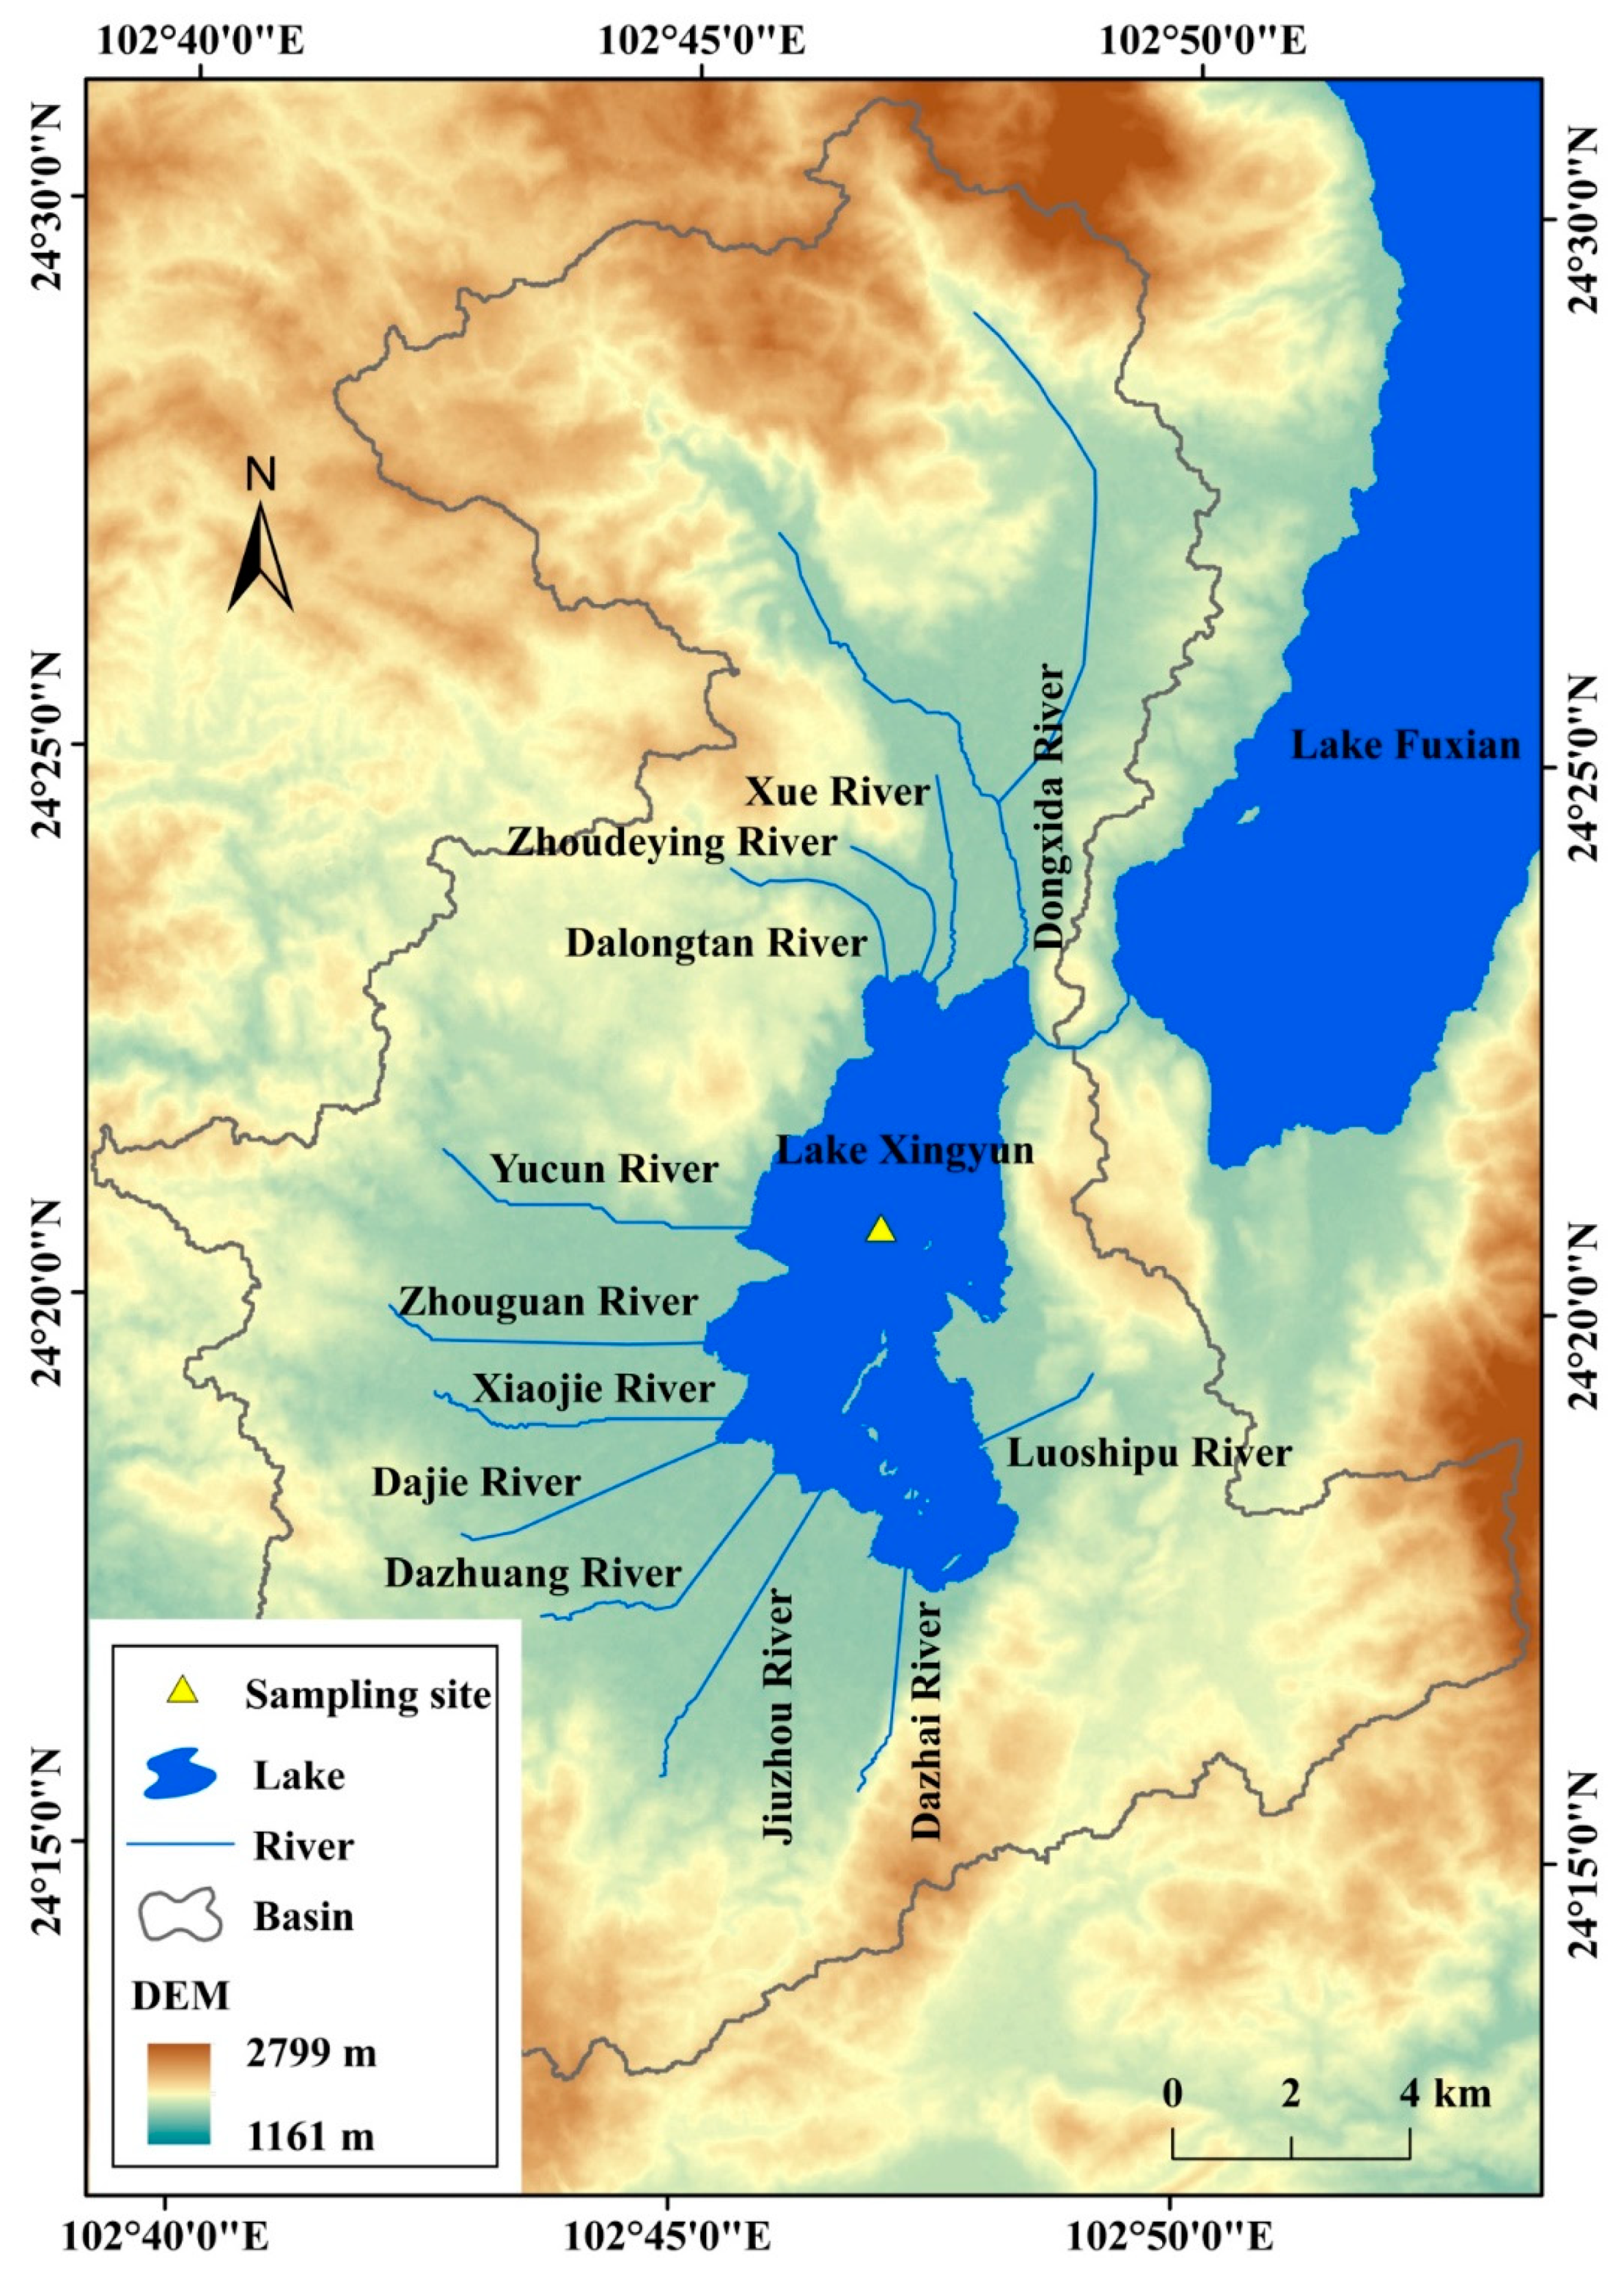
2.1. Study Site

Lake Xingyun is a shallow lake with a water volume of 2.1 × 10⁸ m3, and catchment area of 325 km2. The average depth is 7.0 m, with a maximum depth of 10.8 m and a water surface area of 34.7 km2 (Figure 1) [42]. There are 12 main shallow tributaries, including four rivers to the north (Figure 1, river numbers 1 to 4), two to the west (river numbers 5 to 6), four to the southwest (river numbers 7 to 10), one to the south (river number 11), and one river to the southeast (river number 12). All these sub-catchment proportions of water input, TP input, and TN input of total tributary inputs in 1999 are based on the only existing measurements of inflow volume (Table 1, [41]) and their proportions of paddy land, dry land, and the population of the catchment in 2015 [43]. So, the water and nutrients were mostly from the north (river numbers 1–4), southwest (river numbers 7–10), and east (river number 12) in 1999.
These rivers reportedly carried 41.0% of total water input, including surface and subsurface water inputs and rainfall, 34.3% of TP input, and 56.7% of TN input through surface water, subsurface water, dry deposition, and wet deposition to the lake in 1999 [41]. Before 2007, Lake Xingyun flowed to Lake Fuxian through the Ge River in the north, with an average water volume of 4.3644 × 10⁷ m3/year due to the 1 m higher elevation of the water surface of Lake Xingyun compared to Lake Fuxian, carrying significant nutrients to the other lake. To protect Lake Fuxian, the polluted water in Lake Xingyun has been diverted to the Jiuxi Wetland through a channel to the Dongfeng Reservoir for agricultural and industrial uses since May 2008. The water level at Lake Xingyun was then mainly regulated by the diversion channel for many years, but the diversion engineering is no longer working to guarantee water use for vegetable farming at the lake catchment.
The lake has experienced dramatic macrophyte degradation and significant phytoplankton biomass increase since the 1980s. The macrophyte coverage area percentage of the whole lake area was 22% in 1984, 2.2% in 2000, and 1.8% in 2008. The Chl-a concentration was 6.67 µg/L in 1984, 11.93 µg/L in 1993, and 18.18 µg/L in 1999. It dramatically increased during 2002–2009, with an average of 47.63 µg/L, and maintained this level during 2010–2017, with an average value of 61.16 µg/L [44]. At the lake catchment, the dominant land use types are agricultural land, accounting for 43.3%; forest, accounting for 23.4%; grass land, accounting for 15.4%; and construction land, accounting for 14.7% of the whole catchment area in 2016 [45].

2.2. Data Source

All the monthly WQ data for January 2010–April 2018 used here are from the Yuxi Environmental Monitoring Station (YEMS). In the lake, water samples were collected at surface, middle, and bottom layers of the sampling site (Figure 1) and were mixed for laboratory analysis at the middle of every month. For the 12 shallow tributaries, water samples were collected at the estuary. All the water samples were analyzed according to the standard methods issued by Ministry of Ecology and Environment of the People’s Republic of China (MEEC) [46]. TN and TP were analyzed using combined persulphate digestion and spectrophotometry. The transparency was measured with a 20 cm diameter Secchi disc (SD) in situ. The Chl-a was determined spectrophotometrically after acetone (90%) extraction. The COD were analyzed by potassium permanganate oxidation methods (CODMn) with un-filtrated samples.

2.3. Reconstruction of Monthly Inflow Volumes

There have been very few inflow volume measurements recorded for Lake Xingyun. The only observations were conducted by YEMS in 1999 and reported by Wang [41]. The inflow volume at the main 12 tributaries was measured 3 times during January to April, 12 times during May to September, and 3 times from October to Decemberin 1999.
Mei [47] reported there was a good linear relationship between rainfall and inflow volume or runoff with a 24 h lag after the rainfall at three stations of the Lake Taihu catchment. This linear characteristic was also found in Xinjiang Province (correlation coefficient > 0.7) by Zhao [48], the Fujiang River of Sichuan Province at an annual time scale by Wang et al. [49], and the Jinghe River Basin [50]. Due to the extreme lack of inflow measurements at the 12 tributaries of Lake Xingyun, we hypothesize that there was also a linear relationship between the total inflow volume of the 12 tributaries and the precipitation at both monthly and annual time scales. We then calculated monthly inflow volumes for the 12 tributaries as follows:
(1)
The ratio of inflow volume for each tributary to the total inflow volume in 1999:
R i = V o l i / T I V 1999
where Voli represents the inflow volume for the ith (i = 1, 2, 3, …, 12) tributary from January to December in 1999, TIV1999 represents the total inflow volume of the 12 main tributaries in 1999, and Ri is the ratio of volume of the ith tributary in 1999 relative to TIV1999.
(2)
The annual total inflow volume estimation for 2010–2018:
T I V j = T I V 1999 × ( R a i n j / R a i n 1999 )
where TIVj represents the total inflow volume of the 12 tributaries for Lake Xingyun in the jth year from 2010 to 2018 (a period when the river WQ was measured). TIV1999 represents the total inflow volume of the 12 tributaries in 1999. Rain1999 and Rainj are the total annual rainfall in 1999 and in the jth year from 2010 to 2018, respectively.
(3)
The annual total inflow volume for each tributary:
T I V i j = T I V j × R i
where TIVij represents the total inflow volume for the ith (i = 1, 2, 3, …, 12) tributary in the jth (j = 2010, 2011, 2012… 2018) year.
(4)
The monthly total inflow volume for every tributary:
T I V i j n = T I V i j × ( R a i n j n / R a i n j )
where TIVijn represents the total inflow volume for the ith tributary (i = 1, 2, 3, …, 12) in the nth month (n = 1, 2, 3, …, 12) of the jth year from 2010 to 2018. Rainjn and Rainj are the total rainfall in the nth month of the jth year and the total rainfall in the jth year.

2.4. Annual and Monthly Nutrient Loads for All the Tributaries

With the reconstructed monthly volume TIVijn for 2010 to 2018, the monthly nutrient load for each tributary was then calculated as:
E l o a d i j n = T I V i j n × C i j n
where Eloadijn represents the external nutrient load as either TN or TP (tons/month, abbreviated to t/mon) for the ith (i = 1, 2, 3, …, 12) tributary in the nth (n = 1, 2, 3, …, 12) month of the jth (j = 2010, 2011, 2012, …, 2018) year from 2010 to 2018. Cijn is the measured nutrient (TN or TP) concentration at the ith (i = 1, 2, 3, …, 12) tributary estuary in the nth (n = 1, 2, 3, …, 12) month of the jth (j = 2010, 2011, 2012, …, 2018) year. The measurements in 2018 were only conducted during January to April, so these measurements were not included in the calculation of total annual external load.

2.5. Comprehensive Trophic Level Index (TLI)

The trophic state index (TSI) was developed by Carlson [51], reflecting lake trophic status. It was modified to the TLI by Wang et al. [52] and adapted to Chinese lakes. The aggregated TLI is calculated as the sum of individual TLIs, which are calculated as
T L I c h l a = 10 ( 2.5 + 1.086 × l n C h l a )
T L I T P = 10 ( 9.436 + 1.624 × l n T P )
T L I T N = 10 ( 5.453 + 1.694 × l n T N )
T L I S D T = 10 ( 5.118 1.94 × l n S D T )
T L I C O D = 10 ( 0.109 + 2.661 × l n C O D )
where the left side in the above equations is the sub-TLI for each parameter and the aggregated value is
T L I = j = 1 m W j · T L I j
where TLI represents the aggregated trophic level index for Lake Xingyun and Wj represents the weighting factor for the jth WQ parameter, including Chl-a, TN, TP, Secchi disk transparency (SDT), and chemical oxygen demand (COD) (j = 1, 2, 3, 4, 5). The weighting factor values are 0.2663 for Chl-a, 0.1879 for TN, 0.179 for TP, 0.1834 for SDT, and 0.1834 for COD based on investigations from 26 Chinese lakes by [53]. The TLI calculations were conducted by YEMS based on Equations (6)–(11). The TLI ranges and corresponding trophic status are shown in Table 2.

2.6. Long-Term Lake WQ Data

To compare lake WQ after 2010 with that during 2000 to 2009 and before 2000, the lake WQ data before 2009 were retrieved from [54,55,56]. There were no TN and TP data for 1983–1987, no Chl-a data for 1983, 1985–1992, 1994–1998, and 2000–2001, and no TLI values for 1982–1995.

3. Results

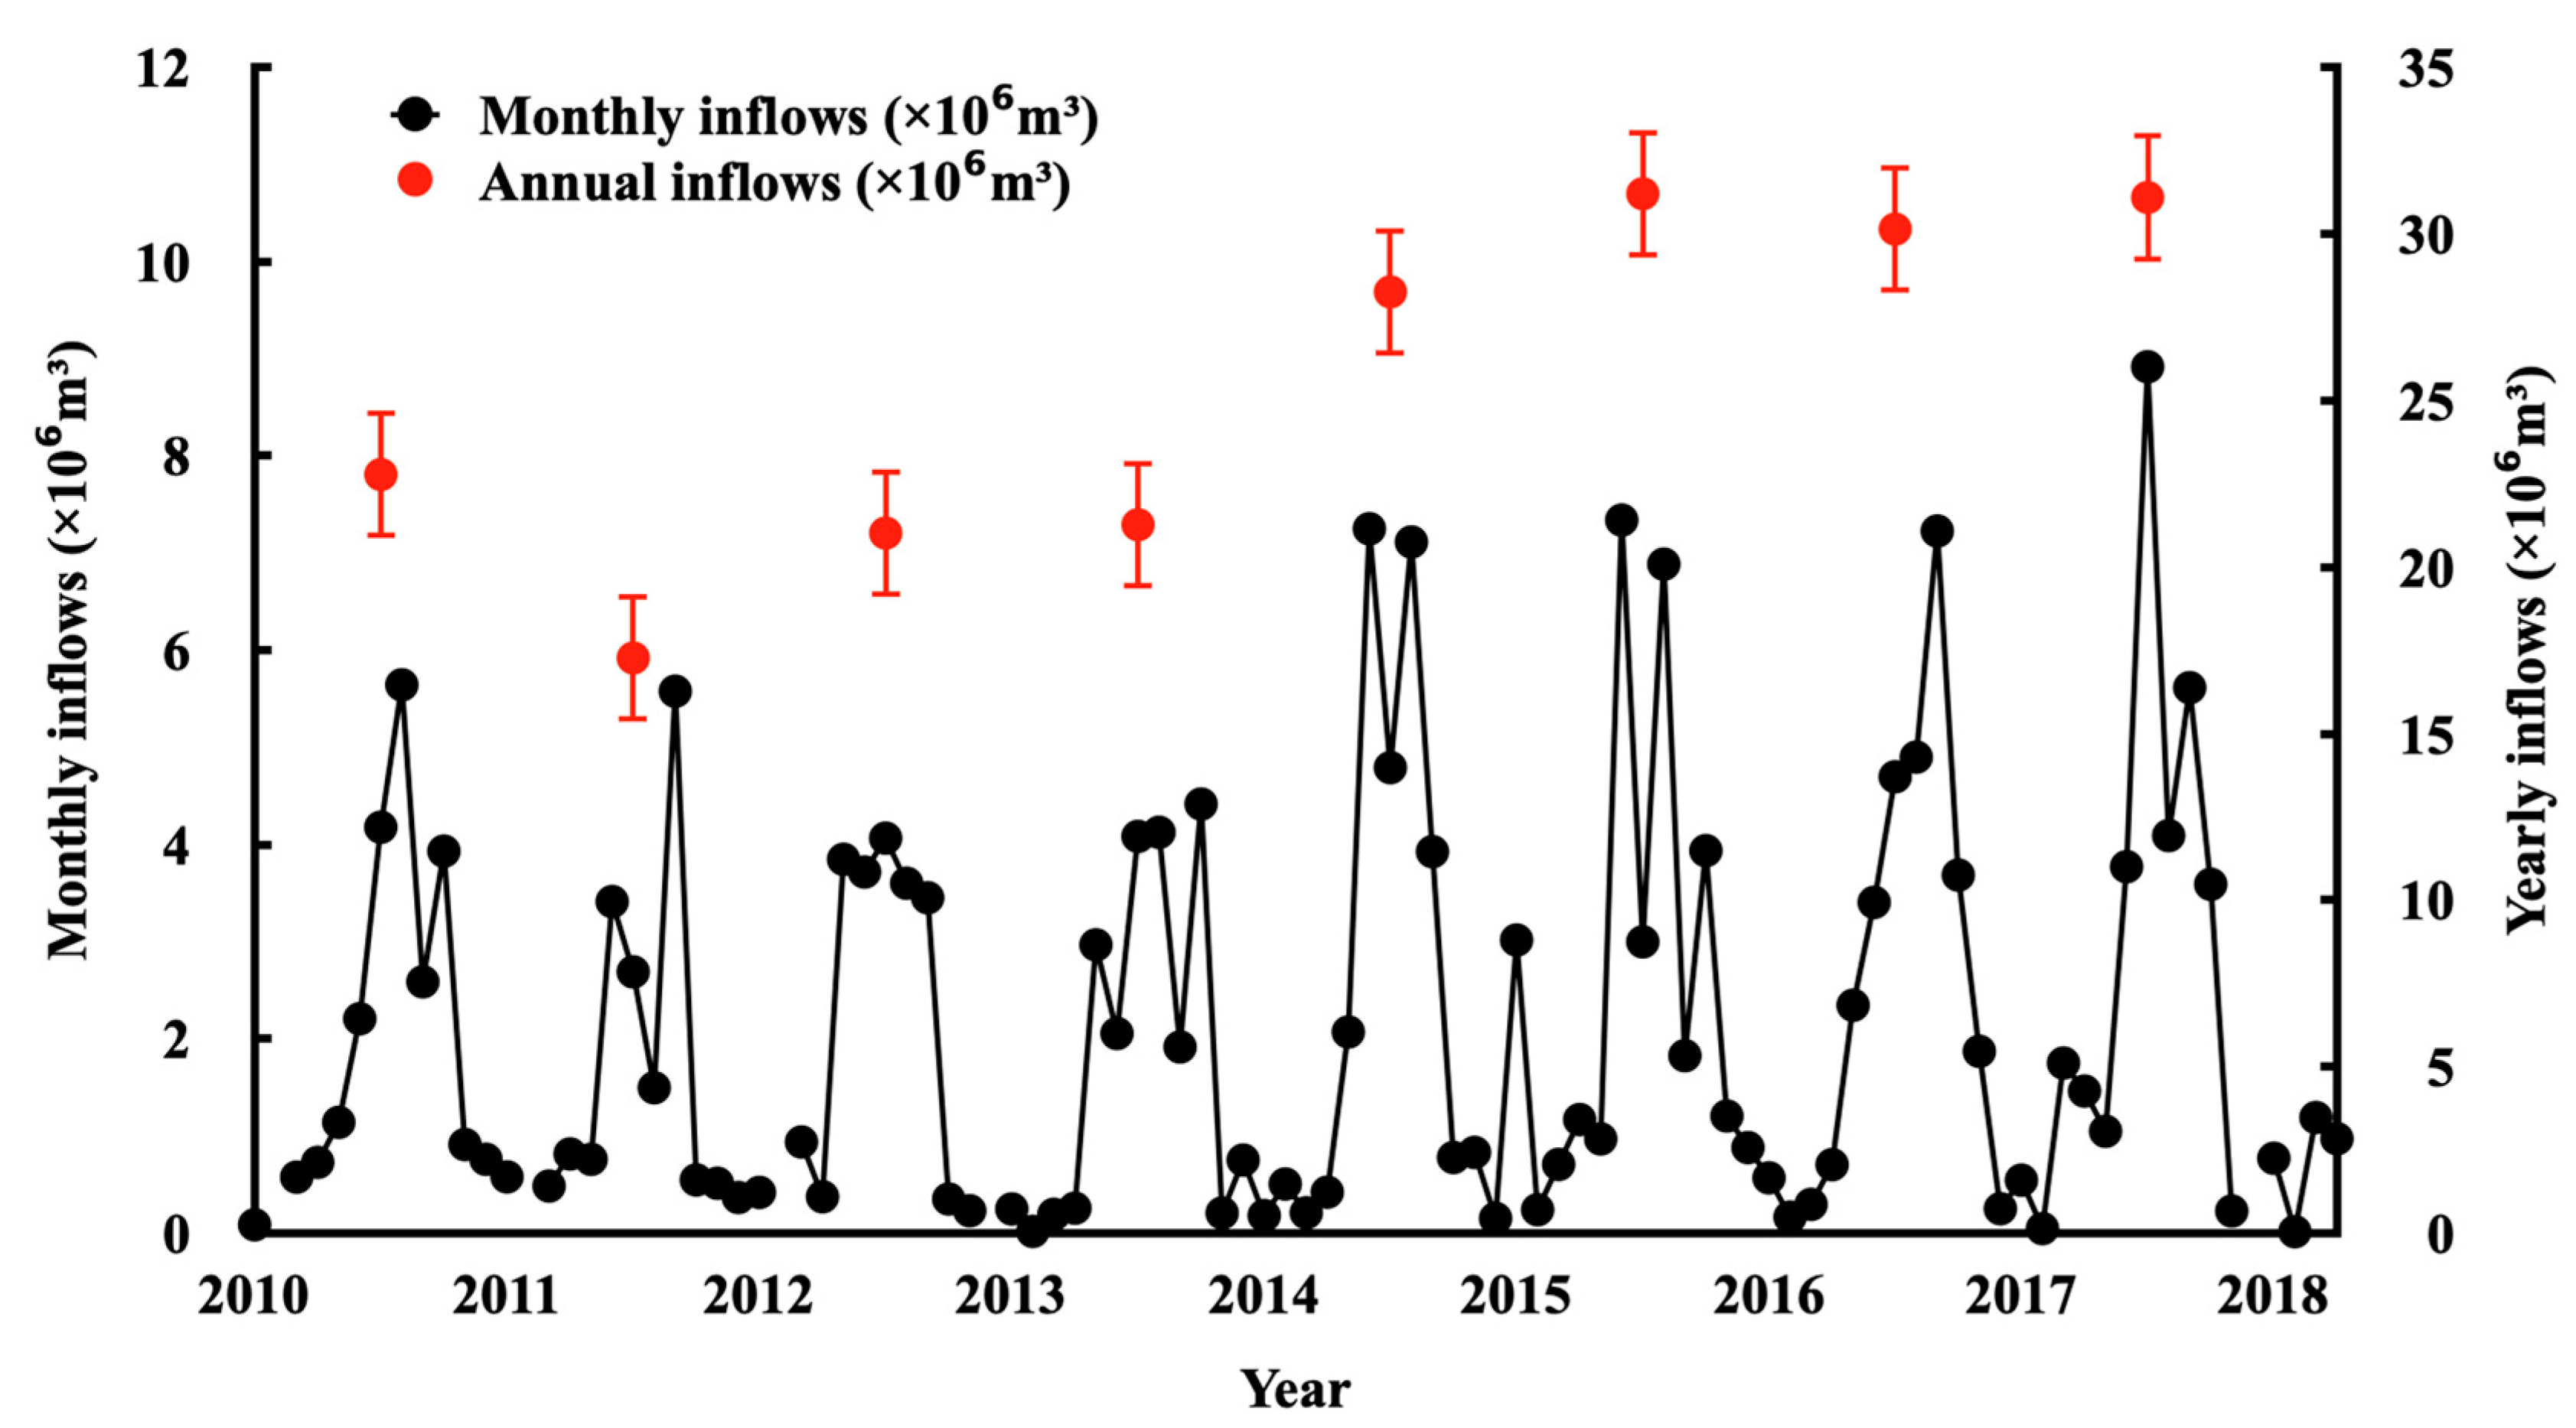
3.1. Total Monthly and Yearly Inflows

The constructed yearly inflows for 2010–2017 and monthly inflows from January 2010 to April 2018 are shown in the Figure 2. It is obvious that the monthly inflows in the wet season (May–October) were much higher than those in the dry season (November–April), which is consistent with the rainfall distribution pattern through the year as well as the measurements in 1999 by Wang [41]. The highest monthly inflow was in Jul 2017, with a value of 8.918 × 10⁶ m3, while the lowest value was 0.018 × 10⁶ m3 in February 2018, i.e., the maximum monthly inflow was 495 times the minimum value. The annual inflow decreased from 2010 to 2011 but increased progressively from 2011 to 2017. The lowest annual inflow was 17.269 × 10⁶ m3 in 2011 and the highest was 31.09 × 10⁶ m3 in 2017, which is smaller than the annual inflow (37.995 × 10⁶ m3) measured in 1999 [41]. The estimated mean annual water inflow for 2010–2017 was 2.54 × 10⁷ m3, which is very close to the value (2.4 × 10⁷ m3) reported by Gao et al. [57], suggesting that the calculated inflows based on Equations (1)–(4) are reliable.

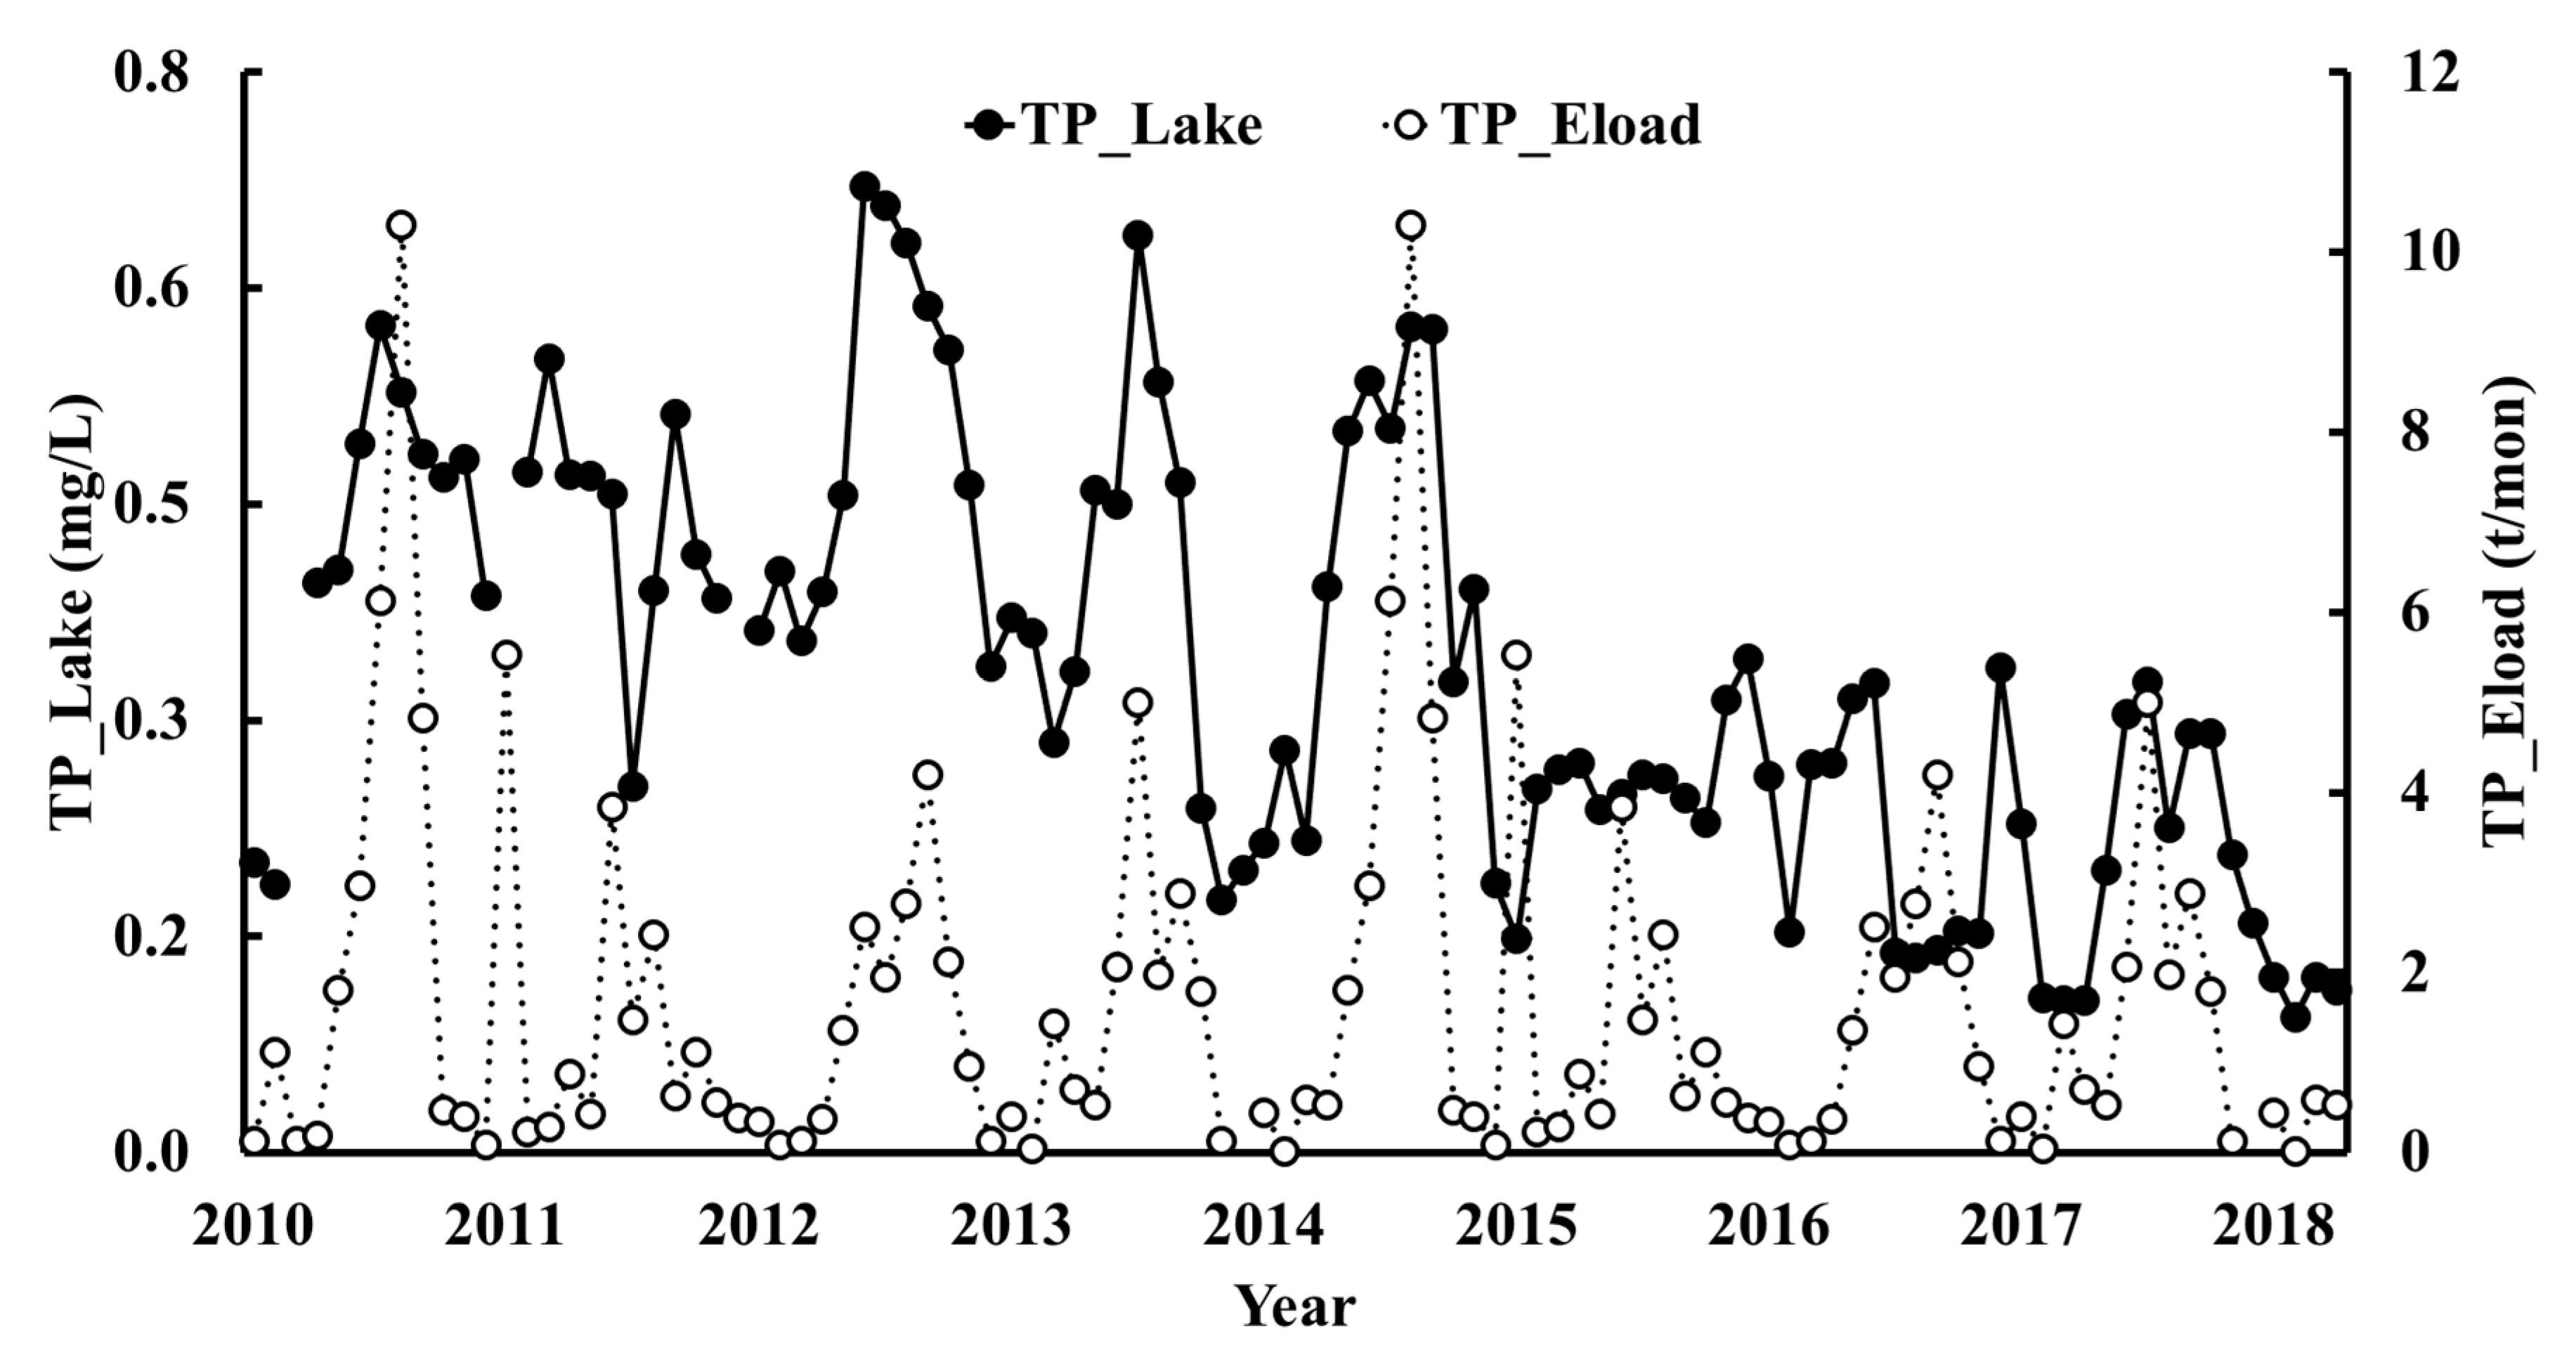
3.2. Monthly TN and TP Loads for 2010–2018

With the constructed inflow volumes and Equation (5), the monthly TN and TP loads from the 12 tributaries were calculated from January 2010 to April 2018. The monthly TN loads (TN_Eload, t/mon) and the lake TN concentrations (TN_Lake, mg/L) are shown in Figure 3. The corresponding monthly TP loads (TP_Eload, t/mon) and the lake TP concentrations (TP_Lake, mg/L) data are shown in Figure 4. The average values of TN_Lake, TP_Lake, TN_Eload, and TP_Eload were 1.87 mg/L, 0.36 mg/L, 15.8 t/mon, and 1.65 t/mon for Jan 2010–April 2018. The standard deviations (SD) for the time series of TN_Lake (SD_TN_Lake), TP_Lake (SD_TP_Lake), TN_Eload (SD_TN_Eload), and TP_Eload (SD_TP_Eload) were 0.58 mg/L, 0.16 mg/L, 17.86 t/mon, and 1.97 t/mon, respectively, demonstrating wide variations in the loads relative to the averages compared with comparable values for lake nutrient concentrations. There were obvious seasonal variations of TN_Lake, TP_Lake, TN_Eload, and TP_Eload, with peak values in summer and trough values in winter, suggesting that the rainfall in summer brought the lake abundant nutrients.
The Pearson correlation coefficient (r) between the two time series of lake TN and TN loads was 0.07 (n = 92). The maximum TN_Lake occurred in September 2010, with a value of 5.21 mg/L, and the minimum TN_Lake occurred in November 2017, with a value of 0.92 mg/L, while the TN_Eload in these two months was 17.9 t and 3.3 t. The maximum TN_Eload was 97.9 t/mon in Jul 2017, and the minimum TN_Eload was 0.15 t/mon in February 2018. The maximum values for both TN_Lake (September 2010) and TN_Eload (Jul 2017) were in the wet season, and the minimum values of TN_Lake (November 2017) and TN_Eload (February 2018) were both in the dry season.
The r value between the two time series of lake TP and TP loads was 0.39 (n = 95), which was greater than r between TP_Eload and TP_Lake. The maximum TP_Lake concentration was 0.72 mg/L in June 2012, and the minimum value was 0.10 mg/L in February 2018, while the maximum TP_Eload was 10.3 t/mon in both August 2010 and August 2014, and the minimum TP_Eload was 0.0094 t/mon in both February 2014 and February 2018. Similar to TN, both the maximum TP_Eload (August 2010 and August 2014) and the maximum TP_Lake (June 2012) were observed in the wet season, and both the minimum TP_Eload (February 2014 and February 2018) and the minimum TP_Lake (February 2018) were observed in the dry season.

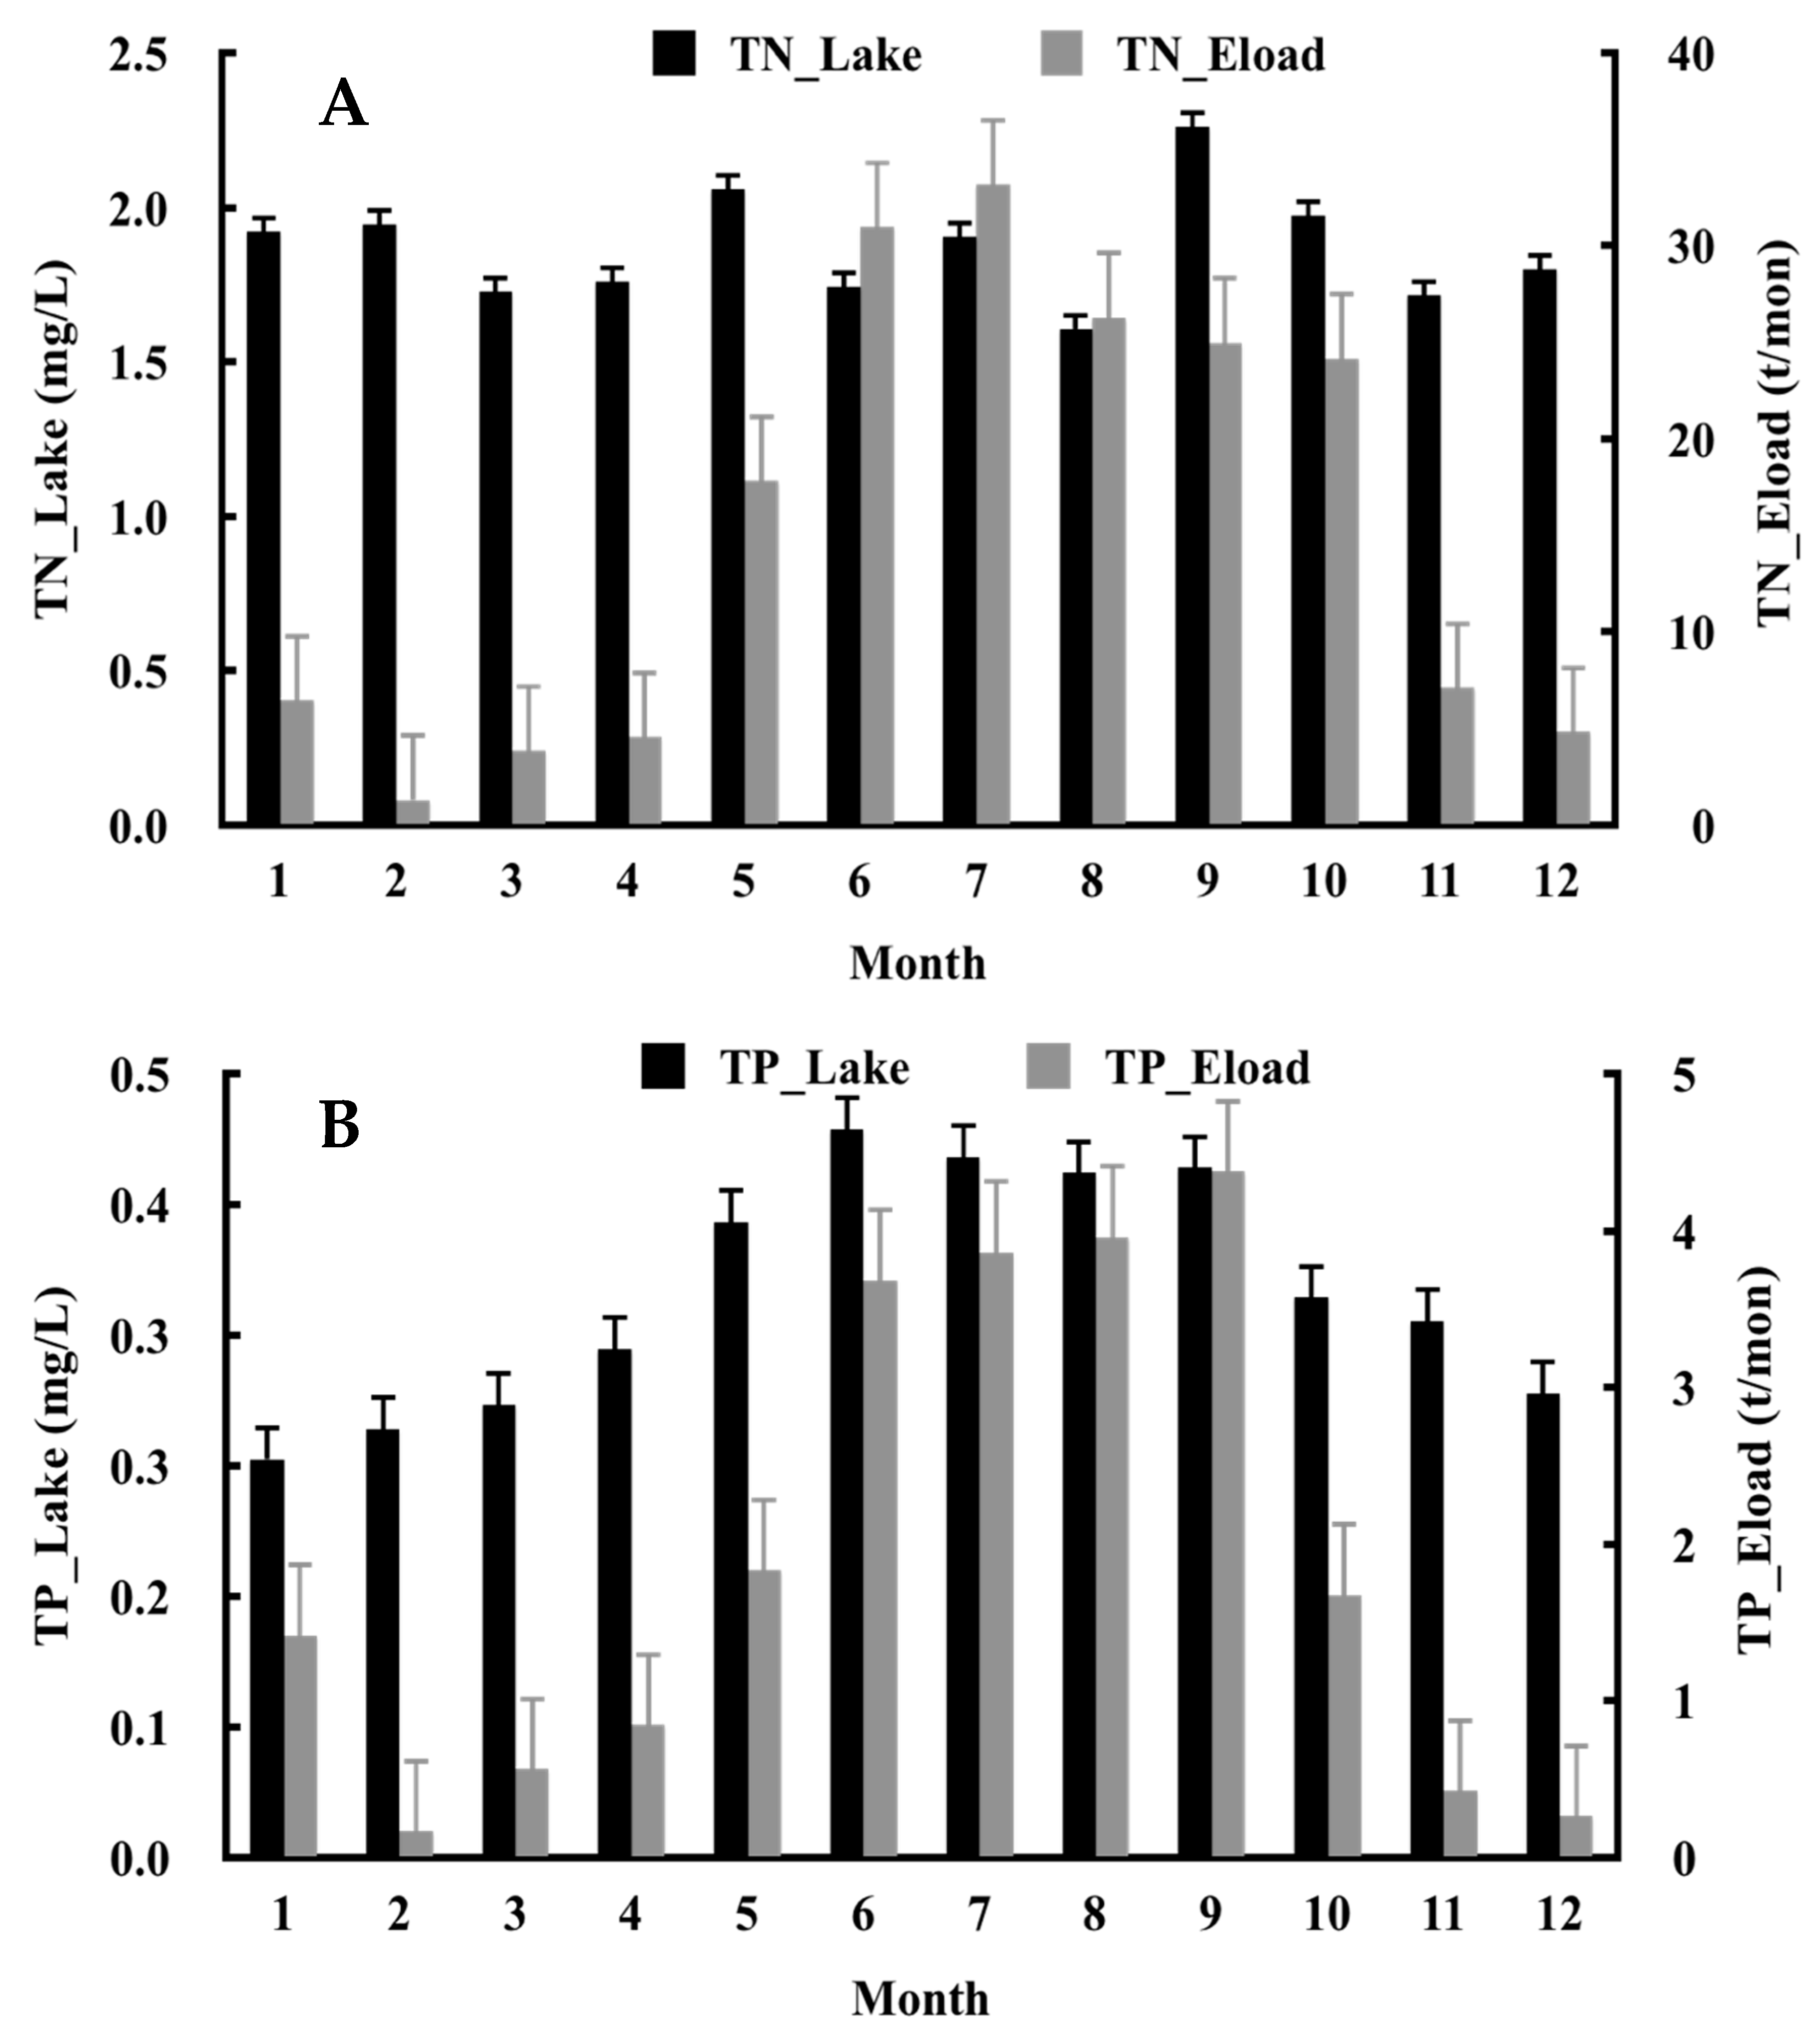
3.3. Seasonality of TN and TP Loading

The lake TN and TP concentrations and external loads for the 12 months (January–December) of each year are plotted in Figure 5. The average TN (Figure 5A) and TP (Figure 5B) concentrations in the wet season were 1.93 mg/L and 0.43 mg/L, respectively, and 1.81 mg/L and 0.3 mg/L in the dry season. Both the TN and TP concentrations were slightly greater in the wet season than in the dry season. The average TN load (Figure 5A) and TP load (Figure 5B) in the wet season were 26.3 t/mon and 3.2 t/mon, respectively, and 4.7 t/mon and 0.6 t/mon in the dry season. The highest TN and TP loads were 33.2 t in Jul and 4.4 t in September, respectively, while the highest lake TN and TP concentrations were 2.26 mg/L in September and 0.46 mg/L in June. The lowest monthly TN (1.3 t) and TP loads (0.2 t) were both in February, a month of relatively low rainfall. The lowest lake TN (1.61 mg/L) and TP (0.25 mg/L) concentrations occurred in August and January, respectively. Therefore, in winter and spring (i.e., the dry season), the average external loads and lake nutrient concentrations were lower compared with the wet season.
The calculated total multi-year averaged external loads of TN and TP were 183.8 t/year and 23.3 t/year, respectively, during 2010–2017. The TN loads in spring, summer, autumn, and winter accounted for 14.2%, 48.8%, 30.3%, and 6.7%, respectively, of the total multi-year averaged TN load, and for TP loads the corresponding seasonal values were 14.1%, 49.8%, 28.1%, and 8% of the annual TP load (Table 3). In addition, the average load during the wet season accounted for 84.9% of the total TN load and 84.0% of the total TP load during the study period. The magnitude of the seasonal load was summer > autumn > spring > winter for both TN and TP.

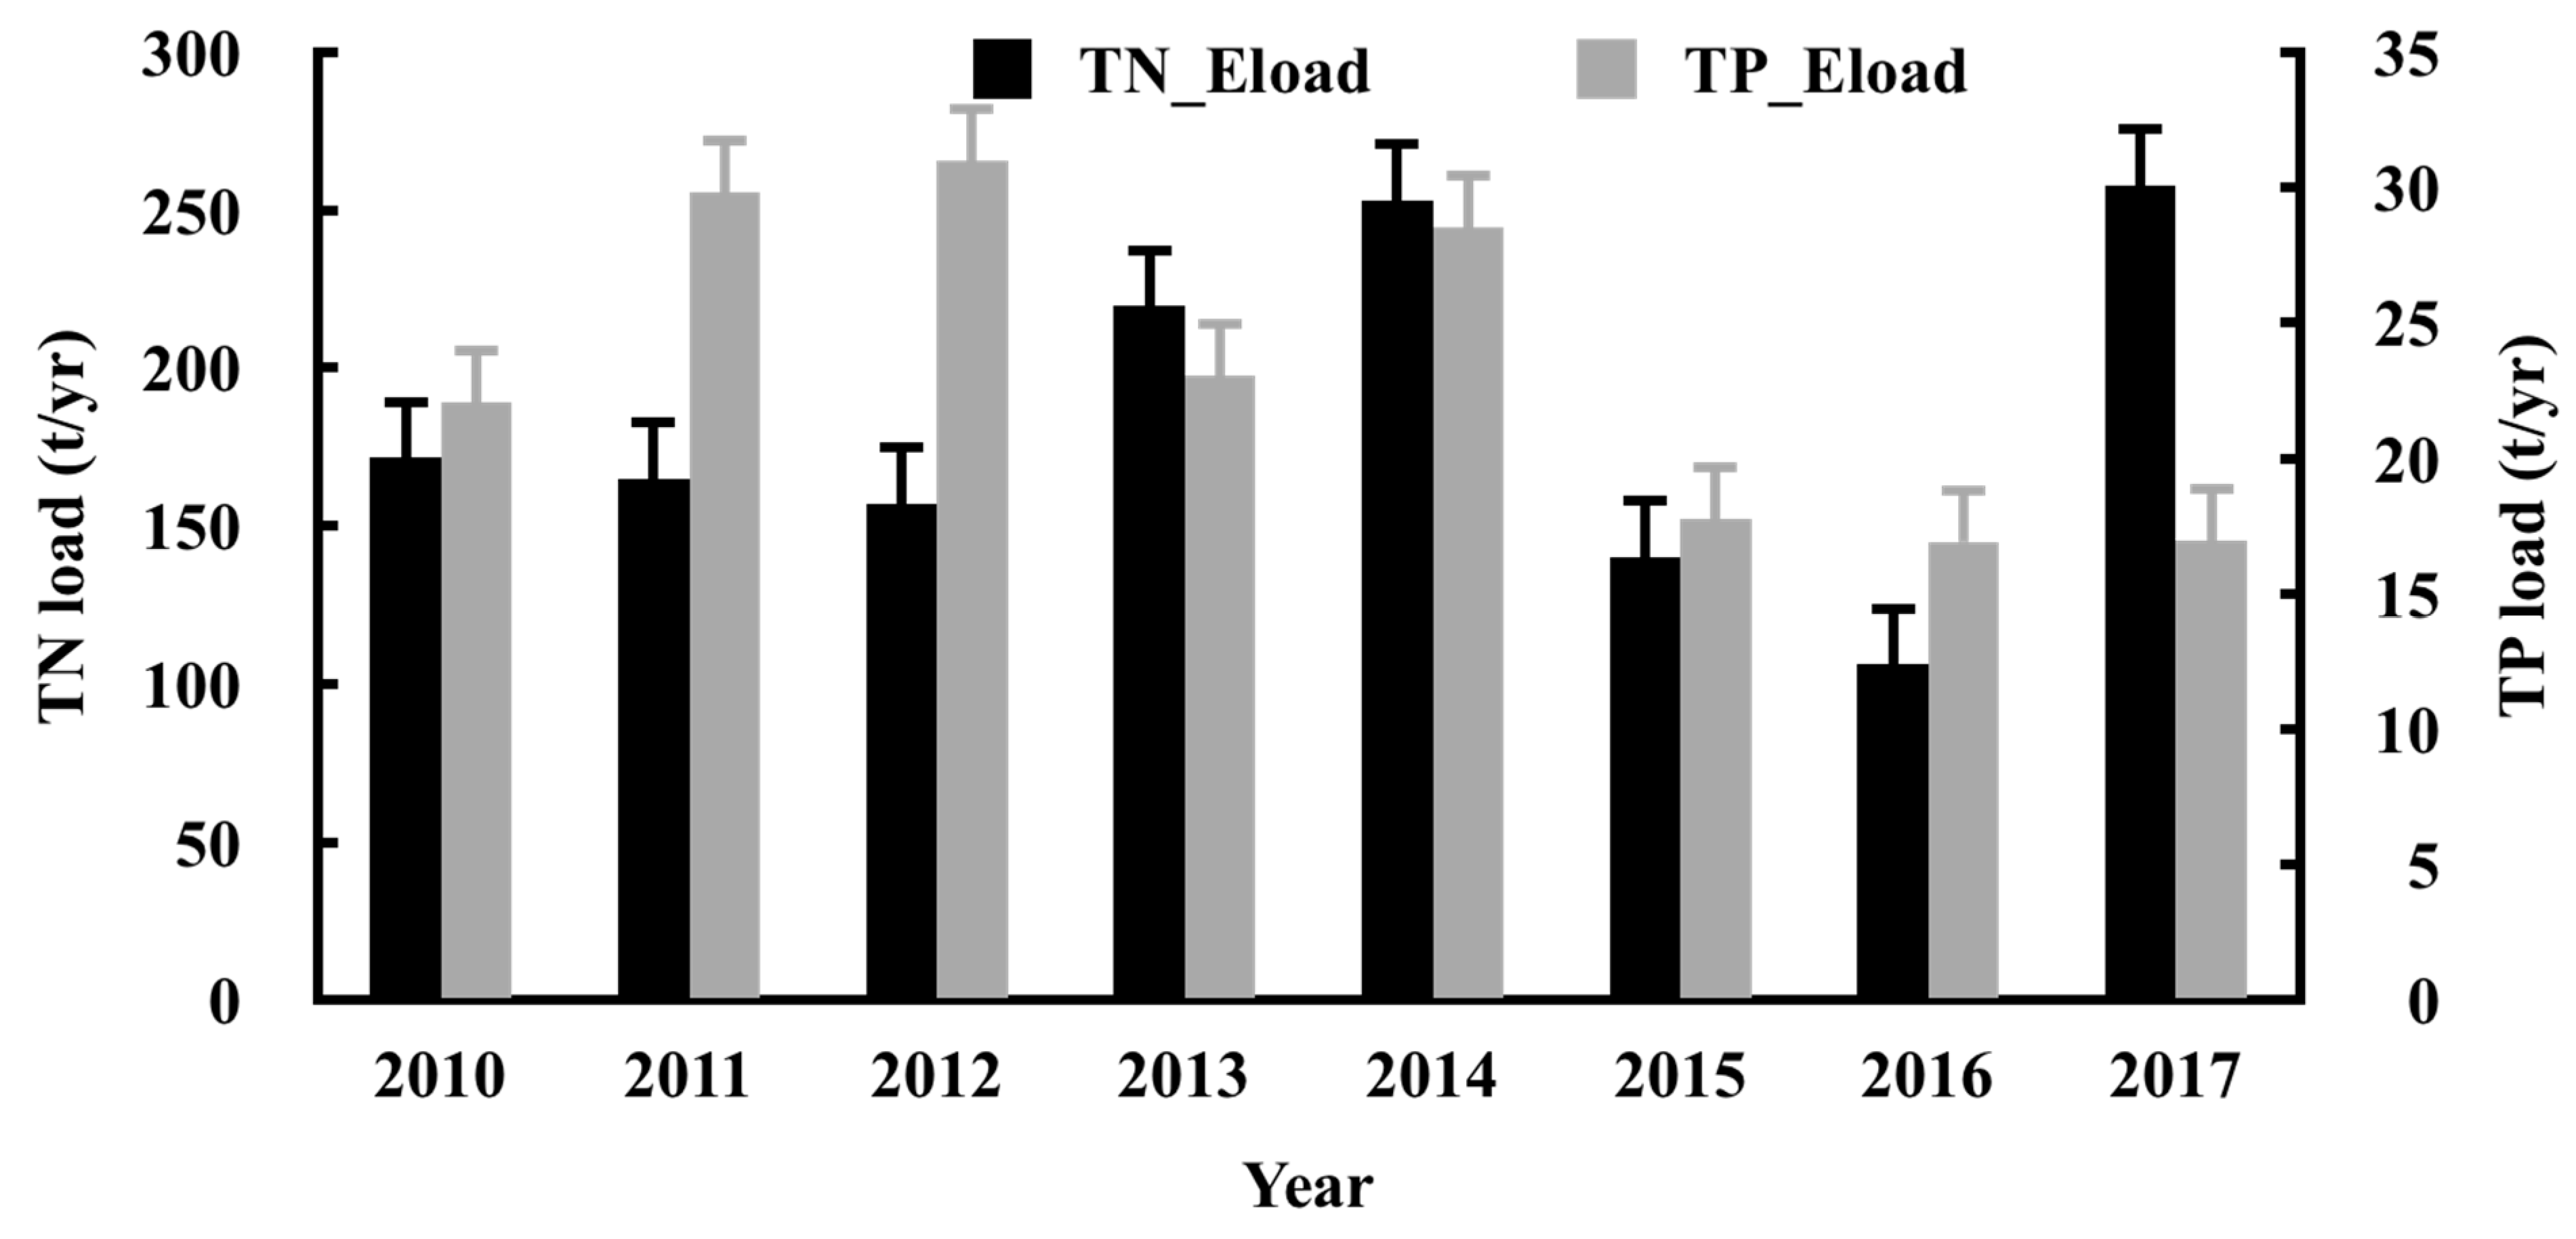
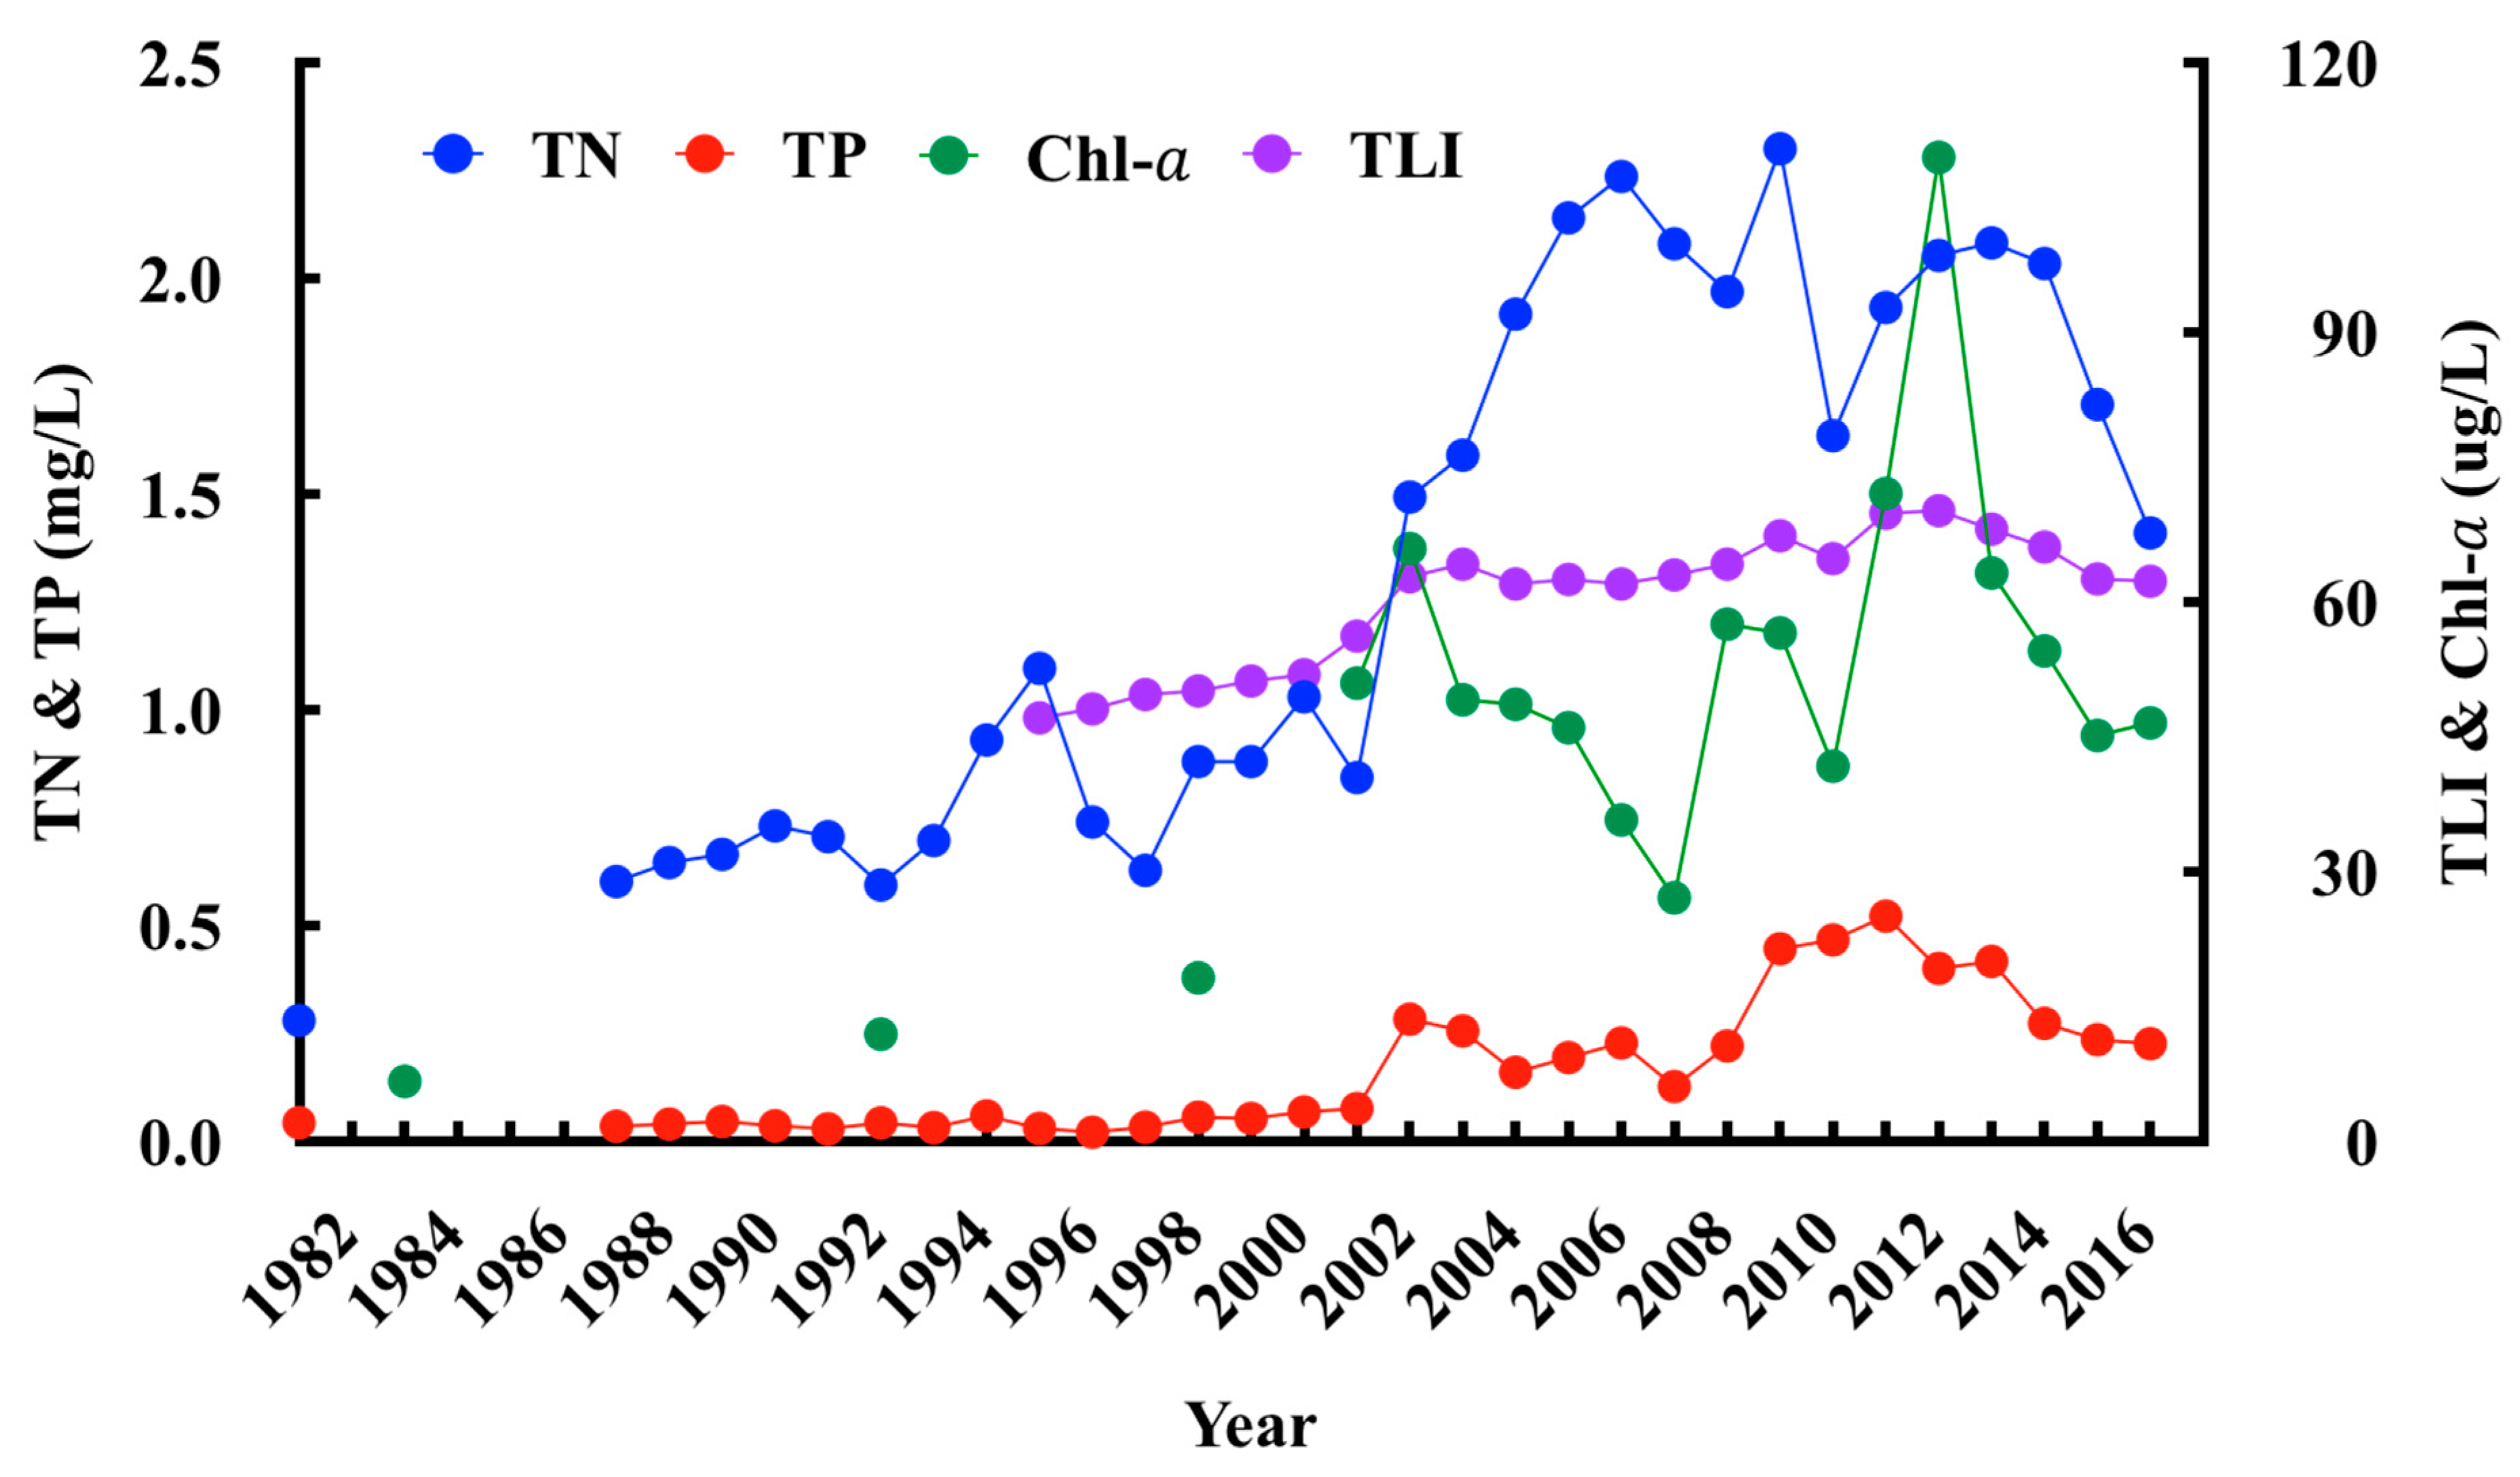
3.4. Annual TN and TP Loads and Long–Term Variations in Lake WQ

The annual external loads of TN (TN_Eload) and TP (TP_Eload) are plotted in Figure 6. The highest and lowest TN_Eloads were 258.0 t/year and 106.1 t/year in 2017 and 2016, and for TP_Eload they were 31.0 t/year and 16.9 t/year in 2012 and 2016, respectively. The lowest external loads for both TP and TN were in 2016. The deviation coefficient (a coefficient with the standard deviation divided by the average value) for TN_Eloads and TP_Eloads were 0.28 and 0.24, respectively, showing TN_Eloads was slightly more variable than TP_Eloads.
The annual variations in TN, TP, Chl-a, and TLI during 1982–2017 are shown in Figure 7. TN and Chl-a showed greater relative interannual variability than TP and TLI. The highest observed TN, TP, Chl-a, and TLI were 2.3 mg/L, 0.52 mg/L, 109.5 µg/L, and 70.1 in 2010, 2012, 2013, and 2013, respectively, and the lowest values were 0.28 mg/L, 0.02 mg/L, 6.67 µg/L, and 47.1 in 1982, 1997, 1984, and 1996, respectively. There was a dramatic increase in TN, TP, Chl-a, and TLI after 2000 compared with the values from 1982 to 1999. The average TN, TP, Chl-a, and TLI for 1982–1999 (period 1), 2000–2009 (period 2), and 2010–2017 (period 3) are shown in Table 4. The average TN was > twice as high in period 2 compared to period 1 and increased again from period 2 (1.62 mg/L) to period 3 (1.89 mg/L). The relative increase in TP from period 1 to period 2 was much more dramatic than TN, and the increase in period 3 was > twice the increase in period 2. Chl-a and TLI increased considerably from period 1 to period 2 and increased again, but to a lesser extent, from period 2 to period 3. During period 3, the annual TN_Eload did not correspond closely with the lake TN concentration, but the highest TP_Eload (in 2012) corresponded with the highest TP_Lake concentration.

4. Discussion

Tributary nutrient loads of N and P are often the dominant driver of lake eutrophication. They increase in-lake concentrations, promote algal growth, and increase nutrient storage in sediments. The resuspension of sediment-associated nutrients in shallow waters or dissolved nutrients enhanced by periods of hypoxia/anoxia in the bottom waters of stratified water bodies can consequentially positively fuel internal nutrient loading and feedback to increase eutrophication. Sakamoto et al. [58] estimated that 25% of the total nitrogen inputs from the catchment of Lake Xingyun were stored in the bottom sediments. Based on an upper layer sediment of thickness of 27.7 cm, the sediment P storage was estimated to be 6967 t, and the N storage was estimated to be 8444 t [53]. The TP concentration in the bottom sediment ranged from 1682 to 6537 mg/kg (average 3059 mg/kg) based on observations in September 2010. This value is much higher than shallow Lake Taihu (mean depth 1.9 m), Lake Chao (mean depth 3 m), and Lake Dian (mean depth 4.4 m) [59] and likely reflects a greater relative deposition of autochthonous-generated organic material. The bottom sediments, particularly under hypoxic/anoxic conditions, therefore represent a potential major nutrient source that could stimulate eutrophication in the lake, although atmospheric deposition may be similarly important. The stores of nutrients in the bottom sediments have likely accelerated with agricultural and industrial development in the catchment [60], phosphorus mining [61], and livestock and poultry farming [62].
Wang [41] documented the external TN and TP loads through tributaries and wet and dry deposition based on measurements from 1999. He estimated TN and TP loads, including diffuse inputs at the shoreline and atmospheric deposition, of 236.7 t and 187.3 t in 1999, respectively. The TN and TP loadings from dry deposition and wet deposition were 29.3 t and 105.7 t in 1999 [41], accounting for 12.4% and 56.4% of the total TN and TP loads, respectively. The major TP contributor was air deposition resulting from phosphorus mining in 1999. The 12 main tributaries contributed 56.7% of the TN inputs and 34.3% of the TP inputs in 1999. Nowadays, all phosphorus mining factories have been closed or moved out of the lake catchment, leading to a remarkable decrease in both tributary and atmospheric TP loading. The wet and dry deposition estimates of TP loading dramatically decreased from 105.7 t in 1999 to 15.22 t in 2010 [61], likely reflecting the early stages of mine closure. The average TP loading through tributaries has decreased by 63.8% during 2010–2017 compared to that in 1999.
Despite P management efforts and mine closures, in-lake TP concentration have increased from 0.04 mg/L in period 1 (pre-2000) to 0.17 mg/L in period 2 (2000s) and 0.37 mg/L in period 3 (2010s), while the TP input through the main 12 tributaries in the three periods was gradually decreasing, with average annual loads of 61.2 t/year (Wang 2001), 46.6 t/year (Jin et al., 2010), and 23.3 t/year (this paper), respectively. The large increase in lake TP concentration from period 1 to period 3 implies that there might still be a large amounts of phosphorus entering the lake waterbody through sediment resuspension or, to some extent, through dry deposition, although four of five phosphorus mining factories have been closed by the local government, or that there might be significant phytoplankton P content since chl-a has dramatically increased from 12.26 µg/L in period 1 to 47.63 µg/L in period 2 and 61.16 µg/L in period 3. Therefore, the reason why the lake P has increased dramatically since 1980s need to be further studied for the mitigation of lake eutrophication and algal blooms.
The primary nitrogen source from the catchment is from vegetable farming [42]. The majority of TN reaches the lake via tributaries during the rainy season. We observed increased annual loading of TN, likely due to a progressive increase in agricultural development in the catchment over the past three decades [61]. Although there are now many pre-pools around the lake (~30 m to the lake shore) receiving water from all the tributaries, which are mostly used for vegetable farming, there is still significant N and P entering the lake water with overflow due to limited pre-pool storage during the rainy seasons. So, the buffering pre-pools cannot completely reduce the external loading from the catchment to be zero. Furthermore, they might make the lake water level decrease gradually. So, the effect of pre-pools around the lake shore on water quality improvement needs to be carefully and seriously evaluated in the future.
The increased TN loading and TP loading through tributary inputs and atmospheric deposition and internal loading, together with increases in in-lake TP have likely favored algal growth, as shown by a ~5-fold increase of in Chl-a concentrations for the period of 2010–2017 compared with pre-2000. The TLI values in the three periods also increased dramatically. Although most of the nutrients from tributaries are now entering the buffering pre-pools, there is inevitably some N and P entering the lake through overflow in the rainy seasons. The high N and P concentrations in surface sediment and the lake shallowness lead to considerable internal loadings with sediment resuspension during strong wind events. Therefore, to mitigate the eutrophication in Lake Xingyun, it is necessary to manage the reduction of internal TP and TN loads as well as reduced external loads. Directly taking the aggregated algae out of surface water regulated by the meteorological condition might be another optional method for mitigating eutrophication, as it is being carried out at this lake, Lake Dianchi, Lake Chao, and Lake Taihu with frequent and strong algal blooms.
The tributary loadings of TN and TP were poorly correlated with the in-lake TN and TP concentrations at both monthly and annual time scales, which implies internal loading is playing a vital role in lake eutrophication and that TN and TP concentrations in the bottom sediments have increased [54]. Cheng et al. [63] reported that the TN and TP concentrations in the surface sediment of Lake Xingyun were 5140 and 4790 mg/kg, respectively, which were both the highest among the NGPLs of the YP. During January 2010–April 2018, the monthly average TN of all the 12 tributaries was 1.44 mg/L, while the monthly average TN of lake water was 1.87 mg/L. The monthly average TP for inflows and lake water were 0.04 mg/L and 0.36 mg/L, respectively. So, the TN and TP concentrations in the lake were much higher than those of the inflow waters during the period, suggesting the nutrient-enriched surface sediment was an important N and P source that can enter the lake water through wind-induced sediment resuspension or release with hypoxia conditions at the sediment–water interface. The average water residence time was 7.6 years for 2010–2018. The long residence time has kept P and N from catchment cycling in the water–sediment and water–sediment–atmosphere (especially for N) systems, respectively.
The combination of persistent high nutrient loads from the catchment, while they have decreased slightly, and an apparent increase in internal loading based on ongoing increases in in-lake nutrient concentrations have caused frequent harmful algal blooms dominated by Microcystis aeruginosa since 2000 [64]. Concentrations of microcystins of up to 42.0 µg/L are observed during the warm season [65], which is much higher than the standard (1.0 µg/L) for drinking water safety suggested by the World Health Organization. Except for the internal load stored in the sediment originating from the lake catchment, cyanobacteria and water hyacinth in the lake water also contribute to internal loading through decomposition, with both vegetative types having increased in biomass in recent years [66].
It has been well documented that internal loading is a critical part of lake eutrophication [8,9,25]. For example, in Lake Pamvotis, internal P loading is expected to increase the response time of trophic status by a decade or longer after external reductions in the P load [67]. In shallow Lake Okeechobee, the average annual TP concentrations increased from 0.049 mg/L in 1973 to 0.098 mg/L in 1984 [68]. The increases in TP concentrations were not correlated with external phosphorus inputs but with changes in lake water levels. The resuspension of bottom sediments by wind action may also be a major factor influencing in-lake total phosphorus concentrations [69]. In large shallow Lake Taihu, nutrient loss from the water column and burial through sedimentation is hampered by frequent wind-induced sediment resuspension [25]. The internal loading induced by sediment resuspension in shallow waters and by hypoxia/anoxia in deep waters is a substantial barrier to reducing eutrophication. According to investigations into the WQ and sediment of 24 lakes in the YP in October 1994, Lake Xingyun’s sediment had the highest TP concentration [70]. In this lake, eutrophication has reduced SDT and led to the near total elimination of submerged aquatic vegetation. Therefore, in managing eutrophication in severely degraded lakes, there is a need to reduce external nutrient loads [71,72] as well as internal loads. The management of internal loads can be difficult and expensive. Methods such as dredging [67,73,74] or geoengineering [75,76] have had variable levels of success.
Compared to 1999, with annual tributary TN loads of 134.2 t, the 2017 load and the average 2010–2017 load have increased by 92.2% and 37%, respectively, but the tributary phosphorus inputs have decreased by 73.6% in 2017 and 63.8% during 2010–2017 relative to a load of 64.3 t in 1999. Despite this sustained reduction of P loading, including from atmospheric deposition, in-lake TP has increased, apparently in response to increased internal loading from P-enriched sediment. Microcystis aeruginosa is commonly associated with high levels of internal P loading, and, as water transparency has decreased, it appears to have benefited from the lack of competition with submerged macrophytes, which have severely declined in recent years. The lake TN and TP concentrations have increased progressively since the 1980s, and effective lake restoration will require improved agricultural practices to reduce the nutrients, as well as sediment dredging, sediment capping, or geoengineering to reduce internal nutrient loadings at Lake Xingyun.
The estimation of total nutrient inputs to lakes from catchment likely looks very difficult if no monitored inflow volume of tributaries can be found. A hydrodynamic or catchment model [14] might be very useful to estimate inflow volume of all the tributaries for a lake. However, water levels and outflows are required by a hydrodynamic model, and measured daily inflows are required by a catchment model to conduct the estimation. At a monthly time scale, a statistical regression [47,48,49,50], genetic method [77], or wavelet method [78] to find the relationship between inflow and rain might be a good option to solve the problem. So, the process of producing monthly tributary inflows based on rainfall data in this paper might be a good example for estimating runoff at other lakes.

5. Conclusions

(1)
During 2010–2017, the average yearly TN and TP loads from the main tributaries were 36.6% higher and 63.8% lower than the measurements in 1999.
(2)
The TN and TP loads showed similar seasonality, with the highest loading during the wet season and the lowest during the dry season. The TN loading in the wet season accounted for 84.9% of the annual TN load, and the TP loading in the wet season accounted for 84.0% of the annual TP load during 2010–2017.
(3)
In-lake TN and TP concentrations were poorly correlated with the corresponding external loadings from main tributaries, which suggests that the internal loading might significantly contribute to the lake eutrophication.
(4)
A reduction in the internal loads might be seriously considered for the mitigation of lake eutrophication.

Author Contributions

Conceptualization, L.L., H.Z. (Hucai Zhang) and H.L.; methodology, L.L.; software, L.L.; validation, C.M., K.M. and H.Z. (Hong Zhou); formal analysis, L.L.; investigation, L.L., H.Z. (Hucai Zhang) and C.L.; resources, L.L. and H.Z. (Hucai Zhang); data curation, L.L., H.Z. (Hucai Zhang) and C.H.; writing—original draft preparation, L.L.; writing—review and editing, C.M. and H.Z. (Hong Zhou); visualization, F.L. and H.L.; supervision, L.L.; project administration, L.L., H.Z. (Hucai Zhang) and H.L.; funding acquisition, L.L. All authors have read and agreed to the published version of the manuscript.

Funding

This research was funded by Yunnan University (C176220100043), the Yunnan Provincial Department of Science and Technology (202001BB050078), the National Natural Science Foundation of China (41671205, 42171034), and the Yunnan Provincial Government Leading Scientist Program (2015HA024).

Institutional Review Board Statement

Not applicable.

Informed Consent Statement

Not applicable.

Data Availability Statement

The relevant data was available on the request of corresponding authors.

Acknowledgments

The authors would like very much to thank David Philip Hamilton from Griffith University of Australia for his valuable comments on the manuscript.

Conflicts of Interest

The authors declare no conflict of interest.

References

  1. Conley, D.J.; Paerl, H.W.; Howarth, R.W.; Boesch, D.F.; Seitzinger, S.P.; Havens, K.E.; Lancelot, C.; Likens, G.E. Controlling eutrophication: Nitrogen and phosphorus. Science 2009, 323, 1014–1015. [Google Scholar] [CrossRef]
  2. Greeson, P.E. Lake eutrophication—A natural process. J. Am. Water Resour. Assoc. 1969, 5, 15–30. [Google Scholar] [CrossRef]
  3. Anderson, D.M.; Glibert, P.M.; Burkholder, J.M. Harmful algal blooms and eutrophication: Nutrient sources, composition, and consequences. Estuaries 2002, 25, 704–726. [Google Scholar] [CrossRef]
  4. Smith, V.H.; Schindler, D.W. Eutrophication science: Where do we go from here. Trends Ecol. Evol. 2009, 24, 201–207. [Google Scholar] [CrossRef]
  5. Smith, V.H. Eutrophication of freshwater and coastal marine ecosystems a global problem. Environ. Sci. Pollut. Res. 2003, 10, 126–139. [Google Scholar] [CrossRef]
  6. Hamilton, D.P.; Salmaso, N.; Paerl, H.W. Mitigating harmful cyanobacterial blooms: Strategies for control of nitrogen and phosphorus loads. Aquat. Ecol. 2016, 50, 351–366. [Google Scholar] [CrossRef]
  7. Mehner, T.; Diekmann, M.; Gonsiorczyk, T.; Kasprzak, P.; Koschel, R.; Krienitz, L.; Rumpf, M.; Schulz, M.; Wauer, G. Rapid recovery from eutrophication of a stratified lake by disruption of internal nutrient load. Ecosystems 2008, 11, 1142–1156. [Google Scholar] [CrossRef]
  8. Søndergaard, M.; Kristensen, P.; Jeppesen, E. Phosphorus release from resuspended sediment in the shallow and wind– exposed Lake Arreso, Denmark. Hydrobiologia 1992, 228, 91–99. [Google Scholar] [CrossRef]
  9. Søndergaard, M.; Jensen, J.P.; Jeppesen, E. Role of sediment and internal loading of phosphorus in shallow lakes. Hydrobiologia 2003, 506–509, 135–145. [Google Scholar] [CrossRef]
  10. Matisoff, G.; Watson, S.B.; Guo, J.; Duewiger, A.; Steely, R. Sediment and nutrient distribution and resuspension in Lake Winnipeg. Sci. Total Environ. 2017, 575, 173–186. [Google Scholar] [CrossRef]
  11. Paytan, A.; Roberts, K.; Watson, S.; Peek, S.; Chuang, P.; Defforey, D.; Kendall, C. Internal loading of phosphate in Lake Erie Central Basin. Sci. Total Environ. 2017, 579, 1356–1365. [Google Scholar] [CrossRef]
  12. Wu, Z.; Liu, Y.; Liang, Z.; Wu, S.; Guo, H. Internal cycling, not external loading, decides the nutrient limitation in eutrophic lake: A dynamic model with temporal Bayesian hierarchical inference. Water Res. 2017, 116, 231–240. [Google Scholar] [CrossRef]
  13. Whitehead, P.G.; Wilby, R.L.; Battarbee, R.W.; Kernan, M.; Wade, A.J. A review of the potential impacts of climate change on surface water quality. Hydrol. Sci. J. 2009, 54, 101–123. [Google Scholar] [CrossRef]
  14. Zhang, Y.; Lan, J.; Li, H.; Liu, F.; Luo, L.; Wu, Z.; Yu, Z.; Liu, M. Estimation of external nutrient loadings from the main tributary (Xin’anjiang) into Lake Qiandao (2006–2016). J. Lake Sci. 2019, 31, 1534–1546. (In Chinese) [Google Scholar]
  15. Sahoo, G.B.; Nover, D.M.; Reuter, J.E.; Heyvaert, A.C.; Riverson, J.; Schladow, S.G. Nutrient and particle load estimates to Lake Tahoe (CA-NV, USA) for total maximum daily load establishment. Sci. Total Environ. 2013, 444, 579–590. [Google Scholar] [CrossRef]
  16. Robinson, C. Review on groundwater as a source of nutrients to the Great Lakes and their tributaries. J. Great Lakes Res. 2015, 41, 941–950. [Google Scholar] [CrossRef]
  17. Verschuren, D.; Johnson, T.C.; Kling, H.J. History and timing of human impact on Lake Victoria, East Africa. Proc. R. Soc. Lond. Ser. B Biol. Sci. 2002, 269, 289–294. [Google Scholar] [CrossRef] [Green Version]
  18. Sitoki, L.; Kurmayer, R.; Rott, E. Spatial variation of phytoplankton composition, biovolume, and resulting microcystin concentrations in the Nyanza Gulf (Lake Victoria, Kenya). Hydrobiologia 2012, 691, 109–122. [Google Scholar] [CrossRef] [Green Version]
  19. Hensalu, A.; Alliksaar, T.; Leeben, A.; Nõges, T. Sediment diatom assemblages and composition of pore–water dissolved organic matter reflect recent eutrophication history of lake Peipsi (Estonia/Russia). Hydrobiologia 2007, 584, 133–143. [Google Scholar] [CrossRef]
  20. Yang, M.; Yu, J.; Li, Z.; Guo, Z.; Burch, M.; Lin, T.F. Taihu Lake not to blame for Wuxi’s woes. Science 2008, 319, 158. [Google Scholar] [CrossRef]
  21. Schindler, D.W. The dilemma of controlling cultural eutrophication of lakes. Proc. R. Soc. B Biol. Sci. 2012, 279, 4322–4333. [Google Scholar] [CrossRef] [Green Version]
  22. Michalak, A.M.; Anderson, E.J.; Beletsky, D.; Boland, S.; Bosch, N.S.; Bridgeman, T.B.; Chaffin, J.D.; Cho, K.; Confesor, R.; Daloğlu, I.; et al. Record-setting algal bloom in Lake Erie caused by agricultural and meteorological trends consistent with expected future conditions. Proc. Natl. Acad. Sci. USA 2013, 110, 6448–6452. [Google Scholar] [CrossRef] [Green Version]
  23. Lewitus, A.J.; Schmidt, L.B.; Mason, L.J.; Kempton, J.W.; Wilde, S.B.; Wolny, J.L.; Williams, B.J.; Hayes, K.C.; Hymel, S.N.; Keppler, C.J.; et al. Harmful algal blooms in South Carolina residential and golf course ponds. Popul. Environ. 2003, 24, 387–413. [Google Scholar] [CrossRef]
  24. Welch, E.B.; Cooke, G.D. Internal phosphorus loading in shallow lakes: Importance and control. Lake Reserv. Manag. 2005, 21, 209–217. [Google Scholar] [CrossRef] [Green Version]
  25. Qin, B.; Paerl, H.W.; Brookes, J.D.; Liu, J.; Jeppesen, E.; Zhu, G.; Zhang, Y.; Xu, H.; Shi, K.; Deng, J. Why Lake Taihu continues to be plagued with cyanobacterial blooms through 10 years (2007–2017) efforts. Chin. Sci. Bull. 2019, 64, 354–356. [Google Scholar] [CrossRef] [Green Version]
  26. Lou, Y.; Zhang, J.; Zhao, L.; Li, Y.; Yang, Y.; Xie, S. Aerobic and nitrite-dependent methane-oxidizing microorganisms in sediments of freshwater lakes on the Yunnan Plateau. Appl. Microbiol. Biotechnol. 2015, 99, 2371–2381. [Google Scholar] [CrossRef]
  27. Zou, L.; Li, X.; Yang, K. The temporal and spatial distribution of precipitation over Kunming. Yunnan Geogr. Environ. Res. 2014, 26, 68–78. (In Chinese) [Google Scholar]
  28. Yang, L. The Preliminary study on the original classification and distribution law of lakes in the Yunnan Plateau. Trans. Oceanol. Limnol. 1984, 1, 34–39. (In Chinese) [Google Scholar]
  29. Zhu, H. Formation of fault lakes in Yunnan Province, and its sediment and evolution in lake cenozoic. Oceanol. Limnol. Sin. 1991, 22, 509–516. (In Chinese) [Google Scholar]
  30. Ley, S.; Yu, M.; Li, G.; Zeng, J.; Chen, J.; Gao, B.; Huang, H. Limnological survey of the lakes of Yunnan Plateau. Oceanol. Limnol. Sin. 1963, 5, 87–114. (In Chinese) [Google Scholar]
  31. Dong, Y. Research and development of algae in the nine plateau lakes in Yunnan. Environ. Sci. Surv. 2014, 33, 1–8. (In Chinese) [Google Scholar]
  32. Zhang, X.; Liu, L.; Ma, S. Projects for comprehensive pollution treatment for the Xingyun Lake catchment. J. Lake Sci. 2001, 13, 175–179. (In Chinese) [Google Scholar]
  33. Zhang, X.; Xu, H. Ecological preservation and pollution treatment of Xingyun Lake. Environ. Sci. Surv. 2014, 33, 20–24. (In Chinese) [Google Scholar]
  34. Wu, D.; Zhou, A.; Liu, J.; Chen, X.; Wei, H.; Sun, H.; Yu, J.; Bloemendal, J.; Chen, F. Changing intensity of human activity over the last 2000 years recorded by the magnetic characteristics of sediments from Xingyun Lake, Yunnan, China. J. Paleolimnol. 2015, 53, 47–60. [Google Scholar] [CrossRef]
  35. Zhou, X. Characterization and sources of sedimentary organic matter in Xingyun Lake, Jiangchuan, Yunnan, China. Environ. Earth Sci. 2016, 75, 1054. [Google Scholar] [CrossRef]
  36. Zhang, H.; Li, S.; Feng, Q.; Zhang, S. Environmental change and human activities during the 20th century reconstructed from the sediment of Xingyun Lake, Yunnan Province, China. Quat. Int. 2010, 212, 14–20. [Google Scholar] [CrossRef]
  37. Dong, Y.; Wu, X.; Sheng, S.; Yang, S. Paths for protection and treatment of the nine plateau lakes in Yunnan under ecological civilization development. Ecol. Econ. 2014, 30, 151–155. (In Chinese) [Google Scholar]
  38. Li, R.; Dong, M.; Zhao, Y.; Zhang, L.; Cui, Q.; He, W. Assessment of water quality and identification of pollution sources of plateau lakes in Yunnan (China). J. Environ. Qual. 2007, 36, 291–297. [Google Scholar] [CrossRef]
  39. Jin, S.; Jin, X.; Lu, Y.; Lu, H.; Yang, Y.; Li, Y. Research on amount of phosphorus entering into Xingyun Lake caused by phosphorite exploitation and processing in Xingyun Lake watershed. Environ. Sci. Surv. 2010, 29, 43–45. (In Chinese) [Google Scholar]
  40. Jin, X.; Wang, L.; Qi, Y.; Liu, Y.; Lu, Y. Study on the influence of phosphorite exploration on the total phosphorus pollution in Xingyun Lake. Environ. Sci. Surv. 2011, 30, 78–80. (In Chinese) [Google Scholar]
  41. Wang, J. In-lake pollution load of Xingyun Lake. Yunnan Environ. Sci. 2001, 20, 28–31. (In Chinese) [Google Scholar]
  42. Zhang, W.; Ming, Q.; Shi, Z.; Chen, G.; Niu, J.; Lei, G.; Chang, F.; Zhang, H. Lake sediment records on climate change and human activities in the Xingyun Lake Catchment, SW China. PLoS ONE 2014, 9, e102167. [Google Scholar] [CrossRef]
  43. Zheng, T.; Zhao, Z.; Zhao, X.; Gu, Z.; Pu, J.; Lu, F. Water quality change and humanities driving force in Lake Xingyun, Yunnan Province. J. Lake Sci. 2018, 30, 79–90. (In Chinese) [Google Scholar]
  44. Wang, Y.; Wang, Z.; Wu, W.; Wang, K.; Liu, Y. Investigating and analyzing plankton and macrophytes in Xingyun Lake. In Proceedings of the 3rd Lake Forum, Wuhan, China, 24 October 2013. (In Chinese). [Google Scholar]
  45. Zhang, X.; Shao, Y.; Chen, Z.; Zhang, F.; Wan, B.; Chen, G.; Nie, J. Response analysis between land use change and water quality in Xingyun Lake Basin. J. Kunming Metall. Coll. 2020, 36, 77–82. (In Chinese) [Google Scholar]
  46. Ministry of Ecology and Environment of China (MEEC). Methods of Analysis and Monitoring for Water and Wastewater, 4th ed.; China Environmental Science Press: Beijing, China, 2002. (In Chinese) [Google Scholar]
  47. Mei, Q.; Hu, Y.; Sun, H.; Ren, X. Relationship mining between rainfall and inflow volume. China Econ. Informatiz. 2008, 26, 44–45. (In Chinese) [Google Scholar]
  48. Zhao, X. Analysis on correlation between annual runoff and precipitation in Xinjiang. Water Resour. Dev. Manag. 2016, 1, 73–75. (In Chinese) [Google Scholar]
  49. Wang, Y.; Xu, H.; Cheng, B.; Huang, D.; Tan, Y.; Luo, Y. Impacts of precipitation change on the runoff change in the Fujiang River Basin during the period of 1951–2012. Progress. Inquis. Mutat. Clim. 2014, 10, 127–134. (In Chinese) [Google Scholar]
  50. Guo, A.; Chang, J.; Wang, Y.; Li, Y. Variation characteristics of rainfall-runoff relationship and driving factors analysis in Jinghe river basin in nearly 50 years. Trans. Chin. Soc. Agric Eng. 2015, 31, 165–171. (In Chinese) [Google Scholar]
  51. Carlson, R.E. A trophic state index for lakes. Limnol. Oceanogr. 1977, 22, 361–369. [Google Scholar] [CrossRef] [Green Version]
  52. Wang, M.; Liu, X.; Zhang, J. Evaluation method and classification standard on lake eutrophication. Environ. Monitor. China 2002, 18, 47–49. (In Chinese) [Google Scholar]
  53. Jin, X. China Lake Environment, 1st ed.; China Ocean Press: Beijing, China, 1995. (In Chinese) [Google Scholar]
  54. Wang, H.; Tang, C. Advances on environmental research at Lake Xingyun. Anhui Agric. Sci. Bull. 2010, 16, 183–185. (In Chinese) [Google Scholar]
  55. Liu, Y.; Chen, G.; Shi, H.; Chen, X.; Lu, H.; Duan, L.; Zhang, H.; Zhang, W. Response of a diatom community to human activities and climate changes in Xingyun Lake. Acta Ecol. Sin. 2016, 36, 3063–3073. (In Chinese) [Google Scholar]
  56. Liu, Y.; Chen, G.; Hu, K.; Shi, H.; Huang, L.; Chen, X.; Lu, H.; Zhao, S.; Chen, L. Biological responses to recent eutrophication and hydrologic changes in Xingyun Lake, southwest China. J. Paleolimnol. 2017, 57, 343–360. [Google Scholar] [CrossRef]
  57. Gao, C.; Yu, J.; Min, X.; Cheng, A.; Hong, R.; Zhang, L. Heavy metal concentrations in sediments from Xingyun lake, southwestern China: Implications for environmental changes and human activities. Environ. Earth Sci. 2018, 77, 666. [Google Scholar] [CrossRef]
  58. Sakamoto, M.; Sugiyama, M.; Maruo, M.; Murase, J.; Song, X.; Zhang, Z. Distribution and dynamics of nitrogen and phosphorus in the Fuxian and Xingyun lake system in the Yunnan Plateau, China. Yunnan Geogr. Environ. Res. 2002, 14, 1–9. [Google Scholar]
  59. Wu, X.; Qin, J.; Peng, T. Spatial distribution characteristics and different analysis of phosphorus in the overlying water and surface sediments of the Xingyun Lake. J. Yuxi Normal. Univ. 2013, 29, 12–17. (In Chinese) [Google Scholar]
  60. Yi, D.; Gan, S.; Yu, Z. Relationship between water quality and catchment land use change at Lake Xingyun. J. Zhejiang Agric. Sci. 2019, 60, 459–461. (In Chinese) [Google Scholar]
  61. Jin, X.; Lu, Y.; Jin, S.; Liu, H.; Li, Y. Research on amount of total phosphorus entering into Fuxian Lake and Xingyun Lake through dry ad wet deposition caused by surrounding phosphorus chemical factories. Environ. Sci. Surv. 2010, 29, 39–42. (In Chinese) [Google Scholar]
  62. Wang, J.; Zhang, D.; Chen, Y. Livestock waste pollution loading and its environmental impact in Xingyun Lake watershed. Shanghai Environ. Sci. 2011, 30, 12–17. (In Chinese) [Google Scholar]
  63. Cheng, N.; Liu, L.; Hou, Z.; Wu, J.; Wang, Q. Pollution characteristics and risk assessment of surface sediments in nine plateau lakes of Yunnan Province. IOP Conf. Ser. Earth Environ. Sci. 2020, 467, 012166. [Google Scholar] [CrossRef]
  64. Liu, S.; Ji, Z.; Pu, F.; Liu, Y.; Zhou, S.; Zhai, J. On phytoplankton community composition structure and biological assessment of water trophic state in Xingyun Lake. J. Saf. Environ. 2019, 19, 1439–1447. (In Chinese) [Google Scholar]
  65. Li, S.; Xie, P.; Xu, J.; Zhang, X.; Qin, J.; Zheng, L.; Liang, G. Factors shaping the pattern of seasonal variations of microcystins in Lake Xingyun, a subtropical plateau lake in China. Bull. Environ. Contam. Toxicol. 2007, 78, 226–230. [Google Scholar] [CrossRef] [PubMed]
  66. Chen, P. Brief talk on protection and treatment of Xingyun Lake in Jiangchuan, Yuxi. Environ. Sci. Surv. 2018, 37, 53–57. (In Chinese) [Google Scholar]
  67. Kagalou, I.; Papastergiadou, E.; Leonardos, I. Long term changes in the eutrophication process in a shallow Mediterranean lake ecosystem of W. Greece: Response after the reduction of external load. J. Environ. Manag. 2008, 87, 497–506. [Google Scholar] [CrossRef] [PubMed]
  68. Canfield, D.E., Jr.; Hoyer, M.V. The eutrophication of Lake Okeechobee. Lake Reserv. Manag. 1988, 4, 91–99. [Google Scholar] [CrossRef] [Green Version]
  69. Hansen, P.S.; Phlips, E.J.; Aldridge, F.J. The Effects of sediment resuspension on phosphorus available for algal growth in a shallow subtropical lake, Lake Okeechobee. Lake Reserv. Manag. 1997, 13, 154–159. [Google Scholar] [CrossRef] [Green Version]
  70. Jiang, Z.; Wu, Y.; Song, X.; Whitmore, T.J.; Brenner, M.; Curtis, J.H.; Moore, A.M.; Engstrom, D.R. Water quality and sediment geochemistry in lakes of Yunnan Province, southern China. Yunnan Geoglogy 1997, 16, 115–128. (In Chinese) [Google Scholar]
  71. Schindler, D.W.; Hecky, R.E.; Findlay, D.; Stainton, M.P.; Parker, B.R.; Paterson, M.J.; Beaty, K.G.; Lyng, M.; Kasian, S.E.M. Eutrophication of lakes cannot be controlled by reducing nitrogen input: Results of a 37-year whole-ecosystem experiment. Proc. Natl. Acad. Sci. USA 2008, 105, 11254–11258. [Google Scholar] [CrossRef] [Green Version]
  72. Schindler, D.W.; Hecky, R.E.; McCullough, G.K. The rapid eutrophication of Lake Winnipeg: Greening under global change. J. Great Lakes Res. 2012, 38 (Suppl. S3), 6–13. [Google Scholar] [CrossRef]
  73. Brouwer, E.; Roelofs, J.G.M. Oligotrophication of acidified, nitrogen–saturated softwater lakes after dredging and controlled supply of alkaline water. Archiv. Hydrobiol. 2002, 155, 83–97. [Google Scholar] [CrossRef]
  74. Smolders, A.J.P.; Lamers, L.P.M.; Lucassen, E.C.H.E.T.; Van der Velde, G.; Roelofs, J.G.M. Internal eutrophication: How it works and what to do about it—A review. Chem. Ecol. 2006, 22, 93–111. [Google Scholar] [CrossRef]
  75. Mackay, E.B.; Maberly, S.C.; Pan, G.; Reitzel, K.; Bruere, A.; Corker, N.; Douglas, G.; Egemose, S.; Hamilton, D.; Hatton-Ellis, T.; et al. Geoengineering in lakes: Welcome attraction or fatal distraction? Inland Waters 2014, 4, 349–356. [Google Scholar] [CrossRef] [Green Version]
  76. Lürling, M.; Mackay, E.B.; Peitzel, K.; Spears, B.M. Editorial—A critical perspective on geo-engineering for eutrophication management in lakes. Water Res. 2016, 97, 1–10. [Google Scholar] [CrossRef] [PubMed] [Green Version]
  77. Rodriguez-Vazquez, K.; Arganis-Juarez, M.L.; Cruickshank-Villanueva, C.; Dominguez-Mora, R. Rainfall-runoff modelling using genetic programming. J. Hydroinform. 2012, 14, 108–121. [Google Scholar] [CrossRef] [Green Version]
  78. Chou, C. Enhanced accuracy of rainfall-runoff modeling with wavelet transform. J. Hydroinform. 2013, 15, 392–404. [Google Scholar] [CrossRef]
Figure 1. Map of Lake Xingyun catchment with the 12 main tributaries and the sampling site for lake water.
Water 14 01281 g001
Figure 2. Calculated monthly inflows for January 2010–April 2018, represented by black solid circles and solid line (left Y axis), and yearly inflows ± standard error for 2010–2017, represented by red solid circles (right Y axis).
Water 14 01281 g002
Figure 3. Monthly lake TN concentration (TN_Lake), represented by black solid circles and solid line (left Y axis), and total tributary TN inputs (TN_Eload) represented by black hollow circles and dash line (right Y axis), during January 2010–April 2018.
Water 14 01281 g003
Figure 4. Monthly lake TP concentration (TP_Lake), represented by black solid circles and solid line (left Y axis), and total tributary TP inputs (TP_Eload), represented by black hollow circles and dash line (right Y axis), during January 2010–April 2018.
Water 14 01281 g004
Figure 5. Mean monthly concentrations of lake TN (TN_Lake) with positive standard errors (black), and tributary loadings of TN (TN_Eload) with positive standard errors represented (grey) for January 2010–April 2018 (A). Mean monthly concentrations of lake TP (TP_Lake) with positive standard errors (black), and tributary loadings of TP (TP_Eload) with positive standard errors represented (grey) (B) for January 2010–April 2018.
Water 14 01281 g005
Figure 6. Annual tributary external loadings of TN (TN_Eload) with positive standard errors (black, left Y axis), and TP (TP_Eload) with positive standard errors (grey, right Y axis), in Lake Xingyun for 2010–2017.
Water 14 01281 g006
Figure 7. Annual concentrations of TN (blue), TP (red), Chl-a (green), and TLI (purple) at Lake Xingyun for 1982–2017 (no TN and TP data for 1983–1987, no Chl-a data for 1983, 1985–1992, 1994–1998, and 2000–2001, and no TLI data for 1982–1995).
Water 14 01281 g007
Table 1. The sub-catchment proportions of water input, TP input, and TN input of total tributary inputs in 1999 and their proportions of dry land, paddy land, and population of those of the whole catchment in 2015 (N—north, W—west, SW—southwest, S—south, E—east).
Sub-Catchment and River Numbers1999 (%)2015 (%)
WaterTPTNDry LandPaddy LandPopulation
N (1–4)30.840.927.734.66.833.2
W (5–6)15.26.113.224.157.519.6
SW (7–10)34.320.447.211.31.729.4
S (11)2.41.117.224.811
E (12)17.331.510.922.89.26.8
Table 2. Trophic Level Index (TLI) value ranges and corresponding trophic status for Chinese lakes.
TLITLI < 3030 < TLI < 5050 < TLI < 6060 < TLI < 70TLI > 70
Eutrophic
status
OligotrophicMesotrophicLight-eutrophicMiddle-eutrophicHyper-eutrophic
Table 3. The proportions (percentage) of external loading in different seasons as a fraction of the sum of the 12 month loadings during January 2010–April 2018. Wet season is May–October and dry season is November–April for Yunnan Plateau.
Spring (%)Summer (%)Autumn (%)Winter
(%)
Wet Season
(%)
Dry Season
(%)
TN14.248.830.36.784.915.1
TP14.149.828.18.084.016.0
Table 4. Average TN, TP, and Chl-a concentrations and TLI for the periods of 1982–1999, 2000–2009, and 2010–2017 at Lake Xingyun.
Year
Period
1982–1999
(Period 1)
2000–2009
(Period 2)
2010–2017
(Period 3)
TN (mg/L)0.71 1.62 1.89
TP (mg/L)0.04 0.17 0.37
Chl-a (µg/L)12.26 47.63 61.16
TLI48.8 60.0 66.4
Publisher’s Note: MDPI stays neutral with regard to jurisdictional claims in published maps and institutional affiliations.

