
Short−Term Assessment of Heavy Metals in Surface Water from Xiaohe River Irrigation Area, China: Levels, Sources and Distribution

Department of Biology, Taiyuan Normal University, Jinzhong 030619, China
*
Author to whom correspondence should be addressed.
Water 2022, 14(8), 1273; https://doi.org/10.3390/w14081273
Submission received: 10 March 2022
/
Revised: 4 April 2022
/
Accepted: 12 April 2022
/
Published: 14 April 2022
(This article belongs to the Special Issue Water Quality in Agricultural Watersheds)
Abstract
:The aims of this study were to determine the pollution characteristics of heavy metals and their potential harm to human health in the surface water of agricultural irrigation areas, China, over a short term. In this study, Cu, Zn, Pb, Hg, Ni, Cr, Cd, and As in surface water of the Xiaohe River irrigation area were detected and analyzed. The results showed that the concentrations of Pb, Hg, Ni, Cr, Cd, and As exceeded the national environmental quality standard for surface water in varying degrees. The concentrations of heavy metals in surface water in October were significantly lower than that in November and December due to the impact of extreme precipitation events. Point source pollution (industrial sewage, etc.) was the main factor affecting the spatial distribution of heavy metals. The main source of heavy metals in October was domestic sewage. Domestic sewage and industrial sewage were the main sources of heavy metals in November. The sources of heavy metals in surface water in December were relatively diverse, and industrial sewage was the main source. The temporal variation of heavy metal pollution sources changed significantly. Industrial sewage was the main pollution source of heavy metals in surface water in the study area. The impact of urban domestic sewage and agricultural activities cannot be ignored. The health risk of heavy metals in surface water mainly depends on Cr, Cd, and As. Policy recommendations were also proposed for better control of heavy metal pollution in the surface water of river ecosystems involving agricultural irrigation areas.
1. Introduction
The global agroecosystem accounts for 36% of the land area and provides food for more than 7 billion people. Agricultural irrigation area is not only an important part of agricultural ecosystems but also an important source and sink of watershed pollution [1]. Soil and surface water in agricultural irrigation areas are important spaces for the collection of earth surface material, physicochemical information, and energy, which can accommodate, buffer, and purify pollutants [2]. At the same time, these pollutants will enter the human body through the food chain, which will have an environmental toxicological impact on human health in the study area, and even destroy the stability of agricultural ecosystems [3]. However, with the acceleration of agricultural modernization and the increase in unreasonable farming methods, soil and water pollution in agricultural irrigation areas in China and developing countries has become increasingly serious in the past few decades. In particular, heavy metal pollutants will migrate along with surface water under geochemical action, which will enter the soil, water, and atmosphere directly or indirectly, and then affect the environmental quality and human health [4,5]. This phenomenon poses a serious challenge to the security of agricultural ecosystems. Thus, it is necessary to study and evaluate the pollution characteristics of heavy metals in surface water in the process of agricultural modernization deeply, which is of great significance for the improvement of the river ecological environment and regional sustainable planning and management.
Due to the strong biological toxicity and bioaccumulation amplification effect of heavy metals, more and more scholars around the world are paying attention to the ecotoxicity and ecological risk of heavy metals in surface water in agricultural ecosystems [6,7,8]. The sources of heavy metals in agricultural ecosystems are complex and diverse. The main sources can be divided into two categories: natural sources and anthropogenic sources. Natural sources include soil erosion, rock weathering, and other processes. Anthropogenic sources mainly refer to the pollutants produced in the process of human production and life, which enter the soil and surface water through atmospheric deposition, surface runoff, and direct discharge of pollutants, resulting in the obvious enrichment of heavy metals [9]. Generally, the potential pollution sources of heavy metals in surface water of agricultural irrigation areas are the discharge of agricultural wastewater and industrial sewage, and the influence of anthropogenic sources on the content of heavy metals in surface water is much greater than that of natural sources. It is worth noting that the use of industrial sewage for irrigation will lead to the accumulation of heavy metals in soil, water, and crops in agricultural irrigation areas, and then enter the human body through the food chain and cause cancer risk [10]. Heavy metals enter the soil and surface water in the form of point source pollution or non−point source pollution. However, due to the intensive and diversified human agricultural activities in the irrigation area, the diffusion processes of heavy metal pollutants are also gradually becoming diversified, resulting in the complexity of the spatial distribution pattern of heavy metals in the environment [11,12], which brings certain difficulties to the study of pollution characteristics of heavy metals.
Tracing the sources of heavy metals is one of the effective ways to control the content of heavy metals in agricultural ecosystems. Relevant studies show that isotope tracing technology is an effective means of pollutant traceability. Normally, the per mL deviation values (δ) of the isotope ratio of the sample to the standard sample are used to indicate the isotopic content of the heavy metals. For example, the isotopic content of Cu is represented in δ units defined as δ65Cu = [(65Cu/63Cu)sample/(65Cu/63Cu)standard − 1] × 1000‰, and the isotopic content of Zn is represented in δ units defined as δ66Zn = [(66Zn/64Zn)sample/(66Zn/64Zn)standard − 1] × 1000‰. The isotopic content of Pb is represented in δ units defined by the Pb ratio of 208Pb/206Pb, 208Pb/204Pb, 206Pb/207Pb, 207Pb/204Pb and 206Pb/204Pb due to the large isotopic composition of Pb. However, a single isotope is mostly used for source analysis with the 208Pb/206Pb and 207Pb/206Pb or Zn isotope ratio in current studies, and tracing heavy metal pollution sources based on multi−isotope tracing technology is rarely reported [13,14,15,16].
At the same time, most of the existing studies focus on the pollution characteristics of heavy metals in soil and pay less attention to the migration process and storage path of heavy metal pollutants in surface water. The distribution characteristics of heavy metal pollutants in agricultural ecosystems are unable to be revealed effectively due to the medium in the ecosystem being interrelated and unified [16]. The agricultural irrigation areas in the Loess Plateau are seriously short of water resources due to factors such as geology, landform, altitude, and climate. In particular, the excessive discharge of pollutants into the surface water has led to the serious exceeding of water environmental indicators in recent years, and the problems of water resources and water environment have become increasingly prominent [17]. Therefore, it is necessary to establish the temporal and spatial distribution characteristics of heavy metal pollutants in the whole agricultural ecosystem of the Loess Plateau based on field investigation, remote sensing data, hydrochemical analysis, and isotope tracing.
The Xiaohe River Basin is an important area with developed industry, concentrated agriculture, and a dense population of the Loess Plateau. Relevant research shows that the agricultural non−point source pollution and urban point source pollution have led to the water environment of Xiaohe River not being promising due to the acceleration of urbanization and the influence of modern farming technology, and the heavy metal pollution in the Xiaohe River irrigation area is becoming increasingly serious [18]. Therefore, this study takes the Xiaohe River irrigation area as the study area, and based on field investigation, the main objectives of this study were: (1) to determine the concentration of heavy metals (Cu, Zn, Hg, Ni, Pb, Cr, Cd, and As) in surface water from the Xiaohe River irrigation area; (2) to analyze the temporal and spatial variation of heavy metals using geostatistical analysis with a geographic information system (ArcGIS); (3) to trace the sources of heavy metal pollutants−based isotope tracing technology; (4) to evaluate the health risk caused by heavy metal pollutants in surface water with the health risk assessment model. It is expected to provide a theoretical basis for the improvement of the ecological environment and the comprehensive treatment of water environmental pollution in agricultural irrigation areas of the Loess Plateau.
2. Materials and Methods
2.1. Study Area Description
Xiaohe River is the second largest tributary of Fenhe River, with a total length of 147 km. The river runs through the Jinzhong urban area from east to west and flows into the main stream of Fenhe River at Nanma village (NM), Taiyuan City. The Xiaohe River irrigation area (Figure 1) is located in the lower reaches of Xiaohe River, in the west of the Xiaohe River Basin and northeast of the Jinzhong Basin, which is an important grain and vegetable planting base for Taiyuan and Jinzhong. The basic farmland is mainly distributed in the bedrock mountains on both sides of the river, and the outcrops are mainly in the Lower Triassic Liujiagou Formation and Quaternary strata, controlling the cultivated land area of 260 km2 and the effective irrigation area of 222 km2 [19].
The study area belongs to the temperate semi−arid continental monsoon climate, which is generally arid and water deficient. The precipitation is mostly concentrated in the eastern mountainous region and less in the western plain region. The annual average precipitation is 483 mm and the seasonal distribution is uneven; 70% of the precipitation is concentrated from June to September (flood season) every year, which is characterized by dry and little rain in winter, and hot and rainy in summer. The average annual evaporation is 2063 mm, with a long frost−free period (about 120~140 days). The temperature difference between day and night is large, and the annual average temperature is 10.1 °C. The study area has sufficient sunshine, rich light, and heat resources, which are suitable for agricultural development. With the rapid development of modern agriculture and industry, the acceleration of urbanization, and the construction of Xiaohe Industrial Park, the Xiaohe River irrigation area has changed from traditional agricultural land to a compound area integrating ecological agriculture, coal chemical industry, and tourism and service industry.
Meanwhile, the surface water of the Xiaohe River Basin is an important source of drinking water for local residents [17]. Songta hydropower station, located on the main stream of Xiaohe River, has a controlled drainage area of 1174 km2 and a reservoir capacity of 97.4 million m3. It focuses on urban domestic, industrial water supply, and hydropower generation, taking into account comprehensive utilization such as flood control and irrigation. It provides 22 million m3 of urban and industrial water supply for the Jinzhong urban area and Taiyuan urban area every year, which can meet the domestic water needs of Shanxi’s new energy automobile equipment manufacturing park and the new town in the north of Jinzhong and provides a strong water resource guarantee for the co−urbanization construction of Jinzhong and Taiyuan in Shanxi. In addition, relevant studies show that the sewage discharged by industrial and mining enterprises in the study area contains pollutants such as heavy metals and organic matter, which have a certain impact on the health of local residents and the ecological environment [18,19].
2.2. Field Sampling
On the basis of consulting the water system map of the Xiaohe River Basin and combining it with the field investigation, according to the distribution of basic farmland in the Xiaohe River Basin and taking into account the topographic characteristics and soil types of the study area, 8 sampling sites in the Xiaohe River irrigation area were set up in this study, and each sampling site was positioned with a handheld Global Position System (GPS, Garmin 72, Lenexa, KS, USA) to ensure the representativeness of the collected samples. The 8 sampling sites were Beiheliu Village (BHL), Xiaohe River wetland park (SD), Xiuwen town (XW), Zhangqing town (ZQ), Zhanghua Village (ZH), Zhaojiabu Village (ZJB), Haocun Village (HC), and Nanma Village (NM), respectively. The distribution of sampling sites is shown in Figure 1.
Surface water samples were collected at a depth of 30 cm in the center of the river with a special plexiglass sampler. Water samples for hydrochemical determination were stored in 1 L polyethylene sample bottles, and for isotopic determination were stored in 100 mL borosilicate glass sample bottles, respectively. The sample bottles were washed with the collected water samples three times before storing water samples. HNO3 was added to all the water samples to stabilize the samples until pH < 2 and then sealed with parafilm to prevent water evaporation and isotope fractionation. At the same time, the pondus hydrogenii (pH), electrical conductance (EC), and total dissolved solids (TDS) of the sampling sites were measured by a portable multi−parameter water quality analyzer (HI 98130, Hanna, Woonsocket, RI, USA). All the samples were taken back to the laboratory with a low-temperature incubator and stored at 4 °C until experimental analysis.
2.3. Heavy Metal Analysis
All the surface water samples were filtered with a 0.45 μm cellulose acetate membrane filter to eliminate impurities before being measured. An inductively coupled plasma optical emission spectrometer (ICP−OES, Optima 5300 DV, PerkinElmer, ThermoScientific Inc., Waltham, MA, USA) was used to determine the concentrations of eight heavy metals (Cu, Zn, Hg, Ni, Pb, Cr, Cd, and As). The lower detection limits were 0.1, 0.1, 0.05, 0.1, 0.1, 0.1, and 0.5 μg·L−1, respectively [20]. In order to ensure the accuracy of the experimental results, each batch of samples was added to the blank control group to eliminate the pollution in the process of sample processing and testing, and this process was randomly carried out. The analytical reagents were of high−grade purity. The measurement results showed that the errors were within the allowable error range (90~105%) and satisfied the experimental requirements. Meanwhile, a 20% repeatability test was carried out for the determination results, and the error was within 5%, indicating that the analysis steps of the samples in this study satisfied the quality requirements.
2.4. Stable Isotopic Analysis
The stable isotopic analysis was carried out in an ultra−clean laboratory. All samples were transferred to a Teflon digestion tube, and HF, HCIO4, and HNO3 solutions were added and digested at 120 °C. Before analyzing the isotopic composition of Cu, Pb, and Zn, Cu was separated and purified by an AGMP−1 anion exchange resin column, Pb was separated and purified by an AG1−X8 anion exchange resin column, and Zn was separated and purified by anion exchange chromatography, respectively.
The isotopic compositions of Cu, Zn, and Pb were determined by a multi−collector inductively coupled plasma mass spectrometer (MC−ICP−MS, Nu Plasma HR, Nu Instruments Ltd., Wrexham, UK). All acids (HBr, HNO3, HF, and HCl) were purified by sub−boiling distillation. Standard reference materials (SRM−976−Cu, IRMM−3702−Zn, NBS−981−Pb, and CAGS−Pb) were added for quality monitoring during the analysis. Each sample was repeated 6 times with an error of less than ±0.6 × 10⁻⁶.
2.5. Water Environment Health Risk Assessment Model
Water environment health risk assessment is one of the most important means to analyze the relationship between heavy metal pollution and human health. The main object of the water environment health risk assessment is harmful substances in water, which can be divided into carcinogens and noncarcinogens. Carcinogens include genotoxic substances and radioactive substances, while noncarcinogens are mainly somatic toxic substances. Direct ingestion, skin contact, and oral and nasal inhalation are the three main ways for harmful substances to enter the human body [21]. There are three main ways for heavy metals in water to enter the human body and endanger human health: direct contact, eating food in polluted water, and drinking polluted water. Among them, drinking polluted water is considered to be the most important exposure route [22].
In this study, the water environment health risk assessment model recommended by the United States Environmental Protection Agency (US EPA) was used to evaluate the impact of heavy metals in surface water of the Xiaohe River irrigation area on the human body. Since heavy metals in drinking water can be divided into carcinogenic and noncarcinogenic heavy metals, heavy metals entering the human body through drinking water can produce varying degrees of carcinogenic and noncarcinogenic risks to the health of adults and children. The calculation formulas of carcinogens health risk assessment model (1) and noncarcinogens health risk assessment model (2) are as follows [23]:
where in Equations (1) and (2) represents the average annual personal carcinogenic risk (a−1) caused by a given chemical carcinogen j entering the human body through drinking water; represents the average annual personal carcinogenic risk (a−1) caused by a given noncarcinogen chemical j entering the human body through drinking water. represents the daily average exposure dose per unit body weight (mg·kg−1·d−1) for a given chemical toxic substance j; represents the carcinogenic potency factor (kg−1·d·mg−1) for a given chemical toxic substance j through drinking water. represents the reference dose of a chemical noncarcinogen j ingested by the human body through drinking water; 70 years is the average life span of human beings [24].
Equation (3) is the formula for calculating the average daily exposure dose per unit body weight through drinking water. represents the actual mass concentration (mg·L−1) for a given chemical toxic substance j, Q represents the average drinking water (2.2 L for adults and 1.0 L for children), W represents the average human weight (64.3 kg for adults and 22.9 kg for children) [24,25]. Equation (4) is the total health risk degree model of heavy metal pollutants in the surface water environment. Different chemical toxic substances have different harmful effects on human health, which can be roughly divided into three categories: additive effect, synergistic effect, and antagonistic effect. However, the concentration of chemical toxic substances in water is usually low, and thus it can be assumed that there is no synergistic and antagonistic effect of various chemical toxic substances on human health. The total health risk degree of surface water environmental pollutants is the cumulative effect of each chemical toxic substance on human health [26,27].
According to the classification system compiled by the International Agency for Research on Cancer (IARC) and World Health Organization (WHO), the potency factors () for Cr, Cd, and As are 41, 6.1, and 15 kg−1·d·mg−1, and the daily average exposure doses per unit body weight () for Cu, Zn, Hg, Pb, and Ni are 0.005, 0.3, 0.0003, 0.0014, and 0.02, respectively [18].
2.6. Data Processing and Spatial Analysis
In the present study, ArcGIS kriging interpolation was used to present the current distribution of the study area and spatial distribution of heavy metals in the surface water (ArcGIS 9.0, Environmental Systems Research Institute, Inc., RedLands, CA, USA). The statistical analysis of the data was performed with SPSS 20.0 (IBM, Armonk, NY, USA) and Excel 2019 (Microsoft, Redmond, WA, USA). Descriptive statistics used for the analysis of the heavy metals in the surface water samples included minimum, maximum, mean, median, and standard deviation (SD). The data analysis diagrams were performed with SigmaPlot 10.0 (Systat Software Inc., Palo Alto, CA, USA).
3. Results and Discussion
3.1. Heavy Metal Concentrations in Surface Water
The concentration of heavy metals (μg·L−1) in the study area is shown in Table 1. Heavy metals were found in all the surface water samples with a significant temporal and spatial variety. The average concentrations of eight heavy metals (Cu, Zn, Pb, Hg, Ni, Cr, Cd, and As) in the study area were 64.28 ± 27.83, 155.03 ± 48.97, 11.38 ± 4.86, 0.06 ± 0.05, 16.78 ± 8.69, 85.83 ± 36.85, 11.64 ± 5.07, and 41.51 ± 28.33 μg·L−1, respectively.
Sampling sites in this study were further classified according to the geographical locations and land use types (grass, forest, farmland, industrial land, and built land), and there was a significant difference between the abundance of heavy metals among different sampling sites. A generally increasing trend of heavy metals abundance from upstream to downstream was identified in all the sampling sites (Figure 2). Interestingly, the average concentration of heavy metals near the industrial land and built land areas was the highest, followed by croplands, while the lowest heavy metals abundance was detected near grass and forest areas.
According to the national environmental quality standard for surface water (Class II, GB 3838–2002) and the national sanitary standard for drinking water (GB 5749−2006), the average concentration of Cr and Cd in all the sampling sites exceeded the national standard limit (Figure 2). The average concentrations of Pb, Hg, Ni, and As in the sampling sites which are located in the downstream also exceeded the national standard limit. The average concentration of Cu and Zn in all the sampling sites was lower than the national standard limit, compared with the background values of Cu (22.9 mg·kg−1) and Zn (63.5 mg·kg−1) in Shanxi Province, China [19]. The enrichment phenomenon of Cu and Zn was found in the study area.
The heavy metal concentrations in the study area were often within the World Health Organization (WHO) allowable limits for irrigation [27], but the concentration of Cd (11.64 μg·L−1) slightly exceeded the WHO maximum limits (Table 1). Although the concentration of heavy metals in the surface water of the Xiaohe River irrigation area is at a lower level compared with other countries and regions [6,10,12,16,27], measures still need to be taken and controlled. Cadmium compounds are not easily absorbed by the gut and accumulate in the liver or kidneys, causing damage to the body, especially to the kidneys. It can also cause osteoporosis and a softening of the body [3,7]. Therefore, strict farmland protection measures and comprehensive wastewater treatment systems are particularly important for the reuse of industrial and agricultural wastewater in sewage irrigation areas.
3.2. Characteristics of Isotopic Composition of Cu, Zn and Pb
The isotopic compositions of Cu, Zn, and Pb in the surface water from the Xiaohe River irrigation area are shown in Table 2. The δ65Cu values of surface water in this study ranged from −0.28‰ to +0.31‰ with an average value of +0.04‰, and the δ66Zn values of surface water in this study ranged from −0.08‰ to +0.14‰ with an average value of +0.03‰. The 207Pb/206Pb of surface water in this study ranged from 0.88 to 0.91 with an average value of 0.90. The 208Pb/206Pb of surface water in this study ranged from 2.01 to 2.33 with an average value of 2.18. The 207Pb/204Pb of surface water in this study ranged from 14.71 to 15.32 with an average value of 14.97. The 208Pb/204Pb of surface water in this study ranged from 36.8 to 39.8 with an average value of 38.5. The 206Pb/204Pb of surface water in this study ranged from 17.2 to 18.7 with an average value of 17.9, respectively.
The analysis of variance (ANOVA) showed that the spatial distributions of the isotopic composition of Cu, Zn, and Pb were not statistically significant among the different sampling sites. The mean δ65Cu and δ66Zn values were close in different months. We conjectured that the main reason for this was the small watershed area in the study area (222 km2). Statistical results showed that the average values of δ65Cu during the study period were followed in the order of November (+0.31‰) > December (+0.15‰) > October (−0.28‰), while the average values of δ66Zn were followed in the order of December (+0.14‰) > November (+0.06‰) > October (−0.08‰) in the study area. However, the ratios of Pb varied greatly in different months, and a generally increasing trend of Pb ratios from October to December among all the sampling sites in the study area was observed (Figure 3).
3.3. Temporal Distribution Characteristics of Heavy Metals
As shown in Table 1, the average concentrations of heavy metals in the surface water in the study area were in the following order Zn > Cr > Cu > As > Ni > Cd > Pb > Hg, and the CV of heavy metals in the surface water in the study area were in the following order Hg > As > Ni > Cd > Cu = Pb = Cr > Zn. Generally, the degree of variation can be divided into weak variability (CV < 0.1), medium variability (0.1 < CV < 1), and strong variability (CV > 1) [31]. The CV of heavy metals in the surface water of the Xiaohe irrigation area was between 0.32 and 0.79, belonging to the medium variability. Overall, once the heavy metal contents and the CV are higher, the sources of the heavy metals are more complex [32]. There were no obvious regular changes in the CV within the sampling time range in this study. However, the CV of the same element showed a certain change rule in this study. The CV of Cu, Zn, and Pb was largest in October, followed by November, and lowest in December. The CV of Hg, Cr, and Cd was lowest in November, which was significantly lower than that of October and December, while the CV of Ni and As was largest in November, which was significantly higher than that of October and December. The CV of heavy metals in the surface water of the Xiaohe River irrigation area showed that the sources of heavy metals were different. In recent years, the land use types and the scope of human activities in the Xiaohe River irrigation area have changed significantly, and the patching of soil is more obvious. These phenomena have led to significant changes in the overall pollution level of heavy metals in the surface water of this area.
In October, the concentrations of heavy metals in the surface water in the study area were significantly lower than that in November and December (Figure 4). Relevant studies show that water velocity and water volume have a positive correlation with the concentration and distribution of heavy metals in the surface water [12,17]. In the first ten−day period of October, Shanxi Province experienced a rare rainstorm in history. The precipitation event belongs to an abnormally extreme heavy precipitation process, which has the characteristics of large, accumulated rainfall, long duration, and prominent extremes. The precipitation in this rainfall process broke the historical extreme value, which was more than three times the annual monthly average. According to the relevant data from the local meteorological department and water conservancy department, the average precipitation in Shanxi Province reached 119.5 mm, and the precipitation in the Xiaohe River irrigation area reached 203 mm during the first ten−day period of October, which was equivalent to more than 98 mm of West Lake water that poured into the study area. The sampling in October was taken within one week after the precipitation event. A large number of floods gathered in the upper reaches of Xiaohe River, resulting in a surge in water velocity and water volume in this precipitation event. Compared with the Jinghuiwu irrigation area, the Loess plateau [12] and the Imam Zadeh Jafar Aquifer located in Gachsaran City, southwest Iran [17], were also in the semi−arid area, and the changing trend of the heavy metal concentration in the water was similar. That was a large water velocity and water volume that led to the dilution of the heavy metals in the surface water, which reduced the concentration of heavy metals in the surface water. On the other hand, a large amount of rainwater entering the surface water in a short time is also one of the factors leading to the reduction in the concentration of heavy metals in the surface water [10]. At the same time, the concentration of heavy metals in the surface water in the study area showed a trend of December > November > October. November and December are the dry seasons in the Xiaohe River Basin, the water velocity and water volume are significantly reduced, and the physical and chemical properties of the water body were obviously different from those in the rainy season, which will affect the adsorption, degradation, migration, and bioavailability of heavy metals. However, the land use types and human activities on both sides of the river have not significantly changed during this period, resulting in a significant increase in the residual concentration of heavy metals in the surface water.
3.4. Spatial Distribution Characteristics of Heavy Metals
Understanding the spatial distribution of heavy metals in the surface water is an important prerequisite for monitoring and evaluating the regional ecological and environment [33]. In order to analyze the spatial differences of heavy metals in the study area, the spatial distribution of eight heavy metals in the surface water from the Xiaohe River irrigation area during October, November, and December was visualized by distribution maps with ArcGIS (Figure 5, Figure 6 and Figure 7).
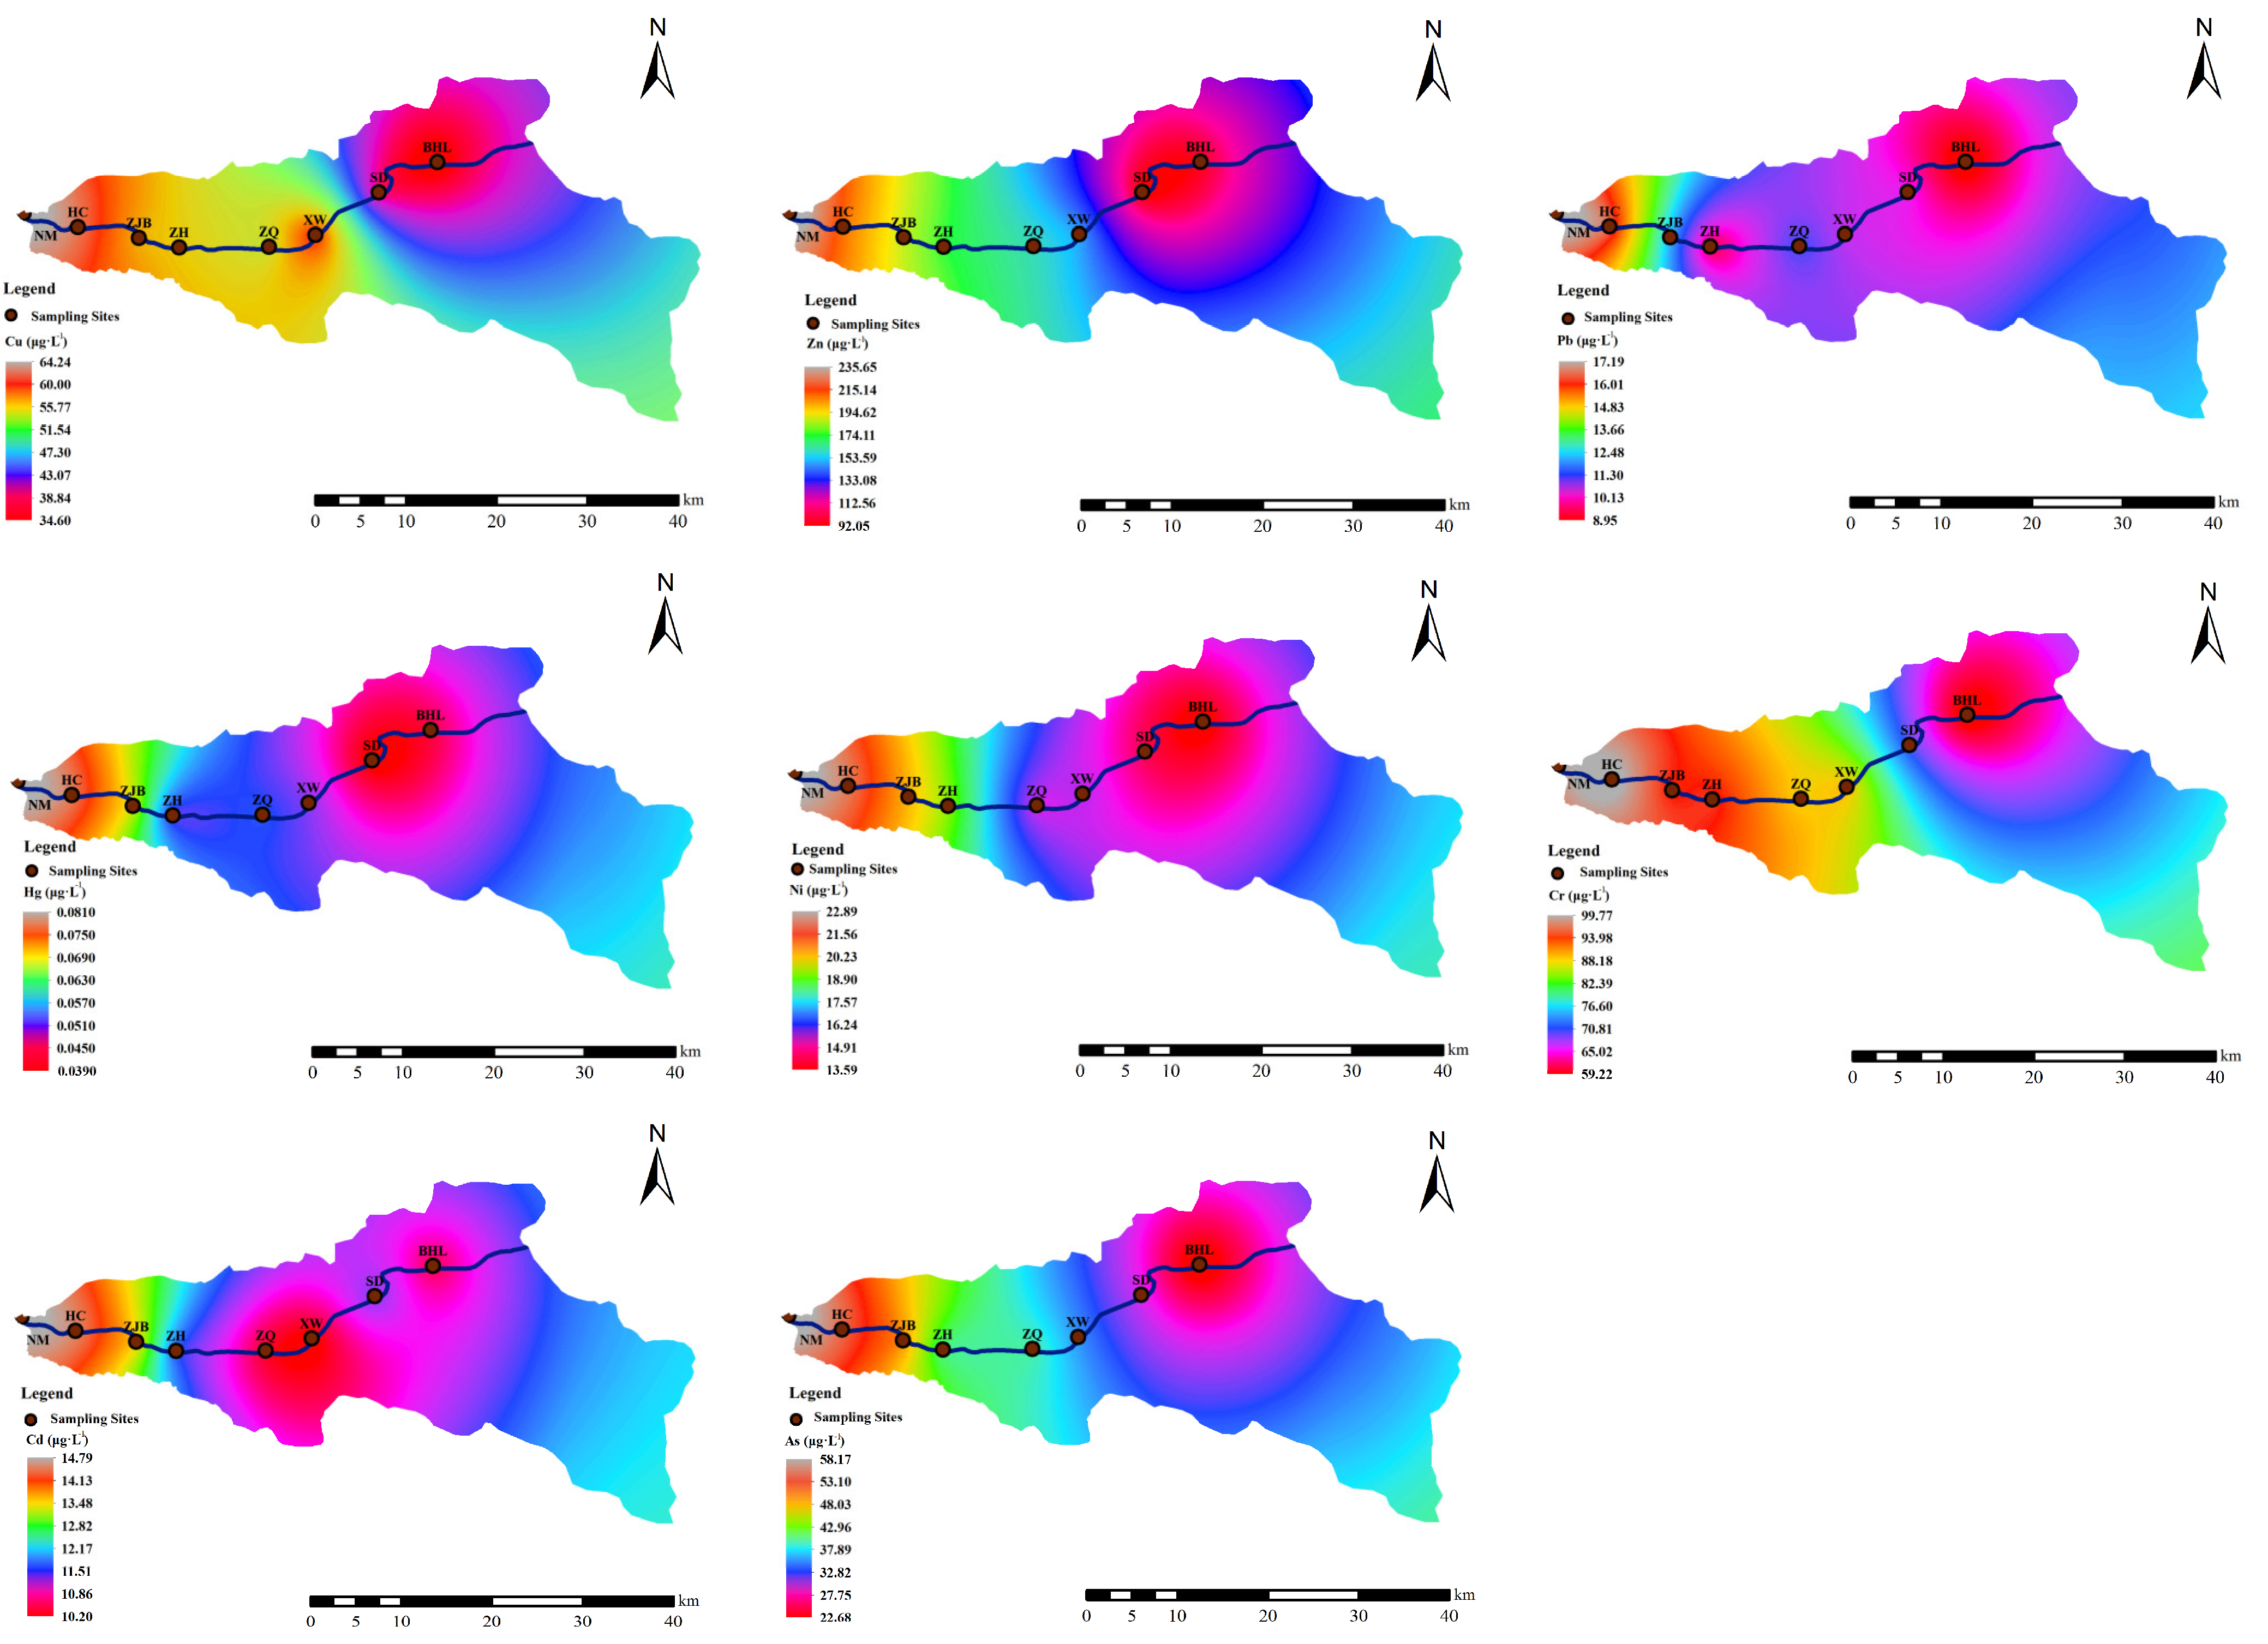
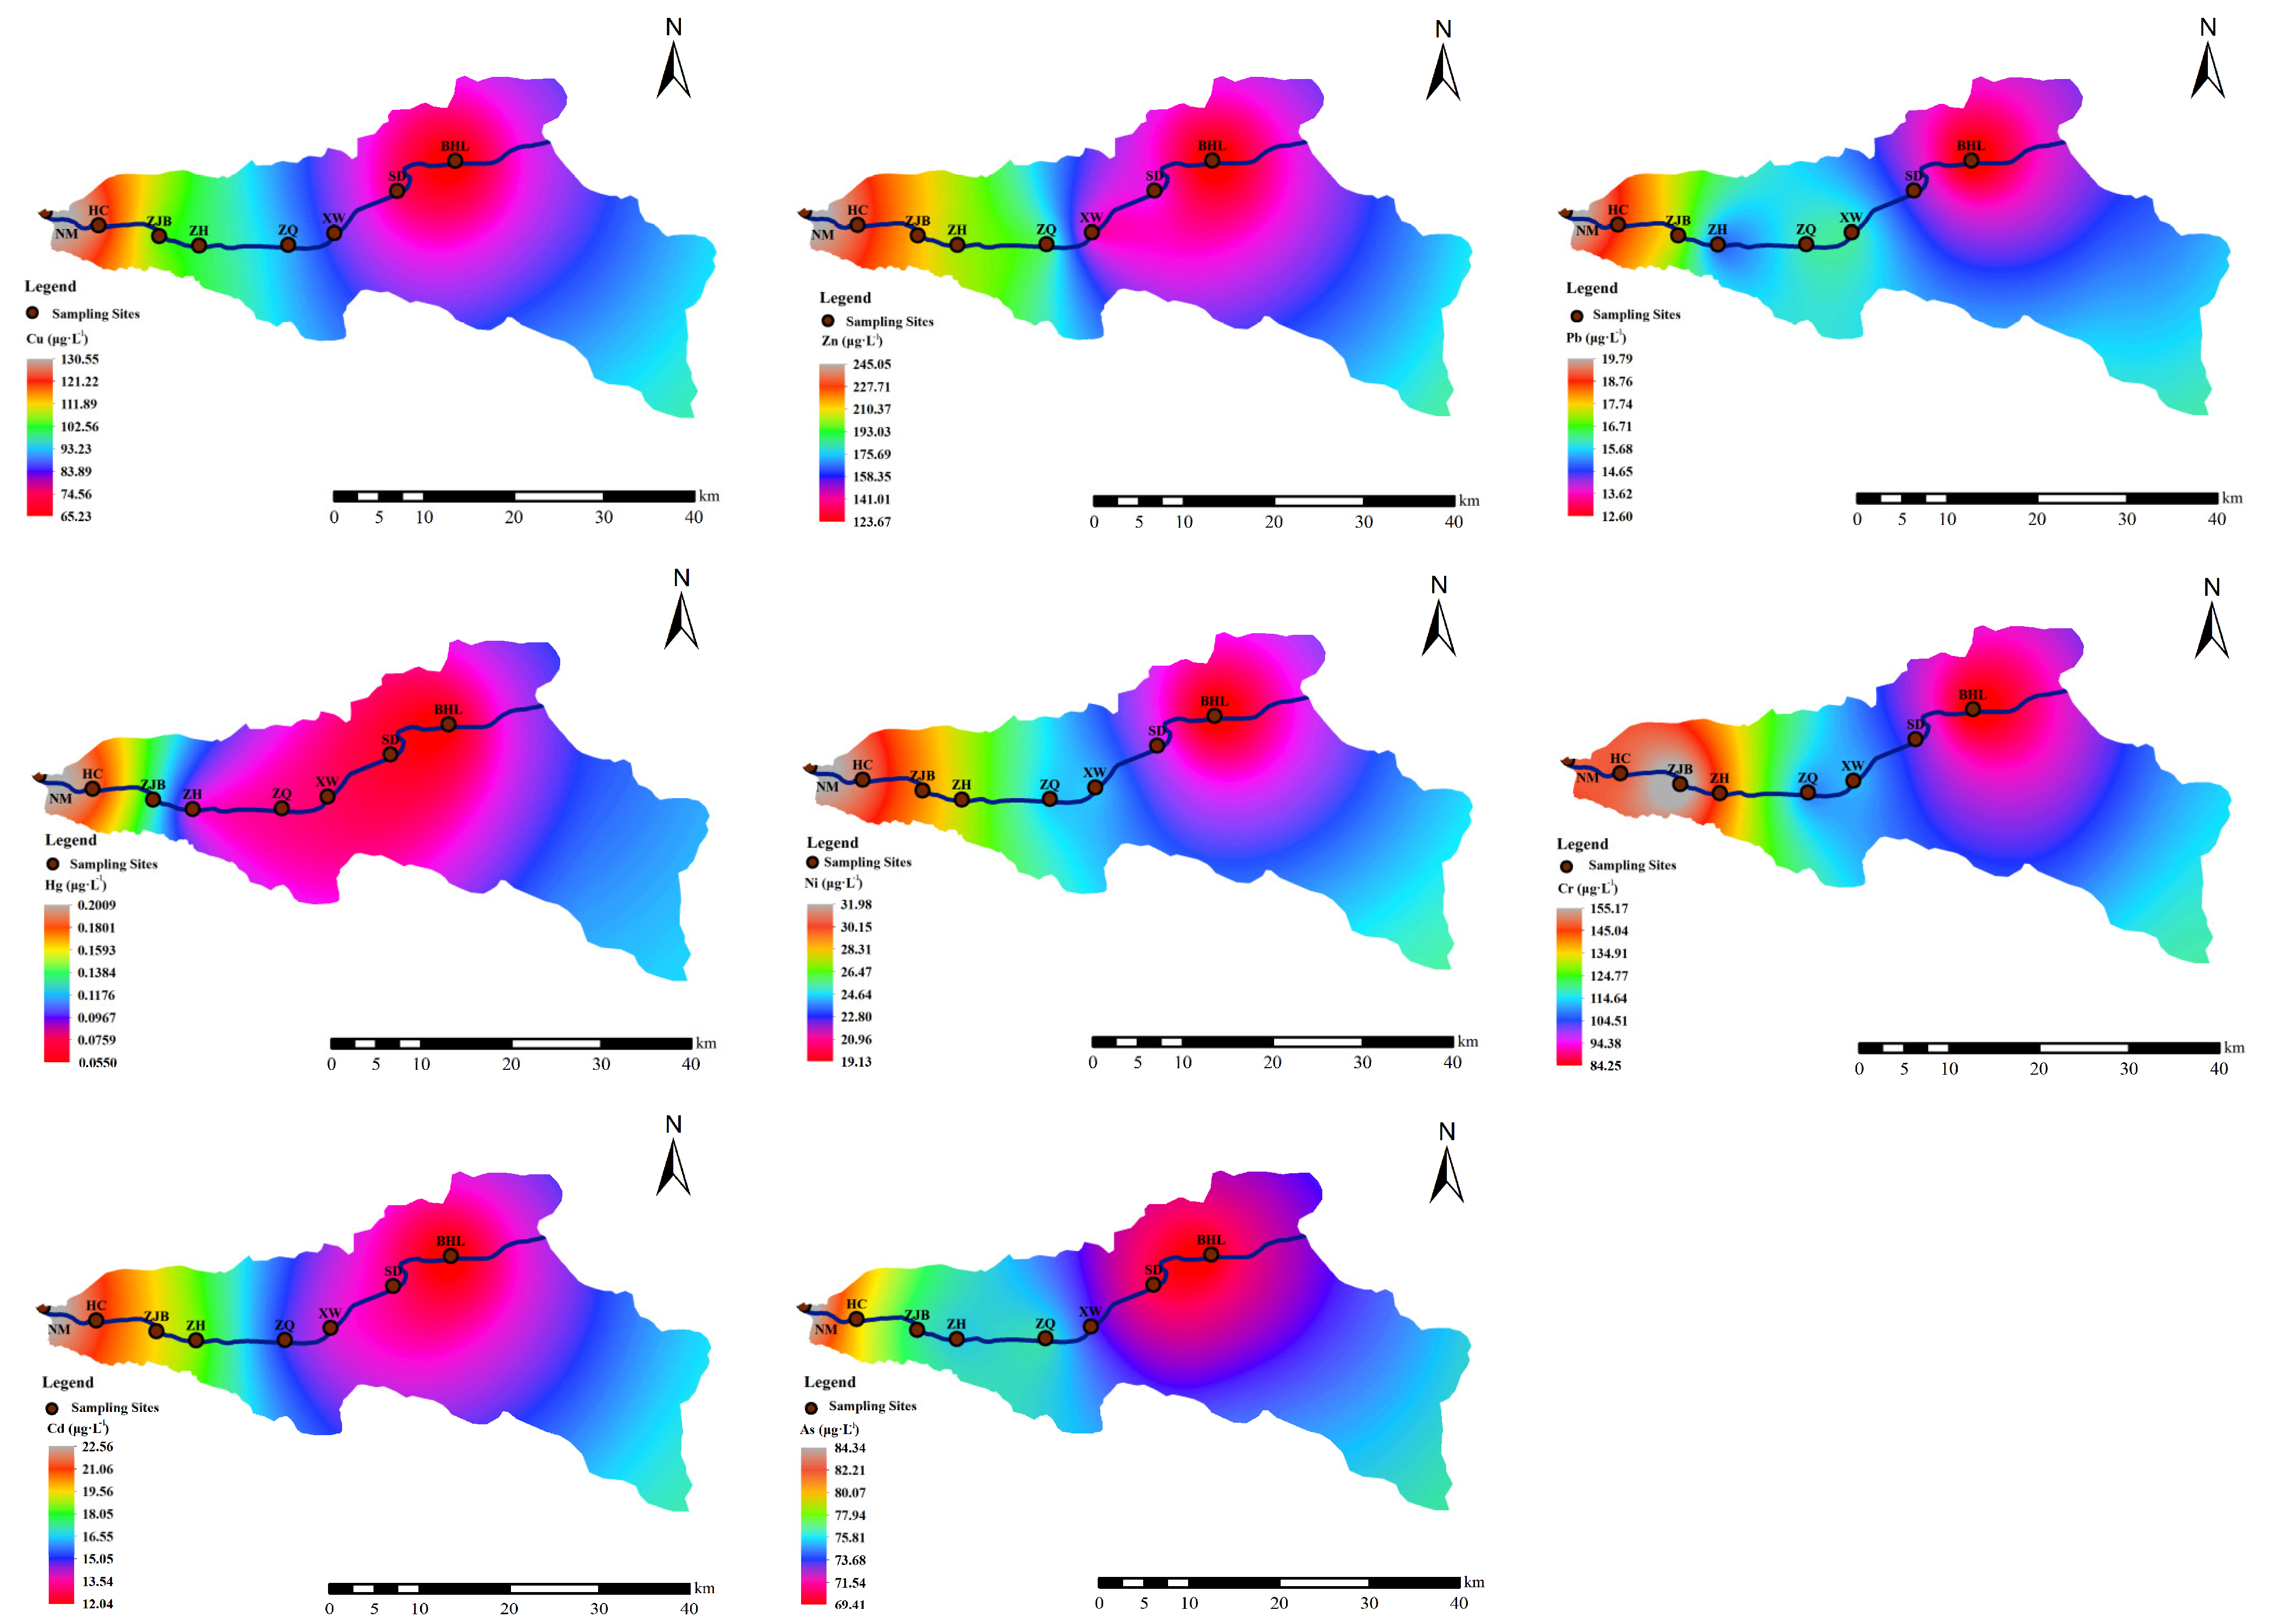
Overall, the concentrations of all the heavy metals in the study area increased from upstream to downstream (Figure 4), especially for Cu, Zn, Cr, Cd, and Hg. While, heavy metal distribution maps showed some distinct geographical trends, especially for Cu, Zn, and Hg, which were found in high concentrations in some special sampling sites. The hotspots of Cu and Zn were found in sampling site XW during November and December (Figure 5 and Figure 6), and the concentrations of Cu and Zn were relatively low at the other sampling sites. The sampling site XW was located near the national highway, and the developed transportation industry and the tertiary industry will have an impact on the concentrations of Cu and Zn in the surface water [34]. The hotspot of Hg was found in sampling sites ZJB, HC, and NM during December (Figure 7). It is interesting to note that these sampling sites coincided with wheat and corn planting areas in Taiyuan and Jinzhong; large quantities of phosphatic fertilizers and pesticides have been used for wheat and corn farming in this region in the past few decades based on our field investigation. Phosphatic fertilizers and pesticides have proven to be a significant source of some heavy metals including Hg, Cd, and Zn, which may partially explain the presence of the Hg, Cd, and Zn hotspots in these sampling sites [19].
The CV can reflect the average variation degree of the heavy metal concentration at various sampling sites. If the CV > 0.5, indicating that the spatial distribution of the heavy metal concentration is uneven, then there may be point source pollution caused by the entry of foreign substances [31]. The CV of Hg, Ni, and As in this study was greater than 0.5 (Table 1), indicating that point source pollution and non−point source pollution have influenced the concentrations of Hg, Ni, and As. Relevant research showed that cement plants and brick factories located in this region contributed 74% of Hg in soil [19], which would affect the surface water quality through the natural migration process. However, there were no other obvious point sources of Hg in the study area that were identified, such as steel smelting factories and coking industries. Hence, further investigation of the high concentrations of Hg in the sampling sites HC and NM may be required (Figure 7). The main point source of As in the agricultural irrigation area was the excessive application of pesticides, herbicides, and insecticides, and the main point source of Ni in the urban suburbs was the electroplating industry and architectural ornament industry [35]. As discussed above, on the premise of similar background values, point source pollution was the main factor for the spatial difference between Ni and As concentrations. In other words, the acceleration of agricultural modernization and the development of manual manufacturing, which could be the main point source, affected the concentrations of heavy metals in the study area.
To sum up, the analysis of the temporal and spatial distribution characteristics of heavy metals in the Xiaohe River irrigation area showed that there was a great correlation between the concentrations of heavy metals and the land use types on both banks of the river. The study area was located in the downstream of Xiaohe River. Agricultural land was the main land use type in this area. Therefore, heavy metals from agricultural fertilizers led to the concentrations of specific heavy metals (Hg, Cd, Cr) in this area being higher than the environmental background value. At the same time, our research also found that due to the rapid economic development of the region in recent years, the application of agricultural chemical fertilizer, the production activities of industrial and mining enterprises, and transportation activities were also the factors leading to the abnormally high concentrations of heavy metals in specific sampling sites (XW, HC, NM). Therefore, the concentrations of heavy metals in the surface water showed a generally increasing trend from upstream to downstream in the Xiaohe River irrigation area.
3.5. Source Analysis of Heavy Metal Pollution
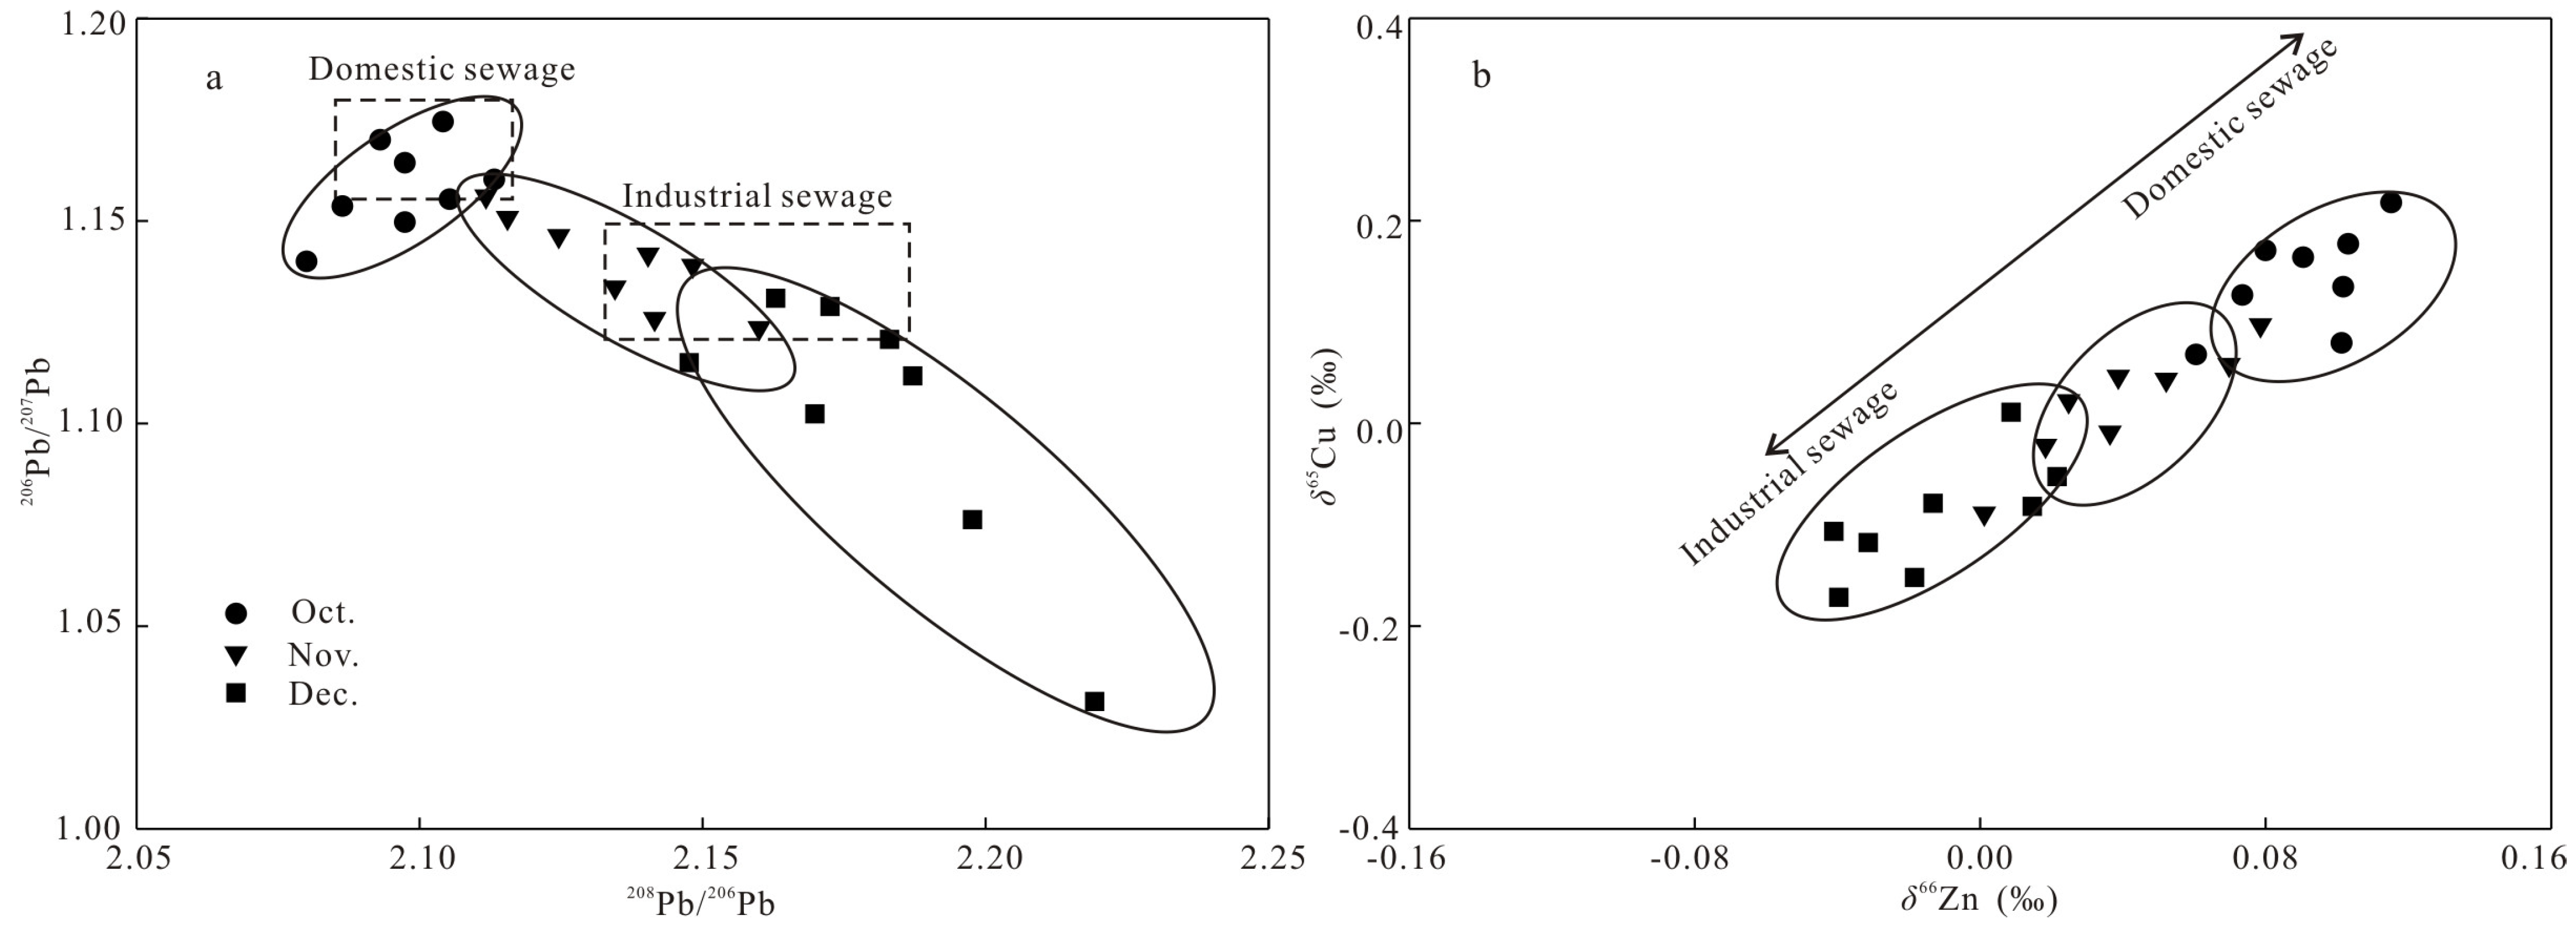
Accurately identifying pollution sources is the premise of heavy metal pollution prevention and control in urban rivers [23]. In this study, the concentration of Pb in 62.5% of the surface water samples exceeded the national environmental quality standard for surface water (Class II, GB3838–2002). Although the concentrations of Cu, Zn, and Pb in the surface water were lower than the national standard (Table 1, Figure 2), the concentrations were still higher compared with most urban agricultural areas in China [3,17,18]. Therefore, it is necessary to identify the main sources of Cu, Zn, and Pb, and provide a scientific basis for controlling their impact on agricultural ecosystems. Relevant studies showed that the isotopic composition of Cu, Zn, and Pb was relatively stable and rarely affected by natural processes such as geophysics and chemistry; moreover, there was no fractionation in agricultural farming and industrial processes. Therefore, Cu, Zn, and Pb isotopic tracer technology can be used as a geochemical indicator to effectively identify the potential sources of heavy metal pollutants [36,37,38].
Based on the analysis of heavy metal concentrations, we found that the heavy metal pollution of surface water in the study area has an obvious increasing trend among the three sampling times in October, November, and December (Figure 4). At the same time, the analysis of the Pb isotope illustrated that the 208Pb/206Pb showed an increasing trend during the sampling period, while the 206Pb/207Pb showed a decreasing trend (Table 2, Figure 3), especially in the sampling sites with excessive Pb concentrations (Figure 2). Relevant studies showed that the water body, sediment, and riparian soil of rivers with lower pollution degrees have the characteristics of lower 208Pb/206Pb and higher 206Pb/207Pb [39]. The results of this study are similar to those of previous studies [37,40]; that is, the heavy metal pollution of surface water in the Xiaohe River irrigation area was lowest in October, followed by November, and the heavy metal pollution was the most serious in December. Combined with the analysis of the spatial change of the heavy metal concentration, it can be inferred that the point source pollution around the sampling site is an important factor affecting the spatial change of the heavy metal concentration.
The distribution of Pd, Cu, and Zn isotopic compositions in the surface water from the Xiaohe River irrigation area during different months is shown in Figure 8. The isotopic composition of each sampling site in the study area was relatively scattered, while the isotopic composition of each sampling site is relatively concentrated in each month, especially in October and November. The distribution of 208Pb/206Pb and 206Pb/207Pb in each sampling site in December was relatively scattered, especially in the sampling sites located in the downstream area, such as ZH, ZJB, HC, and NM.
Relevant research shows that the 206Pb/207Pb ratio of sewage discharged from industrial production was 1.1302~1.1487, and the 208Pb/206Pb ratio was 2.1319~2.1701; while the 206Pb/207Pb ratio of urban domestic sewage and agricultural sewage was 1.1693~1.1741 and the 208Pb/206Pb ratio was 2.0947~2.1092 [41]. In this study, the composition of 208Pb/206Pb and 206Pb/207Pb in October was mainly distributed near the scope of domestic sewage (Figure 8a), indicating that the main source of heavy metals in the surface water in the study area in October was the discharge of domestic sewage. The industrial production activities in October in the study area almost stopped due to the rare rainstorm in Shanxi Province. Extreme precipitation events led to a large amount of surface runoff, scouring the surface soil in the study area in a short period of time. The domestic sewage discharged through surface overflow in the study area was mixed into the surface runoff and entered the river channel through various flood discharge ways, resulting in the obvious accumulation of heavy metals in the surface water in the river channel. The composition of 208Pb/206Pb and 206Pb/207Pb in November was mainly between the scopes of domestic sewage and industrial sewage (Figure 8a), indicating that the domestic sewage and industrial sewage were the main sources of heavy metals in the surface water in the study area in November. The field survey found that the land use types within the study area are diverse, mainly including agricultural areas, urban residential living areas, and industrial areas. The industrial areas are distributed with furniture factories, plastic products factories, chemical plants, and other enterprises. The discharge of industrial sewage produced by these enterprises leads to the accumulation of heavy metals in the surface water in varying degrees. The composition of 208Pb/206Pb and 206Pb/207Pb in December was relatively dispersed, and close to the distribution range of industrial sewage, indicating that the discharge of industrial sewage was the main source of heavy metals in the surface water in the study area in December. Compared with the other six sampling sites, the 206Pb/207Pb ratio of sampling sites HC and NM was significantly lower, while the 208Pb/206Pb ratio was significantly higher. The sampling sites HC and NM were located in the Xiaohe River industrial park under construction. The concentration of Pb in the surface water was significantly higher due to a large number of civil engineering, steel structure engineering, and transportation vehicles in the park which consume a lot of fuel (Figure 2 and Figure 8a). The results of this study were consistent with the conclusions of the research on the surface sediments of the Barents Sea [36].
When δ65Cu and δ66Zn in surface runoff were higher, the main sources of heavy metals in surface water were domestic sewage and agricultural sewage, while when δ65Cu and δ66Zn were lower, the main sources of heavy metals in the surface water were industrial sewage [37,42]. The distribution of δ65Cu and δ66Zn in the surface water in the Xiaohe River irrigation area (Figure 8b) was consistent with this conclusion. Combined with the analysis of the temporal and spatial variation of the heavy metal concentration and the composition distribution of 208Pb/206Pb and 206Pb/207Pb, it can be seen that the sources of domestic sewage and agricultural sewage of heavy metals in the surface water were reduced due to the decrease in upstream inflow and agricultural production activities in the dry season, while the discharge of industrial sewage had no significant change. Therefore, the temporal distribution of heavy metal pollution sources changed significantly, but the spatial distribution change was not obvious.
To sum up, based on the analysis of the temporal and spatial variation of heavy metals, combined with the application of the Cu, Zn, and Pb multi−isotopic tracer technique, the sources of heavy metal pollutants in the Xiaohe River irrigation area can be tracked and analyzed more accurately. At the same time, the results of this study also showed that industrial sewage was the main pollution source of surface water in the Xiaohe River irrigation area, and the influence of urban sewage and agricultural sewage on the heavy metal concentration in the surface water cannot be ignored.
3.6. Health Risk Assessment of Heavy Metal Pollution
According to the compositions of heavy metals in the surface water of the Xiaohe River irrigation area, the health risk caused by heavy metal pollutants in the surface water through drinking water can be calculated according to the water environment health risk assessment model and parameter selection. Average personal annual health risks caused by heavy metal pollutants for adults and children are shown in Table 3 and Table 4, respectively.
The average personal annual health risks caused by Cr, Cd, and As to adults through drinking water were 1.29 × 10⁻², 2.77 × 10⁻⁴, and 2.41 × 10⁻³ (Table 3), and to children were 1.62 × 10⁻², 3.54 × 10⁻⁴, and 3.06 × 10⁻³ (Table 4), respectively. The International Commission on Radiation Protection (ICRP) stipulated that the maximum acceptable human level of Cr and As was 5 × 10⁻⁵ a−1 [43]. In this study, the per capita annual carcinogenic risk of Cr and As exceeded the recommended value. Therefore, Cr and As were the main potency factors in the surface water of the Xiaohe River irrigation area, especially Cr, which should be prioritized for the control of pollutants in the study area. Although the per capita annual health risk value of Cd was far lower than that of Cr and As, it also exceeds the recommended value of ICRP, which should be given more attention by the government departments and environmental protection agencies.
The average personal annual health risks caused by Cu, Zn, Pb, Hg, and Ni to adults through drinking water were 5.03 × 10⁻⁸, 2.20 × 10⁻⁹, 3.18 × 10⁻⁸, 7.91 × 10⁻¹⁰, and 3.28 × 10⁻⁹ (Table 3), and to children were 6.42 × 10−80, 2.58 × 10⁻⁹, 4.05 × 10⁻⁸, 1.01 × 10⁻⁹, and 4.19 × 10⁻⁹ (Table 4), respectively. The health risk values of these heavy metals were on the order of 10−11 to 10−9, which were considered an acceptable risk level due to the proportion being very low compared to that of Cr, Cd, and As (10−5 to 10−3).
In this study, the average personal annual health risks caused by heavy metals were in the following order Cr > As > Cd > Pb > Cu > Zn > Ni > Hg, respectively. Since the health risk values caused by Cr, Cd, and As were 106 times that caused by the other five heavy metals, it can be considered that the health risk of heavy metals in the surface water of the Xiaohe River irrigation area mainly depends on Cr, Cd, and As. Therefore, it is particularly urgent to control the pollution sources of Cr, Cd, and As in the study area, such as controlling the emission of industrial point source pollution and nonpoint source pollution of tertiary industry. This result is consistent with the previous results of temporal and spatial variation of heavy metals, and also consistent with other relevant research conclusions [44,45,46]. In addition, although the concentrations of Cu and Zn were lower than the national standard, the health risk value exceeded that of Ni and Hg, which is also worthy of attention.
Total health risks caused by heavy metal pollutants in the surface water from the Xiaohe River irrigation area are shown in Table 5. Compared with adults, the risk of heavy metal pollutants in the surface water to children was significantly higher. The , , and of heavy metal pollutants for children were 1.26 times, 1.26 times, and 1.28 times higher than that of adults, respectively. Therefore, heavy metal pollutants in the surface water in the study area have a greater impact on children, and children were more sensitive risk receptors for heavy metal pollutants in the surface water. More strict drinking water management means and more direct control methods are particularly important to improve the current situation in the study area.
It is worth noting that the water environment health risk assessment model used in this study was the recommended method by the US EPA, and all parameters were international general coefficients. In the process of health risk assessment, only heavy metal pollutants are calculated, without considering the additive, synergistic, and antagonistic effects of different heavy metals on the human body, as well as the effects of other factors, such as fruits, vegetables, grains, etc. The water body enriched with heavy metals will affect the soil, crops, and even the air, and then enter the human body through the food chain. A small number of heavy metals enter the human body through direct drinking water and skin contact with the water body. Therefore, in agricultural irrigation areas, the risks of surface water to human health are mostly indirect rather than direct. At the same time, due to the short sampling period and frequency, the impact of organic pollutants, microorganisms, and radioactive water quality indicators was also not considered, so the conclusion of the health risk assessment may be different from the actual situation in the field of the study area. For example, all the concentrations of Cr and Cd in the eight sampling sites in this study exceeded the national environmental quality standard for surface water (Class II, GB3838–2002), and only the concentration of As at sampling site NM exceeded the national standard (Figure 2). However, relevant studies showed that As has a certain carcinogenic risk [47]. The results of the water environment health risk assessment also showed that Cr and As were the main potency factors of the surface water in the Xiaohe River irrigation area. The total health risk values of Cr and As are 46.65 times, 8.69 times (adults), and 45.88 times, 8.66 times (children) of Cd, respectively, which may be related to the toxicity of different heavy metals [25,26]. In addition, due to the diversity of the pathways through which heavy metal pollutants enter the human body, we only considered the drinking water in this study, excluding food intake, skin contact, and air inhalation. The eating habits, consumption habits, occupation types, and personal physique in the study area will also have an impact on the evaluation results [23]. Therefore, it is necessary to adopt more perfect, comprehensive, objective, and complex evaluation methods for future research.
4. Conclusions
Our research showed the levels, sources, and distribution of heavy metals in the surface water from the Xiaohe River irrigation area in the Loess Plateau, China, over a short term. The concentrations of heavy metals in the surface water were in the following order Zn > Cr > Cu > As > Ni > Cd > Pb > Hg. The concentrations of Pb, Hg, Ni, Cr, Cd, and As exceeded the national environmental quality standard for surface water (Class II, GB3838–2002) in varying degrees. Compared with international standards, the heavy metal concentrations were often within the allowable limits for irrigation, except Cd. The abundance of all heavy metals showed an upward trend from upstream to downstream. The concentrations of heavy metals in the surface water in October were significantly lower than that in November and December due to the impact of extreme precipitation events. Transportation and tertiary industry have an impact on the concentrations of Cu and Zn, and the pesticides and fertilizers applied in agricultural production increased the concentrations of Cd and Hg in the study area.
Point source pollution was the main factor affecting the spatial distribution of heavy metals. Industrial sewage was the main pollution source of surface water in the Xiaohe River irrigation area, and the impact of urban domestic sewage and agricultural production activities on the concentration of heavy metals in the surface water cannot be ignored. It is necessary to improve the enterprise process level and sewage discharge control, strengthen the construction of urban rainwater and sewage pipe network, and reduce unnecessary pesticide applications in agricultural production for the control of point source pollution in the study area.
The average personal annual health risks caused by heavy metals were in the following order Cr > As > Cd > Pb > Cu > Zn > Ni > Hg, respectively. Cr and As were the main potency factors, especially Cr. Although the average personal annual health risk value of Cd was far lower than that of Cr and As, it also exceeded the recommended value of ICRP. It should be pointed out that this study is a preliminary study; the high accumulation of heavy metals in water, soil, and the human body may lead to cancer in the future. Heavy metal pollutants in the surface water in the study area cause greater harm to children than to adults. More strict drinking water management means and more direct water pollution remediation methods are needed to control the health risks of heavy metals in the study area.
Author Contributions
Z.M. writing—review and editing the manuscript and provided methodology; X.B. provided visualization and results of statistical analysis and the software; X.T. provided the funding acquisition and writing—review of the manuscript. All authors have read and agreed to the published version of the manuscript.
Funding
This research was funded by the Science and Technology Innovation Project of Shanxi Provincial Education Department (2019L0811) and National Natural Science Foundation of China (grant numbers 42101104).
Acknowledgments
The authors are grateful to the anonymous reviewers for their useful comments and detailed suggestions for this manuscript. Sincere appreciation also goes to Haibin Liang and Jie Wang for their kind help in participating in field and laboratory work.
Conflicts of Interest
The authors declare no conflict of interest. The funders had no role in the writing of the manuscript; or in the decision to publish the results.
References
- Karasali, H.; Marousopoulou, A.; Machera, K. Pesticide residue concentration in soil following conventional and Low−Input Crop Management in a Mediterranean agro−ecosystem, in Central Greece. Sci. Total Environ. 2016, 15, 130–142. [Google Scholar] [CrossRef] [PubMed]
- Mondal, P.; Srivastava, P.; Kalin, L.; Panda, S.N. Ecologically sustainable surface water withdrawal for cropland irrigation through incorporation of climate variability. J. Soil Water Conserv. 2011, 66, 221–232. [Google Scholar] [CrossRef] [Green Version]
- Qin, G.W.; Niu, Z.D.; Yu, J.D.; Li, Z.H.; Ma, J.Y.; Xiang, P. Soil heavy metal pollution and food safety in China: Effects, sources and removing technology. Chemosphere 2021, 267, 129205. [Google Scholar] [CrossRef] [PubMed]
- Liu, L.W.; Wei, L.; Song, W.P.; Guo, M.X. Remediation techniques for heavy metal−contaminated soils: Principles and applicability. Sci. Total Environ. 2018, 633, 206–219. [Google Scholar] [CrossRef]
- Maghrebi, M.; Noori, R.; Bhattarai, R.; Mundher Yaseen, Z.; Tang, Q.H.; Al–Ansari, N.; Danandeh Mehr, A.; Karbassi, A.; Omidvar, J.; Farnoush, H.; et al. Iran’s agriculture in the Anthropocene. Earth’s Future 2020, 8, e2020EF001547. [Google Scholar] [CrossRef]
- Wei, O.Y.; Wang, Y.D.; Lin, C.Y.; He, M.C.; Hao, F.H.; Liu, H.B.; Zhu, W.H. Heavy metal loss from agricultural watershed to aquatic system: A scientometrics review. Sci. Total Environ. 2018, 637–638, 208–220. [Google Scholar]
- Liang, C.Z.; Xiao, H.J.; Hu, Z.Q.; Zhang, X.; Hu, J. Uptake, transportation, and accumulation of C−60 fullerene and heavy metal ions (Cd, Cu, and Pb) in rice plants grown in an agricultural soil. Environ. Pollut. 2018, 235, 330–338. [Google Scholar] [CrossRef]
- Xie, S.W.; Yang, F.; Feng, H.X.; Wei, C.Y.; Wu, F.C. Assessment of potential heavy metal contamination in the peri−urban agricultural soils of 31 provincial capital cities in China. Environ. Manag. 2019, 64, 366–380. [Google Scholar] [CrossRef]
- Negahban, S.; Mokarram, M.; Pourghasemi, H.R.; Zhang, H.C. Ecological risk potential assessment of heavy metal contaminated soils in Ophiolitic formations. Environ. Res. 2020, 192, 110305. [Google Scholar] [CrossRef]
- Khan, S.; Cao, Q.; Zheng, Y.M.; Zhu, Y.G. Health risks of heavy metals in contaminated soils and food crops irrigated with wastewater in Beijing, China. Environ. Pollut. 2008, 152, 686–692. [Google Scholar] [CrossRef]
- Barsova, N.; Yakimenko, O.; Tolpeshta, I.; Motuzova, G. Current state and dynamics of heavy metal soil pollution in Russian Federation—A review. Environ. Pollut. 2019, 249, 200–207. [Google Scholar] [CrossRef] [PubMed]
- Maskooni, E.K.; Rad, M.N.; Berndtsson, R.; Nakagawa, K. Use of heavy metal content and modified water quality index to assess groundwater quality in a semiarid area. Water. 2020, 12, 1115. [Google Scholar] [CrossRef] [Green Version]
- Zhang, X.W.; Yan, Y.; Syed, A.W.; Sun, Q.Q.; Guo, B.L. Source apportionment of cadmium pollution in agricultural soil based on cadmium isotope ratio analysis. Appl. Geochem. 2020, 123, 104776. [Google Scholar] [CrossRef]
- Kang, M.J.; Kwon, Y.K.; Yu, S.; Lee, P.K.; Park, H.S.; Song, N. Assessment of Zn pollution sources and apportionment in agricultural soils impacted by a Zn smelter in South Korea. J. Hazard. Mater. 2019, 364, 475–487. [Google Scholar] [CrossRef] [PubMed]
- Yu, D.Y.; Wang, J.R.; Wang, Y.H.; Du, X.L.; Li, G.C.; Li, B. Identifying the source of heavy metal pollution and apportionment in agricultural soils impacted by different smelters in China by the positive matrix factorization model and the Pb isotope ratio method. Sustainability 2021, 13, 6526. [Google Scholar] [CrossRef]
- Lermi, A.; Sunkari, E.D. Geochemistry, risk assessment and Pb isotopic evidence for sources of heavy metals in stream sediments around the Ulukla Basin, Nide, southern Turkey. Turk. J. Earth. Sci. 2020, 29, 1167–1188. [Google Scholar] [CrossRef]
- Zhao, L.; Wang, L.X.; Yi, X.; Mao, Q.N.; Liu, Y. The water source situation and crises of the irrigation areas on the Loess Plateau at the origin of the Silk Road, China. Environ. Earth. Sci. 2016, 75, 1144. [Google Scholar]
- Qi, H.X.; Zhao, B.Q.; Li, L.H.; Chen, X.L. Heavy metal contamination and ecological risk assessment of the agricultural soil in Shanxi Province, China. R. Soc. Open Sci. 2020, 7, 200538. [Google Scholar] [CrossRef]
- Qi, H.X.; Chen, X.L.; Du, Y.E.; Niu, X.J.; Guo, F.; Li, W.X. Cancer risk assessment of soils contaminated by polycyclic aromatic hydrocarbons in Shanxi, China. Ecotox. Environ Safe. 2019, 182, 109381. [Google Scholar] [CrossRef]
- Nuapia, Y.; Chimuka, L.; Cukrowska, E. Assessment of heavy metals in raw food samples from open markets in two African cities. Chemosphere 2017, 196, 339–346. [Google Scholar] [CrossRef]
- Luo, Q.; Bei, E.; Liu, C.; Deng, Y.L.; Miao, Y.; Qiu, Y.; Lu, W.Q.; Chen, C.; Zeng, Q. Spatial, temporal variability and carcinogenic health risk assessment of nitrosamines in a drinking water system in China. Sci. Total Environ. 2020, 736, 139695. [Google Scholar] [CrossRef] [PubMed]
- Kerger, B.D.; Paustenbach, D.J.; Corbett, G.E.; Finley, B.L. Absorption and elimination of trivalent and hexavalent chromium in humans following ingestion of a bolus dose in drinking water. Toxicol. Appl. Pharmacol. 1996, 141, 145. [Google Scholar] [CrossRef]
- USEPA. 822−S−12−001 2006. Edition of the Drinking Water Standards and Health Advisories; USEPA: Washington, DC, USA, 2006. [Google Scholar]
- Ministry of Environmental Protection. Exposure Factors Handbook of Chinese Population (Adult Volume); China Environmental Press: Beijing, China, 2013. [Google Scholar]
- Ministry of Environmental Protection. Exposure Factors Handbook of Chinese Population (0~5 Years); China Environmental Press: Beijing, China, 2016. [Google Scholar]
- Aradpour, S.; Noori, R.; Tang, Q.H.; Bhattarai, R. Metal contamination assessment in water column and surface sediments of a warm monomictic man−made lake: Sabalan Dam Reservoir, Iran. Hydrol. Res. 2020, 51, 799–814. [Google Scholar] [CrossRef]
- Othman, Y.A.; Al−Assaf, A.; Tadros, M.J.; Albalawneh, A. Heavy Metals and Microbes Accumulation in Soil and Food Crops Irrigated with Wastewater and the Potential Human Health Risk: A Metadata Analysis. Water 2021, 13, 3405. [Google Scholar] [CrossRef]
- CMEE (China Ministry of Ecology and Environment). National Environmental Quality Standard for Surface Water (GB3838–2002); China Environmental Science Press: Beijing, China, 2002. (In Chinese) [Google Scholar]
- MOH (China Ministry of Health). National Sanitary Standard for Drinking Water (GB5749−2006); MOH (China Ministry of Health): Beijing, China, 2002. (In Chinese) [Google Scholar]
- CMEE (China Ministry of Ecology and Environment). National Water Quality Standard for Farmland Irrigation (GB5084−2021); China Environmental Science Press: Beijing, China, 2021. (In Chinese) [Google Scholar]
- Dahmouni, M.; Hoermann, G.; Jouzdan, O.; Hachicha, M. Spatio−temporal variability of hydrochemical parameters and heavy metals in shallow groundwater of the area of Cebala−Borj−Touil, irrigated with treated wastewater (Tunisia). Environ. Earth. Sci. 2019, 78, 57. [Google Scholar] [CrossRef]
- Liu, R.M.; Guo, L.J.; Men, C.; Wang, Q.R.; Miao, Y.X.; Shen, Z.Y. Spatial−temporal variation of heavy metals’ sources in the surface sediments of the Yangtze River Estuary. Mar. Pollut. Bull. 2019, 138, 526–533. [Google Scholar] [CrossRef]
- Suteja, Y.; Atmadipoera, A.S.; Riani, E.; Nurjaya, I.W.; Nugroho, D.; Cordova, M.R. Spatial and temporal distribution of microplastic in surface water of tropical estuary: Case study in Benoa Bay, Bali, Indonesia. Mar. Pollut. Bull. 2021, 163, 111979. [Google Scholar] [CrossRef]
- Baglaeva, E.M.; Sergeev, A.P.; Shichkin, A.V.; Buevich, A.G. The extraction of the training subset for the spatial distribution modelling of the heavy metals in topsoil. Catena. 2021, 207, 105699. [Google Scholar] [CrossRef]
- Lei, L.; Ma, Y.B.; Zhang, S.Z.; Wei, D.P.; Zhu, Y.G. An inventory of trace element inputs to agricultural soils in China. J. Environ. Manag. 2009, 90, 2524–2530. [Google Scholar]
- Maslov, A.V.; Kuznetsov, A.B.; Politova, N.V.; Shevchenko, V.P. Distribution of Trace and Rare−Earth Elements, and Nd, Pb, and Sr Isotopes in the Surface Sediments of the Barents Sea. Geochem. Int. 2020, 58, 566–582. [Google Scholar] [CrossRef]
- Fekiacova, Z.; Cornu, S.; Pichat, S. Tracing contamination sources in soils with Cu and Zn isotopic ratios. Sci. Total Environ. 2015, 517, 96–105. [Google Scholar] [CrossRef] [PubMed] [Green Version]
- Sun, J.W.; Yu, R.L.; Hu, G.R.; Su, G.M.; Zhang, Y.F. Tracing of heavy metal sources and mobility in a soil depth profile via isotopic variation of Pb and Sr. Catena 2018, 171, 440–449. [Google Scholar] [CrossRef]
- He, B.H.; Zhao, X.L.; Li, P.; Liang, J.J.; Fan, Q.H.; Ma, X.X.; Zheng, G.D.; Qiu, J.L. Lead isotopic fingerprinting as a tracer to identify the pollution sources of heavy metals in the southeastern zone of Baiyin, China. Sci. Total Environ. 2019, 660, 348–357. [Google Scholar] [CrossRef] [PubMed]
- Bird, G. Provenancing anthropogenic Pb within the fluvial environment: Developments and challenges in the use of Pb isotopes. Environ. Int. 2011, 37, 802–819. [Google Scholar] [CrossRef] [PubMed]
- Resongles, E.; Casiot, C.; Freydier, R.; Dezileau, L.; Viers, J.; Elbaz–Poulichet, F. Persisting impact of historical mining activity to metal (Pb, Zn, Cd, Tl, Hg) and metalloid (As, Sb) enrichment in sediments of the Gardon River, Southern France. Sci. Total Environ. 2014, 481, 509–521. [Google Scholar] [CrossRef] [PubMed]
- Thapalia, A.; Borrok, D.M.; Metre, P.C.V.; Musgrove, M.; Landa, E.R. Zn and Cu isotopes as tracers of anthropogenic contamination in a sediment core from an urban lake. Environ. Sci. Technol. 2010, 44, 1544–1550. [Google Scholar] [CrossRef]
- US Environment Protection Agency. Available Information on Assessing Exposure from Pesticides in Food: A User’s Guide; US EPA: Washington, DC, USA, 2000; pp. 14–16. [Google Scholar]
- Song, T.J.; An, Y.; Cui, G.; Tong, S.Z. Bioconcentrations and health risk assessment of heavy metals in crops in the Naoli River Basin agricultural area, Sanjiang Plain, China. Environ. Earth. Sci. 2021, 80, 1–10. [Google Scholar] [CrossRef]
- Adeyemi, A.A.; Ojekunle, Z.O. Concentrations and health risk assessment of industrial heavy metals pollution in groundwater in Ogun state, Nigeria. Scientific African 2020, 11, 666. [Google Scholar] [CrossRef]
- Zeng, X.F.; Wang, Z.W.; Wang, J.; Guo, J.T.; Chen, X.J.; Zhang, J. Health risk assessment of heavy metals via dietary intake of wheat grown in Tianjin sewage irrigation area. Ecotoxicology 2015, 24, 2115–2124. [Google Scholar] [CrossRef]
- Aradpour, S.; Noori, R.; Naseh, M.R.V.; Hosseinzadeh, M.; Safavi, S.; Ghahraman–Rozegar, F.; Maghrebi, M. Alarming carcinogenic and non−carcinogenic risk of heavy metals in Sabalan dam reservoir, Northwest of Iran. Environ. Pollut. Bioavail. 2021, 33, 278–291. [Google Scholar] [CrossRef]
Figure 1.
Location of the sampling sites in the study area (the elevation of this map was derived from digital elevation model (DEM)).
Figure 1.
Location of the sampling sites in the study area (the elevation of this map was derived from digital elevation model (DEM)).

Figure 2.
Average concentration of heavy metals in the surface water from Xiaohe River irrigation area (μg·L−1). Dotted line for the national environmental quality standard for surface water (Class II, GB 3838–2002).
Figure 2.
Average concentration of heavy metals in the surface water from Xiaohe River irrigation area (μg·L−1). Dotted line for the national environmental quality standard for surface water (Class II, GB 3838–2002).

Figure 3.
Isotopic compositions of Cu, Zn, and Pb in the surface water from Xiaohe River irrigation area during different months.
Figure 3.
Isotopic compositions of Cu, Zn, and Pb in the surface water from Xiaohe River irrigation area during different months.

Figure 4.
Temporal distribution characteristics of heavy metals in the surface water from Xiaohe River irrigation area during different months (μg·L−1).
Figure 4.
Temporal distribution characteristics of heavy metals in the surface water from Xiaohe River irrigation area during different months (μg·L−1).

Figure 5.
Spatial distribution characteristics of heavy metals in the surface water from Xiaohe River irrigation area in October (μg·L−1).
Figure 5.
Spatial distribution characteristics of heavy metals in the surface water from Xiaohe River irrigation area in October (μg·L−1).

Figure 6.
Spatial distribution characteristics of heavy metals in the surface water from Xiaohe River irrigation area in November (μg·L−1).
Figure 6.
Spatial distribution characteristics of heavy metals in the surface water from Xiaohe River irrigation area in November (μg·L−1).

Figure 7.
Spatial distribution characteristics of heavy metals in the surface water from Xiaohe River irrigation area in December (μg·L−1).
Figure 7.
Spatial distribution characteristics of heavy metals in the surface water from Xiaohe River irrigation area in December (μg·L−1).

Figure 8.
Relationship between 208Pb/206Pb and 206Pb/207Pb (a), δ65Cu and δ66Zn (b) in the surface water from Xiaohe River irrigation area during different months.
Figure 8.
Relationship between 208Pb/206Pb and 206Pb/207Pb (a), δ65Cu and δ66Zn (b) in the surface water from Xiaohe River irrigation area during different months.


Table 1.
Heavy metal concentrations in the surface water from Xiaohe River irrigation area (μg·L−1).
Table 1.
Heavy metal concentrations in the surface water from Xiaohe River irrigation area (μg·L−1).
| Sampling Time | Sampling Site | Cu | Zn | Pb | Hg | Ni | Cr | Cd | As |
|---|---|---|---|---|---|---|---|---|---|
| October | BHL | 25.34 | 78.15 | 3.49 | 0.011 | 5.49 | 22.45 | 4.55 | 7.12 |
| SD | 21.05 | 69.45 | 4.59 | 0.013 | 4.84 | 24.41 | 5.1 | 6.25 | |
| XW | 58.46 | 120.32 | 5.11 | 0.016 | 6.19 | 36.15 | 5.36 | 8.03 | |
| ZQ | 47.44 | 128.26 | 8.16 | 0.014 | 6.44 | 45.78 | 5.11 | 7.46 | |
| ZH | 50.02 | 138.11 | 4.25 | 0.022 | 6.77 | 55.09 | 5.47 | 9.23 | |
| ZJB | 49.16 | 106.54 | 6.15 | 0.021 | 6.71 | 57.49 | 5.85 | 9.55 | |
| HC | 53.26 | 158.14 | 7.48 | 0.032 | 7.11 | 63.59 | 8.12 | 8.49 | |
| NM | 54.11 | 187.45 | 8.59 | 0.048 | 8.03 | 66.78 | 9.02 | 9.67 | |
| November | BHL | 32.48 | 94.58 | 8.94 | 0.041 | 13.58 | 59.16 | 10.44 | 22.64 |
| SD | 30.24 | 92.03 | 10.25 | 0.039 | 14.12 | 70.51 | 11.2 | 28.49 | |
| XW | 72.23 | 140.11 | 10.45 | 0.048 | 15.22 | 89.26 | 10.2 | 35.12 | |
| ZQ | 49.11 | 151.24 | 11.24 | 0.051 | 14.97 | 88.16 | 10.35 | 39.66 | |
| ZH | 55.26 | 165.22 | 9.48 | 0.049 | 19.21 | 95.26 | 11.46 | 40.15 | |
| ZJB | 54.37 | 178.55 | 12.11 | 0.067 | 20.33 | 94.16 | 13.45 | 50.11 | |
| HC | 62.11 | 201.34 | 16.45 | 0.077 | 21.94 | 99.78 | 14.41 | 54.44 | |
| NM | 66.97 | 235.79 | 17.19 | 0.081 | 22.89 | 98.16 | 14.79 | 58.19 | |
| December | BHL | 65.18 | 123.55 | 12.03 | 0.055 | 19.11 | 84.16 | 12.03 | 68.78 |
| SD | 69.94 | 142.01 | 14.15 | 0.059 | 21.55 | 100.26 | 13.01 | 69.44 | |
| XW | 80.36 | 136.25 | 16.48 | 0.064 | 24.36 | 112.23 | 13.55 | 72.13 | |
| ZQ | 89.16 | 187.54 | 16.12 | 0.066 | 24.19 | 107.19 | 14.59 | 77.06 | |
| ZH | 99.48 | 198.66 | 13.54 | 0.071 | 27.64 | 142.25 | 18.41 | 74.16 | |
| ZJB | 102.35 | 211.25 | 17.89 | 0.124 | 29.13 | 155.29 | 19.25 | 75.45 | |
| HC | 124.15 | 231.02 | 18.55 | 0.187 | 31.02 | 145.48 | 21.03 | 78.11 | |
| NM | 130.58 | 245.11 | 20.31 | 0.201 | 31.99 | 146.79 | 22.57 | 86.47 | |
| Mean | 64.28 | 155.03 | 11.38 | 0.06 | 16.78 | 85.83 | 11.64 | 41.51 | |
| Sd. | 27.83 | 48.97 | 4.86 | 0.05 | 8.69 | 36.85 | 5.07 | 28.33 | |
| CV | 0.43 | 0.32 | 0.43 | 0.79 | 0.52 | 0.43 | 0.44 | 0.68 | |
| National environmental quality standard for surface water (Class II, GB3838–2002) [28] | 1000 | 1000 | 10 | 0.05 | 20 | 50 | 5 | 50 | |
| National sanitary standard for drinking water (GB5749−2006) [29] | 1000 | 1000 | 10 | 1 | 20 | 50 | 5 | 10 | |
| National water quality standard for farmland irrigation (GB5084−2021) [30] | 1000 | 2000 | 200 | 1 | 200 | 100 | 10 | 100 | |
| International standards (WHO) [27] | 200 | 2000 | 5000 | 10 | 200 | 50 | 10 | 100 | |
Table 2.
Isotopic compositions of Cu, Zn, and Pb in the surface water from Xiaohe River irrigation area.
Table 2.
Isotopic compositions of Cu, Zn, and Pb in the surface water from Xiaohe River irrigation area.
| δ65Cu | δ66Zn | 207Pb/206Pb | 208Pb/206Pb | 207Pb/204Pb | 208Pb/204Pb | 206Pb/204Pb | |
|---|---|---|---|---|---|---|---|
| Max | +0.31 | +0.14 | 0.91 | 2.33 | 15.32 | 39.8 | 18.7 |
| Min | −0.28 | −0.08 | 0.88 | 2.01 | 14.71 | 36.8 | 17.2 |
| Mean | +0.06 | +0.04 | 0.89 | 2.16 | 15.00 | 37.9 | 18.1 |
| CV | 0.08 | 0.06 | 0.05 | 0.07 | 0.12 | 0.25 | 0.21 |
| SD | 0.05 | 0.06 | 0.07 | 0.10 | 2.88 | 1.87 | 2.11 |
Table 3.
Average personal annual health risks (adults) caused by heavy metal pollutants in the surface water from Xiaohe River irrigation area (a−1).
Table 3.
Average personal annual health risks (adults) caused by heavy metal pollutants in the surface water from Xiaohe River irrigation area (a−1).
| Heavy Metal | Sampling Sites | |||||||
|---|---|---|---|---|---|---|---|---|
| BHL | SD | XW | ZQ | ZH | ZJB | HC | NM | |
| Cr | 1.07 × 10⁻³ | 1.25 × 10⁻³ | 1.50 × 10⁻³ | 1.52 × 10⁻³ | 1.83 × 10⁻³ | 1.91 × 10⁻³ | 1.92 × 10⁻³ | 1.94 × 10⁻³ |
| Cd | 2.68 × 10⁻⁵ | 2.91 × 10⁻⁵ | 2.89 × 10⁻⁵ | 2.98 × 10⁻⁵ | 3.51 × 10⁻⁵ | 3.83 × 10⁻⁵ | 4.32 × 10⁻⁵ | 4.60 × 10⁻⁵ |
| As | 2.39 × 10⁻⁴ | 2.52 × 10⁻⁴ | 2.79 × 10⁻⁴ | 3.00 × 10⁻⁴ | 2.99 × 10⁻⁴ | 3.26 × 10⁻⁴ | 3.41 × 10⁻⁴ | 3.72 × 10⁻⁴ |
| Cu | 4.01 × 10⁻⁹ | 3.95 × 10⁻⁹ | 6.88 × 10⁻⁹ | 6.05 × 10⁻⁹ | 6.67 × 10⁻⁹ | 6.71 × 10⁻⁹ | 7.80 × 10⁻⁹ | 8.20 × 10⁻⁹ |
| Zn | 1.61 × 10⁻¹⁰ | 1.65 × 10⁻¹⁰ | 2.15 × 10⁻¹⁰ | 2.54 × 10⁻¹⁰ | 2.73 × 10⁻¹⁰ | 2.70 × 10⁻¹⁰ | 3.21 × 10⁻¹⁰ | 3.63 × 10⁻¹⁰ |
| Pb | 2.85 × 10⁻⁹ | 3.37 × 10⁻⁹ | 3.73 × 10⁻⁹ | 4.13 × 10⁻⁹ | 3.17 × 10⁻⁹ | 4.21 × 10⁻⁹ | 4.94 × 10⁻⁹ | 5.36 × 10⁻⁹ |
| Hg | 5.81 × 10⁻¹¹ | 6.03 × 10⁻¹¹ | 6.95 × 10⁻¹¹ | 7.11 × 10⁻¹¹ | 7.71 × 10⁻¹¹ | 1.15 × 10⁻¹⁰ | 1.61 × 10⁻¹⁰ | 1.79 × 10⁻¹⁰ |
| Ni | 3.11 × 10⁻¹⁰ | 3.30 × 10⁻¹⁰ | 3.73 × 10⁻¹⁰ | 3.71 × 10⁻¹⁰ | 4.37 × 10⁻¹⁰ | 4.58 × 10⁻¹⁰ | 4.89 × 10⁻¹⁰ | 5.12 × 10⁻¹⁰ |
Table 4.
Average personal annual health risks (children) caused by heavy metal pollutants in the surface water from Xiaohe River irrigation area (a−1).
Table 4.
Average personal annual health risks (children) caused by heavy metal pollutants in the surface water from Xiaohe River irrigation area (a−1).
| Heavy Metal | Sampling Sites | |||||||
|---|---|---|---|---|---|---|---|---|
| BHL | SD | XW | ZQ | ZH | ZJB | HC | NM | |
| Cr | 1.35 × 10⁻³ | 1.57 × 10⁻³ | 1.89 × 10⁻³ | 1.91 × 10⁻³ | 2.29 × 10⁻³ | 2.39 × 10⁻³ | 2.40 × 10⁻³ | 2.43 × 10⁻³ |
| Cd | 3.42 × 10⁻⁵ | 3.71 × 10⁻⁵ | 3.69 × 10⁻⁵ | 3.81 × 10⁻⁵ | 4.48 × 10⁻⁵ | 4.88 × 10⁻⁵ | 5.51 × 10⁻⁵ | 5.87 × 10⁻⁵ |
| As | 3.04 × 10⁻⁴ | 3.21 × 10⁻⁴ | 3.55 × 10⁻⁴ | 3.82 × 10⁻⁴ | 3.80 × 10⁻⁴ | 4.15 × 10⁻⁴ | 4.33 × 10⁻⁴ | 4.73 × 10⁻⁴ |
| Cu | 5.12 × 10⁻⁹ | 5.04 × 10⁻⁹ | 8.78 × 10⁻⁹ | 7.72 × 10⁻⁹ | 8.52 × 10⁻⁹ | 8.56 × 10⁻⁹ | 9.96 × 10⁻⁹ | 1.05 × 10⁻⁸ |
| Zn | 2.05 × 10⁻¹⁰ | 2.10 × 10⁻¹⁰ | 2.75 × 10⁻¹⁰ | 3.24 × 10⁻¹⁰ | 3.48 × 10⁻¹⁰ | 3.44 × 10⁻¹⁰ | 4.09 × 10⁻¹⁰ | 4.63 × 10⁻¹⁰ |
| Pb | 3.63 × 10⁻⁹ | 4.31 × 10⁻⁹ | 4.76 × 10⁻⁹ | 5.28 × 10⁻⁹ | 4.05 × 10⁻⁹ | 5.37 × 10⁻⁹ | 6.31 × 10⁻⁹ | 6.85 × 10⁻⁹ |
| Hg | 7.42 × 10⁻¹¹ | 7.69 × 10⁻¹¹ | 8.87 × 10⁻¹¹ | 9.08 × 10⁻¹¹ | 9.84 × 10⁻¹¹ | 1.47 × 10⁻¹⁰ | 2.05 × 10⁻¹⁰ | 2.29 × 10⁻¹⁰ |
| Ni | 3.97 × 10⁻¹⁰ | 4.21 × 10⁻¹⁰ | 4.76 × 10⁻¹⁰ | 4.74 × 10⁻¹⁰ | 5.57 × 10⁻¹⁰ | 5.84 × 10⁻¹⁰ | 6.25 × 10⁻¹⁰ | 6.54 × 10⁻¹⁰ |
Table 5.
Total health risk caused by heavy metal pollutants in the surface water from Xiaohe River irrigation area (a−1).
Table 5.
Total health risk caused by heavy metal pollutants in the surface water from Xiaohe River irrigation area (a−1).
| Population | |||
|---|---|---|---|
| Adults | 1.56 × 10⁻² | 8.81 × 10⁻⁸ | 1.56 × 10⁻² |
| Children | 1.96 × 10⁻² | 1.12 × 10⁻⁷ | 1.96 × 10⁻² |
Publisher’s Note: MDPI stays neutral with regard to jurisdictional claims in published maps and institutional affiliations. |
© 2022 by the authors. Licensee MDPI, Basel, Switzerland. This article is an open access article distributed under the terms and conditions of the Creative Commons Attribution (CC BY) license (https://creativecommons.org/licenses/by/4.0/).
Share and Cite
MDPI and ACS Style
Meng, Z.; Bai, X.; Tang, X. Short−Term Assessment of Heavy Metals in Surface Water from Xiaohe River Irrigation Area, China: Levels, Sources and Distribution. Water 2022, 14, 1273. https://doi.org/10.3390/w14081273
AMA Style
Meng Z, Bai X, Tang X. Short−Term Assessment of Heavy Metals in Surface Water from Xiaohe River Irrigation Area, China: Levels, Sources and Distribution. Water. 2022; 14(8):1273. https://doi.org/10.3390/w14081273
Chicago/Turabian StyleMeng, Zhilong, Xinru Bai, and Xiuli Tang. 2022. "Short−Term Assessment of Heavy Metals in Surface Water from Xiaohe River Irrigation Area, China: Levels, Sources and Distribution" Water 14, no. 8: 1273. https://doi.org/10.3390/w14081273
Note that from the first issue of 2016, this journal uses article numbers instead of page numbers. See further details here.