Article

Application of a Conceptual Hydrological Model for Streamflow Prediction Using Multi-Source Precipitation Products in a Semi-Arid River Basin

1
Research and Development Division, Pakistan Meteorological Department, Pitras Bukhari Road, H-8/2, Islamabad 44000, Pakistan
2
Australian Rivers Institute, Griffith University, Nathan, QLD 4111, Australia
3
School of Environment & Science, Griffith University, Nathan, QLD 4111, Australia
4
Department of Earth & Environmental Sciences, Bahria School of Engineering and Applied Sciences (BSEAS), Bahria University, Sector H-11/4, Islamabad 44000, Pakistan
5
Research Center for Environmental Quality Management, Graduate School of Engineering, Kyoto University, 1-2 Yumihama, Otsu 520-0811, Shiga, Japan
6
School of Energy and Environment, City University of Hong Kong, Kowloon, Hong Kong, China
*
Author to whom correspondence should be addressed.
Water 2022, 14(8), 1260; https://doi.org/10.3390/w14081260
Submission received: 7 March 2022 / Revised: 2 April 2022 / Accepted: 12 April 2022 / Published: 13 April 2022
(This article belongs to the Special Issue Advances and Challenges in Hydrological Modeling and Engineering)

Abstract

:
Management of the freshwater resources in a sustained manner requires the information and understanding of the surface water hydrology and streamflow is of key importance in this nexus. This study evaluates the performance of eight different precipitation products (APHRODITE, CHRS CCS, CHRS CDR, CHIRPS, CPC Global, GPCC, GPCP, and PERSIANN) for streamflow prediction in two sub-catchments (Chirah and Dhoke Pathan) of the data-scarce Soan River Basin (SRB) in Pakistan. A modified version of the hydrological model HBV (Hydrologiska Byråns Vattenbalansavdelning) known as HBV-light was used to generate streamflow. The model was separately calibrated and validated with observed and estimated precipitation data for streamflow simulation with optimized parameterization. The values of R2, NSE, KGE and PBIAS obtained during the calibration (validation) period for the Chirah sub-catchment were 0.64, 0.64, 0.68 and −5.6% (0.82, 0.81, 0.88 and 7.4%). On the other hand, values of R2, NSE, KGE, and PBIAS obtained during the calibration (validation) period for the Dhoke Pathan sub-catchment were 0.85, 0.85, 0.87, and −3.4% (0.82, 0.7, 0.73 and 6.9%). Different ranges of values were assigned to multiple efficiency evaluation metrics and the performance of precipitation products was assessed. Generally, we found that the performance of the precipitation products was improved (higher metrics values) with increasing temporal and spatial scale. However, our results showed that APHRODITE was the only precipitation product that outperformed other products in simulating observed streamflow at both temporal scales for both Chirah and Dhoke Pathan sub-catchments. These results suggest that with the long-term availability of continuous precipitation records with fine temporal and spatial resolutions, APHRODITE has the high potential to be used for streamflow prediction in this semi-arid river basin. Other products that performed better were GPCC, GPCP, and CHRS CCS; however, their scope was limited either to one catchment or a specific time scale. These results will also help better understand surface water hydrology and in turn, would be useful for better management of the water resources.

1. Introduction

Understanding surface water hydrology is important in the sustainable management of freshwater resources. The importance of this management ensures the effective allocation of freshwater and its availability for the functioning of numerous ecosystems [1]. Additionally, different environmental processes are governed by streamflow and have a tendency to considerably exacerbate water pollution, salinity, and soil erosion [2,3,4]. Long-term records of streamflow measurements at spatial and temporal scales are considered an important hindrance to the improved understanding of surface water hydrology. Hydrological modeling is usually employed for the purpose of streamflow prediction, which is not complete without adequate and quality precipitation data [5,6,7,8].
Precipitation is even more important in semi-arid basins as these regions have fragile hydrological balance [9] and the spatiotemporal variability of precipitation is usually higher in these regions, making streamflow prediction rather challenging [10]. However there is a scarcity of in situ hydrologic measurements and the available gauging networks are extraordinarily sparse both spatially and temporally, especially in developing countries such as Pakistan. For instance data from one meteorological station was used for a catchment with a size of more than 10,000 km2 [11].
These limited observations and shortcomings create a knowledge gap in our understanding of hydrologic variability and limit our ability to understand the hydrological response of river basins to changing climate as well as hinder decision-makers and stakeholders from implementing actions that could support the sustainable management of freshwater resources [1,12]. The quest for an alternate source of precipitation data is thus warranted and satellite and gauge-based precipitation products are a viable source of precipitation data to comprehensively develop and improve the knowledge of surface water hydrology.
Different Precipitation Products (PPs) that exists now have a global coverage at high spatial and temporal resolutions and offer a prodigious opportunity for the optimization of water resource management. Different PPs adopt different procedures to estimate precipitation and estimates of these products are based on different remotely sensed characteristics of clouds e.g., reflectivity, the temperature of cloud-top, or from different effects (of scattering and emission) of raindrops/particles of ice, gaps in time of revisit and an indirect relationship between precipitation rate and remote signals, etc. [13,14,15]. So, the use of different methods and basis leads to a broad range of uncertainties in satellite PPs [5,16,17]. Catchment properties (e.g., topography, evaporation, land surface conditions, etc.), and biophysical characteristics (e.g., vegetation) can also contribute to these uncertainties or influence the characteristics of local precipitation and overall hydro-climatology, and research has shown that the performance of a certain satellite PPs depends on these regional characteristics. These uncertainties are also reflected when these PPs are used for hydrological applications e.g., streamflow prediction [18].
Because of the improved characteristics and uncertainties related to different PPs, there is an increasing and ongoing debate on the region-specific suitability of PPs. So, to unleash the maximum potential of these PPs for hydrological applications, an assessment of their reliability for hydrological applications (e.g., streamflow prediction) is critical. Such an evaluation will not only be beneficial for the region of study (e.g., catchment) with particular climate conditions (e.g., semi-arid) but also for the product itself (in terms of further development and improvements).
Therefore the aim of this study is to assess and analyze the performance of different multi-source PPs for streamflow prediction in two sub-catchments of the Soan River Basin (SRB). The objectives of this study are to: (i) calibrate and validate the HBV-light model for two sub-catchments in a semi-arid region using observed (station-based) and estimated precipitation data from different products, and (ii) assess the performance of eight different PPs to predict the streamflow at different temporal scales using multiple efficiency evaluation metrics.

2. Materials and Methods
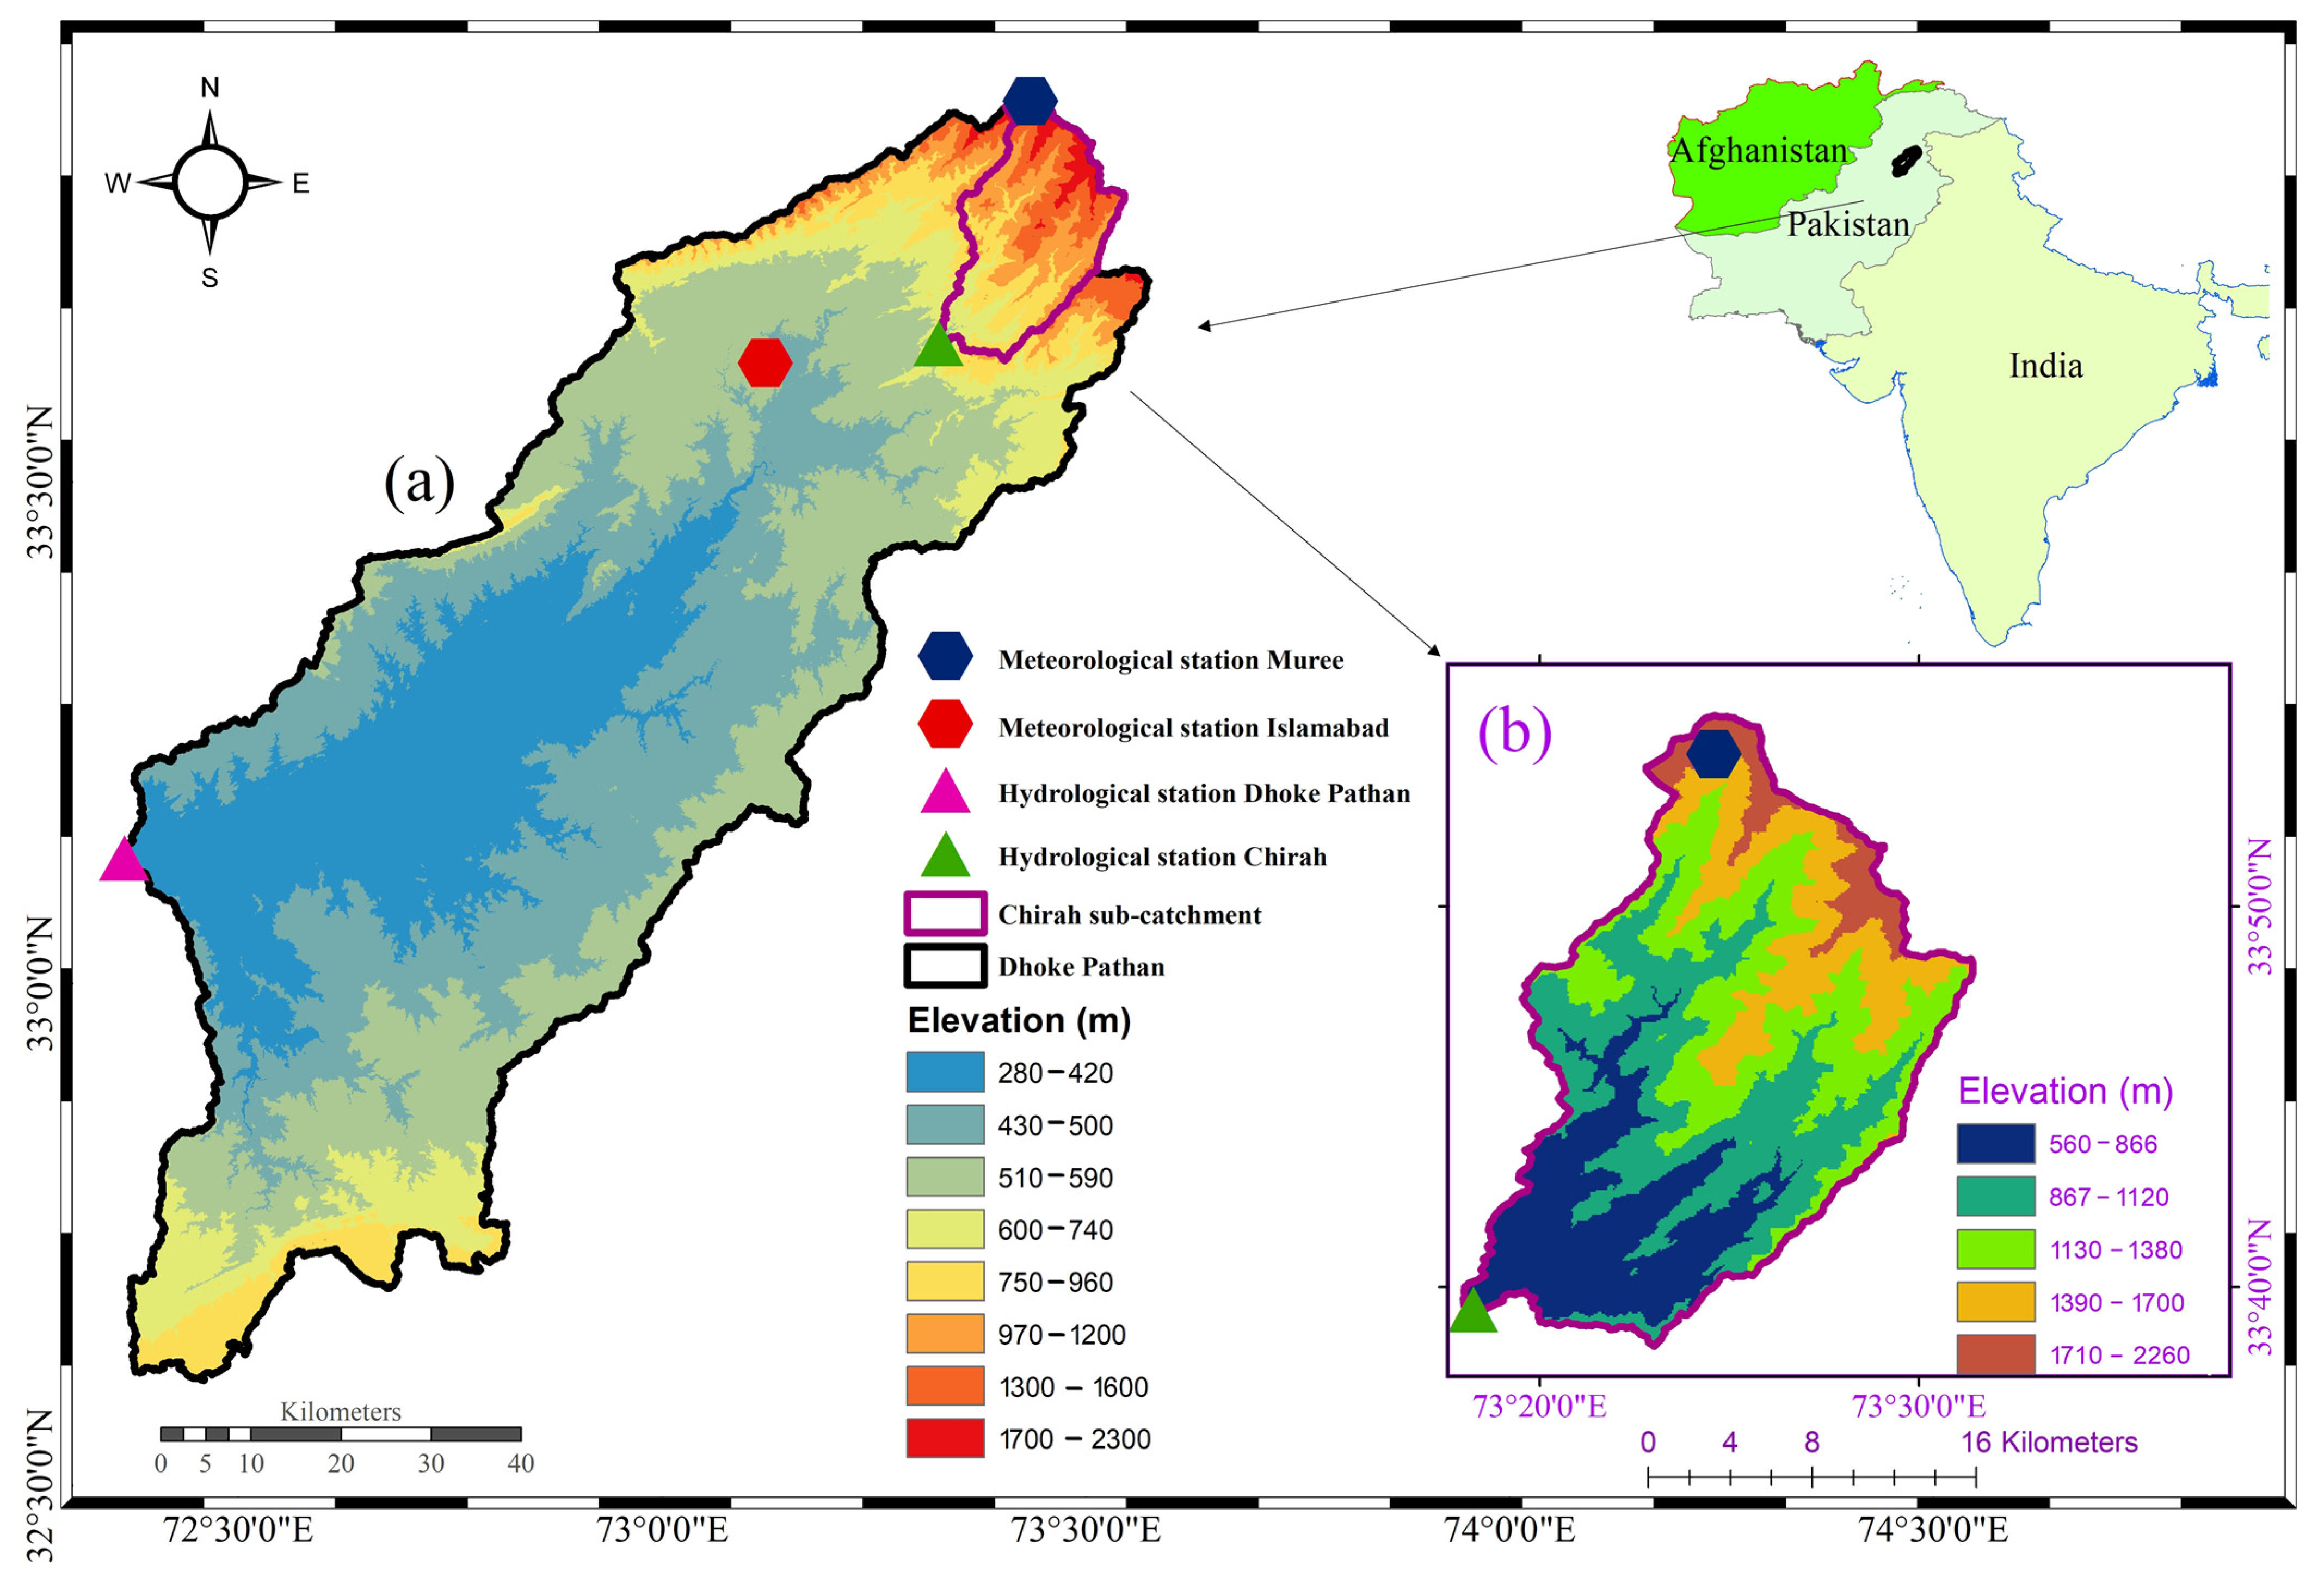
2.1. Study Area

The SRB is located in a semi-arid region of Pakistan and this study is focused on the Chirah and Dhoke Pathan sub-catchments of the SRB (Figure 1). The Chirah sub-catchment is located upstream of the SRB while the Dhoke Pathan sub-catchment is located downstream, the former drains an area of 336 km2 and the latter has a drainage area of 6542 km2. Generally, the streamflow in both the sub-catchments is rainfed. However, snowmelt also plays a minute role in the upstream Chirah sub-catchment. The Chirah sub-catchment comes across the Himalayan subtropical pine forest and western Himalayan subalpine conifer forest (key terrestrial ecoregions) of western Himalayas, while the other sub-catchment comes across north-western thorn scrub forest and encompasses the xeric shrubland ecoregion of Pakistan [19]. Agricultural activities in the SRB are dependent on precipitation and perennial flows. Wheat, groundnut, millets, oilseeds, and fodders are key crops in the basin. The dominant soil type in the basin is noncalcareous soil of alluvial and loess plains.

2.2. Description of Observed Data, PPs, and the Hydrological Model

Observed (gauge-based) precipitation and temperature data at daily scales were obtained from the Pakistan Meteorological Department, daily streamflow data was acquired from the Surface Water Hydrology Project of the Water and Development Authority, Pakistan, and long-term mean monthly potential evapotranspiration data from Climate Research Unit (CRU) was used [20] in this study.
Eight different PPs including Precipitation Estimation from Remotely Sensed Information using Artificial Neural Networks (PERSIANN) system developed by the Center for Hydrometeorology and Remote Sensing (CHRS) at the University of California, Irvine (UCI), PERSIANN-Cloud Classification System (CCS) referred to as CHRS CCS in this study, PERSIANN-Climate Data Record (CDR) referred to as CHRS CDR in this study, Climate Hazards Group InfraRed Precipitation with Station data (CHIRPS), CPC Gauge-Based Analysis of Global Daily Precipitation (CPC Global), Global Precipitation Climatology Centre (GPCC), Global Precipitation Climatology Project (GPCP), and Asian Precipitation-Highly-Resolved Observational Data Integration Towards Evaluation (APHRODITE) for streamflow prediction were used in this study. For a comprehensive description and database information of these PPs (other than given in Table S1) readers are referred to [21,22,23,24].
The HBV model [25,26] is a conceptual, semi-distributed hydrological model and HBV-light (version 4.0.0.24) is the version developed by Seibert and Vis [27]. It is a widely used model and its performance has been evaluated in many climatically diverse catchments around the globe [28,29,30,31]. The HBV-light was used in this study to simulate daily streamflow for each catchment. Daily temperature (°C), precipitation (mm), and long-term monthly mean potential evapotranspiration (mm) were used as inputs to the model. A detailed description of the model is available in the literature [25,27,28,32].

2.3. Calibration and Validation of the Hydrological Model

The period 2001−2013 (except 2008) was used to calibrate and validate the model for Chirah and Dhoke Pathan sub-catchments. For both sub-catchments, this period was divided into two parts, one for calibrating the model (2002−2007) and the other for validating the model (2009−2013), leaving 2001 as a warm-up period. The calibration was performed using a genetic algorithm and Powell optimization (GAP; Seibert 2000) method and manual hit and trial method. The mechanism of these optimization methods is to select and recombine parameter sets (depicting high performance) with each other until a parameter set is achieved, which results in the highest objective functions (value) e.g., coefficient of determination.
The HBV-light was first calibrated and validated with observed data and then with data from each individual PP. For performance assessment of the HBV-light model during calibration and validation periods for gauge based precipitation and each individual PP, different metrics were used including the Nash Sutcliffe Efficiency (NSE) [33], Kling-Gupta efficiency (KGE) [34], PBIAS, and coefficient of determination (R2).
NSE = 1 Q o b s Q s i m 2 Q o b s Q o b s ¯ 2
KGE = 1 r 1 2 + α 1 2 + β 1 2
R 2 = Q o b s Q o b s ¯ Q s i m Q s i m ¯ 2 Q o b s Q o b s ¯ 2 Q s i m Q s i m ¯ 2
PBIAS = i = 1 n s i o i i = 1 n o i × 100
r is represented by the (Pearson’s) correlation coefficient, and the bias component α is represented by the ratio of modelled and observed means, and the variability component β by the ratio of the estimated and observed coefficients of variation.
α = μ s μ o   and   β = σ s μ s σ o μ o
where μ and σ are the distribution mean and standard deviation, respectively, and the subscripts s and o denote estimate and reference, respectively. Where Q o b s and Q s i m are observed and modeled streamflow, Q o b s ¯ and Q s i m ¯ are mean observed and modeled streamflow.

2.4. Evaluation of PPs for Streamflow Prediction

The PPs used in this study are commonly used in hydrological applications and their performance has been assessed at different temporal and spatial scales throughout the world [5,35,36,37,38]. In the first step, the performance of daily and monthly precipitation from all precipitation products was evaluated against gauged precipitation in Chirah and Dhoke Pathan sub-catchments against correlation coefficient (R2) and Mean Absolute Error (MAE).
In the second step performance of PPs for streamflow prediction was assessed using different ranges of metric (Equations (1)−(4)) values which reflect the performance of the hydrological model in simulating observed streamflow and are recommended in previous research [7,39,40]. Generally, the model’s performance becomes better with higher R2 and NSE values and lower PBIAS values. According to Moriasi et al., 2015 [40] a model’s performance is not acceptable or unreliable at a daily time scale if NSE values are less than 0.50 and PBIAS more than ±15%. In addition, values of R2 less than 0.50 are not generally considered acceptable [39]. We have used these values with slight modifications (Table 1). For instance, we also included KGE as it is one of the most important measures to assess a model’s performance in simulating observed streamflow, and values of KGE less than 0.4 represent poor model efficiency [7]. Furthermore, we selected the range of PBIAS as less than ±10% (for monthly scale) as compared to less than ±15% (for daily scale) for improved model performance.

3. Results

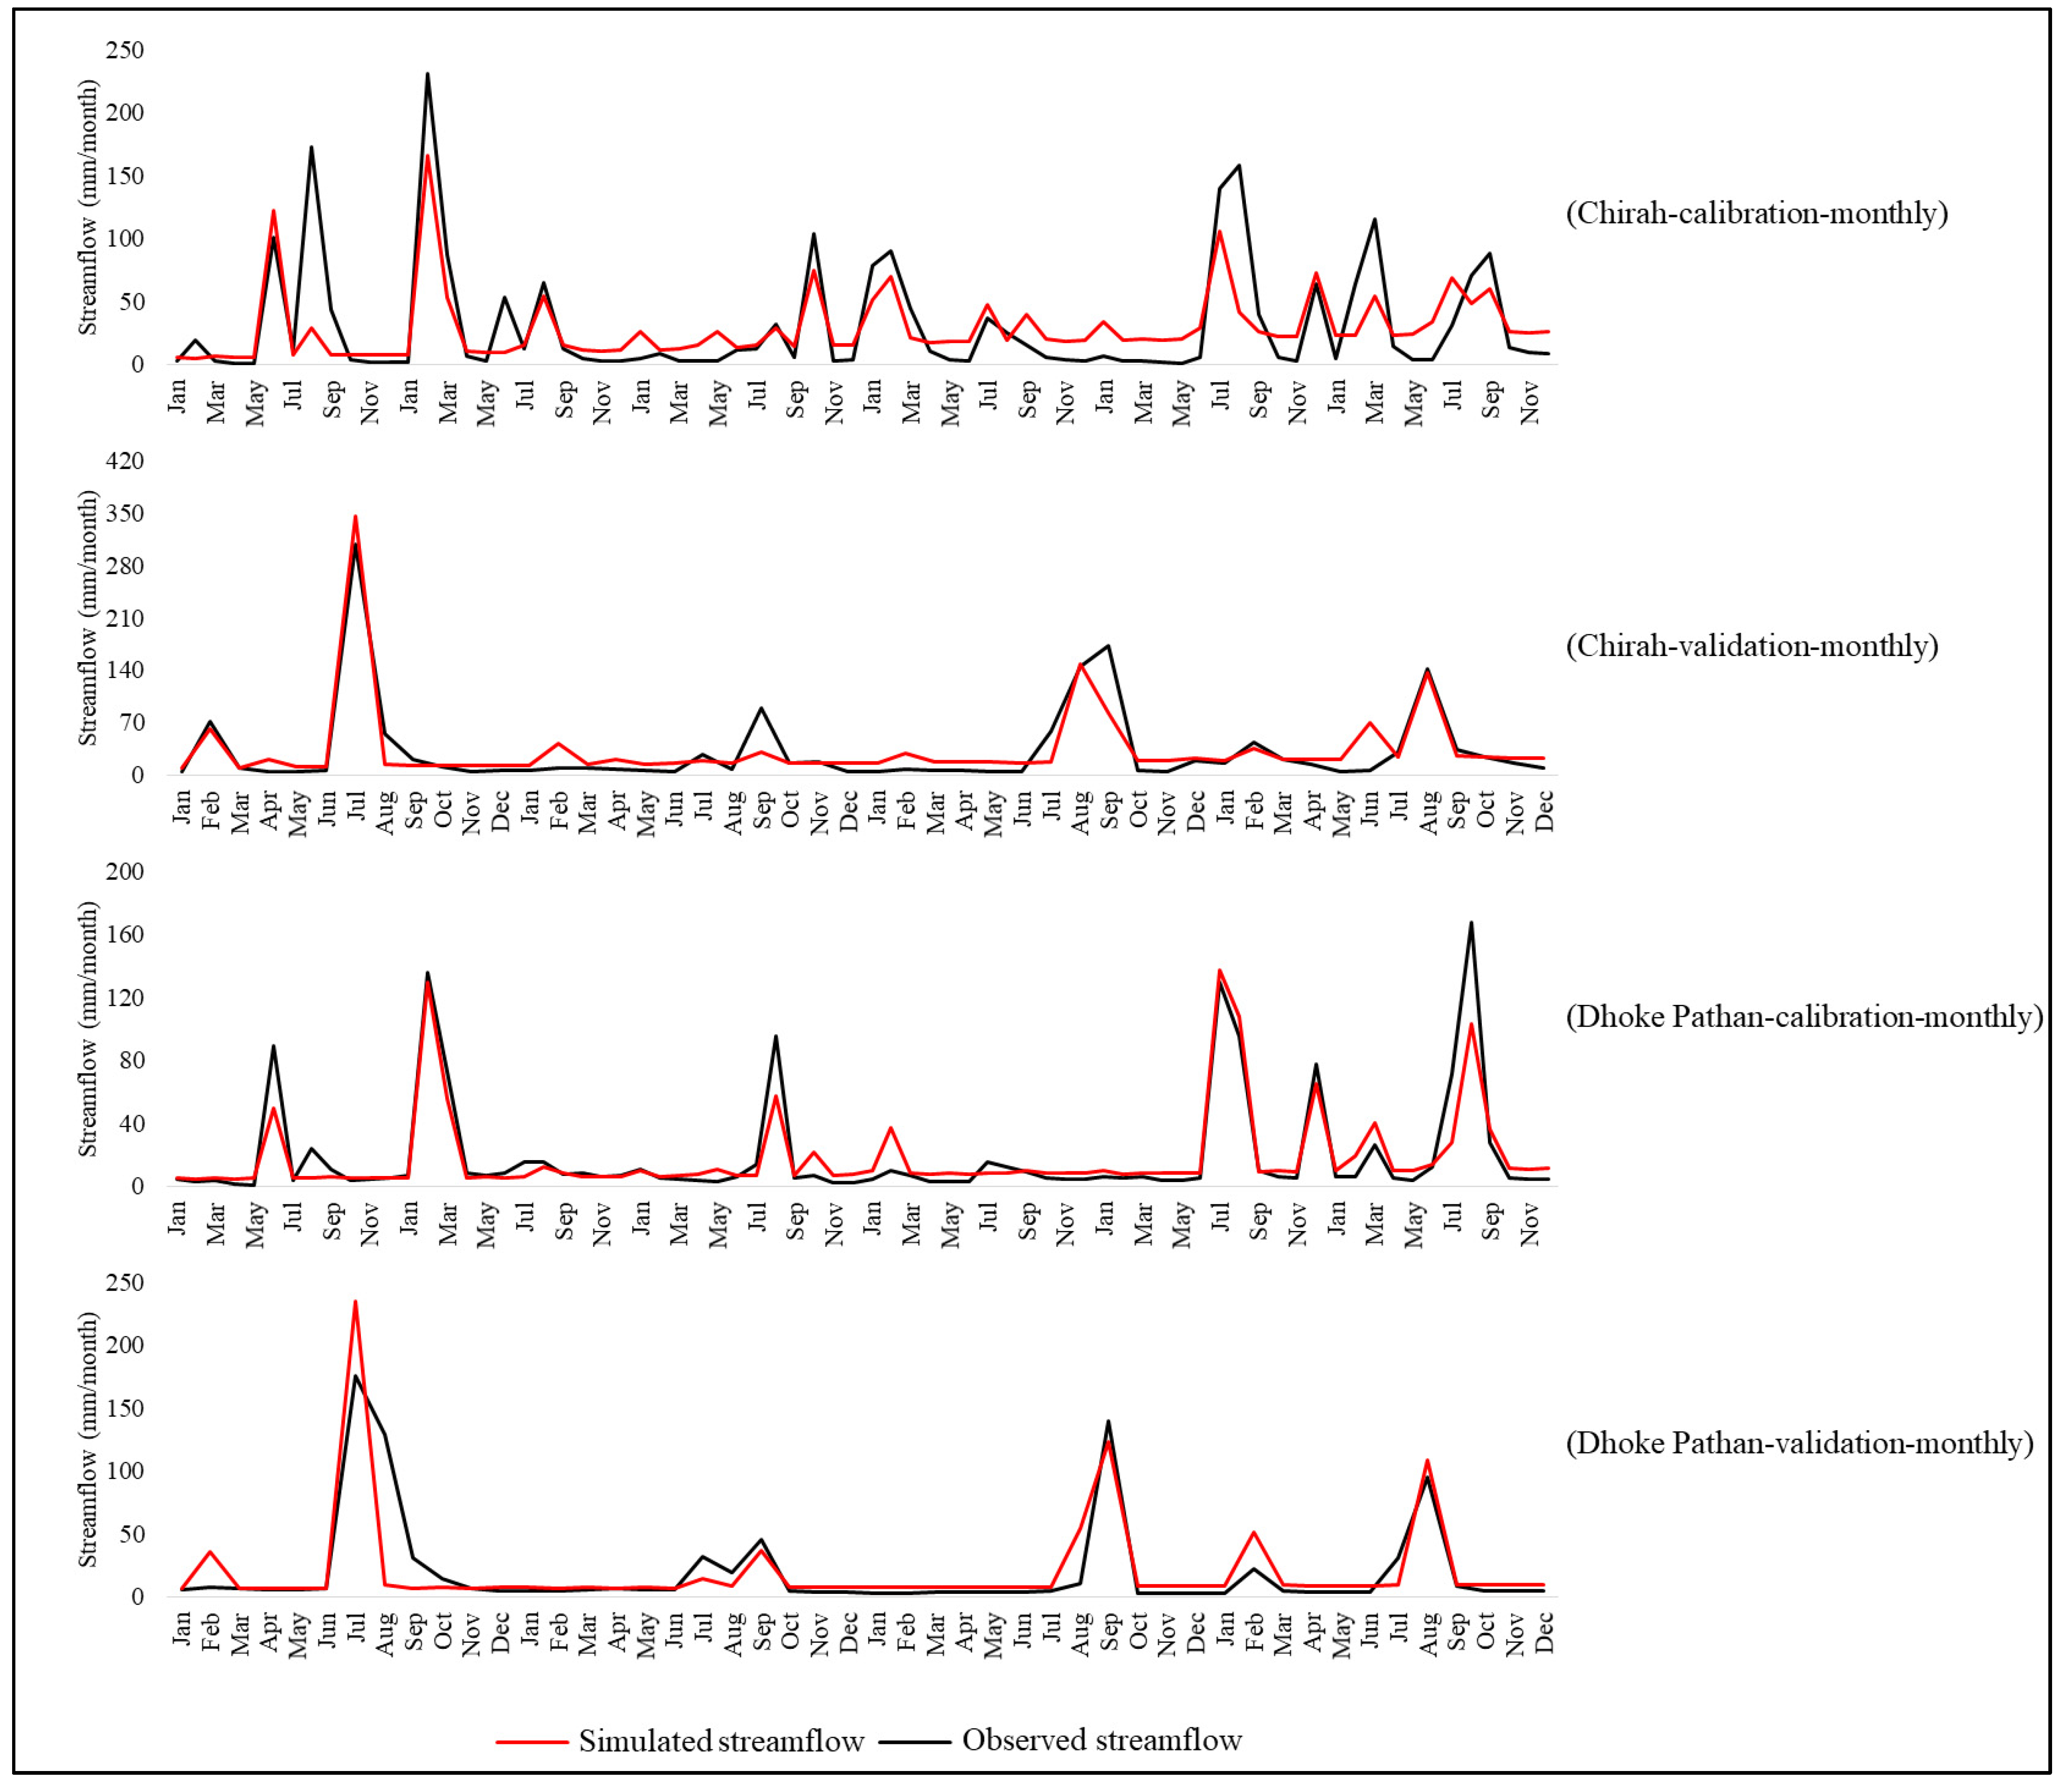
3.1. Performance of the HBV-Light in Simulating Observed Streamflow in Chirah and Dhoke Pathan Sub-Catchments with Observed Precipitation

Daily and monthly streamflow simulated during calibration and validation periods with the HBV-light forced with gauged precipitation data for the Chirah and Dhoke Pathan sub-catchments is shown in Figure 2 and Figure 3, respectively. Performance of the HBV-light in simulating observed streamflow was good for both sub-catchments. The values of R2, NSE, KGE, and PBIAS obtained during the calibration period for the Chirah sub-catchment were 0.64, 0.64, 0.68, and −5.6%, respectively. The values of R2, NSE, KGE, and PBIAS obtained during the validation period for the Chirah sub-catchment were 0.82, 0.81, 0.88, and 7.4%, respectively. On the other hand, values of R2, NSE, KGE, and PBIAS obtained during the calibration period for the Dhoke Pathan sub-catchment were 0.85, 0.85, 0.87, and −3.4%, respectively. While values of R2, NSE, KGE, and PBIAS obtained during the validation period for the Dhoke Pathan sub-catchment were 0.82, 0.7, 0.73, and 6.9%, respectively. Streamflow simulations were even better at the monthly time scale for both sub-catchments during calibration and validation periods. Parameter ranges for the selection of optimum parameters to achieve the aforementioned performance of the model during calibration and validation periods are given in Table S2.

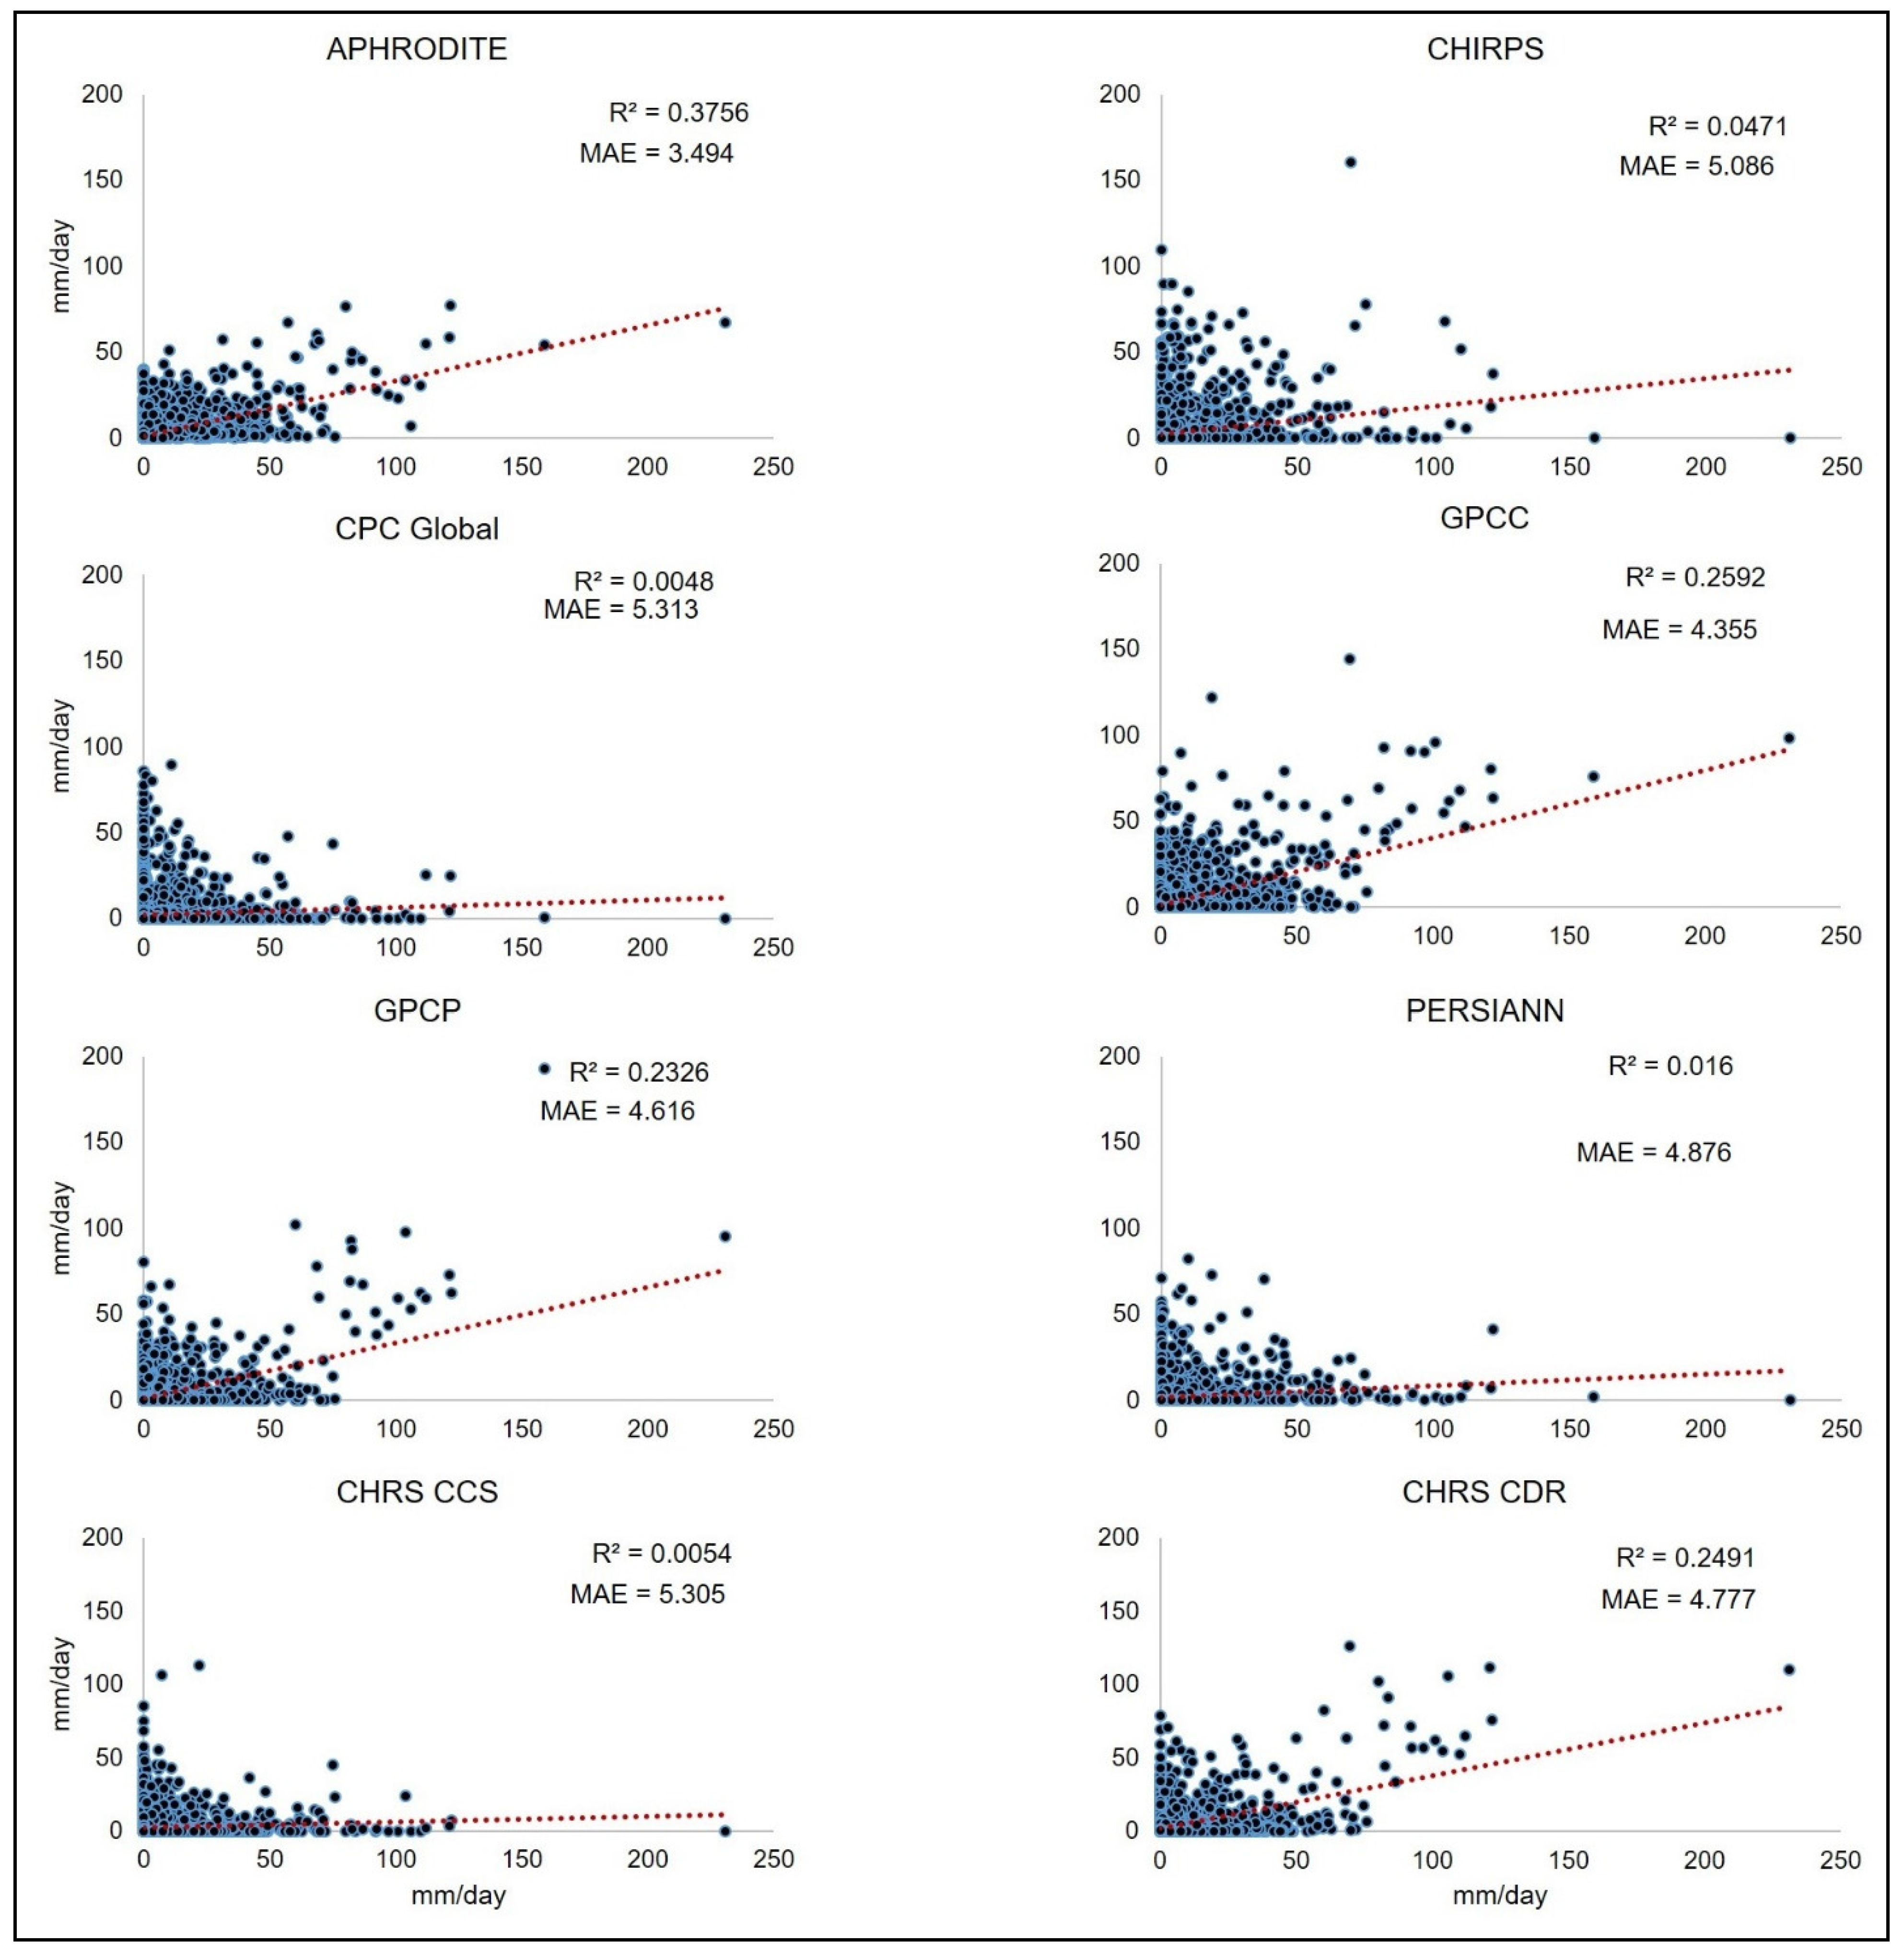
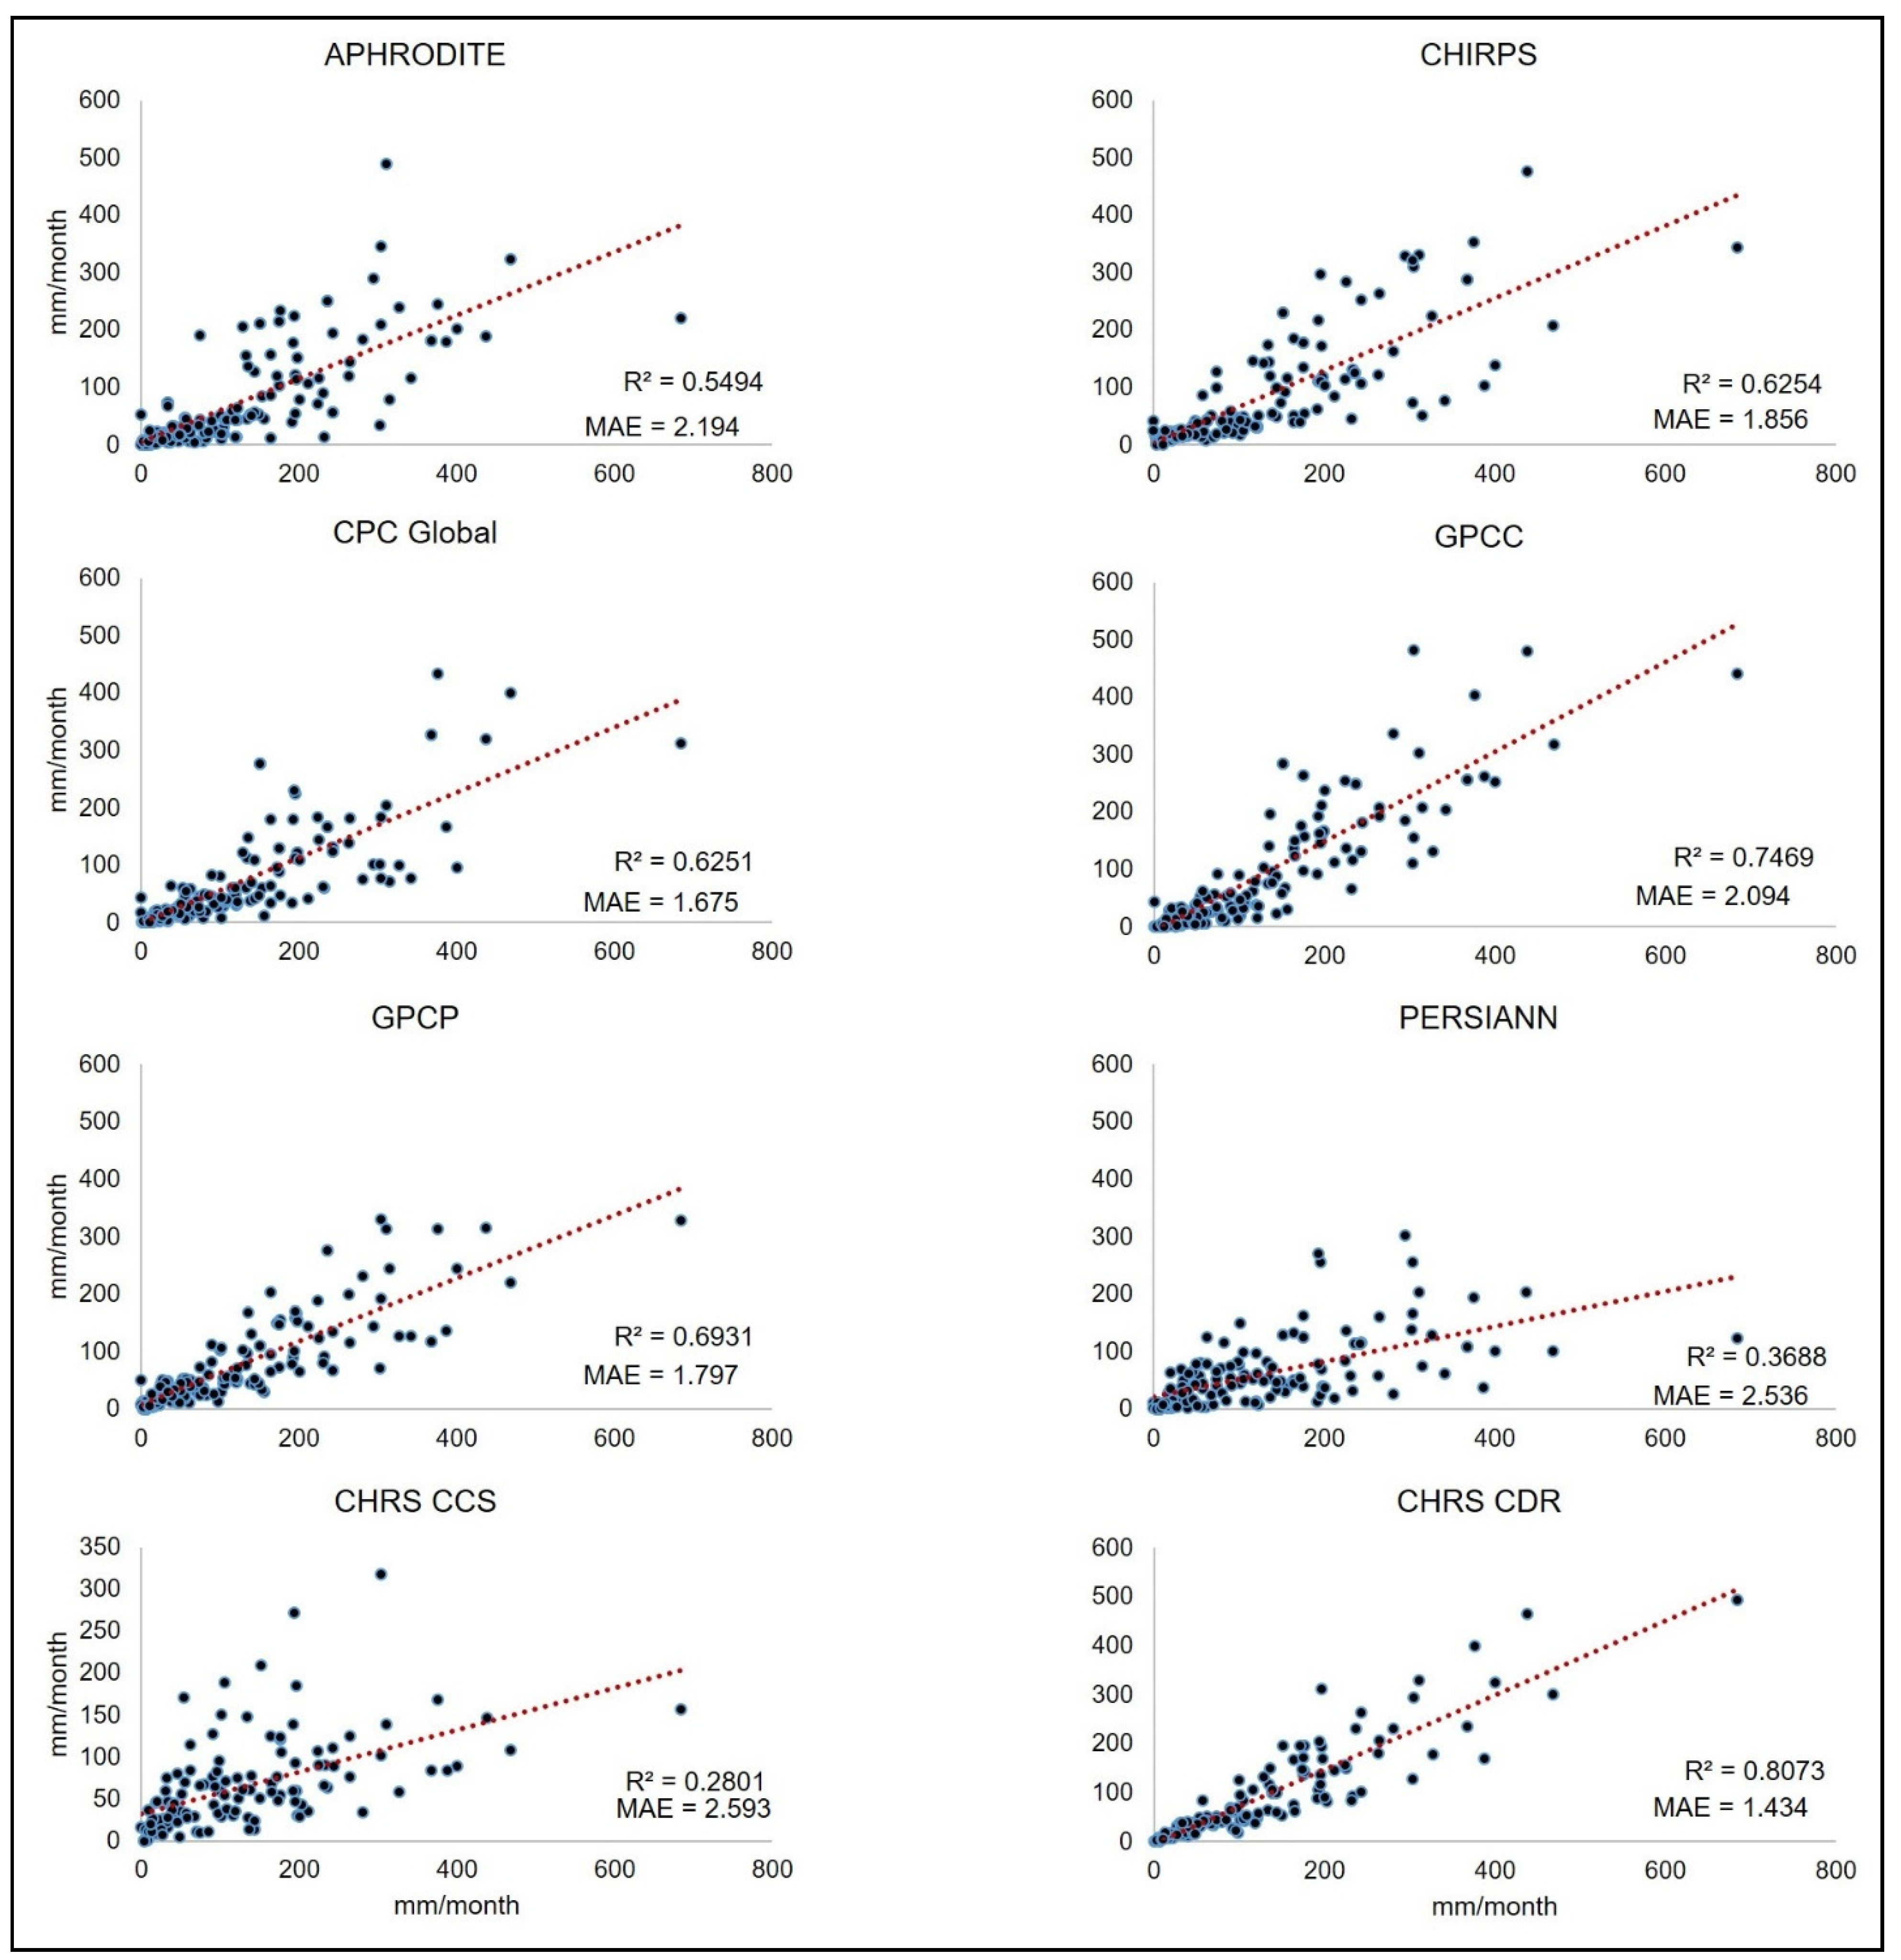
3.2. Performance of Different PPs in Simulating Observed (Gauge Based) Precipitation

The performance of daily precipitation from all PPs was evaluated against gauged precipitation in the Chirah and Dhoke Pathan sub-catchments. For the Chirah sub-catchment, the performance of different PPs in simulating observed precipitation at a daily scale is shown in Figure 4. The performance of APHRODITE (CPC Global) was best (worst) in terms of R2 and MAE values in the Chirah sub-catchment. The performance of APHRODITE was best in the Dhoke Pathan sub-catchment as well; however, the worst-performing product in this catchment, in terms of R2 and MAE was GPCP (Figure S1).
The performance of different PPs on a monthly scale was evaluated over both sub-catchments using the same statistical criteria for the daily time scale. The mean monthly precipitation for eight PPs against the gauge data in the Chirah sub-catchment is shown in Figure 5. Based on the R2 and MAE values, the CHRS CDR has the best performance and CHRS CCS has the worst performance over the Chirah sub-catchment. The GPCP and CHRS CDR have the best performance in terms of R2 and MAE values, and CPC Global showed relatively the worst performance in the Dhoke Pathan sub-catchment (Figure S2).

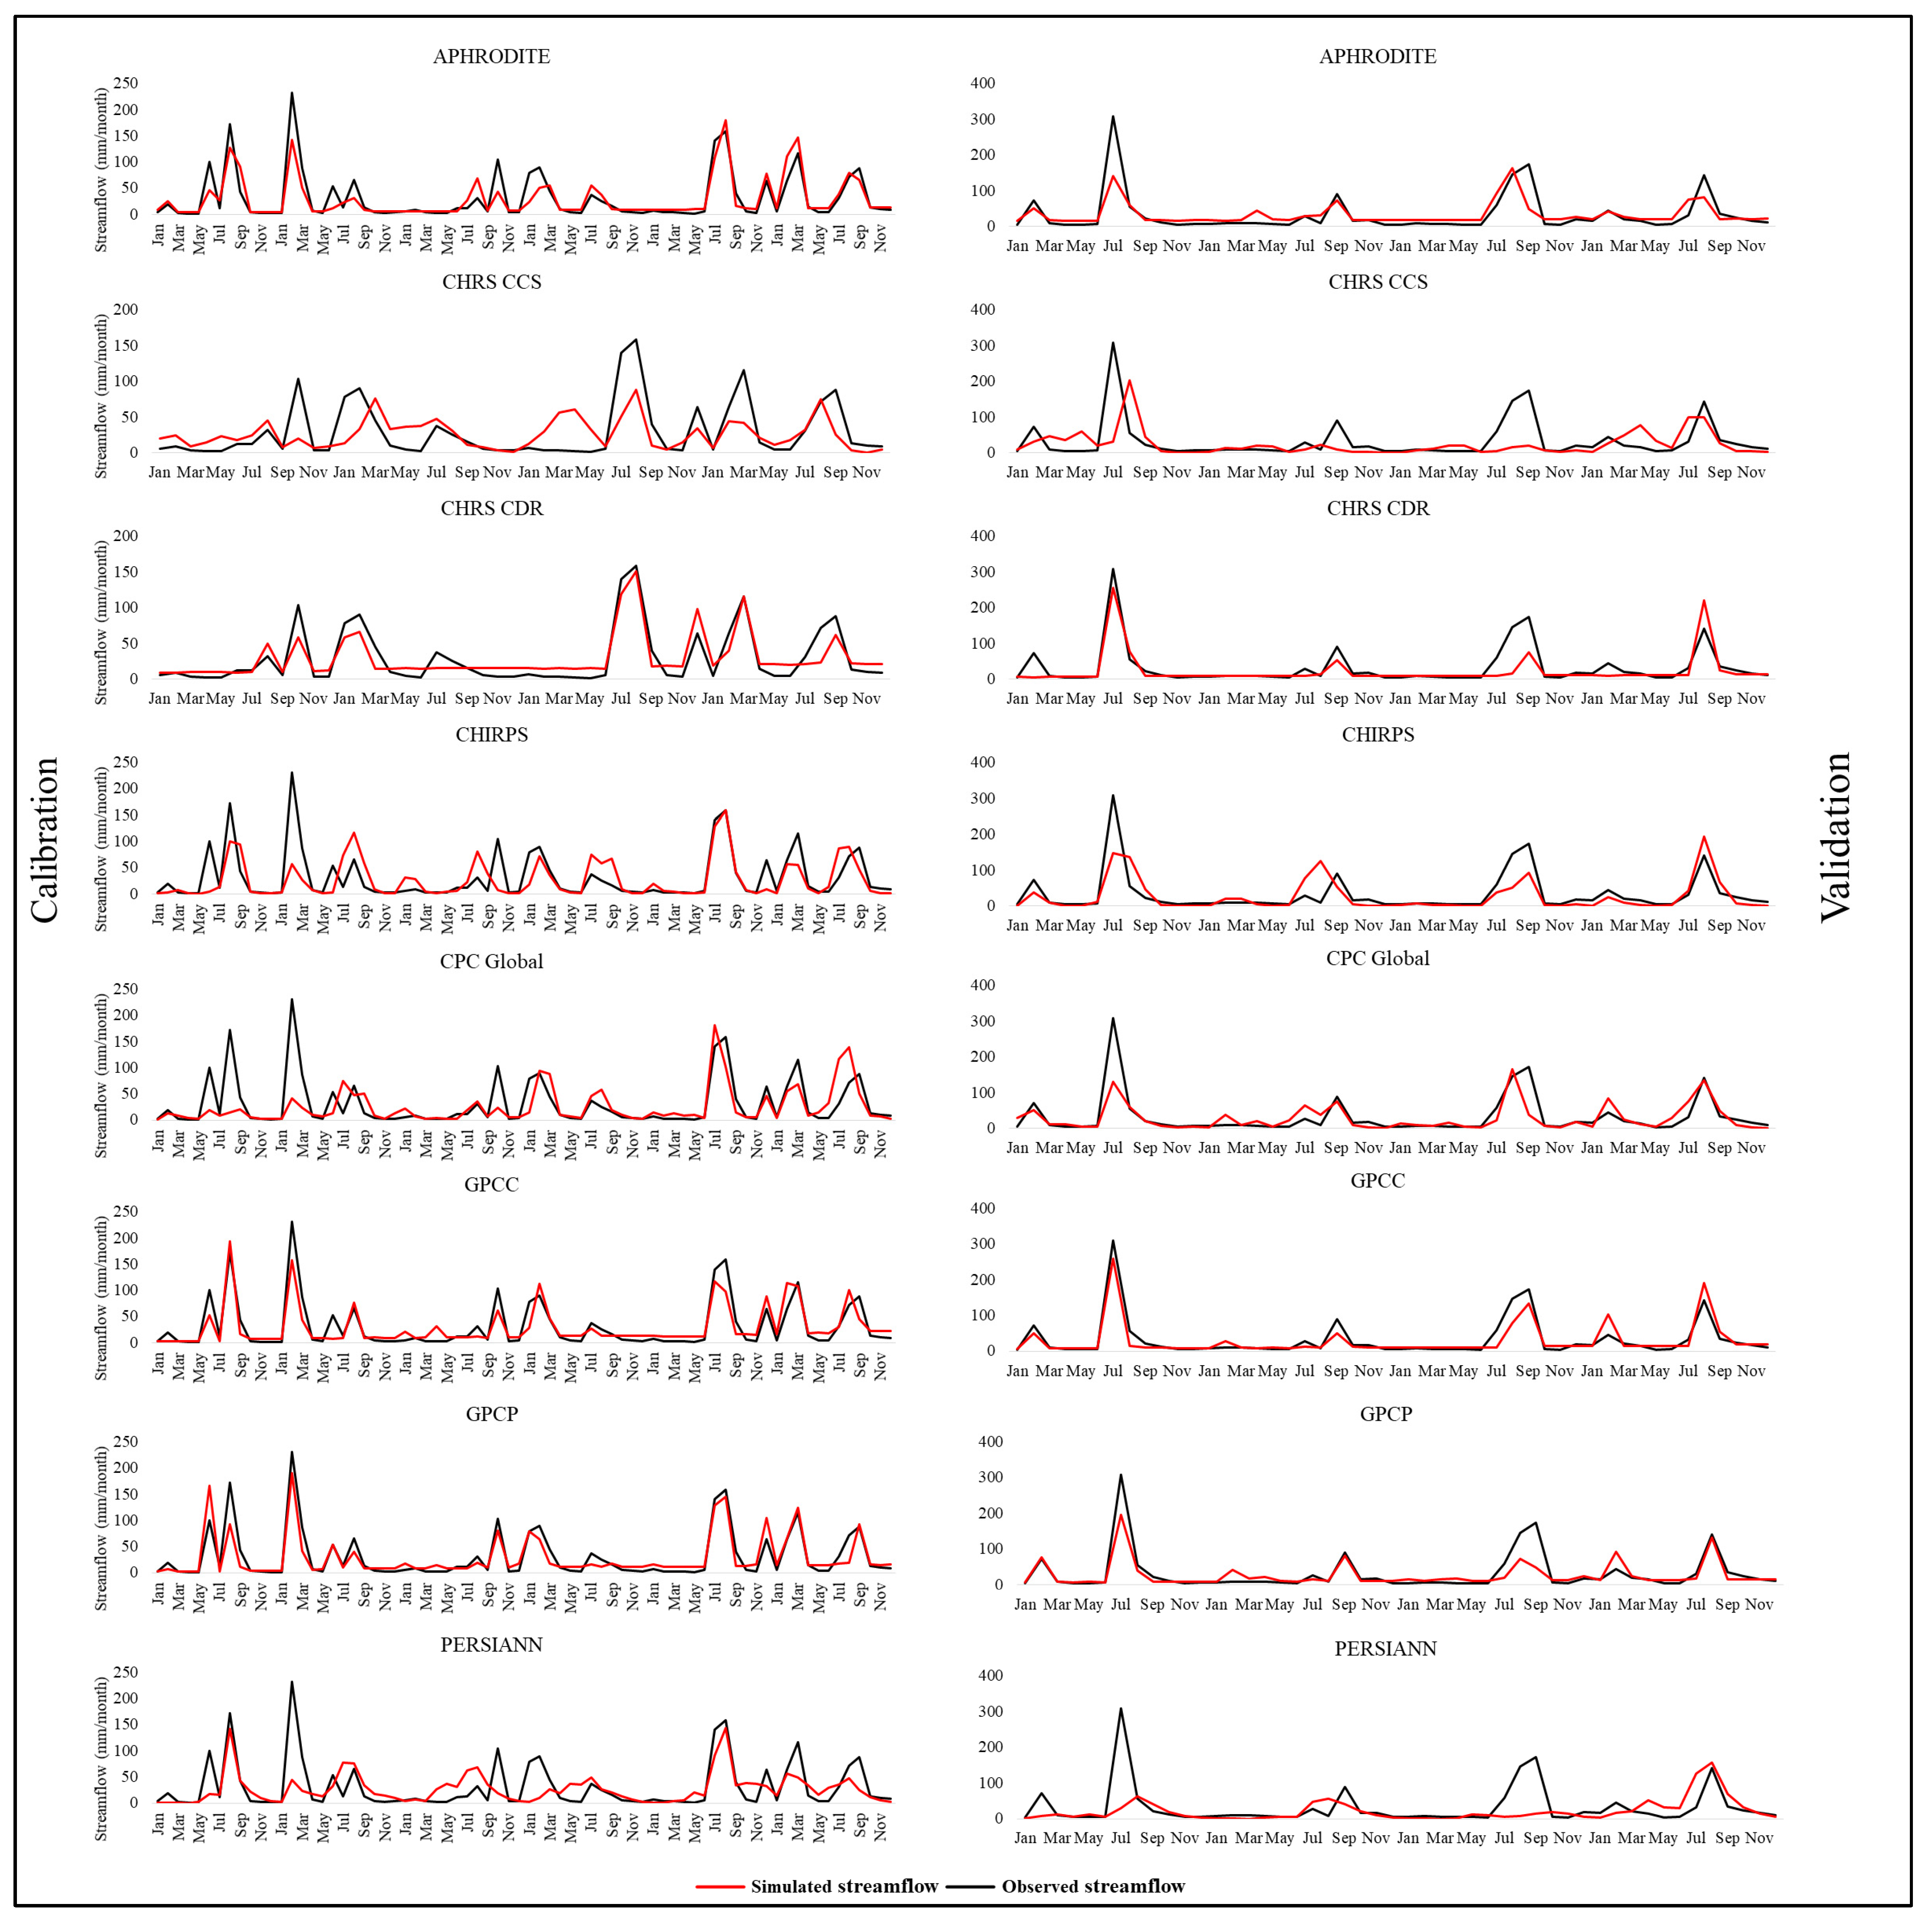
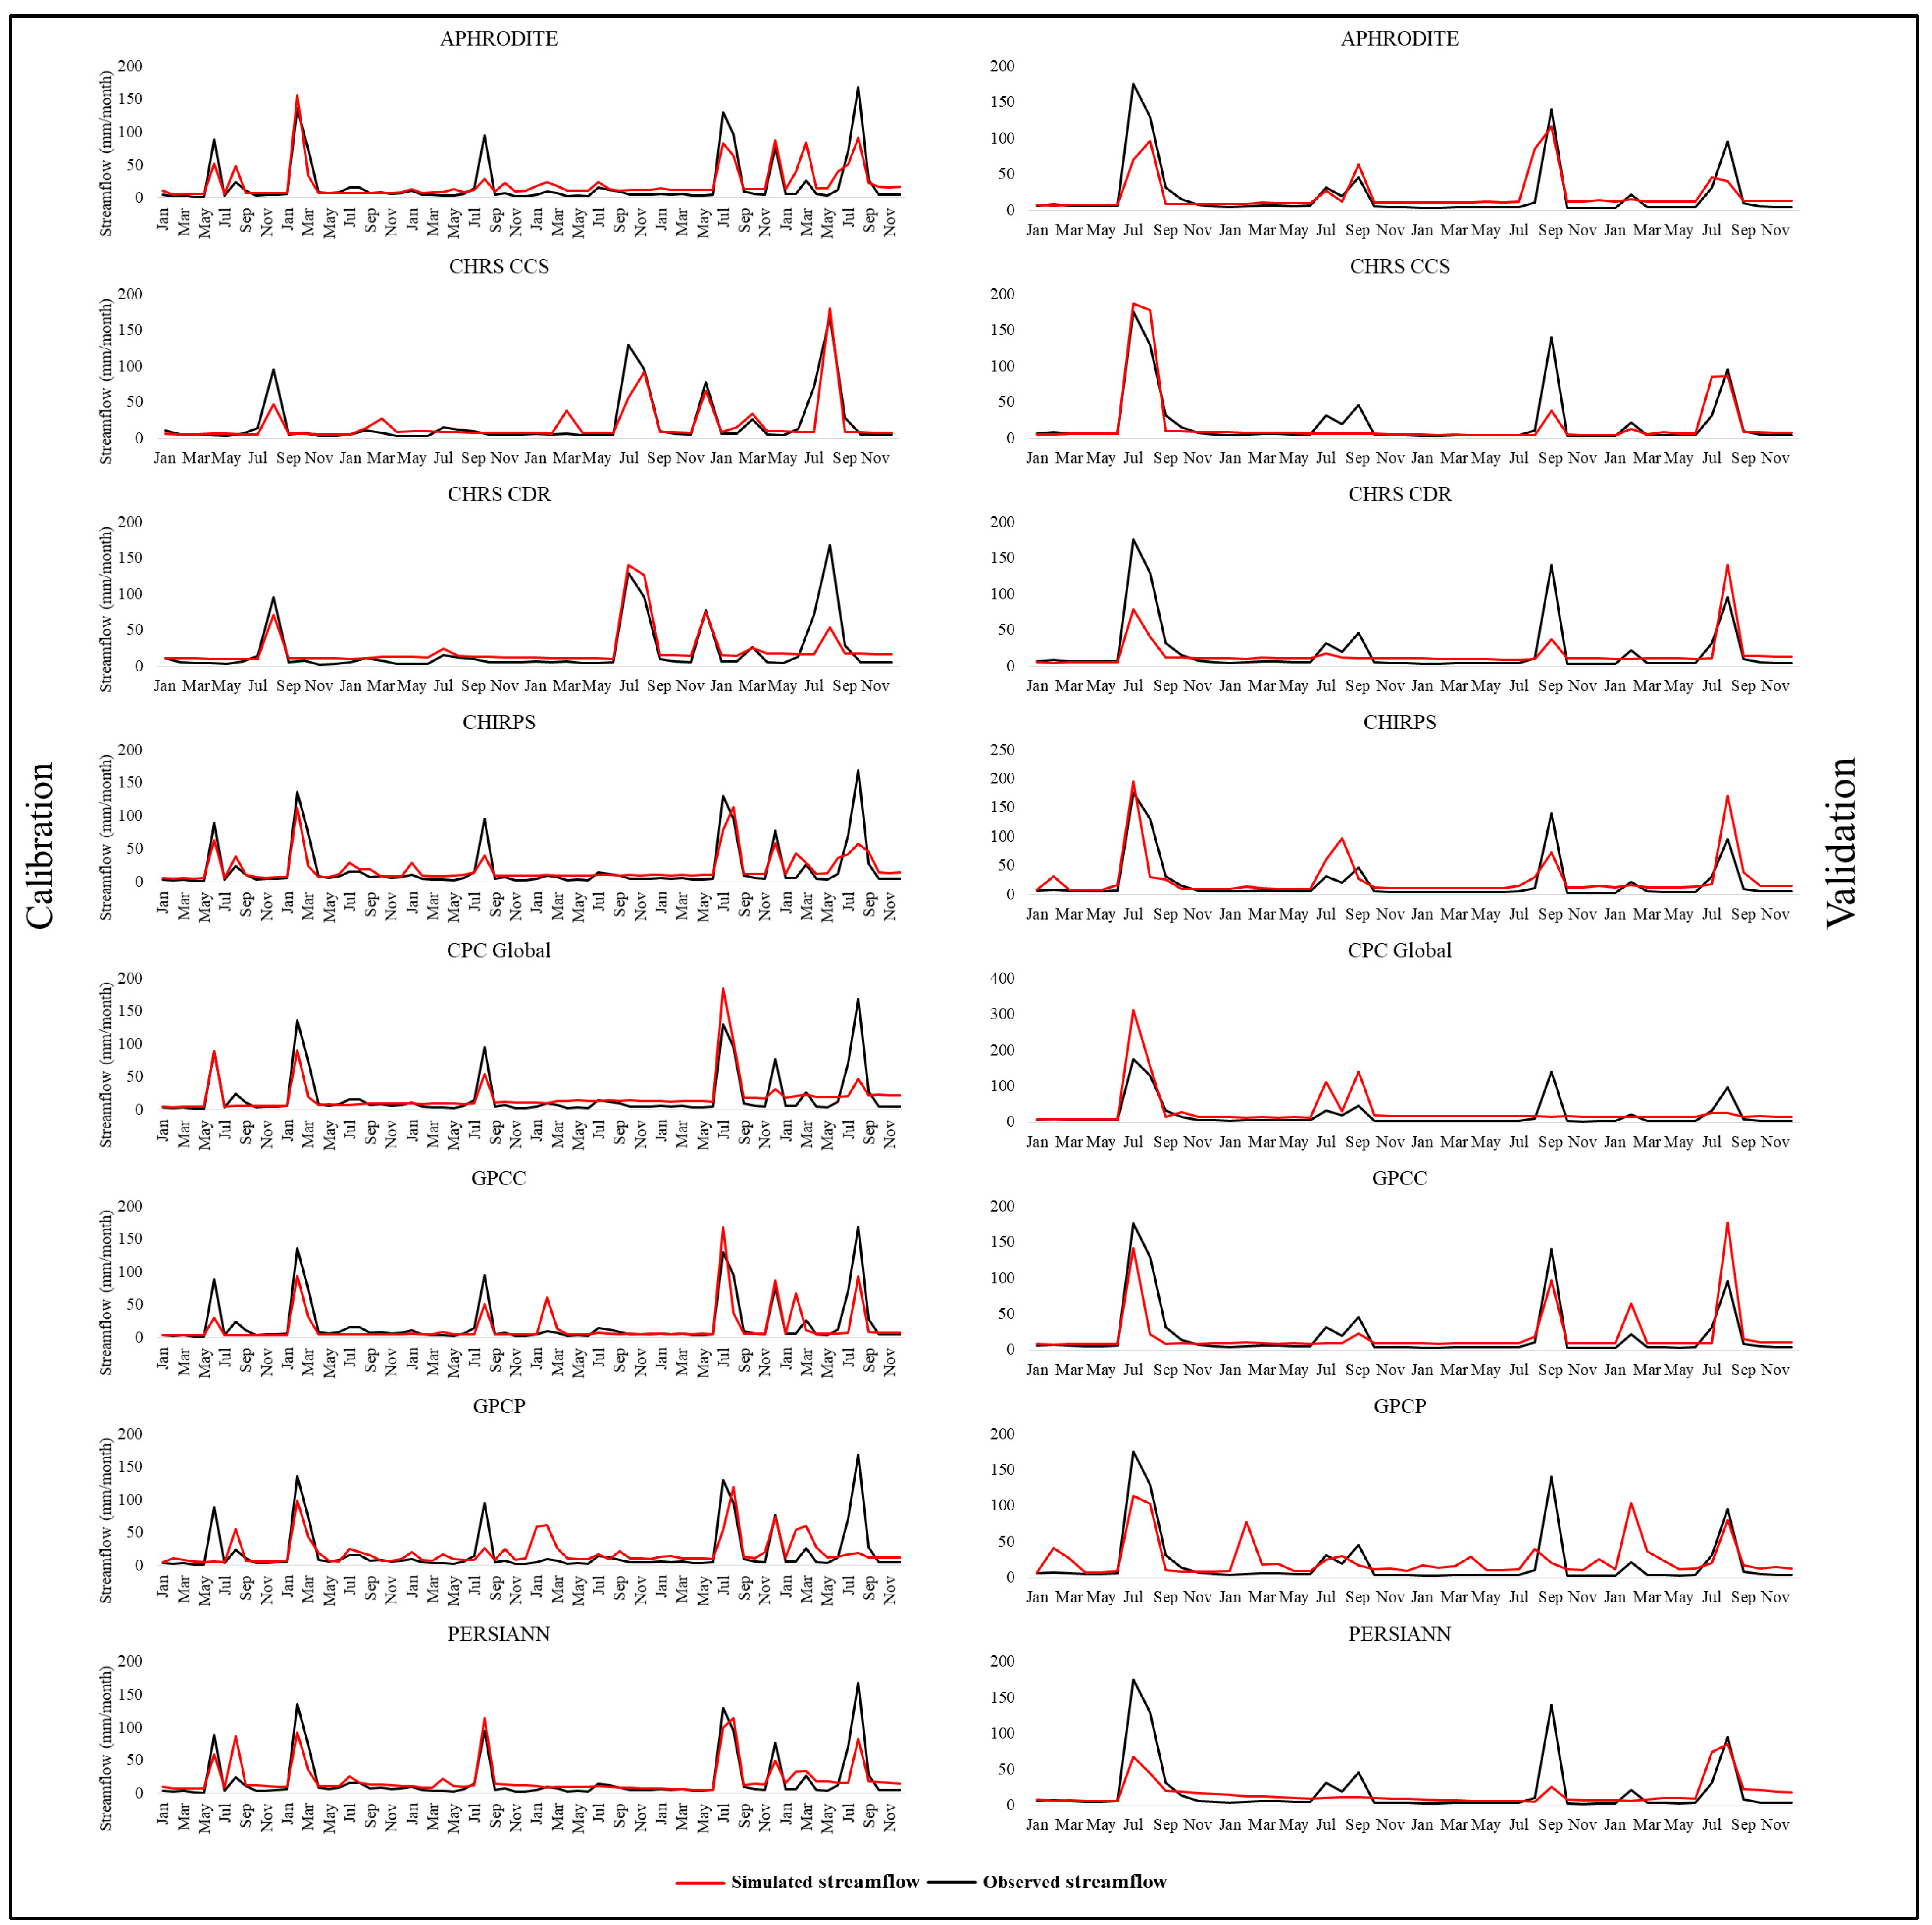
3.3. Performance of the HBV-Light in Simulating Observed Streamflow in Chirah and Dhoke Pathan Sub-Catchments with Estimated Precipitation

The daily streamflow simulated using the input of eight PPs during the calibration and validation periods for Chirah and Dhoke Pathan sub-catchments is shown in Figure S3 and Figure S4, respectively. The monthly streamflow simulated using the input of eight PPs during the calibration and validation periods for Chirah and Dhoke Pathan sub-catchments is shown in Figure 6 and Figure 7, respectively. The values of efficiency evaluation metrics for both sub-catchments at daily and monthly temporal scales are given in Table 2 and Table 3, respectively. The results indicate that APHRODITE was the only precipitation product that simulated the observed streamflow during both calibration and validation periods for both sub-catchments at both temporal scales (daily and monthly) with an accepted accuracy. The values of R2, NSE, KGE, and PBIAS obtained during the calibration (validation) period at a daily scale for the Chirah sub-catchment with precipitation from APHRODITE were 0.53, 0.53, 0.6, and −5.8% (0.57, 0.52, 0.46 and 3%), respectively. On the other hand, the values of R2, NSE, KGE, and PBIAS obtained during the calibration (validation) period at a daily scale for the Dhoke Pathan sub-catchment were 0.69, 0.69, 0.7, and 9.8% (0.52, 0.51, 0.54 and 4.29%), respectively. For a monthly scale, the values of R2, NSE, KGE, and PBIAS obtained during the calibration (validation) period at a monthly scale for the Chirah sub-catchment were 0.76, 0.76, 0.78, and −5.8% (0.68, 0.61, 0.52 and 3%), respectively. The values of R2, NSE, KGE, and PBIAS obtained during the calibration (validation) period at a monthly scale for the Dhoke Pathan sub-catchment were 0.7, 0.69, 0.68, and −8.9% (0.65, 0.63, 0.61 and 4.2%), respectively.

4. Discussion

In the setup and development of a hydrological model, parameterization and structure of the model as well as the selection of objective functions accounts for the major uncertainties [28,41]. These sources of uncertainty could be reflected by the differences between observed and simulated streamflow and the measure of fit values between observed and simulated streamflow that are achieved after the model is calibrated and validated. Our results indicated that the HBV-light’s performance in simulating observed streamflow was good, as we achieved a low difference (PBIAS of up to −3.4%) in observed and simulated streamflow and high values of measure of fit (KGE of up to 0.88). The attainment of these high values strongly suggests that multiple uncertainties that may be related to the process of calibration and validation have been kept to a minimum. Another key aspect is that this calibration and validation have been carried out using the observed (station) data, so it provides a solid benchmark for comparison of simulated streamflow during calibration and validation of the model using input data (precipitation) of PPs.
Because different PPs impact the parameterization of the model by the differences in their meteorological forcings, the use of the same calibrated model (with observed data) to simulate streamflow for PPs will result in misleading calculations and may cause uncertainties. Therefore, the HBV-light was calibrated and validated with estimated data of each PPs (APHRODITE, CHRS CCS, CHRS CDR, CHIRPS, CPC Global, GPCC, GPCP, and PERSIANN) using an optimized set of parameters.
After obtaining the streamflow simulations for calibration and validation periods for each PP and observed data, a suite of efficiency evaluation metrics (NSE, R2, KGE, and PBIAS) was used for the selection of the best performing products for streamflow prediction. A set of different value ranges was assigned to these metrics for different temporal scales i.e., daily and monthly. Only those products were considered “best performing” which fell within the defined range (see Section 2.4). This method of selecting multiple metrics and specifying ranges is both rigorous and flexible (subjective) at the same time. In terms of rigorousness, all the PPs have to go through the set criteria to be considered as products with good performance, and the flexibility of this method is reflected in the range of values as they are dependent on the overall results that are achieved (therefore it may be different for other studies). This selection method serves two purposes in this study. The first one is the identification of a PP that can be used with confidence in both the catchments at both temporal scales. The second purpose is to look for other PPs that might have the potential to be used for either one (or more) catchments or one (or more) temporal scales, i.e., a product that is not comprehensive enough to cover both catchments and both temporal scales but is good enough for one or two aspects.
Results of this study indicate that out of eight different PPs considered in this study, APHRODITE was suitable to simulate observed streamflow during calibration and validation periods with an accepted accuracy for both the Chirah and Dhoke Pathan sub-catchments at daily and monthly temporal scales, thereby fulfilling the first purpose (see paragraph above). This finding is in line with previous findings [42,43,44,45,46,47,48], which highlighted the good performance of APHRODITE for streamflow prediction in catchments with distinct characteristics. Overall, the better performance of APHRODITE in simulating observed streamflow for both sub-catchments might be attributed to the fact that it is a gauge-based product and its development is based on daily precipitation records from a large number of meteorological stations in Asia.
As far as the second purpose is concerned, our results also indicate that CHRS CCS performed with an acceptable accuracy as well at a daily time scale for the Dhoke Pathan sub-catchment; however, it did not meet the criteria to be considered a good product to simulate streamflow at monthly scale for the same sub-catchment. Further, the performance of the CHRS CCS precipitation product was poor in the Chirah sub-catchment at both temporal scales. This shows the high sensitivity of a considered PP on different catchment characteristics (e.g., size, climate, vegetation, topography, etc.), and different temporal scales. A similar result was observed for GPCC as well, but contrary to CHRS CCS its performance was good for the Chirah sub-catchment but it did not fulfill the criteria to be considered as a good PP to generate streamflow in the Dhoke Pathan sub-catchment. GPCC and GPCP were the precipitation products that reproduced observed streamflow with an acceptable accuracy for the Chirah sub-catchment on a daily scale and GPCC performed well on a monthly scale, too, in the Chirah sub-catchment.
We also found that the performance of different precipitation products in simulating observed streamflow during calibration and validation periods showed more sensitivity to PBIAS, i.e., most of the precipitation products failed to fulfill our defined criteria of acceptable accuracy in replicating observed streamflow (despite falling within the defined ranges of R2, NSE, and KGE) because their PBIAS values were out of defined range. For instance, CHRS CDR simulated the observed streamflow with an acceptable accuracy for both the Chirah and Dhoke Pathan sub-catchments as far as R2, NSE and KGE are concerned; however, PBIAS values of more than 20% were observed, which raises serious concerns on its performance and subsequent use in streamflow prediction and any other purpose in operational hydrology.
Our results also indicate that the performance of APHRODITE was comparably better (i.e., higher values of efficiency evaluation metrics) in the Dhoke Pathan sub-catchment than in the Chirah sub-catchment. Additionally, the performance of APHRODITE was much improved at a monthly scale for both sub-catchments. Even though APHRODITE showed good performance in prediction streamflow for both sub-catchments it was not able to perform as well as the observed (gauge-based) precipitation, suggesting that the estimates of precipitation could be further improved.

5. Conclusions

This study evaluated the streamflow prediction skill of eight widely used precipitation products namely, APHRODITE, CHRS CCS, CHRS CDR, CHIRPS, CPC Global, GPCC, GPCP, and PERSIANN in two sub-catchments (Chirah and Dhoke Pathan) of the Soan River Basin (SRB) in Pakistan. A semi-distributed, conceptual hydrological model HBV-light was first calibrated and validated for the two sub-catchments using observed and estimated precipitation data of different precipitation products. The HBV-light performed well in simulating the observed streamflow of the two catchments using observed data. Then, the HBV-light was calibrated and validated with precipitation data from the aforementioned products. Different evaluation metrics (NSE, R2, KGE, and PBIAS) were used to assess the performance of streamflow simulated with precipitation products. The results of this study indicate that the APHRODITE was the only precipitation product (as defined by the selection criteria) that was able to represent the observed streamflow with accuracy at daily and monthly time scales for the Chirah and Dhoke Pathan sub-catchments. Other products which showed potential were not as comprehensive as APHRODITE was, and include GPCC and GPCP for a daily time scale and GPCC for a monthly time scale for the Chirah sub-catchment, and CHRS CCS for a monthly time scale for the Dhoke Pathan sub-catchment. This conclusion also introduces the limitations of this work. The findings of this study may not be the same for other regions. In further studies, more conclusions should be drawn in comparison to our conclusion in terms of streamflow prediction in semi-arid river basins using multi-source precipitation products. This will pave the way for a general conclusion about the feasibility of certain precipitation products for streamflow prediction in other semi-arid regions of the world. Additionally, combinations of different hydrological models (having different internal structures) should be used along with a suite of precipitation products that have different development mechanisms to better understand the impact of internal structures of hydrological models and precipitation products on the final conclusions about the best performing products for streamflow prediction.

Supplementary Materials

The following supporting information can be downloaded at: https://www.mdpi.com/article/10.3390/w14081260/s1, Table S1: Description of multi-source PPs used in this study; Figure S1: Performance of different PPs against gauged precipitation in simulating daily precipitation in Dhoke Pathan sub-catchment; Figure S2: Performance of different PPs against gauged precipitation in simulating monthly precipitation in Dhoke Pathan sub-catchment; Figure S3: Daily streamflow during calibration and validations periods simulated by the HBV-light forced with the precipitation input from eight products in Chirah sub-catchment; Figure S4: Daily streamflow during calibration and validations periods simulated by the HBV-light forced with the precipitation input from eight products in Dhoke Pathan sub-catchment; Table S2: Parameter ranges for optimized performance of the HBV-light during calibration and validation periods with observed precipitation data. References [49,50,51,52,53,54,55,56] are cited in the “Supplementary Materials”.

Author Contributions

Conceptualization, M.U. and C.E.N.; Data curation, M.U., B.A. and Y.W.; Formal analysis, M.U., B.A. and O.E.A.; Funding acquisition, C.E.N.; Investigation, M.U.; Methodology, M.U. and C.E.N.; Project administration, C.E.N.; Resources, C.E.N.; Software, H.F., B.A. and Y.W.; Supervision, C.E.N. and H.F.; Validation, C.E.N., H.F. and O.E.A.; Writing—original draft, M.U.; Writing—review & editing, M.U., C.E.N., H.F., B.A., Y.W. and O.E.A. All authors have read and agreed to the published version of the manuscript.

Funding

The APC for this study was funded by GRIFFITH UNIVERSITY, AUSTRALIA.

Institutional Review Board Statement

Not applicable.

Informed Consent Statement

Not applicable.

Data Availability Statement

The data presented in this study is available on appropriate request from the corresponding author.

Acknowledgments

Hydrometeorological data was provided by the Pakistan Meteorological Department and Surface Water Hydrology Project of Water and Power Development Authority, Pakistan. The authors are grateful to these organizations.

Conflicts of Interest

The authors declare no conflict of interest.

References

  1. Ndehedehe, C.E.; Ferreira, V.G.; Onojeghuo, A.O.; Agutu, N.O.; Emengini, E.; Getirana, A. Influence of global climate on freshwater changes in Africa’s largest endorheic basin using multi-scaled indicators. Sci. Total Environ. 2020, 737, 139643. [Google Scholar] [CrossRef] [PubMed]
  2. Ricci, G.F.; De Girolamo, A.M.; Abdelwahab, O.M.M.; Gentile, F. Identifying sediment source areas in a Mediterranean watershed using the SWAT model. Land Degrad. Dev. 2018, 29, 1233–1248. [Google Scholar] [CrossRef]
  3. Serpa, D.; Nunes, J.P.; Santos, J.; Sampaio, E.; Jacinto, R.; Veiga, S.; Lima, J.C.; Moreira, M.; Corte-Real, J.; Keizer, J.J.; et al. Impacts of climate and land use changes on the hydrological and erosion processes of two contrasting Mediterranean catchments. Sci. Total Environ. 2015, 538, 64–77. [Google Scholar] [CrossRef] [Green Version]
  4. Sorando, R.; Comín, F.A.; Jiménez, J.J.; Sánchez-Pérez, J.M.; Sauvage, S. Water resources and nitrate discharges in relation to agricultural land uses in an intensively irrigated watershed. Sci. Total Environ. 2019, 659, 1293–1306. [Google Scholar] [CrossRef] [PubMed]
  5. Behrangi, A.; Khakbaz, B.; Jaw, T.C.; AghaKouchak, A.; Hsu, K.; Sorooshian, S. Hydrologic evaluation of satellite precipitation products over a mid-size basin. J. Hydrol. 2011, 397, 225–237. [Google Scholar] [CrossRef] [Green Version]
  6. Derin, Y.; Anagnostou, E.; Berne, A.; Borga, M.; Boudevillain, B.; Buytaert, W.; Chang, C.H.; Delrieu, G.; Hong, Y.; Hsu, Y.C.; et al. Multiregional satellite precipitation products evaluation over complex terrain. J. Hydrometeorol. 2016, 17, 1817–1836. [Google Scholar] [CrossRef]
  7. Brocca, L.; Massari, C.; Pellarin, T.; Filippucci, P.; Ciabatta, L.; Camici, S.; Kerr, Y.H.; Fernández-Prieto, D. River flow prediction in data scarce regions: Soil moisture integrated satellite rainfall products outperform rain gauge observations in West Africa. Sci. Rep. 2020, 10, 12517. [Google Scholar] [CrossRef]
  8. Voisin, N.; Wood, A.W.; Lettenmaier, D.P. Evaluation of precipitation products for global hydrological prediction. J. Hydrometeorol. 2008, 9, 388–407. [Google Scholar] [CrossRef] [Green Version]
  9. Pilgrim, D.H.; Chapman, T.G.; Doran, D.G. Problems of rainfall-runoff modelling in arid and semiarid regions. Hydrol. Sci. J. 1988, 33, 379–400. [Google Scholar] [CrossRef]
  10. Huang, P.; Li, Z.; Chen, J.; Li, Q.; Yao, C. Event-based hydrological modeling for detecting dominant hydrological process and suitable model strategy for semi-arid catchments. J. Hydrol. 2016, 542, 292–303. [Google Scholar] [CrossRef]
  11. Usman, M.; Pan, X.; Penna, D.; Ahmad, B. Hydrologic alteration and potential ecosystem implications under a changing climate in the Chitral River, Hindukush region, Pakistan. J. Water Clim. Chang. 2021, 12, 1471–1486. [Google Scholar] [CrossRef]
  12. Immerzeel, W.W.; Petersen, L.; Ragettli, S.; Pellicciotti, F. The importance of observed gradients of air temperature and precipitation for modeling runoff from a glacierized watershed in the Nepal Himalayas. Water Resour. Res. 2014, 50, 2212–2226. [Google Scholar] [CrossRef] [Green Version]
  13. Sapiano, M.R.P.; Arkin, P. An intercomparison and validation of high-resolution satellite precipitation estimates with 3-hourly gauge data. J. Hydrometeor. 2009, 10, 149–166. [Google Scholar] [CrossRef]
  14. Kidd, C.; Levizzani, V. Status of satellite precipitation retrievals. Hydrol. Earth Syst. Sci. 2011, 15, 1109–1116. [Google Scholar] [CrossRef] [Green Version]
  15. Bui, H.T.; Ishidaira, H.; Shaowei, N. Evaluation of the use of global satellite–gauge and satellite-only precipitation products in stream flow simulations. Appl. Water Sci. 2019, 9, 53. [Google Scholar] [CrossRef] [Green Version]
  16. Ebert, E.E.; Janowiak, J.E.; Kidd, C. Comparison of near-real-time precipitation estimates from satellite observations and numerical models. Bull. Am. Meteorol. Soc. 2007, 88, 47–64. [Google Scholar] [CrossRef] [Green Version]
  17. AghaKouchak, A.; Nasrollahi, N.; Habib, E. Accounting for uncertainties of the trmm satellite estimates. Remote Sens. 2009, 1, 606–619. [Google Scholar] [CrossRef] [Green Version]
  18. Yi, L.; Zhang, W.; Wang, K. Evaluation of heavy precipitation simulated by the WRF model using 4D-Var data assimilation with TRMM 3B42 and GPM IMERG over the Huaihe River Basin, China. Remote Sens. 2018, 10, 646. [Google Scholar] [CrossRef] [Green Version]
  19. Nazeer, S.; Hashmi, M.Z.; Malik, R.N. Spatial and seasonal dynamics of fish assemblage along river Soan, Pakistan and its relationship with environmental conditions. Ecol. Indic. 2016, 69, 780–791. [Google Scholar] [CrossRef]
  20. Harris, I.; Osborn, T.J.; Jones, P.; Lister, D. Version 4 of the CRU TS monthly high-resolution gridded multivariate climate dataset. Sci. Data 2020, 7, 109. [Google Scholar] [CrossRef] [Green Version]
  21. Ji, X.; Li, Y.; Luo, X.; He, D.; Guo, R.; Wang, J.; Bai, Y.; Yue, C.; Liu, C. Evaluation of bias correction methods for APHRODITE data to improve hydrologic simulation in a large Himalayan basin. Atmos. Res. 2020, 242, 104964. [Google Scholar] [CrossRef]
  22. Sun, Q.; Miao, C.; Duan, Q.; Ashouri, H.; Sorooshian, S.; Hsu, K.-L. A review of global precipitation data sets: Data sources, estimation, and intercomparisons. Rev. Geophys. 2018, 56, 79–107. [Google Scholar] [CrossRef] [Green Version]
  23. Beck, H.E.; Pan, M.; Roy, T.; Weedon, G.P.; Pappenberger, F.; Van Dijk, A.I.; Huffman, G.J.; Adler, R.F.; Wood, E.F. Daily evaluation of 26 precipitation datasets using Stage-IV gauge-radar data for the CONUS. Hydrol. Earth Syst. Sci. 2019, 23, 207–224. [Google Scholar] [CrossRef] [Green Version]
  24. Beck, H.E.; Vergopolan, N.; Pan, M.; Levizzani, V.; Van Dijk, A.I.; Weedon, G.P.; Brocca, L.; Pappenberger, F.; Huffman, G.J.; Wood, E.F. Global-scale evaluation of 22 precipitation datasets using gauge observations and hydrological modeling. Hydrol. Earth Syst. Sci. 2017, 21, 6201–6217. [Google Scholar] [CrossRef] [Green Version]
  25. Bergström, S. Development and Application of a Conceptual Runoff Model for Scandinavian Catchments; Sveriges Meteorologiska Och Hydrologiska Institute: Norrköping, Sweden, 1976; 134p. [Google Scholar]
  26. Lindström, G.; Johansson, B.; Persson, M.; Gardelin, M.; Bergström, S. Development and test of the distributed HBV-96 hydrological model. J. Hydrol. 1997, 201, 272–288. [Google Scholar] [CrossRef]
  27. Seibert, J.; Vis, M.J.P. Teaching hydrological modeling with a user-friendly catchment-runoff model software package. Hydrol. Earth. Syst Sci. 2012, 16, 3315–3325. [Google Scholar] [CrossRef] [Green Version]
  28. Hakala, K.; Addor, N.; Seibert, J. Hydrological Modeling to Evaluate Climate Model Simulations and Their Bias Correction. J. Hydrometeorol. 2018, 19, 1321–1337. [Google Scholar] [CrossRef]
  29. Meresa, H.K.; Gatachew, M.T. Climate change impact on river flow extremes in the Upper Blue Nile River basin. J. Water Clim. Chang. 2019, 10, 759–781. [Google Scholar] [CrossRef]
  30. Ahmad, B.; Usman, M.; Bukhari, S.A.A.; Sajjad, H. Contribution of glacier, snow and rain components in flow regime projected with HBV under AR5 based climate change scenarios over Chitral river basin (Hindukush Ranges, Pakistan). Int. J. Clim. Res. 2020, 4, 24–36. [Google Scholar]
  31. Usman, M.; Ndehedehe, C.E.; Manzanas, R.; Ahmad, B.; Adeyeri, O.E. Impacts of climate change on the hydrometeorological characteristics of the soan river basin, Pakistan. Atmosphere 2021, 12, 792. [Google Scholar] [CrossRef]
  32. Seibert, J. HBV Light Version 2. User’s Manual. Stockholm University, 2005. Available online: https://www.geo.uzh.ch/dam/jcr:c8afa73c-ac90-478e-a8c7-929eed7b1b62/HBV_manual_2005.pdf (accessed on 15 January 2022).
  33. Nash, J.E.; Sutcliffe, J.V. River flow forecasting through conceptual models part I–a discussion of principles. J. Hydrol. 1970, 10, 282–290. [Google Scholar] [CrossRef]
  34. Gupta, H.V.; Kling, H.; Yilmaz, K.K.; Martinez, G.F. Decomposition of the mean squared error and NSE performance criteria: Implications for improving hydrological modelling. J. Hydrol. 2009, 377, 80–91. [Google Scholar] [CrossRef] [Green Version]
  35. Alnahit, A.O.; Mishra, A.K.; Khan, A.A. Evaluation of high-resolution satellite products for streamflow and water quality assessment in a Southeastern US watershed. J. Hydrol. Reg. Stud. 2020, 27, 100660. [Google Scholar] [CrossRef]
  36. Rivera, J.A.; Hinrichs, S.; Marianetti, G. Using CHIRPS Dataset to Assess Wet and Dry Conditions along the Semiarid Central-Western Argentina. Adv. Meteorol. 2019, 2019, 8413964. [Google Scholar] [CrossRef] [Green Version]
  37. Santra Mitra, S.; Santra, A.; Kumar, A. Catchment specific evaluation of Aphrodite’s and TRMM derived gridded precipitation data products for predicting runoff in a semi gauged watershed of Tropical India. Geocarto Int. 2021, 36, 1292–1308. [Google Scholar] [CrossRef]
  38. Tuo, Y.; Duan, Z.; Disse, M.; Chiogna, G. Evaluation of precipitation input for SWAT modeling in Alpine catchment: A case study in the Adige river basin (Italy). Sci. Total Environ. 2016, 573, 66–82. [Google Scholar] [CrossRef] [Green Version]
  39. Van Liew, M.W.; Arnold, J.G.; Garbrecht, J.D. Hydrologic simulation on agricultural watersheds: Choosing between two models. Trans. ASAE 2003, 46, 1539–1551. [Google Scholar] [CrossRef]
  40. Moriasi, D.N.; Gitau, M.W.; Pai, N.; Daggupati, P. Hydrologic and water quality models: Performance measures and evaluation criteria. Trans. ASABE 2015, 58, 1763–1785. [Google Scholar]
  41. Usman, M.; Ndehedehe, C.E.; Farah, H.; Manzanas, R. Impacts of climate change on the streamflow of a large river basin in the Australian tropics using optimally selected climate model outputs. J. Clean. Prod. 2021, 315, 128091. [Google Scholar] [CrossRef]
  42. Ménégoz, M.; Gallée, H.; Jacobi, H.W. Precipitation and snow cover in the Himalaya: From reanalysis to regional climate simulations. Hydrol. Earth Syst. Sci. 2013, 17, 3921–3936. [Google Scholar] [CrossRef] [Green Version]
  43. Lauri, H.; Räsänen, T.A.; Kummu, M. Using reanalysis and remotely sensed temperature and precipitation data for hydrological modeling in monsoon climate: Mekong River case study. J. Hydrometeorol. 2014, 15, 1532–1545. [Google Scholar] [CrossRef]
  44. Chen, C.J.; Senarath, S.U.; Dima-West, I.M.; Marcella, M.P. Evaluation and restructuring of gridded precipitation data over the Greater Mekong Subregion. Int. J. Climatol. 2017, 37, 180–196. [Google Scholar] [CrossRef]
  45. Li, H.; Haugen, J.E.; Xu, C.Y. Precipitation pattern in the Western Himalayas revealed by four datasets. Hydrol. Earth Syst. Sci. 2018, 22, 5097–5110. [Google Scholar] [CrossRef] [Green Version]
  46. Guan, X.; Zhang, J.; Yang, Q.; Tang, X.; Liu, C.; Jin, J.; Liu, Y.; Bao, Z.; Wang, G. Evaluation of Precipitation Products by Using Multiple Hydrological Models over the Upper Yellow River Basin, China. Remote Sens. 2020, 12, 4023. [Google Scholar] [CrossRef]
  47. Usman, M.; Ndehedehe, C.E.; Ahmad, B.; Manzanas, R.; Adeyeri, O.E. Modeling streamflow using multiple precipitation products in a topographically complex catchment. Model. Earth Syst. Environ. 2021, 1–11. [Google Scholar] [CrossRef]
  48. Tian, W.; Liu, X.; Wang, K.; Bai, P.; Liang, K.; Liu, C. Evaluation of six precipitation products in the Mekong River Basin. Atmos. Res. 2021, 255, 105539. [Google Scholar] [CrossRef]
  49. Yatagai, A.; Kamiguchi, K.; Arakawa, O.; Hamada, A.; Yasutomi, N.; Kitoh, A. APHRODITE: Constructing a long-term daily gridded precipitation dataset for Asia based on a dense network of rain gauges. Bull. Am. Meteorol. Soc. 2012, 93, 1401–1415. [Google Scholar] [CrossRef]
  50. Funk, C.; Peterson, P.; Landsfeld, M.; Pedreros, D.; Verdin, J.; Shukla, S.; Michaelsen, J. The climate hazards infrared precipitation with stations—A new environmental record for monitoring extremes. Sci. Data 2015, 2, 150066. [Google Scholar] [CrossRef] [Green Version]
  51. Xie, P.; Chen, M.; Shi, W. CPC Global Unified Gauge-Based Analysis of Daily Precipitation. Available online: https://psl.noaa.gov/data/gridded/data.cpc.globalprecip.html (accessed on 13 December 2021).
  52. Schamm, K.; Ziese, M.; Becker, A.; Finger, P.; Meyer-Christoffer, A.; Schneider, U.; Stender, P. Global gridded precipitation over land: A description of the new GPCC First Guess Daily product. Earth Syst. Sci. Data 2014, 6, 49–60. [Google Scholar] [CrossRef] [Green Version]
  53. Huffman, G.J.; Adler, R.F.; Morrissey, M.M.; Bolvin, D.T.; Curtis, S.; Joyce, R.; Susskind, J. Global precipitation at one-degree daily resolution from multisatellite observations. J. Hydrometeorol. 2001, 2, 36–50. [Google Scholar] [CrossRef] [Green Version]
  54. Sorooshian, S.; Hsu, K.L.; Gao, X.; Gupta, H.V.; Imam, B.; Braithwaite, D. Evaluation of PERSIANN system satellite-based estimates of tropical rainfall. Bull. Am. Meteorol. Soc. 2000, 81, 2035–2046. [Google Scholar] [CrossRef] [Green Version]
  55. Hong, Y.; Hsu, K.L.; Sorooshian, S.; Gao, X. Precipitation estimation from remotely sensed imagery using an artificial neural network cloud classification system. J. Appl. Meteorol. 2003, 43, 1834–1853. [Google Scholar] [CrossRef] [Green Version]
  56. Ashouri, H.; Hsu, K.L.; Sorooshian, S.; Braithwaite, D.K.; Knapp, K.R.; Cecil, L.D.; Prat, O.P. PERSIANN-CDR: Daily precipitation climate data record from multisatellite observations for hydrological and climate studies. Bull. Am. Meteorol. Soc. 2015, 96, 69–83. [Google Scholar] [CrossRef] [Green Version]
Figure 1. Location and characteristics of the study catchments, (a) Soan River Basin with both Chirah and Dhoke Pathan sub-catchments with overall elevation ranges (b) Chirah sub-catchment with its elevation ranges.
Water 14 01260 g001
Figure 2. Daily Streamflow during calibration and validations periods simulated by the HBV-light forced with the gauged data in Chirah and Dhoke Pathan sub-catchments.
Water 14 01260 g002
Figure 3. Monthly streamflow during calibration and validations periods simulated by the HBV-light forced with the gauged data in Chirah and Dhoke Pathan sub-catchments.
Water 14 01260 g003
Figure 4. Performance of different PPs against gauged precipitation in simulating daily precipitation in Chirah sub-catchment.
Water 14 01260 g004
Figure 5. Performance of different PPs against gauged precipitation in simulating monthly precipitation in Chirah sub-catchment.
Water 14 01260 g005
Figure 6. Monthly streamflow during calibration and validations periods simulated by the HBV-light forced with the precipitation input from eight PPs in the Chirah sub-catchment.
Water 14 01260 g006
Figure 7. Monthly streamflow during calibration and validations periods simulated by the HBV-light forced with the precipitation input from eight PPs in the Dhoke Pathan sub-catchment.
Water 14 01260 g007
Table 1. Efficiency evaluation metrics and their ranges for selection of best performing PPs for streamflow prediction at daily and monthly timescales in Chirah and Dhoke Pathan sub-catchments.
Efficiency Evaluation MetricsDailyMonthly
NSE>0.5>0.6
R2>0.5>0.6
PBIAS<±15% <±10%
KGE>0.4>0.6
Table 2. Performance of eight PPs in simulating daily streamflow for Chirah and Dhoke Pathan sub-catchments.
Chirah Sub-Catchment
CalibrationValidation
R2NSEKGEPBIASR2NSEKGEPBIAS
APHRODITE 0.530.530.60−5.810.570.520.463.02
CHRS CCS0.070.06−0.09−10.270.00−0.01−0.22−24.92
CHRS CDR0.620.620.711.810.510.500.55−27.87
CHIRPS0.100.100.05−14.730.140.130.15−17.44
CPC Global0.110.110.05−18.370.120.120.09−9.54
GPCC0.540.540.60−3.410.510.500.64−8.89
GPCP0.700.700.77−5.480.670.640.57−14.48
PERSIANN0.100.100.02−14.040.020.02−0.18−30.07
Dhoke Pathan sub-catchment
APHRODITE 0.690.690.709.800.520.510.544.29
CHRS CCS0.710.700.75−10.810.680.650.80−8.44
CHRS CDR0.730.730.769.720.640.540.41−20.00
CHIRPS0.570.570.611.460.03−0.870.1230.49
CPC Global0.560.560.650.360.490.280.3752.81
GPCC0.650.640.58−23.400.590.580.691.41
GPCP0.170.170.144.730.210.210.1829.26
PERSIANN0.650.640.698.280.530.440.35−16.29
Table 3. Performance of eight PPs in simulating monthly streamflow for Chirah and Dhoke Pathan sub-catchments.
Chirah Sub-Catchment
CalibrationValidation
R2NSEKGEPBIASR2NSEKGEPBIAS
APHRODITE 0.760.760.78−5.820.680.610.523.00
CHRS CCS0.280.280.3311.440.04−0.160.08−24.94
CHRS CDR0.820.800.771.840.700.670.64−27.85
CHIRPS0.390.360.54−14.750.510.490.60−17.46
CPC Global0.300.250.44−18.380.590.580.58−9.54
GPCC0.780.780.79−3.430.850.840.82−10.13
GPCP0.820.820.83−5.500.780.720.59−14.49
PERSIANN0.360.350.42−14.040.08−0.010.11−30.07
Dhoke Pathan sub-catchment
APHRODITE 0.700.690.68−8.930.650.630.614.28
CHRS CCS0.760.750.7612.140.730.70.83−8.46
CHRS CDR0.660.660.689.700.510.480.45−20.01
CHIRPS0.710.670.601.440.590.520.6230.51
CPC Global0.600.600.680.150.560.090.3052.82
GPCC0.630.620.63−23.430.610.600.751.41
GPCP0.300.300.414.740.420.390.4529.25
PERSIANN0.720.710.698.260.490.420.36−16.30
Publisher’s Note: MDPI stays neutral with regard to jurisdictional claims in published maps and institutional affiliations.

