
Laboratory Tests of Water Level Regulators in Ditches of Irrigation Systems
by
 , , ,
, , ,
Janusz Urbański
1 ,
,
Sławomir Bajkowski
1,
Piotr Siwicki
2,
Ryszard Oleszczuk
2,
Andrzej Brandyk
3,* and
Zbigniew Popek
2 1
Institute of Civil Engineering, Warsaw University of Life Sciences, 02-787 Warsaw, Poland
2
Institute of Environmental Engineering, Warsaw University of Life Sciences, 02-787 Warsaw, Poland
3
Water Centre, Warsaw University of Life Sciences, 02-766 Warsaw, Poland
*
Author to whom correspondence should be addressed.
Water 2022, 14(8), 1259; https://doi.org/10.3390/w14081259
Submission received: 21 January 2022
/
Revised: 6 April 2022
/
Accepted: 8 April 2022
/
Published: 13 April 2022
(This article belongs to the Special Issue Water, Wastewater, Waste Management in Agriculture and Agri-Food Industry)
Abstract
:Observed changes in hydrological conditions indicate the need for economical use of water. This pertains to water management on a national scale, river basins and drainage systems. The outflow of water can be extensively regulated after various forms of retention in the catchment. The water level regulators presented herein enable the damming of water in drainage networks and the adjacent ground. Their advantages include their simple structure and operation principles and also the ability to adapt to currently existing devices in sub-irrigation systems. Laboratory tests were conducted to determine the hydraulic characteristics and operating conditions of three innovative regulator solutions. They focused on changing water damming heights by the closure of successively placed beams in order to obtain the required water level in the given hydrometeorological conditions. The structures of the regulators were made of plastics and rectilinear fillings for securing S-type excavations and elements of sheet piling with a developed shape in the plan of U and Z types, offering advantages compared to traditional materials (with respect to installation, operation and durability). All tested regulators were characterized by the effective flow Qe, caused by water leaks due to the lack of tightness of the regulator elements. The regulator with rectilinear beams of S-type closures offered the highest effective flow, which was 4 ÷ 5 times higher than in other regulators. U- and Z-type regulators were better at facilitating the regulation of the water table and the flow than the S rectilinear regulator. This led to both: the greater tightness of connections and the use of an overflow with a developed crest in the plan. The U and Z controllers had the highest hydraulic efficiency, expressed as the flow increase coefficient, at overflow layer heights of up to 5.0 cm. For tested fillings larger than 5.0 cm, U-type beams with a cylindrical corner shape had a lower flow increase coefficient (kq = 1.25) than Z-type beams with an angular corner shape, for which kq ∈ <1.35 ÷ 1.38>.
1. Introduction
Water resources in Poland have been found to be the lowest among European countries. The reasons for this are the climatic and physiographic conditions and the overlapping of oceanic and continental climates [1]. This leads to lower precipitation compared to other European countries and contributes to its high seasonal and spatial variability. Furthermore, the observed climate changes may also impact the shortages of water resources in Poland [2,3], with the simultaneous occurrence of extreme weather phenomena such as floods and droughts. The latter are extremely harmful to agriculture, resulting in a reduction in yields, especially in areas with drainage systems but without devices for water damming [4,5,6,7,8].
For the needs of crop production, water collection and runoff control are often carried out in open drainage systems (ditches) [9,10,11,12] and closed systems (drains) [13,14,15]. For the regulation of flow in watercourses and reservoirs [16], tower regulators, vortex regulators or gate valves and overflow regulators [17,18] are applied, as well as float regulators for the upper or lower water levels [19]. One of the ways to increase retention in drainage facilities is the use of water-damming regulators in ditches influencing the adjacent ground [20,21,22,23]. These devices slow the outflow from the facility, taking into account the optimal level of plant desiccation/irrigation in these areas [24], but also allow proper water management through appropriate water distribution in drainage/sub-irrigation networks [4,25].
The necessity to block the outflow of water in drained valley areas as well as soils of low peat (fen) bogs is of additional importance. These sites are usually equipped with drainage systems that only drain water from their catchments. In Poland, about 80% of the valley soils of low fen-peat (1.2 million ha) are already drained [26,27]. This leads to many unfavorable changes in the physical, chemical and biological properties of the top layers of such soils [28,29,30,31]. Often, they require restoration by blocking the outflow of surface waters and raising the groundwater table to a depth of approx. 30–50 cm below the surface [32,33,34,35,36,37]. Unfortunately, in Poland, many drainage systems of this type have been subsequently decapitalized and thus deprived of water-damming elements. For example, in the drained soils of a fen (Solec site, central Poland) equipped with a dense network of drainage ditches (62 ditches), none of the hydraulic structures (3 valves and 42 valve culverts) has the capacity for damming [12,25].
For that reason [38] and also due to the need to provide more advanced, modern solutions, the development of water-damming regulators in drainage ditches has become one of the goals of the INOMEL project—“Technological innovations and a system for monitoring, forecasting and operational planning of drainage activities for precise water management on the scale of a drainage facility” (BIOSTRATEG3/347837/11/NCBR/2017). The innovative character involved the typical elements of the beams, which are widely applied in civil engineering, pointing at advantages such as the flexibility of installation and water damming. The underlying theory involves proper weir types, e.g., sharp-crested weir, and relevant discharge equations that cannot fully support the cases analyzed herein. The resolved modeling experiment aimed to determine relationships, which, indeed, were not well-defined by existing formulas and therefore required an empirical approach.
Available hydraulic weir equations do not capture the effective flow (Qe) through openings between beams, seals and guides and leakage through locks at beam connections. In contemporary literature sources, no sufficient attention is given to hydraulic losses and simultaneous local loss coefficients for such diverse and irregular hydraulic forms. Therefore, there is an important role for research executed on real-scale models to focus on artificial material prototypes, which have not been widely popular with drainage/irrigation systems so far. Their advantage over existing traditional materials (steel or wood) is manifested in operating costs, precise installation, weight, operation and resilience. These novel regulators were, in particular, subject to the determination of empirical relationships with effective flow and its utilization for total flow estimation in the case of S (rectilinear), U (labyrinth) and Z (compound crest) shapes so as to gain insight into tightness and water level regulation capabilities. Their tests and validation in laboratory conditions were conducted at the Hydraulic Laboratory of the Warsaw University of Life Sciences.
2. Materials and Methods
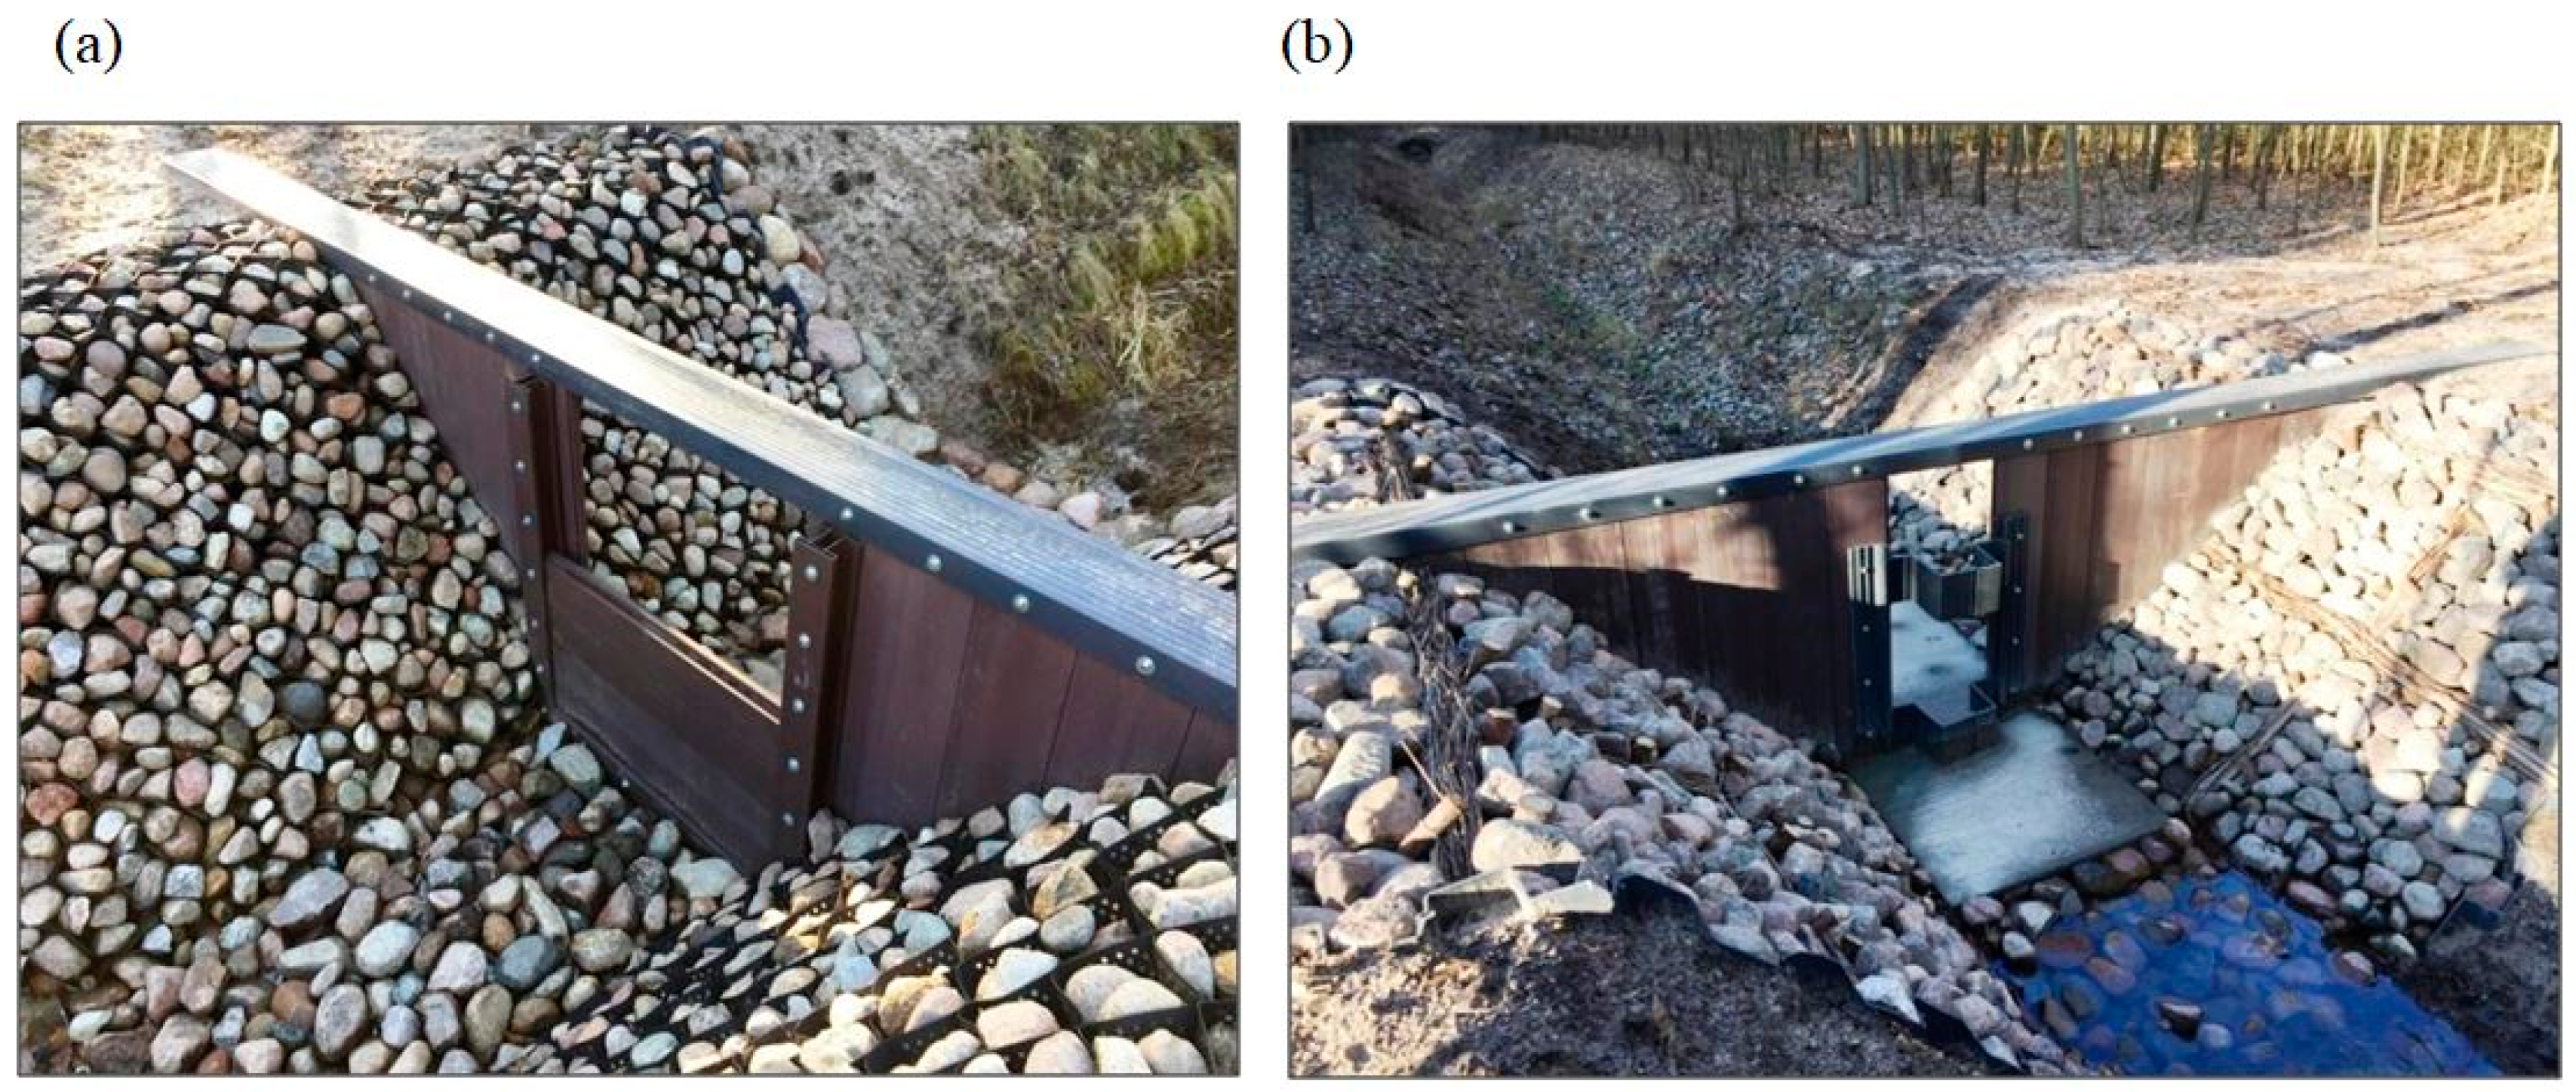
In open drainage systems, gate valves with wooden beams or steel gates are usually used to regulate the flow and water level. The tested prototype beam regulators used typical structural elements of sheet piling, i.e., plastic sheet piles. In such a construction, the top edge of one or more successive elements is at a lowered level. In this way, a cut-out is created that forms the overflow of the fixed regulator. The sheet piles are placed in the ground at such a depth that the position of their upper edge corresponds to the ordinate of the required damming, with the overflow crest remaining constant over time. A greater range of regulation is ensured by the use of beam regulators. After the installation of a number of beams, the upper edge of the uppermost beam forms the control overflow with a discharge rate influenced by: H (cm)—water depth in the upper stand; P (cm)—the height of the threshold regulated by the number of beams; the height of the water layer flowing over the crest (H − P); and the shape of the elements used to make the closure beams. The shape of the beams determines the active length of the overflow through the arrangement of its crest and the geometry of the edge. These are devices that allow for changing the water damming level in the range from the height of the fixed sill to the ordinate, depending on the number of beams applied (Figure 1).
This study used the results of research on rectilinear beam regulators (GW458/11, Pietrucha—J. Gralewski, Blaszki, Poland) (Figure 1a) and labyrinth regulators (GW458/12, Pietrucha—J. Gralewski, Blaszki, Poland) (Figure 1b), with the overflow in the plan having a complex shape. The proposed prototype devices were developed in relation to typical existing structures of drainage gates regulating the outflow of water from ditches, that is, from objects with a bottom width of up to 1.50 m and a depth of up to 1.00 m. The research methodology for other types of beams is consistent with the methods described in this paper, which also presents the analysis of S-, U- and Z-shaped beam constructions, the most popular types in construction engineering and widespread elements of tight walls. It is stressed that laboratory tests of new devices constitute the first stage of their implementation in practice. Moreover, an advantage is gained from the much lower cost of execution, easier and precise assembly from typical structural elements, easy handling of the closures (due to their relatively light weight, with no need to use additional lifting devices), long-term use (no corrosion) and the lack of costly maintenance, as was already stressed.
Experimental Site and Models of Regulators
The experimental site for regulators in the hydraulic laboratory is shown in Figure 2. The use of empirical laboratory tests of the prototype at a 1:1 scale resulted from the ability to study a very diverse form of flow through the gaps, between the beams, through the horizontal seals of the beams, along the guides and through the locks on the beam connections. The obtained results were approximated by equations for which the coefficients were calculated according to the data from the model, which is not feasible to derive from available weir equations. The tests were carried out in a concrete channel (1 in Figure 2) 1.07 m in width and 1.20 m in depth. The site was supplied with water in a closed-circuit system, which included: a pressure expansion tank (2 in Figure 2), a suction and pressure pump (3 in Figure 2), pipelines supplying the measuring station, pipelines for water discharge and a bottom tank. The water installation was equipped with a control valve and an electromagnetic flow meter (ENKO MPP600 DN60-type, Enko, Gliwice, Poland) with a flow rate measurement accuracy of ± 1%. A water gauge (MICRO MD-2108-type, Micro, Otmuchow, Poland) (7 in Figure 2) with a reading accuracy of ± 1.0 x0−4 m (±0.01 cm) was used to measure the water levels. The water stream flowed with a fixed, controlled intensity Qc (dm3⋅s−1) to the regulator from the upper tank, in which the position of the water table was kept constant. The tests were carried out under the conditions of a steady flow of the water stream, and its intensity was regulated by a valve in the supply conduit and controlled by an electromagnetic flow meter.
The regulators used in the tests were made of typical plastic sheet piling elements. There were three prototype beam regulators (Table 1, Figure 2): S—straight; U—labyrinth; and Z—compound. The S regulator was made of straight beams, the U regulator was made of uniform, non-split sheet pile elements of tight scraps, and the Z regulator beams consisted of two sheet pile elements with an additional lock connecting both parts vertically. The prototypes of the regulators (8a, 8b and 8c in Figure 2 and Figure 3, Figure 4 and Figure 5) were made on a 1:1 scale, that is, with their actual dimensions. Thus, it was not necessary to convert the constructional and hydraulic parameters into natural (terrain) conditions.
Both U and Z shapes showed a characteristic, developed crest line (Figure 4 and Figure 5), and, it should be stressed, the length of this line Lp was greater than the outlet width by 59 and 78 percent, respectively. As was already pointed out, the determination of discharge characteristics for such regulators could not rely on equations in the available literature since they mainly consider straight-line weir crests. Moreover, they assume the complete tightness of the constructions, which was not the case of successively placed beams analyzed herein; therefore, an experimental approach was required to assess the design and function of the regulators under variable hydrostatic and hydrodynamic loads. The detailed structure of the analyzed regulators is shown in Figure 3, Figure 4 and Figure 5. The arrows in Figure 3, Figure 4 and Figure 5 show the places of intense effective flow.
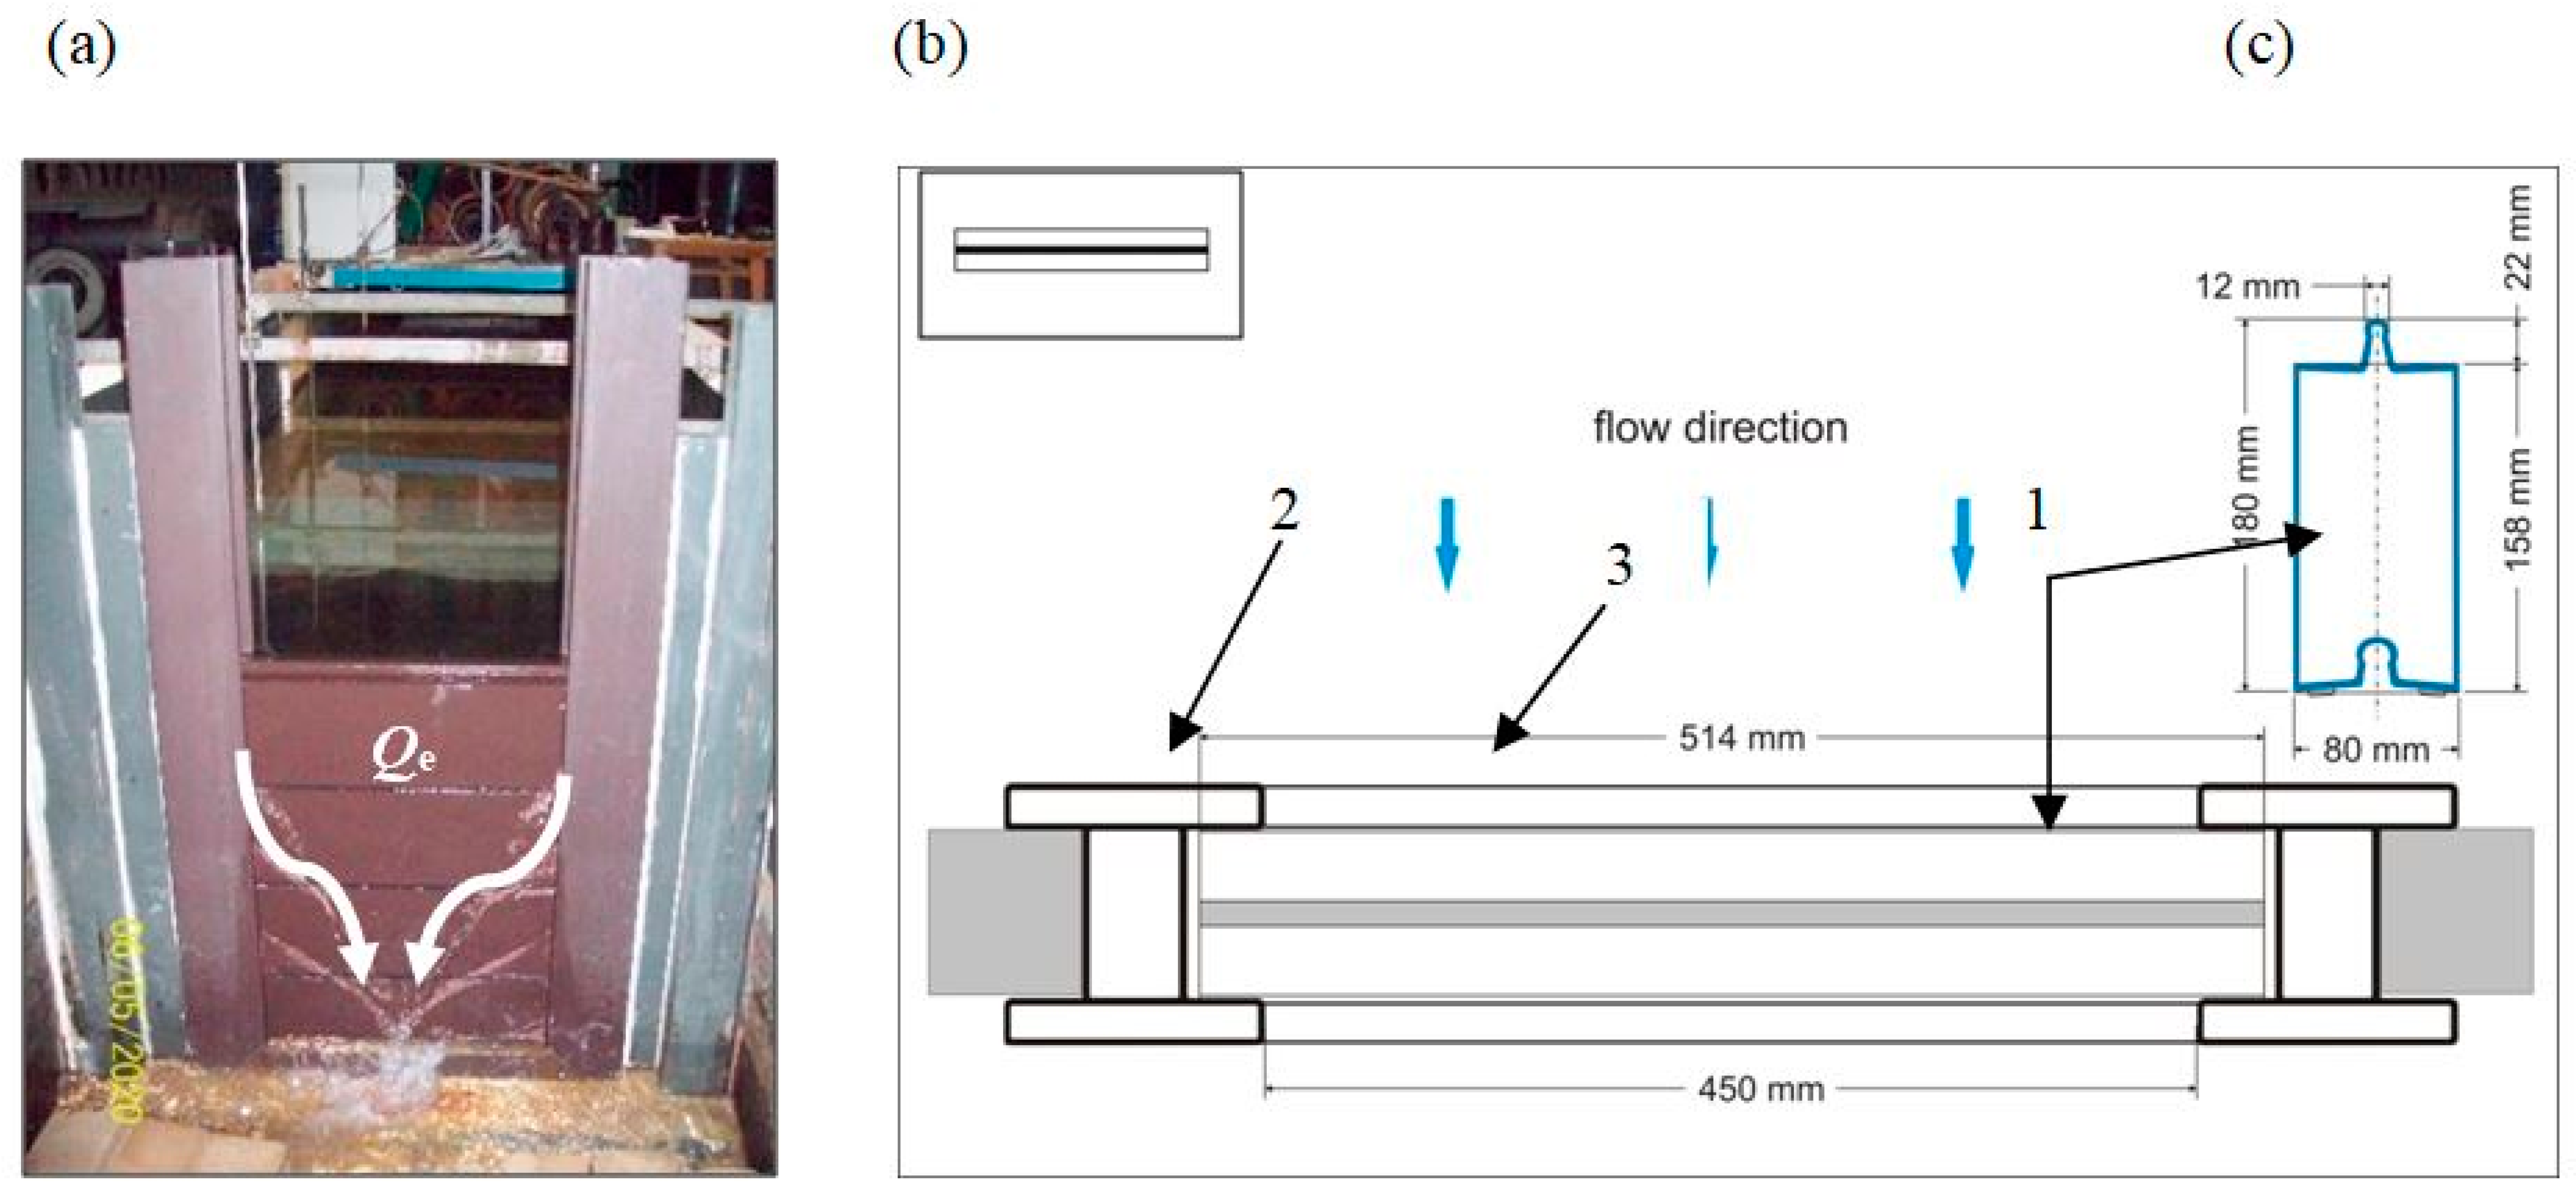
The rectilinear regulator S (8a in Figure 2, Figure 3) consisted of beams (1 in Figure 3) and two gibs (2 in Figure 3) in the shape of H126 mm sections. The guides rested against the bottom beam (3 in Figure 3). The use of a recess in the gibs made it possible to install the beams and keep them in a vertical position. The shape of the beams enabled their interconnection with the use of a lock and a gasket, which improved the tightness. The tested specimen with a width of b = 0.45 m made it possible to set the overflow crest in relation to the bottom of the upper station within the height range of P = 6.8 ÷ 85.7 cm (Table 1).
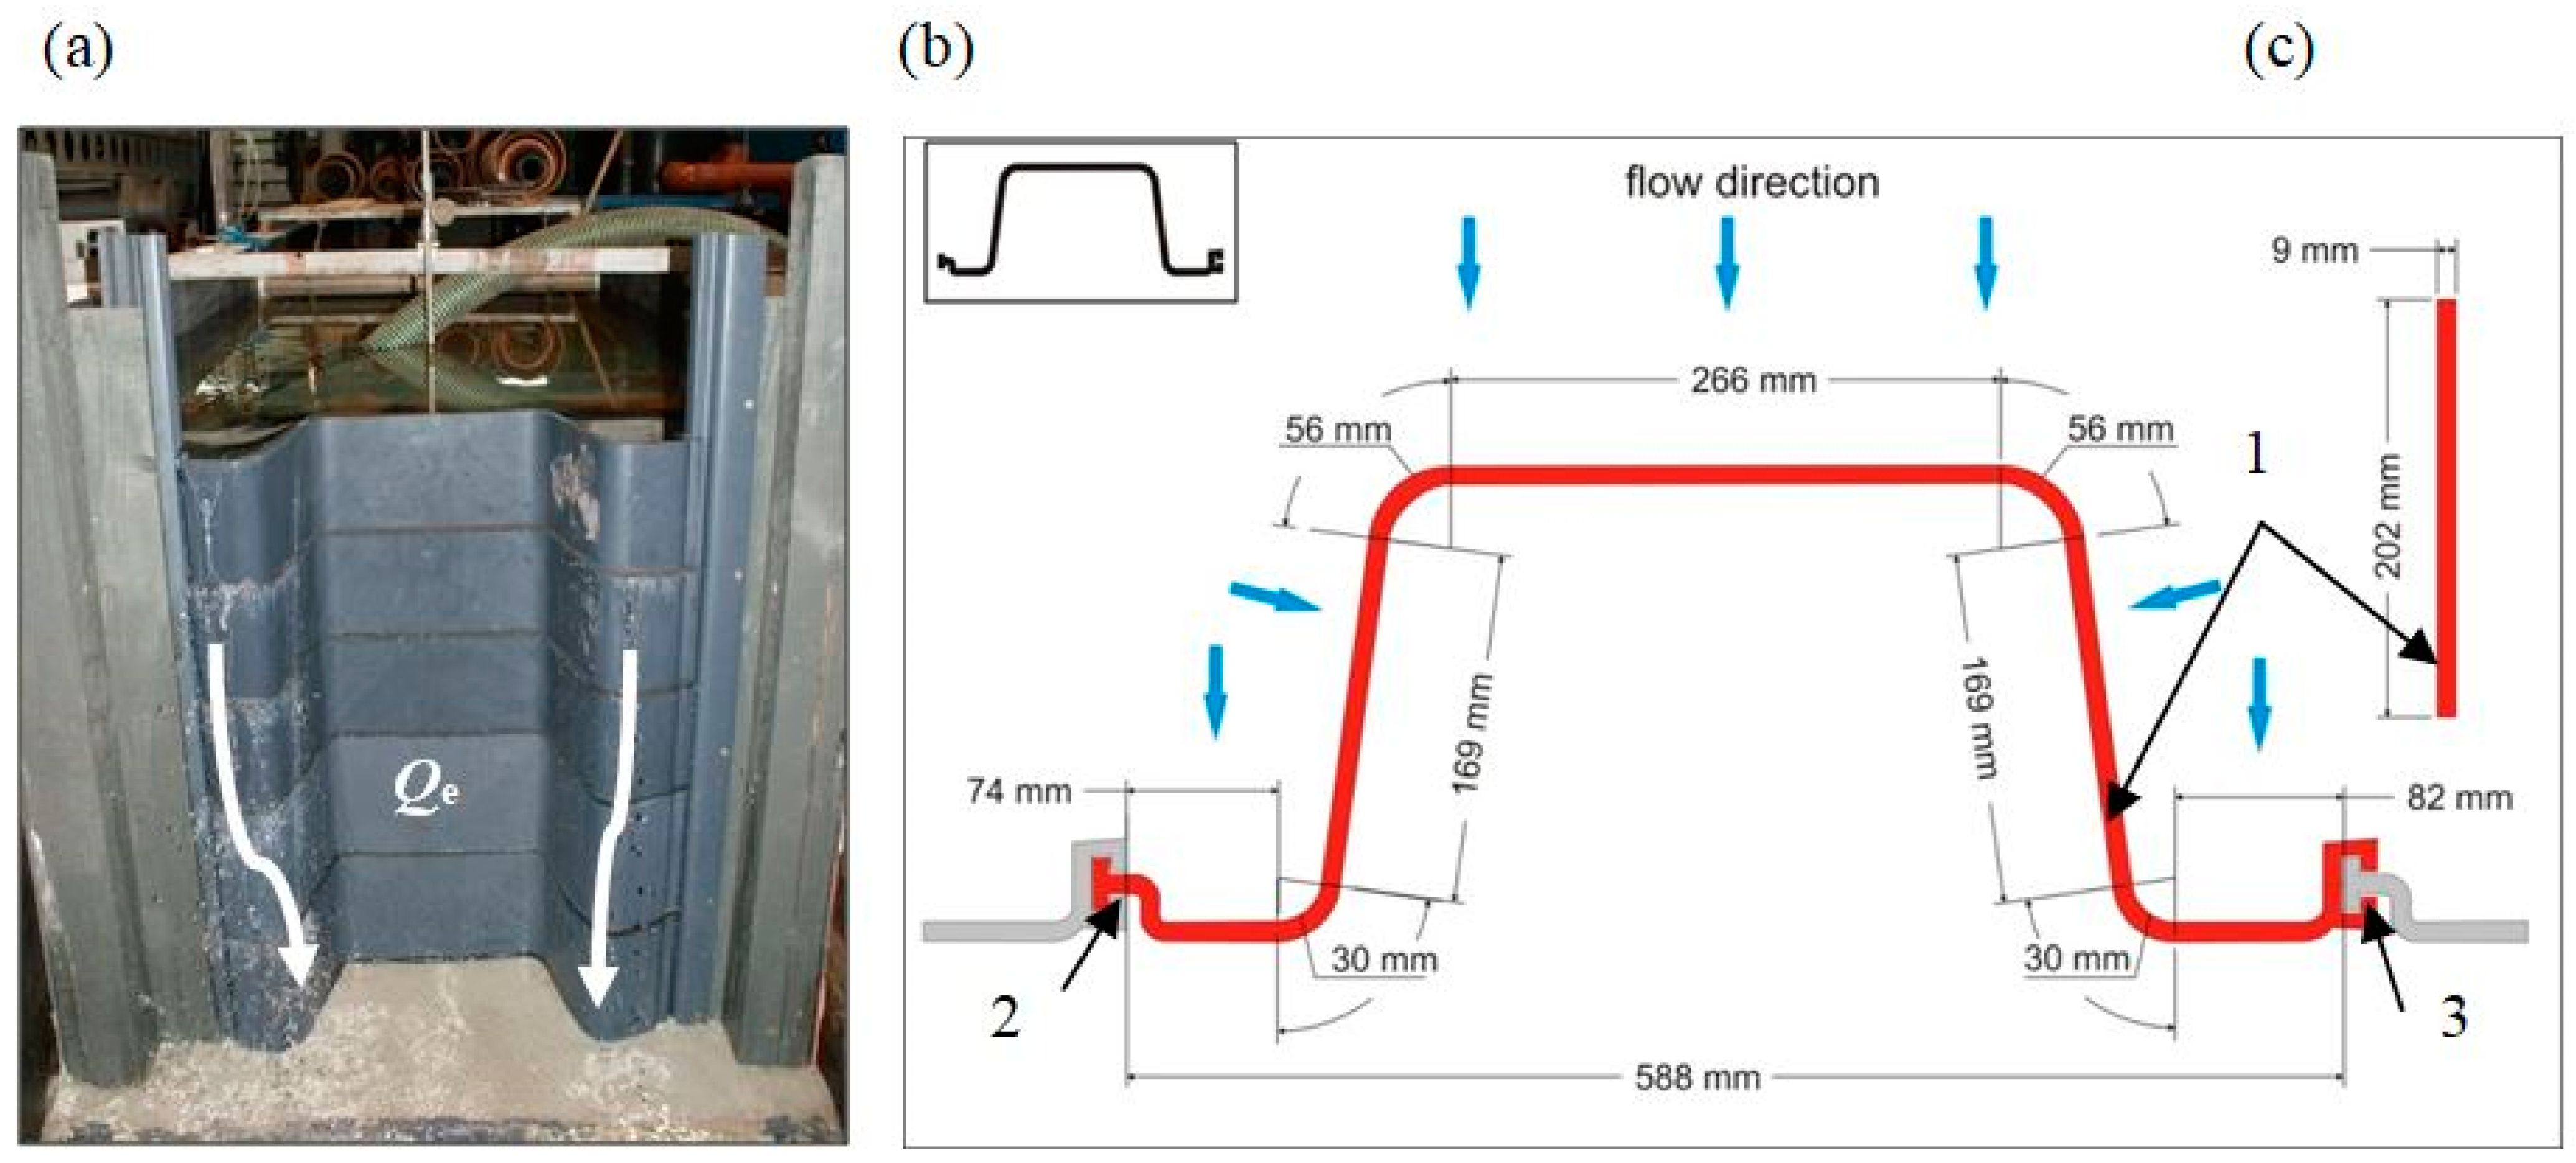
The labyrinth regulator U (8b in Figure 2, Figure 4) consisted of beams (1 in Figure 4) and two gibs: one with a female lock (2 in Figure 4) and the other with a male lock (3 in Figure 4). In the tested model with an opening width b = 0.588 m, the height P of the overflow edge position could be adjusted within the range of 0.0 ÷ 102.2 cm relative to the bottom (Table 1) by inserting or removing beam elements.
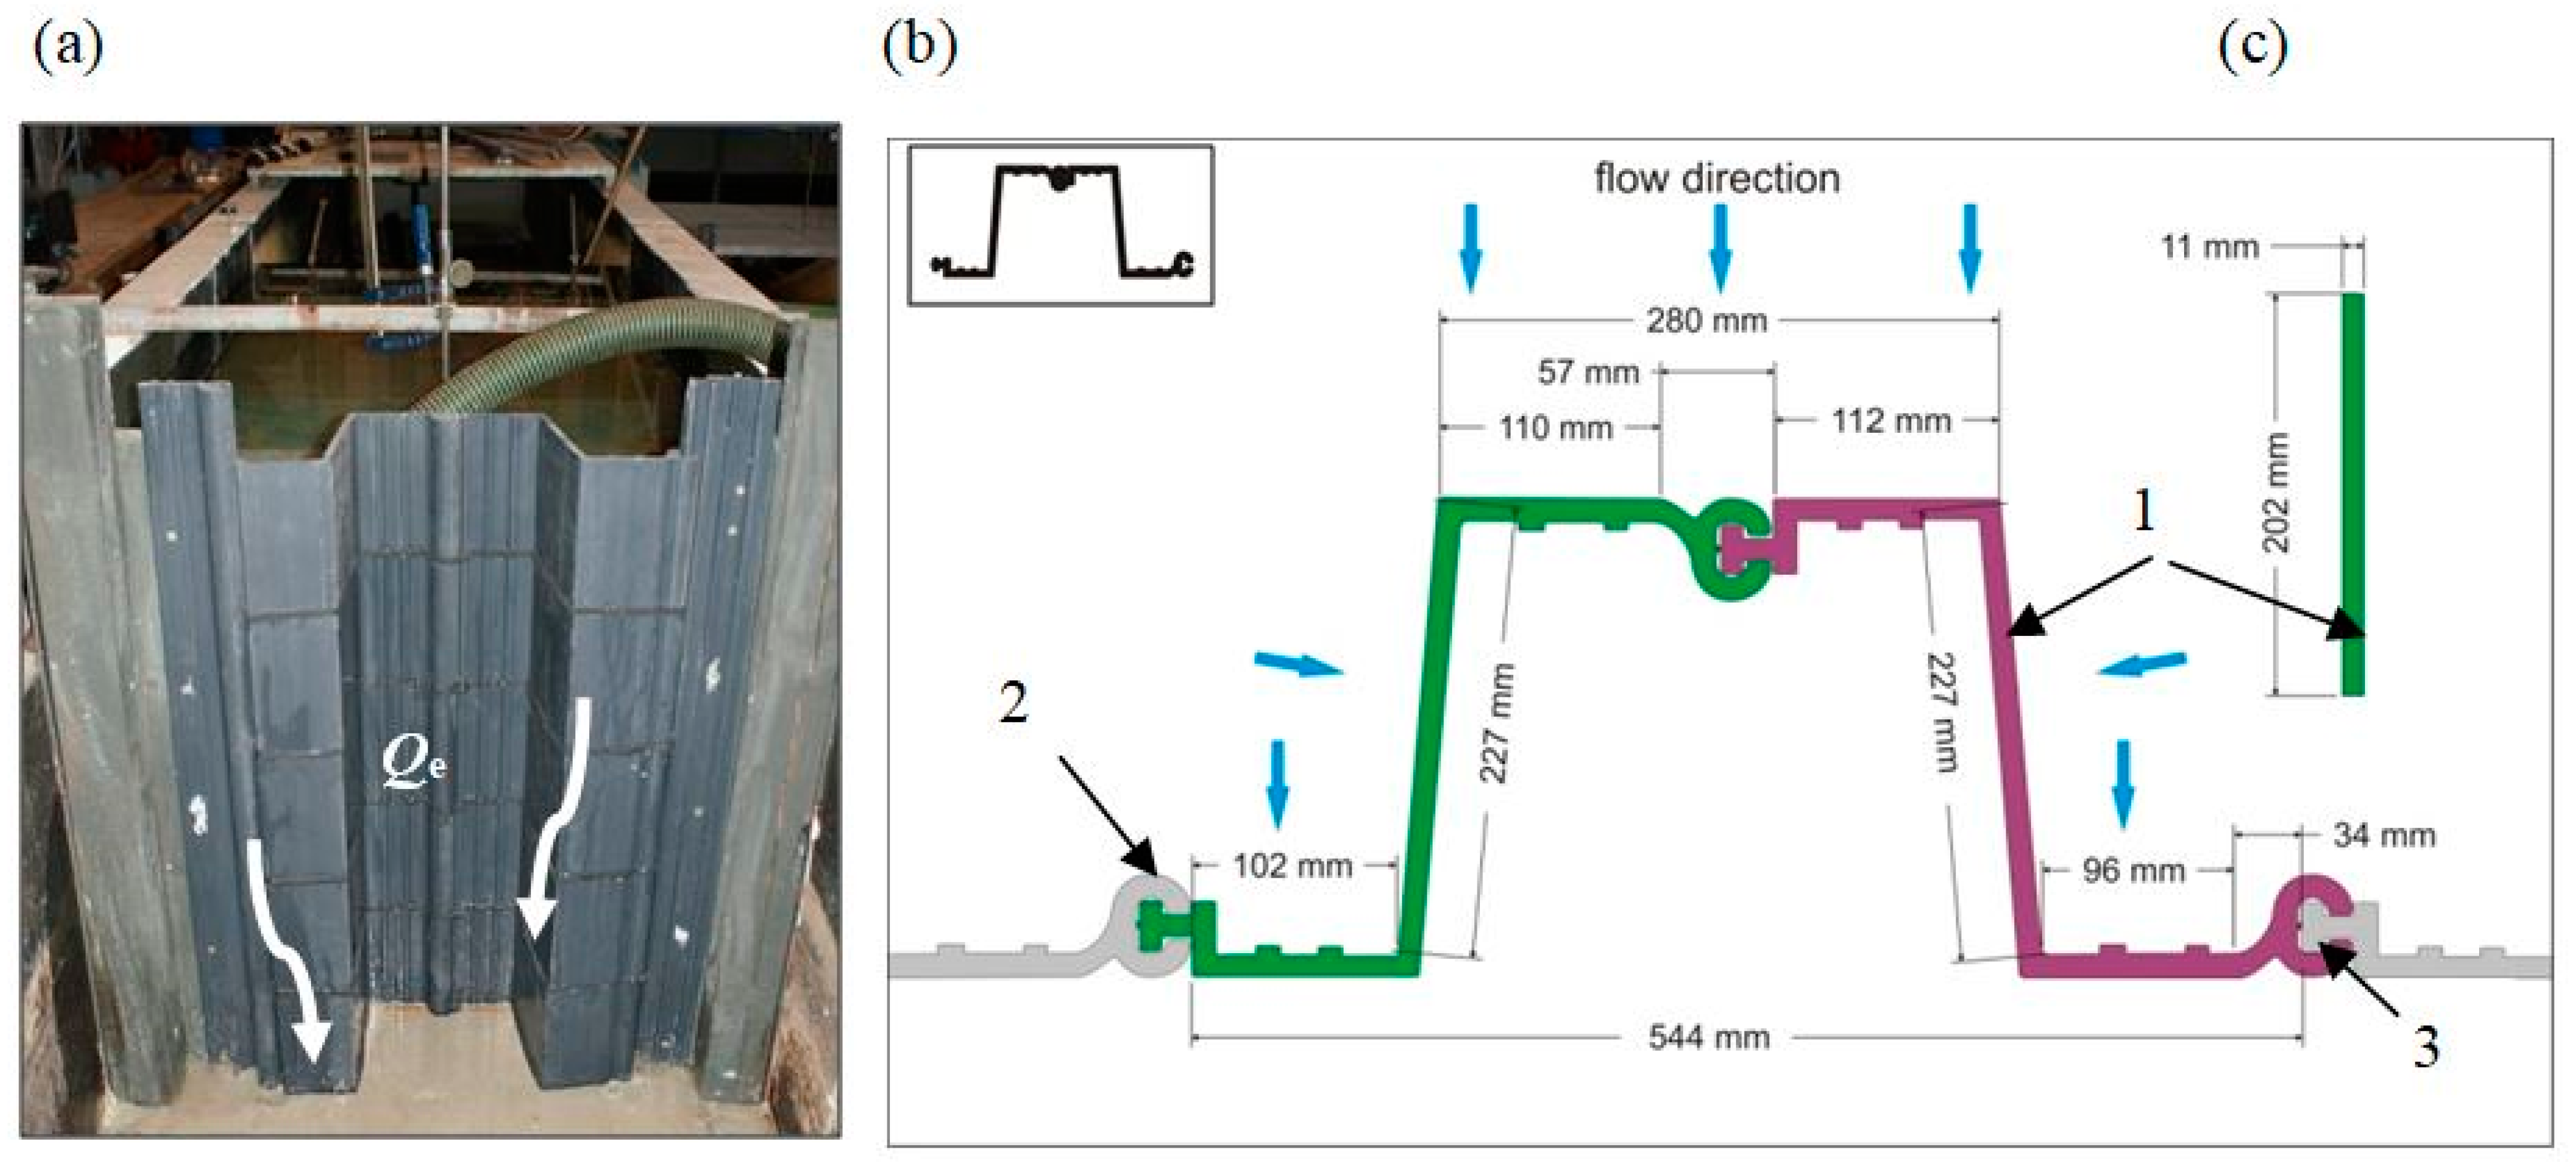
The compound regulator Z (8c in Figure 2, Figure 5) was composed of two asymmetrical elements (1 in Figure 5) connected with each other by a lock in a vertical line. In the test specimen with an opening width b = 0.545 m, the height P could be adjusted within the range of 0.0 ÷ 102.6 cm relative to the bottom (Table 1) by inserting or removing subsequent beams.
3. Laboratory Test Results
The total outflow of beam regulators is the sum of the intensity Qr (dm3⋅s−1) of the control flow above the overflow crest and the intensity Qe (dm3⋅s−1) of the effective flow. The idle flow rate was defined as the effective flow Qe compensating for water losses caused by leaks occurring in places where the beams are seated in recesses, on the horizontal seals between the beams and on their vertical joints. After exceeding this flow, the process of self-regulation of the water level in the ditch begins. The tests of each of the three regulators were carried out in two stages. In the first stage, the value of the effective flow Qe was determined, and in the second stage, the total discharge Qc of the regulators was measured in the specified range of the water damming height H in the upper stand and the elevation (H − P) of the water table above the control overflow.
3.1. Effective Flow Qe
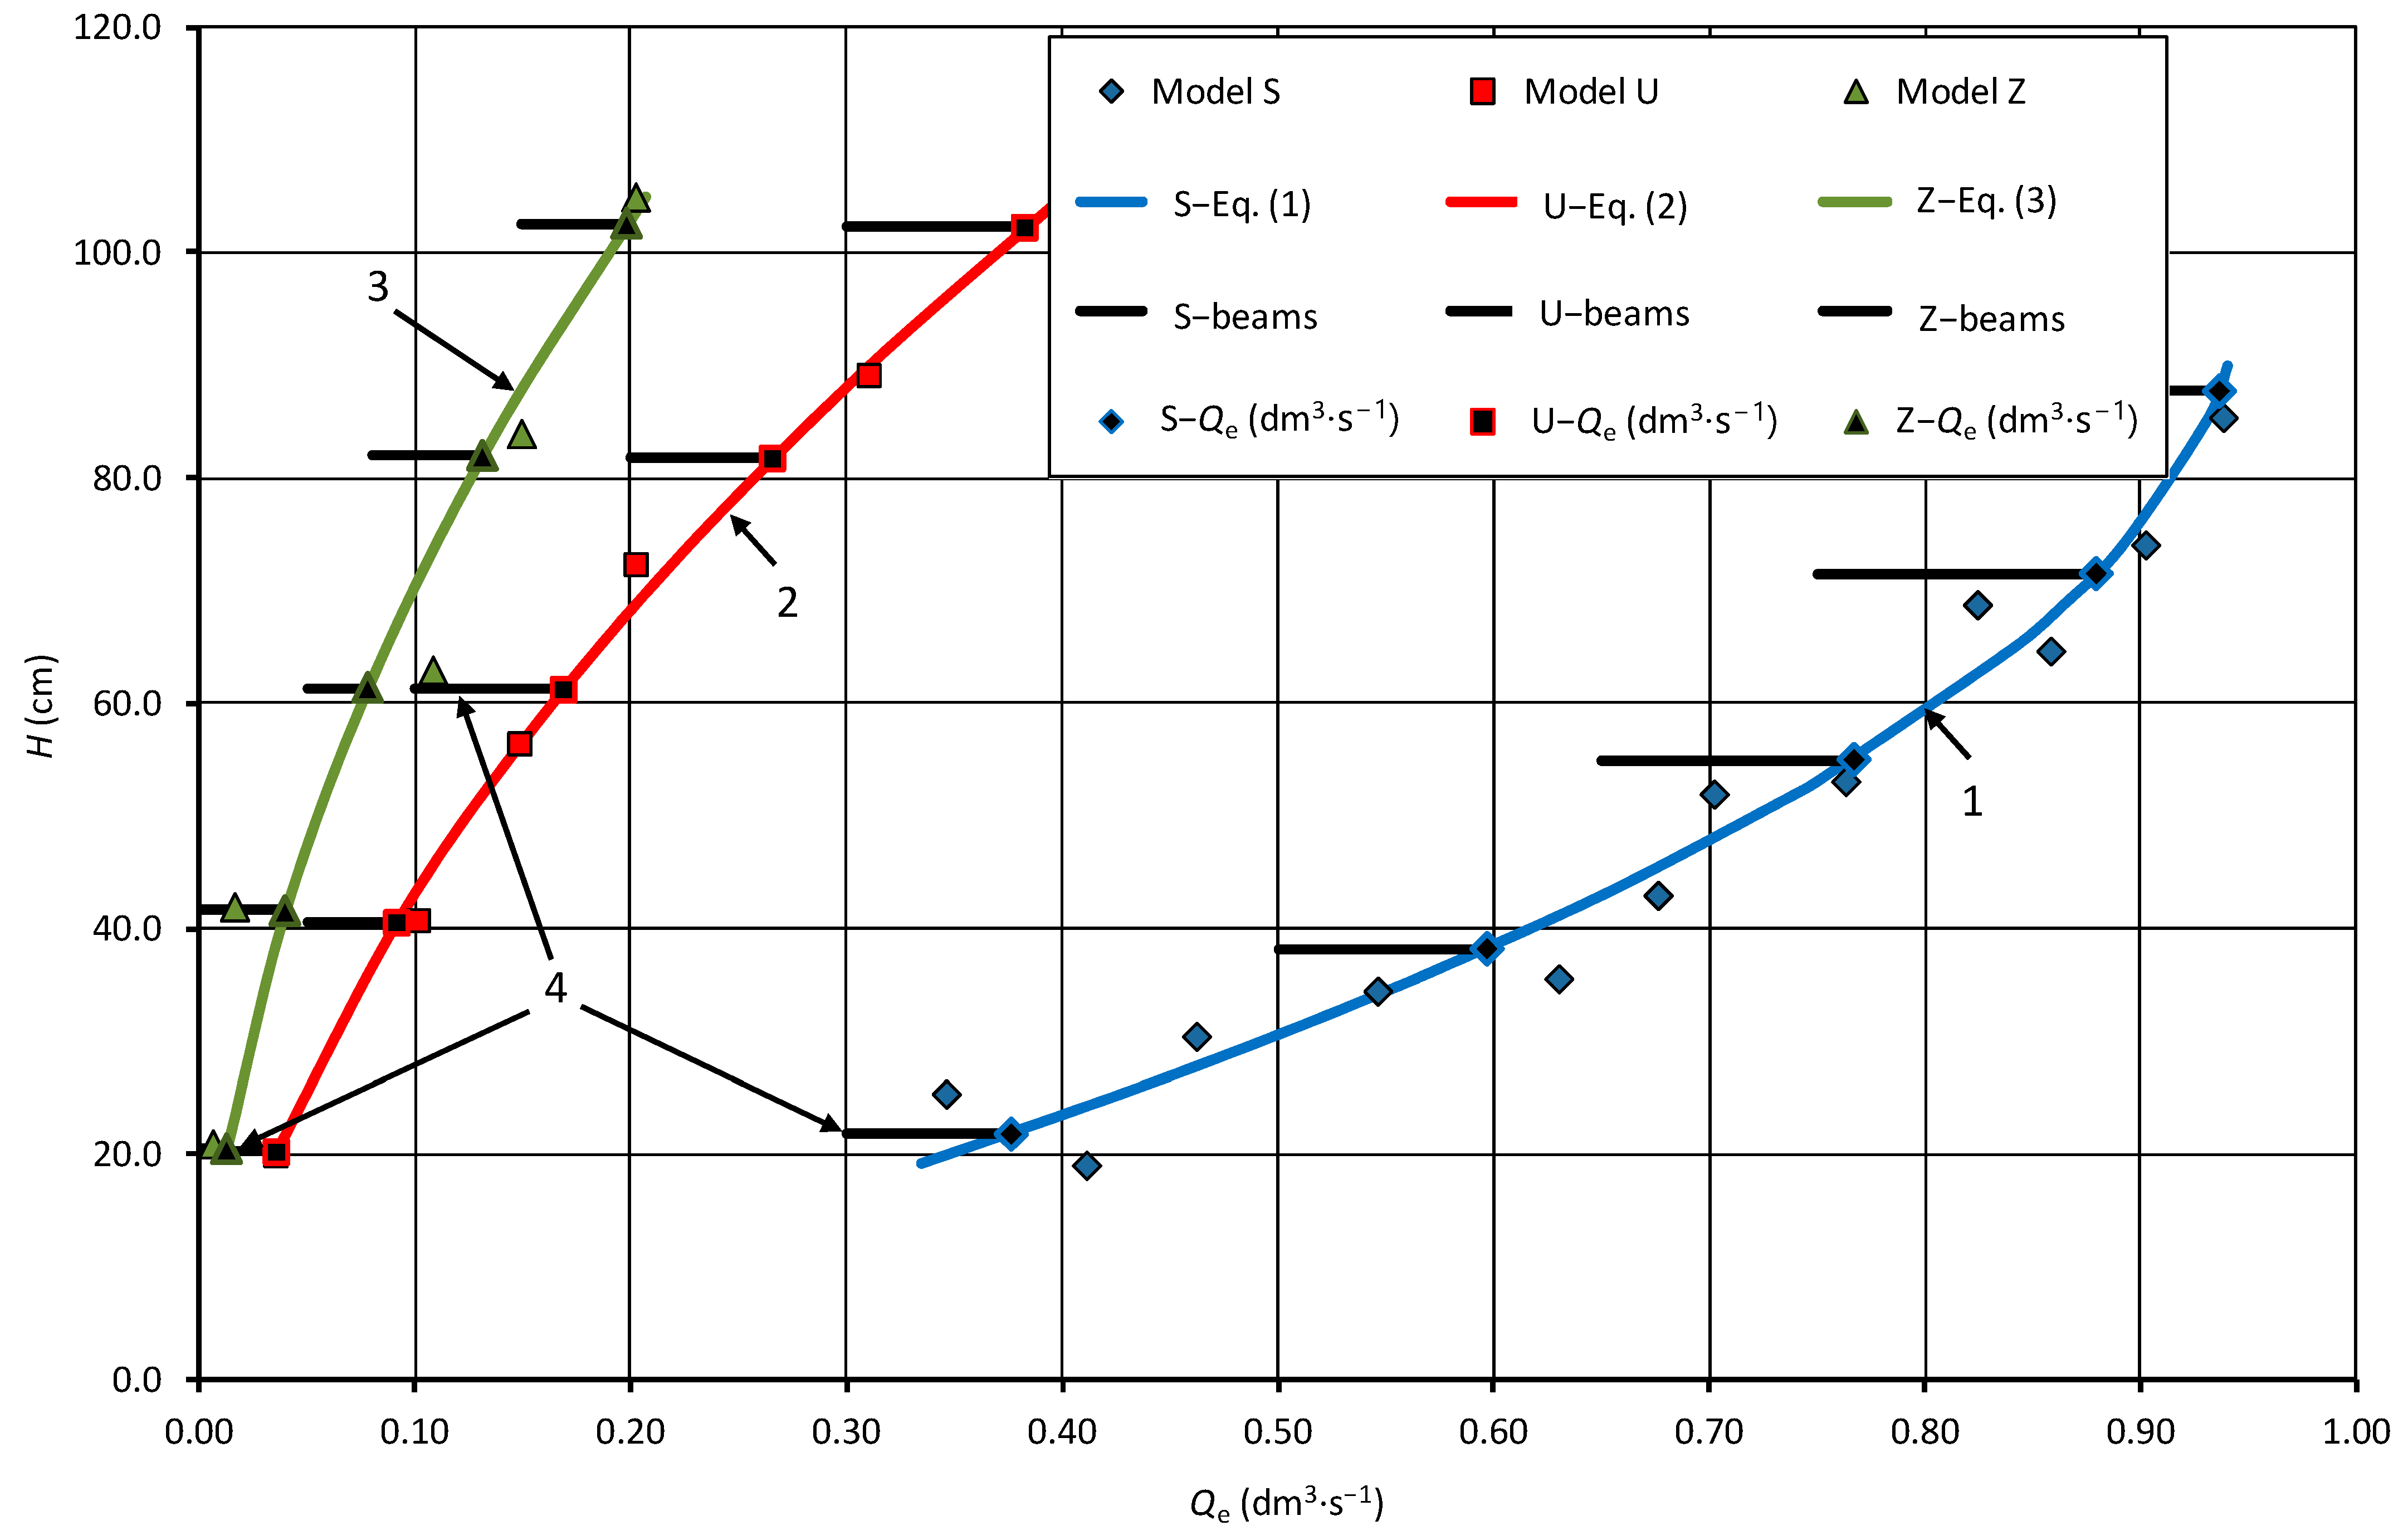
The value of the effective flow Qe is variable, depending on the type of regulator, the number of installed elements and the method of their assembly and sealing accuracy. The curves of the variability of the effective flow Qe, developed on the basis of the results of measurements of this parameter with the assumed five beams for each of the S, U and Z regulators, are presented in Figure 6. For each tested regulator design, the maximum value of the effective flow was determined while maintaining the position of the dammed water table at the level of the upper edge of the overflow, without the stream overflowing.
The regulator with the S-type closure was characterized by the highest effective flow among all tested prototypes. S-type beams were placed in gib recesses without additional locks. Leaks occurred mainly in places where the beams were seated and, to a lesser extent, in the horizontal joints of the successively placed elements—here, seals and a suitably shaped lock were used. With the increase in the dammed water depth H, the effective flow increased in the range from Qe = 0.33 dm3⋅s−1 at H = 19.1 cm to Qe = 0.93 dm3⋅s−1 at H = 85.4 cm (Figure 6). The U and Z models of regulators were characterized by much lower effective flow values compared to the S model. These regulators were mounted on gibs with special locks (Figure 4 and Figure 5), which improved the tightness. Minor leaks occurred mainly in the joint of the gaskets between the beams. In the tests of the U-type regulator, the water losses increased with the increase in the dammed water level in the range from Qe = 0.04 dm3⋅s−1 to Qe = 0.31 dm3⋅s−1 (Figure 6). The Z-type regulator was characterized by the highest tightness and therefore the lowest effective flow, despite the presence of an additional lock vertically connecting two parts of each beam. The amount of effective flow at the maximum depth of dammed water H = 105.0 cm was Qe = 0.21 dm3⋅s−1 (Figure 6).
The set of Qe measurement results was subjected to statistical analysis. Using a non-linear approximation model, regression curves for individual models were developed:
- S model, formula validity range: 19.1 cm ≤ H ≤ 85.4 cm:
- U model, formula validity range: 19.2 cm ≤ H ≤ 89.2 cm:
- Z model, formula validity range: 21.0 cm ≤ H ≤ 105.0 cm:
The following symbols are used in Formulas (1), (2) and (3): Qe (dm3⋅s−1)—effective flow; H (cm)—upper water depth above the bottom; P (cm)—height of the threshold beam marking the level of damming; R2—coefficient of determination; r—correlation coefficient. The calculated values of statistical measures (r, R2) indicate a very good representation of the actual flow conditions with the adopted equations. Using the developed formulas (1)–(3), the effective flow Qe was calculated for the water depth, which determined the height of the threshold P for individual variants of the tested models. The results of the calculations are summarized in column 9 of Table 1. These values determine the flow above which there is effective self-regulation of the flow over the crest of the beams.
3.2. Total Flow Qc
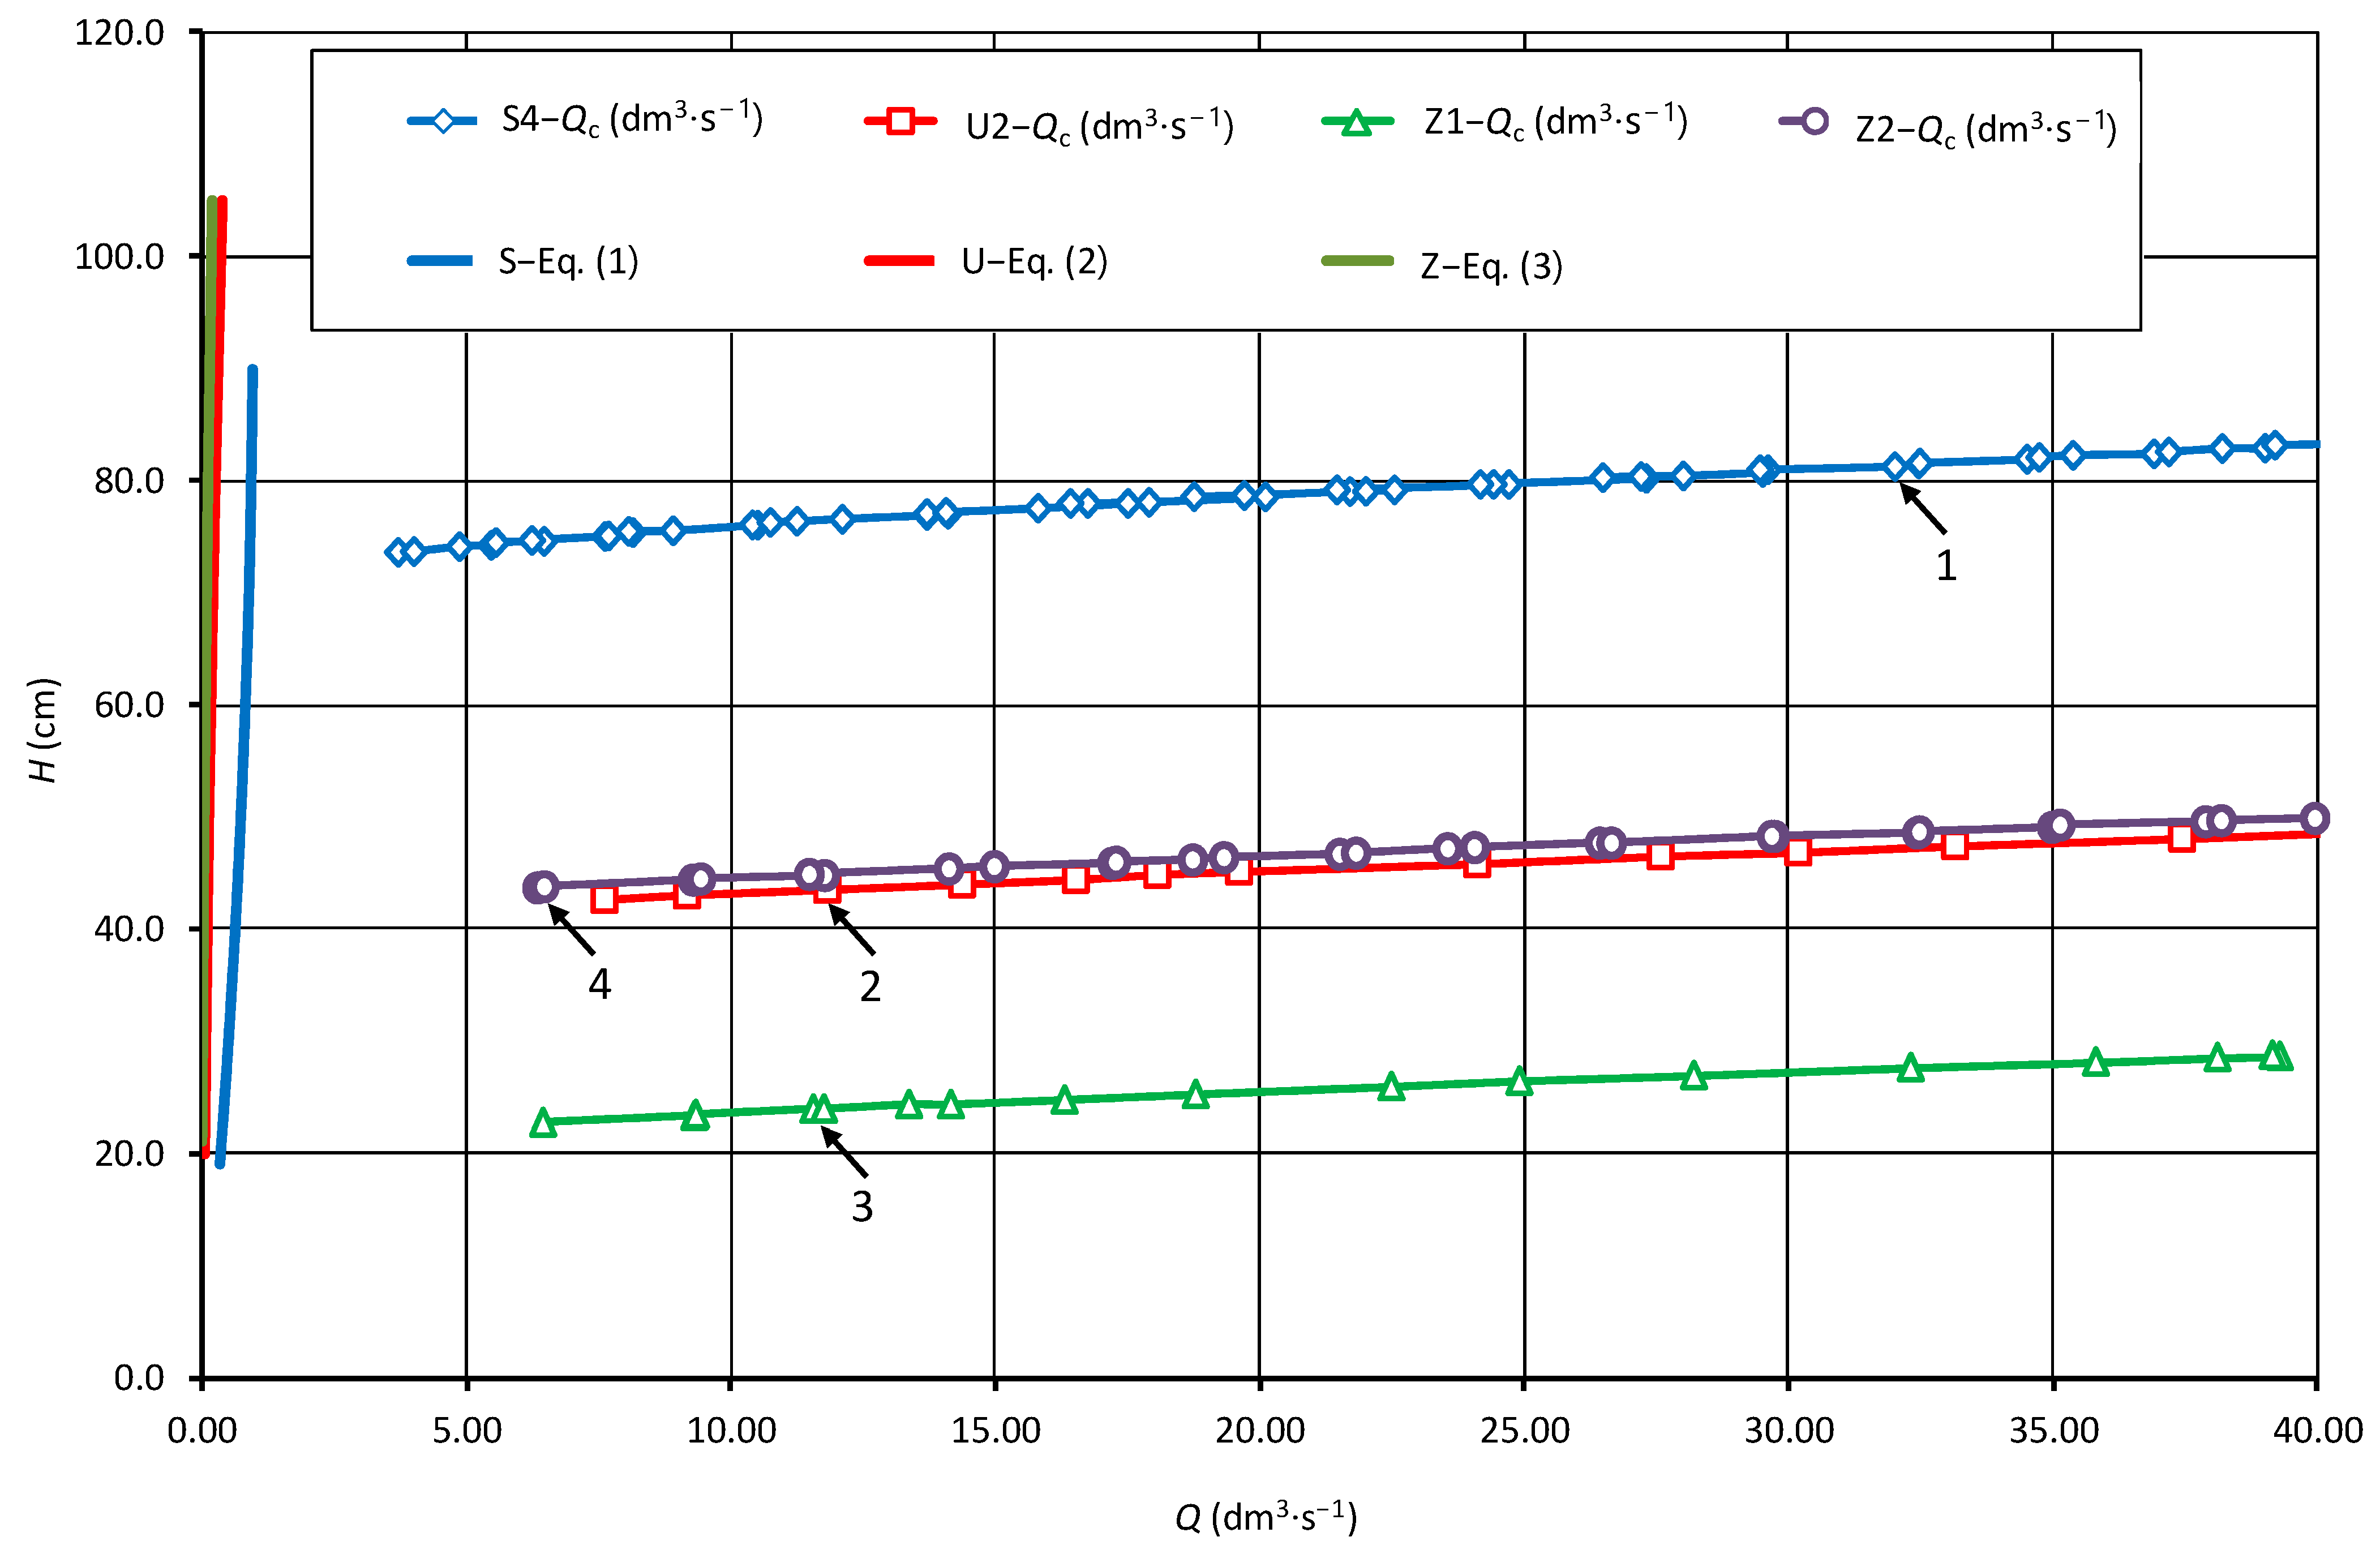
The measured discharge curves at variable damming height H in the upper stand for each tested regulator (S, U and Z) and different damming levels are presented in Figure 7. They contain the effective flow Qe curves expressing the water losses of the valve made of five beams and the Qr (regulatory) discharge curves above the tested beam installation variants. The tests were carried out with flow rates up to a maximum value of about 60 dm3⋅s−1.
The damming height above the overflow crest (H − P) had the greatest variability when using the S-type beam, ranging from 0 to 14.9 cm, with the maximum flow amounting to Qc = 55.9 dm3⋅s−1, and the smallest obtained with the use of the Z-type beam for the Z1 variant: filling (H − P) = 8.2 cm with Qc = 39.3 dm3⋅s−1. The characteristics of the total discharge of the U and Z valves were similar. Their design, compared to the S-type valve, ensured the stabilization of the position of the flooded water table to a greater extent at lower values of the effective flow Qe (Figure 6).
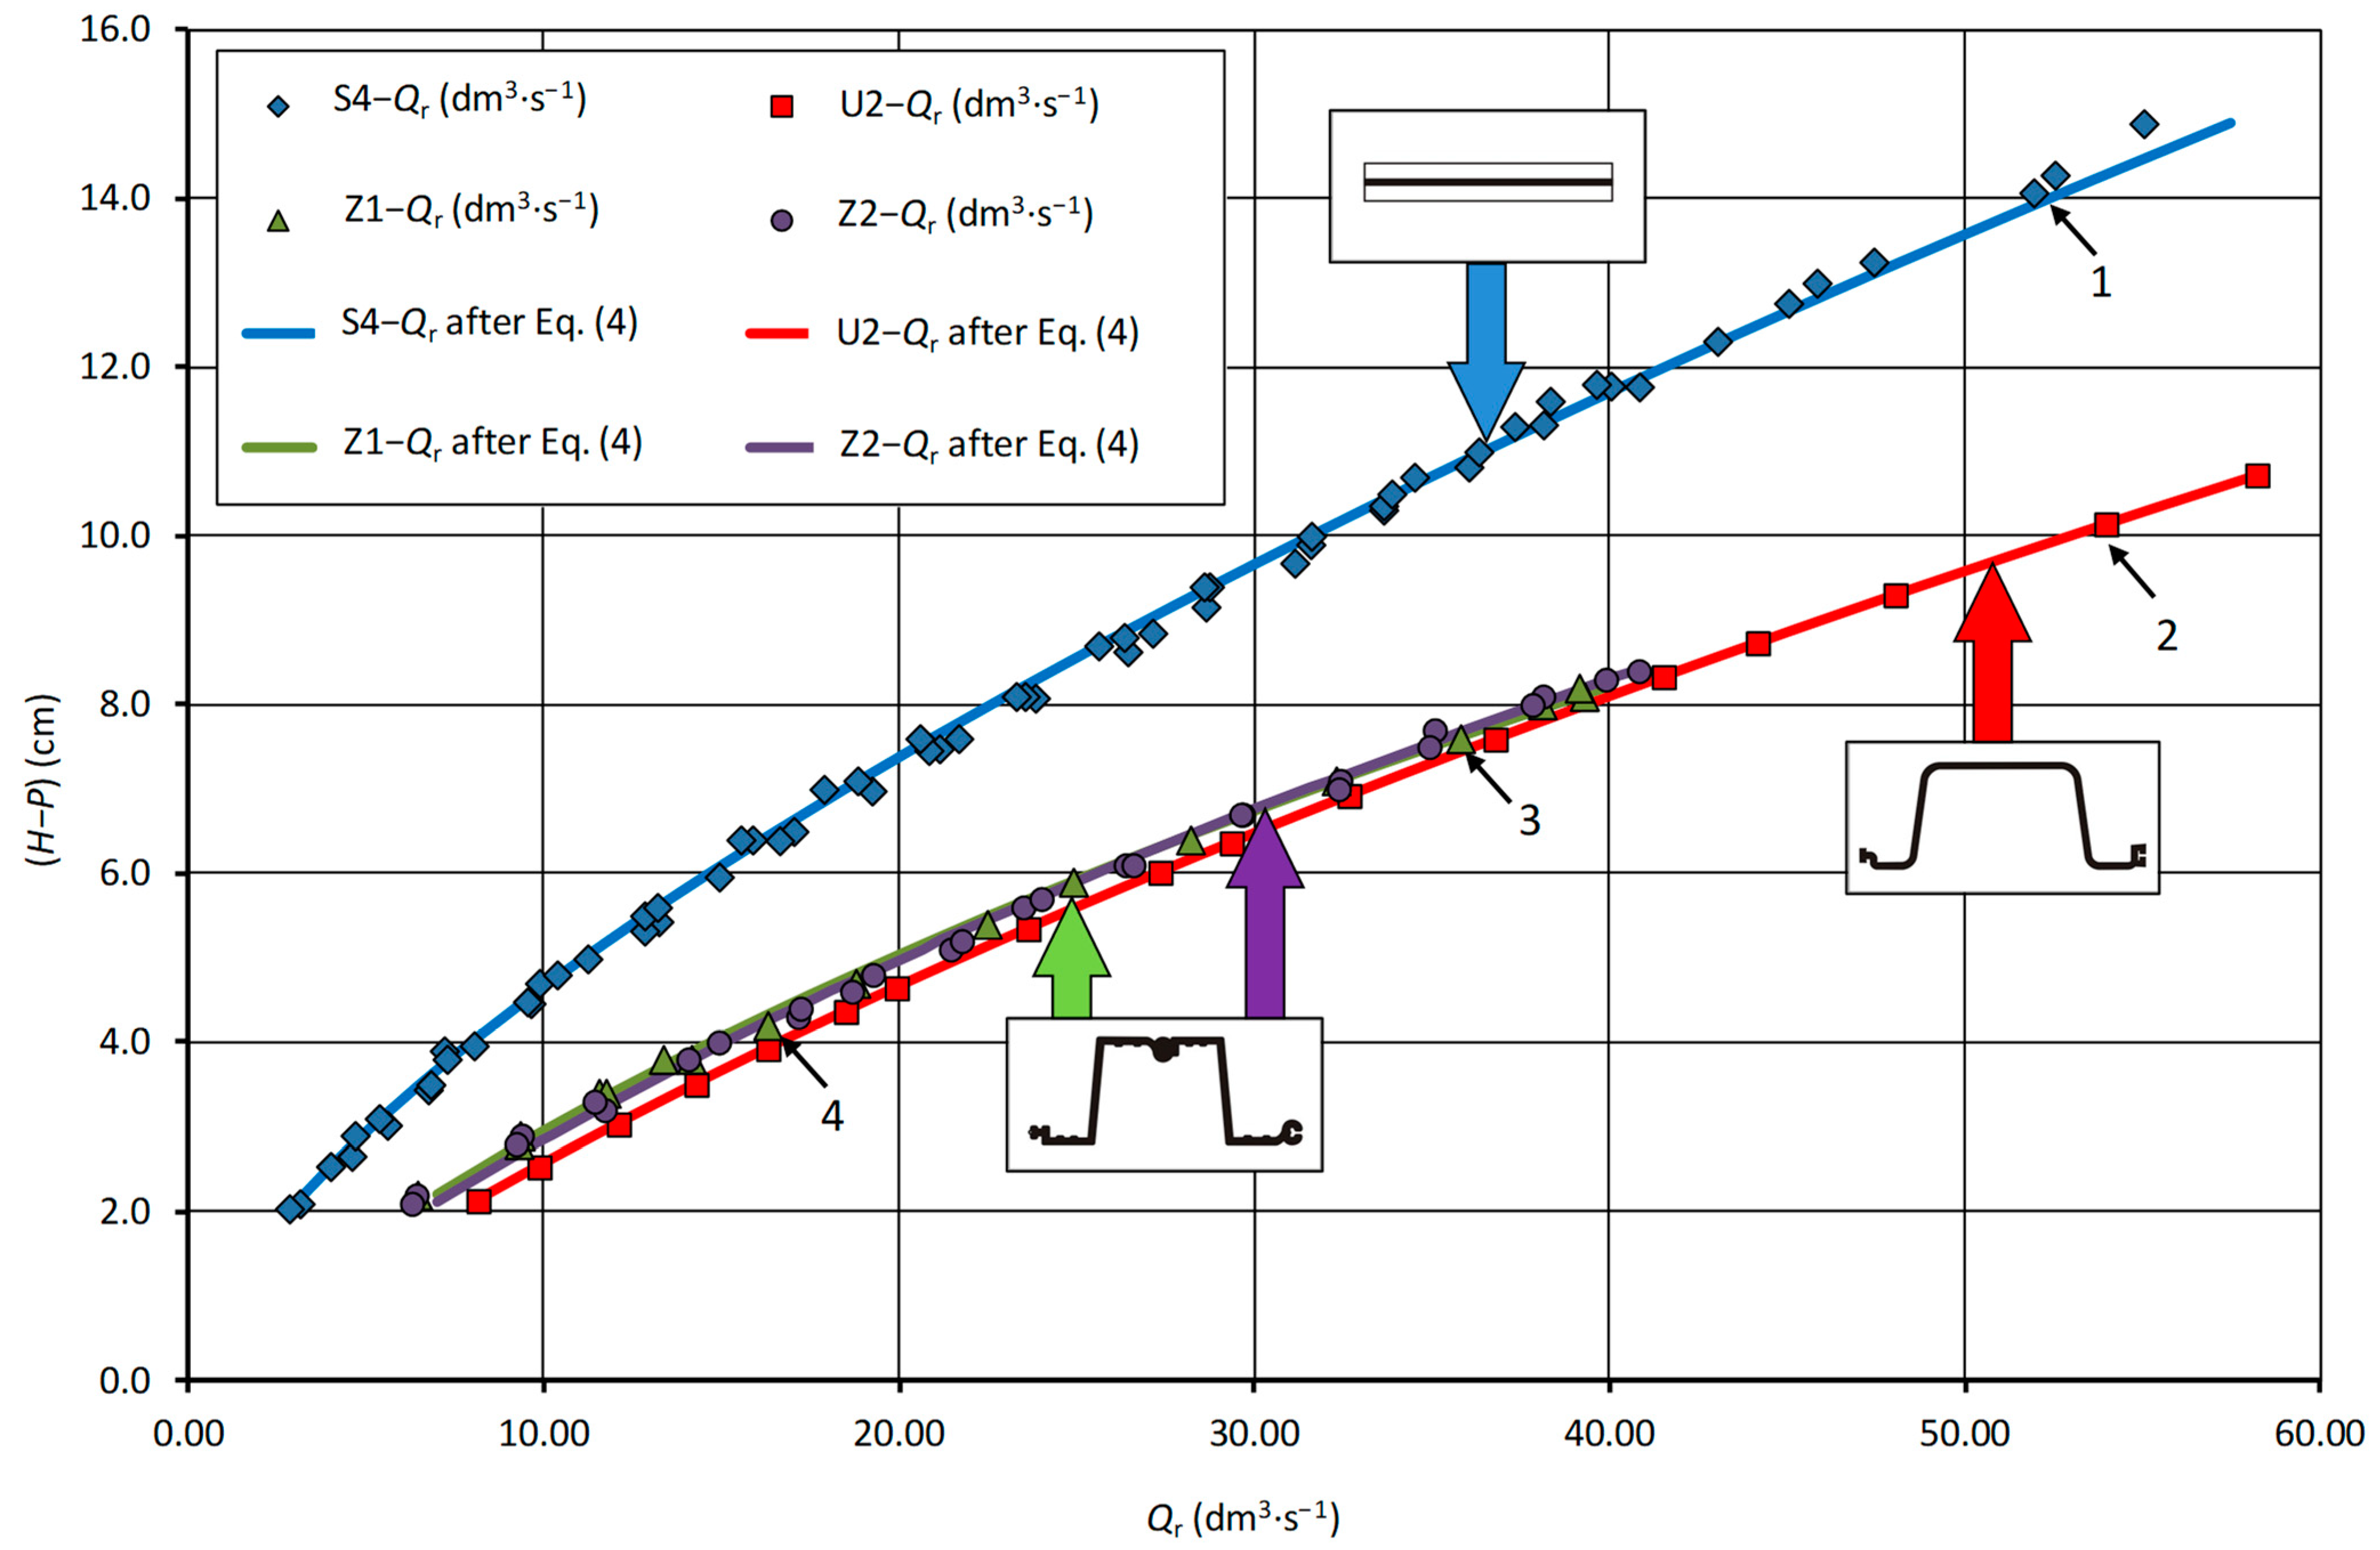
The regulating flow curves (Qr = Qc − QeP) for various P heights of the thresholds of the tested regulators are shown in Figure 8. The measurement results of the overflow discharge rate of the tested regulators were equalized with a non-linear model using the following equation:
where a1, a2 and b1 are the coefficients in Equation (4) and are summarized in Table 2.
4. Discussion
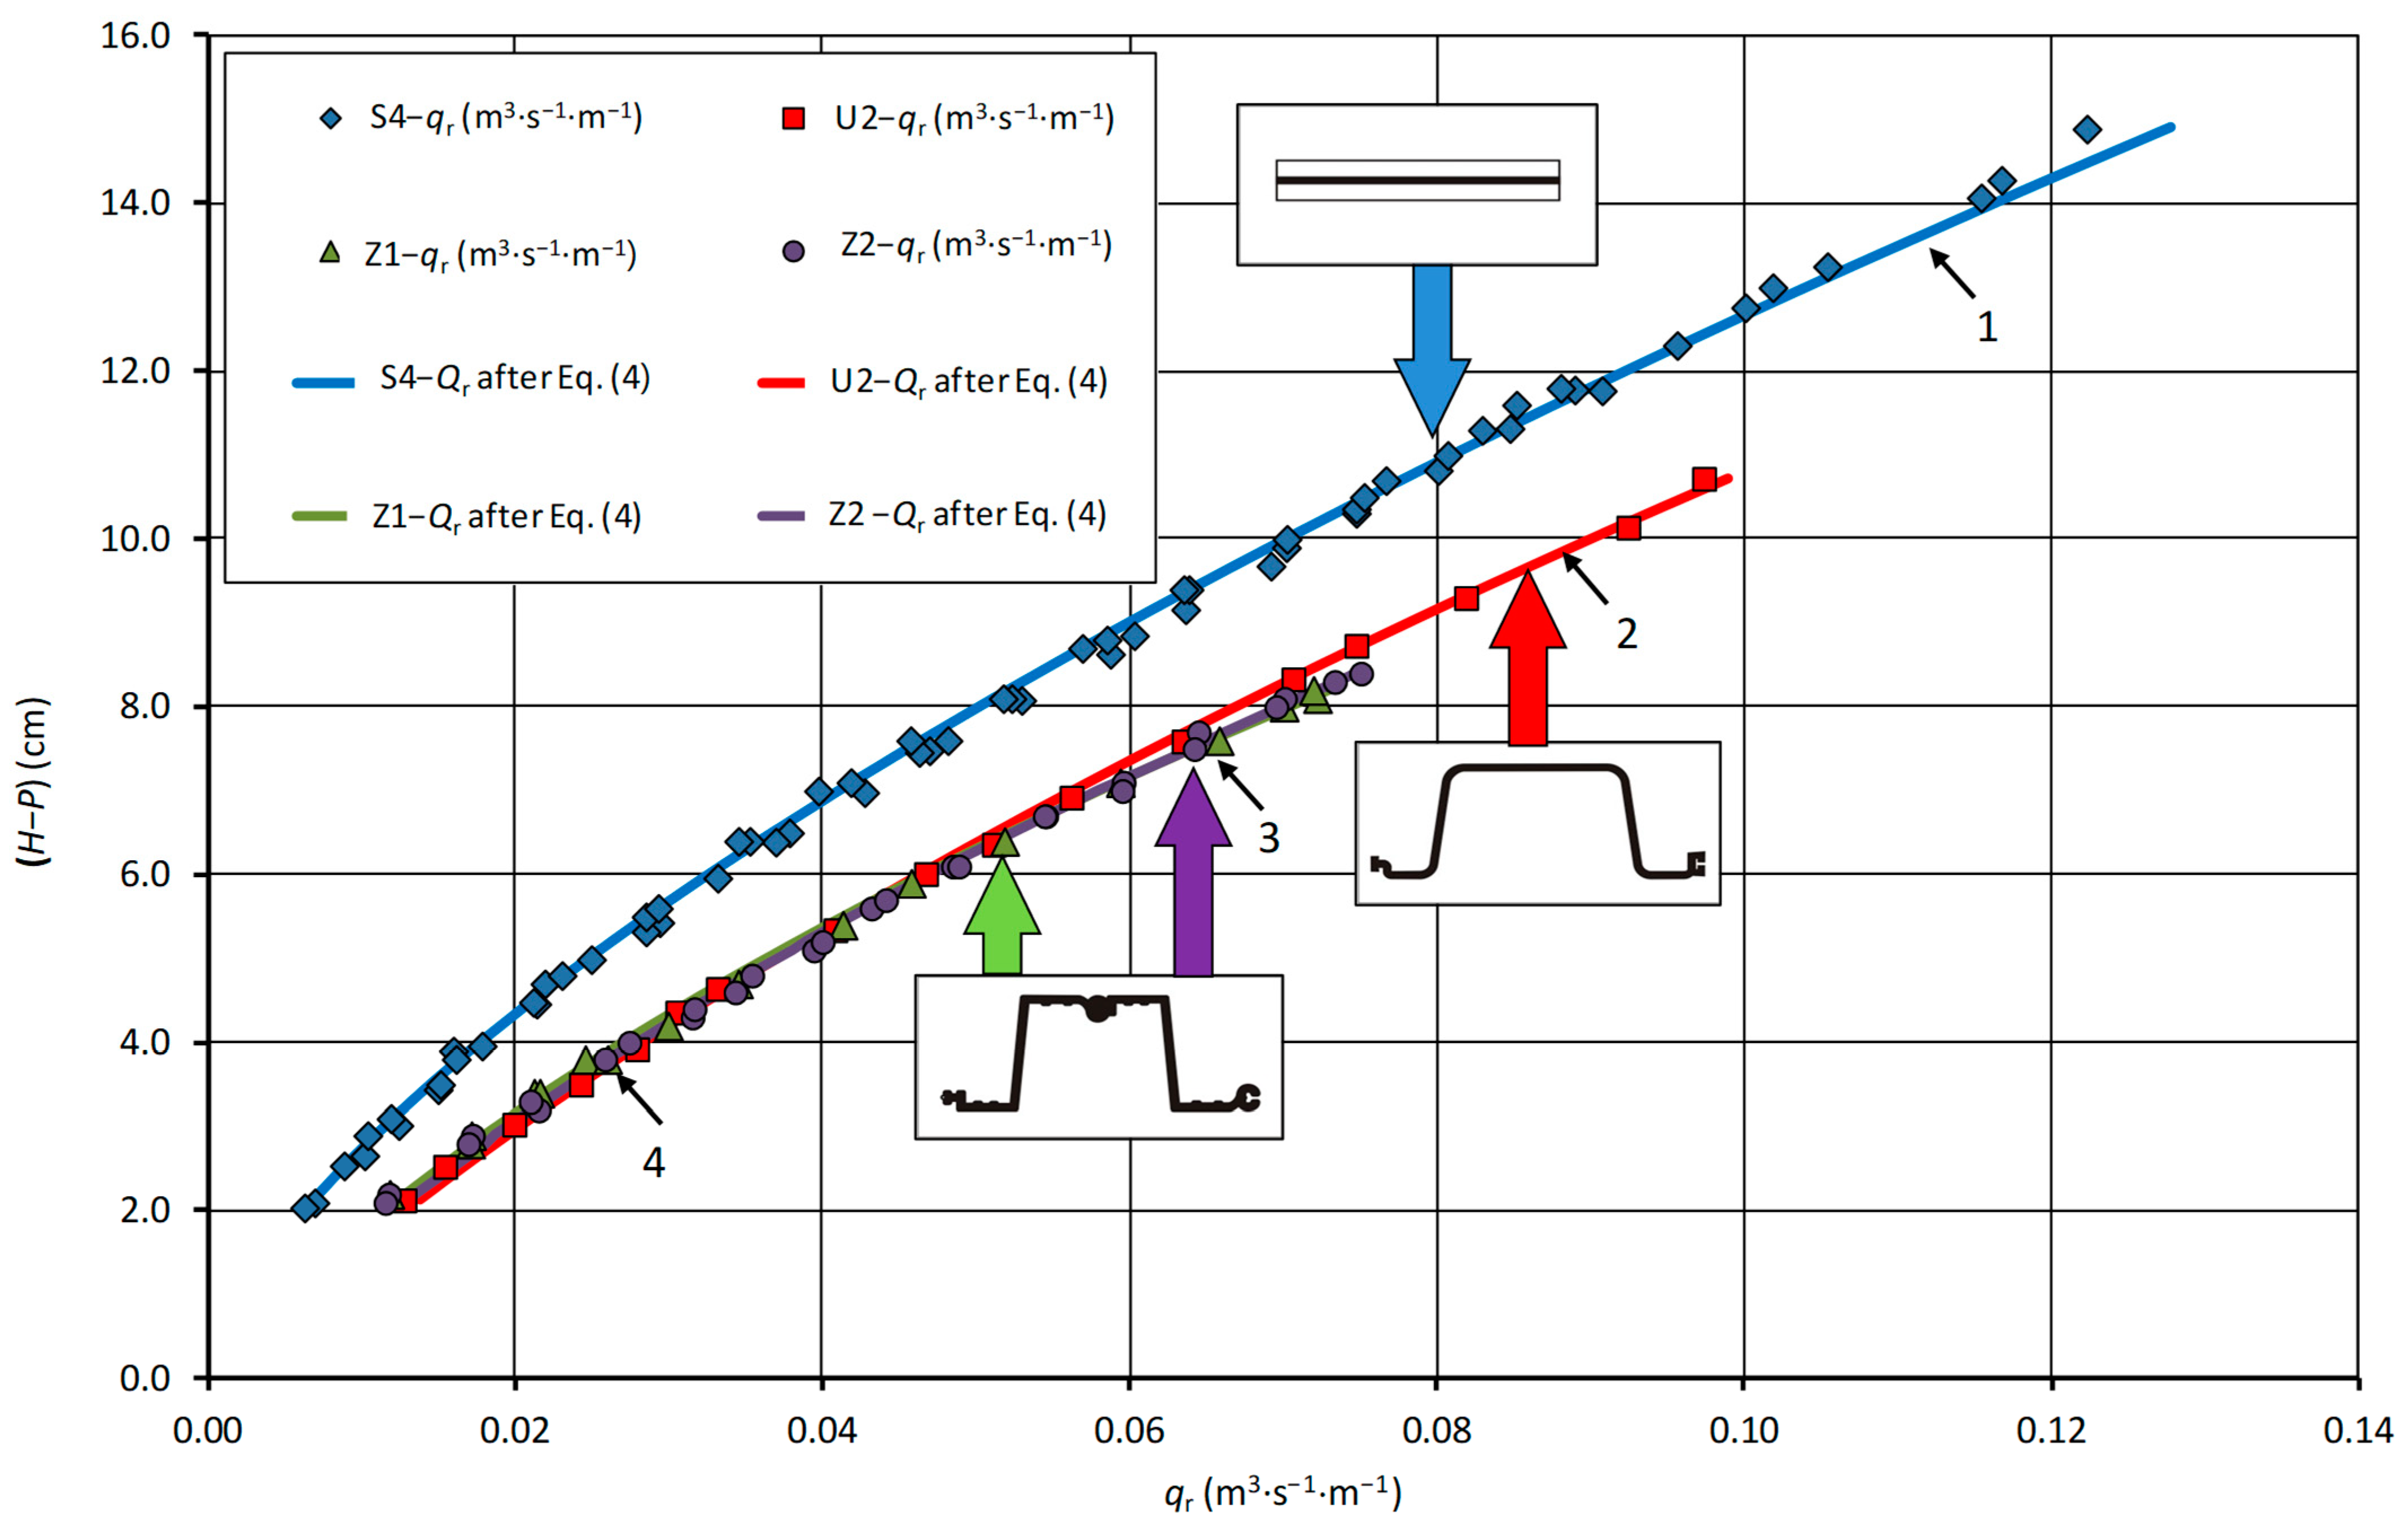
The tested regulators, apart from the beam shape, differed in the width of the overflow opening between the vertical side limitations, that is, the beam gids. The hydraulic efficiency of the tested regulators was determined by the characteristics of the unit flow rate q (m3·s−1⋅m−1) depending on the damming height above the overflow crest (H − P). The unit flow rate qc = Qc/b (m3·s−1⋅m−1) was calculated as the quotient of the total flow rate Qc (m3⋅s−1) and the width b (m) of the opening between the regulator gibs (Table 1), the values of which were: b = 0.450 m for the S model (Figure 3); b = 0.588 m for the U model (Figure 4); b = 0.544 m for the Z model (Figure 5). The regulator with rectilinear closure S was adopted as the base structure to which the unit flows of other regulators were compared: U2, Z1 and Z2, with a crest line developed in the plan. In practice, more closure solutions were not able to be constructed in a focused, short-term project. The measurement points and the unit control flow regression curves qr = qc − qe for different damming levels of the tested regulators are shown in Figure 9. These curves are described by a non-linear model using Equation (4) with the coefficients in Table 2.
The effectiveness of water level control with the tested regulators is described by the kq (–) coefficient of the unit flow increase factor. It takes into account the influence of the shape and development of the overflow in the plan on the capacity of the regulator. Using the kq (–) factor, the flow through the U and Z controllers satisfies the relationship:
where is the flow rate through U- and Z-type regulators for a module (beam) with width b, kq is the flow rate increase coefficient, and is the flow rate through the S-type regulator for the module width b.
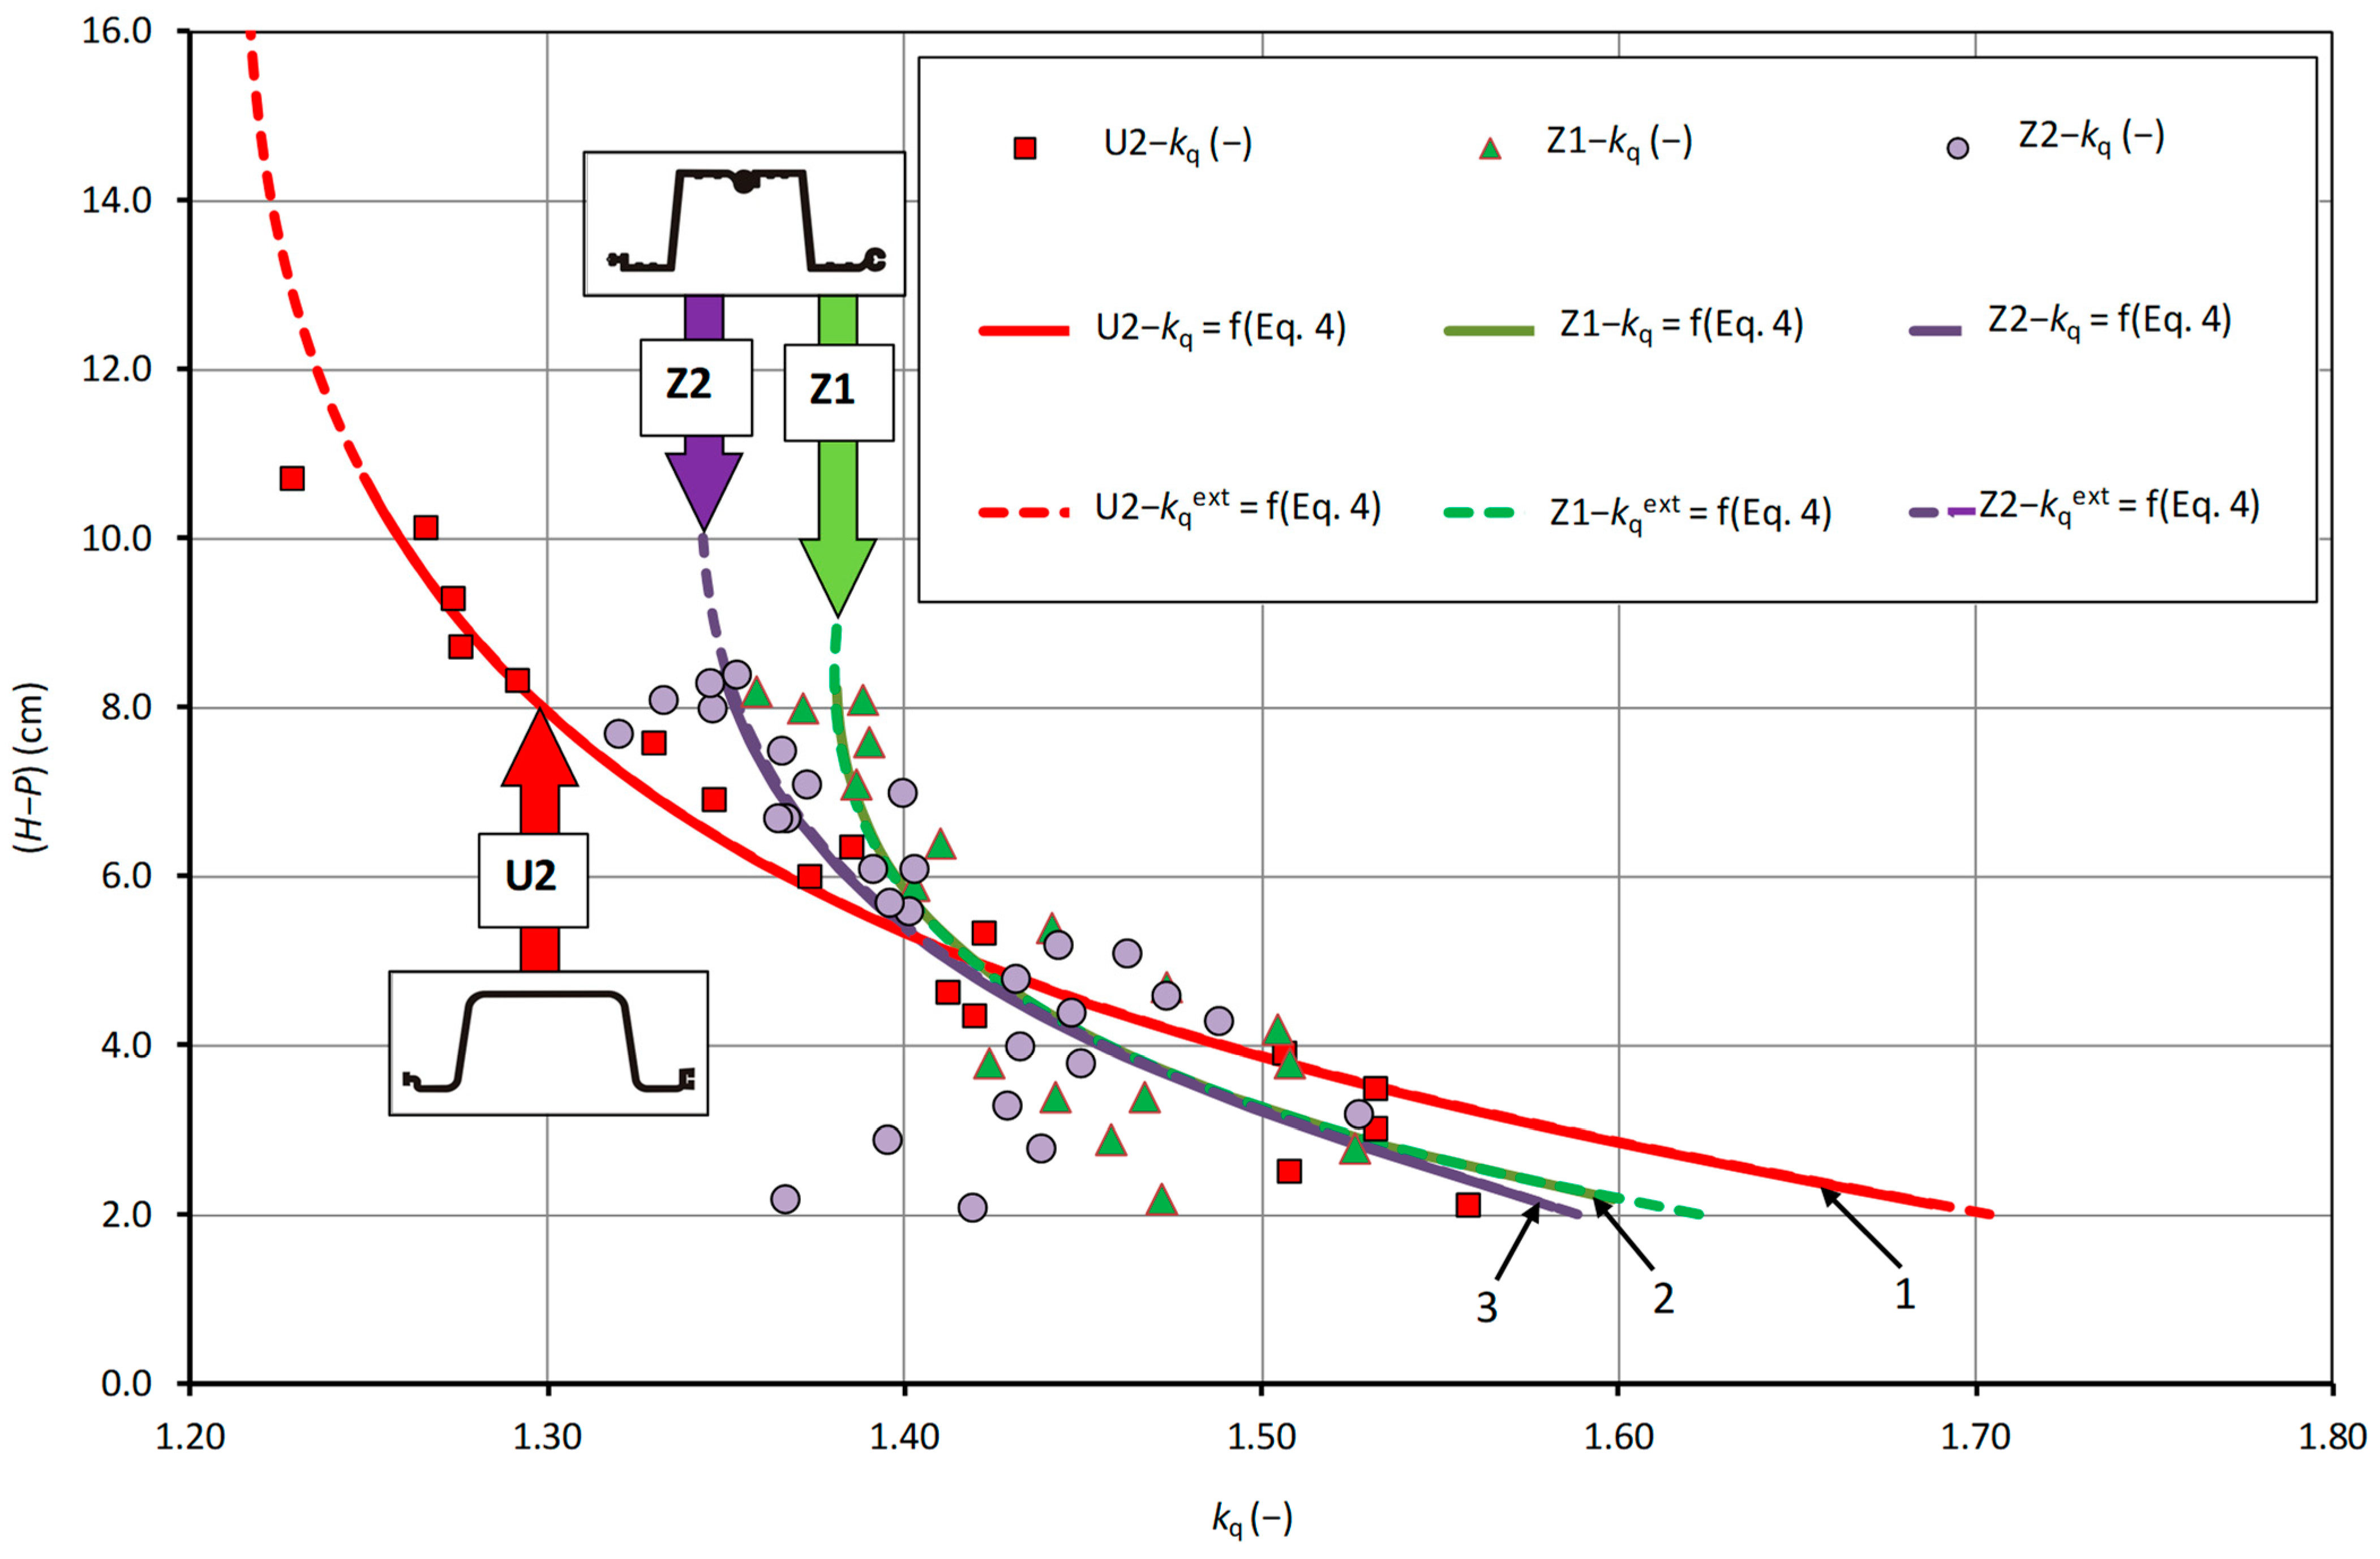
The coefficient kqi = qi/qSi (–) was calculated as the ratio of qi of the unit flow rate of the regulators U2, Z1 and Z2, with a developed shape, to qSi of the unit flow rate of the rectilinear S regulator, with the same value (H − P) and water depth in the top position. Figure 10 shows the values of the coefficient kqi of the increase in flow calculated for the measuring points and the curves of changes in this coefficient, calculated according to the developed regression equations kqF(i) = Fqi/FqSi described by Equation (4) with the parameters in Table 2, where: Fqi—unit flow rate calculated according to the function Fqi = F(H − P)i and developed for variants U2, Z1 and Z2; FqSi—unit flow rate according to FqSi = F(H − P)Si of the function for variants S1 and S2. The approximation curves developed according to Formula (4) were used to extrapolate the value of the kqi (–) coefficient into the filling zone (H − P) above the test range.
The tested U and Z models are characterized by similar conditions of the impact of the shape of the overflow and the development of its crest line on the obtained increase in the unit flow rate. The maximum value of the unit flow increase factor occurs when the filling is slightly above the overflow crest. Above 5.0 cm filling, the impact of developing the overflow line decreases. The value of the growth factor stabilizes at fillings (H − P) greater than those included in the scope of the tests.
For the U2 variant (line 1 in Figure 10), the unit flow rate increase coefficient reaches the highest value of 1.70 for a filling of 2.0 cm above the crest. Then, its value decreases to 1.25 in the measuring range at about 11.0 cm, and a further decrease to 1.22 occurs when extrapolating the curves to the height (H − P) = 16.0 cm. The Z model is characterized by a gradual decrease in the value of the flow increase coefficient kq. Initially, up to a height (H − P) of about 5.0 cm, the variability in the kq coefficient for variants Z1 and Z2 is almost identical. After exceeding 5.0 cm for variant Z1 (line 2 in Figure 10), there is a further continuous but slight decrease in the value of the kq coefficient. In the scope of the tested fillings at 8.0 cm, the value of the factor is 1.38. Assuming larger fillings (up to 9.0 cm), the factor remains at the same level of 1.38. For the Z2 variant (line 3 in Figure 10), after exceeding a height (H − P) of 8.0 cm, the influence of the curvature of the overflow edge disappears, and the value of the kq coefficient stabilizes at a level of about 1.35. The different courses of the kq curves for variants Z1 and Z2 for the filling above 8.0 cm indicate that the regulating properties of the beam regulators depend on the height of their threshold.
5. Summary and Conclusions
This article describes a pilot study on a new generation of water-damming regulators in drainage ditches with rectilinear beam closures and a developed shape in the plan. They are considered potential innovative solutions, the design of which is not well known, and there are no publications available on such solutions. Therefore, the final conclusions were developed solely on the basis of the results of our own research and comparative calculations. Only the basic hydraulic characteristics of the tested prototypes of regulators were developed. None of the generalized dimensionless hydraulic relationships were presented because the tests were limited to fixed dimensions without modifications or changes in the sizes of the main regulators’ elements.
Based on the conducted research of regulators, the following conclusions and recommendations were formulated:
- The tested regulators are suitable for damming water in ditches at flows equal to and greater than the effective flow, that is, equal to the water losses due to leakages. The S regulator with rectilinear beams of closures has 4 ÷ 5 times greater effective flow compared to other regulators, so the most effective are devices of types U and Z, which are recommended for practical use.
- Regulators with beam closures with a developed shape are characterized by greater efficiency in regulating the position of the water table in comparison to the S-type regulator. Their design ensured stabilization of the position of the backwater table, with lower values of the effective flow Qe and the damming height (H − P). This was the result of both greater tightness of the connections of their elements, as well as the development of the overflow crest in the plan.
- The use of the expansion of the overflow crest in the plan in U-type and Z-type regulators increased the hydraulic efficiency of these devices, expressed by the kq coefficient of unit flow increase, especially at overflow layer heights of up to 5.0 cm. For heights greater than 5.0 cm, the beams of the Z2 type with an angular corner shape were characterized by a lower value of the flow increase coefficient kq = 1.25 than the Z1-type beams with a curvilinear shape, for which kq ∈ <1.35 ÷ 1.38>.
- It is recommended to conduct further detailed tests with the use of regulators with the described structure and a wider range of beam shapes and hydraulic conditions, that is, the flow rate and damming height. The result of these studies would be the development of dimensionless modular characteristics for the series of regulator types with different damming heights. It is also recommended to include numerical modeling of the regulators in analyses of this type, which would replace toilsome laboratory tests.
Author Contributions
Conceptualization, S.B. and J.U.; methodology, Z.P.; laboratory tests, P.S.; validation, R.O., Z.P. and S.B.; formal analysis, S.B. and P.S.; investigation, J.U.; resources, P.S.; data curation, J.U. and Z.P.; writing—original draft preparation, A.B.; writing—review and editing, J.U. and P.S.; visualization, S.B.; supervision, J.U.; project administration, R.O. All authors have read and agreed to the published version of the manuscript.
Funding
This research was funded by the project “Technological innovations and system of monitoring, forecasting and planning of irrigation and drainage for precise water management on the scale of drainage/irrigation system (INOMEL)” under the BIOSTRATEG3 program, funded by the Polish National Centre for Research and Development. Contract number BIOSTRATEG3/347837/11/NCBR/2017.
Institutional Review Board Statement
Not applicable.
Informed Consent Statement
Not applicable.
Data Availability Statement
Not applicable.
Acknowledgments
Administrative and technical support was provided by the BIOSTRATEG3 program, funded by the Polish National Centre for Research and Development.
Conflicts of Interest
The authors declare no conflict of interest.
References
- Somorowska, U. Amplified signals of soil moisture and evaporative stresses across Poland in the twenty-first century. Sci. Total Environ. 2022, 812, 151465. [Google Scholar] [CrossRef] [PubMed]
- Kundzewicz, Z.W.; Piniewski, M.; Mezghani, A.; Okruszko, T.; Pińskwar, I.; Kardel, I.; Hov, Ø.; Szcześniak, M.; Szwed, M.; Benestad, R.E.; et al. Assessment of climate change and associated impact on selected sectors in Poland. Acta Geophys. 2018, 66, 1509–1523. [Google Scholar] [CrossRef] [Green Version]
- Popek, Z.; Bajkowski, S.; Siwicki, P.; Urbański, J. Laboratory Tests of New Groundwater Table Level Regulators in Subsurface Drainage Systems. Water 2021, 13, 631. [Google Scholar] [CrossRef]
- Kaca, E. Operacyjne Sterowanie Procesem Nawodnień Podsiąkowych i Odwodnień—Komputerowy System Wspomagania Decyzji Wraz z Przykładami Zastosowania; Bogucki Wydawnictwo Naukowe: Poznań, Poland, 2020; p. 186. [Google Scholar]
- Przybyła, C.; Szafrański, C. Water management problems in the agriculture of Wielkopolska province, Poland. Water Environ. Rural. Areas 2004, 4, 25–38. [Google Scholar]
- Wilderer, P.A. Applying Sustainable Water Management Concepts in Rural and Urban Areas: Some Thoughts About Reasons, Means and Needs. Water Sci. Technol. 2004, 49, 7–16. [Google Scholar] [CrossRef]
- Mioduszewski, W. Management of water resources in rural areas: The Polish approach. J. Water Land Dev. 2006, 10, 3–14. [Google Scholar] [CrossRef]
- Mosiej, J.; Pierzgalski, E.; Jeznach, J. Contemporary problems of water management in rural areas. Postępy Nauk. Rol. 2011, 1, 25–36. [Google Scholar]
- Schuurmans, J.; Hof, A.; Dijkstra, S.; Bosgra, O.H.; Brouwer, R. Simple Water Level Controller for Irrigation and Drainage Canals. J. Irrig. Drain. Eng. 1999, 125, 189–195. [Google Scholar] [CrossRef]
- Ankum, P.; Renault, D. Modernization of Irrigation Systems—Technical Modules; FAO Land & Water Division: Rome, Italy, 2008; p. 32. [Google Scholar]
- Oleszczuk, R.; Stocka, I.; Urbański, J.; Hewelke, E. Evaluation of hydraulic structures condition in a sub-irrigation system Solec. Wiadomości Melior. Łąkarskie 2016, 2, 72–76. [Google Scholar]
- Oleszczuk, R.; Stocka, I.; Urbański, J.; Hewelke, E. Water damming structures condition in a selected valley system. Water Environ. Rural. Areas 2017, 17, 89–100. [Google Scholar]
- Smedema, L.K.; Vlotman, W.F.; Rycroft, D.W. Modern Land Drainage: Planning, Design and Management of Agricultural Drainage Systems; CRC Press: Abingdon, UK, 2004; p. 449. [Google Scholar]
- Skaggs, R.W.; Fausey, N.R.; Evans, R.O. Drainage water management. J. Soil Water Conserv. 2012, 67, 167A–172A. [Google Scholar] [CrossRef] [Green Version]
- Szejba, D.; Bajkowski, S. Determination of Tile Drain Discharge under Variable Hydraulic Conditions. Water 2019, 11, 120. [Google Scholar] [CrossRef] [Green Version]
- Subhash, C.; Jain, M. Free-surface swirling flows in vertical dropshaft. J. Hydraul. Eng. 1987, 113, 1277–1289. [Google Scholar]
- Harada, M. Fluid Control and Measurement; The Society of Instrument and Control Engineers, Pergamon Press: Tokyo, Japan, 1986; Volume 1, p. 587. [Google Scholar]
- Bos, M.G. Discharge Measurement Structures, 3rd ed.; International Institute for Land Reclamation and Improvement/ILRI: Wageningen, The Netherlands, 1989; p. 402. [Google Scholar]
- Voron, B. Regulation and management of water in irrigation canals and water saving irrigation methods and technologies. La Houille Blanche 1995, 4, 72–81. [Google Scholar] [CrossRef] [Green Version]
- Frankenberger, J.; Kladivko, E.; Sands, G.; Jaynes, D.; Fausey, N.; Helmers, M.; Brown, L. Drainage Water Management for the Midwest: Questions and Answers about Drainage Water Management for the Midwest; Purdue Extension: West Lafayette, IN, USA, 2006; 8p. [Google Scholar]
- Jaynes, D.B. Changes in yield and nitrate losses from using drainage water management in central Iowa, United States. J. Soil Water Conserv. 2012, 67, 485–494. [Google Scholar] [CrossRef] [Green Version]
- Sunohara, M.D.; Gottschall, N.; Craiovan, E.; Wilkes, G.; Topp, E.; Frey, S.K.; Lapen, D.R. Controlling tile drainage during the growing season in Eastern Canada to reduce nitrogen, phosphorus, and bacteria loading to surface water. Agric. Water Manag. 2016, 178, 159–170. [Google Scholar] [CrossRef]
- Sojka, M.; Kozłowski, M.; Stasik, R.; Napierała, M.; Kęsicka, B.; Wróżyński, R.; Jaskuła, J.; Liberacki, D.; Bykowski, J. Sustainable Water Management in Agriculture—The Impact of Drainage Water Management on Groundwater Table Dynamics and Subsurface Outflow. Sustainability 2019, 11, 4201. [Google Scholar] [CrossRef] [Green Version]
- Pierzgalski, E. Land Reclamation of Grassland–Sub-Irrigation Systems. Guide–Book; Warsaw Agricultural University Press: Warsaw, Poland, 1996; p. 200. [Google Scholar]
- Brandyk, A.; Kaca, E.; Oleszczuk, R.; Urbański, J.; Jadczyszyn, J. Conceptual Model of Drainage-Sub Irrigation System Functioning-First Results from a Case Study of a Lowland Valley Area in Central Poland. Sustainability 2021, 13, 107. [Google Scholar] [CrossRef]
- Okruszko, H. Transformation of fen-peat soil under the impact of draining. Zesz. Prob. Post. Nauk Rol. 1993, 406, 3–73. [Google Scholar]
- Czaplak, I.; Dembek, W. Polish peatlands as a source of carbon dioxide emission. Zesz. Eduk. Rol. Pol. Ochr. Jakości Wody 2000, 6, 61–71. [Google Scholar]
- Strack, M. (Ed.) Peatlands and Climate Change; International Peat Society: Jyväskylä, Finland, 2008; p. 223. [Google Scholar]
- Ilnicki, P.; Szajdak, L.W. Peatland Disappearance; PTPN Press: Poznań, Poland, 2016; p. 312. [Google Scholar]
- Lipka, K.; Zając, E.; Hlotov, V.; Siejka, Z. Disappearance rate of a peatland in Dublany near Lviv (Ukraine) drained in 19th century. Mires Peat 2017, 19, 1–15. [Google Scholar]
- Oleszczuk, R.; Zajac, E.; Urbański, J.; Jadczyszyn, J. Rate of Fen-Peat Soil Subsidence Near Drainage Ditches (Central Poland). Land 2021, 10, 1287. [Google Scholar] [CrossRef]
- Renger, M.; Wessolek, G.; Schwärzel, K.; Sauerbrey, R.; Siewert, C. Aspects of peat conservation and water management. J. Plant Nutr. Soil Sci. 2002, 165, 487–493. [Google Scholar] [CrossRef]
- Jurczuk, S. Drainage-irrigation practices for the preservation of organic matter on post-bog soils used as meadows. Water Environ. Rural. Areas 2011, 30, s1–s81. [Google Scholar]
- Querner, E.P.; Jansen, P.C.; van den Akker, J.J.H.; Kwakernaak, C. Analysing water level strategies to reduce soil subsidence in Dutch peat meadows. J. Hydrol. 2012, 446, 59–69. [Google Scholar] [CrossRef]
- Van den Akker, J.J.H.; Hendriks, R.F.A.; Pleijter, M. CO2 emissions from peat soils in agricultural use: Calculation and prevention. Agrociencia 2012, 16, 43–50. [Google Scholar]
- Van den Akker, J.J.H.; Jansen, P.C.; Hendriks, R.F.A.; Hoving, I.; Pleijter, M. Submerged infiltration to halve subsidence and GHG emissions of agricultural peat soils. In Proceedings of the 14th International Peat Congress, Extended Abstract No. 383, Stockholm, Sweden, 3–8 June 2012. [Google Scholar]
- Urzainki, I.; Laurén, A.; Palviainen, M.; Haahti, K.; Budiman, A.; Basuki, I.; Netzer, M.; Hökkä, H. Canal blocking optimization in restoration of drained peatlands. Biogeosciences 2020, 17, 4769–4784. [Google Scholar] [CrossRef]
- Kundzewicz, Z.W.; Zalewski, M.; Kędziora, A.; Pierzgalski, E. Threats related with water. Nauka 2010, 4, 87–96. [Google Scholar]
Figure 1.
Beam regulators: (a) rectilinear beam, (b) compound beam (photo by R. Oleszczuk).

Figure 2.
Scheme of the entire experimental site: 1—flume; 2—bottom tank; 3—pump; 4—upper stability tank; 5—regulating valve; 6—electromagnetic flow meter; 7—precise water gauge; 8—regulators of water damming in the ditches; 8a—rectilinear regulator; 8b—labyrinth regulator; 8c—compound regulator; H (cm)—top water depth; P (cm)—height of the regulator overflow (photo by Z. Popek).

Figure 3.
Measurement scheme of the S rectilinear regulator (a) measuring station, (b) regulator mounting, (c) cross-section of the beam: 1—beam; 2—gib; 3—regulator sill (photo by J. Urbański).
Figure 3.
Measurement scheme of the S rectilinear regulator (a) measuring station, (b) regulator mounting, (c) cross-section of the beam: 1—beam; 2—gib; 3—regulator sill (photo by J. Urbański).

Figure 4.
Measurement diagram of the U labyrinth regulator: (a) measuring station, (b) regulator mounting, (c) cross-section of the beam: 1—beam; 2—gib with female lock; 3—gib with a male lock (photo by Z. Popek).
Figure 4.
Measurement diagram of the U labyrinth regulator: (a) measuring station, (b) regulator mounting, (c) cross-section of the beam: 1—beam; 2—gib with female lock; 3—gib with a male lock (photo by Z. Popek).

Figure 5.
Measurement diagram of the Z compound regulator: (a) measuring station, (b) regulator mounting, (c) cross-section of the beam: 1—beam; 2—gib with female lock; 3—gib with male lock (photo by Z. Popek).
Figure 5.
Measurement diagram of the Z compound regulator: (a) measuring station, (b) regulator mounting, (c) cross-section of the beam: 1—beam; 2—gib with female lock; 3—gib with male lock (photo by Z. Popek).

Figure 6.
Effective flow Qe of the tested regulators depending on the water depth H: 1—S model; 2—U model; 3—Z model; 4—levels of the upper edges of the beams.
Figure 6.
Effective flow Qe of the tested regulators depending on the water depth H: 1—S model; 2—U model; 3—Z model; 4—levels of the upper edges of the beams.

Figure 7.
Discharge curves of regulators at different heights of the edge of the regulatory overflow: 1—variant S4; 2—variant U2; 3—variant Z1; 4—variant Z2.
Figure 7.
Discharge curves of regulators at different heights of the edge of the regulatory overflow: 1—variant S4; 2—variant U2; 3—variant Z1; 4—variant Z2.

Figure 8.
Discharge curves of beam regulators at different heights of the overflow edge position: 1—variant S4; 2—variant U2; 3—variant Z1; 4—variant Z2.
Figure 8.
Discharge curves of beam regulators at different heights of the overflow edge position: 1—variant S4; 2—variant U2; 3—variant Z1; 4—variant Z2.

Figure 9.
Unit flow rates of the tested regulator variants: 1—variant S4; 2—variant U2; 3—variant Z1; 4—variant Z2.
Figure 9.
Unit flow rates of the tested regulator variants: 1—variant S4; 2—variant U2; 3—variant Z1; 4—variant Z2.

Figure 10.
Coefficient of increase in unit flow rate: 1—U2/S2 according to Equation (4); 2—Z1/S1 according to Equation (4); 3—Z2/S2 according to Equation (4).
Figure 10.
Coefficient of increase in unit flow rate: 1—U2/S2 according to Equation (4); 2—Z1/S1 according to Equation (4); 3—Z2/S2 according to Equation (4).


Table 1.
Parameters of the tested beam regulators.
| No. | Model | b (m) | Lp (m) | Lk (cm) | kr (–) | Variant | P (cm) | Qe (dm3⋅s−1) |
|---|---|---|---|---|---|---|---|---|
| 1 | 2 | 3 | 4 | 5 | 6 | 7 | 8 | 9 |
| 1 | S—rectilinear | 0.450 | 0.450 | 1.2 | 1.00 | S5 | 87.7 | 0.937 |
| 2 | S4 | 71.5 | 0.879 | |||||
| 3 | S3 | 55.0 | 0.767 | |||||
| 4 | S2 | 38.2 | 0.597 | |||||
| 5 | S1 | 21.8 | 0.376 | |||||
| 6 | S0 | 6.8 | 0.000 | |||||
| 7 | U—labyrinth | 0.588 | 0.935 | 0.9 | 1.58 | U5 | 102.2 | 0.383 |
| 8 | U4 | 81.7 | 0.266 | |||||
| 9 | U3 | 61.2 | 0.169 | |||||
| 10 | U2 | 40.5 | 0.092 | |||||
| 11 | U1 | 20.2 | 0.036 | |||||
| 12 | U0 | 0.0 | 0.000 | |||||
| 13 | Z—compound | 0.544 | 0.967 | 1.1 | 1.74 | Z5 | 102.6 | 0.198 |
| 14 | Z4 | 82.0 | 0.131 | |||||
| 15 | Z3 | 61.4 | 0.078 | |||||
| 16 | Z2 | 41.6 | 0.040 | |||||
| 17 | Z1 | 20.5 | 0.013 | |||||
| 18 | Z0 | 0.0 | 0.000 |
b (m)—width of the outlet opening; Lp (m)—length of the overflow line; Lk (cm)—width of the rectangular edge of the overflow (equivalent width for the S model); kr (–)—overflow development factor; P (cm)—height threshold in the upper stand; Qe (dm3⋅s−1)—effective flow.
Table 2.
Parameters of Equation (4) of regulation Qr discharge curves.
| No. | Parameter | S4 | U2 | Z1 | Z2 |
|---|---|---|---|---|---|
| 1 | 2 | 3 | 4 | 5 | 6 |
| 1 | a1 | 1.0000 | 0.1871 | 0.2798 | 0.2408 |
| 2 | a2 | 0.0000 | 3.4250 | 2.5577 | 2.8244 |
| 3 | b1 | 1.50 | 2.0 | 2.0 | 2.0 |
| 4 | Qe (dm3⋅s−1) | 0.8794 | 0.0917 | 0.0126 | 0.0397 |
| 5 | r | 0.9956 | 0.9983 | 0.9984 | 0.9985 |
| 6 | R2 | 0.9987 | 0.9990 | 0.9987 | 0.9978 |
| 7 | N | 65 | 17 | 18 | 28 |
| 8 | Hmin (cm) | 73.54 | 42.63 | 22.70 | 43.70 |
| 9 | Hmax (cm) | 86.39 | 51.22 | 28.70 | 50.00 |
| 10 | Qmin (dm3⋅s−1) | 3.700 | 7.600 | 6.440 | 6.310 |
| 11 | Qmax (dm3⋅s−1) | 55.900 | 57.360 | 39.280 | 40.850 |
Abbreviations: r—linear correlation coefficient; R2—coefficient of determination.
Publisher’s Note: MDPI stays neutral with regard to jurisdictional claims in published maps and institutional affiliations. |
© 2022 by the authors. Licensee MDPI, Basel, Switzerland. This article is an open access article distributed under the terms and conditions of the Creative Commons Attribution (CC BY) license (https://creativecommons.org/licenses/by/4.0/).
Share and Cite
MDPI and ACS Style
Urbański, J.; Bajkowski, S.; Siwicki, P.; Oleszczuk, R.; Brandyk, A.; Popek, Z. Laboratory Tests of Water Level Regulators in Ditches of Irrigation Systems. Water 2022, 14, 1259. https://doi.org/10.3390/w14081259
AMA Style
Urbański J, Bajkowski S, Siwicki P, Oleszczuk R, Brandyk A, Popek Z. Laboratory Tests of Water Level Regulators in Ditches of Irrigation Systems. Water. 2022; 14(8):1259. https://doi.org/10.3390/w14081259
Chicago/Turabian StyleUrbański, Janusz, Sławomir Bajkowski, Piotr Siwicki, Ryszard Oleszczuk, Andrzej Brandyk, and Zbigniew Popek. 2022. "Laboratory Tests of Water Level Regulators in Ditches of Irrigation Systems" Water 14, no. 8: 1259. https://doi.org/10.3390/w14081259
Note that from the first issue of 2016, this journal uses article numbers instead of page numbers. See further details here.