
SpillwayPro: Integrated Water Surface Profile, Cavitation, and Aerated Flow Analysis for Smooth and Stepped Chutes


1
U.S. Department of the Interior, Bureau of Reclamation, Denver, CO 80225, USA
2
Henry T. Falvey & Associates, Inc., Conifer, CO 80433, USA
*
Author to whom correspondence should be addressed.
Water 2022, 14(8), 1256; https://doi.org/10.3390/w14081256
Submission received: 8 February 2022
/
Revised: 5 April 2022
/
Accepted: 7 April 2022
/
Published: 13 April 2022
(This article belongs to the Special Issue Advances in Spillway Hydraulics: From Theory to Practice)
Abstract
:Spillways of large and small dams experience flow conditions that exceed the capabilities of common water surface profile computer programs. Unique channel geometries, steep slopes, and streamline curvature demand rigorous mathematics, while phenomena associated with aerated flow and potential cavitation require special analyses, especially for stepped chutes. SpillwayPro is a generalized, energy-based, water surface profile calculation tool for both smooth and stepped chutes that integrates cavitation analysis and aerated flow effects, with separate modules supporting aerator design and the development of optimized structure profiles that meet cavitation parameter objectives. Simultaneous calculation of smooth and stepped-chute flow profiles enables the rapid assessment of the energy dissipation benefits of steps, as well as their unique aerated flow and cavitation issues. SpillwayPro’s technical basis is presented, and its results are compared to the data from prototype case studies and empirical methods developed from large-scale laboratory studies. SpillwayPro’s fundamental energy-based methods are useful for cases that differ from idealized empirical approaches and would benefit from a more rapid analysis than can be accomplished with physical or computational fluid dynamics (CFD) modeling.
1. Introduction
Spillway chutes are an essential feature of most dams and must be analyzed carefully to address a variety of design issues, including the height of training walls, cavitation potential, and energy content of the flow reaching a terminal structure (e.g., stilling basin or flip bucket). The basis for many of these analyses is the calculation of a water surface profile that provides initial information on the depth and velocity of non-aerated (clear water) flow and provides the basis for supplemental analysis of cavitation, aerated flow, and associated effects, such as flow bulking and changes in energy dissipation. Many of the important phenomena are significantly modified when chutes are constructed with a stepped invert, and the evaluation of stepped-chute design alternatives requires a comparison of stepped-chute versus smooth chute performance.
Computation of water surface profiles is familiar to most hydraulic engineers using tools such as HEC-RAS [1], but spillway applications have unique requirements. To begin, steep channel slopes and streamline curvature in the vertical plane create significant differences between the free water surface itself and the associated piezometric head, and these must be accounted for to compute the actual pressure exerted against the spillway surface for determining hydrodynamic loads and cavitation potential. Spillway flows are also commonly affected by self-aeration, a process that occurs when thin, high velocity flows interact with the boundary layers produced by the invert of the channel and the air flow induced above the free surface; both can roughen the free surface enough to create turbulent waves and droplets that eventually entrain air into the flow. Downstream from the air inception point, the appearance and character of the flow change dramatically, with whitewater characterized by increased flow depth and splash, decreased effective fluid density, and reduced hydraulic friction. Many spillways today are constructed with stepped surfaces that accelerate the air entrainment process and have dramatically greater roughness and energy dissipation than a smooth chute.
Tools for computation of spillway hydraulic profiles are limited. HEC-RAS [1] is a widely known water surface profile tool, and while it allows supercritical flow, it does not consider streamline curvature, cavitation, aerated flow, or stepped chute geometries. WSPRO, developed by the U.S. Geological Survey and distributed by the Federal Highway Administration (FHWA) as HY−7 [2], also has some capabilities for analyzing supercritical flow, but does not address cavitation, aeration, or stepped profiles, and has not been improved since a 1990 revision. SpillwayPro [3] was developed over several decades at the Bureau of Reclamation. The program began as a standard-step water surface profile calculator with features that supported the analysis of aerated open channel flow [4]. Later improvements added cavitation analysis and separate program modules to support cavitation-related design needs (aerators, controlled-pressure spillway profiles, and the estimation of damage indices for extended operational periods) [5]. The most recent developments described in this paper improve the aerated flow calculations for smooth chutes and add the analysis of stepped chutes. SpillwayPro offers a full-featured ability to analyze many of the most important aspects of spillway hydraulics more rapidly than can be achieved with physical or computational fluid dynamics (CFD) models. SpillwayPro is available for free download by the public [6].
The aerated flow routines in the 1980s-era predecessors to SpillwayPro were developed [7] from the idea that aerated flow occurs when the turbulent boundary layer generated at the channel bed grows in thickness to reach the free water surface [8] and turbulent forces exceed the ability of surface tension to maintain the continuity of the air-water interface. A relation for modeling this force balance was developed [7] from reanalysis of data collected from several field tests and from laboratory tests by Straub and Anderson [9]. However, in practice, the relation often predicted no aeration in situations where aeration was observed.
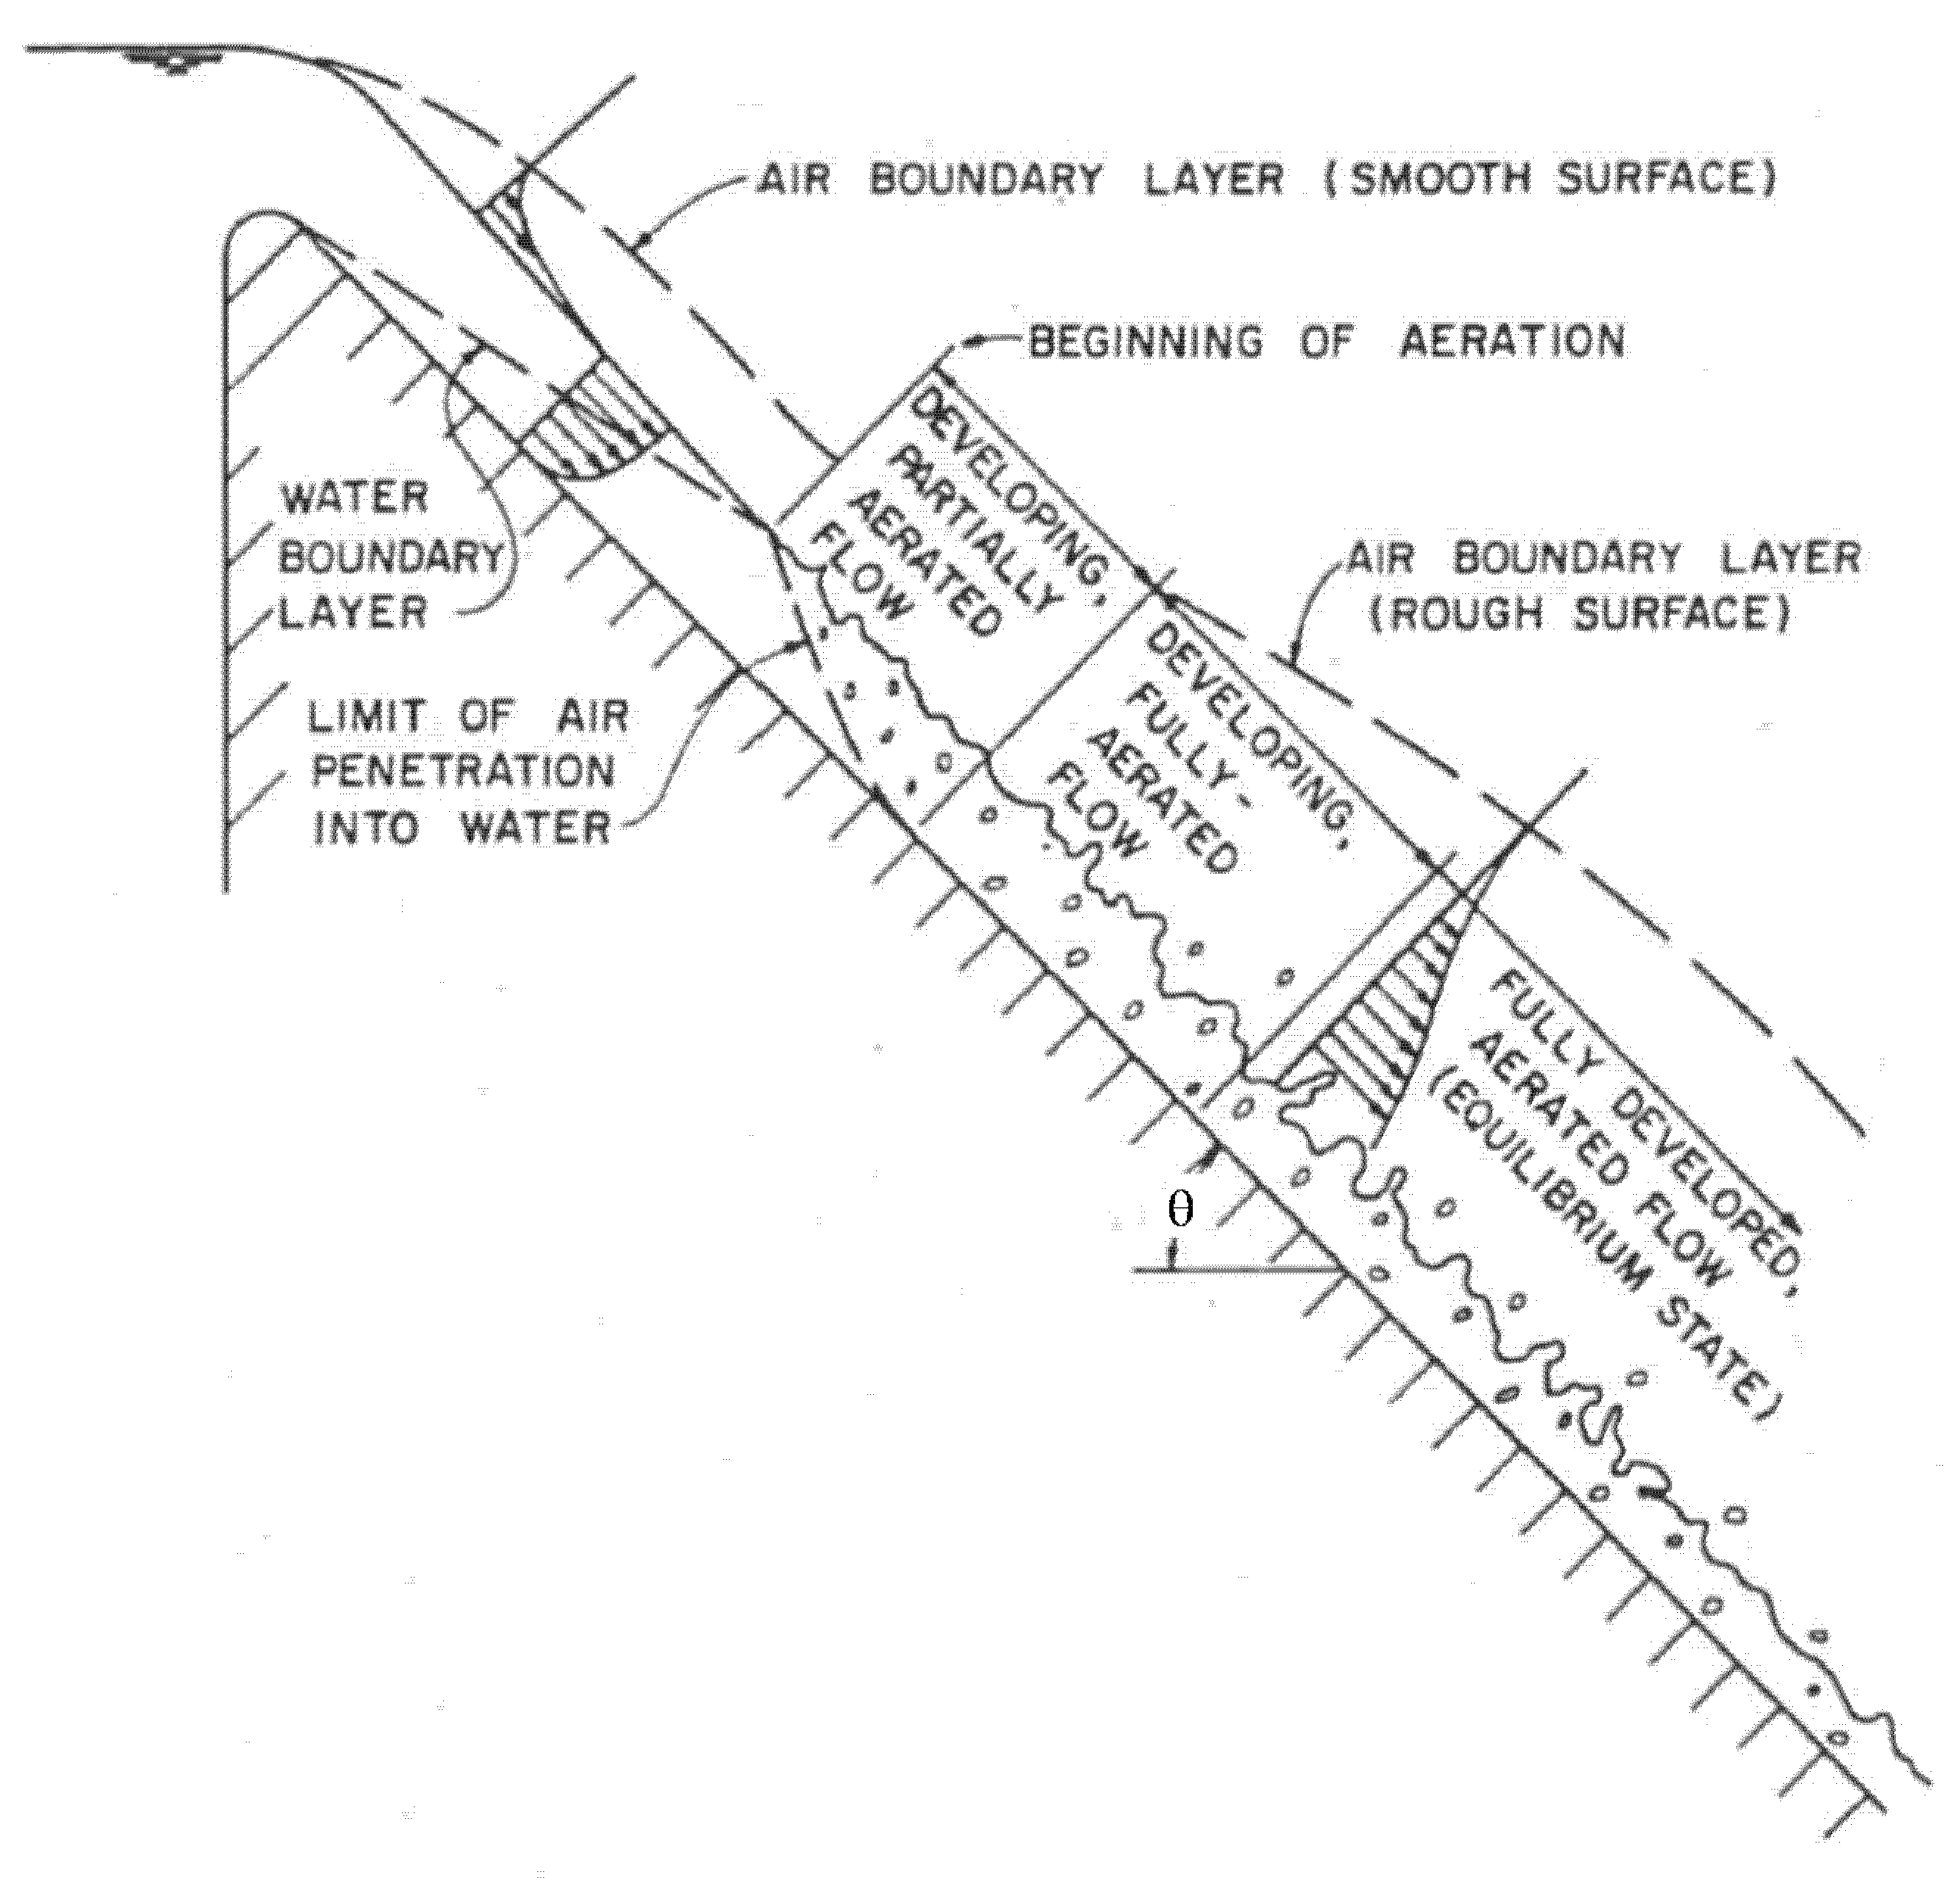
Computation of aerated flow has continued to be a rich research topic in recent decades. Four flow zones are typically identified (Figure 1): non-aerated or clear-water flow, developing partially aerated flow (air entrained near the water surface but not reaching the floor of the channel), developing fully aerated flow after entrained air reaches the bed, and finally fully aerated flow once the flow velocity and aerated flow properties reach a final equilibrium [10]. The tasks in modeling this process are typically identification of the inception point (start of air entrainment at the surface), prediction of fully developed aerated flow conditions, and modeling of the transition zones between these limits. Research on these topics continues and the physical mechanisms that determine aeration inception, aerated flow development, and aeration effects on frictional resistance and energy dissipation are still open questions [11,12,13]. The new version of SpillwayPro adopts a straightforward method developed by Wilhelms and Gulliver [14,15] for computing information of practical engineering interest. In addition to computing the inception point and air concentrations in the developing and fully developed aerated flow zones, the method also predicts air concentrations at the flow boundary (of interest for mitigating against cavitation damage), flow bulking effects, and reductions of the effective friction factor.
The stepped chute is an ancient concept that has seen a resurgence in recent decades due to compatible construction techniques and a desire to aerate flow and dissipate energy [16]. Design guidance has developed separately for slopes steeper than 2H:1V (50% slope) [17,18] and flatter slopes typical of roller-compacted concrete overlays on embankment dams [19,20,21,22]. These works address similar engineering parameters as those important for smooth chutes, namely water surface profiles, aerated flow, and friction factors and energy dissipation. The potential for cavitation damage to stepped chutes is a concern at high unit discharges, where high velocities can occur prior to the inception of aerated flow that will protect the spillway surface from damage. Flow conditions for the inception of damaging cavitation have been related to step geometry through research conducted in high-speed water tunnels and in low-ambient pressure test facilities [23]. Several concepts for aerating stepped-chute flows to prevent cavitation damage have been put forward in recent years, e.g., in [24,25].
The research introduced above provides a rich combination of techniques for computing the flow parameters of engineering interest for smooth and stepped spillway chutes, but most are presented as empirical relations for application to prototype chutes of uniform width, slope, and roughness. In practice, chutes are frequently encountered with variations of all these properties. This paper presents the integration of these methods into SpillwayPro to provide a physically based tool capable of analyzing clear-water and aerated flow in smooth and stepped chutes with integrated cavitation analysis. A description of the program’s methods is provided, with discussion of the supporting literature and practical modifications made in its implementation in SpillwayPro. Readers interested in details regarding experimental uncertainty, scale effects, and boundary conditions of the experimental work should consult the cited references.
2. Structure of SpillwayPro
SpillwayPro is an Excel workbook featuring multiple worksheet tabs. The first tab is used to provide geometric and hydraulic input data defining the spillway chute, including station, elevation, cross section shapes and sizes, surface roughness, step heights, etc. The flow condition is defined through specification of discharge, reservoir elevation, control structure elevation, and the station of the crest, at which boundary layer development is presumed to begin. The bottom profile provided by the user defines both the surface of a smooth chute and the pseudobottom of a stepped chute (the line connecting the step tips). The next three tabs provide output from the standard step water surface profile calculations for the smooth chute: (a) basic hydraulic parameters; (b) aerated flow properties; and (c) cavitation parameters. The fifth tab provides output for the stepped chute flow profile. Visual Basic for Applications subroutines perform most of the calculations and place the output into the various pages. The focus of this paper is on the recently improved water surface profile calculations associated with the first five tabs of the spreadsheet.
Additional tabs handle input and output related to four other program modules: aerator trajectory and design; equal cavitation number chute profiles; chute profiles with controlled (triangular and sinusoidal) pressure distributions; and cavitation damage estimates for past or future spillway operations. Previous documentation [3] is still relevant for the other modules, which have not changed significantly since 2019.
3. Aerated Flow in Smooth Chutes
SpillwayPro’s simulation of aerated flow in smooth chutes uses the approach outlined by Wilhelms and Gulliver [14,15], with reference to the non-aerated and aerated flow zones depicted in Figure 1. The aeration inception point and the mean air concentration in the fully developed aerated flow zone are predicted, then the transitional conditions in the developing flow zones between those limits. Reductions of hydraulic friction due to aeration are estimated and predictions are made of the air concentration at the channel bottom. Although there is research to support estimating the air concentration profile continuously from the bed to the water surface in each zone, only the mean and bottom air concentrations are calculated by SpillwayPro as these are of primary engineering interest.
3.1. Aeration Inception Point
Lane [8] first suggested that the inception of aerated flow is defined by the intersection of the developing boundary layer with the water surface, and this led to empirical relations [26] for estimating the flow distance from the start of boundary layer development to the inception point for hydraulically smooth and rough surfaces. It has also been suggested [10,11,27] that turbulent fluctuations outside the computed thickness of the boundary layer cause aeration to begin when the computed boundary layer thickness reaches about 80% of the flow depth. SpillwayPro takes this approach and estimates the thickness of the boundary layer, δ, using δ/x = 0.0302(x/ks)−1/8 [28], where x is the distance along the flow surface from the initiation of boundary layer development and ks is the surface roughness. The interested reader is also referred to Wood [10], who offers analytical approaches to computing the rate of boundary layer growth in chutes with gradually varying slope and width.
3.2. Fully Developed Aerated Flow
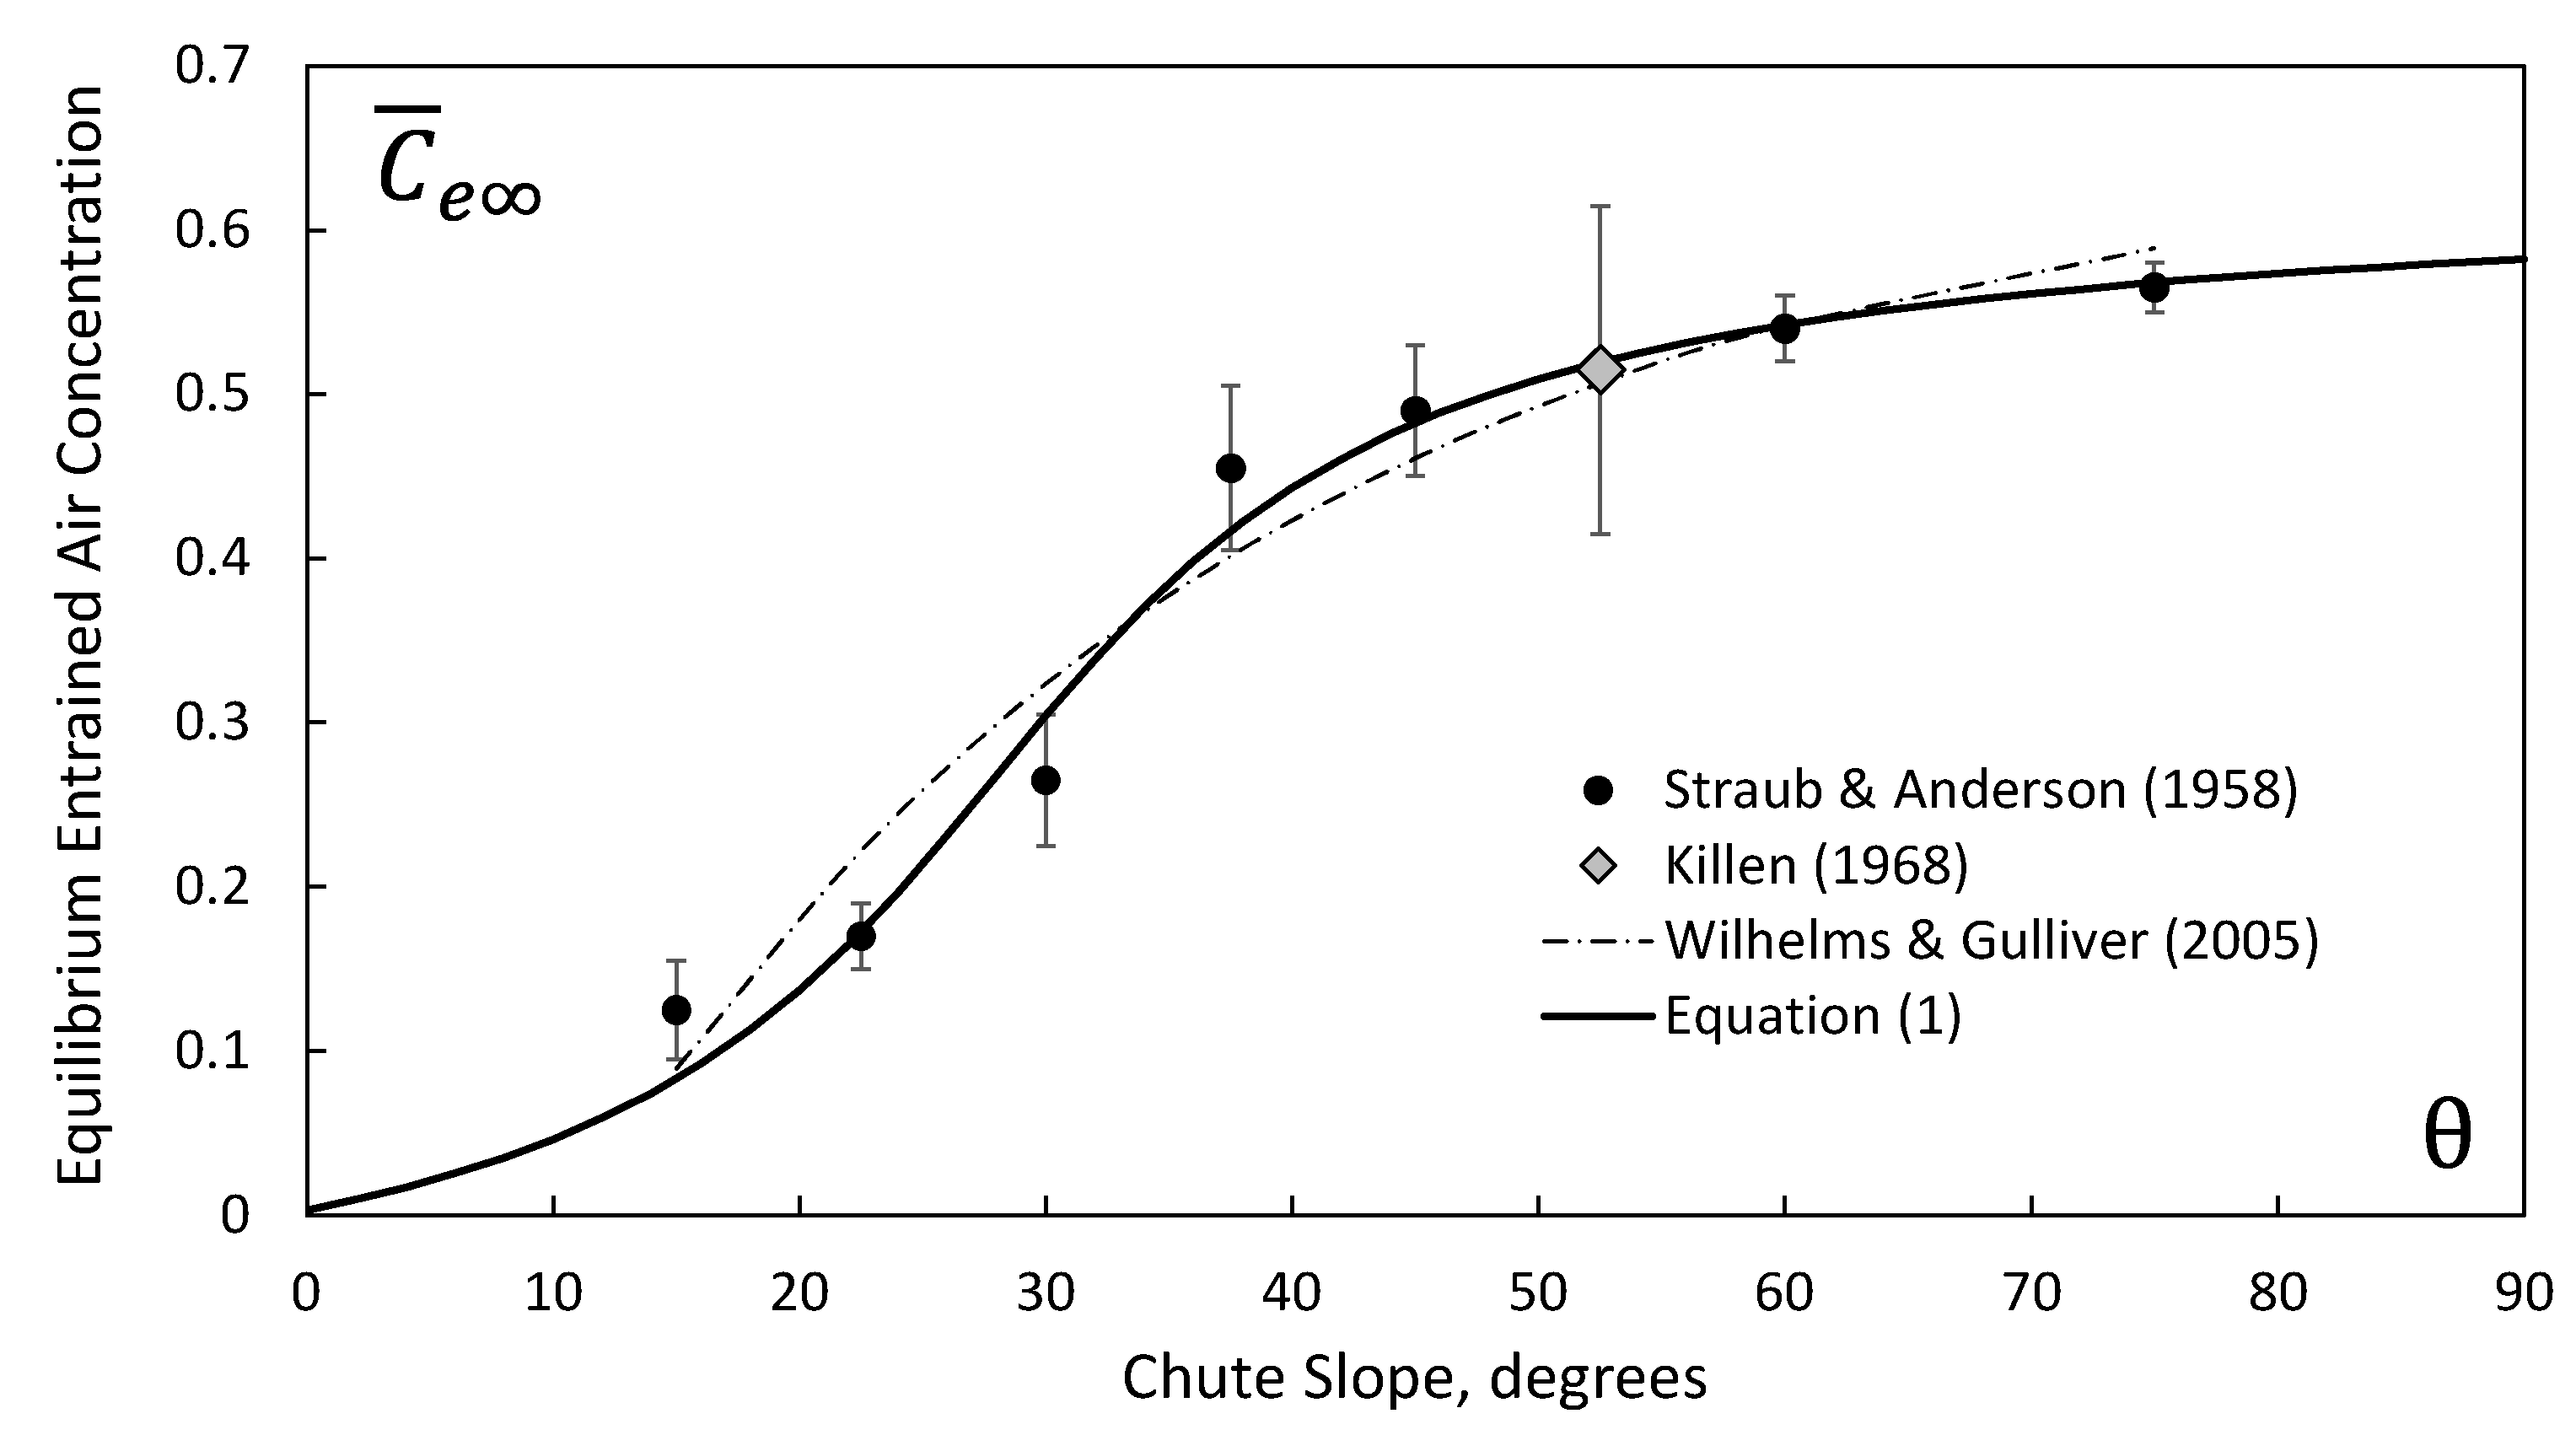
Several relations have been suggested for computing the mean air concentration in the fully developed aerated zone, e.g., [29,30]. A distinction was made by Wilhelms and Gulliver [14,15] between two modes of air transport within the flow, as indicated by photographs and water surface data collected by Killen [31]. Entrained air is transported as bubbles wholly contained within the surrounding water flow, and entrapped air travels “with the flow in the roughness or waves of the water surface”. They designated the entrained air concentration (volume of air/volume of air plus water) in the fully developed aerated zone as and developed [14] an equation that fits the newly calculated values of entrained air concentration obtained from Killen’s experiments [31]. The equation unfortunately behaves poorly outside of the range of the original data and predicts negative entrained air for chute slopes less than about 11 degrees. An improved relation that predicts zero entrained air concentration at zero slope and is faithful to the original data was developed for SpillwayPro (Figure 2).
The concept of measuring distinct quantities of entrained and entrapped air was not fully envisioned by Killen [31] at the time of his original measurements, which were made using a two-conductor, electrical resistance-based instrument whose output varied as a function of the relative time during which the two closely-spaced probe tips encountered each phase of the flow, water and air. A second electrically based system was intended to track the motion of waves on the water surface and thereby provide a measure of near-surface velocity. Wilhelms [32] was able to analyze the original data from this instrument to determine the entrapped air. Modern phase-detection air concentration probes do not provide this information directly, but useful comments on the instruments needed to measure entrapped air and the interpretation of those measurements is provided in a discussion of [14] by Pfister [33] and Wilhelms and Gulliver [34]. New measurements of entrapped air have been made recently by Valero and Bung [11] using ultrasonic sensor measurements of the water surface, and a very recent study by Chanson [35] uses visual imagery techniques to study air entrapment processes. This is still a very active research topic.
3.3. Developing Zone of Aerated Flow
Figure 1 divides the developing zone into a first region in which aeration is only present near the free surface, and a second region with aeration from the surface to the floor with air concentration increasing in the streamwise direction. SpillwayPro represents the mean entrained air concentration in the developing zone [14] using
If the chute slope is constant, the entrained air concentration will asymptotically approach for large values of X*/Yi. If the slope steepens, the value of will increase and the developing zone will extend until the new equilibrium can be reached. If the slope flattens, deaeration is possible. SpillwayPro addresses this by recalculating at each station. If drops below the previous station’s value of , deaeration is determined to occur, but the reduction is limited to where ΔX is the streamwise distance and is the flow depth at which air concentration is 0.90 in the fully developed (uniform) flow zone [36].
3.4. Bottom Air Concentration
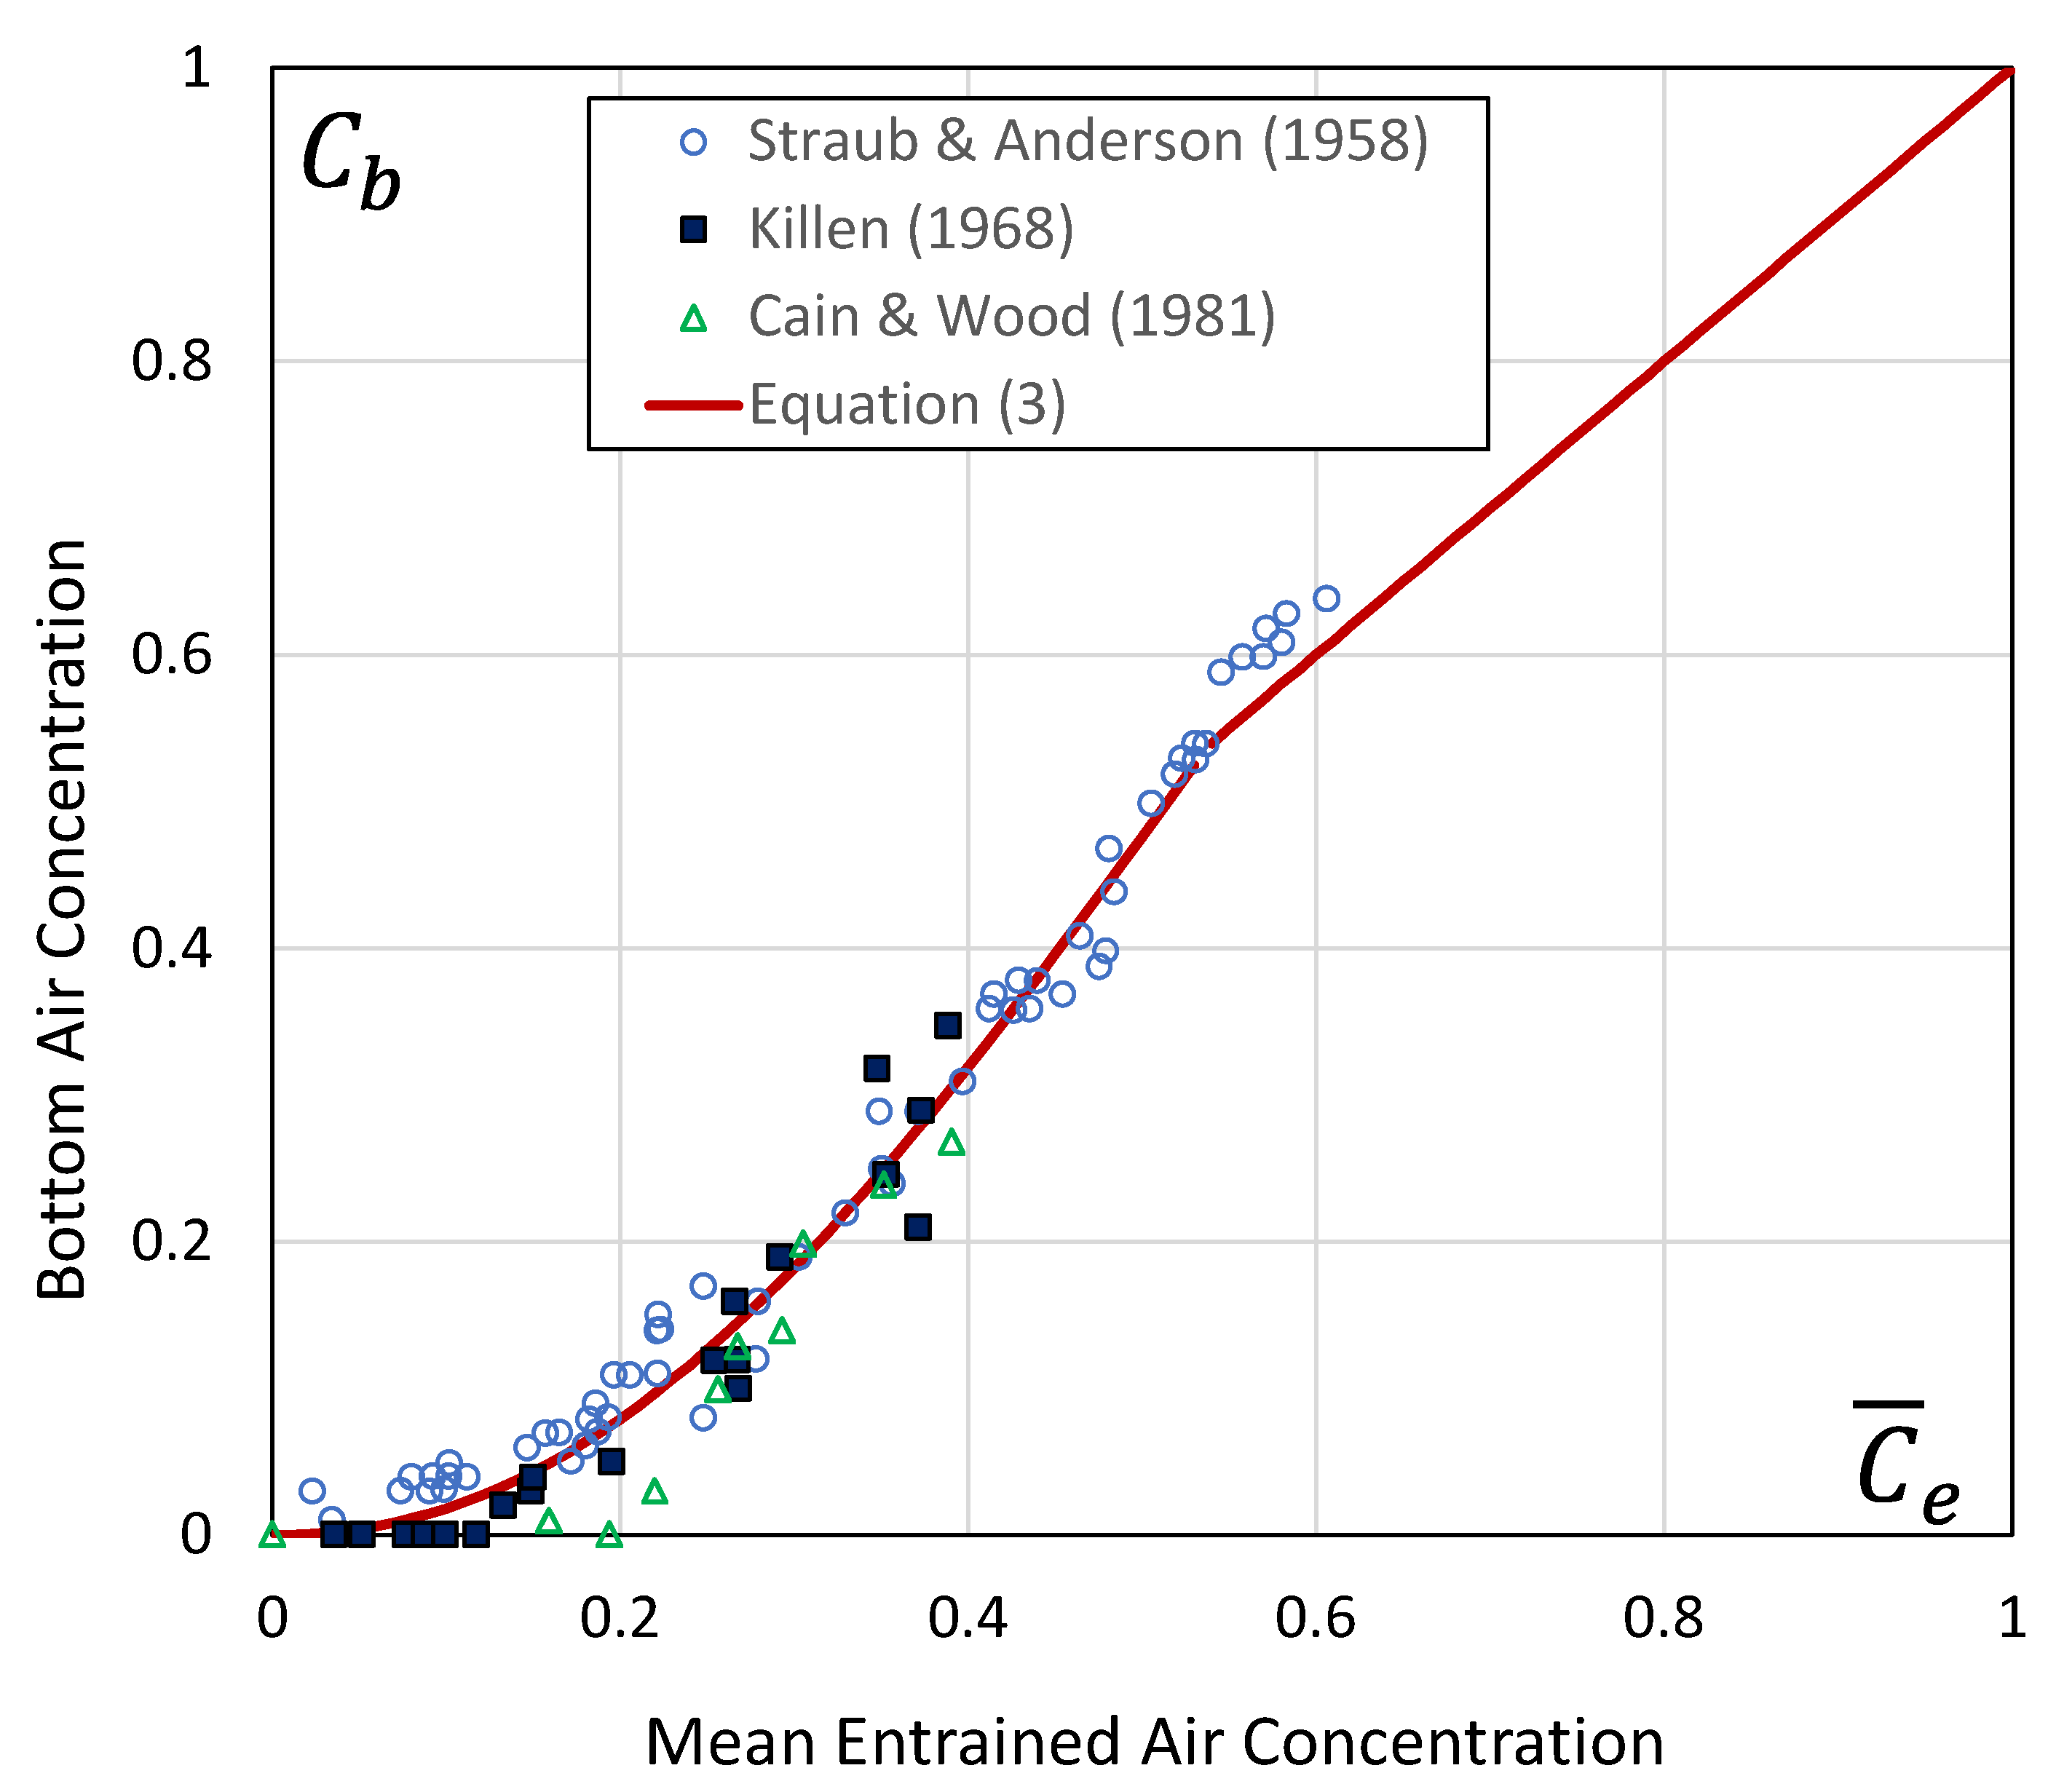
The presence of entrained air can protect spillway flow surfaces from cavitation damage. Early research [37] suggested that a mean air concentration from 3 to 8% can dramatically reduce material loss. Other studies have suggested that local concentrations near the flow boundary as low as 1% may be effective [38]. Advances in instrumentation have made it more feasible to measure air concentration very near the channel bottom and this has been a focus of recent research on smooth and stepped chute flows and associated aerators, e.g., [24,25,39,40,41]. SpillwayPro estimates the bottom air concentration, Cb, using an equation fit to the data shown in Figure 3 gathered within 5 mm of the channel floor [15] from laboratory and field studies [9,31,42],
3.5. Friction Factor
Wilhelms and Gulliver [14] separated total conveyed air into entrained and entrapped components. To quantify the total conveyed air and the entrapped portion, it is necessary to integrate the air concentration profile from the channel bed to the upper limit of conveyed water, but this limit is difficult to define precisely. Straub and Anderson [9] suggested integrating up to depths corresponding to set values of air concentration, e.g., 0.95 or 0.99. Wood [10,43] adopted 0.90 as the integration limit and many investigators have followed that lead. Wilhelms and Gulliver [14] considered integration limits of 0.90, 0.95, and 0.98, with the depths designated Y90, Y95, and Y98. For each integration limit, they found that the entrapped air concentration was constant downstream from the inception point, and there was less variability in the entrapped air concentrations as the integration limit was increased. Notably, the entrapped air concentrations for the 0.90 and 0.98 integration limits were 0.073 and 0.23, respectively. New work [11] on the mechanics of air inception suggests that the flow of an air superlayer above the water surface may have some influence on the amount of entrapped air, but SpillwayPro uses the constant values developed by Wilhelms and Gulliver [14].
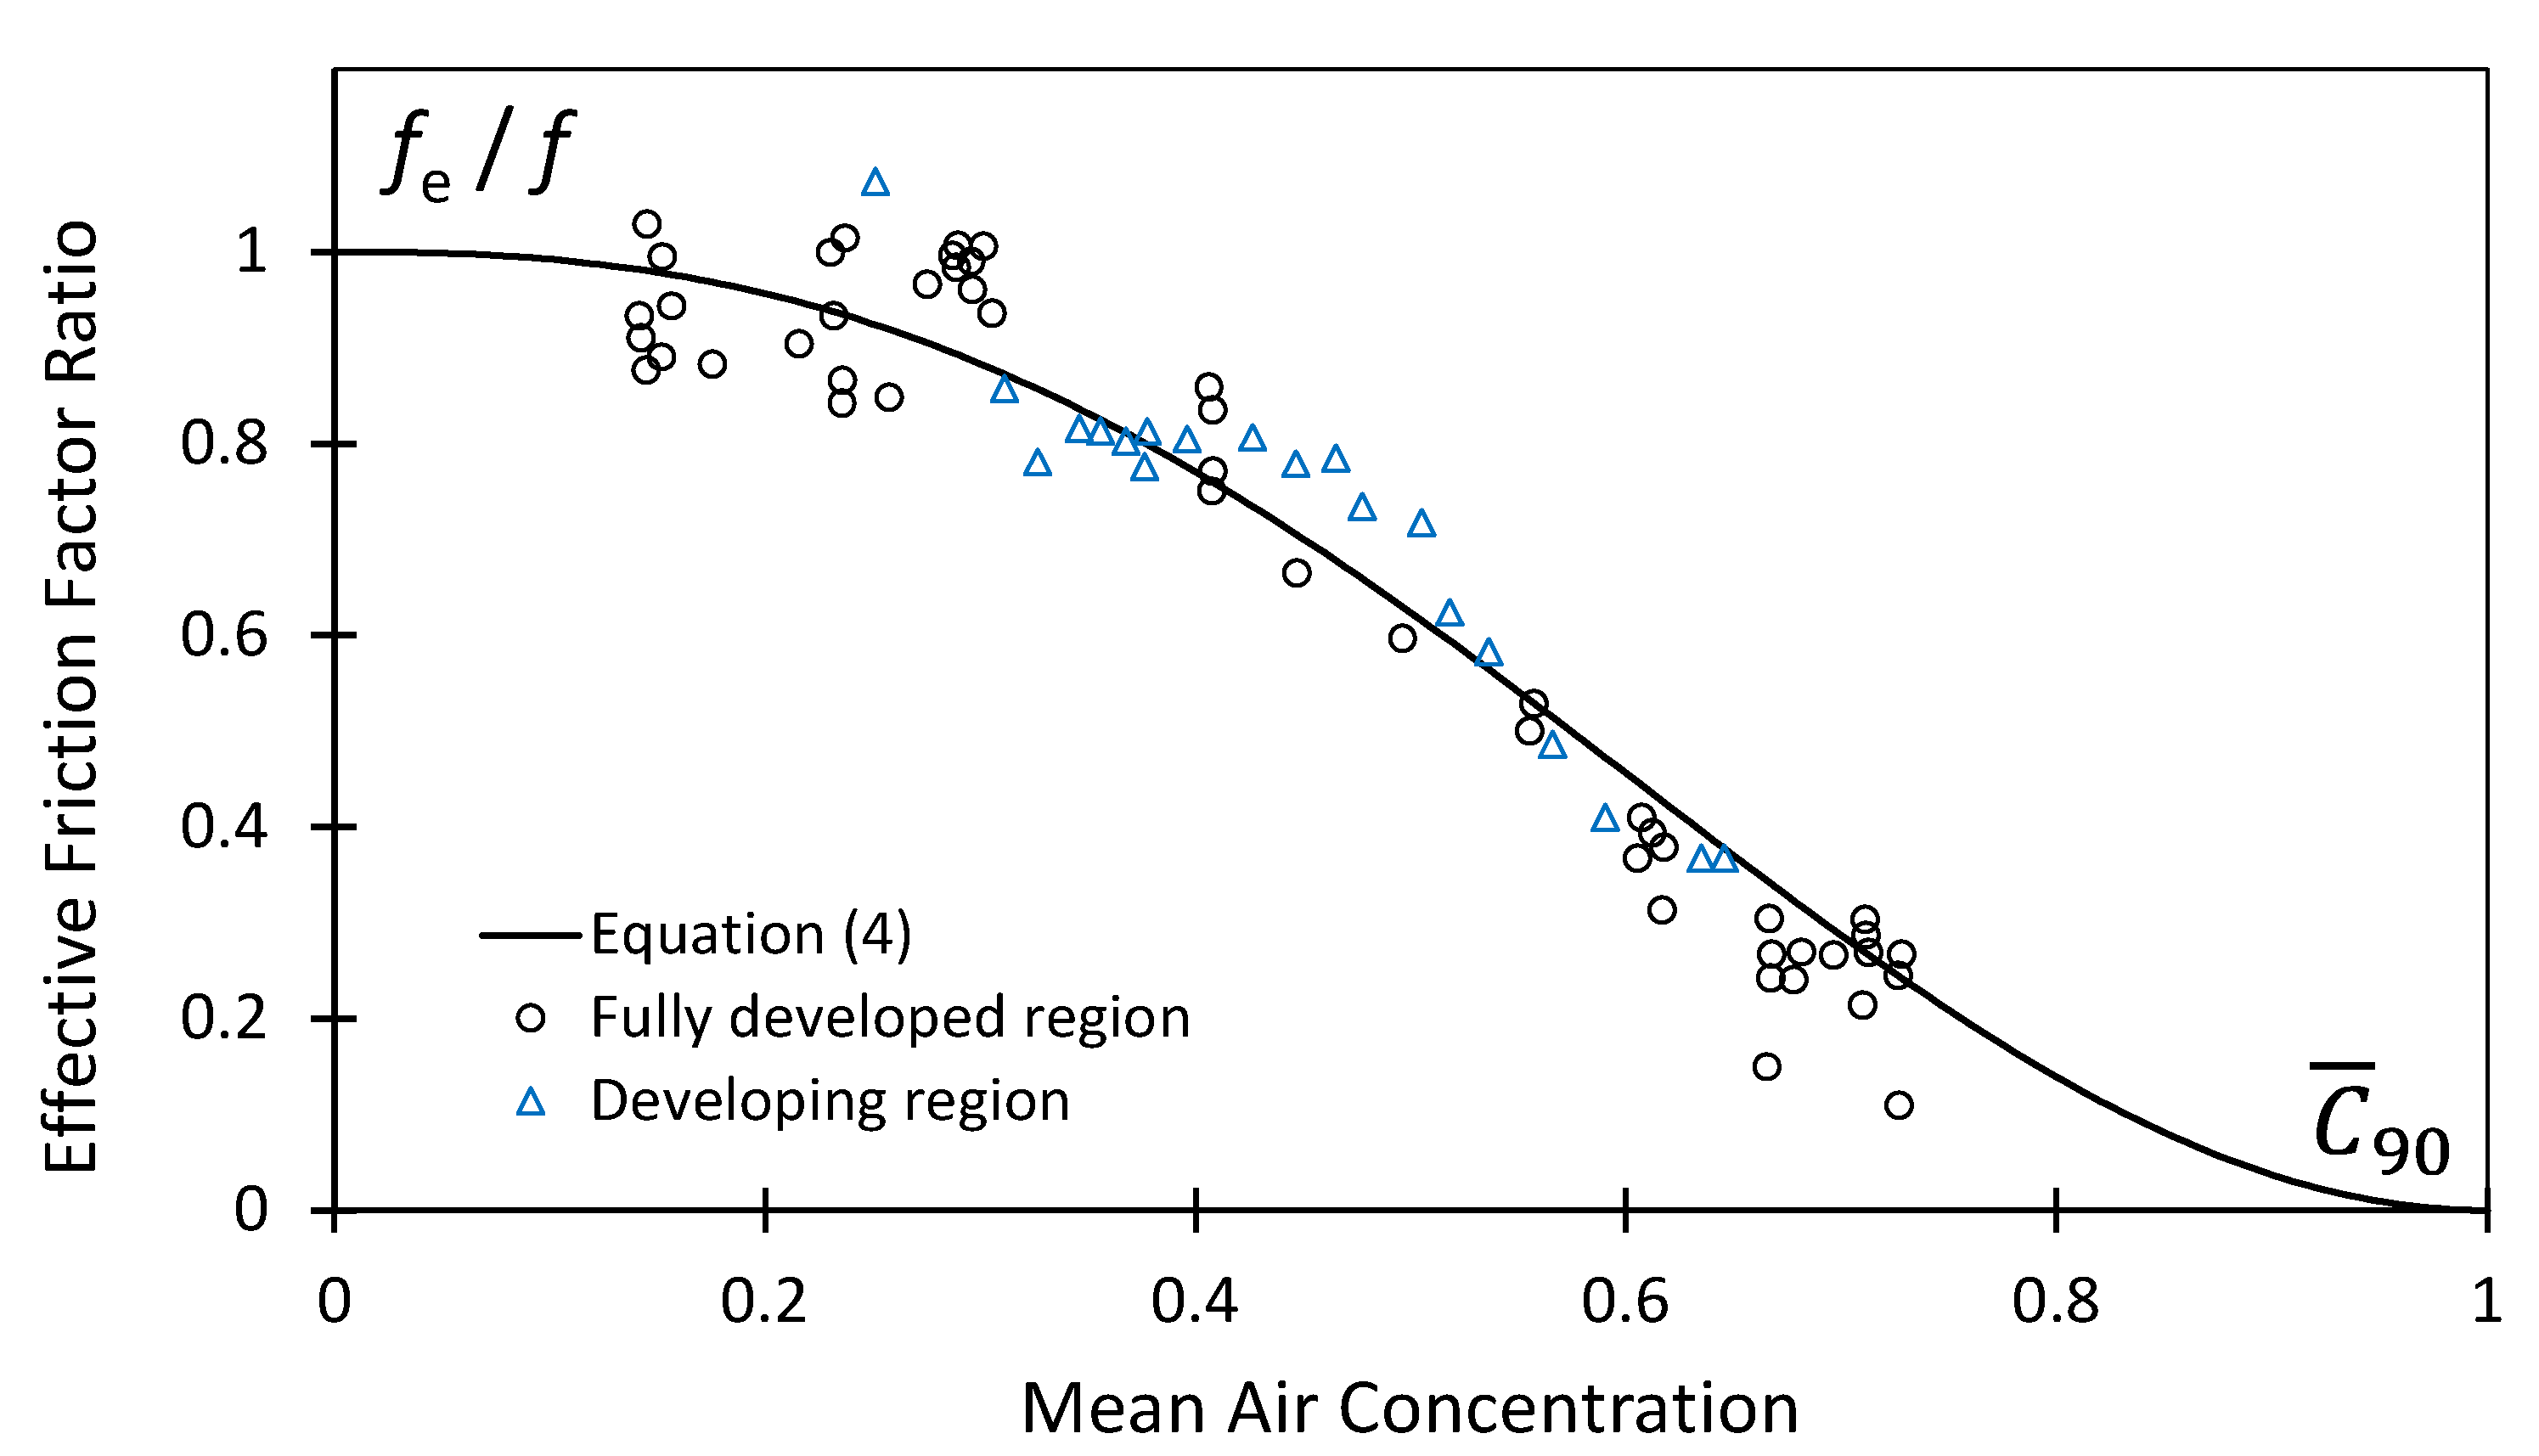
An aerated open channel flow has a lower density and less viscous energy dissipation than a non-aerated flow [9,10,30,43]. One of the newest approaches to determining friction factors of aerated chute flow is based on the bottom air concentration [13], but SpillwayPro takes a more established approach. The base friction factor, f, for non-aerated flow is determined using the Colebrook–White equation that relates f to the relative surface roughness and Reynolds number. To adjust for the effects of aeration, the ratio fe/f is determined, where fe is the effective aerated friction factor. Wilhelms and Gulliver [15] suggested a procedure based on a curve drawn [43] to fit data collected by Straub and Anderson (1958) [9], but their resulting equations produce negative values of the ratio for large air concentrations. Instead, SpillwayPro uses a different function fit to the same original data [43] (Figure 4),
3.6. Flow Bulking
Wilhelms and Gulliver [15] based predictions of flow bulking on the air concentration evaluated at the 0.98 integration limit, since it had the least variability and encompassed the largest portion of the flow among the conditions they analyzed. At this limit the entrapped air concentration is about 0.23. SpillwayPro reports the entrained air, , and the total air and uses the latter to calculate the bulked flow depth,
For comparison to past work, SpillwayPro also provides the traditional freeboard suggestions given by the Bureau of Reclamation’s Design of Small Dams [44], yf = 0.61 + 0.0371Vd1/3, where yf is the freeboard in meters and flow depth, d, and velocity, V, are expressed in m and m/s, respectively.
4. Stepped Chutes
The engineering issues of interest for stepped chutes are similar to those of smooth chutes, with a greater emphasis on energy dissipation, since sizing of the steps can have a significant effect. The inception point for aerated flow must still be identified and flow conditions in developing and fully developed aerated zones must be computed. Friction factors are dramatically higher than those of smooth slopes and primarily affected by chute slope, step size, and aeration. Primary objectives of analysis are to estimate bulked flow depths, evaluate energy dissipation, and assess cavitation potential, which can be severe until the flow develops adequate aeration. SpillwayPro relies primarily on two bodies of work for the analysis of stepped spillways: testing performed by the Agricultural Research Service (ARS) for application of RCC overlay protection systems to embankment dams ranging from 2:1 to 4:1 slope [19,20,21,22]; and several investigations of steeper stepped slopes [17,18,45]. The literature includes many studies, e.g., [46,47,48,49,50], of other step geometries, different step-height combinations, and slopes on the edge or outside of the typical range of embankment dams and concrete gravity dams.
4.1. Aeration Inception Point
Although the mechanism of aeration inception is still considered to be the intersection of the step-induced boundary layer with the free surface, most investigators have not focused on predicting the boundary layer thickness for stepped chutes. Instead, they have provided empirical relations for computing the flow distance along the spillway profile from the start of boundary layer growth to the inception point. Most relations have been primarily functions of the roughness Froude number, where g is the acceleration due to gravity, q is the discharge per unit width, and h∙cos(θ) represents the step height normal to the chute slope. Some investigators have used the vertical step height h as the length reference. The sin(θ) term is commonly included but may not be warranted [51].
4.1.1. Slopes of 2:1 or Less
For chutes with a slope of 2:1 or flatter, SpillwayPro determines the distance from the start of the chute to the inception point, Li, with empirical relations developed from testing performed at 4:1, 3:1, and 2:1 slopes [22]. A pair of equations are used for different ranges of F*:
It should be noted that these equations were developed from tests of chutes below freely overtopped dams, so the upstream boundary condition was approximately critical-depth flow entering the chute. The equations do not incorporate any direct influence of the flow depth—only the step height, unit discharge, and slope. They may not be appropriate for a situation in which flow at the start of the stepped portion of the chute is already supercritical, e.g., discharged from a sluice gate, or already accelerated by the distance traveled in a smooth chute. In such cases, an analysis of boundary layer growth like that used for smooth chutes may be needed, but there are presently few studies in the literature that directly quantify rates of boundary layer growth in stepped chutes. Two studies [27,52] developed nearly identical relations from testing over a very limited slope range (0.8:1 and 0.75:1), , where L is the streamwise flow path length measured from the start of boundary layer growth. A recent study on a 1:1 slope [53] also produced a similar relation, . These are not implemented at this time in SpillwayPro due to the narrow range of supporting data. Interested readers may also wish to consult past work [54,55,56] on relations between boundary layer growth and roughness height of relatively smooth (non-stepped) surfaces and new studies that attempt to combine data from both situations [28]. One study [57] has used physical and CFD modeling to explore the details of stepped chute boundary layers but does not provide a readily applicable modeling relation.
Stepped chutes constructed from roller compacted concrete (RCC) are commonly used as overlays to provide overtopping protection and extra spillway capacity for existing embankment dams. A typical construction practice is to finish the steps with a 1:1 (45°) bevel rather than a vertical face, for ease of construction and enhanced durability. Although the bevel reduces the effective roughness height to ks = [(z − 1)/z](h∙cos θ), where z is the inverse of the chute slope (i.e., z:1), recent testing [58] has shown that the inception point moves upstream compared to a vertical step face, in real terms for the same step height and in dimensionless terms for comparable values of F* and the effective roughness height. The cause is believed to be an unstable undular flow condition enabled by the attachment of the flow to the beveled step faces. To compensate, an additional multiplier, Cf = 0.76, is included in Equation (6) for application to beveled-face steps. The testing demonstrating this behavior has been limited to date to F* ≤ 35. Since it is expected that the undular flow condition will be a gradually smaller factor at increasingly large values of F*, for values of F* > 28, SpillwayPro continues to use Equation (6) with the additional Cf term, but the inception length is limited to the lesser of the modified Equation (6) or the unmodified Equation (7).
4.1.2. Slopes Steeper Than 2:1
For chutes steeper than 2:1, SpillwayPro uses the inception length relation [17]:
For chutes steeper than 2:1, SpillwayPro computes the depth-averaged air concentration at the inception point, , using [17] . represents the total entrained and entrapped air (not computed separately for stepped chutes) integrated up to the depth at which the air concentration is 0.90. This is used later in the calculation of air concentrations in the developing zone downstream from the inception point.
4.1.3. Mixture Flow Depth at Inception
Another key parameter at the inception point is the air–water mixture flow depth, which is used later to calculate the air concentration at the channel bottom. For 2:1 and flatter slopes, the clear-water flow depth, ycw, and inception point air concentration are calculated using [22]:
4.1.4. Complex Cases
A specific objective in the development of SpillwayPro was to enable analysis of cases differing from the idealized cases considered in laboratory studies. One such situation is a chute with a combination of smooth and stepped floors, with steps typically provided at a point of slope increase. In this situation, there is the possibility that aerated flow may begin on the smooth slope. If so, SpillwayPro reports air concentrations computed as though there is a smooth floor up to the location at which inception of stepped-chute aeration inception is computed. Beyond that point, aeration of the flow is determined by stepped-chute relationships.
If the smooth chute does not create aeration inception before the start of the stepped floor but would still reach inception before the computed inception point of the stepped chute (applying Equation (6), (7), or (8) and measuring Li from the location of the first step), then the air concentration due to smooth chute aeration will again control until the stepped-chute aeration exceeds it.
4.2. Fully Developed Aerated Flow
The basis for computation of air concentration in the developing zone is the air concentration in the fully developed uniform aerated flow, , which is evaluated in most of the stepped spillway research by integrating the air concentration profile up to the depth at which the air concentration is 0.9. Tests conducted at 2:1, 3:1, and 4:1 slopes provide Equation (11) used for slopes of 2:1 or flatter [22], and Equation (12) [45] for steeper slopes has good continuity with the relations for flatter slopes.
Computations proceed in the downstream direction and, if there is a slope change at some point, the fully developed air concentration values are updated for the new slope. If a flattening of the slope occurs, the air concentration at the present station may be larger than the newly computed value of . If so, deaeration is computed as described previously for smooth chutes until the concentration drops back to the new value.
It should be noted that the research on aerated flow in stepped chutes has not made a distinction between entrained and entrapped air, but has considered only the total conveyed air. For smooth chutes, the separate entrained air quantity is used for estimating the bottom air concentration relevant to mitigation of cavitation damage, and entrained air is also of interest in gas transfer applications [15]. For stepped chutes, empirical relations for these applications have been developed as a function of total air or other parameters, such as flow distance beyond the inception point.
4.3. Developing Zone of Aerated Flow
Air concentrations in the developing zone for 2:1 and flatter slopes are computed from the inception point L/Li = 1.0 up to L/Li = 2.0 using a relation [22] based on and the relative distance beyond the inception point. Air concentration is reduced 11% from at the inception point and increases linearly up to at L/Li = 2.0, with air concentration equal to beyond that point.
For steeper slopes, the depth-averaged mean air concentration in the developing zone is computed between and using [17]:
4.4. Friction Factor
SpillwayPro calculates standard step water surface profiles of the clear-water depth using the energy equation, avoiding the assumptions implicit in the empirical relations developed from limited experimental studies. For this purpose, the Darcy friction factor, f, or another suitable resistance factor is needed. Many experimental works have reported energy content and energy dissipation as a function of vertical distance below a dam crest but have not provided direct expressions for f. SpillwayPro estimates friction factors for the stepped bottom portion of the chute and then determines a wetted perimeter-weighted average friction factor for the complete cross section, assuming hydraulically smooth side walls.
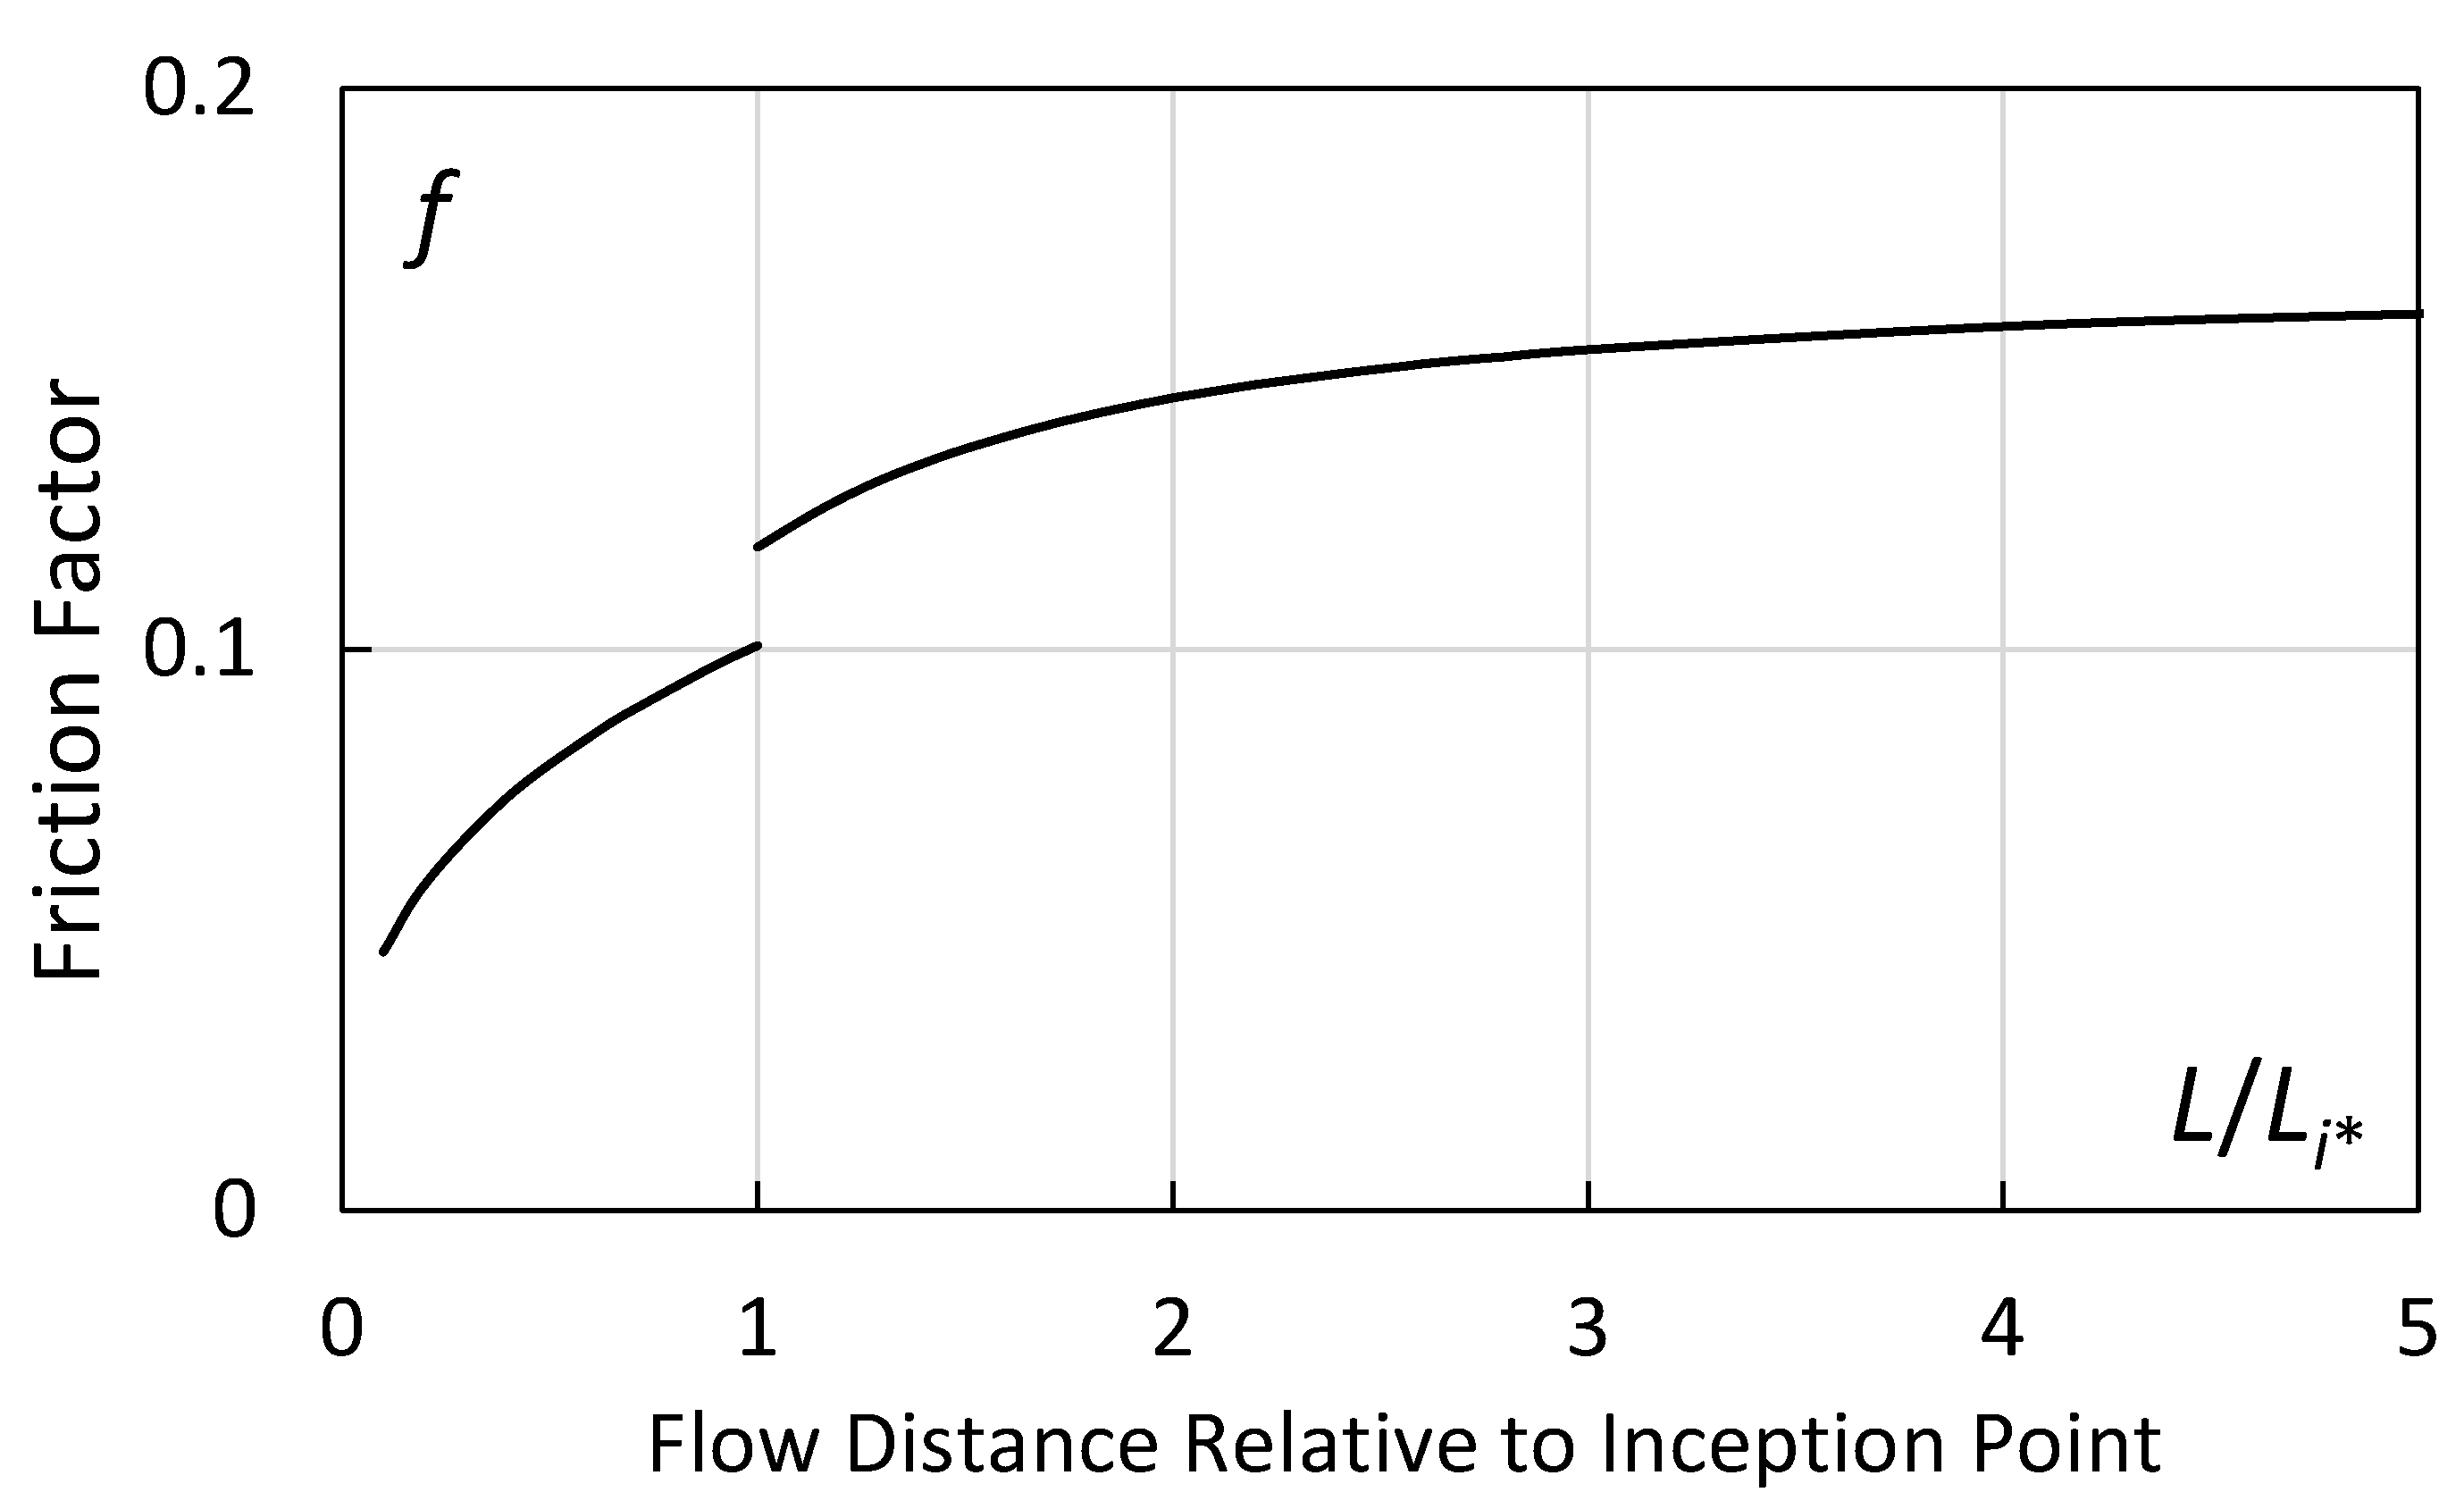
For chutes with slopes of 2:1 or flatter, SpillwayPro relies on energy loss data collected at locations upstream and downstream from the inception point [19,20,60]. On a 4:1 slope [19], the relative energy loss upstream from the inception point, ΔH, could be estimated as ΔH/Ho = 0.3(L/Li*), where Li* was the inception point predicted by [16] (the refined relations for computing the inception point, Equations (6) and (7), had not yet been developed), and Ho is the available head from the upstream reservoir to the point of interest in the chute. Similar energy losses were observed on a 2:1 slope [60]. Downstream from the inception point [20], the relative energy loss was ΔH/Ho = 1 − (L/Li* + 0.51)−0.87. Considering that the overtopping energy head is small compared to the total elevation drop, the friction factor can be estimated as f = 8(ycw/yc)3(dH/dL). The derivative, dH/dL, can be determined from the relative energy loss relations, and ycw/yc can be estimated from empirical relations [22]. A resulting typical relation between f and L/Li* is shown in Figure 5. The friction factor is low at the start of the chute where the boundary layer induced by the steps is beginning to develop and affects just a fraction of the flow, and asymptotically approaches an equilibrium value downstream from the inception point. In SpillwayPro, this approach is adopted with Li* replaced by Li from Equation (6) or (7), modified if necessary for beveled step faces. There is little variation downstream from L/Li* = 1.0, and in fact the observation in [22] that clear-water depth is nearly constant in this zone indicates that the friction factor should also be approximately constant.
For slopes steeper than 2:1, tests at a 53° slope [52] showed a similar energy loss relation upstream from the inception point, with about 5% more energy loss than on the flatter slopes. Thus, a similar approach as outlined above is used to estimate the friction factors in the non-aerated zone. Downstream from the inception point, SpillwayPro uses a relation developed by Takahashi and Ohtsu to compute f directly,
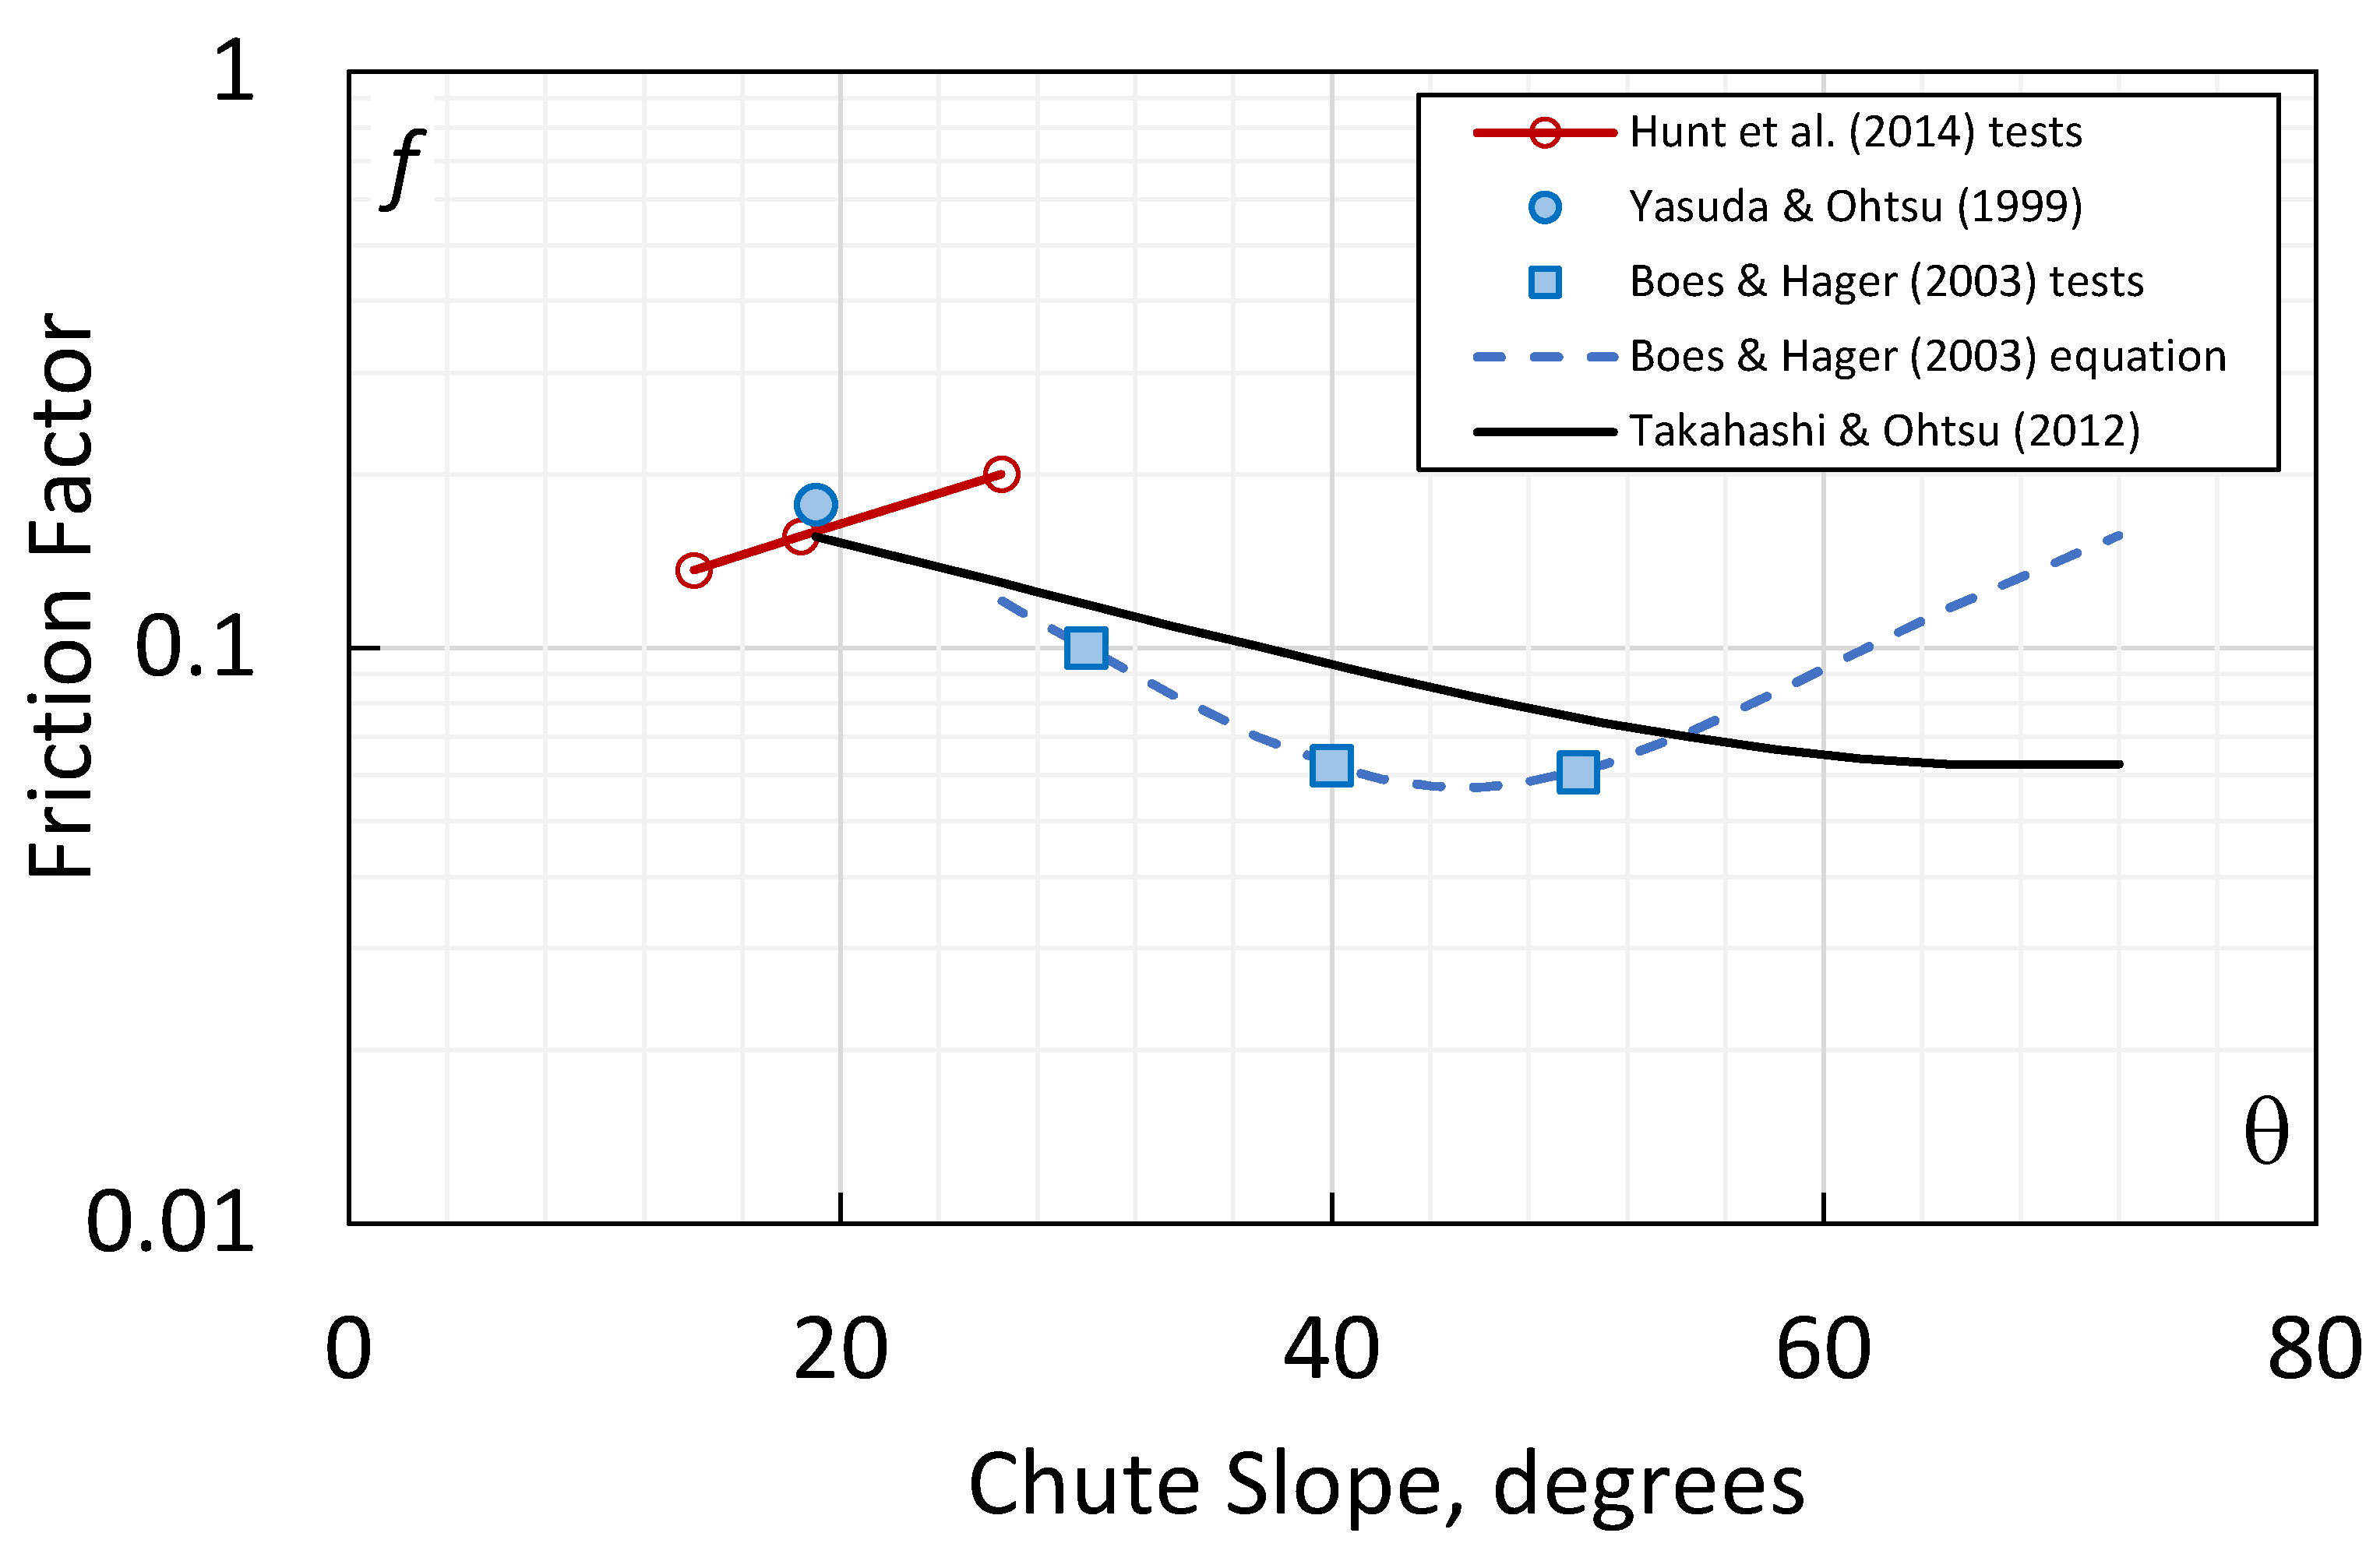
Before selecting Equation (15), several relations were considered and compared in the uniformly aerated zone, and a discussion provides insight about uncertainties in friction factor estimation. Figure 6 compares values for flatter slopes determined from the methods described above and those determined for steeper slopes by Equation (15) [45], and Boes and Hager’s relation [18] for slopes steeper than 2:1, f = [0.5–0.42∙sin(2θ)]∙(ks/Dh,w)0.2, where ks = h∙cos(θ) and Dh,w = 4Rh is the hydraulic diameter, with Rh being the hydraulic radius computed as the flow area divided by the wetted perimeter. The latter relation was also developed to fit data collected by Yasuda and Ohtsu on a 19° slope [63]. The first term involving sin(2θ) represents the influence of the spacing of step tips relative to the flow depth, which is minimum for a 1:1 slope, and the second term represents the effect of relative roughness. It suggests that for equal relative roughness f will be minimum for a 45° slope and equal values will exist for complementary slopes on either side of 45°, e.g., 40° and 50°, 30° and 60°, etc. However, hydraulic gradients measured in closed-conduit tests [23] show that for equal values of ks/Dh,w the values of f for a 68° slope are about 1.75–2.1 times larger than those of a 22° slope. This is intuitively sensible since steep slopes cause the steps to present an offset into the flow, but flat slopes create offsets away from the flow. These are fundamentally different roughness types that can cause different degrees of form drag. Two other factors that should be expected to exert an influence on friction factors for steeper slopes are the tendency toward reduced flow depth and thus increased relative roughness, and greater aeration. The latter effect is probably dominant, since Equation (15) [45], used in SpillwayPro, trends continuously down for the full practical range of increasing slopes.
It is notable in Figure 6 that all relations predict friction factors in the range of about 0.15 to 0.20 for slopes around 3:1 (approx. 20°), but the relation for flatter slopes exhibits a trend vs. slope that is contrary to that of the two relations for steeper slopes. It is possible that these different trends are caused by a diminishing importance of aerated flow for flatter slopes, although aeration is still significant. Better estimation of the friction factor is still a significant research need for the analysis of stepped chute flows. Determination of friction factors for stepped chutes on all slopes is a complex problem because there are several important factors: relative roughness (step height and flow depth), channel slope (which affects the angle of the roughness elements to the flow and the relative spacing of roughness elements), and aeration, which becomes more influential at steeper slopes. There is still a need for studies that can isolate the separate influences of these factors. An example of active research on this topic is an alternate approach recently proposed [13] for estimating friction factors in aerated chute flows (both smooth and stepped) as a function of only the bottom air concentration and relative roughness.
4.5. Energy Coefficient
SpillwayPro includes an energy (Coriolis) coefficient α to account for nonuniform velocity profiles. For flatter slopes, equations provided by [22] for locations upstream and downstream from the inception point are used, with α ranging from about 1.01 to 1.17, depending on the relative step height and chute slope. For slopes steeper than 2:1, a relation developed [52] from tests on a 53° slope (0.75:1) is used in the non-aerated zone, α = 1 + 0.19(L/Li) up to L/Li = 1; beyond the aeration inception point, a constant value of α = 1.1 is used [18]. There is experimental evidence [45] that α in the uniformly aerated zone is dependent on slope and relative step height and may be as large as about 1.16 for a 55° slope (0.70:1) and small relative step height.
4.6. Bulked Flow Depth (Mixture Depth)
For stepped chutes, SpillwayPro provides the depth of the flow mixture evaluated at the level where air concentration is 0.90. For determining the height of training walls, a factor of safety to be applied to this depth can be provided on the input data tab and this will be multiplied by the mixture depth to compute the elevation of training walls at each station.
4.7. Cavitation Potential
Downstream from the inception point, there is little risk of cavitation damage on stepped chutes, since air concentrations typically build quickly, and air rapidly becomes present near the boundary. However, in the nonaerated flow upstream from the inception point, there can be a significant cavitation risk that may require the provision of aerators. SpillwayPro estimates the risk by providing the cavitation index of the flow and the corresponding incipient cavitation index value, σc, using the relation [23] σc = 4f. This relation is based on data from several investigations of different types of roughness elements, including water tunnel tests of a stepped chute floor conducted in a reduced atmospheric pressure condition that allowed incipient cavitation to be observed. For this purpose, SpillwayPro conservatively uses the bottom friction factor estimated for fully developed flow, not the perimeter-weighted average factor of the whole section or the reduced friction factor estimated for partially developed flow upstream from the inception point.
Downstream from the inception point, bottom air concentration is again of interest in stepped chutes for evaluating the distance downstream at which self-aeration can mitigate against cavitation damage. The relation
5. Energy Dissipation and Stilling Basin Calculations
SpillwayPro provides calculated specific energy values at each station, which can be readily compared to the smooth-chute values to see the energy dissipation benefits of adding steps to a chute design. A practical benefit of reduced specific energy at the bottom of the chute is a reduction of the tailwater depth needed to force a hydraulic jump to occur, and a reduction of stilling basin length. To provide an indication of the magnitude of these benefits, SpillwayPro determines the clear-water depth at the last station of the profile and uses it to calculate the conjugate depth using the familiar Bélanger equation [64] for a rectangular section,
With Y2 determined, SpillwayPro also estimates the length of four types of possible stilling basins that might be used at the bottom of a spillway chute. This is accomplished using equations fit to the curves of Lbasin/Y2 for USBR Type I, II, III [64], and Low-Froude Number [65] stilling basins. (Note that the Low-Froude Number basin referred to here is an updated and much more compact design than the Type IV basin described in [64] for a similar range of Froude numbers). Results are displayed in spreadsheet cells at the top of the smooth- and stepped-chute hydraulic results pages, and the cell colors are highlighted in green when F1 is within the suggested range for each stilling basin, or red when the flow condition is outside of the recommended range. There is an inherent assumption that the required basin length can be estimated based on the equivalent clear water depth and Froude number, independent of the type of chute (smooth or stepped). Recent experiments on Type I basins [66] have shown that the normalized hydraulic jump length is significantly extended when flow is delivered to the basin from a stepped chute. However, testing of Type III and Type IV basins [67,68] has shown adequate performance below stepped chutes without extending the basin beyond the design length recommended for smooth chute applications. In addition, the incorporation of a supercavitating baffle block in the Type III basin provides resilience against low tailwater conditions [67].
6. Example Applications
6.1. RCC Embankment Dam Overlay with 3:1 Slope
To test the SpillwayPro algorithms for an embankment dam overlay application, an arbitrary example was calculated and compared to empirical equations for a 12.4 m high embankment with 3:1 slope, a width of 100 m and discharge of 223 m3/s. The overlay is constructed with steps that are 0.5 m high with vertical faces. The spillway channel width is constant down the full height of the dam. SpillwayPro can consider width variations down the chute if the structure plan is arched so that the gradient of the spillway slope is aligned with the training walls. However, SpillwayPro does not analyze the concentrated flow that will occur in the groin areas if the abutments meet the chute on an alignment that does not parallel the gradient of the slope. For these situations, studies of significantly convergent chutes should be consulted [69,70].
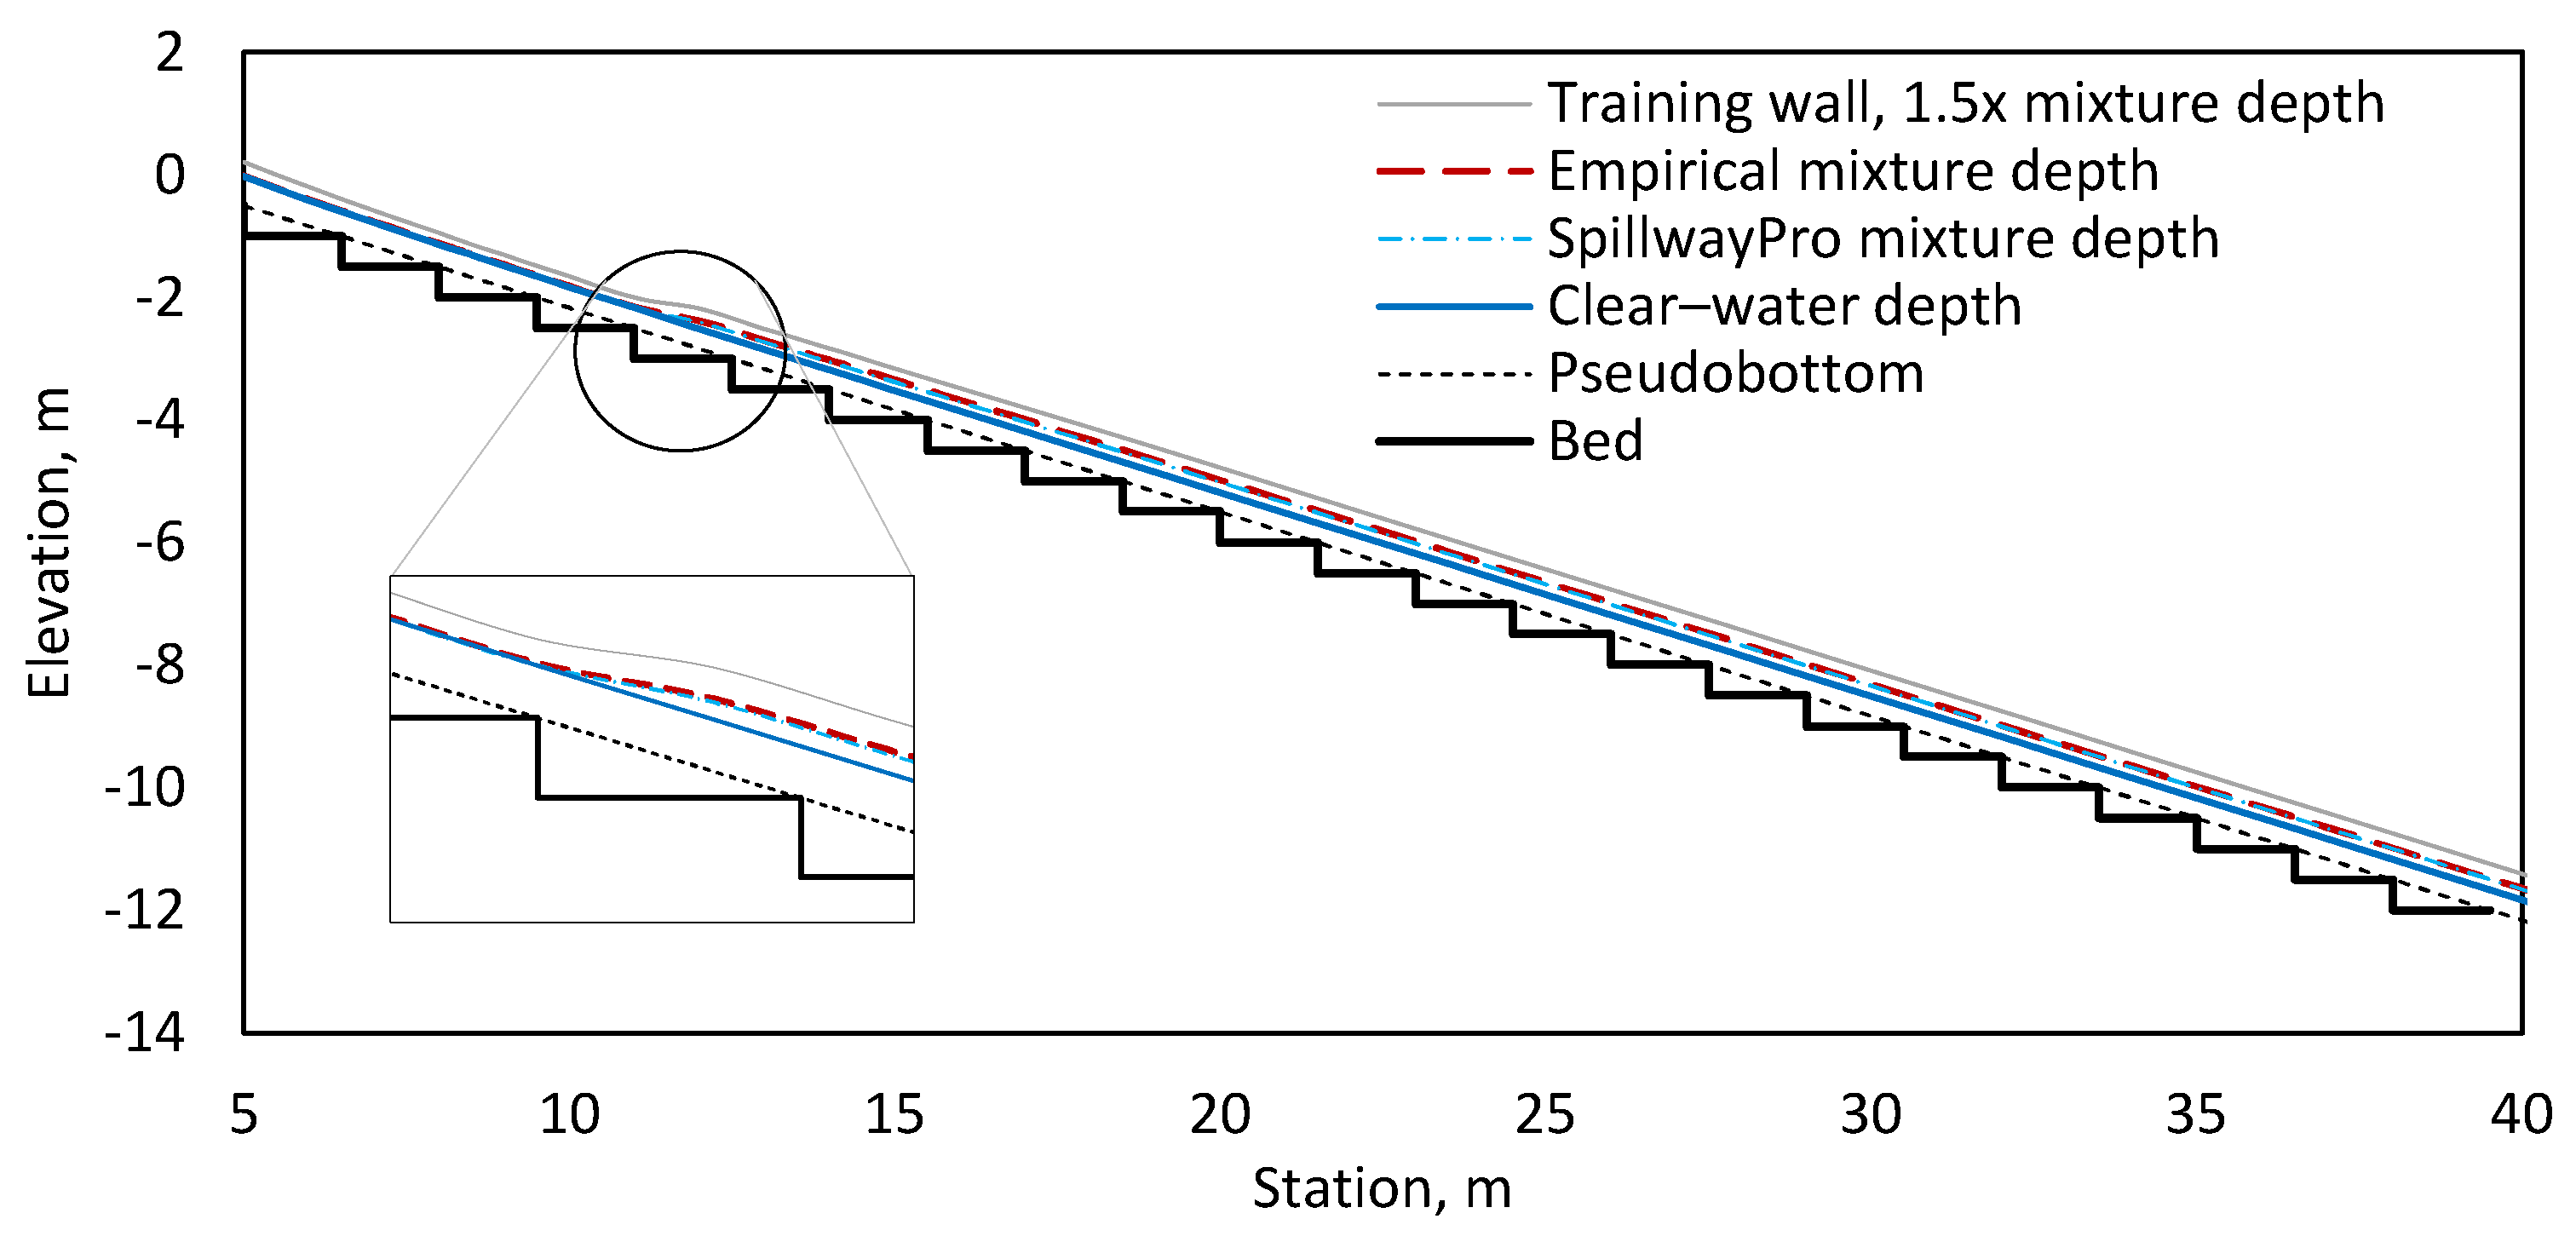
For this example, F* = 3.88 and the inception point for aeration is determined empirically in SpillwayPro by Equation (6), which yields an inception length of 8.22 m. For comparison, the predicted inception point for a smooth overlay is about 19.1 m down the slope. Clear-water flow depths upstream from the inception point are about 3–5% lower than predictions by empirical equations [22]. Downstream from the inception point, clear-water depths and flow mixture depths are up to 8% low in the developing zone but return to within 3% of empirical predictions at the toe of the slope. Air concentrations are predicted by SpillwayPro using empirical equations, so there are no differences. Residual energy at the bottom of the stepped chute is about 22% of the total head; a smooth chute would have about three times as much residual energy. Stilling basin length requirements are reduced by about one third from those of a smooth chute. There is no risk for cavitation at any location along the chute. Figure 7 shows typical stepped chute output.
6.2. Concrete Gravity Dam Example
The gravity dam example presented in [18] was calculated using SpillwayPro. Details of this example are dam height = 60 m; chute width = 40 m; slope = 1.25 (1V:0.8H) or 51.3°; Q = 800 m3/s; and step height = 1.2 m. Nappe flow will occur up to about Q = 104 m3/s, and skimming flow for all larger flows.
Predicted clear-water flow depths and mixture flow depths at the bottom of the chute are 0.82 m and 1.75 m, respectively, compared with 0.83 m and 1.74 m for empirical equations [18] for the fully developed uniformly aerated condition. The air concentration predictions made by SpillwayPro using Equation (12) [45] are about 2 to 4% lower than the empirical estimates made in [18] ( = 0.53 vs. = 0.57 at the bottom of the chute). The specific energy computed at the bottom of the chute is about 34 m, compared to 28.6 m estimated in [18]. The most significant reason for the difference is probably the friction factor uncertainty discussed earlier.
6.3. Aviemore Dam Case Study
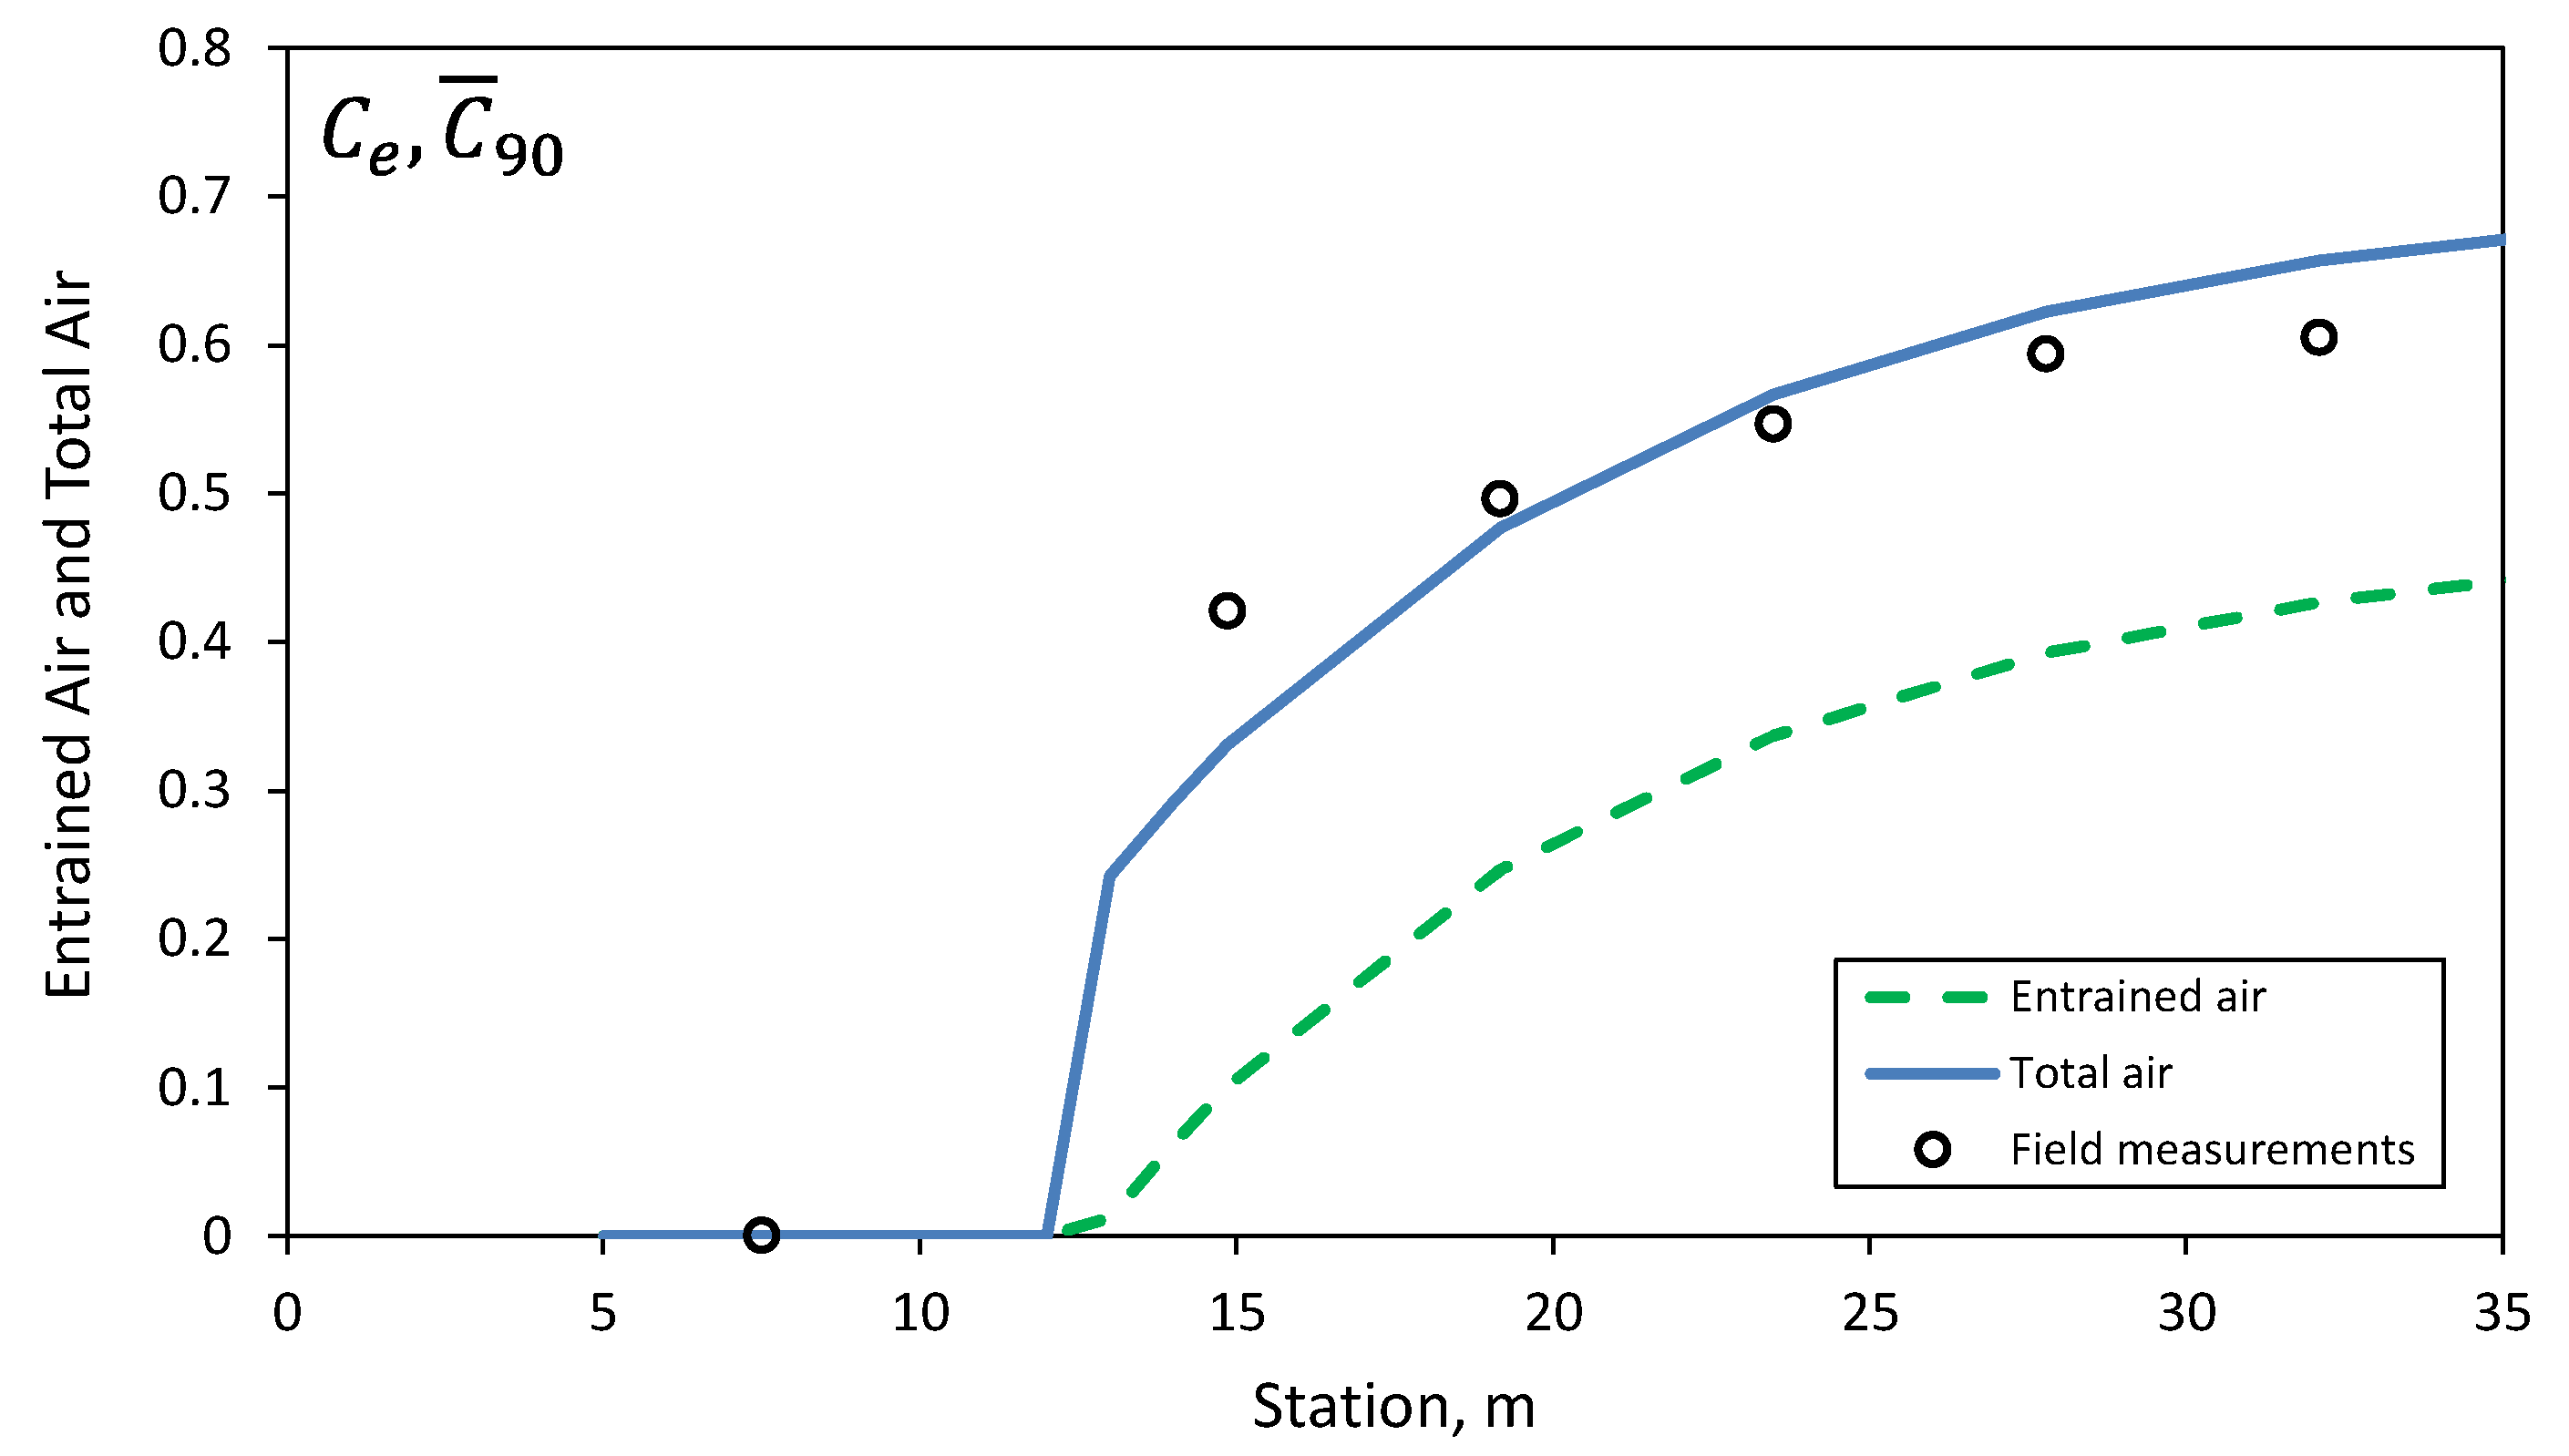
Cain and Wood [42] made measurements of aerated flow properties on the prototype spillway of Aviemore Dam, New Zealand. The smooth chute has a 1:1 slope downstream from a radial gate-controlled ogee crest. Measurements were made for two discharge settings at five stations on 6.1 m intervals between the inception point and the tailwater pool. Exact discharges could not be maintained for every measurement, so results were presented after being normalized to a single unit discharge, 2.23 m2/s at a 300 mm gate opening.
The observed inception point was only 7.5 m downstream from the gate. Several empirical methods employed in [42] predicted significantly greater lengths to the inception point, in the range of 10 to 15 m; SpillwayPro’s boundary layer growth model predicts 12.9 m. The thin flow depth makes the prediction of the boundary layer–water surface intercept point very sensitive to the boundary conditions, i.e., the starting point for boundary layer growth and the presence of any pre-existing turbulence in the flow. Despite the significant differences in the inception point prediction, the modeled values of mean air concentration match reasonably downstream from the inception point. The measured prototype air concentrations increased from 0.42 to 0.61 over the five stations, while SpillwayPro predicts 0.33 at the first station, increasing to 0.66 (Figure 8).
7. Discussion and Conclusions
SpillwayPro has been developed over several decades to meet the needs of spillway design professionals for modeling of basic hydraulic performance, aerated flow effects, and cavitation analysis. The program relies on fundamental energy and momentum equations supplemented by empirical relations developed from laboratory and prototype measurements. This gives it the flexibility to model a wide variety of situations with computations that can be completed much more rapidly than CFD simulations. This also provides the ability to analyze cases that differ from standard situations addressed by purely empirical methods. This capability should be exercised with caution so that empirical relationships are not applied outside of appropriate ranges; a prime objective of this article has been to explain the basis and inner workings of SpillwayPro to promote a healthy understanding of its capabilities and limitations. Most of the calculations are based on laboratory-scale experiments conducted at slopes ranging from about 14° (4H:1V) to 55° (0.7H:1V), supported by some full-scale field measurements.
Recent improvements to the aerated flow features provide good agreement with empirical models and case study observations. The new ability to perform parallel computation of flow profiles for smooth and stepped chutes allows designers to readily evaluate the potential benefits of stepped chutes for energy dissipation and enhanced aeration.
Author Contributions
Conceptualization, T.L.W. and H.T.F.; methodology, T.L.W. and H.T.F.; software, T.L.W. and H.T.F.; validation, T.L.W. and H.T.F.; formal analysis, T.L.W.; investigation, T.L.W. and H.T.F.; resources, T.L.W.; data curation, T.L.W.; writing—original draft preparation, T.L.W.; writing—review and editing, T.L.W. and H.T.F.; visualization, T.L.W. All authors have read and agreed to the published version of the manuscript.
Funding
This research was funded by Congressional Appropriations to the U.S. Department of the Interior, Bureau of Reclamation.
Data Availability Statement
Some of the data that support the findings of this study are available from the corresponding author upon reasonable request.
Conflicts of Interest
The authors declare no conflict of interest.
Notation
| C | air concentration = volume of air divided by volume of air and water. |
| Cb | air concentration at channel bottom. |
| mean entrained air concentration for smooth chute in developing zone. | |
| mean entrained air concentration for fully developed smooth chute. | |
| Cf | correction factor for effect of beveled-face steps on inception length, Li. |
| mean air concentration at inception point, integrated to the depth where C = 0.90. | |
| mean air concentration in the uniform, fully developed, aerated zone, integrated to the depth where C = 0.90. | |
| mean total air concentration (entrained + entrapped) integrated from the channel bed to the depth where C = 0.90. | |
| mean air concentration at vertical distance Zi below the inception point. | |
| mean total air concentration integrated from the channel bed to the depth where C = 0.98. | |
| d | clear-water flow depth in freeboard equation. |
| dH/dL | instantaneous energy slope along a chute. |
| Dh,w | hydraulic diameter of clear-water flow, Dh,w = 4Rh. |
| e | base of natural logarithms, approx. 2.7183. |
| f | Darcy–Weisbach friction factor. |
| fe | effective friction factor considering effects of aeration. |
| F1 | . |
| F* | . |
| F*h | ; |
| g | acceleration due to gravity. |
| h | vertical step height. |
| Ho | dam height, or vertical drop from upstream reservoir to a point along a chute; |
| ks | effective roughness height normal to chute slope, h∙cos(θ), for a vertically faced step or [(z − 1)/z]h∙cos(θ) for a beveled-face step, or equivalent sand-grain roughness of a smooth (non-stepped) chute. |
| L | streamwise flow distance from the start of boundary layer development. |
| Lbasin | recommended stilling basin length. |
| Li | distance along chute from start of boundary layer to aeration inception point. |
| q | discharge per unit width. |
| Q | total discharge. |
| Rh | hydraulic radius = area/wetted perimeter. |
| V | flow velocity. |
| x | distance traveled along the flow surface from boundary layer initiation. |
| X* | flow distance past the inception point, smooth chute. |
| yc | critical depth. |
| ycw | clear-water flow depth, stepped chute. |
| yf | suggested freeboard. |
| ym,i | flow depth of air-water mixture at inception point; |
| y90u | flow depth of air-water mixture at which air concentration is 0.90 in uniform flow. |
| Ycw | clear-water flow depth, smooth chute. |
| Yi | flow depth at inception point, smooth chute. |
| Y1 | clear-water flow depth entering stilling basin. |
| Y2 | conjugate depth downstream from stilling basin to force hydraulic jump. |
| Y90, Y95, Y98 | flow depths at which air concentration is 0.90, 0.95, and 0.98. |
| z | inverse of chute slope, or horizontal run per unit of vertical distance, z:1 (H:V). |
| Zi | vertical elevation difference from inception point. |
| α | energy coefficient or Coriolis coefficient applied to velocity head. |
| δ | boundary layer thickness. |
| ΔH | head loss from upstream reservoir. |
| ΔX | distance between stations in deaeration function. |
| θ | chute slope, degrees. |
| π | approx. 3.1416. |
| σc | incipient cavitation index. |
References
- Brunner, G.W. HEC-RAS River Analysis System User’s Manual Version 6.0; U.S. Army Corps of Engineers, Hydrologic Engineering Center: Davis, CA, USA, 2021.
- Shearman, J.O. User’s Manual for WSPRO—A Computer Model for Water Surface Profile Computation; Federal Highway Administration Report FHWA-IP-89-027; Federal Highway Administration: McLean, VA, USA, 1990; 177p.
- Wahl, T.L.; Frizell, K.W.; Falvey, H.T. SpillwayPro—Tools for Analysis of Spillway Cavitation and Design of Chute Aerators; Hydraulic Laboratory Report HL-2019-03; Bureau of Reclamation: Denver, CO, USA, 2019.
- Falvey, H.T. Air-Water Flow in Hydraulic Structures; Engrg. Monograph 41; Bureau of Reclamation: Denver, CO, USA, 1980.
- Falvey, H.T. Cavitation in Chutes and Spillways; Engrg. Monograph 42; Bureau of Reclamation: Denver, CO, USA, 1990.
- Wahl, T.L.; Falvey, H.T. SpillwayPro Software; Bureau of Reclamation, Technical Service Center: Denver, CO, USA, 2022. Available online: https://www.usbr.gov/tsc/techreferences/computersoftware/software/EM42/ (accessed on 8 March 2022).
- Falvey, H.T. Mean air concentration of self-aerated flows. J. Hydraul. Div. 1979, 105, 91–96. [Google Scholar] [CrossRef]
- Lane, E.W. Entrainment of air in swiftly flowing water. Civ. Engrg. 1939, 9, 89–91. [Google Scholar]
- Straub, L.G.; Anderson, A.G. Experiments on self-aerated flow in open channels. J. Hydraul. Div. 1958, 84, 1–35. [Google Scholar] [CrossRef]
- Wood, I.R. (Ed.) Free surface air entrainment on spillways. In Air Entrainment in Free-Surface Flows; A. A. Balkema: Rotterdam, The Netherlands, 1991; pp. 55–84. [Google Scholar]
- Valero, D.; Bung, D.B. Development of the interfacial air layer in the non-aerated region of high-velocity spillway flows. Instabilities growth, entrapped air and influence on the self-aeration onset. Intl. J. Multiph. Flow 2016, 84, 66–74. [Google Scholar] [CrossRef]
- Valero, D.; Bung, D.B. Reformulating self-aeration in hydraulic structures: Turbulent growth of free surface perturbations leading to air entrainment. Intl. J. Multiph. Flow 2018, 100, 127–142. [Google Scholar] [CrossRef]
- Kramer, M.; Felder, S.; Hohermuth, B.; Valero, D. Drag reduction in aerated chute flow: Role of bottom air concentration. J. Hydraul. Eng. 2021, 147, 04021041. [Google Scholar] [CrossRef]
- Wilhelms, S.C.; Gulliver, J.S. Bubbles and waves description of self-aerated spillway flow. J. Hydraul. Res. 2005, 43, 522–531. [Google Scholar] [CrossRef]
- Wilhelms, S.C.; Gulliver, J.S. Gas transfer, cavitation, and bulking in self-aerated spillway flow. J. Hydraul. Res. 2005, 43, 532–539. [Google Scholar] [CrossRef]
- Chanson, H. The Hydraulics of Stepped Chutes and Spillways; A. A. Balkema: Rotterdam, The Netherlands, 2002. [Google Scholar]
- Boes, R.M.; Hager, W.H. Two-phase flow characteristics of stepped spillways. J. Hydraul. Eng. 2003, 129, 661–670. [Google Scholar] [CrossRef]
- Boes, R.M.; Hager, W.H. Hydraulic design of stepped spillways. J. Hydraul. Eng. 2003, 129, 671–679. [Google Scholar] [CrossRef] [Green Version]
- Hunt, S.L.; Kadavy, K.C. Energy dissipation on flat-sloped stepped spillways: Part 1. Upstream of the inception point. Trans. ASABE 2010, 53, 103–109. [Google Scholar] [CrossRef] [Green Version]
- Hunt, S.L.; Kadavy, K.C. Energy dissipation on flat-sloped stepped spillways: Part 2. Downstream of the inception point. Trans. ASABE 2010, 53, 111–118. [Google Scholar] [CrossRef]
- Hunt, S.L.; Kadavy, K.C. Inception point for embankment dam stepped spillways. J. Hydraul. Eng. 2013, 139, 60–64. [Google Scholar] [CrossRef]
- Hunt, S.L.; Kadavy, K.C.; Hanson, G.J. Simplistic design methods for moderate-sloped stepped chutes. J. Hydraul. Eng. 2014, 140, 04014062. [Google Scholar] [CrossRef]
- Frizell, K.W.; Renna, F.M.; Matos, J. Cavitation potential of flow on stepped spillways. J. Hydraul. Eng. 2013, 139, 630–636. [Google Scholar] [CrossRef]
- Pfister, M.; Hager, W.H.; Minor, H.-E. Bottom aeration of stepped spillways. J. Hydraul. Eng. 2006, 132, 850–853. [Google Scholar] [CrossRef]
- Terrier, S. Hydraulic Performance of Stepped Spillway Aerators and Related Downstream Flow Features. Ph.D. Thesis, École Polytechnique Fédérale de Lausanne (EPFL), Lausanne, Switzerland, 2016. [Google Scholar]
- Keller, R.J.; Lai, K.K.; Wood, I.R. Developing region in self-aerated flows. J. Hydraul. Div. 1974, 100, 553–568. [Google Scholar] [CrossRef]
- Amador, A.; Sánchez-Juny, M.; Dolz, J. Developing flow region and pressure fluctuations on steeply sloping stepped spillways. J. Hydraul. Eng. 2009, 135, 1092–1100. [Google Scholar] [CrossRef]
- Castro-Orgaz, O.; Hager, W.H. Drawdown curve and turbulent boundary layer development for chute flow. J. Hydraul. Res. 2010, 48, 591–602. [Google Scholar] [CrossRef] [Green Version]
- Hager, W.H. Uniform aerated chute flow. J. Hydraul. Eng. 1991, 117, 528–533. [Google Scholar] [CrossRef]
- Chanson, H. Self-aerated flows on chutes and spillways. J. Hydraul. Eng. 1993, 119, 220–243. [Google Scholar] [CrossRef] [Green Version]
- Killen, J.M. The Surface Characteristics of Self Aerated Flow in Steep Channels. Ph.D. Thesis, University of Minnesota, Minneapolis, MN, USA, 1968. [Google Scholar]
- Wilhelms, S.C. Self-Aerated Spillway Flow. Ph.D. Thesis, University of Minnesota, Minneapolis, MN, USA, 1997. [Google Scholar]
- Pfister, M. Discussion of ‘Bubbles and waves description of self-aerated spillway flow’. J. Hydraul. Res. 2008, 46, 420–422. [Google Scholar] [CrossRef]
- Wilhelms, S.C.; Gulliver, J.S. Reply to discussion of ‘Bubbles and waves description of self-aerated spillway flow’. J. Hydraul. Res. 2008, 46, 422–423. [Google Scholar]
- Chanson, H. On air entrapment onset and surface velocity in high-speed turbulent prototype flows. Flow Meas. Instrum. 2022, 83, 102122. [Google Scholar] [CrossRef]
- Kramer, K. Development of Aerated Chute Flow. Ph.D. Thesis, ETH-Zürich, Zürich, Switzerland, 2004. [Google Scholar]
- Peterka, A.J. The effect of entrained air on cavitation pitting. In Proceedings of the 1953 Meeting of ASCE Hydraulics Div., Minneapolis, MN, USA, 1–4 September 1953. [Google Scholar]
- Rasmussen, R.E.H. Some Experiments on Cavitation Erosion in Water Mixed with Air; Symposium on Cavitation in Hydrodynamics; National Physical Laboratory: London, UK, 1956. [Google Scholar]
- Pfister, M.; Hager, W.H. Chute aerators. I: Air transport characteristics. J. Hydraul. Eng. 2010, 136, 352–359. [Google Scholar] [CrossRef]
- Pfister, M.; Hager, W.H. Chute aerators. II: Hydraulic design. J. Hydraul. Eng. 2010, 136, 360–367. [Google Scholar] [CrossRef]
- Pfister, M.; Hager, W.H. Self-entrainment of air on stepped spillways. Inter. J. Multiph. Flow 2011, 37, 99–107. [Google Scholar] [CrossRef]
- Cain, P.; Wood, I.R. Measurements of self-aerated flow on a spillway. J. Hydraul. Div. 1981, 107, 1425–1444. [Google Scholar] [CrossRef]
- Wood, I.R. Uniform region of self-aerated flow. J. Hydraul. Div. 1983, 109, 447–462. [Google Scholar] [CrossRef]
- Bureau of Reclamation. Design of Small Dams, 3rd ed.; Bureau of Reclamation: Denver, CO, USA, 1987.
- Takahashi, M.; Ohtsu, I. Aerated flow characteristics of skimming flow over stepped chutes. J. Hydraul. Res. 2012, 50, 427–434. [Google Scholar] [CrossRef]
- Felder, S.; Chanson, H. Energy dissipation, flow resistance and gas-liquid interfacial area in skimming flows on moderate-slope stepped spillways. Environ. Fluid Mech. 2009, 9, 427–441. [Google Scholar] [CrossRef]
- Felder, S.; Chanson, H. Aeration, flow instabilities, and residual energy on pooled stepped spillways of embankment dams. J. Irrig. Drain. Eng. 2013, 139, 880–887. [Google Scholar] [CrossRef] [Green Version]
- Felder, S.; Chanson, H. Air–water flow characteristics in high-velocity free-surface flows with 50% void fraction. Intl. J. Multiph. Flow 2016, 85, 186–195. [Google Scholar] [CrossRef] [Green Version]
- Ashoor, A.; Riazi, A. Stepped spillways and energy dissipation: A non-uniform step length approach. Appl. Sci. 2019, 9, 5071. [Google Scholar] [CrossRef] [Green Version]
- Hunt, S.L.; Kadavy, K.C. Inception point for stepped chute designs with multiple sections of different step heights. J. Hydraul. Eng. 2021, 147, 06021001. [Google Scholar] [CrossRef]
- Wahl, T.L. History and physical significance of the roughness Froude number. J. Hydraul. Res. under review.
- Meireles, I.; Renna, F.; Matos, J.; Bombardelli, F. Skimming, nonaerated flow on stepped spillways over roller compacted concrete dams. J. Hydraul. Eng. 2012, 138, 870–877. [Google Scholar] [CrossRef]
- Zhang, G.; Chanson, H. Hydraulics of the developing flow region of stepped spillways. I: Physical modeling and boundary layer development. J. Hydraul. Eng. 2016, 142, 04016015. [Google Scholar] [CrossRef] [Green Version]
- Campbell, F.B.; Cox, R.G.; Boyd, M.B. Boundary layer development and spillway energy losses. J. Hydraul. Div. 1965, 91, 149–163. [Google Scholar] [CrossRef]
- Halbronn, G. Discussion of Turbulent boundary layer on steep slopes. Trans. ASCE 1954, 119, 1234–1242. [Google Scholar]
- Wood, I.R.; Ackers, P.; Loveless, J. General method for critical point on spillways. J. Hydraul. Div. 1983, 109, 308–312. [Google Scholar] [CrossRef]
- Cheng, X.; Gulliver, J.S.; Zhu, D. Application of displacement height and surface roughness length to determination boundary layer development length over stepped spillway. Water 2014, 6, 3888–3912. [Google Scholar] [CrossRef] [Green Version]
- Hunt, S.L.; Kadavy, K.C.; Wahl, T.L.; Moses, D.W. Physical modeling of beveled-face stepped chute. Water 2022, 14, 365. [Google Scholar] [CrossRef]
- Chanson, H. Hydraulics of skimming flows on stepped chutes: The effects of inflow conditions? J. Hydraul. Res. 2006, 44, 51–60. [Google Scholar] [CrossRef] [Green Version]
- Meireles, I.; Matos, J. Skimming flow in the nonaerated region of stepped spillways over embankment dams. J. Hydraul. Eng. 2009, 135, 685–689. [Google Scholar] [CrossRef]
- Matos, J. Discussion of ‘Hydraulic design of stepped spillways’. J. Hydraul. Eng. 2005, 131, 525–527. [Google Scholar] [CrossRef]
- Matos, J.; Meireles, I. Hydraulics of stepped weirs and dam spillways: Engineering challenges, labyrinths of research. In Hydraulic Structures and Society: Engineering Challenges and Extremes, Proceedings of the 5th IAHR International Symposium on Hydraulic Structures, Brisbane, Australia, 25–27 June 2014; Chanson, H., Toombes, L., Eds.; The University of Queensland: Brisbane, Australia, 2014. [Google Scholar]
- Yasuda, Y.; Ohtsu, I. Flow resistance of skimming flows in stepped channels. In Proceedings of the 28th IAHR Congress, Graz, Austria, 22–27 August 1999. [Google Scholar]
- Peterka, A.J. Hydraulic Design of Stilling Basins and Energy Dissipators; Engrg. Monograph 25; Bureau of Reclamation: Denver, CO, USA, 1958.
- George, R.L. Low Froude Number Stilling Basin Design; Report REC-ERC-78-8; Bureau of Reclamation: Denver, CO, USA, 1978.
- Stojnic, I.; Pfister, M.; Matos, J.; Schleiss, A.J. Influence of 30-degree sloping smooth and stepped chute approach flow on the performance of a classical stilling basin. J. Hydraul. Eng. 2021, 147, 04020097. [Google Scholar] [CrossRef]
- Frizell, K.W.; Svoboda, C.D. Performance of Type III Stilling Basins—Stepped Spillway Studies; Bureau of Reclamation Hydraulic Laboratory Report HL-2012-02; Technical Service Center: Denver, CO, USA, 2012. [Google Scholar]
- Hunt, S.L.; Kadavy, K.C. USBR Type III and Type IV stilling basins and rock aprons associated with stepped chutes. Appl. Eng. Agric. 2018, 34, 389–394. [Google Scholar] [CrossRef]
- Hunt, S.L.; Temple, D.M.; Abt, S.R.; Kadavy, K.C.; Hanson, G.J. Converging stepped spillways: Simplified momentum analysis approach. J. Hydraul. Eng. 2012, 138, 796–802. [Google Scholar] [CrossRef]
- Zindovic, B.; Vojt, P.; Kapor, R.; Savic, L. Converging stepped spillway flow. J. Hydraul. Res. 2016, 54, 699–707. [Google Scholar] [CrossRef]
Figure 1.
Development of air entrainment in open channel flow down a smooth, steep chute (adapted from [4]).
Figure 1.
Development of air entrainment in open channel flow down a smooth, steep chute (adapted from [4]).

Figure 2.
Entrained air concentration in the fully developed aerated flow zone, showing experimental data [9,31], the original curve of Wilhelms and Gulliver [14] and the curve described by Equation (1) that produces more realistic values for low slopes. Error bars are uncertainties in the original experimental values of entrained air as reported by [14].

Figure 3.
Equation (3) curve relating bottom air concentration to mean entrained air concentration, compared with experimental values [9,31,42].


Figure 5.
Example variation of the friction factor along a chute with a 3:1 slope (θ = 18.4°).

Figure 6.
Friction factors for the fully aerated region of stepped chutes vs. chute slope [18,22,45,59].

Figure 7.
Example stepped chute water surface profile results.

Figure 8.
SpillwayPro air concentration predictions vs. Aviemore Dam field data [42].
Figure 8.
SpillwayPro air concentration predictions vs. Aviemore Dam field data [42].

Publisher’s Note: MDPI stays neutral with regard to jurisdictional claims in published maps and institutional affiliations. |
© 2022 by the authors. Licensee MDPI, Basel, Switzerland. This article is an open access article distributed under the terms and conditions of the Creative Commons Attribution (CC BY) license (https://creativecommons.org/licenses/by/4.0/).
Share and Cite
MDPI and ACS Style
Wahl, T.L.; Falvey, H.T. SpillwayPro: Integrated Water Surface Profile, Cavitation, and Aerated Flow Analysis for Smooth and Stepped Chutes. Water 2022, 14, 1256. https://doi.org/10.3390/w14081256
AMA Style
Wahl TL, Falvey HT. SpillwayPro: Integrated Water Surface Profile, Cavitation, and Aerated Flow Analysis for Smooth and Stepped Chutes. Water. 2022; 14(8):1256. https://doi.org/10.3390/w14081256
Chicago/Turabian StyleWahl, Tony L., and Henry T. Falvey. 2022. "SpillwayPro: Integrated Water Surface Profile, Cavitation, and Aerated Flow Analysis for Smooth and Stepped Chutes" Water 14, no. 8: 1256. https://doi.org/10.3390/w14081256
Note that from the first issue of 2016, this journal uses article numbers instead of page numbers. See further details here.