
Spatiotemporal Distribution of Water and Nitrogen in Border Irrigation and Its Relationship with Root Absorption Properties


1
State Key Laboratory of Simulation and Regulation of Water Cycle in River Basin, China Institute of Water Resources and Hydropower Research, Beijing 100048, China
2
School of Hydraulic Engineering, Changsha University of Science & Technology, Changsha 410114, China
3
College of Land Science and Technology, China Agricultural University, Beijing 100193, China
*
Author to whom correspondence should be addressed.
Water 2022, 14(8), 1253; https://doi.org/10.3390/w14081253
Submission received: 14 February 2022
/
Revised: 18 March 2022
/
Accepted: 21 March 2022
/
Published: 13 April 2022
(This article belongs to the Special Issue Advances in Sprinkler Irrigation Systems and Water Saving)
Abstract
:The spatiotemporal distribution characteristics of water and nitrogen in the soil profile are essential influencing factors that determine the development of crop root systems. The purpose of this study was to clarify the inter-row and inter-tree variability in soil moisture in the apple root zone, and to determine the effective root diameter ranges of apple trees that influence water and nitrogen absorption. The method used was a 2-year border irrigation experiment carried out in a traditional apple orchard in Zuncun, Shanxi Province, China. Dynamic variations in the soil moisture between trees within the row (perpendicular to the direction of border irrigation) and between rows (along the direction of border irrigation) were continuously measured from 2015 to 2016, and a specific soil profile was excavated to analyze the distribution characteristics of soil water, nitrogen, and roots with different diameters. The results showed obvious variations in soil moisture in the surface soil of 0–30 cm, and the soil moisture content between rows was 5% higher than that between trees within the row. The root length density in the soil between trees within the row was 33.5% higher than that in the soil between rows. Bivariate correlation analysis showed that the correlation between the root system and nitrogen and water was ranked from highest to lowest: total nitrogen (0.741) > nitrate nitrogen (−0.36) > soil moisture (−0.273). The correlation coefficient between trees within the row was higher than that between rows. Lower soil moisture between trees within the row resulted in increased root biomass and more active uptake activity between trees within the row. There were different significant correlations between the specific root diameter and the contents of soil water and nitrogen, showing that the 1.5 mm diameter roots correlated with the water content, whereas the 2.0 mm diameter roots correlated with the nitrogen content. The findings of this study provide a deeper understanding of the absorption mechanism of crop roots for soil water and nitrogen.
1. Introduction
Orchard production is a huge water consumer in irrigated agriculture. Therefore, a deeper understanding of the effect of irrigation measures on the growth of fruit trees is necessary to provide reasonable irrigation strategies [1,2,3]. Apple trees are an economic crop widely planted in northern China [4,5]. Studying the distribution characteristics of water, nitrogen, and root systems in an apple orchard and establishing a scientific irrigation system are effective ways to improve the efficiency of irrigation water use in agriculture in northern China [6,7,8].
Recent studies have focused on the dynamics of soil water and nutrients in different apple planting areas, the depth of available soil water, the distribution of the root system, and the dynamic simulation of soil water and nutrients in the root area of apple trees [8,9,10,11,12]. In some special cases, the distribution characteristics of soil water and nutrients, and the root development and efficiency of water use of apple trees, have been studied in different growth years in different regions. The results showed that the soil moisture increased in up and down directions with the root area of a fruit tree as the center along the vertical range; additionally, the farther the root area from the trunk, the higher the water moisture along the horizontal direction [13,14,15,16]. In addition, some scholars studied the soil water use depth, soil water suitability, and soil drying in an apple orchard to obtain different conclusions. Ran et al. [17] pointed out that the planting of apple trees led to a dry layer from 0 to 200 cm, resulting in the blocking of irrigation and rainfall to the deep soil water supplement. However, Sun and Zhao [18] reported that the main depth of water consumption of apple trees is from 100 to 310 cm. Meng et al. [19] found that the maximum soil water depth available to the root system of apple orchards ranges from 300 to 500 cm. Most studies have examined the distribution of water and nitrogen in the root region as a whole or in layers. Gao et al. [20] studied the nitrate nitrogen distribution in corn fields along the border length under irrigation conditions, and the distribution of nitrate nitrogen in the surface soil was higher than that in the bottom soil. Bai et al. [21] studied the distribution of nitrogen in the water flow and soil under different fertilization methods for border irrigation. Under the border irrigation conditions in the Yellow River diversion, the difference in moisture and nitrogen distribution in apple root areas between rows and trees within the row has not been reported. The variation in soil water distribution during the growth period, and the relationship between soil water and the root system between rows and trees within the row, need to be further evaluated.
The root system is the key bridge connecting the growth of fruit trees and environmental factors. Previous studies showed that the root length density of fibrous roots was directly and closely related to the ability of the root system to absorb water and nutrients. Hao et al. [22] showed that the root length density decreased with increasing depth in the vertical direction. Lei [23] and Lei and Zhao [24] pointed out that the root distribution depth of a 12-year-old apple orchard reached 1.5 m in the vertical direction with the phenomenon of stratification, and this phenomenon in the zone close to the trunk in the horizontal direction was more significant. Similarly, Li et al. [25] reported that the apple root system followed the law of significant layered distribution. It was reported that there was a dense layer at depths from 15 to 40 cm, and very few roots were observed beyond the depth of 40 cm. The spatiotemporal variation in soil water distribution affects the root growth and distribution [26]; when water stress is relatively light, roots proliferate in large quantities in areas in which soil water is available, root length density increases, and root water absorption capacity also increases significantly [27]. Nitrogen stress and duration affect root length [28]. Root water conductivity is sensitive to nitrogen deficiency, and the uptake of water and nutrients by the root system also changes [29]. Root depth affects nitrogen uptake and leaching loss; deep roots are beneficial to the absorption and utilization of nitrogen [30], root diameter and morphology also influence nutrient uptake [31], and the contribution of young roots and lateral roots to root water uptake is greater than that of old roots. The difference in apple root distribution between rows and trees within the row in border irrigation in Yellow River irrigated areas, and the correlation between root distribution and soil water distribution in the regions between rows and trees within the row at different depths, need to be further revealed.
No clear definition of fine roots has been provided yet. Marshall et al. [32] divided roots that did not have secondary thickening into fine roots, and Wei [33] used the internal structure of the root as the standard for defining thin roots. At the same time, few studies have explored the correlation between water nitrogen and root systems of different diameters. Studying the correlation between different diameters of roots and the distribution of water and nitrogen helps understand the division of apple fine roots and the response of water and nutrients to roots. However, the aforementioned studies on the distribution of water and root systems in an apple orchard mainly focused on water consumption in the field or in a large area. Reports on the response and coupling of the distribution of root systems with that of water and nutrients around the root zone are limited.
Hence, the present study aimed to (1) characterize the spatial distribution of water, nitrogen, particle composition, and the root system in the soil profile for orchards with border irrigation in the Yellow River irrigation area; (2) quantify the relationship between the distribution of soil moisture, nitrogen, particle composition, and roots; and (3) determine the effective root diameter ranges for influencing water and nitrogen absorption. The effects of the border irrigation with diverted Yellow River water on orchard soil, soil moisture, root system, and nitrogen are presented. This study provides a deep understanding of the absorption mechanism of crop roots for soil water and nitrogen, for the design of scientific irrigation strategies, thus improving the efficiency of water and nutrient utilization in arid areas.
2. Materials and Methods
2.1. Study Area
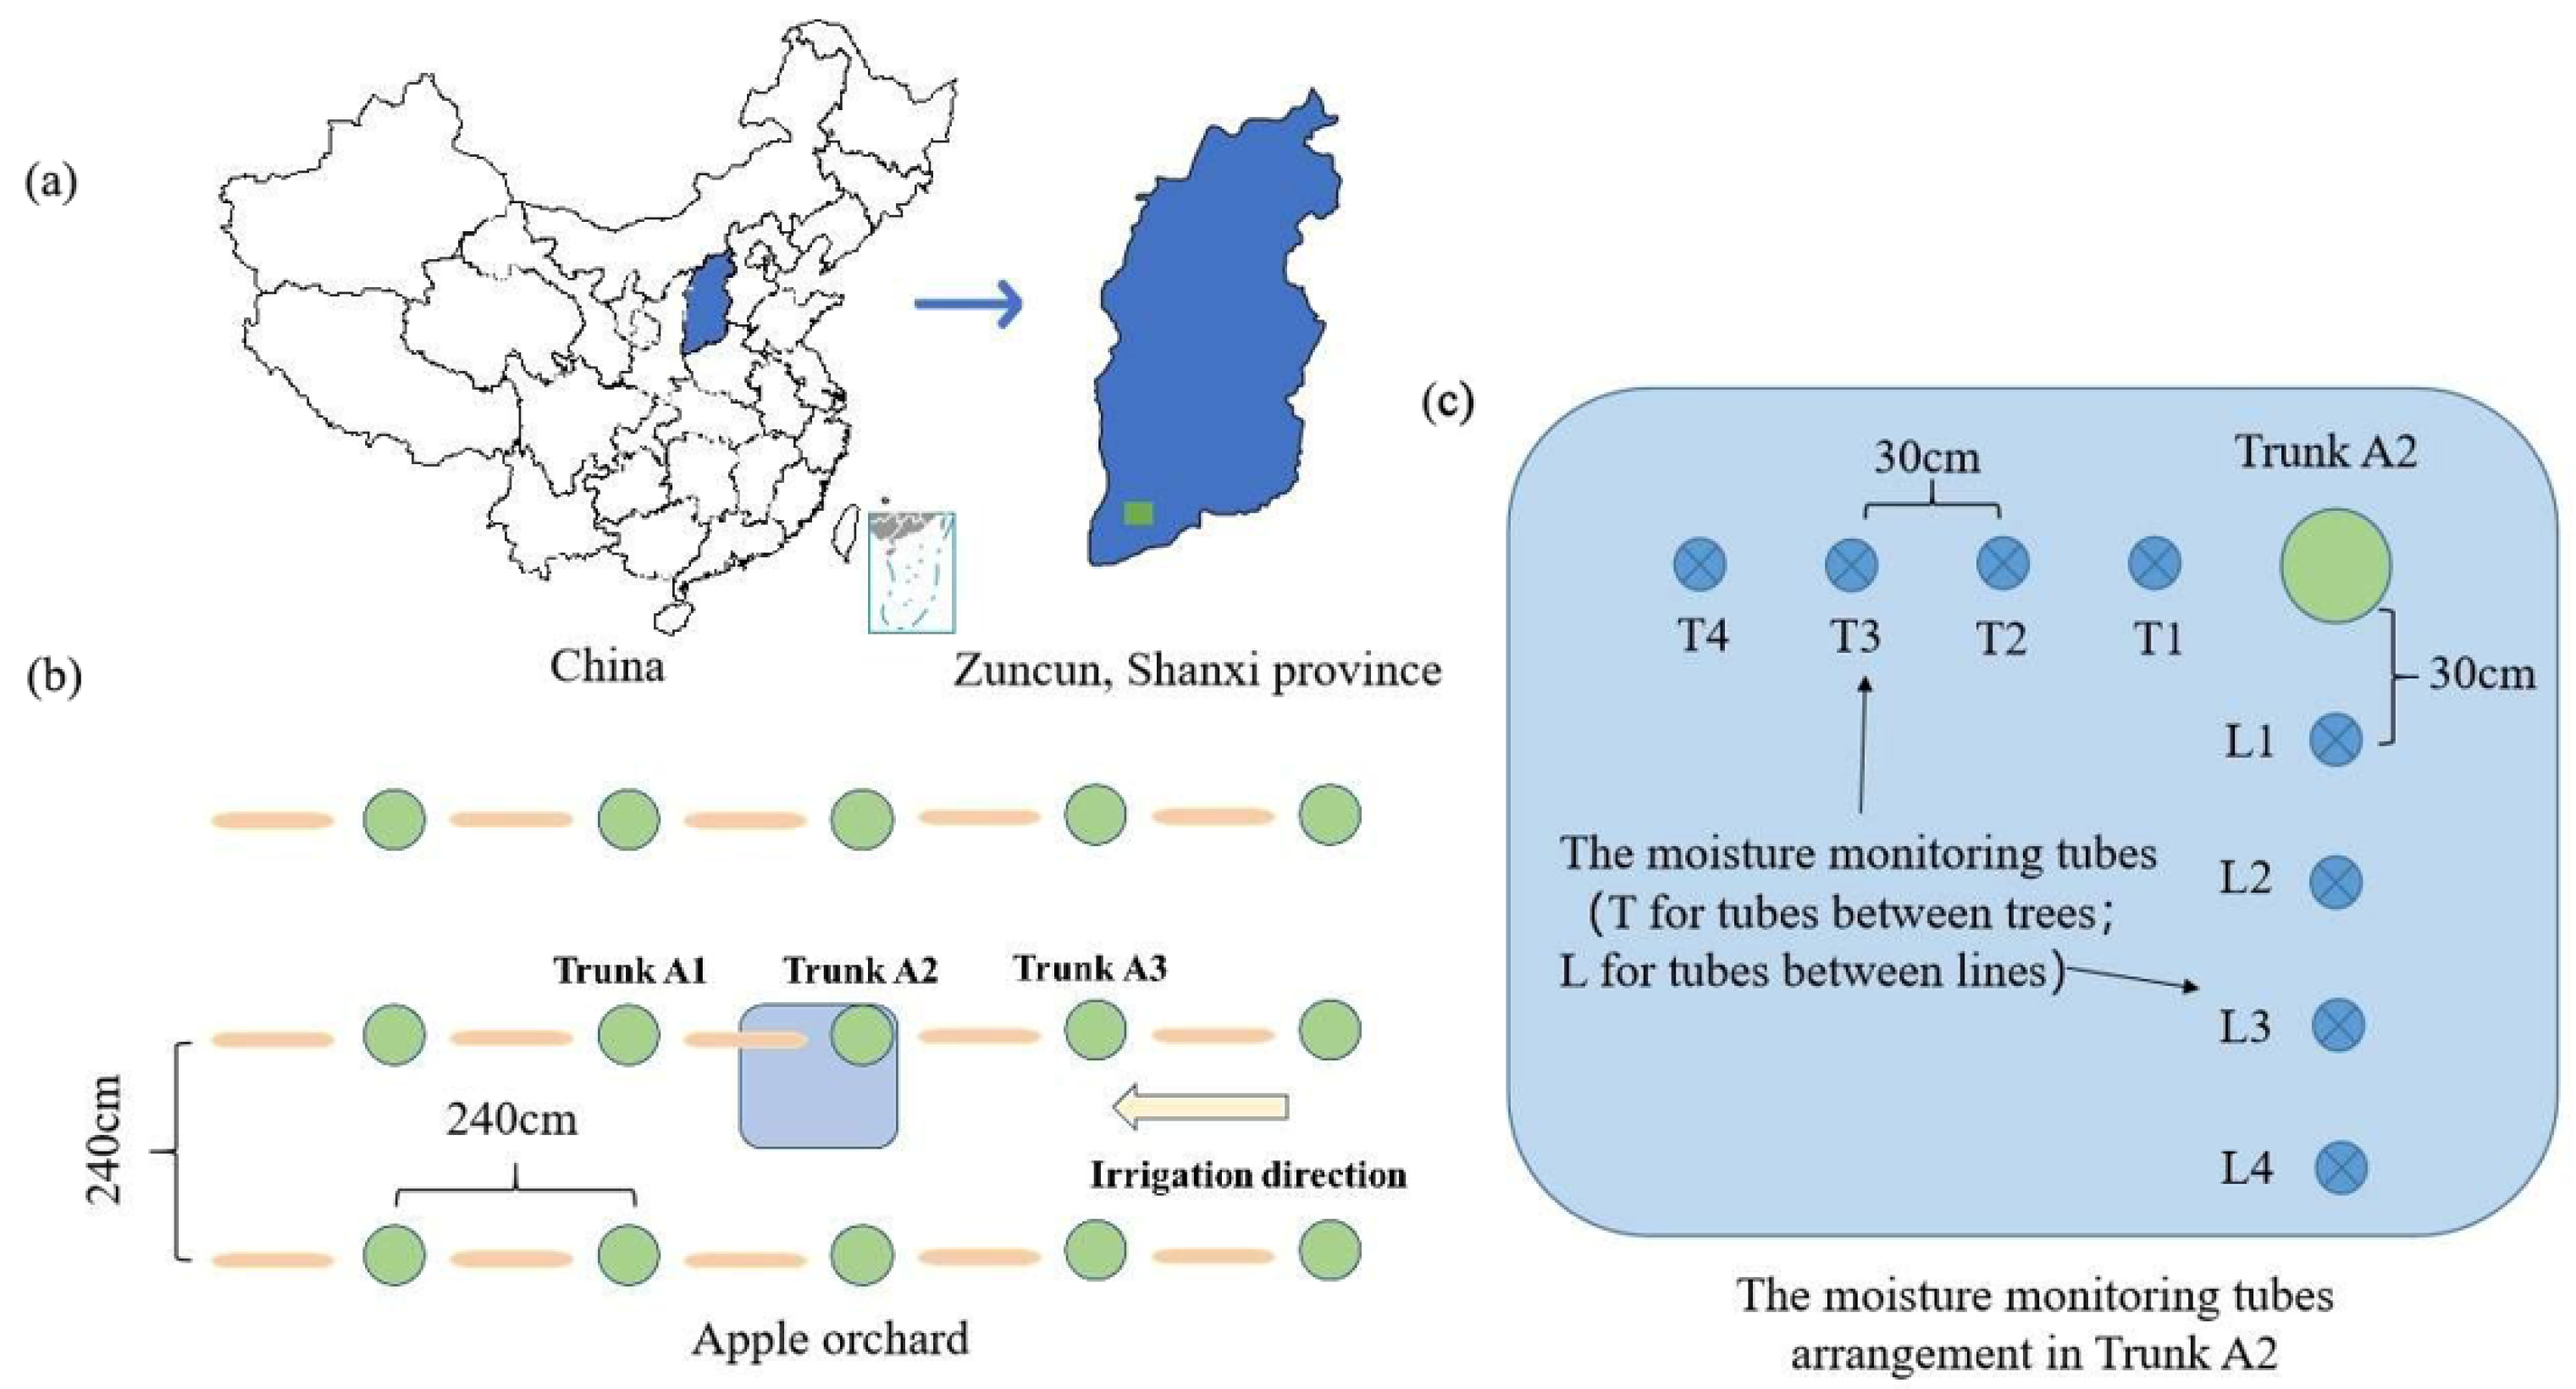
A border irrigation experiment (2015–2016) was carried out in a traditional apple orchard in Zuncun, Shanxi Province, China (35°3’9” N, 110°49’45.12” E). In recent years, the fruit industry in the study area has developed rapidly, forming the largest fruit production area in the region, known as “Linyi Fruit Capital”. The scope of apple cultivation is also expanding year by year. The area’s mean annual precipitation is 573.6 mm and the mean evaporation is 1240.0 mm. The soil of the experimental area is loam and the field capacity is 21.0 g/g. Border irrigation is widely used in local orchards. Therefore, apple orchards with border irrigation were selected as the research object. The water for irrigation is drawn from the Yellow River. The location schematic of the apple experiment orchard is shown in Figure 1a.
2.2. Experimental Treatment
The experimental apple orchard was a rectangular area 290 m long and 25.3 m wide. The apple trees were 6-year Fuji apple trees. Three apple trees with good and similar growth were randomly selected in the middle of the orchard. The selected apple trees were marked A1, A2, and A3 with line spacing of 2.4 × 2.4 m2. Four TRIME-PICO IPH (IMKO, Ettlingen, Germany) water probes were installed every 30 cm around the A2 root zone following the mode displayed in Figure 1b,c. The detection depth of probes for soil moisture was 100 cm. The probes were labeled L1 (30 cm), L2 (60 cm), L3 (90 cm), and L4 (120 cm) between rows, and T1 (30 cm), T2 (60 cm), T3 (90 cm), and T4 (120 cm) between trees within the row. Border irrigation was performed with a 69 mm irrigation volume for each irrigation event. Four irrigation events were carried out on 17 May, 22 June, 17 July, and 10 October in 2015, and five irrigation events were carried out on 22 February, 13 May, 15 July, 27 August, and 12 October in 2016 under the guidelines of local farmers. The irrigation water was from the Yellow River, which contained sediment and nitrogen. Water temperature, sediment content, and nitrogen content changed with different seasons. The average sediment concentration was 1 kg/m3, and the average total nitrogen content was 3.5 mg/L. Urea (N 46%) was used as the fertilizer and spread evenly on the ground (1250 kg/ha) before each irrigation event.
2.3. Measurements
(1) Soil water. TRIME water probes were used to measure the soil moisture twice every week starting on 23 April 2015 and 20 February 2016. The detected soil moisture data obtained using TRIME water probes were the soil volume moisture contents.
(2) Root. In late October 2016, at the end of the apple-growing season, root samples were collected from the soil profile from 0 to 100 cm in the trunk A2 root region. Two 100 cm sections were excavated 10 cm alongside the two rows of tubes. The root was sampled at each 10 × 10 × 10 cm3 cube layer by layer from the two vertical sections. The collected samples were wrapped in 100 mesh fine mesh and washed, the soil was filtered out, and the root samples were scanned and quantified using a root scanner (WinRHIZO, Regent Instruments, Quebec, Canada).
(3) Soil nutrients and particle composition. Soil samples were also collected from the opposite side of the root sampling area for nutrient and particle composition analyses. Each sampling point was located within 10 cm of each monitoring tube. The collected soil samples were air-dried, ground to a fine size, and screened with a 10-mesh filter. Then, the concentrations of nitrate nitrogen, ammonia nitrogen, and total nitrogen were detected using a continuous-flow analyzer (Auto Analyzer Ⅲ, Germany Bran + Luebbe Company), following the procedure reported by Wen et al. [34]. The composition of soil particles was determined using a Mastersizer 3000 (Malvern, Worcs, UK ).
2.4. Data Analysis Methods
Kriging interpolation in Surfer 12.0 was adopted to draw the distribution map of soil moisture and nitrogen content in the root area of the study area. The calculation formula of volumetric moisture content of soil is as follows:
where θ (%) is the soil volume moisture content; Vw (cm3) is the volume of water in soil; Vs (cm3) is the volume of soil.
The coefficient of variation (Cv) of soil moisture at different positions in the root region of the apple tree was calculated as follows:
where S is the standard deviation of the sample value, which is dimensionless, and M is the average value of the sample, which is also dimensionless. Cv reflects the discrete distribution and the degree of spatial variation. This value meant weak variability for Cv ≤ 0.1, moderate variability for 0.1 < Cv < 1, and strong variation for Cv ≥ 1.
The root length density is the root length of the plant contained in the unit soil, and the calculation formula of root length density was as follows:
where RLD is the root length density; Lrs (cm) is the total length of root system for each soil sample with root; n is the number of roots in each soil sample with roots; Li is the length of the ith root; Vrs (cm3) is the volume of each soil sample with roots.
The correlations of the root length of the apple root region with the soil moisture, nitrate nitrogen concentration, total nitrogen content, and median soil particle size were analyzed using the Pearson correlation detection model in the numerical analysis software SPSS 15.0 (SPSS Inc., Chicago, IL, USA).
3. Results and Analysis
3.1. Spatiotemporal Distribution of Moisture in Soil Profile
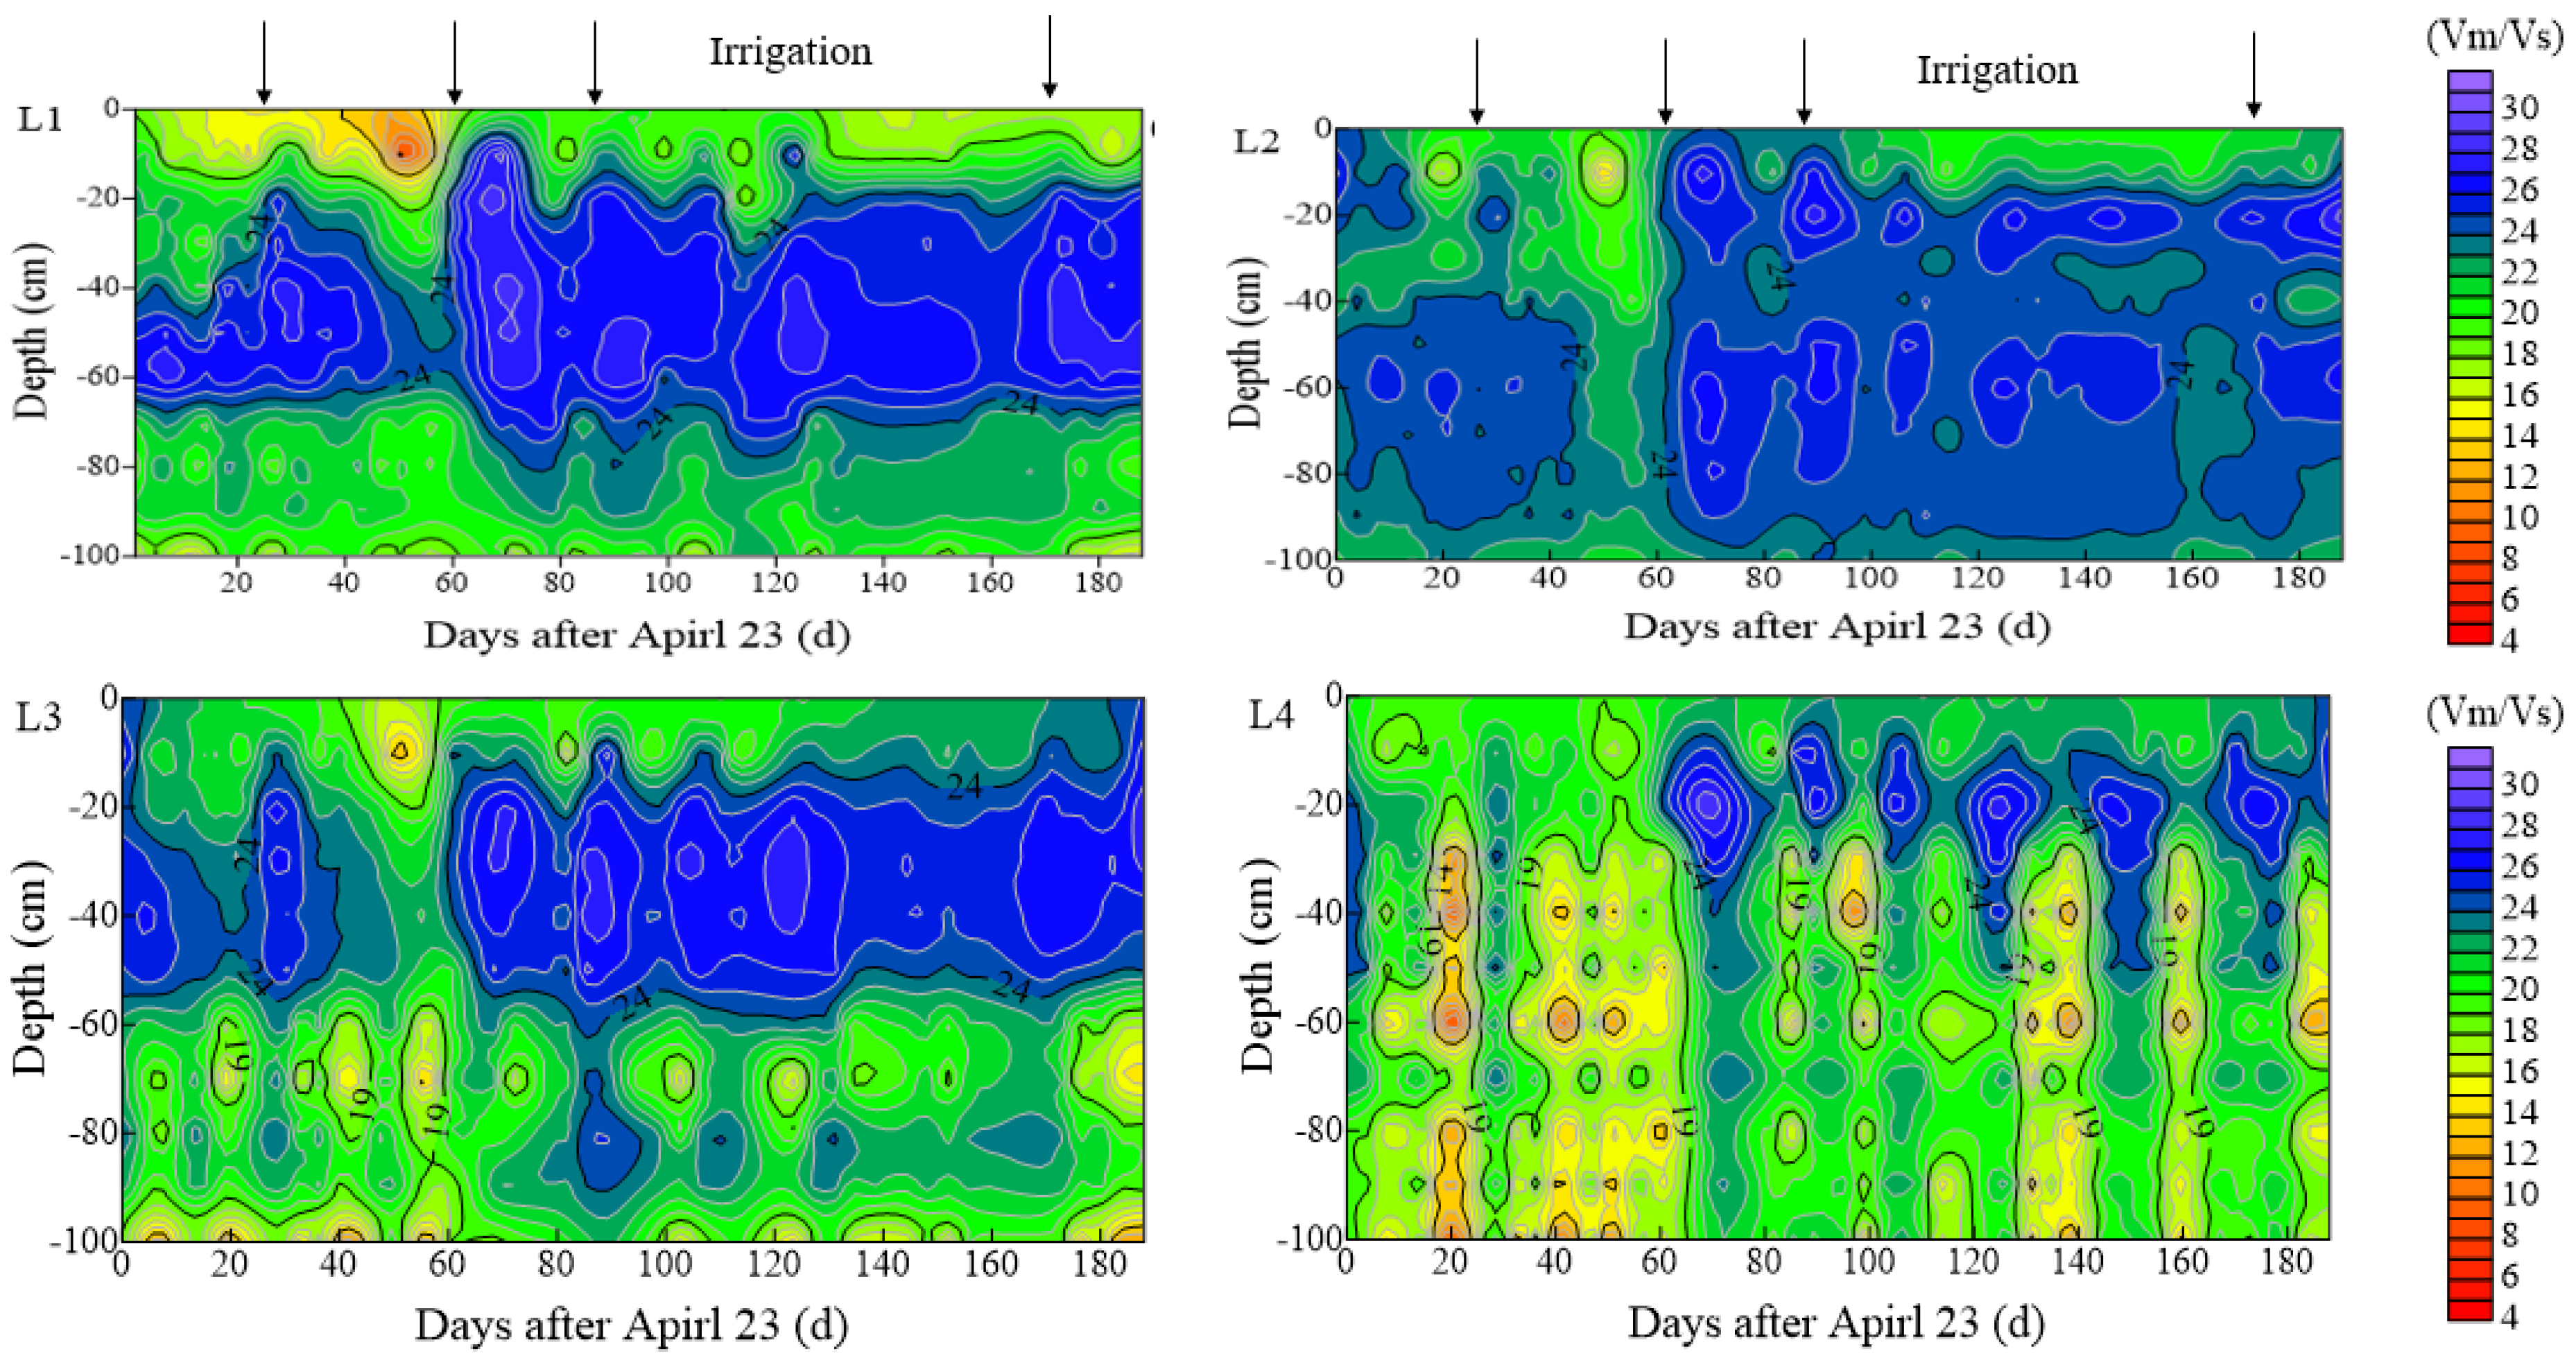
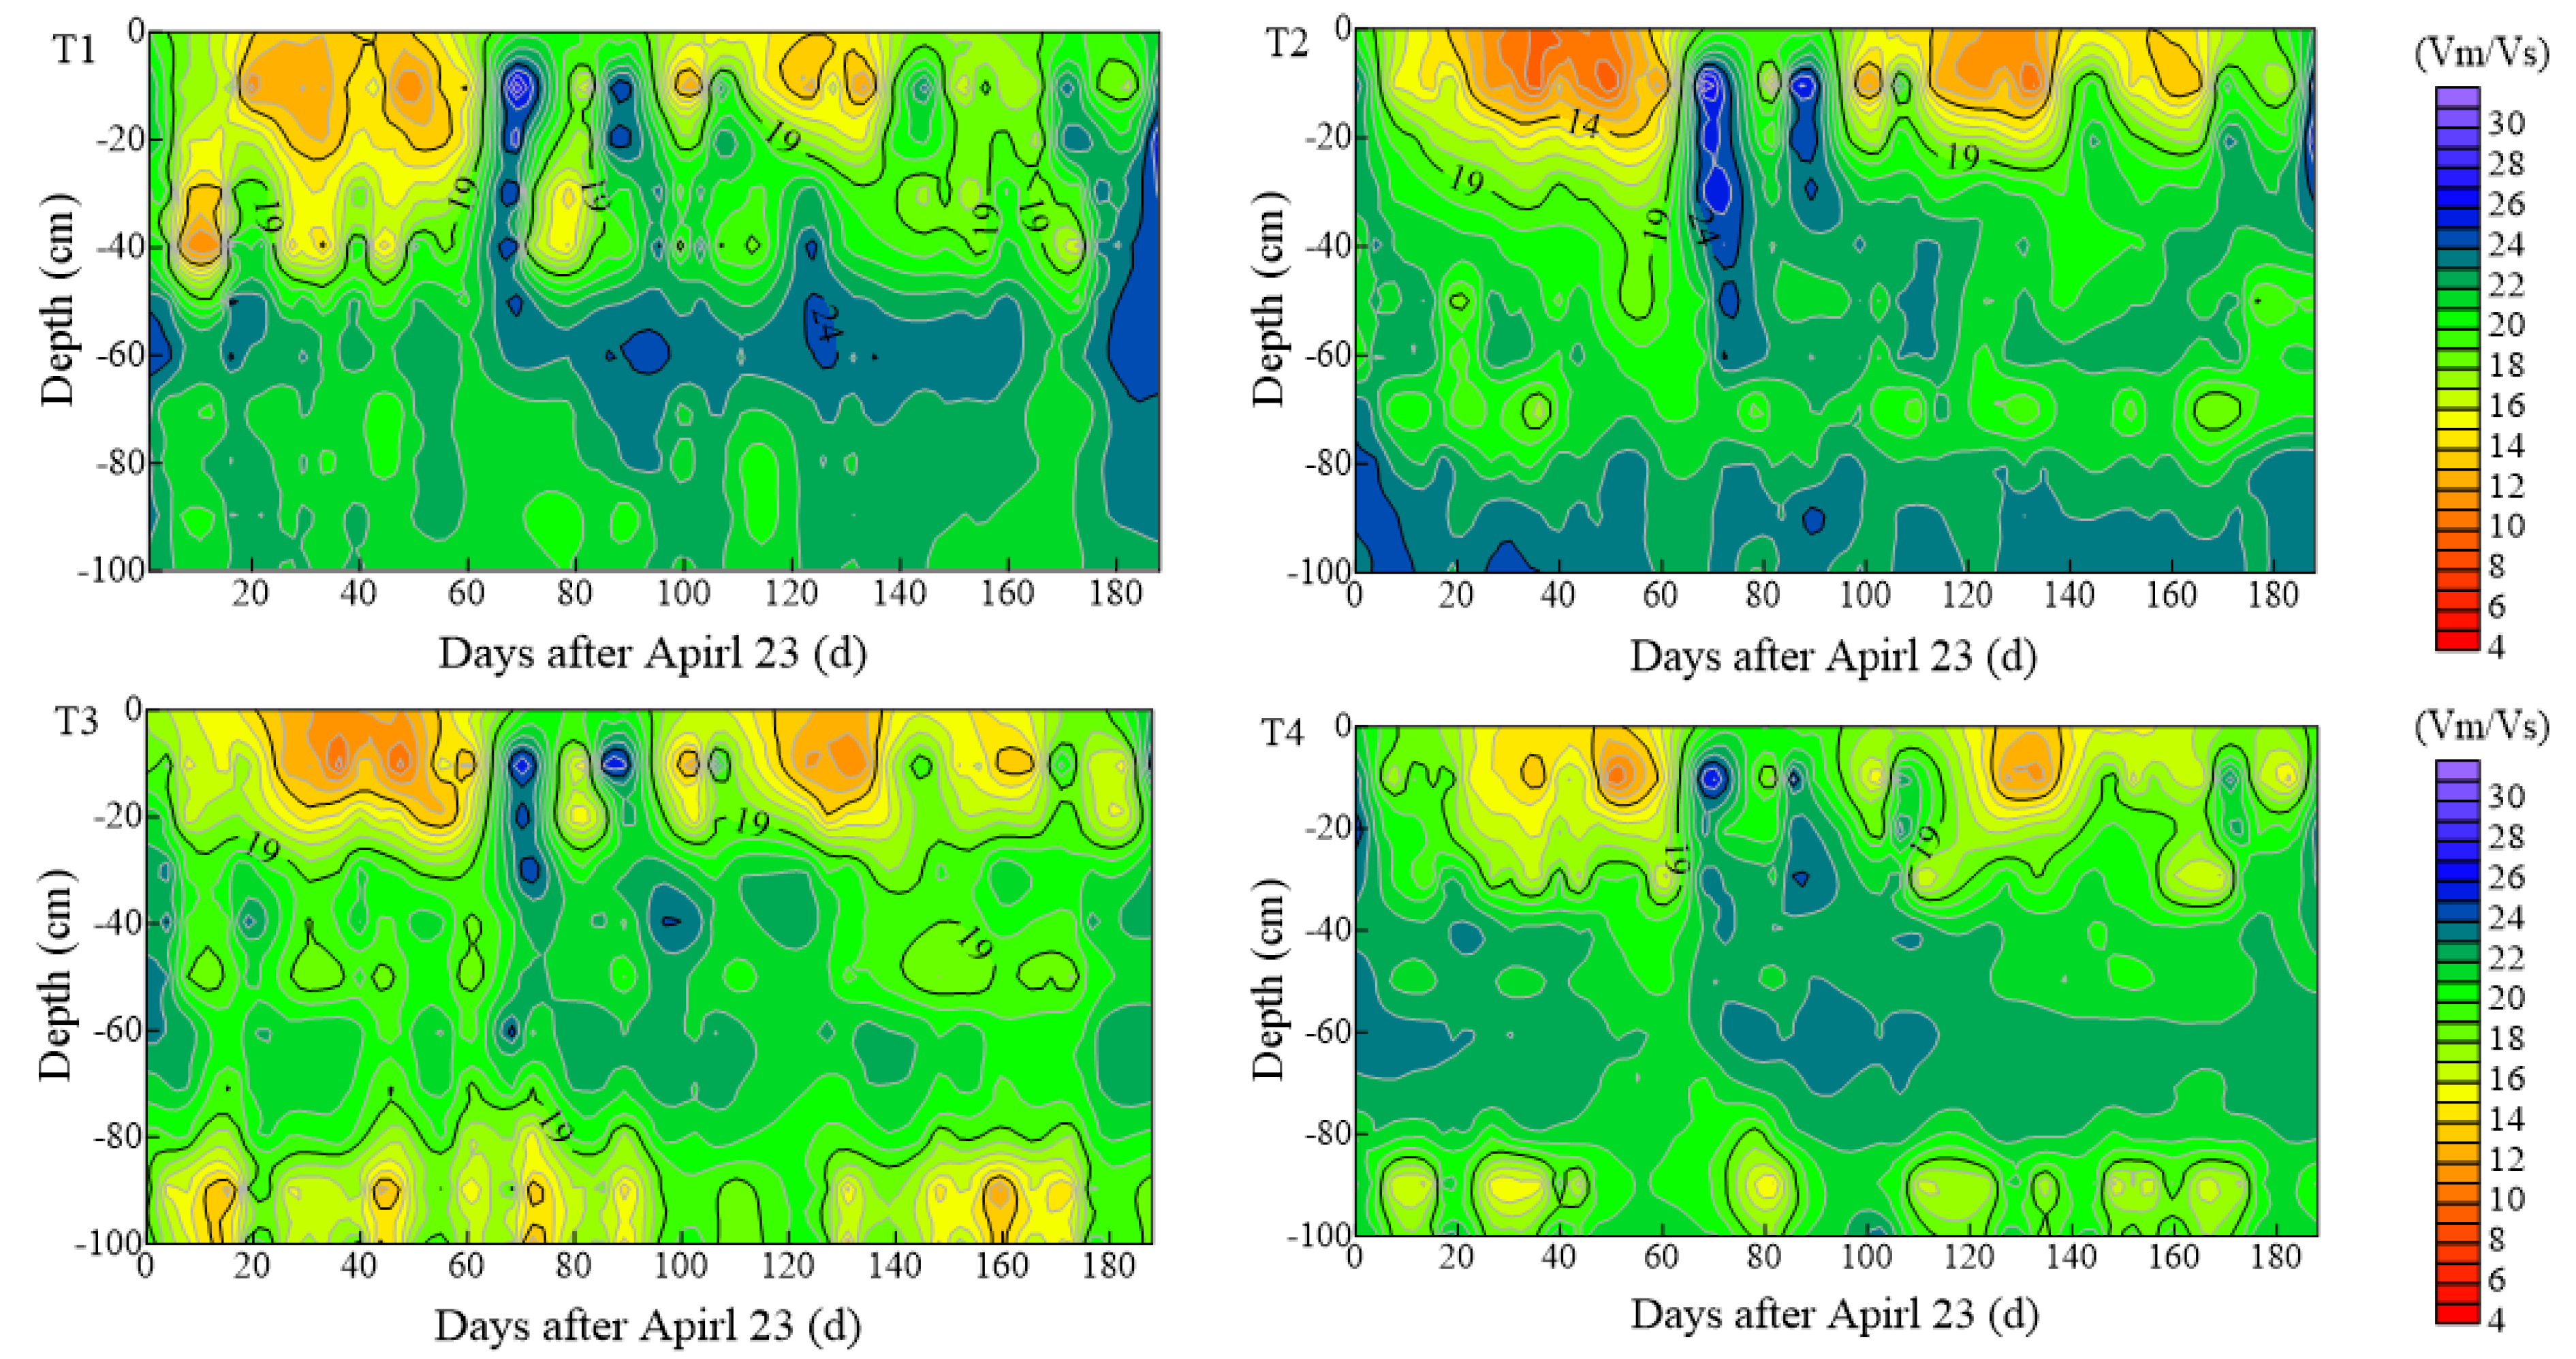
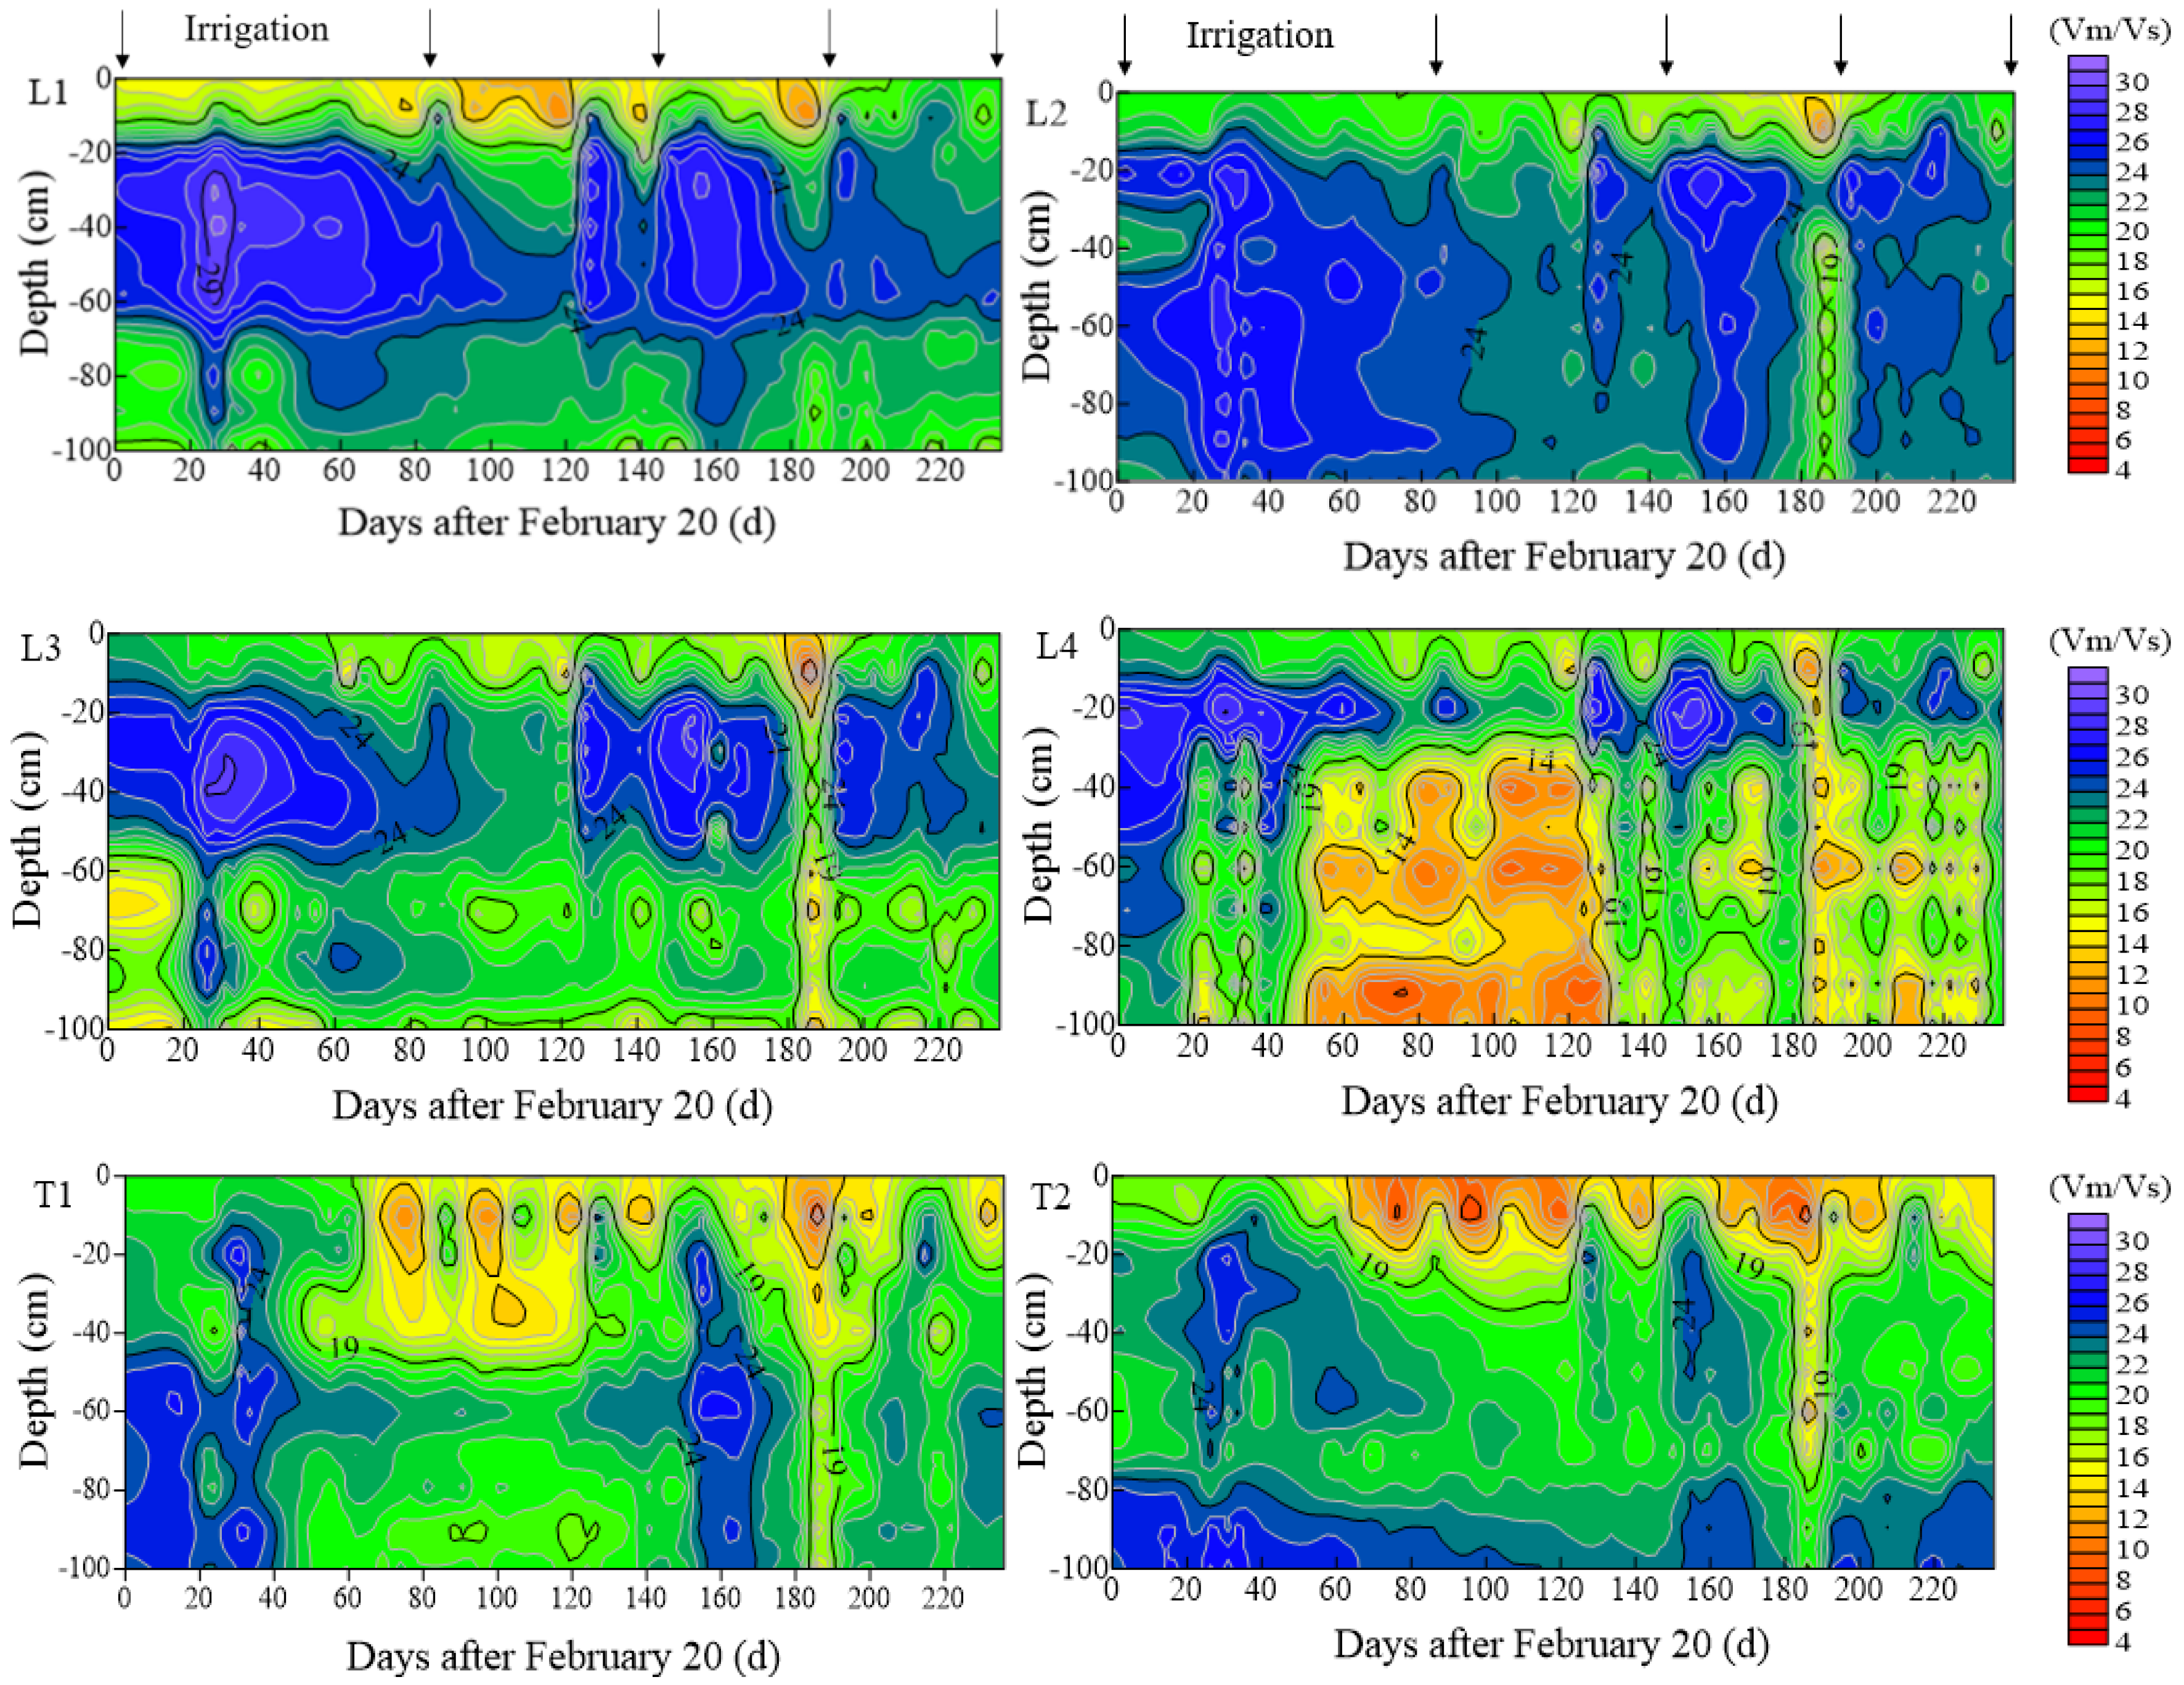
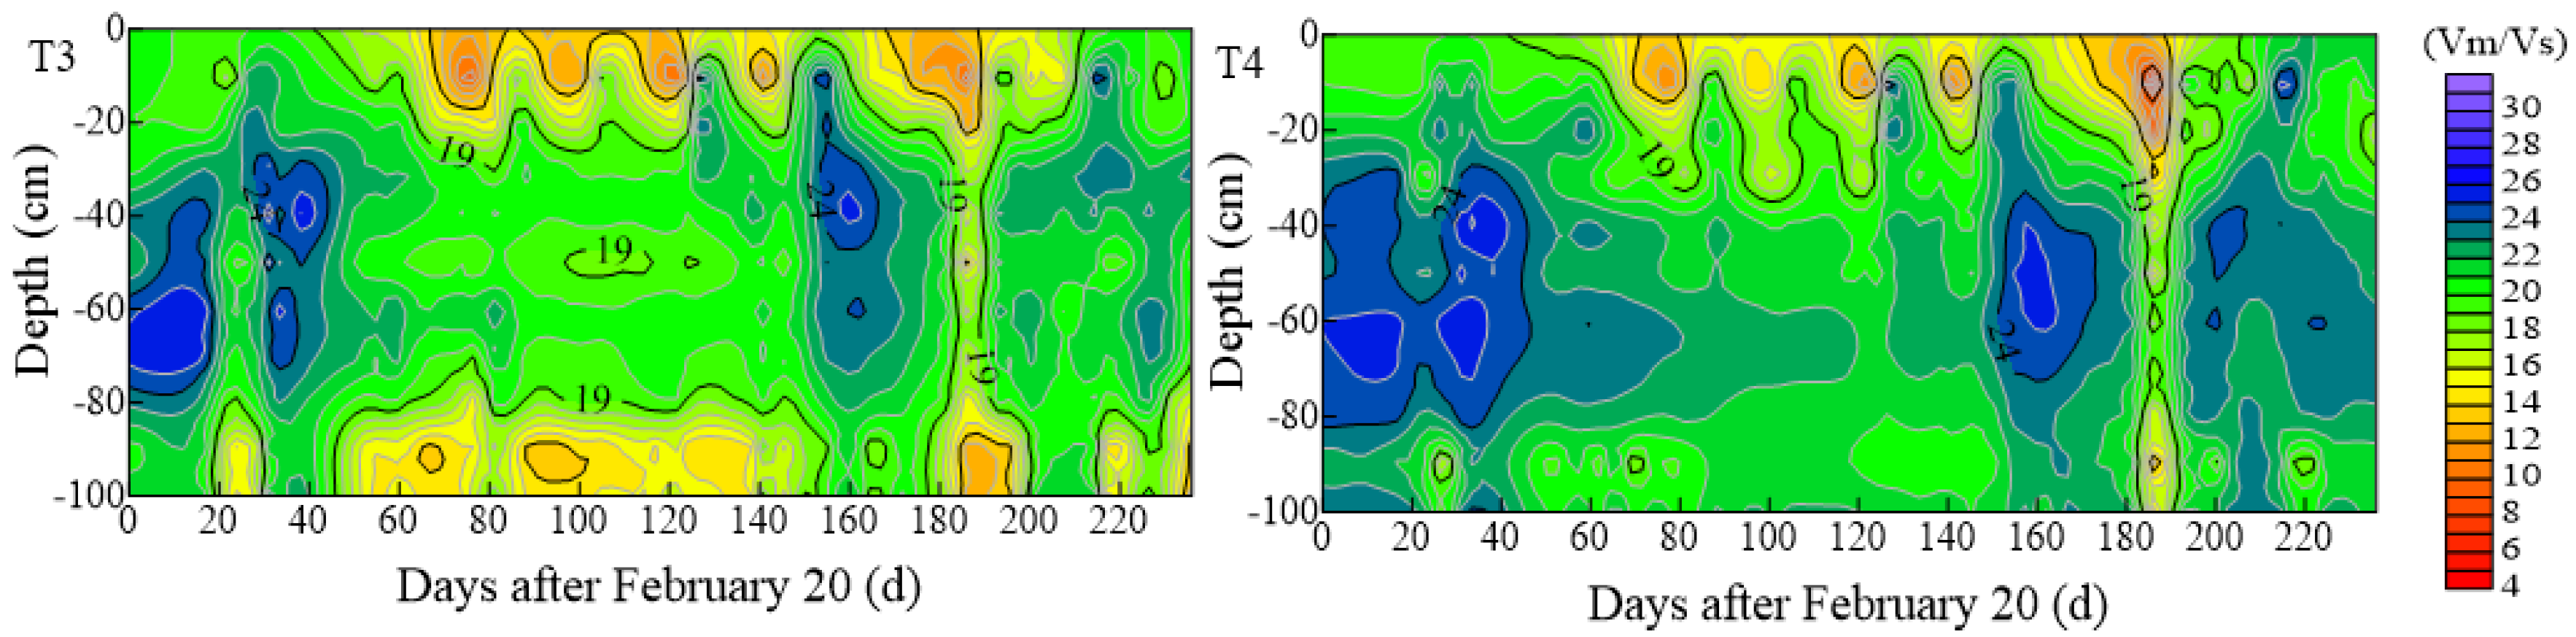
In order to analyze the temporal variation law of soil moisture distribution at each depth at the same location with time, the soil moisture at different times at different depths at the same location was assessed and interpolated, and the contour map was then drawn. The spatiotemporal distributions of soil moisture between rows and between trees within the row at depths from 0 to 100 cm from 2015 to 2016 are shown in Figure 2 and Figure 3, respectively. The area with high soil moisture content between rows was larger than that between trees within the row. Overall, the soil moisture content between rows was 5% higher than that between trees within the row. The soil volume moisture content varied in the range of 10–30%. The high soil moisture content area in the root region was at a 90 cm depth between rows, and the main depth was 60 cm at L1 and L3, and 100 cm at L3. The area in which the soil moisture changed dramatically was the surface layer from a depth of 20 to 30 cm. During the two years, the moisture content in the surface soil at all distances between trees within the row was low. The soil moisture was mainly concentrated in the middle and lower depths (below 40 cm) between trees within the row, and in the middle depths (40–60 cm) between rows, regardless of the distance from the tree trunk.
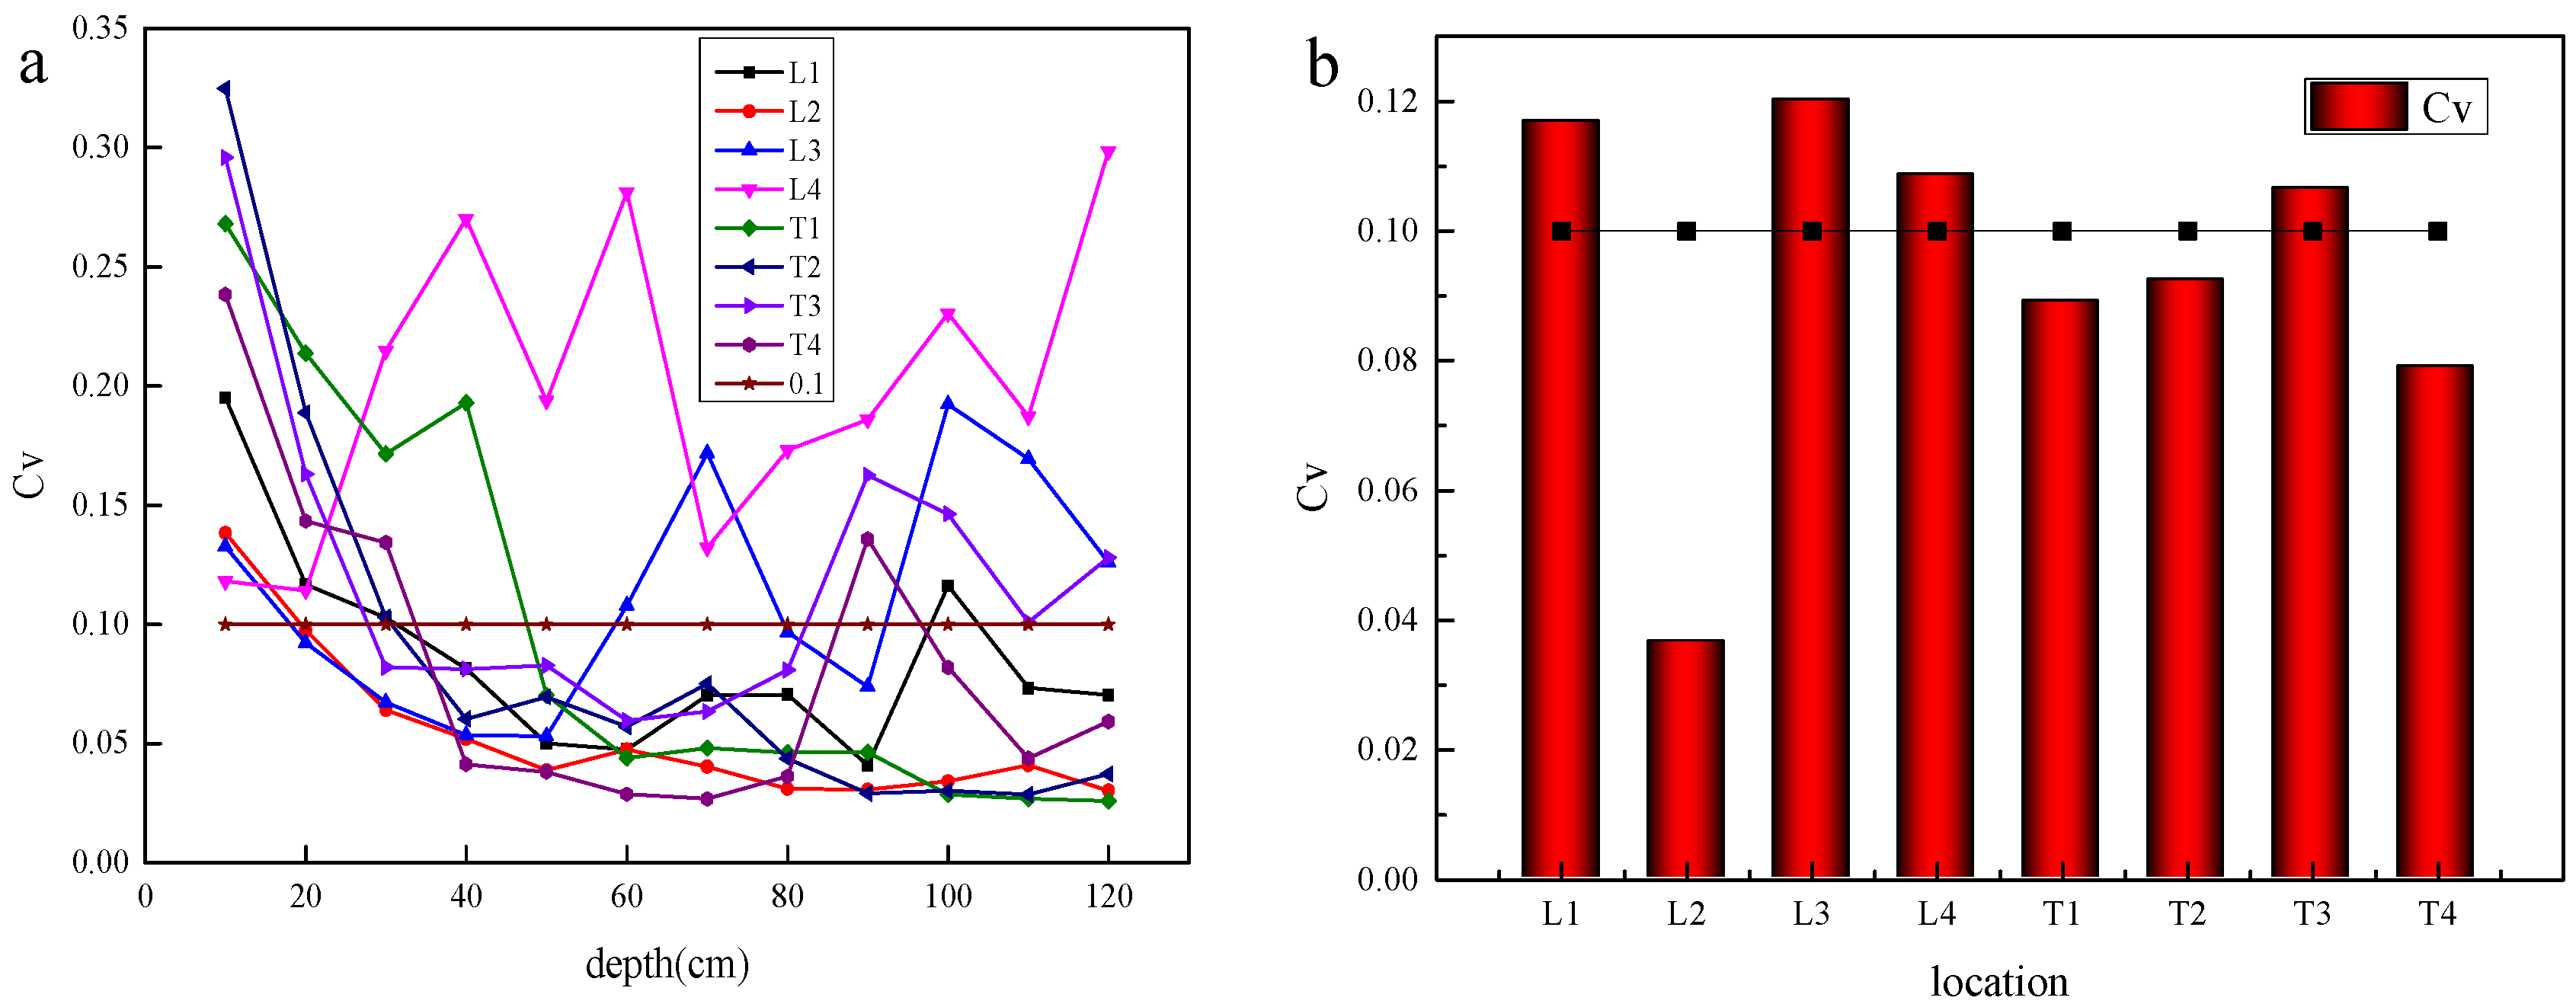
The Cv values of soil moisture at different depths between rows and trees within the row in the root region were determined and are displayed in Figure 4a. The analysis of Cv further supported the results of soil moisture. Two regions with large Cv were determined:
(1) The surface soil between rows and between trees within the row. This result indicates that the soil moisture within the 30 cm surface soil varied greatly throughout the year. The main factors included irrigation events, evaporation between trees within the row, and intensive water activity caused by fibrous roots in the surface soil [35,36,37].
(2) The deep layer of the L3 probe and all soil layers in the L4 probe. The L3 and L4 probes were installed in the middle part of the inter-row area, which were often flooded with irrigation water, and the evaporation from the bare soil was high, resulting in large Cv values. The variation coefficients of the annual average soil moisture data are shown in Figure 4b. Except for the weak variation of the soil moisture observed in the L2 probe, the others were all of moderate variation. However, only the T3 probe indicated moderately variable soil moisture between trees within the row.
3.2. Spatial Distribution of the Root System in Soil Profile
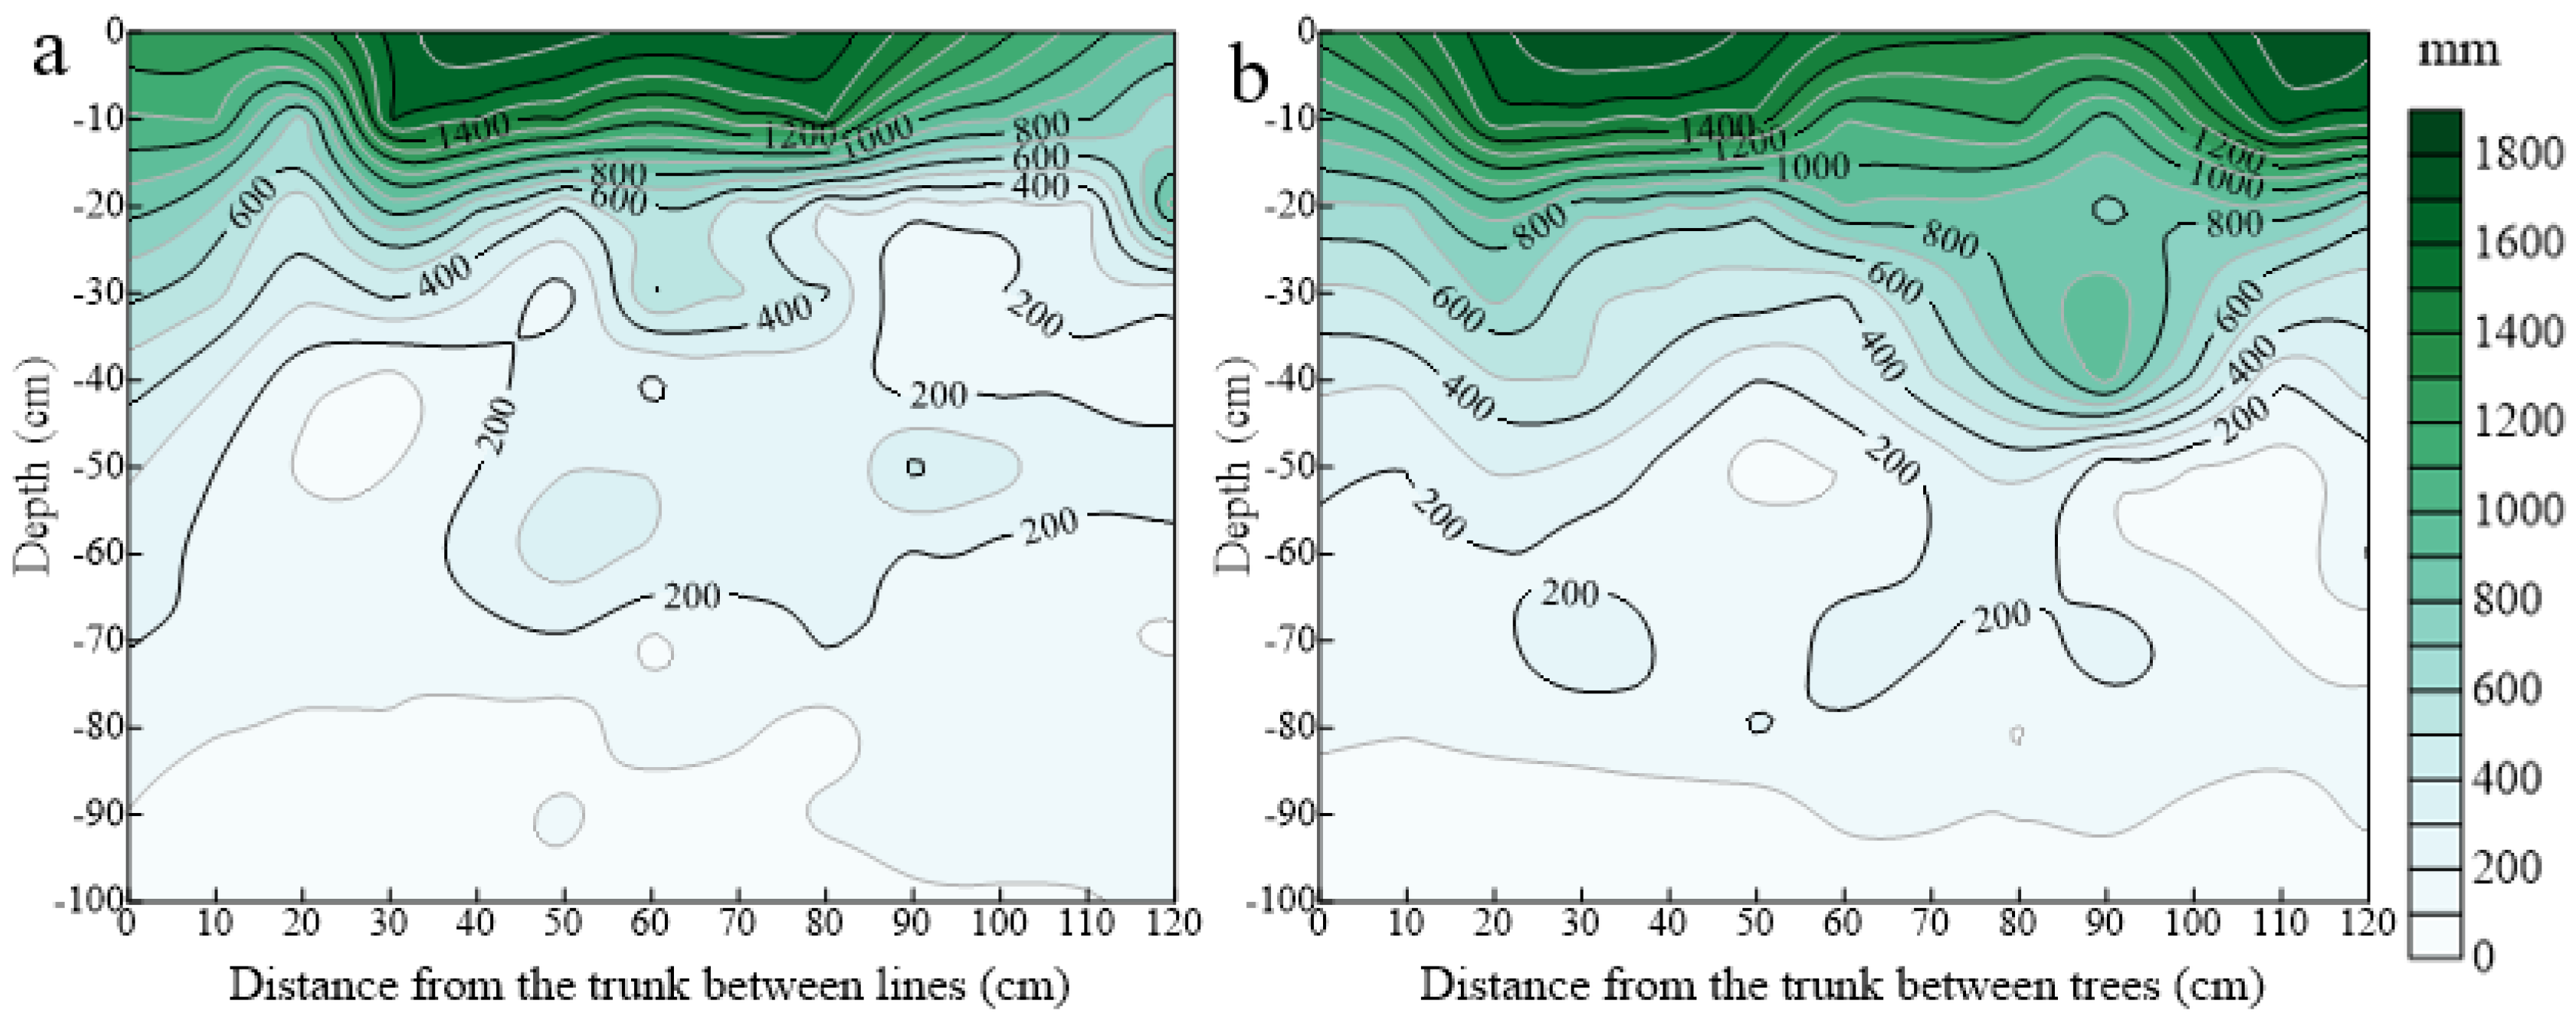
The spatial distribution of the root system of A2 apple trees in the soil profile is shown in Figure 5. The total root length between rows in a specific zone (120 cm length × 100 cm depth × 10 cm width) was 33.22 m, of which the total length of fibrous roots was 32.76 m, accounting for 98.63% of the total length. The total root length between trees within the row in a specific zone was 44.35 m, among which the fibrous roots were 43.43 m long, accounting for 97.91% of the total length. The roots were longer in the soil between trees within the row than between rows mainly because of ridging between trees within the row.
The area with a root length greater than 400 mm per cubic decimeter (mm/dm3) between rows was mainly to the 30 cm depth, whereas the area with a root length greater than 400 mm/dm3 between trees within the row was mainly concentrated to the 40 cm depth. The distribution of the root length showed a decreasing trend with the increase in depth at all distances from the tree trunk, and a slight increase in root length in the tested volume of the soil between rows at a depth from 50 to 60 cm was observed, followed by a further downward trend. A small number of roots were found in soil between rows and between trees within the row below an 80 cm depth. At the horizontal distance, the root length distribution decreased with increasing distance from the tree trunk. However, a small increase in root length distribution was observed in the area between trees within the row situated 110 cm from the trunk.
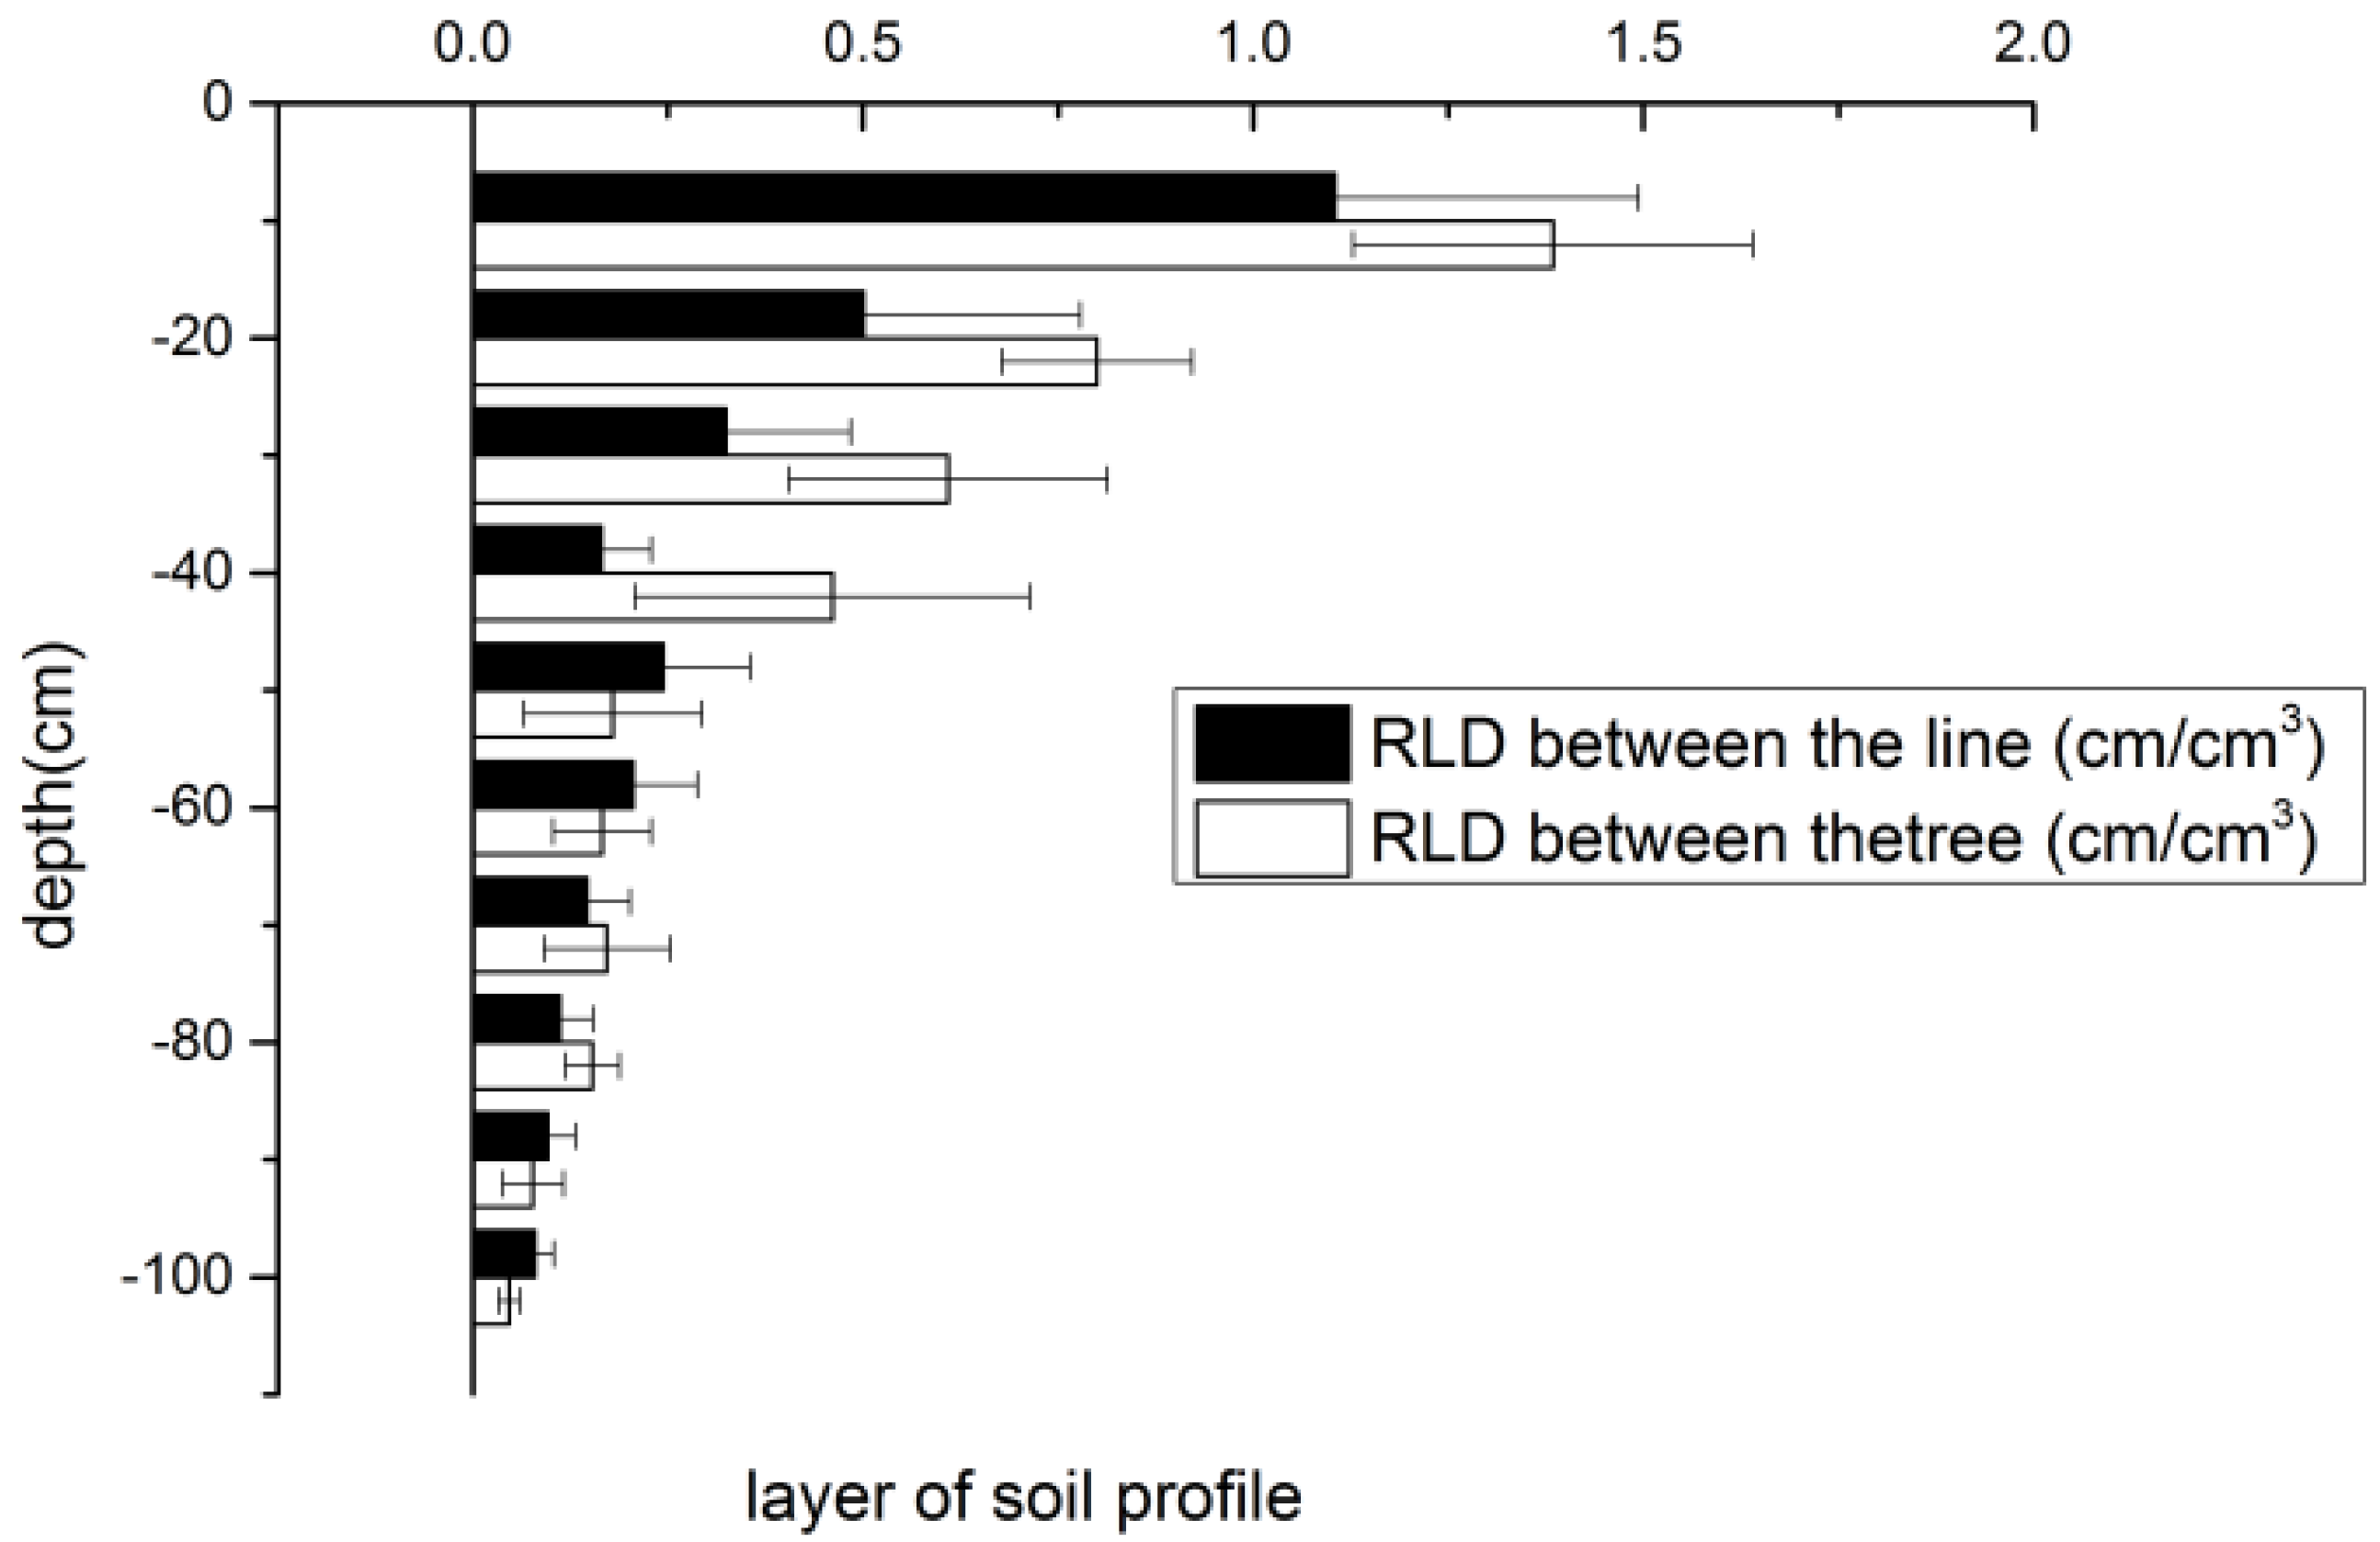
Figure 6 shows the root length density at different depths of soil between rows and between trees within the row. The root length density between rows decreased with increasing soil depth. The maximum root length density was 1.32 cm/cm3, which occurred to a depth of 10 cm below the surface. The root length density was larger in the soil inter- rows at a 30 cm depth, and decreased at 40 cm, whereas the root length density in the soil between trees within the row was larger at 40 cm and decreased at 50 cm. The distributions of root length density in the surface layer between rows and between trees within the row were not consistent. The root length density between trees within the row was significantly higher than the root length density between rows in the top 40 cm layer of the soil. The distribution characteristic of the root length density from a depth of 0 to 100 cm approximately conformed to the logarithmic function model.
3.3. Spatial Distribution of Nitrogen in the Soil Profile
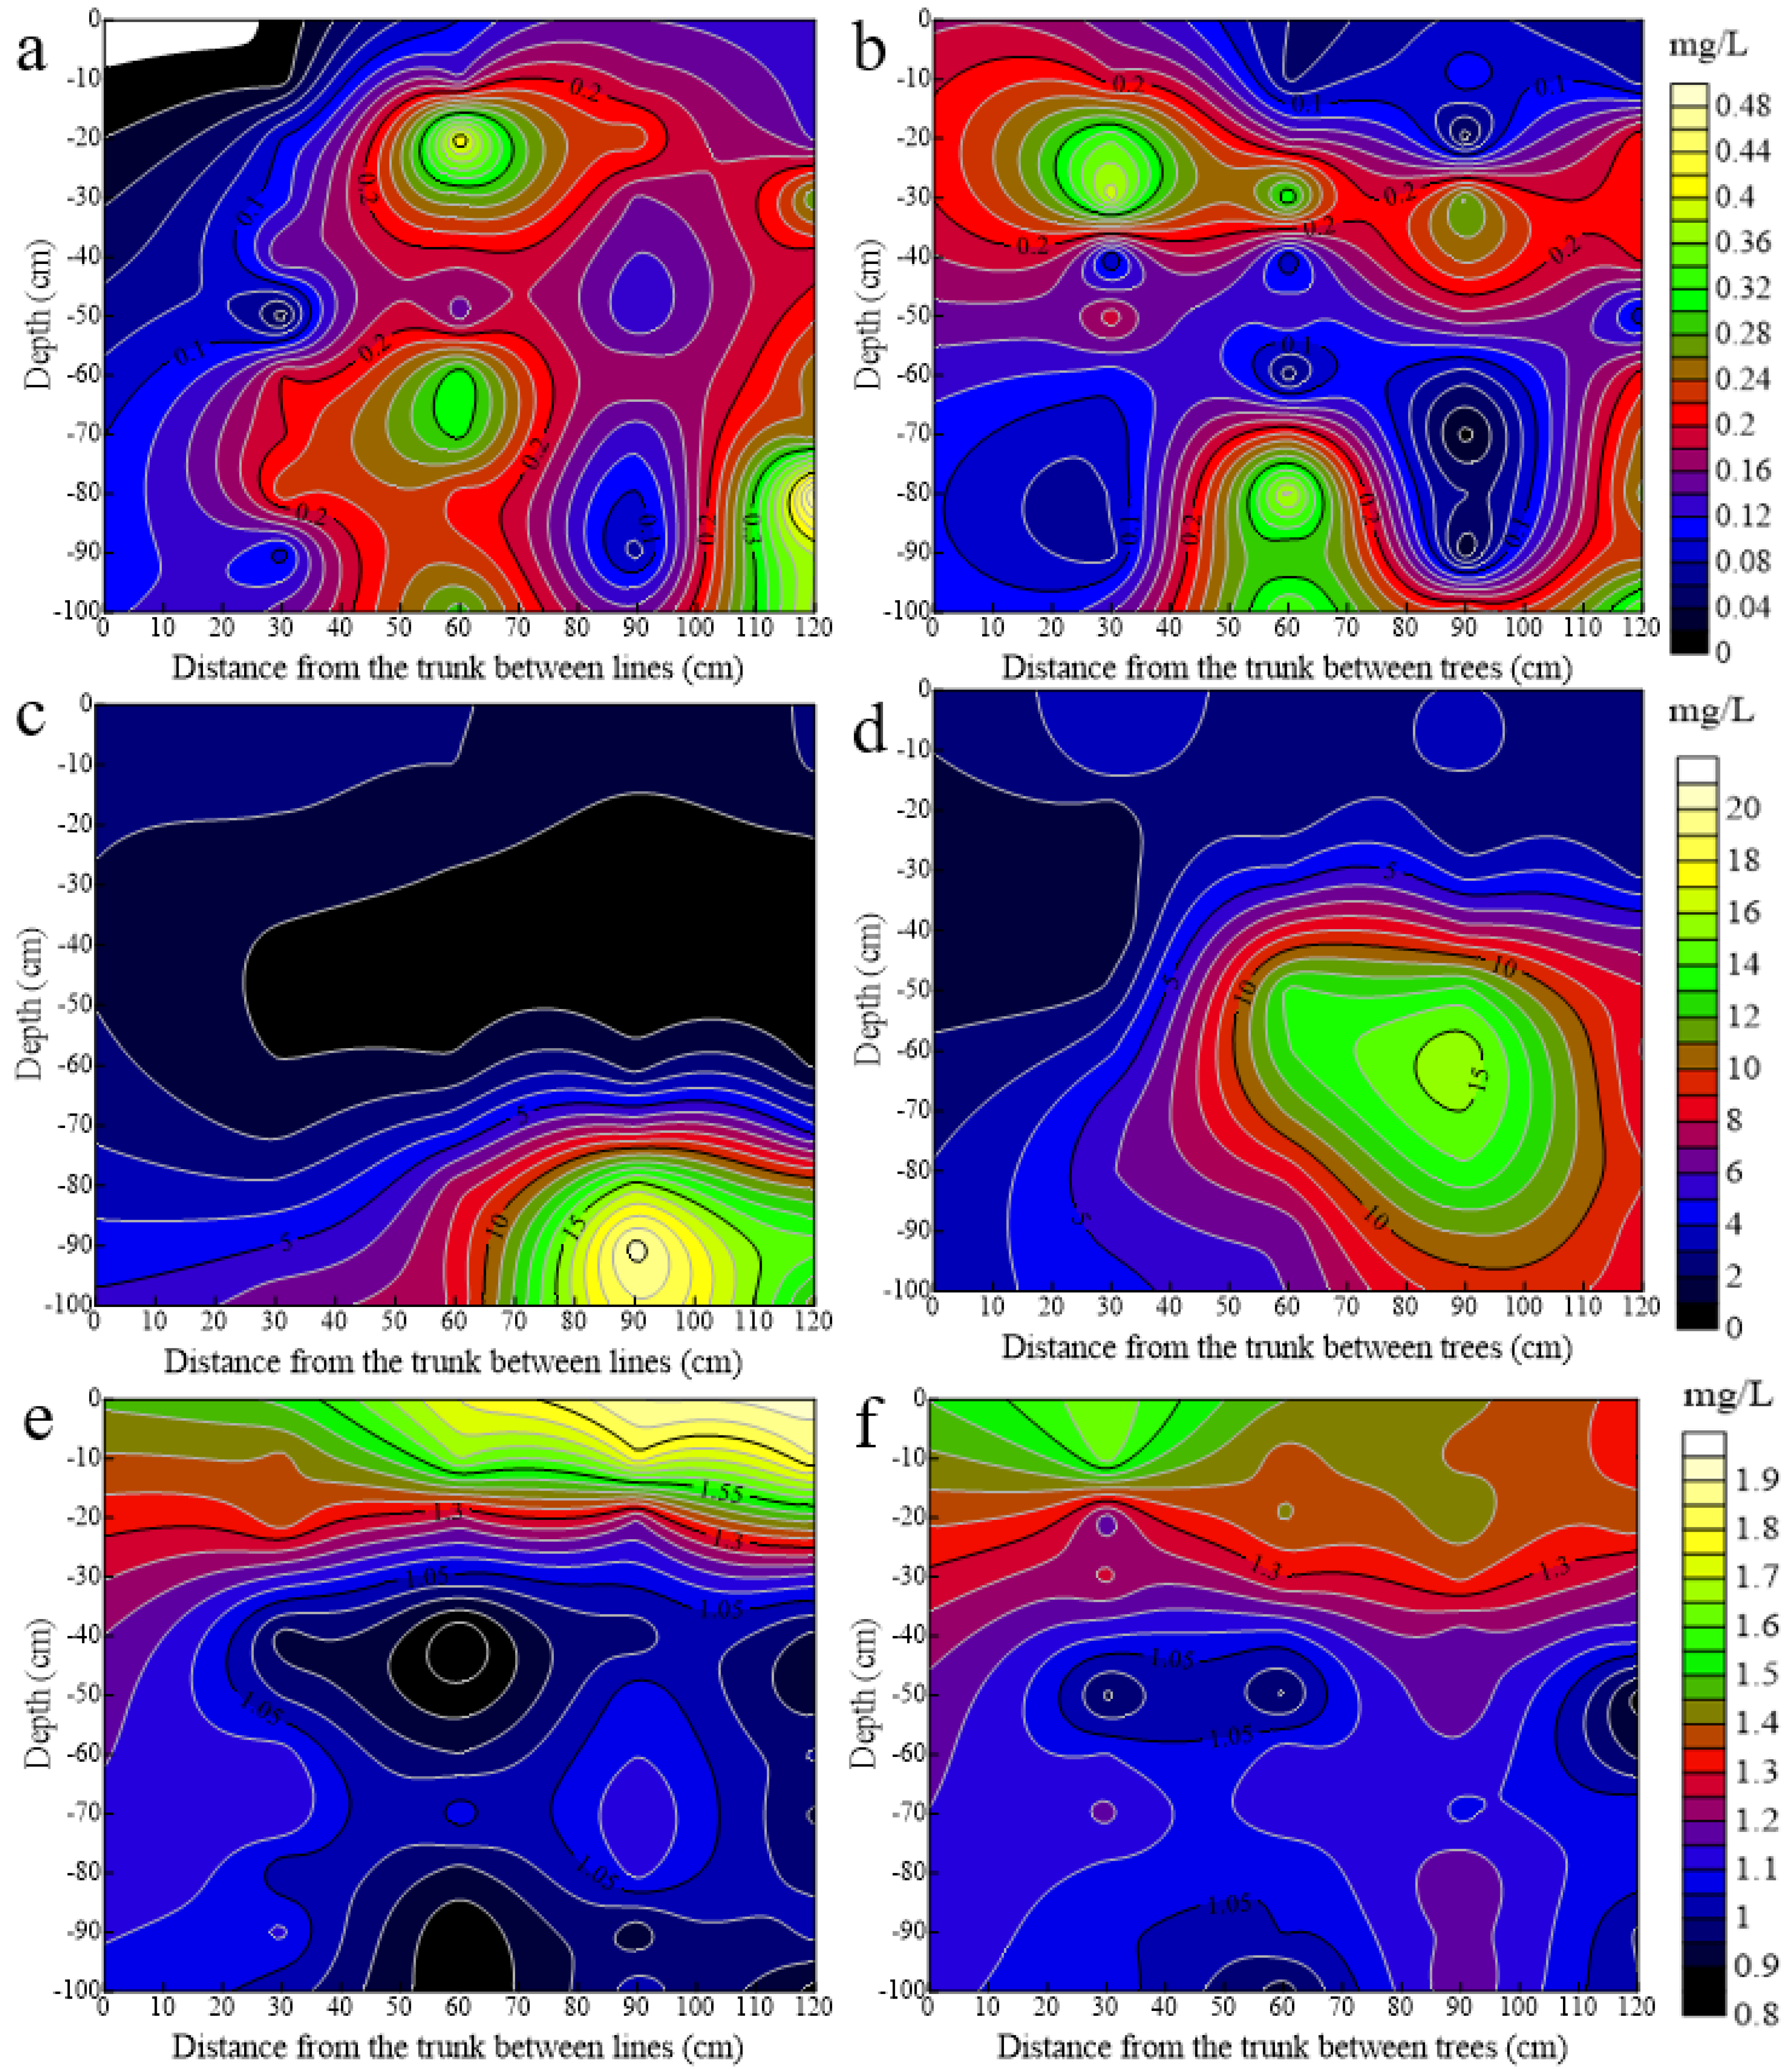
Under the border irrigation and uniform fertilization conditions, the distribution of ammonia nitrogen, nitrate nitrogen, and total nitrogen in the soil to a depth of 100 cm in the zone to around 120 cm is shown in Figure 7. The distribution of ammoniacal nitrogen varied sharply, with higher concentrations in the surface layer at a 20–30 cm depth, and at all depths of the soil profile and a distance of 50–70 cm from the trunk. The unstable nature of ammoniacal nitrogen in drylands led to drastic changes in its concentration distribution. Urea was converted to ammonia by microbial action, and ammonia was converted to nitrate nitrogen by nitrification under dryland aeration conditions. The distribution of nitrate nitrogen concentration was more homogeneous than that of ammonia nitrogen, and the area with a higher concentration was the area away from the tree trunk. The distribution of total nitrogen had a clear stratification effect in the soil profile, with above 1.0 mg/L in the surface layer to a 40 cm depth. The distribution of ammonia and nitrate in the soil originated from inter-rows did not match that found in the soil located between trees within the row. The results showed that the absorption efficiencies of ammonia and nitrate apple roots were not the same. The distribution of nitrate nitrogen concentration followed an opposite trend to that obtained for the root length density, and was lower in the region with a higher root density.
3.4. Correlation of Water Content, Nitrogen Content, and Particle Composition with the Root Length Density of Apple Trees
Table 1 shows the correlation of the root length density with the soil moisture content, nitrate nitrogen content, total nitrogen content, and median soil particle size. In general, the strength of the correlation of the root length density with the four factors was ranked from highest to lowest as follows: total nitrogen content (0.741) > median soil particle size (0.43) > nitrate nitrogen content (−0.36) > moisture content (−0.273). The correlation between root length and nitrate content or particle size in the inter-row soil was not high, but the correlation between the aforementioned four factors and root length in the soil between trees within the row at different distances from the tree trunk was good. The distribution of nitrate was negatively correlated with the root length density, where a denser root distribution led to the absorption of more nitrate. Hence, the nitrate concentration was reduced. However, the roots had a positive correlation with the water content in five of eight regions. The correlation between trees within the row was higher than the correlation between rows.
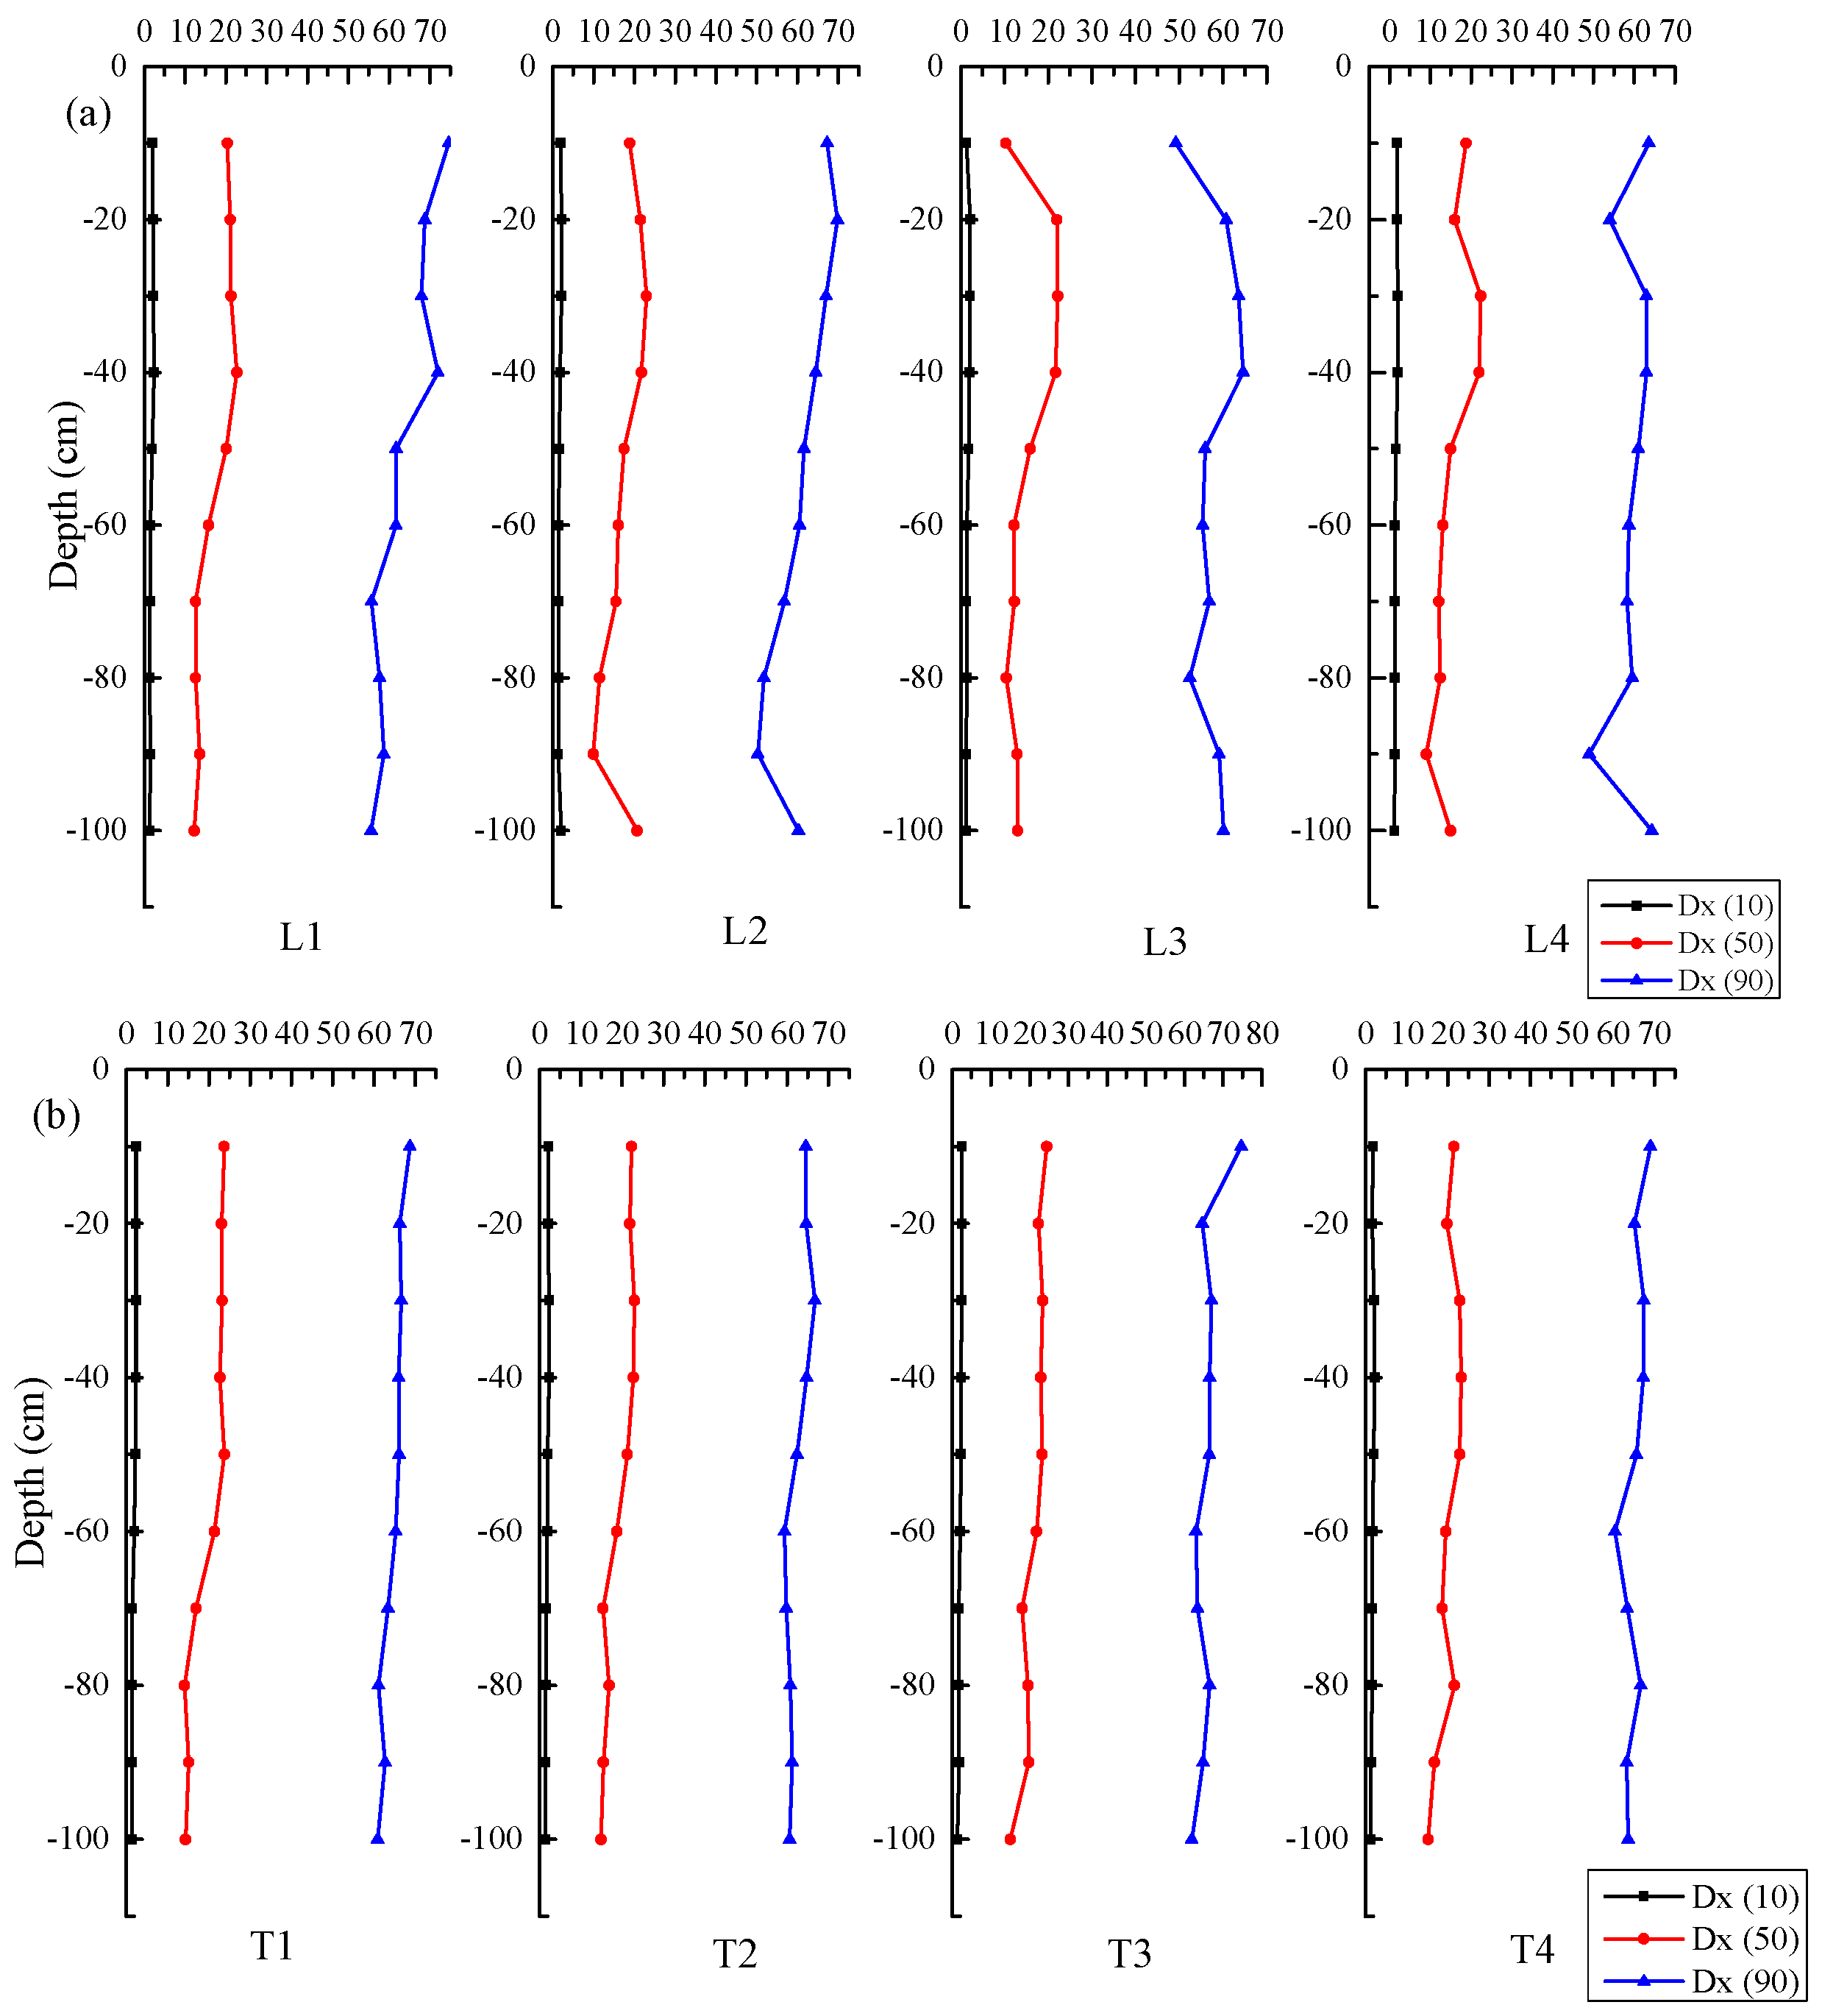
The results of the soil particle size analysis at different positions between rows and trees within the row are shown in Figure 8. The percentage eigenvalues of soil particle size showed a decreasing trend with increasing depth. Soil percentage particle size values between rows varied significantly with depth, whereas those between trees within the row varied more gently with depth. The D50 eigenvalues of soil particle size tended to decrease significantly below a 40 cm depth, and the D50 eigenvalues of inter-row soil tended to decrease faster than those in the inter-tree soil within the row. The soil percentage grain size values between rows were smaller than those between trees within the row, in terms of both D90 and D50. Therefore, the variation in soil particle diameter between rows was greater and the share of larger particles was smaller. The reason for this is that the Yellow River water used for irrigation contains sediment. Due to the sedimentation effect of sedimentation ponds and channels at all levels of water lifting stations, the sediment that also entered the field with the Yellow River water had a small particle size. This smaller grain size sediment was mainly deposited in the field in the soil between the rows, which led to a decrease in the median particle size of the soil particles between the rows.
3.5. Affect of Root-Zone Water and Nitrogen to Roots with Different Diameters
3.5.1. Relationship between Soil Moisture Content and Response of Roots with Different Diameters
The root diameter of apple trees was mainly in the range from 0 to 5 mm. The sampled roots were divided according to different diameters (1, 1.5, 2, 2.5, and 3 mm) to study the response of water and nitrogen to different root diameters. The correlation among root systems with different diameters was analyzed by the mean value of soil moisture, ammonia nitrogen, and nitrate nitrogen. Table 2 shows the correlation between the roots and water content of each measuring point according to different diameters. Roots with a diameter less than 3 mm are called fibrous roots, and are mainly responsible for the absorption and transfer of water and nutrients from the soil. Roots with a diameter of less than 3 mm were significantly correlated with the water content detected in L2, L4, T1, T2, and T4, with a maximum correlation of 0.948. Roots with a diameter less than 2.5 mm had the same correlation with water content as roots with a diameter less than 3 mm, whereas roots with a diameter less than 3 mm contained less than those 2.5 mm in diameter (Table 2). Therefore, the correlation between root diameter less than 3 mm and water content was driven by root diameter less than 2.5 mm. The correlation between roots with a diameter less than 2 mm and those with a diameter less than 1.5 mm and water content was compared with that between roots with a diameter less than 2.5 mm and water content. In fact, the influence of roots with a diameter less than 2.5 mm on water content change was mainly concentrated in the range of diameters less than 1.5 mm, and the root system in the range of 1.5 mm was crucial to the distribution and variation in water. Among roots with a diameter less than 1.5 mm, roots with a diameter less than 1 mm were important for water absorption in the ranges from 0 to 1 mm and from 1 to 1.5 mm. This result was consistent with a previous finding that the root water conduction rate was higher when the root cortex was thinner [38].
3.5.2. Correlation between Nitrate Nitrogen Content and Root Systems with Different Diameters
Table 3 shows the correlation between nitrate distribution and root systems with different diameters. The correlation between nitrate nitrogen content and the root system was significantly different from that of root distributions between rows and between trees within the row, and the areas with high correlation were mainly concentrated in regions between trees within the row. This result indicated that under the border irrigation conditions of the Yellow River, the response of nitrate nitrogen content to the root system was greatly affected between rows. In contrast, human factors between rows led to compactness, which made the root development between rows inferior to that between trees within the row. The distribution of nitrate nitrogen was more sensitive to roots with a diameter of less than 2 mm. Moreover, in the range of 2 mm, the roots were important in the absorption of nitrate nitrogen irrespective of the fact that the diameter of the roots was from 0 to 1 mm or from 1 to 2 mm.
4. Discussion
The results of this study indicate that the border irrigation method would lead to uneven soil moisture distribution within the root zone. The soil moisture content between rows was, on average, 5% higher than the soil moisture content between trees within the row. It should be noted that under local rainfall and irrigation conditions, the soil moisture between the rows remained high, except at a distance of 120 cm. Soil moisture at 120 cm from the trunk between rows was even lower than at any distance between trees within the row. Although the soil between the rows receives more water during irrigation, the lack of water retention by the root system means that water is quickly lost through percolation and evaporation.
The distribution pattern of the root system was consistent with the study of [39], who pointed out that fruit tree roots were mainly distributed within 10 to 40 cm and that a small number of roots were found below 80 cm. In the border irrigation experiment, irrigation water was poured between rows. The irrigation water between trees within the row was significantly less, but the distribution of the root system between trees within the row was larger than that between rows. These results were consistent with other scholars. When the soil water content dropped, root growth increased [40]. Continuous drought promoted lateral root growth, resulting in an increase in root length [41,42]. This pattern was because the root growth genes were expressed more fully between trees within the row to increase the root length and density, and thus absorb more water [43,44].
The comparison of nitrogen concentration distribution and water distribution between rows and trees within the row showed that the soil between the trees within the row had high levels of ammonia nitrogen, nitrate nitrogen, and total nitrogen, but low soil moisture content. Ammonia nitrogen, nitrate nitrogen, and total nitrogen contents were lower between rows, but the soil moisture content was higher. The absorption of nitrogen by the root system was closely related to soil moisture, and the increase in water was conducive to the absorption of nitrogen by the root system. The absorption of nitrogen is a complex process related to the absorption area and water content of the root system, and hence the absorption level cannot be determined by any single factor [45,46]. The correlation found for the soils between trees within the row was higher than the correlation for the soils between rows, which was consistent with the negative correlation between the root systems. The root system grew under mild water stress between trees within the row, and the root length density and the ability to absorb water and nitrogen increased [28,47]. This finding could be explained by the biological feedback regulation theory that helped resist the influence of adverse environmental factors, i.e., the root system tended to absorb more water and mineral nitrogen in the zone with limited moisture and nitrogen content.
From the results of this paper, it is clear that irrigation with Yellow River water affects the particle size ratio of soil particles in the field. The direct result was an increase in soil particle fineness. The increase in the content of fine-grained soil particles leads to an increase in the specific surface area of the soil, and an increase in the compactness of the soil. The results of this paper also show that the grain size was positively correlated with the root distribution, and that more dense roots are distributed in the position with larger soil particle size. The soil with a larger particle size and a higher void ratio was more conducive to the growth and development of roots. After the soil became denser, the porosity decreased, which was detrimental to water infiltration and root development. In fact, the effect of sediment on soil was long-term and multifaceted. However, the experimental work in this paper was limited, and more long-term and comprehensive research work is needed on the effect of Yellow River sediment on soil, water, and plants in the field.
5. Conclusions
A border irrigation experiment was performed to determine the relationship between the distribution of roots, soil water, and nitrogen. (1) The soil moisture content between rows was on average 5% higher than the soil moisture content between trees within the row; soil moisture variability between rows was moderate, and soil moisture variability between trees within the row was weak. (2) Border irrigation caused a logarithmic distribution of roots in the vertical direction of the soil profile. The distribution of roots in the soil between trees within the row was significantly larger than that in the soil between rows. (3) The distribution of the root system was negatively correlated with the distribution of water and nitrate nitrogen. (4) Irrigation with Yellow River water led to an increase in fine particles in the field soil, an increase in specific surface area, and a decrease in porosity. (5) The response of root development to water and nitrogen distribution further indicated that the specific roots with a diameter less than 1.5 mm were related to water uptake capability, and the roots with a diameter less than 2.0 mm were related to nitrate nitrogen uptake capability. This study provides a reference for further understanding the water and nitrogen absorption functions of roots of different diameters.
Author Contributions
W.W. conceived and designed the experiments; F.W. and Y.W. performed the experiments and analyzed the data; F.W., R.L. and W.W. wrote and revised the paper. All authors have read and agreed to the published version of the manuscript.
Funding
This research was funded by National Key R&D Program of China, grant number 2016YFC0400102, 2016YFC0403102.
Institutional Review Board Statement
Not applicable.
Informed Consent Statement
Not applicable.
Data Availability Statement
Data available upon request due to privacy and ethical restrictions.
Conflicts of Interest
The authors declare no competing interest.
References
- Zhang, L.X.; Zhao, Z.L. Research on water management pattern in Fuji apple orchard under different annual precipitations on Weibei rainfed highland. Agric. Res. Arid. Areas 2001, 1, 26–32. [Google Scholar]
- Hernández, A.; Lacasta, C.; Pastor, J. Effects of different management practices on soil conservation and soil water in a rainfed olive orchard. Agric. Water Manag. 2005, 77, 232–248. [Google Scholar] [CrossRef]
- Liao, R.; Wu, W.; Hu, Y.; Xu, D.; Huang, Q.; Wang, S. Micro-irrigation strategies to improve water-use efficiency of cherry trees in Northern China. Agric. Water Manag. 2019, 221, 388–396. [Google Scholar] [CrossRef]
- Zhang, Y.; Wu, F.Q.; Zhang, J. Study on Topsoil Water Characteristics of High Quality Apple Orchard in Shaanxi Province. Acta Agric. Boreali-Occident. Sin. 2010, 19, 91–95. [Google Scholar]
- Liu, C.; Du, T.; Li, F.; Kang, S.; Li, S.; Tong, L. Trunk sap flow characteristics during two growth stages of apple tree and its relationships with affecting factors in an arid region of northwest China. Agric. Water Manag. 2011, 104, 193–202. [Google Scholar] [CrossRef]
- Riga, P.; Charpentier, S. Simulation of nitrogen dynamics in an alluvial sandy soil with drip fertigation of apple trees. Soil Use Manag. 2006, 15, 34–40. [Google Scholar] [CrossRef]
- Yang, Q.; Zhang, F.; Li, F. Effect of different drip irrigation methods and fertilization on growth, physiology and water use of young apple tree. Sci. Hortic. 2011, 129, 119–126. [Google Scholar] [CrossRef]
- Barco, A.; Maucieri, C.; Borin, M. Root system characterization and water requirements of ten perennial herbaceous species for biomass production managed with high nitrogen and water inputs. Agric. Water Manag. 2018, 196, 37–47. [Google Scholar] [CrossRef]
- Tawaraya, K.; Horie, R.; Wagatsuma, T.; Saito, K.; Oikawa, A. Metabolite profiling of shoot extract, root extract, and root exudate of rice under nitrogen and phosphorus deficiency. Soil Sci. Plant Nutr. 2018, 64, 312–322. [Google Scholar] [CrossRef]
- Tsoulias, N.; Gebbers, R.; Zude-Sasse, M. Using data on soil ECa, soil water properties, and response of tree root system for spatial water balancing in an apple orchard. Precis. Agric. 2019, 21, 522–548. [Google Scholar] [CrossRef]
- Wright, D.E.J.; Cline, J.A.; Earl, H.J. Physiological responses of four apple (Malus × domestica Borkh.) rootstock genotypes to soil water deficits. Can. J. Plant Sci. 2019, 99, 510–524. [Google Scholar] [CrossRef]
- Zhong, Y.; Fei, L.; Li, Y.; Zeng, J.; Dai, Z. Response of fruit yield, fruit quality, and water use efficiency to water deficits for apple trees under surge-root irrigation in the Loess Plateau of China. Agric. Water Manag. 2019, 222, 221–230. [Google Scholar] [CrossRef]
- Zhang, S.Y.; Zhang, G.C.; Gu, S.Y.; Xia, J.B.; Zhao, J.K. Critical responses of photosynthetic efficiency of goldspur apple tree to soil water variation in semiarid loess hilly area. Photosynthetica 2010, 48, 589–595. [Google Scholar] [CrossRef]
- Zhang, Y.; Xie, Y.S.; Jiang, Q.L. Spatial heterogeneity of soil moisture in apple orchards with different productivity level. Chin. J. Ecol. 2010, 29, 1326–1332. [Google Scholar]
- Zhang, L.; Wang, Y.Q.; Shi, Z.L. Characteristics of spatio-temporal variation of soil moisture in Weibei orchards in dry seasons. Agric. Res. Arid. Areas 2012, 30, 83–89. [Google Scholar]
- Wang, Y.P.; Han, M.Y.; Zhang, L.S. Spatial Characteristics of Soil Moisture of Apple Orchards in the Loess Plateau of Shaanxi Province. Sci. Silvae Sin. 2013, 49, 16–25. [Google Scholar]
- Ran, W.; Xie, Y.S.; Hao, M.D. Study on Change of Soil Water in Orchards of Different Planting-life in Gully Region of Loess Plateau. Acta Agric. Boreali-Occident. Sin. 2008, 27, 229–233. [Google Scholar]
- Sun, G.Z.; Zhao, J.B. Study on soil moisture content under artificial vegetation in Changwu of Xianyang county in spring. J. Shaanxi Norm. Univ. (Nat. Sci. Ed.) 2008, 2, 97–101. [Google Scholar]
- Meng, Q.; Wang, J.; Wu, F.; Zhang, Q. Soil moisture utilization depth of apple orchard in Loess Plateau. Trans. Chin. Soc. Agric. Eng. 2012, 28, 65–71. [Google Scholar]
- Gao, J.M.; Lv, M.C.; Deng, Z.; Li, Y.; Hu, L.; Zhong, Z.B. Spatial Distribution of Water and Nitrogen under Different Strip-border Fertigation. J. Irrig. Drain. 2019, 38, 56–62. [Google Scholar]
- Bai, M.J.; Xu, D.; Li, Y.N.; Zhang, S.H. Spatial and temporal distribution of nitrogen in surface water and soil under scattering and fertigating ammonium-sulphate for border irrigation. Trans. Chin. Soc. Agric. Eng. 2011, 8, 19–24. [Google Scholar]
- Hao, Z.Y.; Yang, P.Y.; Liu, H.L. Experimental investigation on root system distribution of apple tree. J. China Agric. Univ. 1998, 3, 63–66. [Google Scholar]
- Lei, S.J. Research of Apple Root Distribution in the Platform Field Soil. J. Staff. Work. Univ. 2013, 4, 97–99. [Google Scholar]
- Lei, S.J.; Zhao, Y.L. Influence on apple root system distribution in the platform field coastal salinized soil. Soil Fertil. Sci. China 2014, 4, 87–90. [Google Scholar]
- Li, H.F.; Lv, D.G.; Li, L.G. Evolvement of Root System Architecture in Apple. Acta Agric. Boreali-Sin. 2009, 24, 323–326. [Google Scholar]
- Wang, L.X.; Mou, P.P.; Jones, R.H. Nutrient foraging via physiological and morphological plasticity in three plant species. Can. J. For. Res.-Rev. Can. Rech. For. 2006, 36, 164–173. [Google Scholar] [CrossRef]
- Benjamin, J.G.; Nielsen, D.C. Water deficit effects on root distribution of soybean, field pea and chickpea. Field Crops Res. 2006, 97, 248–253. [Google Scholar] [CrossRef]
- Abdellaoui, A.; Talouizte, A. Effect of previous nitrogen starvation on NO3− and NH4+ uptake and assimilation associated with the endogenous soluble carbohydrate utilization in Moroccan wheat seedlings. J. Plant Nutr. 2001, 24, 1995–2007. [Google Scholar] [CrossRef]
- Hodge, A. The plastic plant: Root responses to heterogeneous supplies of nutrients. New Phytol. 2004, 162, 9–24. [Google Scholar] [CrossRef]
- Lynch, J.P. Steep, cheap and deep: An ideotype to optimize water and N acquisition by maize root systems. Ann. Bot. 2013, 112, 347–357. [Google Scholar] [CrossRef] [Green Version]
- Bengough, A.G.; Mc Kenzie, B.; Hallett, P.; Valentine, T. Root elongation, water stress, and mechanical impedance: A review of limiting stresses and beneficial root tip traits. J. Exp. Bot. 2011, 62, 59–68. [Google Scholar] [CrossRef] [PubMed] [Green Version]
- Marshall, J.D.; Waring, R.H. Predicting Fine Root Production and Turnover by Monitoring Root Starch and Soil Temperature. Can. J. For. Res. 1985, 15, 791–800. [Google Scholar] [CrossRef]
- Wei, X.; Zhang, G.Z. Progress and Prospect in the Main Research Realms of Tree Fine Roots. Chin. Agric. Sci. Bull. 2008, 5, 143–147. [Google Scholar]
- Wen, Y.J.; Li, G.H.; Liu, Y.X.; Gao, X.; Wang, H. Determination nitrogen in the Kjeldahl digests of plant samples by continuous flow analyzer in comparison with automated distillation-titration instrument. Soil Fertil. Sci. China 2015, 6, 146–151. [Google Scholar]
- Li, J.B.; Wang, W.H. Study on Spatial Variability of Soil Water Content and Soil Water Migration in Small-scale Greenhouse. J. Yantai Univ. (Nat. Sci. Eng. Ed.) 2019, 4, 345–351+408. [Google Scholar]
- Li, C.M.; Chen, H.S.; Xu, Q.X.; Wu, P.; Fu, Z.Y. Spatial variability of soil moisture on hillslope in typical karst peak-cluster depression areas. Carsologica Sin. 2018, 2, 159–167. [Google Scholar]
- Liu, H.W.; Gao, F.; Yu, Z.B.; Gao, F.H.; Xiang, L. Study on temporal-spatial variability of soil moisture content on hillslope in a humid area. Water Resour. Prot. 2016, 5, 17–23. [Google Scholar]
- Rieger, M.; Litvin, P. Root system hydraulic conductivity in species with contrasting root anatomy. J. Exp. Bot. 1999, 50, 201–209. [Google Scholar] [CrossRef]
- Zhao, L.J.; Zhang, L.J.; Zhao, S.C. Relationship between root and water content of fruit tree. Hebei Fruits 2007, 1, 1–4. [Google Scholar]
- Guo, X.P.; Kang, S.Z.; Suo, L.P. Effects of Regulated Deficit Irrigation on Root Growth in Maize. J. Irrig. Drain. 2001, 20, 25–27. [Google Scholar]
- Li, W.Y.; Zhang, S.Q.; Ding, S.Y.; Shan, L. Root morphological variation and water use in alfalfa under drought stress. Acta Ecol. Sin. 2010, 19, 5140–5150. [Google Scholar]
- Hao, S.R.; Guo, X.P.; Wang, W.M.; Zhang, L.J.; Wang, Q.; Wang, Q.M.; Liu, Z.P. Effects of water stress in tillering stage and re-watering on rice root growth. Agric. Res. Arid. Areas 2007, 25, 149–152. [Google Scholar]
- Zhang, X.Y.; Wang, Y.; Chen, J.; Chen, A.J.; Wang, L.Y.; Guo, X.Y.; Niu, Y.L.; Zhang, X.Y.; Chen, L.D.; Gao, Q. Effects of Soil Water and Nitrogen on Plant Growth, Root Morphology and Spatial Distribution of Maize at the seedling stage. Sci. Agric. Sin. 2019, 1, 34–44. [Google Scholar]
- Eapen, D.; Barroso, M.L.; Ponce, G.; Campos, M.E.; Cassab, G.I. Hydrotropism: Root growth responses to water. Trends Plant Sci. 2005, 10, 44–50. [Google Scholar] [CrossRef] [PubMed]
- Hong, G.Y. The response of leymus chinensis population root system to waterand nitrogen gradient degraded grassland. Inn. Mong. Univ. 2013, 1, 73–78. [Google Scholar]
- Hu, W.; Liu, J.Z.; Di, Q.; Zhang, Y.M.; Tian, S.B. Relationship Between Different Water Conditions and Nitrogen Leaching in Tobacco Field of Bijie. Chin. Agric. Sci. Bull. 2015, 1, 63–68. [Google Scholar]
- Songsri, P.; Jogloy, S.; Vorasoot, N.; Akkasaeng, C.; Patanothai, A.; Holbrook, C. Root distribution of drought-resistant peanut genotypes in response to drought. J. Agron. Crop Sci. 2008, 194, 92–103. [Google Scholar] [CrossRef]
Figure 1.
Schematic diagram of the experiment: (a) location of the study site; (b) general situation of the experimental apple orchard; and (c) arrangement of moisture-monitoring tubes.
Figure 1.
Schematic diagram of the experiment: (a) location of the study site; (b) general situation of the experimental apple orchard; and (c) arrangement of moisture-monitoring tubes.

Figure 2.
The spatiotemporal distribution of soil moisture between rows and between trees within the row in 2015. (−20 indicates 20 cm below the ground).
Figure 2.
The spatiotemporal distribution of soil moisture between rows and between trees within the row in 2015. (−20 indicates 20 cm below the ground).


Figure 3.
Spatiotemporal distribution of soil moisture between rows and between trees within the row in 2016.
Figure 3.
Spatiotemporal distribution of soil moisture between rows and between trees within the row in 2016.


Figure 4.
Coefficient of variation for (a) soil moisture between rows and between trees within the row at different depths and (b) annual average soil moisture data for different probes.
Figure 4.
Coefficient of variation for (a) soil moisture between rows and between trees within the row at different depths and (b) annual average soil moisture data for different probes.

Figure 5.
Contour map of root distribution in the soil from the top to 100 cm depth: (a) between rows and (b) between trees within the row in October 2016.
Figure 5.
Contour map of root distribution in the soil from the top to 100 cm depth: (a) between rows and (b) between trees within the row in October 2016.

Figure 6.
Root length density at different depths between rows and between trees within the row for A2 in October 2016. The error bars represent the respective standard errors for N = 8.
Figure 6.
Root length density at different depths between rows and between trees within the row for A2 in October 2016. The error bars represent the respective standard errors for N = 8.

Figure 7.
Distribution of nitrogen between rows and trees within the row in the apple root region in October 2016: (a) ammonia nitrogen between rows; (b) ammonia nitrogen between trees within the row; (c) nitrate nitrogen between rows; (d) nitrate nitrogen between trees within the row; (e) total nitrogen between rows; and (f) total nitrogen between trees within the row.

Figure 8.
The cumulative percentage particle size distribution of soil particles in different areas of the root zone, (a): L1–L4, (b): T1–T4. (DX (10), DX (50), and DX (90) indicate that the mass of particles smaller than the particle size accounts for 10%, 50%, and 90%, respectively, of the total mass of particles).


Table 1.
Correlation of the root system, with the moisture content, nitrate content, and particle size in the apple root region.
Table 1.
Correlation of the root system, with the moisture content, nitrate content, and particle size in the apple root region.
| Distance | Correlation with Water Content | Correlation with Nitrate Content | Correlation with Particle Size | Correlation with Total Nitrogen Content |
|---|---|---|---|---|
| Root length in L1 | 0.881 ** | −0.105 | 0.621 | 0.883 ** |
| Root length in L2 | 0.950 ** | −0.496 | 0.590 | 0.947 ** |
| Root length in L2 | 0.072 | −0.383 | −0.488 | 0.064 |
| Root length in L2 | −0.625 | −0.375 | 0.040 | −0.622 |
| Root length in T1 | 0.901 ** | −0.304 | 0.693 * | 0.895 ** |
| Root length in T2 | 0.959 ** | −0.710 * | 0.607 | 0.885 ** |
| Root length in T3 | 0.362 | −0.841 ** | 0.718 * | 0.725 * |
| Root length in T4 | 0.829 ** | −0.780 ** | 0.521 | 0.698 * |
| Total | −0.273 * | −0.360 ** | 0.430 ** | 0.741 ** |
** Represents a significant correlation at the level of 0.01, * Represents a significant correlation at the level of 0.05.
Table 2.
Correlation between roots with different diameters and soil moisture content.
| Diameter Range (mm) | L1 | L2 | L3 | L4 | T1 | T2 | T3 | T4 |
|---|---|---|---|---|---|---|---|---|
| 0–1 | −0.801 ** | 0.809 ** | −0.889 ** | −0.953 ** | −0.837 ** | |||
| 1–2 | 0.655 * | −0.721 * | −0.714 * | |||||
| 2–3 | ||||||||
| 3–4 | 0.848 ** | |||||||
| 4 | −0.728 * | |||||||
| 0–1.5 | −0.799 ** | 0.812 ** | −0.887 ** | −0.950 ** | −0.835 ** | |||
| 1.5–3 | ||||||||
| 3–4.5 | 0.734 * | |||||||
| 3.5–5 | −0.679 * | |||||||
| 0–2 | −0.798 ** | 0.814 ** | −0.887 ** | −0.950 ** | −0.834 ** | |||
| 2–4.0 | ||||||||
| 3.5–5 | −0.679 * | |||||||
| 0–2.5 | −0.797 ** | 0.813 ** | −0.888 ** | −0.949 ** | −0.834 ** | |||
| 2.5–5 | ||||||||
| 0–3.0 | −0.797 ** | 0.813 ** | −0.888 ** | −0.949 ** | −0.834 ** | |||
| 2.5–5 |
White space in the table indicates that no significant correlation was achieved. ** Represents a significant correlation at the level of 0.01, * Represents a significant correlation at the level of 0.05.
Table 3.
Correlation between nitrate nitrogen content and roots with different diameters.
| Diameter Range (mm) | L1 | L2 | L3 | L4 | T1 | T2 | T3 | T4 |
|---|---|---|---|---|---|---|---|---|
| 0–1 | −0.673 * | −0.849 ** | −0.738 * | |||||
| 1–2 | −0.765 ** | −0.785 ** | −0.658 * | |||||
| 2–3 | −0.646 * | |||||||
| 3–4 | −0.835 ** | |||||||
| 4–5 | −0.798 ** |
** Represents a significant correlation at the level of 0.01, * Represents a significant correlation at the level of 0.05.
Publisher’s Note: MDPI stays neutral with regard to jurisdictional claims in published maps and institutional affiliations. |
© 2022 by the authors. Licensee MDPI, Basel, Switzerland. This article is an open access article distributed under the terms and conditions of the Creative Commons Attribution (CC BY) license (https://creativecommons.org/licenses/by/4.0/).
Share and Cite
MDPI and ACS Style
Wan, F.; Wu, W.; Liao, R.; Wang, Y. Spatiotemporal Distribution of Water and Nitrogen in Border Irrigation and Its Relationship with Root Absorption Properties. Water 2022, 14, 1253. https://doi.org/10.3390/w14081253
AMA Style
Wan F, Wu W, Liao R, Wang Y. Spatiotemporal Distribution of Water and Nitrogen in Border Irrigation and Its Relationship with Root Absorption Properties. Water. 2022; 14(8):1253. https://doi.org/10.3390/w14081253
Chicago/Turabian StyleWan, Fa, Wenyong Wu, Renkuan Liao, and Yong Wang. 2022. "Spatiotemporal Distribution of Water and Nitrogen in Border Irrigation and Its Relationship with Root Absorption Properties" Water 14, no. 8: 1253. https://doi.org/10.3390/w14081253
Note that from the first issue of 2016, this journal uses article numbers instead of page numbers. See further details here.