
Analysis of Blue Infrastructure Network Pattern in the Hanjiang Ecological Economic Zone in China


1
School of Environmental Studies, China University of Geosciences, Wuhan 430074, China
2
School of Physical Education, China University of Geosciences, Wuhan 430074, China
*
Author to whom correspondence should be addressed.
Water 2022, 14(8), 1234; https://doi.org/10.3390/w14081234
Submission received: 24 February 2022
/
Revised: 7 April 2022
/
Accepted: 9 April 2022
/
Published: 12 April 2022
(This article belongs to the Special Issue Optimal Utilization and Management of Natural Resources)
Abstract
:As a crucial part of urban development, blue infrastructure (BI) provides multiecosystem services. Using the Hanjiang Ecological Economic Zone as the study area, the potential benefits of a BI network were constructed using morphological spatial pattern analysis (MSPA) and minimum cumulative resistance model (MCR) for three periods in order to assess network structure. The main conclusions are: (1) The total BI area of the study location increased at first and then decreased from 2010 to 2020, during which the area of the core and loop was continually rising while the islet and bridge were gradually dropping. These results reveal that landscape fragmentation was well controlled; (2) Both the Integral Index of Connectivity(IIC) and Probability of Connectivity(PC) of the landscape showed an increasing trend, but the integral connectivity level was still low; (3) The comprehensive resistance value decreased gradually from west to east. The potential corridors were concentrated in the middle and lower reaches of the Hanjiang and extended upstream. The amount decreased first and then increased. (4) The structure of the BI network was simple first and then complex, which is in line with changes in the number of BI sources. Thus, changes in the BI network pattern are closely linked to the changes in the study area and the number of BI sources.
1. Introduction
In the context of rapid urbanization and global climate change, cities are facing many challenges such as rapid climate change, frequent flooding, and increased water pollution. BI can be implemented as a sustainable development strategy to address the urban environmental crisis and improve urban resilience, playing a role in all categories of ecosystem services (e.g., supporting, regulating, provisioning, and cultural) [1]. BI is a network of aquatic ecosystems consisting of spaces and corridors covered by water bodies, which include natural or seminatural water bodies and artificially constructed water-bony surfaces [2], such as rivers, lakes, wetlands, natural coastlines, reservoirs, artificial river embankment, artificial watercourses, etc. BI contributes to water purification, flood protection, and overall climate change adaptation, as well as provides various kinds of cultural ecosystem services [3,4,5,6]. BI also plays a key role in improving public health and people’s well-being, promoting regional economic development, and maintaining urban ecosystem services [7,8,9]. However, the installation and use of BI depend on the different development needs of the city, such as alleviating urban flooding [10,11], promoting physical and mental health [12,13], and enhancing biodiversity [14,15], which are ultimately reflected in the design of urban BI. BI can offset the impacts of gray infrastructures, such as hardened roads, building construction, and drainage pipes which are common features in cities experiencing significant urban development. So is BI [3]. However, there is rare evidence proving the value and ability of BI to provide ecosystem services for cities and their human population [16].
In the last two decades, the concept of green infrastructure has gained attention. Apart from BI, green infrastructure also refers to natural or artificial green spaces such as forests, grasslands, plant and animal habitats, and farms that provide a wider range of ecosystem services to better address environmental issues and support human well-being [17,18,19]. Therefore, BI is placed in the broader framework of green infrastructure research, called blue–green infrastructure [20,21]. However, as urbanization is gaining momentum, human activities are more frequent, urban construction is expanding, and water pollution is increasing [22]. Against this backdrop, BI is exposed to fragmentation, and green corridor connections are weakening, in addition to facing the other difficulties associated with great area loss and quality degradation [23]. This phenomenon has been hidden in the framework of the abroad discussion of green infrastructure. Therefore, it is imperative to study the spatial and temporal changes of BI network patterns in the context of rapid urbanization in order to assess its current status. In this manner, the targeted protection and restoration of the sustainable functions of BI ecosystem services can be carried out.
Currently, the main focus of BI research is on its ecological service functions [24,25,26], value estimation [26,27], protection, and space optimization [28,29], with perspectives mainly drawn from environmental science, land management, ecology, and so on. According to the study results, BI is deeply affected by urbanization, and its ecological function is weakening greatly [23,30]. In addition, the number and quality of BI are dropping, which is mainly attributed to the greater need for grey infrastructure, dramatic climate change, and serious pollution associated with organic and inorganic compounds. In this context, building an urban BI network based on the natural capital is seen as the most profitable protection strategy for urban development and a key breakthrough to improving urban ecological services [31,32,33].
In recent years, some experts have researched ecological networks of different kinds and dimensions from the point of view of landscape ecology theory. Several methods and models have been explored, including morphological spatial pattern analysis (MSPA) and minimum cumulative Resistance (MCR), which have been widely adopted [34,35,36]. MSPA identifies ecological regions with high landscape connectivity from the pixel level through land use raster data; thus, the selection of BI sources can be more scientific. In the light of various resistance factors, such as topography and human activities, MCR models simulate the least cost path between sources by combining landscape connectivity indices, graph theory, and gravity models based on the geographic information system (GIS). The existing studies have conducted in-depth explorations in source selection, resistance factor selection, corridor importance identification, and network optimization [37,38], which provide an important reference for this study.
With the high-quality development of China’s economy, increasingly prominent environmental problems have attracted attention within political and academic circles. Under the guiding ideology of regional development integration proposed by the Chinese government, the research on the ecological economy at the scale of river basins has become a frontier hotspot, such as the Yangtze River Delta [39] and the Huaihe River Ecological and Economic Belt [40,41]. However, the crucial strategic value of the Hanjiang Ecological Economic Zone as an important link between the economic development of the central and western regions of China has yet to receive sufficient attention. The Hanjiang Ecological Economic Zone in China has a developed water system with dense rivers and lakes. With the implementation of the Central Line Project of South-to-North Water Diversion in December 2014, the flow of the Hanjiang river’s middle and lower reaches is reduced, and the water level is lowered during the dry period of the river. The ecological environment has been exposed to strong negative influences [42]. In order to ensure the water volume of the Hanjiang river’s middle and lower reaches, the plan for a cascade reservoir and Yangtze River diversion to the Hanjiang River has also been carried out. In spite of this, the Hanjiang River’s middle and lower reaches are still water-starved, and the ecological environment faces continual deterioration [43]. In addition, as a result of rapid urbanization, the continuous outward expansion will inevitably lead to the conflict between eco-environmental protection and economic development and bring serious challenges to the development of the region.
In this study, software platforms such as ArcGIS, The Environment for Visualizing Images (ENVI), Guidos, and Conefor are applied to the Hanjiang Ecological Economic Zone. The MSPA method was adopted to identify and extract the core areas that are important for species migration and energy exchange. The landscape connectivity index was utilized to assess landscape connectivity within the core area, and patches in the core area with a high patch importance index were regarded as BI sources. Based on the MCR Model, it simulates the potential corridors and adopts a gravity model to identify important corridors for the purpose of constructing a potential BI network in the study area. Thus the temporal and spatial pattern variation of the BI network in the Hanjiang Ecological Economic Zone from 2010 to 2020 was explored. The research results can provide an important reference and basis for the optimization of the BI network pattern in the Hanjiang Ecological Economic Zone and provide a reference for the planning of BI network patterns in other regions.
2. Materials and Methods
2.1. Study Area
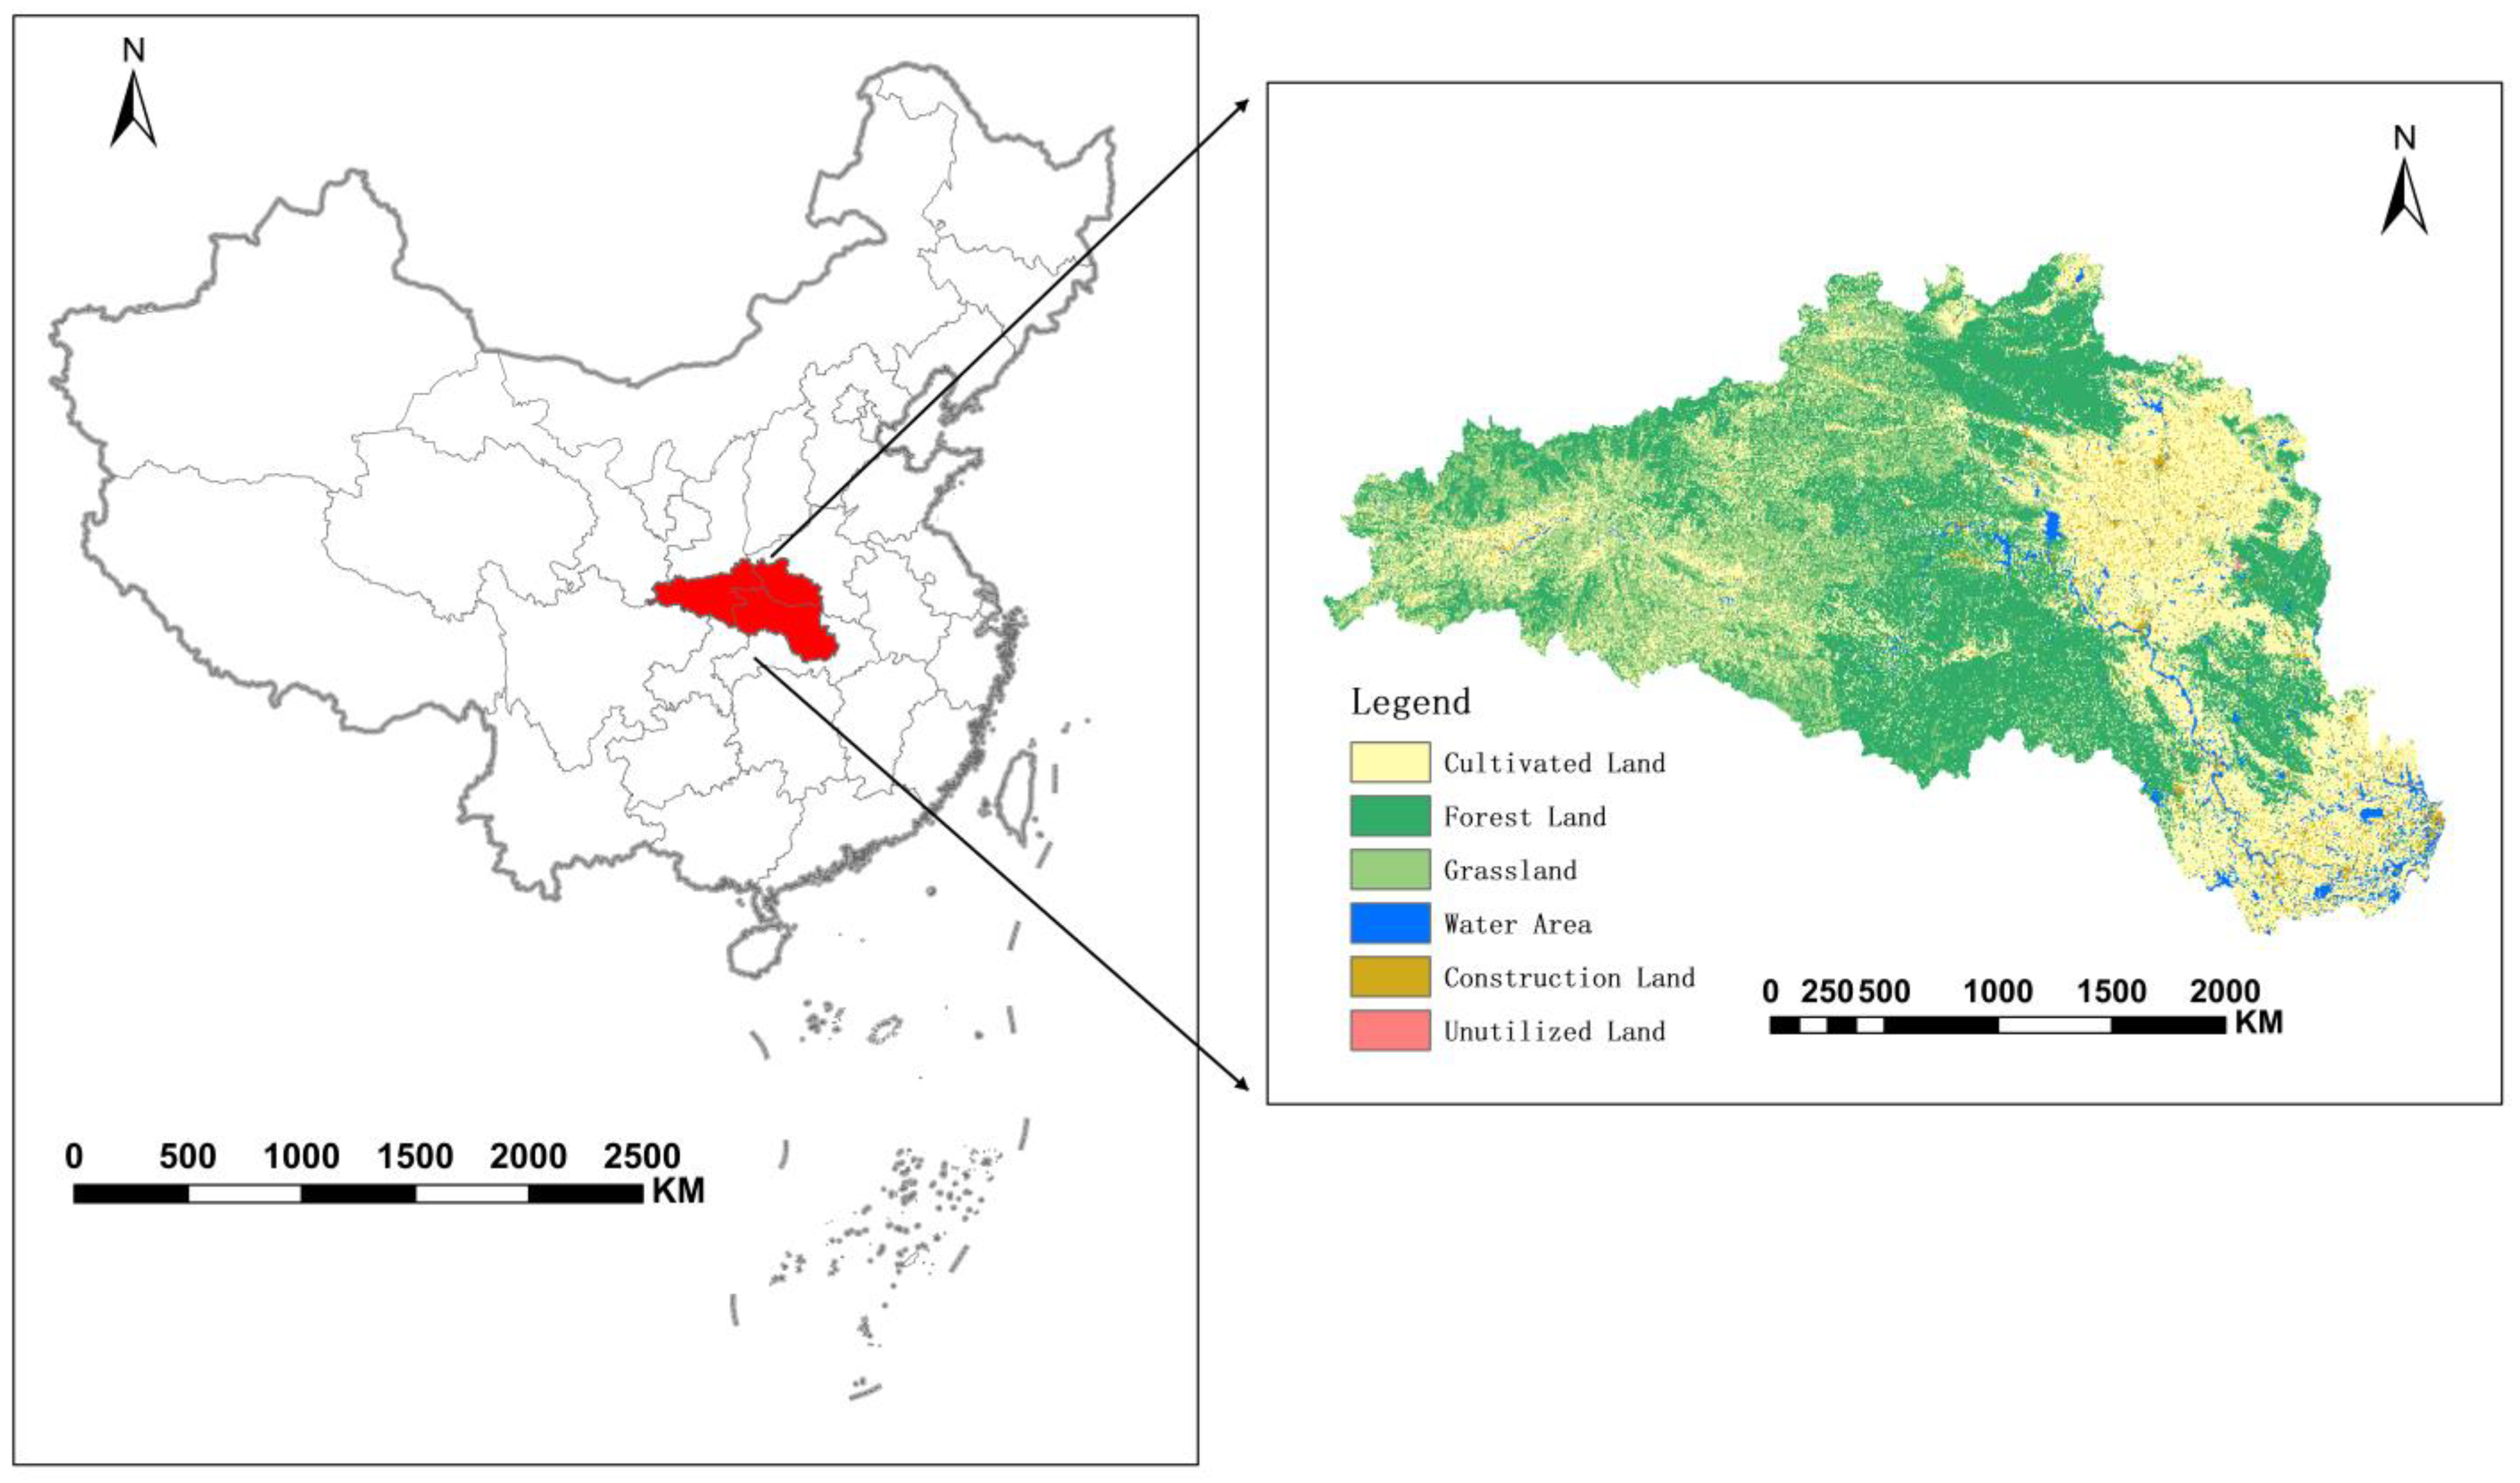
The Hanjiang Ecological Economic Zone is located in the hinterland of China. It is an economic development area with the Hanjiang Basin as a spatial carrier and is also a significant ecological corridor in the central and western regions. It involves 84 county-level cities in three provinces with a total landmass of 191,600 square kilometers. The Zone is in the subtropical monsoon climate region of East Asia, where the four seasons are distinct, and the climate is mild. Overall, the precipitation and temperature increase from northwest to southeast. The average temperature is 12~16 °C, and the average rainfall is 894 mm a year. It is a mountainous region with undulating terrain, and the elevation gradually increases from east to west. The types of landforms are mountains, hills, and plains in sequence (Figure 1). Based on the differences in natural foundations, the Danjiangkou Reservoir area is divided into two parts: the upper reaches and the middle and lower reaches. The upper reaches are an important water source conservation area, where the average gradient of the river is 0.6‰. The flow rate is fast, water resources are abundant, and water energy reserves are large, while the water flow in the middle and lower reaches is relatively gentle and abundant. The Danjiangkou Reservoir is a significant source of the Central Line Project of South-to-North Water Diversion, while the middle and lower reaches are traditional production bases of grain, cotton, oil, and fishery, as well as important production bases for the automobile industry, equipment manufacturing, and textile and clothing in China. As of 2017, the permanent population of the Zone is 44.44 million, and the regional GDP is ¥CNY 2.24 trillion. The Hanjiang Ecological Economic Zone is an important bridge linking the Yangtze River Economic Belt with the Silk Road Economic Belt and a key factor to promote the economic development of the central and western regions of China.
2.2. Data Preparation and Preconditioning
Research data for this paper are mainly obtained from Landsat image data, Google Earth historical satellite maps, Chinese Academy of Sciences Resources and Environment data, and other related data. The Landsat data were downloaded from the official website of the United States Geological Survey and mainly used to extract waters with an area larger than 1 hm2 in different periods [44]. Because of heavy precipitation in the waters in the rainy seasons (spring and summer) and the potential for the uncertainty of the waterbody boundary and cloudiness of the remote sensing image, remote sensing data collected in the autumn and winter (drier seasons) were obtained to effectively avoid the above effects. In addition, the two key time nodes before and after the implementation of the Central Line Project of South-to-North Water Diversion, namely 2010 and 2015, are considered the reference times. Therefore, Landsat 5 Thematic Mapper (TM) and Landsat 8 Operational Land Imager (OLI) remote sensing data images in the autumn and winter of 2010, 2015, and 2020, totaling 48 periods, were selected to extract waterbody information in the Hanjiang Ecological Economic Zone.
The image information of the study area in the 48 selected periods was extracted and calculated with ENVI 5.3 software. The main processes are as follows: (1) Atmospheric correction. The radiation error caused by atmospheric influence is eliminated by means of atmospheric correction after pretreatment through radiometric calibration; (2) Waterbody information extraction. In this step, a modified normalized difference water index (MNDWI) is adopted to extract waterbody index images; (3) Image mosaic and cropping. The 16-period image mosaic of the study area in the current year is obtained, then the research interest area is cut out through the vector boundary of the Hanjiang Ecological Economic Zone; (4) Decision tree classification. The sample water threshold is extracted through the identification of the classification object samples, then the decision tree classification rules for classification are confirmed. (5) The water data obtained by ENVI decision tree classification are visually interpreted and corrected by referring to the historical image data of Google Earth by ArcGIS 10.8. Finally, the obtained waterbody information from the Hanjiang Ecological Economic Zone was gridded and output in Tiff format to meet the needs of analysis on BI network pattern evolution.
2.3. Methods
2.3.1. Analysis of Blue Infrastructure Landscape Patterns
Morphological Spatial Pattern Analysis is a raster data handling method based on principles of mathematical morphological proposed by Vogt and others, which can accurately identify the type and shape of the landscape, and then visualize the spatial distribution of the landscape, offering a new basis for the choice of BI sources [45]. In order to give full play to the MSPA method, ArcGIS was used to set the extracted waterbody as the foreground and other sections as the background. Then, the data were converted into a 30 m × 30 m Tiff format binary raster data file. Finally, based on Guidos Toolboxs software, seven types of nonoverlapping landscapes were obtained by taking the MSPA method with eight-neighbor connectivity and thirty-meter edge width for this analysis (Table 1). After that, the MSPA analysis results were counted. According to the results, the core area is the BI patch with the largest area in the foreground pixel, which has a high ecological service value, and the BI source can be selected from it.
2.3.2. Analysis of Landscape Connectivity
Landscape connectivity can quantify the level of species exchange and dispersal, which is important for conserving species diversity and maintaining ecological harmony [47,48]. For the purpose of selecting the BI sources required for the study, a landscape connectivity index method was used, including Integral Index of Connectivity (IIC,1), Probability of Connectivity Index (PC,2), and Patch Importance Index (dPC,3). IIC and PC reflect the interpatch connectivity and the contribution of each patch to the overall connectivity. Finally, BI sources were selected on the basis of the importance index of the patch.
For these equations, n equals the number of patches, a equals the areas of the patch, nl is the number of links between patches, P* means the maximum of the product of all path probabilities between patches, AL is the total area, IIC = 0 indicates that there is no connection between patches, while IIC = 1 indicates that the entire landscape is a patch. The value of PC is between 0 and 1, values closer to 1 indicate the higher connectivity of the patch, dPC indicates the contribution of each patch to the maintenance of integral connectivity, and PCremove means PC of removing a certain patch.
According to the results of the MSPA analysis, this study selected the core area ≥ 20 hm2 as the landscape connectivity evaluation object [49]. Based on the Conefor software, the connectivity distance parameter was comprehensively determined through the statistical analysis of the calculation results under different distance thresholds. For the purpose of this study, the diffusion distance parameter was 10,000 m, and the probability of connectivity was 0.5. The large-scale patches connectivity was evaluated quantitatively from 2010 to 2020, and the patches with dPC ≥ 1 were taken as BI sources sufficient for ecological protection.
2.3.3. Potential Corridors Simulation
Minimum Cumulative Resistance model (MCR,4) is a common method to simulate ecological corridors, which can evaluate the minimum cost path between sources to determine the optimal path for species migration and dispersal [50]. MCR model has the characteristics of simple construction, an extension of elements, and wide application. It can simulate the extent and direction of species dispersal by avoiding various external disturbances [51].
For this equation, fmin represents the value of the min resistance, D represents the spatial distance between patches, and R represents the resistance coefficient of patches.
Choosing the source and establishing the ecological resistance surfaces are keys to the MCR model. Therefore, for model construction, great importance is attached to the selection of appropriate resistance factors to construct the resistance surface system. Considering factors such as natural conditions and human interference and the condition of the study area, as well as referring to the suggestions from the experts and the results of the existing research, the comprehensive resistance surface system is established, which includes five resistance factors: elevation, slope, landscape use types, distance from the road, and distance from the construction land (Table 2). These factors are confirmed from the perspective of topography, the types of the landscape, and human activities. In addition, the grading index and resistance value of each resistance factor are also confirmed. Higher resistance values indicate more difficulty in species migration and diffusion. Furthermore, the determination of resistance factors was weighted by AHP. Based on ArcGIS 10.8 software, the resistance factor is assigned attribute and converted into raster data, and the comprehensive resistance surface is obtained by using the raster calculator, so the key data of the model are achieved.
The cost distance analysis tool in ArcGIS 10.8 is applied to calculate the minimum cost distance between pixels by using BI source and resistance surface raster images, and then the minimum resistance path between sources is calculated by using the cost path analysis tool thereby the potential corridors between BI sources are generated.
2.3.4. Gravity Model and BI Network Structure Evaluation
The interaction strength between sources can represent the effectiveness of the potential BI corridors. Therefore, the gravity model (5) was adopted to calculate the interaction strength of each patch between BI source patches to determine the relative importance of BI corridors and then to construct the interaction matrix, which is used to quantitatively evaluate the interaction strength between the source patches. In the aftermath, important corridors are selected according to the results of the gravity matrix. Meanwhile, the general corridors passing through the same source patch are eliminated. To obtain the BI network of the Hanjiang Ecological Economic Zone, the network closure index (α, 6), degree index (β, 7), and network connectivity index (γ, 8) were used to quantitatively evaluate the degree of closure and connectivity level of BI network in the study area.
For this equation, G means the force between patches, N means the weight of the patch, D means the normalized resistance value of the potential corridor, P means the resistance values of the patch, S means the area of the patch, L means the resistance value of the corridor, and Lmax means max corridor resistance value.
For this equation, l is the number of links between patches, n is the number of patches, α is the proportion of closed loops, β is the average number of connections per node, if β < 1 indicates a genealogical tree map, If β = 1, it indicates a single loop, If β > 1, it indicates a complex network connection is generated, and γ is the connective degree of all nodes in the network.
3. Results
3.1. The Analysis of BI Landscape Patterns Based on MSPA
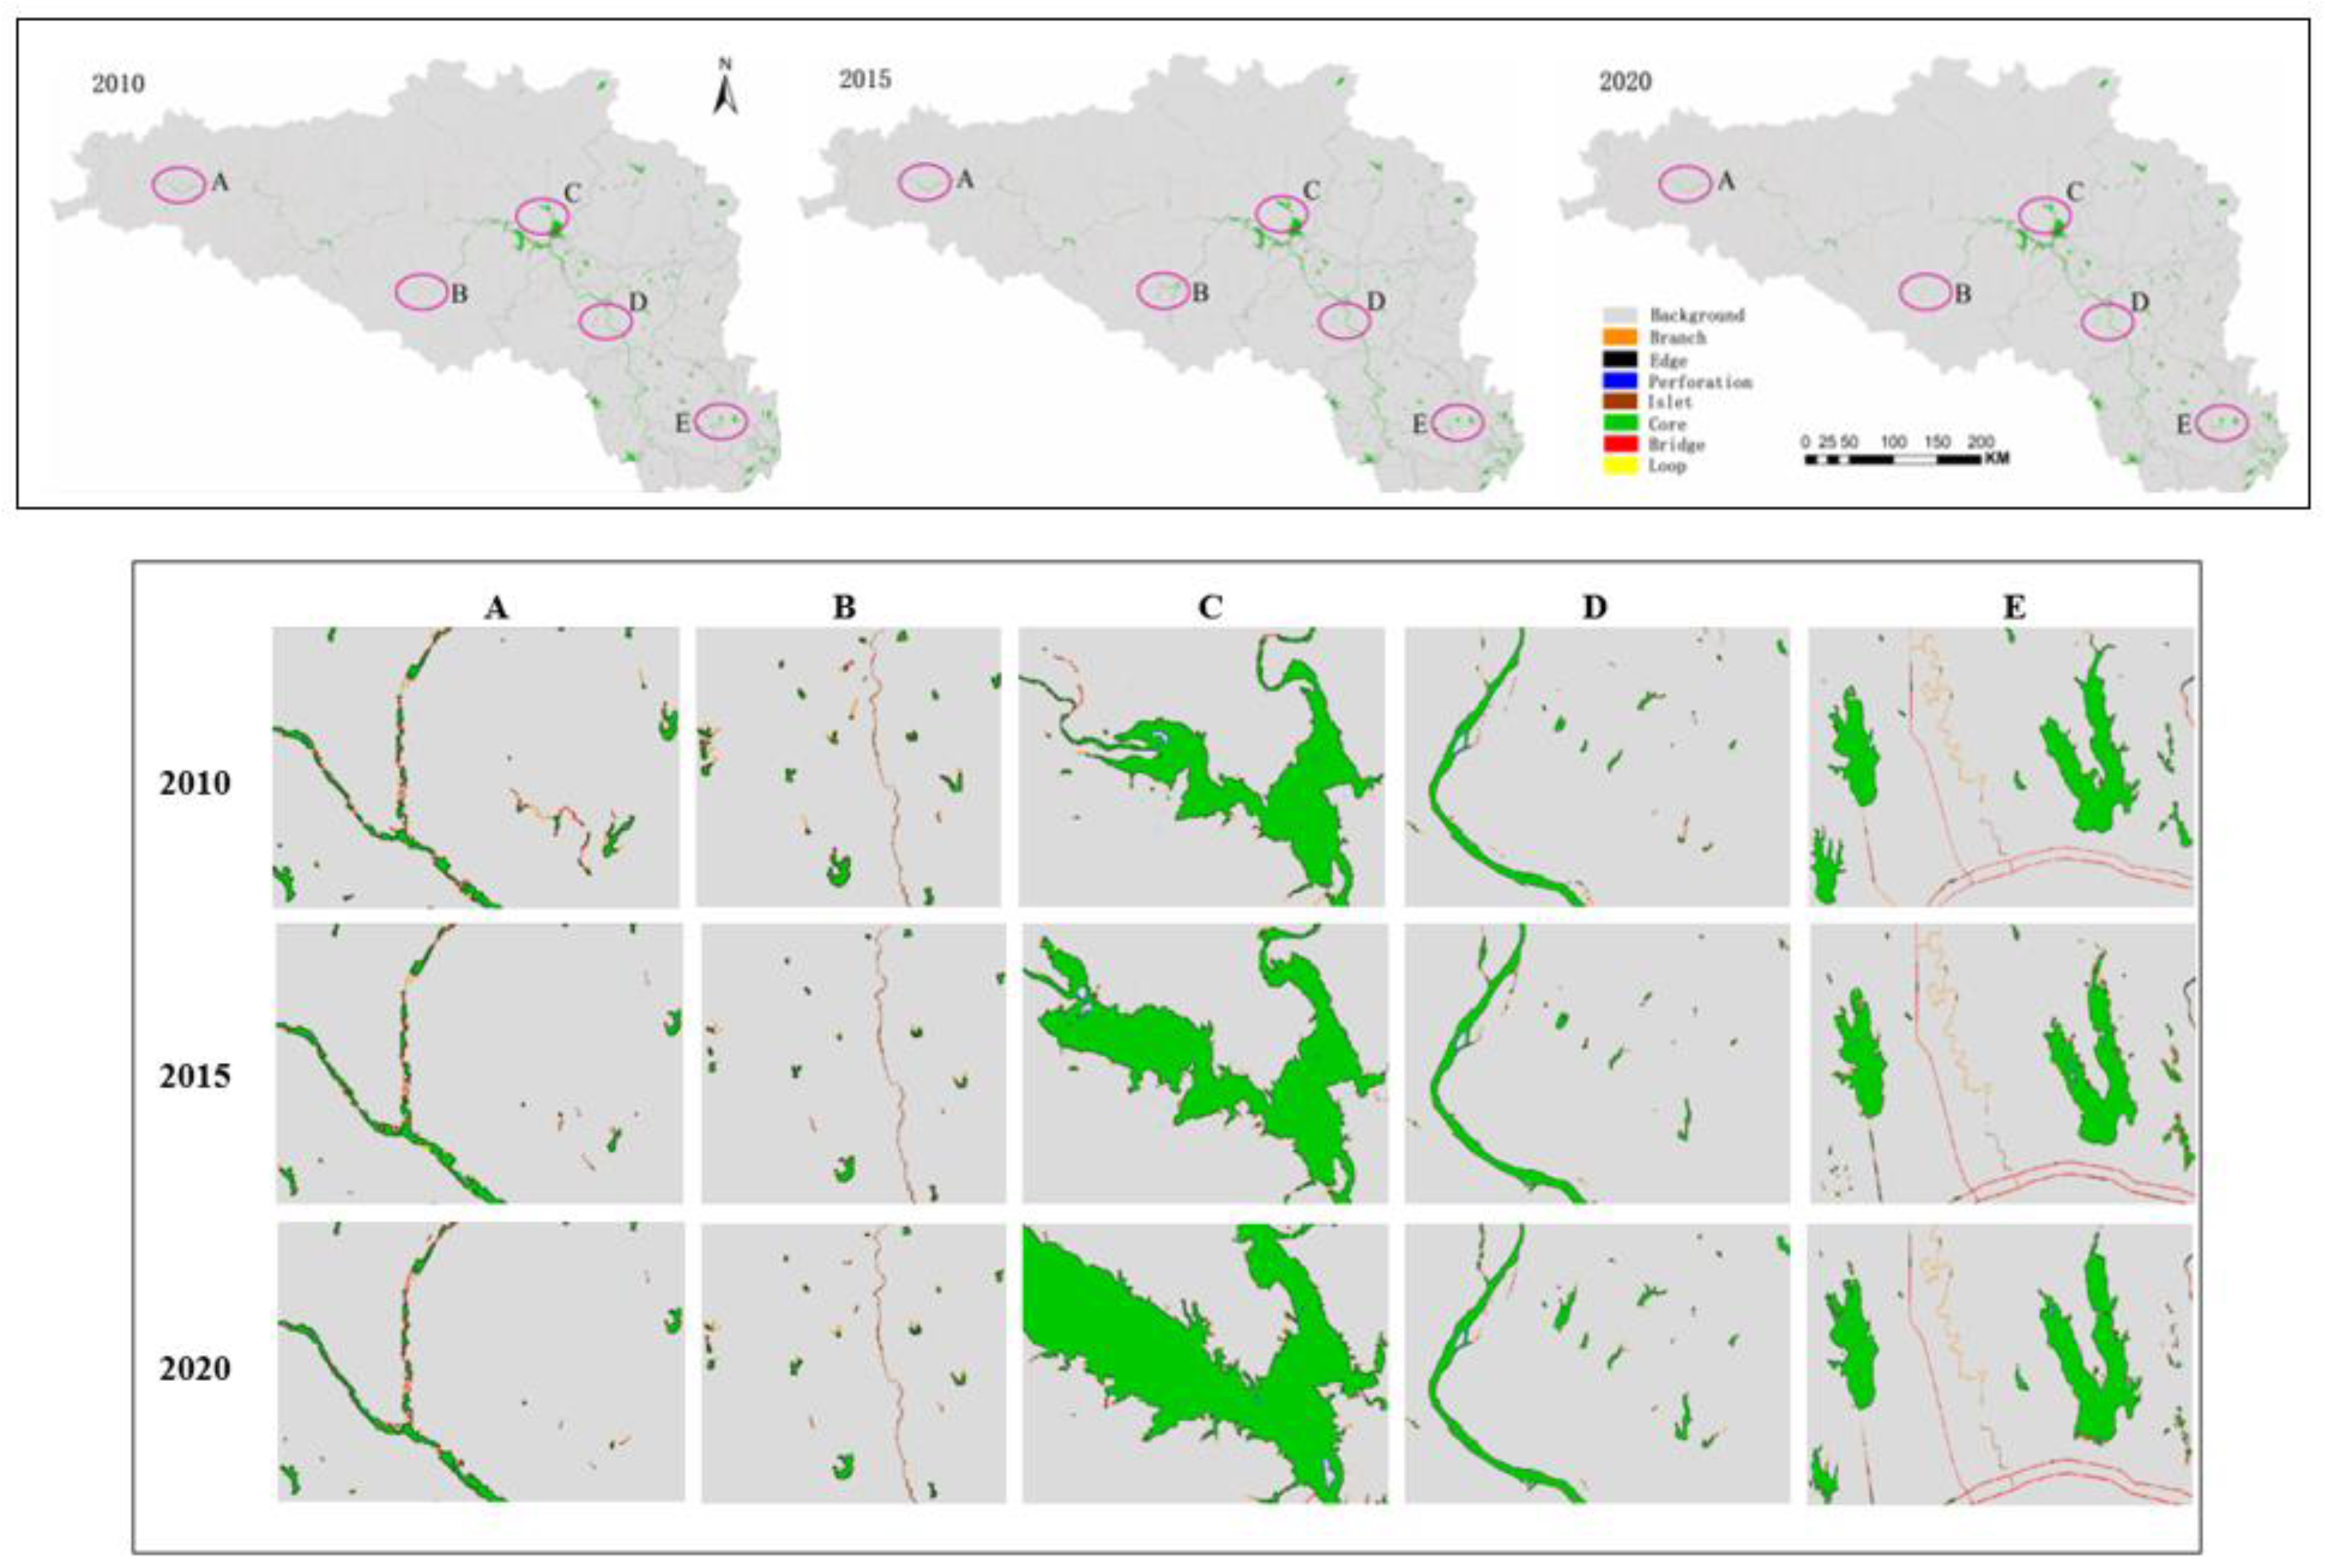
From Table 3 and Figure 2, we can see that the total area of BI decreases first and then increases from 2010 to 2020 on the whole. The area reduces from 3415.1 km2 in 2010 to 3385.57 km2 in 2015 and then rises to 3755.74 km2 in 2020. The core is the main landscape type in the study area. It accounts for 56.90% of the BI area and is densely distributed in the middle and lower reaches of the Hanjiang River and less in the upstream area. The main stream of the Hanjiang River is primarily responsible for the migration and exchange of species. The edge area can reduce the outside interference, accounting for 18.01% of BI area, which has an edge effect. The islets are distributed in the upper reaches of the Hanjiang River, accounting for 8.40% of the BI area. Although small in size, they can be used as stepping-stones for organisms. The bridge is about 223.66 km2, accounting for about 6.36%, which is important for the exchange of material and energy. The loop that acts as a corridor inside the core patch accounts for about 0.40%, and the branches with certain connectivity and the proliferation inside the patch account for 9.55% and 0.38%, respectively.
According to Figure 2, the growth of the core area from 2010 to 2015 is mainly due to the implementation of the compensation project after the Central Line Project of the South-to-North Water Diversion project, which expanded the water surfaces of the main stream of the Hanjiang River, while the core BI patches such as lakes, reservoirs, and wetlands are gradually eroded, segmented, and polluted. As such, the area is further reduced, and landscape fragmentation is intensified. As shown in Figure 2A,B (the Hanjiang River’s upper reaches) and Figure 2D (the Hanjiang River’s middle and lower reaches), the core area increased dramatically from 2015 to 2020. The average annual growth rate reached 3%, and the cumulative increase was 287.87 km2, as shown in Figure 2C (the Danjiangkou Reservoir) and Figure 2E (the Hanjiang River’s middle and lower reaches). This can be explained by the implementation of ecological environment system protection and restoration to promote comprehensive management of the water environment in the Hanjiang Ecological Economic Zone during this period.
3.2. Analysis of the Landscape Connectivity of BI
As seen in Table 4, the integral connectivity index of the Hanjiang Ecological Economic Zone fell from 2010 to 2015, but the number of BI network links and components rose. This means that the landscape fragmentation goes up during this period, and the integral connectivity of the BI network goes down. However, the integral connectivity of the landscape gradually has increased since 2015, and the number of BI network links and components has decreased, which means landscape fragmentation is well curbed. The degree of potential connectivity between patches continually increased from 2010 to 2020, and the growth speed accelerated year after year. This implies that the potential connection degree between patches continues to increase. However, the landscape connectivity of the Hanjiang Ecological Economic Zone is still at a low level overall, and the core area with the function of bridging, as a stepping-stone, accounts for a low proportion. In addition, the advancement of urbanization has led to the reduction in the core area around the city and the weakening of the connectivity between patches. The core patches with more important landscape connectivity are mainly distributed in the Hanjiang River’s middle and lower reaches, such as the Hanjiang River’s main stream, Changhu Lake, the Tangbai River, and the Danjiangkou Reservoir. These are particularly important for improving the survival rate of biological species during the migration process and the improvement of ecological service value. On the whole, only a few key core area patches in the study area exert a profound influence on landscape connectivity, so these patches are the priorities for BI network planning.
3.3. BI Network Construction
3.3.1. Analysis of Ecological Resistance
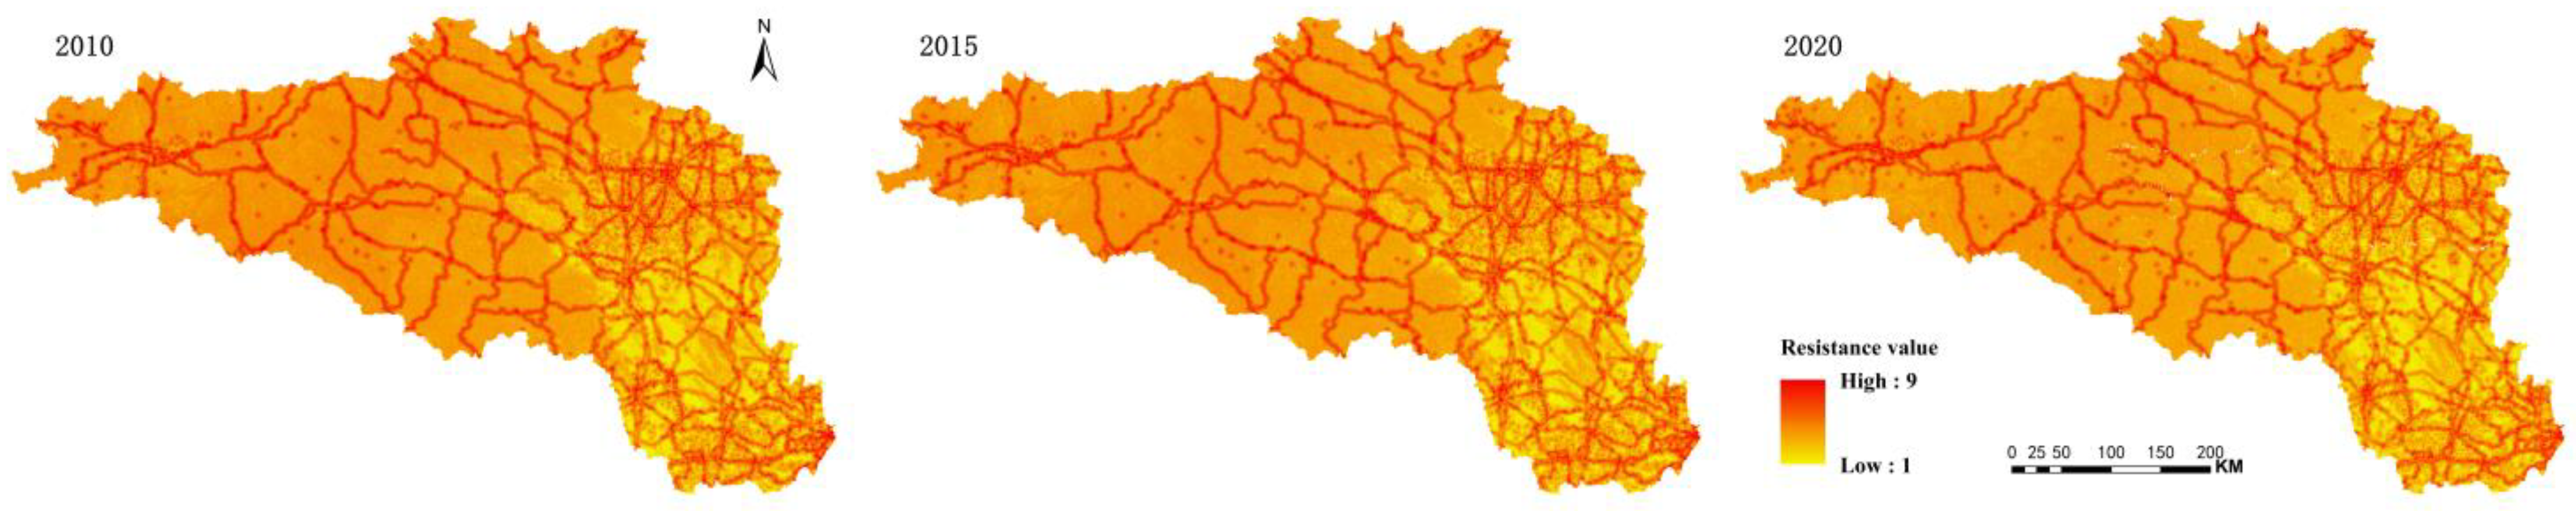
Taking natural and artificial factors into consideration, we can obtain the comprehensive resistance surface of the three periods of the study area through the superposition analysis of the resistance factors (Figure 3). Resistance in the eastern parts is relatively small, but there are also some higher resistance areas, such as the western part of Wuhan City, the central parts of Tianmen City, and Nanyang City, because of the dense distribution of construction land and traffic network. Other high resistance regions are located in the west and north due to large altitude differences. The resistance value gradually increases from east to west, affecting species migration and energy flow between areas. In view of temporal and spatial variation, the high resistance area shows a growing trend from 2010 to 2020, during the first five years of poverty alleviation and development in China’s rural areas, from 2010 to 2015. During this period, the government increased investment and mainly targeted the contiguous destitute areas. Therefore, the areas with increased resistance mainly revolved around road traffic in the Hanjiang River’s upper reaches. The high resistance areas are also grouped mainly in the densely populated and economically developed urban areas from 2015 to 2020.
3.3.2. BI Corridor Simulation
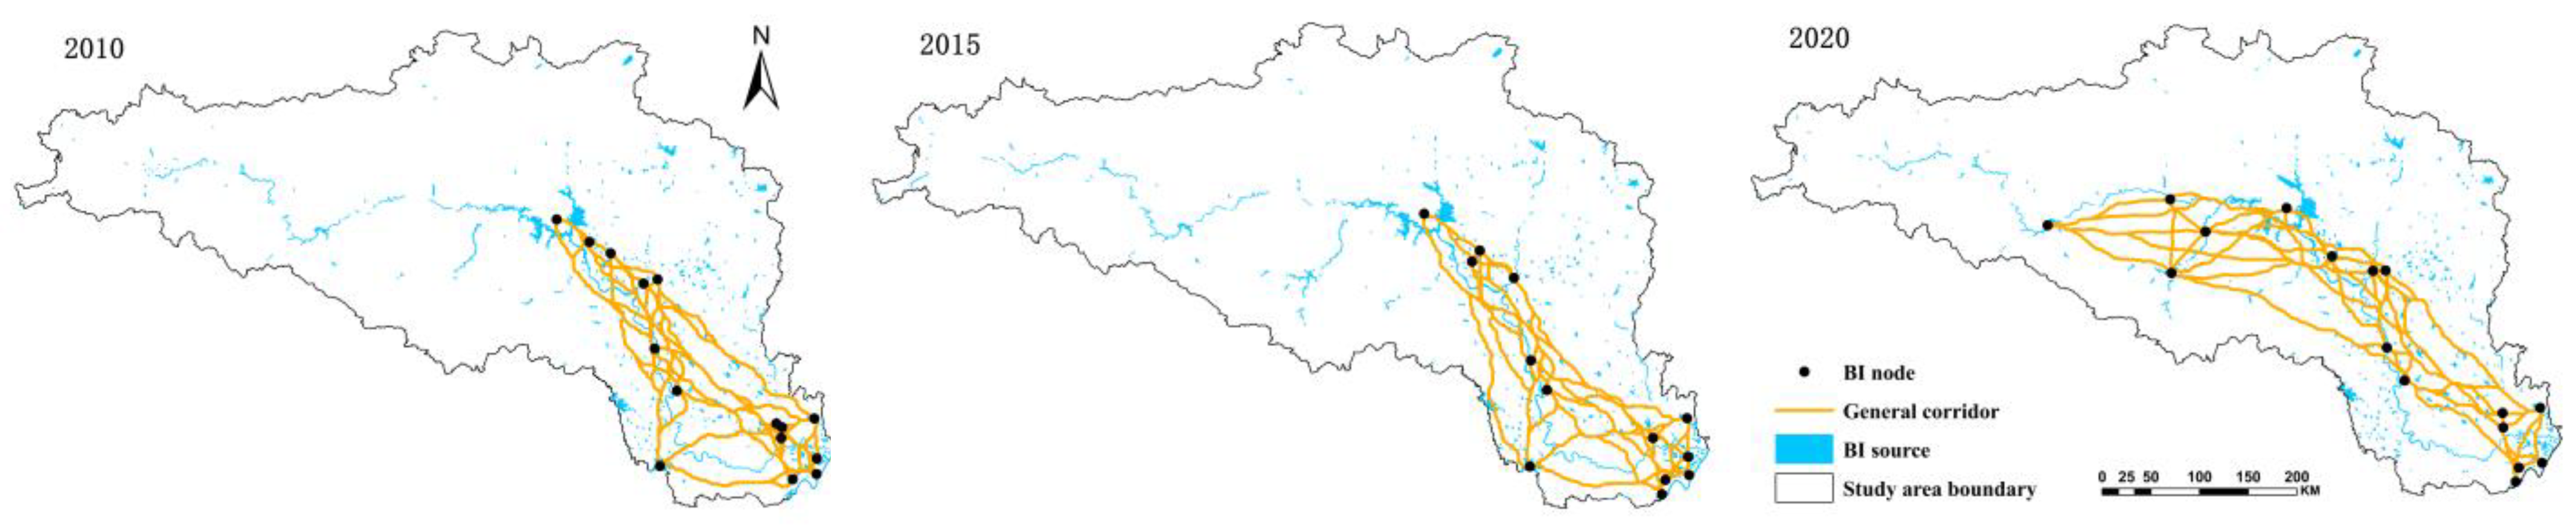
In this study, the BI corridor is simulated by a minimum cumulative cost path. The potential species migration trajectories can be generated by means of calculating the minimum cost path between sources based on the comprehensive resistance surface. According to Table 5 and Figure 4, there were 105 BI corridors in 2010, which were centered in the Hanjiang River’s middle and lower reaches, and densely distributed in the southeast. This means that this area is more conducive to the exchange of matter and energy between species. There were 78 BI corridors in 2015, and the number decreased compared with 2010. There were 1458 corridor nodes, which are scattered in space. The intersection between corridors is reduced, and the landscape connectivity is weakened. The corridors move from the east to the south on the whole. There were 120 BI corridors in 2020, and the number increased sharply compared with 2015. The number of corridor nodes reached 1934. The internal intersection phenomenon is relatively dense, and BI corridors are distributed in strips, rising from the Hanjiang River’s middle and lower reaches. The extension of corridors enhances landscape connectivity between the eastern and western. The number of BI corridors goes up first and then goes down from 2010 to 2020. The following provides an explanation. Firstly, since the implementation of the Central Line Project of the South-to-North Water Diversion Project in 2010, the water flowing into the Hanjiang River’s middle and lower reaches decreased. So, its self-purification capacity became poor. Additionally, the BI source area also diminished, which reduced BI nodes and the corridors connecting the nodes accordingly. Secondly, owing to frequent regional economic activities, a large number of BI sources are used for aquaculture and sewage discharge, leading to increased water pollution. Thirdly, implementation of the ecosystem protection and restoration in the Hanjiang Ecological Economic Zone has been promoted since 2015, and the Yangtze River diversion to the Hanjiang project has been carried out. Therefore, BI sources are systematically protected and restored, and the number of corridors has been increased, which supports the migration of species.
3.3.3. Analysis of Gravity Model Results and Network Construction
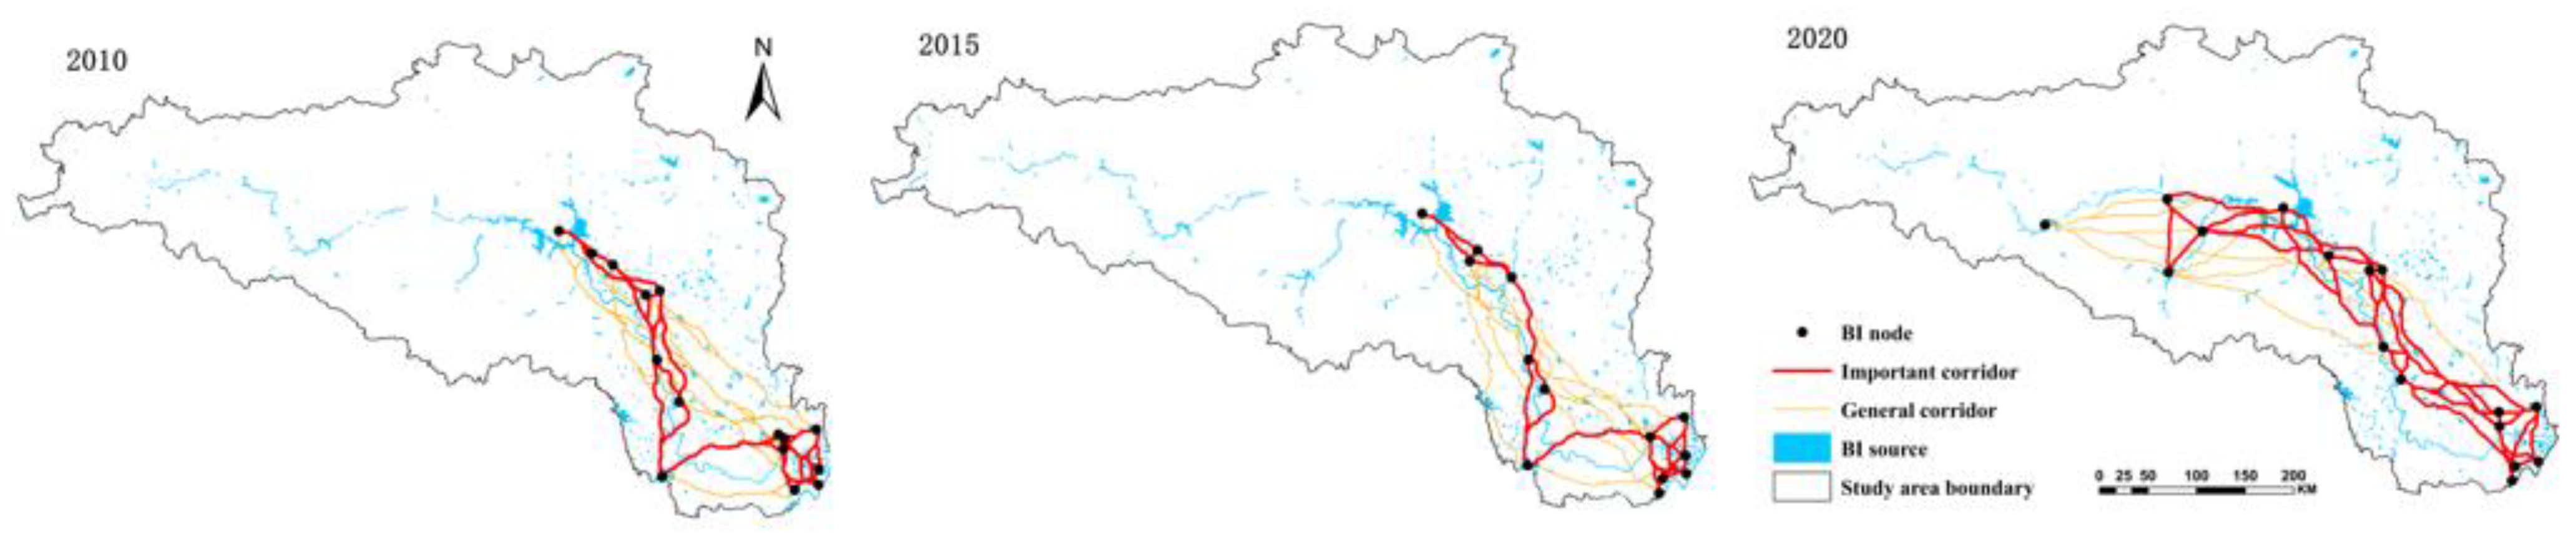
The gravity model was used to construct the interaction matrix between BI sources, and the importance of the corridor was determined based on the strength of the interaction effects. The greater the interaction effects between the target source and the other, the lower the resistance to species migration and flow on the sources, meaning the BI corridor is more important. According to the area of BI source, BI corridors with an interaction force value greater than 300 are regarded as important corridors, and ones with an interaction force value less than 300 are regarded as general corridors. As shown in Figure 5, there were 105 BI corridors in the study area in 2010, including 40 important corridors and 65 general corridors. There were 78 BI corridors in the research area in 2015, including 24 important corridors and 54 general corridors. There were 120 in 2020, including 46 important ones and 74 general ones. Important corridors are generally locations with larger areas and better landscape connectivity. They are concentrated in the Hanjiang River’s middle and lower reaches. These important BI corridors are the main channels for materials exchange and are less disturbed by natural and human factors. So, they are also the paths with the least resistance to species migration. The number of general corridors is large and widely distributed, and they are close to the human activity area. As a result, they are frequently disturbed by human activities. The patch area of general corridors is relatively small, which is not suitable for large-scale species migration activities. In this context, a potential BI network is constructed through the identification of BI sources and important corridors. (Figure 5).
3.3.4. BI Network Structure Evaluation
As can be seen from Table 6 and Figure 5, the α value of the BI network in the study area in 2010, 2015, and 2020 shows a decrease followed by an increase. This demonstrates that the available diffusion paths for the biological species in the study area crossing the BI network gradually decreased from 2010 to 2015. The degree of network closure has gradually increased since 2015. The β value of the BI network in the study area was 1.33 in 2010 and 1.69 in 2020. Both of them are greater than 1, indicating that the connection level of the BI network during this period is relatively complex and has a network structure. The structure of the BI network in 2015 tends to be tree-like, and the level of connectivity and closure is low. The values of α, β, and γ from first 2010 to 2020 decrease and then increases, which is in line with the number of changes in BI source patches. It shows that the fragmentation of the BI network in the study area has intensified since 2010. Moreover, as the connectivity between the source patches has decreased, the network structure has tended to be simplified as well. The number of BI sources has increased since 2015, and the network complexity and connectivity levels have gradually increased. From the evolution of the BI network in the study area in the past 10 years. From 2010 to 2020, it can be seen that the main reason for the change in the BI network pattern is the change in the number and area of the source of BI, which has an important impact on the nodes and corridors and ultimately changes the original network structure.
4. Discussion
(1). The choice of research scale is important when using MSPA to analyze raster images of the landscape because the results of MSPA analysis are closely related to the variation in granularity. Therefore, it is very important to choose an appropriate analysis scale for MSPA research [52,53]. Different image raster sizes in the same study area will change the analysis results accordingly [54]. For example, an increase in the image raster size of the study area may lead to the disappearance or classification of the original smaller area patches into other categories, such as small cores may be reclassified as islets, some bridges may become branches, and some branches may disappear. The Hanjiang Ecological Economic Zone is large, and a larger image raster size can cause some small patches with good connectivity to be lost or change categories types [36,53]. This is why the particle size at the urban scale is set to 30 m. After several tests of the threshold, this granularity can better maintain the original data characteristics, but the reasonableness of the scale still needs further study.
In addition, the edge width needs to be set during the MSPA landscape pattern analysis, and the setting of the edge width represents the size of the extent of the edge effect produced by the patches. The edge width affects the impacted range of the edge effect of the patch. For example, an extension of the edge width will result in a reduction in the core area of the landscape type and an increase in the noncore elements, so the size of the edge width has a greater impact on MSPA analysis results [55]. The edge effect is an important concept in ecology, which is of great significance to ecological processes, species protection, and habitat protection. It must be considered in the functional planning of nature reserves [56]. In this study, considering the area scale and data accuracy, the edge width threshold was set to 1. Since the input image raster size was 30 m × 30 m, the edge effect is 30 m. However, the edge effect is pertinent and complex. The width of the edge effect varies with different landscape properties, patch shapes, and different research objectives [57]. As a result, the width of the edge effect set in this study is not applicable to some specific species, and the characteristics of the protected species and the nature and shape of the study area landscape also need to be considered when setting the edge effect width.
(2). For the reasons that different connectivity distance thresholds will have different impacts on the important value of patches, the betweenness centrality, and the landscape’s connectivity, it is necessary to set the connectivity distance threshold when calculating the landscape connectivity based on PC and IIC [58,59]. For example, a patch is considered connected only if the distance between patches is less than a set threshold, and the opposite is not connected. In this context, this paper determines the connectivity distance threshold by comprehensively analyzing the following factors: the condition of different distance thresholds, the changes in the area and number of patches, the number of components, and the changes in patch area in the biggest component, the area of the individual patch, and the distribution of the area of a single patch and the important value of the patch [60]. When the connectivity distance threshold is 10,000 m, the area and number of connected patches vary greatly, and both large-area patches and small-area patches show higher important values. In addition, in order to ensure the comparability of data between years, the connectivity probability was set to 0.5. However, the setting of the connectivity distance threshold needs to take into account the dispersal distance of species, which often varies among species. Therefore, the scientific determination of this distance threshold needs more argumentation.
(3). MCR Model is used to simulate the potential BI corridor. The selection of resistance factors is the basis of BI network construction, and the construction of the resistance surface system is still controversial [36], although constructing resistance surfaces by selecting resistance factors from topography, landscape types, and human activities in this paper have been reported in scientific literature. Due to the lack of detailed research data, this paper does not take the influence of the living habits of different species and the distribution of settlements and other factors on the construction of the resistance surface into consideration. In addition, the weight of resistance factors is subjective because there are no data on the relationship between species dispersal and resistance factors [61]. It needs to be further studied and discussed in more detail in the follow-up.
(4). In the context of the implementation of the Central Line Project of South-to-North Water Diversion and the cascade reservoir project, the downstream area of Danjiangkou Reservoir shows hydrological characteristics of reduced flow and lower water level during the dry period [62], and water quality deteriorates sharply [42,43]. Subsequently, with the implementation of the Yangtze River diversion to the Hanjiang and ecological restoration projects, the water quality in the Hanjiang River’s middle and lower reaches has transitioned from heavier pollution to moderate pollution and shows a trend of continuing improvement [63]. This is consistent with the results of this study. From 2010 to 2015, the total BI area and core area decreased, the landscape connectivity decreased, and the BI network was simplified. From 2015 to 2020, the total BI area and core area increased, the landscape connectivity improved, and the BI network tended to be complex. This indicates that the study on the change of BI network pattern integrating MSPA, Landscape Connectivity Index, MCR model, and gravity model can reflect the hydrological characteristics and landscape pattern of water bodies in the study area from the macroscopic perspective. The research results can provide a reference for BI network planning in the study area and provide a reference for the planning of BI network patterns in other regions.
5. Conclusions
A study of the Hanjiang Ecological Economic Zone was undertaken in order to explore the temporal and spatial variation of the BI Network Pattern from 2010 to 2020. This study constructed a BI network involving three periods of time by means of the MSPA method and MCR model from the perspective of the identification of BI source, the evaluation of landscape connectivity, and BI corridor simulation. The following conclusions are achieved.
(1). In accordance with the MSPA method, the structural types that are essential to the landscape connectivity, such as the core and the bridge, are identified from the pixel level. The analysis of the temporal and spatial variation of the BI network pattern shows that the total area of BI first decreased and then increased. The change was especially obvious in the Hanjiang River’s middle and lower reaches. The patch area in the core area continually shrinks, and the degree of landscape fragmentation became more and more serious from 2010 to 2015. The patch area in the core has been repaired and expanded, and the degree of landscape fragmentation has gradually decreased since 2015. This is mainly a result of the compensation project after the Central Line Project of the South-to-North Water Diversion Project was carried out, and comprehensive governance of water resources in the Hanjiang Ecological Economic Zone occurred during this period.
(2). Based on the IIC and PC of the landscape index, the integral connectivity level of the core patches in the Hanjiang Ecological Economic Zone was quantitatively estimated. The results show that the integral connectivity of the landscape decreased from 2010 to 2015 with the increase in the degree of landscape fragmentation. The condition has improved since 2015. The integral connectivity level and possible connectivity level of the landscape display an increasing trend, and the growth rate also speeds up. However, the integral level of connectivity remains low, which is related to fewer BI sources serving as a stepping-stone and the rapid expansion of urban space.
(3). In virtue of such resistance factors as natural conditions and human activities, the ecological resistance surface is constructed. Comprehensive resistance gradually increases from east to west. The potential BI corridors were generated by means of the MCR model. They are centered in the Hanjiang River’s middle and lower reaches and are expanding to the upstream area. The important corridors and patches are identified by calculating the interaction force value between BI sources based on the gravity model, and a BI network is constructed. BI network structure is quantitatively evaluated by way of network closure index, degree index, and network connectivity index. The results reveal that the network structure is simple first and then complex, which is in line with the change in the number of BI source patches. It means that the changes in the number and area of BI sources are directly related to the change in the BI network pattern.
This paper reveals the spatial and temporal evolution characteristics of the BI network pattern in the Hanjiang Ecological Economic Zone during 2010–2020, which can provide references for optimizing the BI network and formulating BI protection policies in the study area. However, there are some limitations to this study. Firstly, when adopting MSPA and landscape connectivity analysis, the thresholds have a large impact on the analysis results, and the scientific setting of thresholds still needs further exploration. In future studies, characteristics of species and study areas should be considered to determine the thresholds in an integrated manner. Secondly, although this paper provides a basic framework for resistance surface construction, it still needs to be optimized. The selection of resistance factors is not comprehensive enough, and the weight of resistance factors is also subjective. Under the condition that the relevant data are available, the resistance factors should be included, and the species dispersal characteristics should be considered to establish a more suitable resistance surface system. Lastly, there is no comprehensive analysis of the ecological network of the study area by combining other land-use types. Moving forward, green infrastructure such as forest, grassland, and cultivated land should be included in the construction of a regional ecological network in order to provide comprehensive support for urban ecological development. In the future, our team will conduct follow-up research considering the above aspects.
Author Contributions
Conceptualization, P.H. and K.C.; methodology, P.H.; software, K.C.; validation, K.C.; formal analysis, P.H.; investigation, P.H.; resources, K.C.; data curation, P.H.; writing—original draft preparation, P.H.; writing—review and editing, K.C.; visualization, P.H.; supervision, K.C.; project administration, P.H.; funding acquisition, K.C. All authors have read and agreed to the published version of the manuscript.
Funding
This research was funded by the Fundamental Research Funds for the Central Universities, China University of Geosciences (Wuhan) (No.2018123), and the Foundation Funds for Hubei Social Science (No.2020190).
Data Availability Statement
The data for the network construction originate from the official website of the US Geological Survey, the China City Statistical Yearbook, and the Geospatial Data Cloud.
Acknowledgments
We have sincerely appreciated Bowen Ma and Shuai Liu for their guidance in the writing process.
Conflicts of Interest
The authors declare no conflict of interest.
References
- Haase, D. Effects of urbanisation on the water balance–A long-term trajectory. Environ. Impact Assess. Rev. 2009, 29, 211–219. [Google Scholar] [CrossRef]
- Cristian, I.I.; Denisa, L.B.; Dagmar, H.; Alina, C.H.; Mihai, R.N. How about water? Urban blue infrastructure management in Romania. Cities 2021, 110, 103084. [Google Scholar]
- Haase, D. Reflections about blue ecosystem services in cities. Sustain. Water Qual. Ecol. 2015, 5, 77–83. [Google Scholar] [CrossRef]
- Charmaine, K.W.; Fung, C.Y.J. Influence of blue infrastructure on lawn thermal microclimate in a subtropical green space. Sustain. Cities Soc. 2020, 52, 101858. [Google Scholar]
- Gunawardena, K.R.; Well, M.J.; Kershaw, T. Utilising green and bluespace to mitigate urban heat island intensity. Sci. Total Environ. 2017, 584, 1040–1055. [Google Scholar] [CrossRef]
- Vierikko, K.; Niemelä, J. Bottom-up thinking—Identifying socio-cultural values of ecosystem services in local blue–green infrastructure planning in Helsinki, Finland. Land Use Policy 2016, 50, 537–547. [Google Scholar]
- Finlay, J.; Franke, T.; McKay, H.; Sims-Gould, J. Therapeutic landscapes and wellbeing in later life: Impacts of blue and green spaces for older adults. Health Place 2015, 34, 97–106. [Google Scholar] [CrossRef]
- Haase, D.; Larondelle, N.; Andersson, E.; Artmann, M.; Borgström, S.; Breuste, J.; Gomez-Baggethun, E.; Gren, Å.; Hamstead, Z.; Hansen, R.; et al. A quantitative review of urban ecosystem service assessments: Concepts, models, and implementation. Ambio 2014, 43, 413–433. [Google Scholar] [CrossRef] [Green Version]
- Somayeh, H.; Petri, N.; Anne, O. Urban wetlands: A review on ecological and cultural values. Water 2021, 13, 3301–3347. [Google Scholar]
- Jia, H.; Wang, Z.; Zhen, X.; Clar, M.; Yu, S.L. China’s sponge city construction: A discussion on technical approaches. Front. Environ. Sci. Eng. 2017, 11, 37–47. [Google Scholar] [CrossRef]
- Li, F.; Liu, X.; Zhang, X.; Zhao, D.; Liu, H.; Zhou, C.; Wang, R. Urban ecological infrastructure: An integrated network for ecosystem services and sustainable urban systems. J. Clean. Prod. 2017, 163, S12–S18. [Google Scholar] [CrossRef]
- Pilotti, M.; Klein, E.; Golem, D.; Piepenbrink, E.; Kaplan, K. Is viewing a nature video after work restorative? Effects on blood pressure, task performance, and long-term memory. Environ. Behav. 2015, 47, 947–969. [Google Scholar] [CrossRef]
- Van den Bosch, M.; Sang, Å.O. Urban natural environments as nature-based solutions for improved public health—A systematic review of reviews. Environ. Res. 2017, 158, 373–384. [Google Scholar] [CrossRef]
- Kazemi, F.; Beecham, S.; Gibbs, J.; Clay, R. Factors affecting terrestrial invertebrate diversity in bioretention basins in an Australian urban environment. Landsc. Urban Plan. 2009, 92, 304–313. [Google Scholar] [CrossRef]
- Kazemi, F.; Beecham, S.; Gibbs, J. Streetscape biodiversity and the role of bioretention swales in an Australian urban environment. Landsc. Urban Plan. 2011, 101, 139–148. [Google Scholar] [CrossRef]
- Andersson, E.; Langemeyer, J.; Borgström, S.; McPhearson, T.; Haase, D.; Kronenberg, J.; Barton, D.N.; Davis, M.; Naumann, S.; Röschel, L.; et al. Enabling green and blue infrastructure to improve contributions to human well-being and equity in urban systems. BioScience 2019, 69, 566–574. [Google Scholar] [CrossRef]
- Benedict, M.A.; McMahon, E.T. Green Infrastructure: Smart Conservation for the 21st Century; Monograph Series; Sprawl Watch Clearinghouse: Washington, DC, USA, 2000. [Google Scholar]
- Tzoulas, K.; Korpela, K.; Venn, S.; Yli-Pelkonen, V.; Kaźmierczak, A.; Niemela, J.; James, P. Promoting ecosystem and human health in urban areas using Green Infrastructure: A literature review. Landsc. Urban Plan. 2007, 81, 167–178. [Google Scholar] [CrossRef] [Green Version]
- European Environment Agency. What Is Green Infrastructure? European Environment Agency: Copenhagen, Denmark, 2017. Available online: https://www.eea.europa.eu (accessed on 15 February 2020).
- Barthel, S.; Isendahl, C. Urban gardens, agriculture, and water management: Sources of resilience for long-term food security in cities. Ecol. Econ. 2013, 86, 224–234. [Google Scholar] [CrossRef]
- Ghofrani, Z.; Sposito, V.; Faggian, R. A comprehensive review of blue-green infrastructure concepts. Int. J. Environ. Sustain. 2017, 6, 15–36. [Google Scholar] [CrossRef]
- Kyle, J.H.; David, I.W.J.; Joseph, W.K.; Daniel, A.C.; Janet, L.C.; Kevin, M.E.; Frank, A.J.; Nathaniel, V.O.; Dustin, M.S. A case study of a prymnesium parvum harmful algae bloom in the Ohio River drainage: Impact, recovery and potential for future invasions/range expansion. Water 2021, 13, 3233–3253. [Google Scholar]
- Hettiarachchi, M.; Morrison, T.H.; McAlpine, C. Forty-three years of Ramsar and urban wetlands. Glob. Environ. Chang. 2015, 32, 57–66. [Google Scholar] [CrossRef] [Green Version]
- Ciocanea, C.M.; Corpade, C.; Onose, D.A.; Vanau, G.O.; Malos, C.V.; Petrovici, M.; Gheorghe, C.A.; Dedu, S.; Manta, N.; Robert, S. The assessment of lotic ecosystems degradation using multicriteria analysis and GIS. Carpathian J. Earth Environ. Sci. 2019, 14, 255–268. [Google Scholar] [CrossRef]
- Dugord, P.A.; Lauf, S.; Schuster, C.; Kleinschmit, B. Land use patterns, temperature distribution, and potential heat stress risk—The case study Berlin, Germany. Comput. Environ. Urban Syst. 2014, 48, 86–98. [Google Scholar] [CrossRef]
- Völker, S.; Kistemann, T. Developing the urban blue: Comparative health responses to blue and green urban open spaces in Germany. Health Place 2015, 35, 196–205. [Google Scholar] [CrossRef] [PubMed]
- Veerkamp, C.J.; Schipper, A.M.; Hedlund, K.; Lazarova, T.; Nordin, A.; Hanson, H.I. A review of studies assessing ecosystem services provided by urban green and blue infrastructure. Ecosyst. Serv. 2021, 52, 101367. [Google Scholar] [CrossRef]
- Strain, E.M.A.; Morris, R.L.; Bishop, M.J.; Tanner, E.; Steinberg, P.; Swearer, S.E.; MacLeod, C.; Alexander, K.A. Building blue infrastructure: Assessing the key environmental issues and priority areas for ecological engineering initiatives in Australia’s metropolitan embayments. J. Environ. Manag. 2018, 230, 488–496. [Google Scholar] [CrossRef] [PubMed]
- Ana, B.; Beatriz, M.; Virgilio, H.; Juan, A.T.; Julian, B.; Javier, M.L.; Sami, D.; Simone, D.L.; Stefano, B.; Ferdinando, V.; et al. Cost-effective restoration and conservation planning in Green and Blue Infrastructure designs. A case study on the Intercontinental Biosphere Reserve of the Mediterranean: Andalusia (Spain)–Morocco. Sci. Total Environ. 2019, 652, 1463–1473. [Google Scholar]
- Güneralp, B.; McDonald, R.I.; Fragkias, M.; Goodness, J.; Marcotullio, P.J.; Seto, K.C. Urbanization forecasts, effects on land use, biodiversity, and ecosystem services. In Urbanization, Biodiversity And Ecosystem Services: Challenges and Opportunities; Thomas, E., Michail, F., Julie, G., Eds.; Springer: Dordrecht, The Netherlands, 2013; pp. 437–452. [Google Scholar]
- van Hullebusch, E.D.; Bani, A.; Carvalho, M.; Cetecioglu, Z.; De Gusseme, B.; Di Lonardo, S.; Djolic, M.; van Eekert, M.; Griessler Bulc, T.; Haznedaroglu, B.Z.; et al. Nature-based units as building blocks for resource recovery systems in cities. Water 2021, 13, 3153. [Google Scholar] [CrossRef]
- Charles, J.V.; Ben, S.K.; Pamela, A.G.; Edward, L.B.; Martina, F.; Günther, F.; David, A.W.; Stuart, E.B.; Anik, B.; Peter, B.M.; et al. A green-gray path to global water security and sustainable infrastructure. Glob. Environ. Chang. 2021, 70, 102344. [Google Scholar]
- Johannes, L.; Francesc, B. Nature-based solutions as nodes of green-blue infrastructure networks: A cross-scale, co-creation approach. Nat.-Based Solut. 2021, 1, 100006. [Google Scholar]
- Wickham, J.D.; Riitters, K.H.; Wade, T.G.; Vogt, P. A national assessment of green infrastructure and change for the conterminous United States using morphological image processing. Landsc. Urban Plan. 2010, 94, 186–195. [Google Scholar] [CrossRef]
- Jing, S.; Jane, S. Indicating structural connectivity in Amazonian rainforests from 1986 to 2010 using morphological image processing analysis. Int. J. Remote Sens. 2013, 34, 5187–5200. [Google Scholar]
- Xu, F.; Yin, H.W.; Kong, F.H.; Xu, J.G. Developing ecological networks based on mspa and the least-cost path method: A case study in bazhong western new district. Acta Ecol. Sin. 2015, 35, 6425–6434. [Google Scholar]
- WANG, H. Planning an ecological network of Xiamen Island (China) using landscape metrics and network analysis. Landsc. Urban Plan. 2006, 78, 449–456. [Google Scholar]
- Chen, Z.A.; Kuang, D.; Wei, X.J.; Zhang, L.T.; Geomatics, F.O. Developing ecological networks based on MSPA and MCR: A case study in Yujiang county. Resour. Environ. Yangtze Basin 2017, 26, 1199–1207. [Google Scholar]
- Zhang, C.; Feng, Z.; Ren, Q.; Hsu, W.-L. Using systems thinking and modelling: Ecological land utilisation efficiency in the Yangtze Delta in China. Systems 2022, 10, 16. [Google Scholar] [CrossRef]
- Hsu, W.-L.; Shen, X.; Xu, H.; Zhang, C.; Liu, H.-L.; Shiau, Y.-C. Integrated evaluations of resource and environment carrying capacity of the Huaihe River ecological and economic belt in China. Land 2021, 10, 1168. [Google Scholar] [CrossRef]
- Zhang, C.; Wang, C.; Mao, G.; Wang, M.; Hsu, W.-L. An empirical study on the ecological economy of the Huai River in China. Water 2020, 12, 2162. [Google Scholar] [CrossRef]
- Gao, Y.N.; Gao, J.F. Comprehensive assessment of eco-environment impact of the South-to-North Water Transfer Middle Route Project on the middle-lower Hanjiang River basin. Prog. Geogr. 2010, 29, 59–64. [Google Scholar]
- Su, Y.F.; Li, W.M.; Ai, Z.Q.; Liu, D.F.; Zhu, C.H.; Li, J.J.; Sun, X.Y. Establishment and application of the index system for health assessment of the middle and lower reaches of the Hanjiang River. Acta Ecol. Sin. 2019, 39, 3895–3907. [Google Scholar]
- Chao, W.; Qingming, Z.; De, Z.; Huang, Z.; Chen, Y. Spatiotemporal evolution of lakes under rapid urbanization: A case study in Wuhan, China. Water 2021, 13, 1171–1190. [Google Scholar]
- Vogt, P.; Ferrari, J.R.; Lookingbill, T.R.; Gardner, R.H.; Riitters, K.H.; Ostapowicz, K. Mapping functional connectivity. Ecol. Indic. 2009, 9, 64–71. [Google Scholar] [CrossRef]
- Soille, P. Morphological Image Analysis: Principles and Applications, 2nd ed.; Springer: New York, NY, USA, 2003. [Google Scholar]
- Clergeau, P.; Burel, F. The role of spatio-temporal patch connectivity at the landscape level: An example in a bird distribution. Landsc. Urban Plan. 1997, 38, 37–43. [Google Scholar] [CrossRef]
- Taylor, P.D.; Fahrig, L.; Henein, K.; Merriam, G. Connectivity is a vital element of landscape structure. Oikos 1993, 68, 571–573. [Google Scholar] [CrossRef] [Green Version]
- Hu, Q.Y.; Chen, S.L. Optimizing the ecological networks based on the supply and demand of ecosystem services in Xiamen-Zhangzhou-Quanzhou region. J. Nat. Resour. 2021, 36, 342–355. [Google Scholar] [CrossRef]
- Wang, J.M.; Lei, J.C.; Wang, S.; Wu, J.; Liang, Y.; Chen, Y.L.; Xiong, X.; Wang, J.W. Construction and evaluation of terrestrial ecological networks in headwaters region of the Dongjiang River. Chin. J. Ecol. 2020, 39, 3092–3098. [Google Scholar]
- Huang, L.M.; Chen, J.F. Suitability evaluation of urban construction land based on features extraction of a MCR Surface. Resour. Sci. 2014, 36, 1347–1355. [Google Scholar]
- Ostapowicz, K.; Vogt, P.; Riitters, K.H.; Kozak, J.; Estreguil, C. Impact of scale on morphological spatial pattern of forest. Landsc. Ecol. 2008, 23, 1107–1117. [Google Scholar] [CrossRef]
- Yu, Y.P.; Yin, H.W.; Kong, F.H.; Wang, J.J.; XU, W.B. Scale effect of Nanjing urban green infrastructure network pattern and connectivity analysis. Chin. J. Appl. Ecol. 2016, 27, 2119–2127. [Google Scholar]
- Liang, Y.Y.; Zhao, Y.D. Construction and optimization of ecological network in Xi’an based on landscape analysis. Chin. J. Appl. Ecol. 2020, 31, 3767–3776. [Google Scholar]
- Pierre, S.; Peter, V. Morphological segmentation of binary patterns. Pattern Recognit. Lett. 2009, 30, 456–459. [Google Scholar]
- Zhou, T.; Peng, S.L. Spatial scale an measurement of edge effect in ecology. Acta Ecol. Sin. 2008, 28, 3322–3333. [Google Scholar]
- Chen, L.D.; Xu, J.Y.; Fu, B.J.; Lv, Y.H. Quantitative assessment of patch edge effects and its ecological implications. Acta Ecol. Sin. 2004, 24, 1827–1832. [Google Scholar]
- Xiong, C.N.; Wei, H.; Lan, M.J. Analysis of connectivity on greenland landscape in metropolitan region of Chongqing City. Acta Ecol. Sin. 2008, 28, 2237–2244. [Google Scholar]
- Shi, H.; Xian, M.R.; Xu, Y.N.; Xue, J.H.; Liu, H.J. Developing integrated methods to construct urban potential green corridors: A case study of Changzhou city. Sci. Silvae Sin. 2013, 49, 92–100. [Google Scholar]
- Liu, C.F.; Zhou, B.; He, X.Y.; Chen, W. Selection of distance thresholds of urban forest landscape connectivity in Shenyang city. Chin. J. Appl. Ecol. 2010, 21, 2508–2516. [Google Scholar]
- Kong, F.H.; Yin, H.W. Developing green space ecological networks in Jinan City. Acta Ecol. Sin. 2008, 28, 1711–1719. [Google Scholar]
- Bai, M.C.; Ban, X.; Diplas, P.; Xiao, F. Quantifying the spatio-temporal variation of flow and its ecological impacts in the middle-section of Hanjiang River following the Danjiangkou Reservoir impoundment. Resour. Environ. Yangtze Basin 2017, 26, 1476–1487. [Google Scholar]
- Chen, Y.F.; Zhang, X. Long-term trends and sustainability trends of water quality in the middle and lower reaches of Hanjiang main stream. Resour. Environ. Yangtze Basin 2015, 24, 1163–1167. [Google Scholar]
Figure 1.
Overview of the Hanjiang Ecological Economic Zone.

Figure 2.
Spatial variation based on MSPA in the study area in 2010, 2015, and 2020; (A,B)—the Hanjiang River’s upper reaches; (C)—the Danjiangkou Reservoir; (D,E)—the Hanjiang River’s middle and lower reaches).
Figure 2.
Spatial variation based on MSPA in the study area in 2010, 2015, and 2020; (A,B)—the Hanjiang River’s upper reaches; (C)—the Danjiangkou Reservoir; (D,E)—the Hanjiang River’s middle and lower reaches).

Figure 3.
Comprehensive resistance surface.

Figure 4.
BI corridors of the study area.

Figure 5.
BI network of the study area.


Table 1.
Landscape categories and ecological implications based on MSPA [46].
Table 1.
Landscape categories and ecological implications based on MSPA [46].
| Categories | Ecological Implications |
|---|---|
| Core | Foreground pixels surrounded on all sides by foreground pixels and greater than the specified edge width distance from background. |
| Bridge | Foreground pixels that connect two or more disjunct areas of core. |
| Loop | Foreground pixels that connect an area of core to itself. |
| Branch | Foreground pixels that extend from an area of core, but do not connect to another area of core. |
| Edge | Pixels that form the transition zone between foreground and background. |
| Perforation | Pixels that form the transition zone between foreground and background for interior regions of foreground. Consider a group of foreground pixels in the shape of a doughnut. The pixels forming the inner edge would be classified as perforations, whereas those forming the outer edge would be classified as edge. |
| Islet | Foreground pixels that do not contain core. Islet is the only unconnected class. Edges and perforations surround core, and loops, bridges and branches are connected to core. |
Table 2.
Resistance factor classification, weight, and assignment table.
| Resistance Factor | Weight | Grading Index | Resistance Value |
|---|---|---|---|
| Elevation/m | 0.14 | <50 | 1 |
| 50–150 | 3 | ||
| 150–250 | 5 | ||
| 250–350 | 7 | ||
| >350 | 9 | ||
| Slope/(°) | 0.17 | <3 | 1 |
| 3–8 | 3 | ||
| 8–15 | 5 | ||
| 15–25 | 7 | ||
| >25 | 9 | ||
| Landscape use types | 0.22 | Forest land | 1 |
| cultivated land/grassland | 3 | ||
| unutilized land | 5 | ||
| water area | 7 | ||
| construction land | 9 | ||
| Distance from road/m | 0.29 | <500 | 9 |
| 500–1500 | 7 | ||
| 1500–2500 | 5 | ||
| 2500–3500 | 3 | ||
| >3500 | 1 | ||
| Distance from construction land/m | 0.18 | <500 | 9 |
| 500–1500 | 7 | ||
| 1500–2500 | 5 | ||
| 2500–3500 | 3 | ||
| >3500 | 1 |
Table 3.
Results of MSPA analysis of the Hanjiang Ecological Economic Zone.
| Categories | Year | Area (km2) | Proportion (%) |
|---|---|---|---|
| Core | 2010 | 1885.70 | 55.22 |
| 2015 | 1916.31 | 56.60 | |
| 2020 | 2204.18 | 58.69 | |
| Islet | 2010 | 305.12 | 8.93 |
| 2015 | 291.57 | 8.61 | |
| 2020 | 289.72 | 7.71 | |
| Perforation | 2010 | 11.62 | 0.34 |
| 2015 | 12.19 | 0.36 | |
| 2020 | 16.82 | 0.45 | |
| Edge | 2010 | 619.38 | 18.14 |
| 2015 | 607.48 | 17.94 | |
| 2020 | 674.76 | 17.97 | |
| Loop | 2010 | 11.35 | 0.33 |
| 2015 | 15.33 | 0.45 | |
| 2020 | 15.30 | 0.41 | |
| Bridge | 2010 | 228.63 | 6.69 |
| 2015 | 222.82 | 6.58 | |
| 2020 | 219.53 | 5.85 | |
| Branch | 2010 | 353.30 | 10.35 |
| 2015 | 319.87 | 9.45 | |
| 2020 | 335.43 | 8.93 |
Table 4.
The value of the Integral Connectivity of the Landscape in the Study Area from 2010 to 2020.
Table 4.
The value of the Integral Connectivity of the Landscape in the Study Area from 2010 to 2020.
| Year | Number of Links | Number of Components | IIC | PC |
|---|---|---|---|---|
| 2010 | 1346 | 74 | 0.183 | 0.284 |
| 2015 | 1471 | 89 | 0.167 | 0.369 |
| 2020 | 1466 | 85 | 0.239 | 0.561 |
Table 5.
Statistics on the number of BI corridors and nodes.
| Year | BI Corridor | BI Node | Corridor Intersection |
|---|---|---|---|
| 2010 | 105 | 15 | 1733 |
| 2015 | 78 | 13 | 1458 |
| 2020 | 120 | 16 | 1934 |
Table 6.
Evaluation of BI network structure.
| Year | Nodes | Number of Links | α | β | γ |
|---|---|---|---|---|---|
| 2010 | 15 | 20 | 0.24 | 1.33 | 0.51 |
| 2015 | 13 | 12 | 0 | 0.92 | 0.36 |
| 2020 | 16 | 27 | 0.44 | 1.69 | 0.64 |
Publisher’s Note: MDPI stays neutral with regard to jurisdictional claims in published maps and institutional affiliations. |
© 2022 by the authors. Licensee MDPI, Basel, Switzerland. This article is an open access article distributed under the terms and conditions of the Creative Commons Attribution (CC BY) license (https://creativecommons.org/licenses/by/4.0/).
Share and Cite
MDPI and ACS Style
He, P.; Chen, K. Analysis of Blue Infrastructure Network Pattern in the Hanjiang Ecological Economic Zone in China. Water 2022, 14, 1234. https://doi.org/10.3390/w14081234
AMA Style
He P, Chen K. Analysis of Blue Infrastructure Network Pattern in the Hanjiang Ecological Economic Zone in China. Water. 2022; 14(8):1234. https://doi.org/10.3390/w14081234
Chicago/Turabian StyleHe, Pengfei, and Kunlun Chen. 2022. "Analysis of Blue Infrastructure Network Pattern in the Hanjiang Ecological Economic Zone in China" Water 14, no. 8: 1234. https://doi.org/10.3390/w14081234
Note that from the first issue of 2016, this journal uses article numbers instead of page numbers. See further details here.