Article

Compositional Changes and Co-Occurrence Patterns of Planktonic Bacteria and Microeukaryotes in a Subtropical Estuarine Ecosystem, the Pearl River Delta

1
Research and Development Center for Watershed Environmental Eco-Engineering, Advanced Institute of Natural Sciences, Beijing Normal University, Zhuhai 519087, China
2
State Key Laboratory of Water Environment Simulation, School of Environment, Beijing Normal University, Beijing 100875, China
*
Author to whom correspondence should be addressed.
Water 2022, 14(8), 1227; https://doi.org/10.3390/w14081227
Submission received: 19 February 2022 / Revised: 8 April 2022 / Accepted: 8 April 2022 / Published: 11 April 2022

Abstract

:
Planktonic microorganisms in aquatic ecosystems form complex assemblages of highly interactive taxa and play key roles in biogeochemical cycles. However, the microbial interactions within bacterial and microeukaryotic communities, and the mechanisms underpinning the responses of abundant and rare microbial taxa to environmental disturbances in the river estuary remain unknown. Here, 16S and 18S rRNA gene sequencing were used to investigate the compositional changes and the co-occurrence patterns of bacterial and microeukaryotic communities. The results showed that the rare taxa in the bacterial communities were more prevalent than those in the microeukaryotic communities and may influence the resilience and resistance of microorganisms to environmental variations in estuarine ecosystems. The environmental variations had strong effects on the microeukaryotic communities and their assembly mechanisms but not on the bacterial communities in our studied area. However, based on co-occurrence network analyses, the bacterial communities had stronger links and more complex interactions than microeukaryotic communities, suggesting that bacterial networks may help improve the buffering capacities of the estuarine ecosystem against environmental change. The keystone taxa of bacteria mainly belonged to rare subcommunities, which further illustrates that rare taxa may play fundamental roles in network persistence. Overall, these results provide insights into the microbial responses of aquatic ecosystems to environmental heterogeneity.

1. Introduction

Microbes are natural inhabitants and coexist in aquatic systems. Common microbial communities, including members of microbial bacteria and microeukaryotes, contribute significantly to biodiversity and food webs, and form networks of ecological interactions in freshwater environments [1,2]. Aquatic microbiomes play important roles in various biogeochemical cycles and are affected by regional conditions, physicochemical variations, and interspecies interactions in ecosystems [3]. In highly urbanized regions, river ecosystems are speculated to be influenced by human activities, and shifts in microbial communities are expected to be triggered by changes in the conditions of the water environment. The distributions of riverine microbial communities in urban areas are used to investigate the associations of microbial communities and nutrients that are present in the aquatic system, and the impacts of anthropogenic activities on the environment [4]. The distribution patterns of the microbial communities are of great significance for studying the structure, composition, and interactions of microbial communities, and for offering profound insights into the underlying mechanisms that maintain and drive the assembly of microbial communities. Most microorganisms thrive in communities with large numbers and develop a range of relationships including mutualism, commensalism, competition, and antagonism. These ecological interactions are critical evolutionary pressures for natural selection during microbial evolution. Over the past few decades, the diversity of microbial communities and dominant species have been widely reported. However, microbial communities consist not only of a few abundant taxa but also contain many rare taxa [5]. Currently, research interests of rare microbial biospheres are increasing, and fundamentally distinct characteristics of abundant and rare subcommunities have been found in many ecosystems.
In natural ecosystems, the imbalanced structure of communities is universal, particularly the imbalanced species abundance distributions of microbial communities, which consist of many rare species co-existing with relatively few predominant species [6]. The abundant taxa are the main components and usually play central roles in microbial communities [7]. The rare microorganisms could force the ecosystem to respond to environmental change and convert to dominance under favorable conditions [8]. Therefore, the rare taxa have been increasingly considered to play pivotal roles in ecosystems, and these rare taxa may be identified as keystone species in maintaining the stability of community structure and regulating the function of aquatic ecosystems [9,10]. Many fundamental ecosystem services are provided by microbial communities in aquatic environments, such as primary production, trophic transfer, and nutrient recycling. More importantly, different variations in abundant and rare sub-communities could be explained by environmental indicators.
Microbial behaviors are based on living parameters, and the abundant and rare taxa may react differently to the same variations in environments. Studies have indicated that the spatial patterns of the abundant and rare microorganisms are usually different in different ecosystems, and their responses to environmental factors are also distinctly different [11,12,13,14]. All of these findings can be attributed to the niche positions of the abundant and rare subcommunities. The abundant taxa occupy core positions in microbial community structures and are affected by environmental filtering, while the rare taxa possess strong metabolic activities and could become locally extinct under stress or convert to abundant in favorable conditions [5,15]. Examining the correlations of the abundant and rare microbes to environmental changes is useful to understand the intrinsic biodiversity-stability relationships of microbial communities.
Rivers host complex and diverse microbial communities that are the dynamic components of riverine ecosystems and contribute to drive nutrient cycling. The use of network analysis in recent years has allowed us to effectively investigate the co-occurrence network patterns in river microbial communities across a wide spatial scale [16,17]. Recent studies have indicated that using topology analyses of large networks is a powerful method for studying the patterns at various taxonomic levels and identifying the keystone microbial groups based on the large and complex microbial community datasets. Uncovering the inner ecological relationships and keystone taxa of bacterial and microeukaryotic communities by using network analysis is of great importance to better understand the ecological structures of microbial communities.
The focus of this study is the Pearl River Delta region of China, which consist of numerous tributaries and many cities. This area is comprised of multiple landforms from mountains to plains, and multilevel economic regions from backward to developed. The estuarine ecosystem is highly correlated with a dense population and growing urbanization. Here, our main objectives are to (i) explore the distribution pattern of bacterial and microeukaryotic communities in the subtropical estuarine ecosystem; (ii) identify the major influencing mechanisms and factors that regulate the abundant and rare microbial subcommunities; and (iii) uncover the differences of the co-occurrence patterns between the bacterial and microeukaryotic communities. The results contribute to a better understanding of the biogeochemical processes of the planktonic microorganisms and of the intrinsic mechanisms that maintain microbial diversity in this essential habitat in the subtropical estuary.

2. Materials and Methods

2.1. Study Area

Our study area is located in Guangdong Province, China, and is downstream of the Pearl River (Zhujiang River). The river consists of three main tributaries, namely the Xijiang River, Beijiang River, and Dongxiang River, which are distributed to the west, north, and east of the estuary, respectively (Figure S1). In this study area, the Dongxiang River flows through Heyuan, Huizhou, and Dongguan; the Beijiang River flows through Qingyuan and Guangzhou (the center and provincial capital city of Guangdong Province); and the Xijiang River flows through Yunfu, Zhaoqing, Zhongshan Zhuhai, and a part of Guangzhou. The region belongs to the subtropical zone and is within the transitional zone of the East Asian monsoon system, with an annual mean temperature of approximately 20–25 °C and annual mean precipitation of 1600–2000 mm [18,19].
The entire study area is one of three urban agglomeration areas in China with an area of 4.1 × 10⁴ km2 and provides a major water source for more than 60.41 million people [20]. Water samples were collected from the upstream to downstream areas of Guangdong Province in the Pearl Basin during July 2020.

2.2. Sampling

Three replicate surface water samples (upper 50–100 cm) were randomly obtained with a Ruttner sampler (Hydro-Bios, Altenholz, Germany) at each location to provide representative samples (2.0 L). Subsequently, each sample was divided into two subsamples: one was acid fixed and stored in the dark at 4 °C for further water chemical analyses, and the other subsample (100 mL) was filtered through 0.22 μm Millipore polycarbonate membranes. The filters were then immediately frozen in dry ice and kept at −80 °C until further processing of DNA extraction.

2.3. Chemical Analyses

The pH and water electrical conductivity (EC) values were measured in the field with a YSI multiparameter water quality sonde (YSI, Yellow Springs, OH, USA). The dissolved organic carbon (DOC) levels were determined by a Shimadzu TOC analyzer (TOC-VCPH, Shimadzu Scientific Instruments, Columbia, MD, United States). Following the Clean Water Act Analytical Methods of the United States Environmental Protection Agency, the total nitrogen (TN), nitrate (NO3), and ammonia (NH4+) contents were analyzed using ion chromatography. The total phosphorus (TP) and soluble reactive phosphorus (SRP) values were determined using the ascorbate acid colorimetric method.

2.4. Molecular Methods

The total genomic DNA was extracted from the filter using a DNA extraction kit and followed the manufacturer’s instructions. The DNA concentrations were verified with a NanoDrop and agarose gel. The genomic DNA was used as a template for PCR amplification with barcoded primers and Tks Gflex DNA Polymerase (Takara). For the bacteria analysis, the V3–V4 variable regions of the 16S rRNA genes were amplified with the universal primers 343 F (5′-TACGGRAGGCAGCAG-3′) and 798 R (5′-AGGGTATCTAATCCT-3′). For the microeukaryotes analysis, the V4–V5 variable regions of the 18S rRNA genes were amplified with the universal primers 817 F (5′-TTAGCATGGAATAATRRAATA GGA-3′) and 1196 R (5′-TCTGGACCTGGTGAAGTTTCC-3′). All acquired DNA samples were PCR-amplified and reacted. The PCR products were pooled in equal amounts for purification and were sequenced on the Illumina HiSeq2500 platform (Illumina, Inc., San Diego, CA, USA). Raw sequence data were clustered into operational taxonomic units (OTUs) according to their sequence similarities at a 97% similarity level. The representative reads of each OTU were selected using the QIIME package. All representative reads were annotated and blasted against the SILVA database Version 123 (16S/18S rDNA) using QIME.

2.5. Bioinformatics

The OTU classifications in our study were defined based on the cutoff levels of the relative abundances. The OTUs that had mean relative abundances above 0.1% were defined as “abundant” OTUs, those with relative abundances below 0.01% were defined as “rare” OTUs, and those in between were defined as “intermediate” OTUs [21]. To investigate the relationships of the microbial community and environmental factors, Mantel tests (e.g., the Mantel function in the vegan 2.5–7 package) were performed to calculate the correlations among the environmental dissimilarities using R (v3.6.3, http://www.rproject.org, accessed on 18 February 2022). The results of the significance tests with p < 0.05 were reported as significant. Network analysis was constructed based on 16S and 18S rRNA gene amplicon sequencing data, revealing the co-occurrence patterns of the microbial communities. First, to simplify the dataset, the OTUs that were present in more than 20% of samples with more than 20 sequences were retained. Second, correlation matrices were constructed by calculating the possible pairwise Spearman’s rank correlations based on the OTU levels by R software. A connection means a strong (Spearman r > 0.8 or r < −0.8) and significant (p < 0.05) correlation. Finally, all calculations of network properties were conducted by R software, and visualization was provided by Gephi (WebAtlas, Paris, France). To assess the possible topological roles of the taxa in the networks, the nodes were classified into four categories based on the within-module connectivity (Zi) and among-module connectivity (Pi) values [22,23,24]. Additionally, the taxonomic dissimilarities of the major modules (>10%) were calculated based on the Bray–Curtis distances in terms of the relative abundances of the OTUs in the module. The relationships among different modules and communities for the bacteria and microeukaryotes were also assessed using Mantel tests. Raw sequence data can be accessed at the China National Center for Bioinformation (GSA: CRA006055).

3. Results

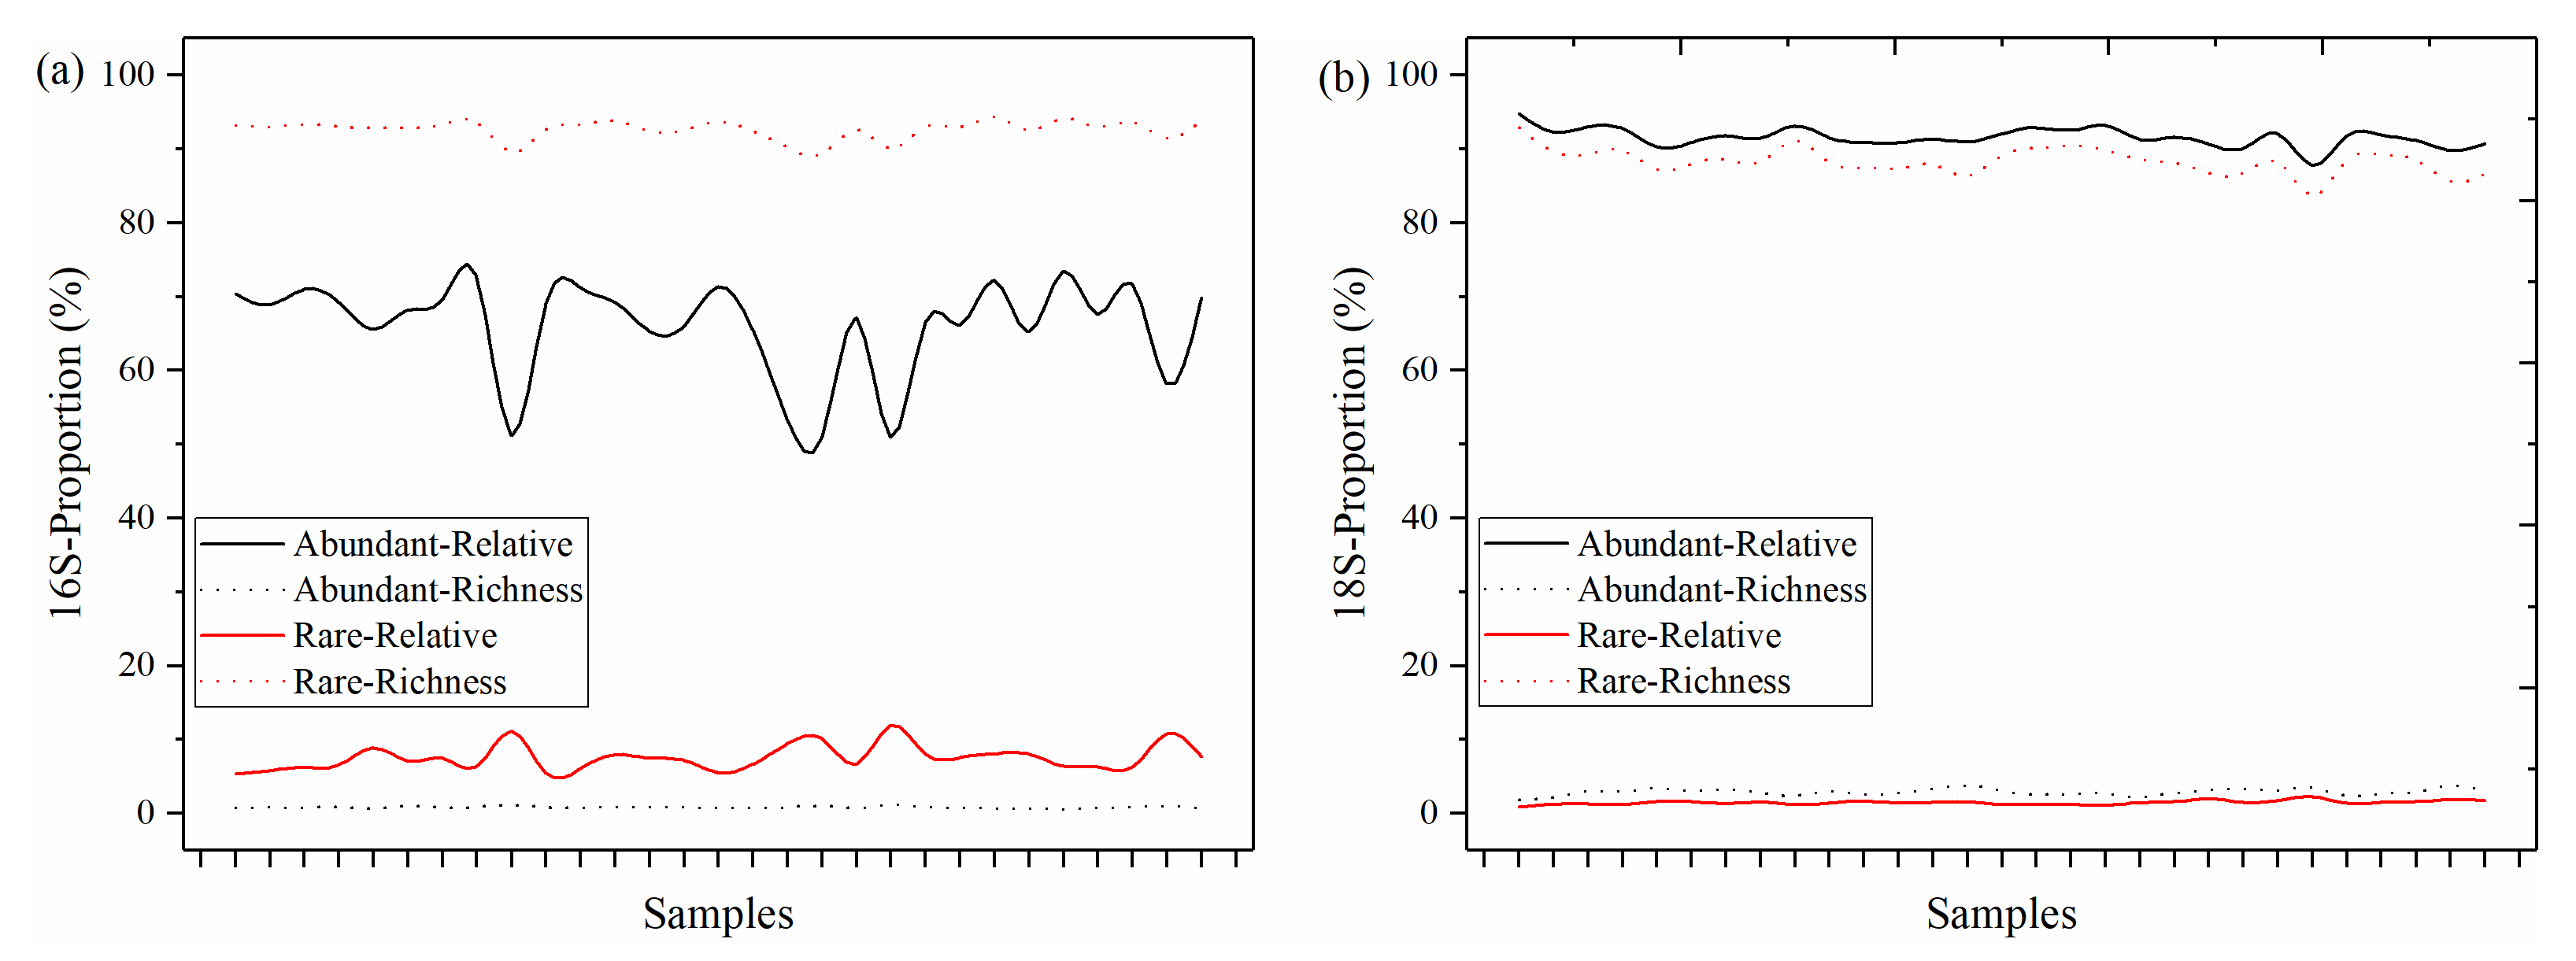
3.1. The Distributions of Abundant and Rare Taxa of Bacteria and Microeukaryotes

For the bacteria, a total of 643,055 high-quality sequences (based on 16S rDNA) were identified after the quality filtering and the removal of chimeric sequences, and 14,954 OTUs (at 97% similarity level) were clustered from the entire sequencing dataset across all samples. For the microeukaryotes, 2320 microeukaryotic OTUs (at 97% similarity level) with 817,969 high-quality sequences of the 18S rDNA gene were obtained in this study. In the bacterial dataset, 115 OTUs (0.33%), which contained 57.56% of all sequences, were classified into the abundant taxa, and 13,928 OTUs (41.15%), which contained 17.10% of all sequences, were classified into the rare taxa. In the microeukaryotic dataset, 86 OTUs (3.71%), which contained 90.68% of all sequences, were classified as abundant, and 1920 OTUs (82.76%), which contained 3.16% of all sequences, were classified as rare among the microeukaryotes.
Moreover, 92.90% of the OTUs on average represented the rare taxa but only accounted for 7.56% of the average relative abundance of all sites in the bacterial community. Conversely, the abundant taxa, which had a very low proportion of the OTUs (mean = 0.81%), accounted for 66.13% of the average relative abundance (Figure 1a). In the microeukaryotic community, the abundant taxa generally accounted for a significantly lower proportion of the OTUs (mean = 2.85%) and a larger proportion of the average relative abundance (mean = 91.57%) in each sample when compared with the rare taxa (means = 88.66% and 1.49%, respectively) (Figure 1b). The results indicated that distinct distribution patterns of abundant and rare subcommunities were exhibited in both the bacterial and microeukaryotic communities. Overall, similar trends were observed between the 16S bacterial and 18S microeukaryotic communities in the river, but the abundant taxa were more predominant in the microeukaryotic community when compared to the 16S findings.

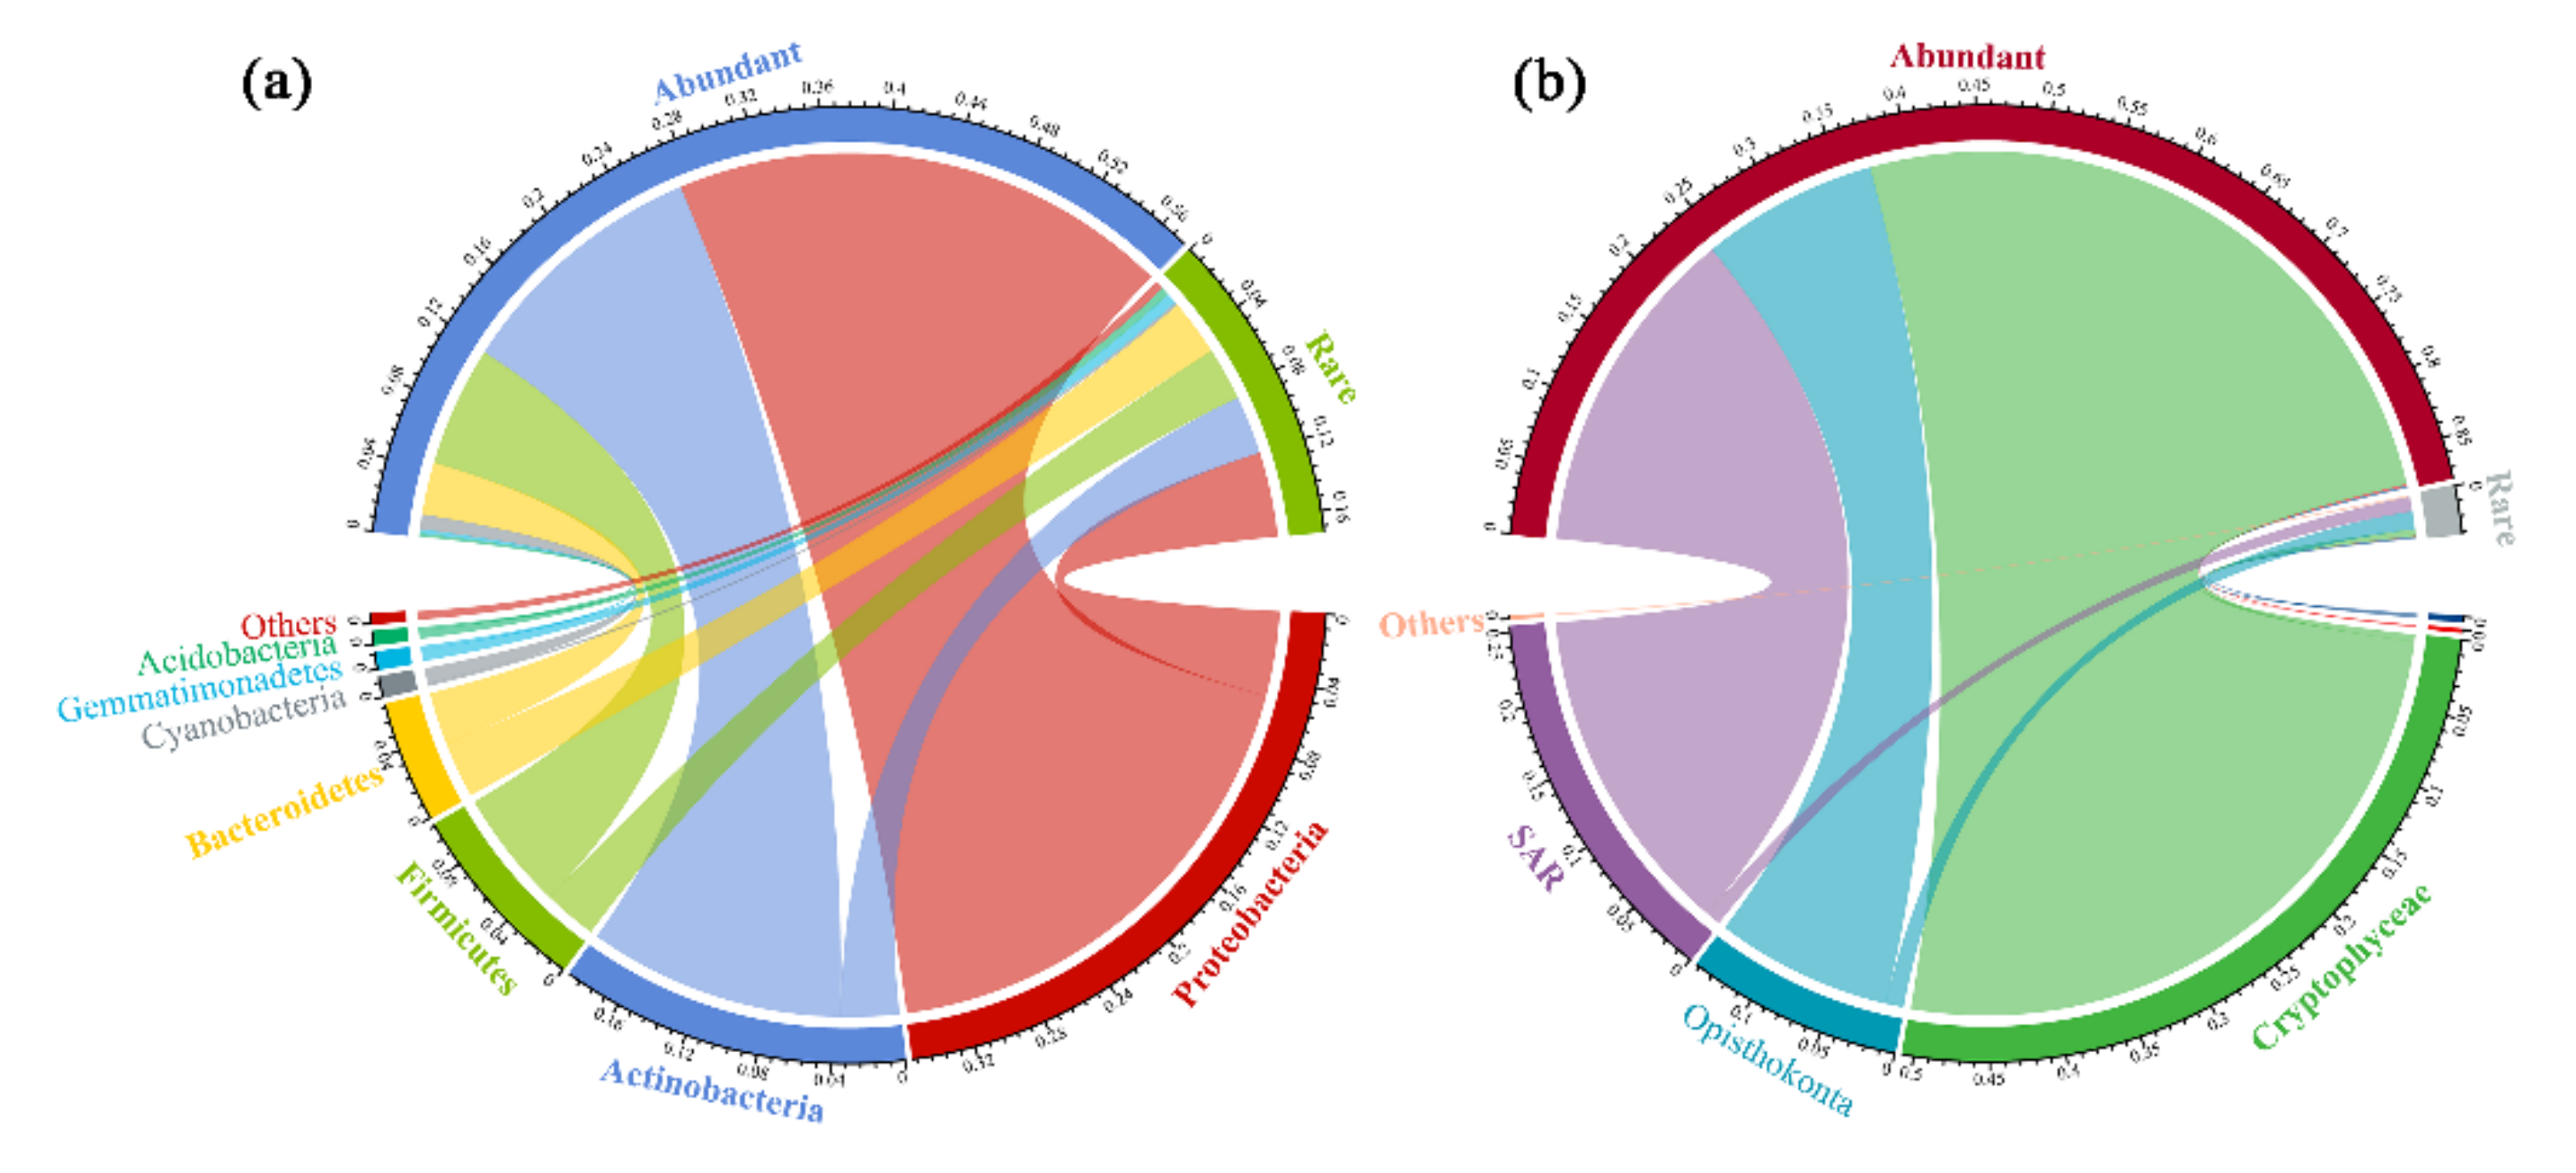
3.2. Taxonomic Compositions of the Abundant and Rare Subcommunities

Based on the proportions of microbial OTUs that were assigned to each taxonomic group, the microbial composition of each sample was calculated. The bacterial OTUs consisted mainly (mean relative abundance > 1%) of Proteobacteria, Actinobacteria, Firmicutes, Bacteroidetes, Gemmatimonadetes, and Cyanobacteria (Figure S2a). The phylogenetic diversity of microeukaryotic OTUs covered 14 lineages (Figure S2b). Cryptophyceae, SAR, and Opisthokonta were the dominant lineages with a mean relative abundance of 52.13%, 28.83%, and 18.10%, respectively. To explore the taxonomic distribution of the microbial community at the regional level, we observed the domain phyla of the abundant and rare taxa in the bacterial and microeukaryotic subcommunities (Figure 2).
The results showed great phylogenetic diversity in both the rare and abundant subcommunities in our study. The abundant taxa in the bacterial community mostly belonged to Proteobacteria, Actinobacteria, and Firmicutes; moreover, the rare taxa were primarily composed of Proteobacteria, Actinobacteria, and Bacteroidetes (Figure 2a). In contrast, the microeukaryotic community was not as diverse as the bacterial community, with fewer taxa present overall. For the microeukaryotic abundant subcommunities, the dominant lineage was Cryptophyceae, which was followed by SAR and Opisthokonta. For microeukaryotic rare subcommunities, the dominant lineage was Opisthokonta, which was followed by SAR and Cryptophyceae similarly (Figure 2b).

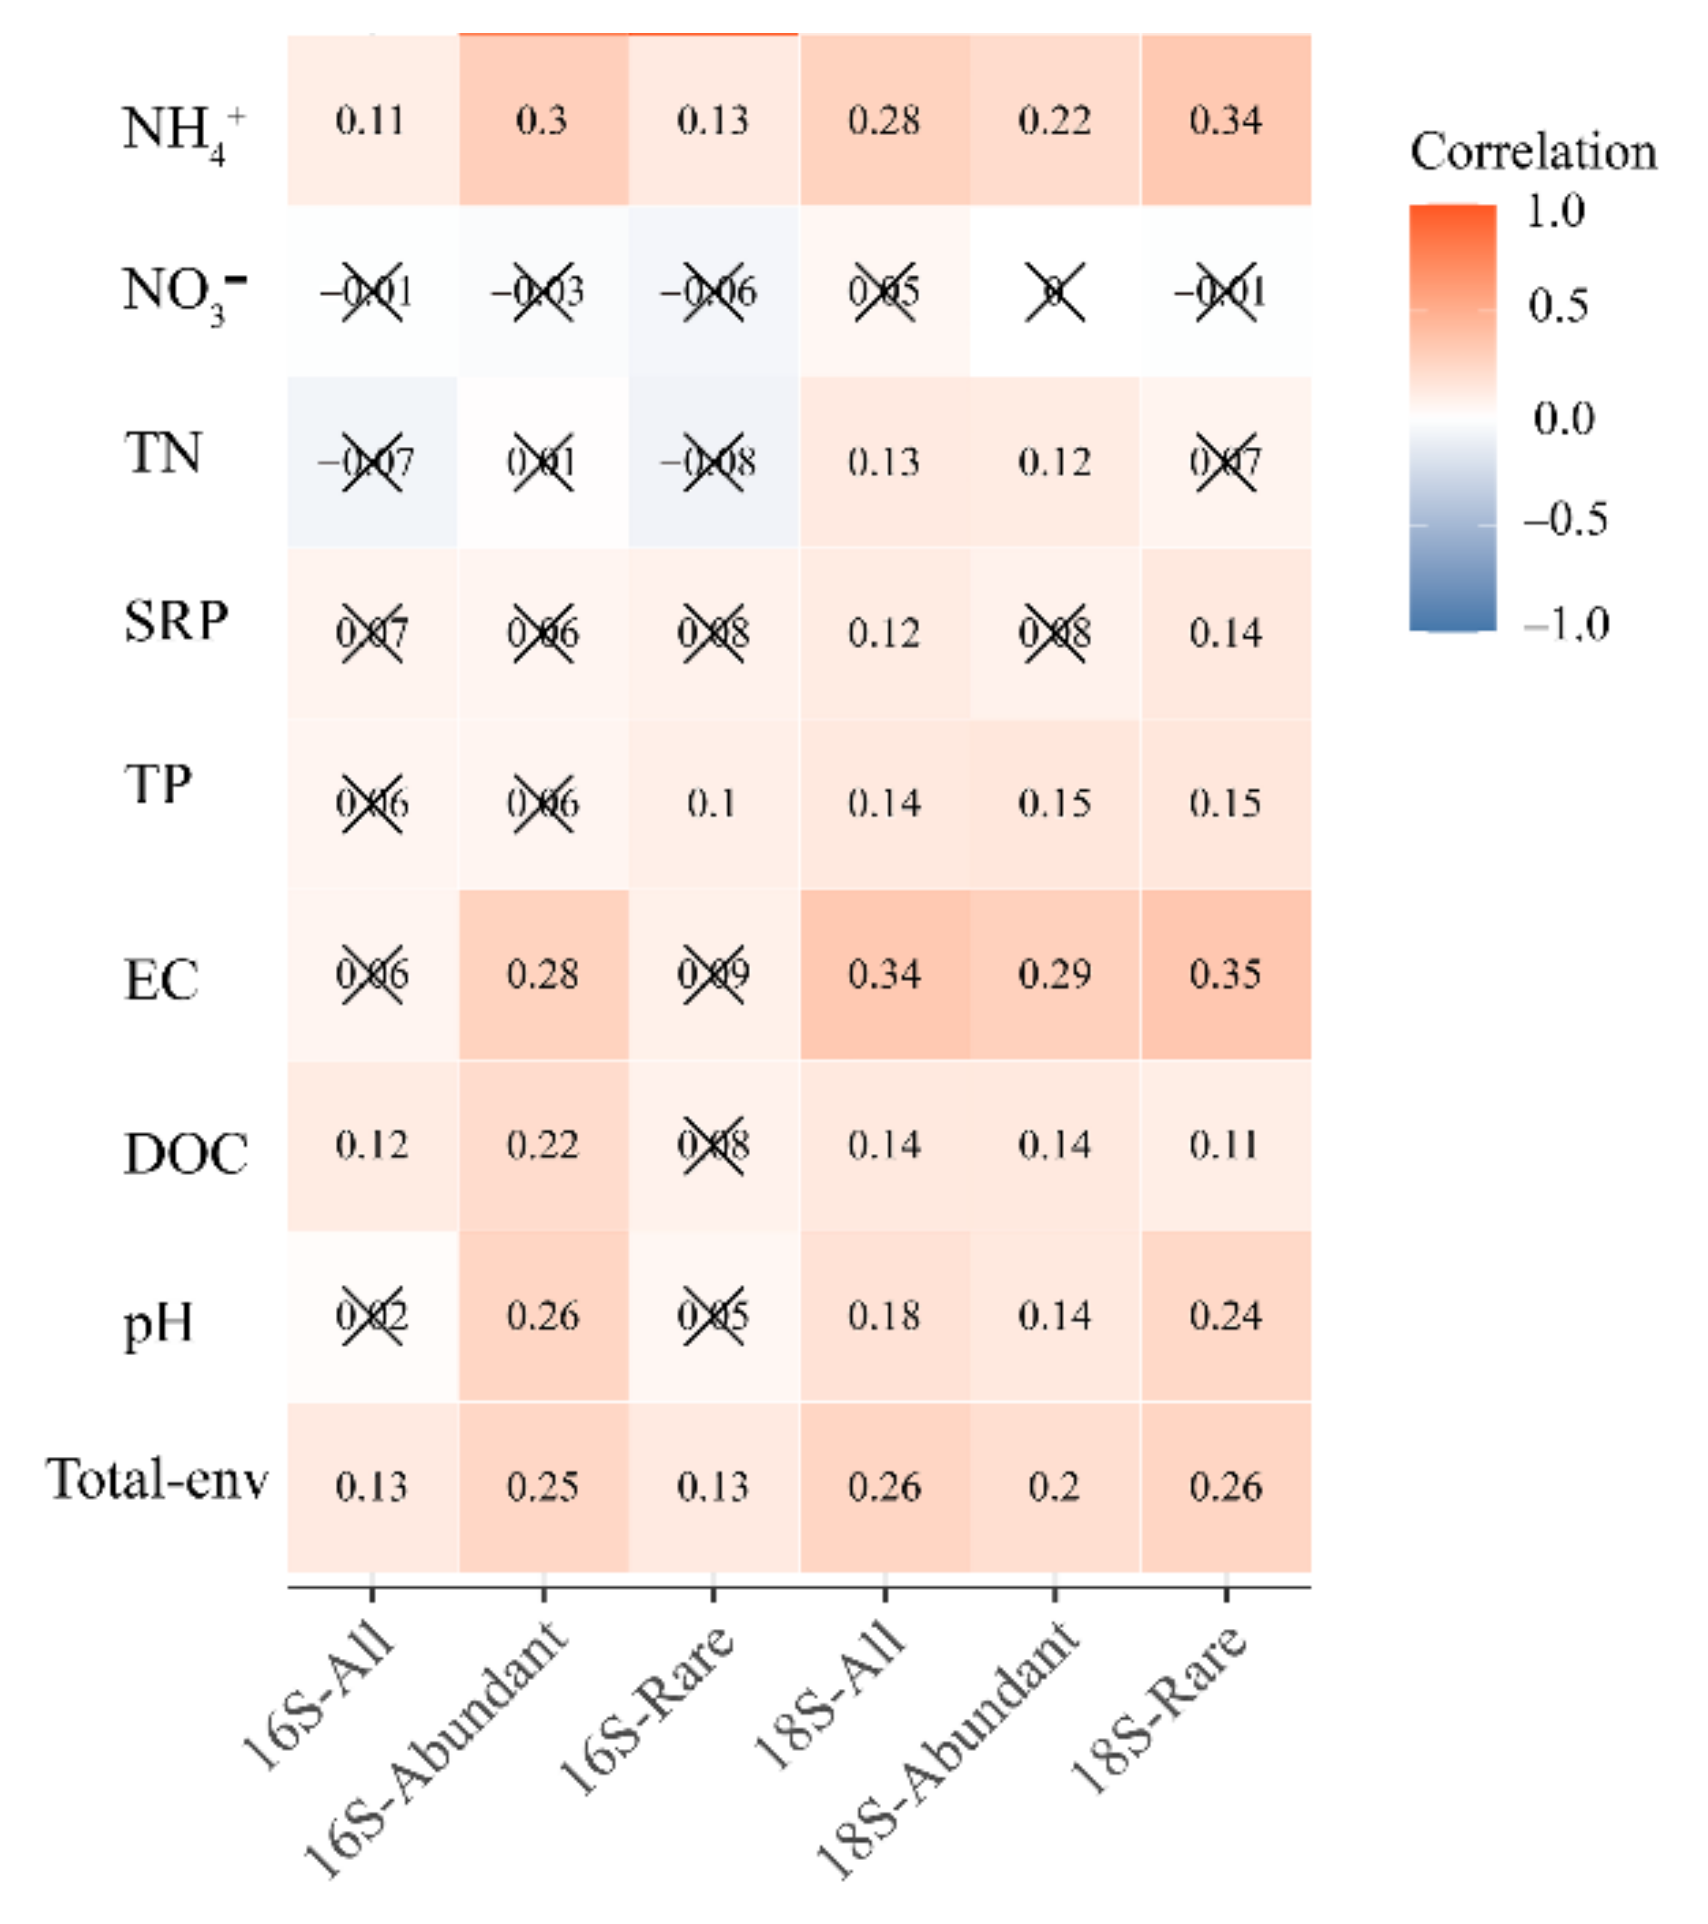
3.3. Environmental Variables Related to the Bacterial and Microeukaryotic Communities and Subcommunities

To investigate the relationships among the microbial communities and environmental factors, the Mantel test was performed (Figure 3). The results indicated that the variations in all of the abundant and rare communities of the bacteria and microeukaryotes resulted from the environmental distances of all samples. The abundant bacterial subcommunities were significantly related to the pH, DOC, EC, and NH4+, while the rare subcommunities were only significantly related to TP and NH4+. In addition, among these environmental properties, only DOC was significantly correlated with the entire bacterial communities.
Interestingly, a further analysis showed that all environmental properties, except for NO3, were significantly correlated with all of the microeukaryotic communities. The results showed that the abundant microeukaryotic subcommunities were significantly related to pH, DOC, EC, TP, TN, and NH4+. In contrast to the abundant taxa, the pH, DOC, EC, TP, SRP, and NH4+ levels were significantly related to the rare taxa of the microeukaryotic communities. By comparing the bacteria and microeukaryotes and their respective abundant and rare subcommunities, the microeukaryotes were shown to be more susceptible to environmental change. The abundant bacterial subcommunities had higher correlations with environmental factors than did rare subcommunities.

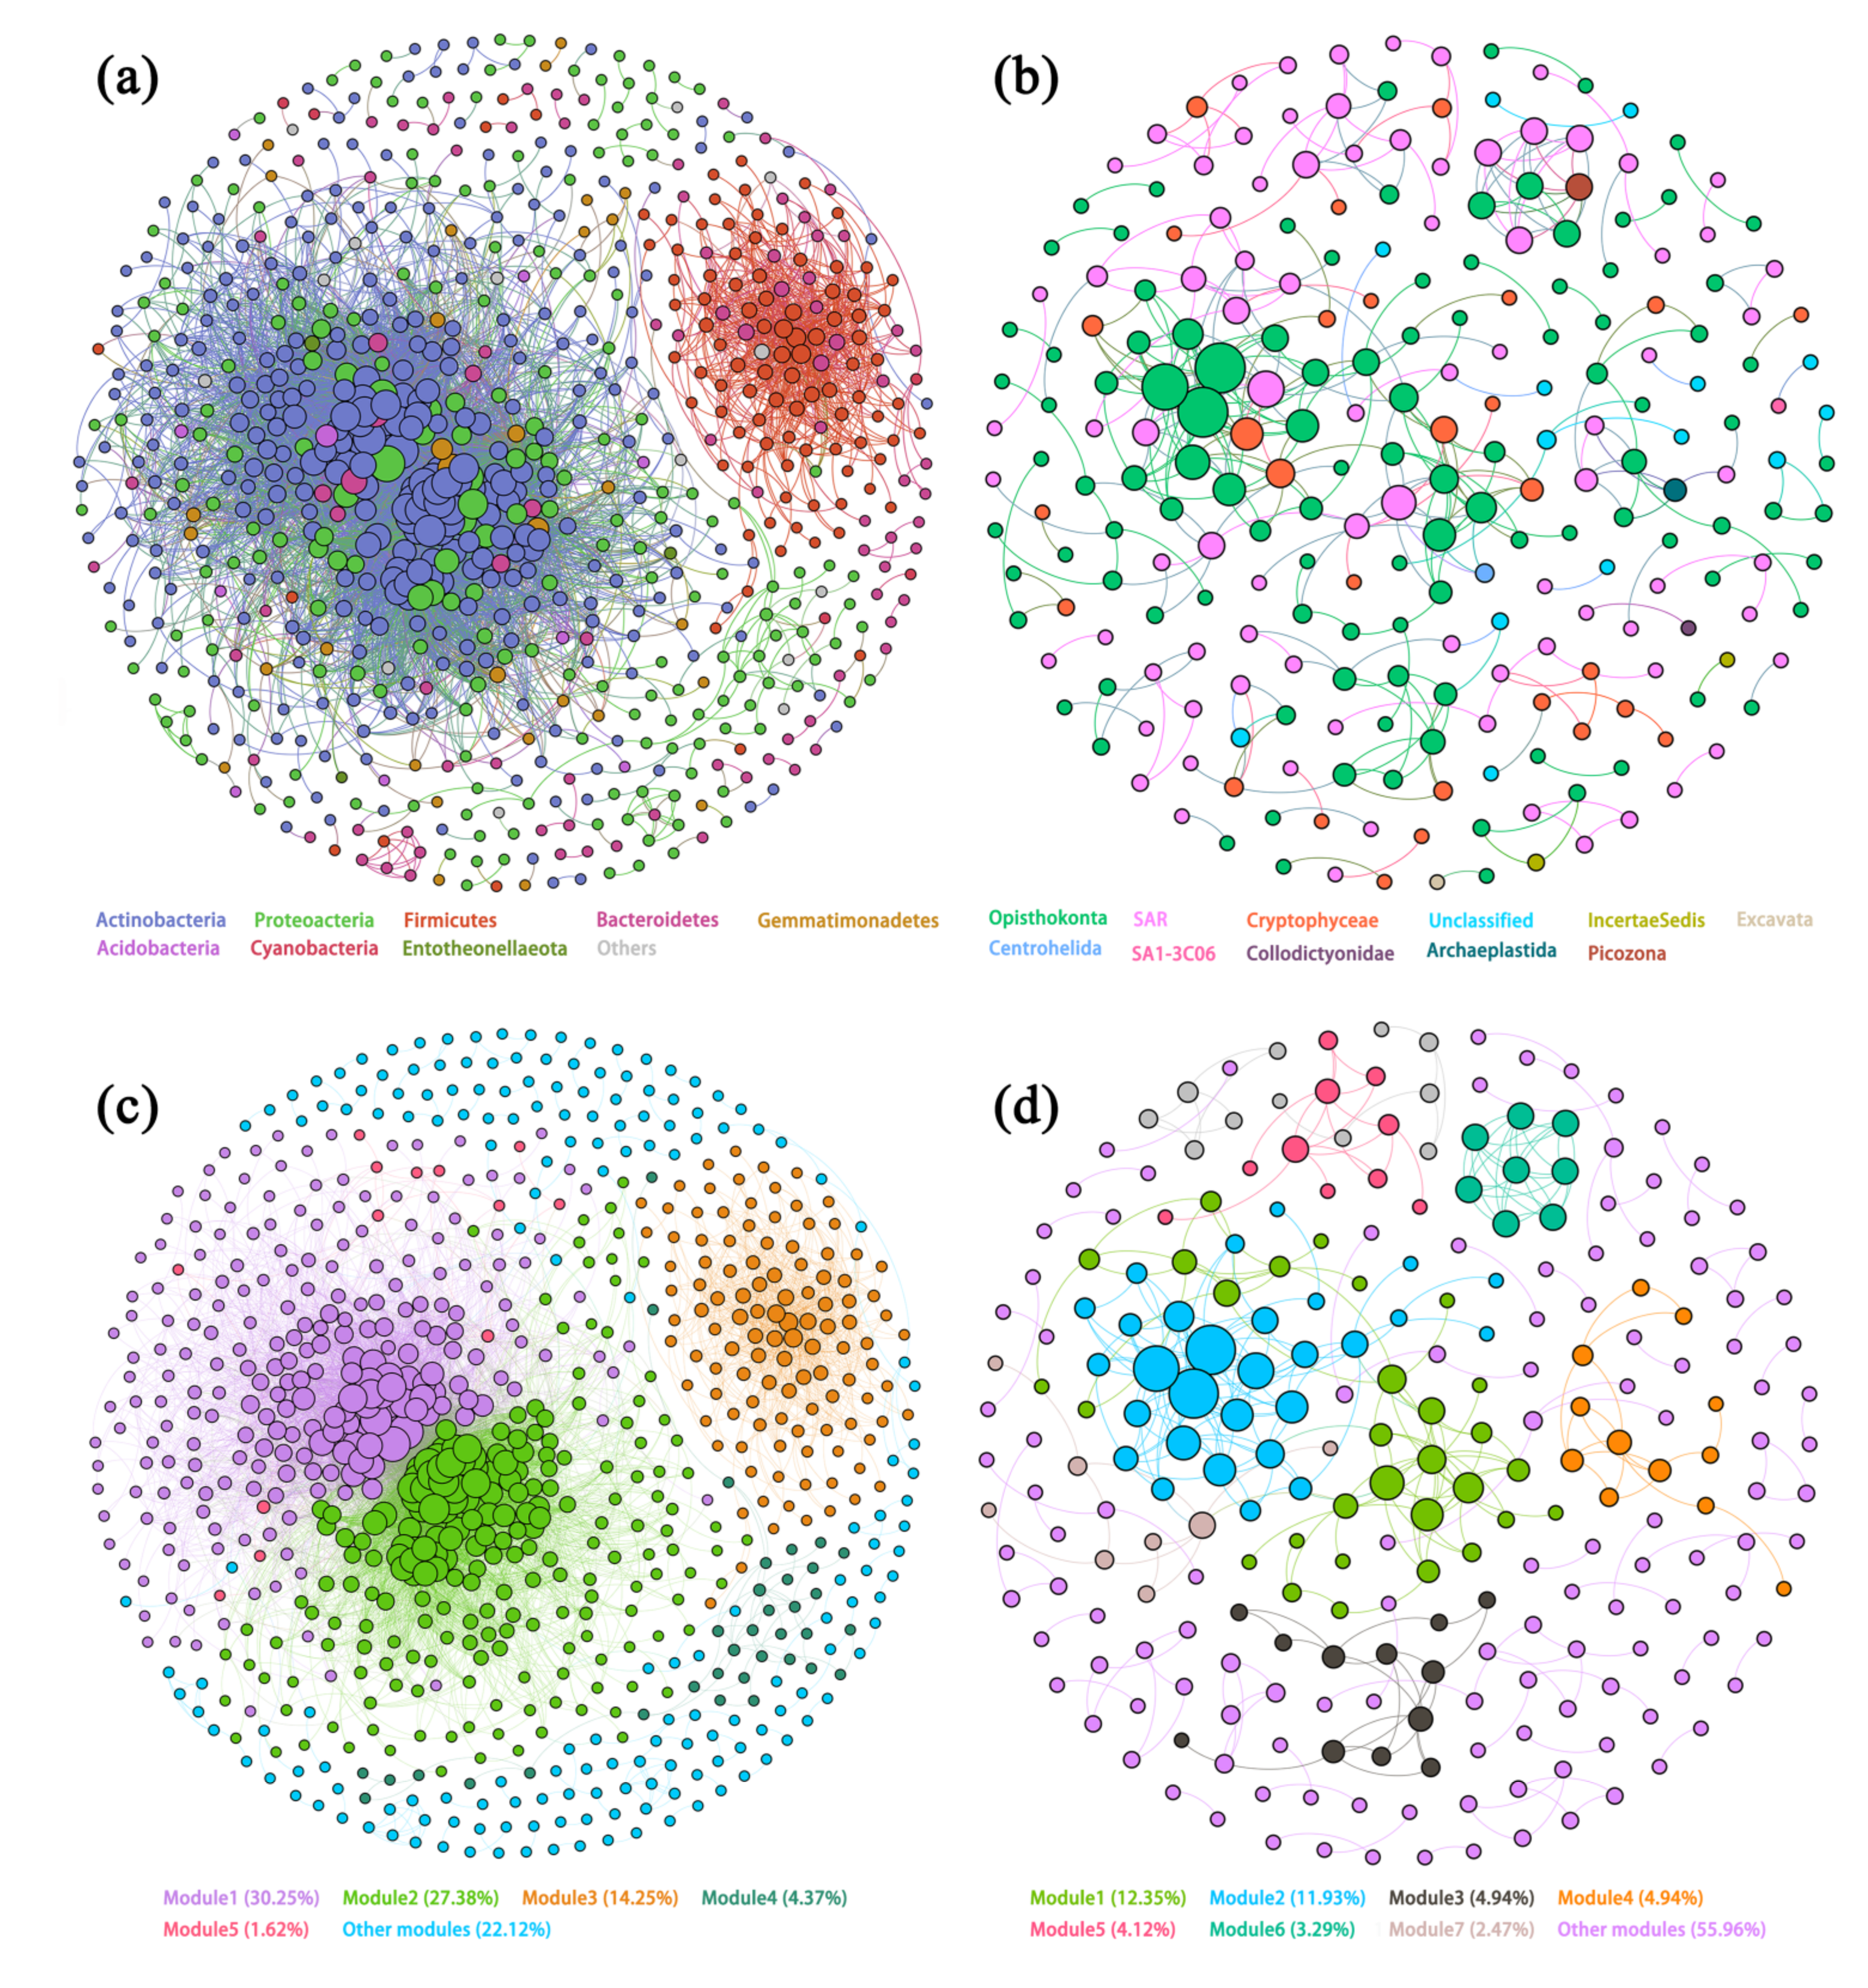
3.4. Co-Occurrence Networks of Different Microbial Communities

Network analysis based on strong and significant correlations was used to build the co-occurrence patterns among the OTUs of bacteria and microeukaryotes (Figure 4). Furthermore, the metacommunity co-occurrence network was built based on bacterial and microeukaryotic subcommunities (Figure S3). In all networks, the number of positive correlations was much higher than negative ones. The 16S network consisted of 800 nodes linked by 9628 edges, and it was primarily occupied by Actinobacteria, Proteobacteria, and Firmicutes (Figure 4a). The bacterial co-occurrence network was clearly parsed into five major modules, which included modules 1 and module 2 occupying 30.25% and 27.38% of the whole network, respectively (Figure 4c). Moreover, the 18S network contained 736 nodes that were linked by 4670 edges, and it consisted of Opisthokonta, SAR, and Cryptophyceae (Figure 4b). Five major modules were also parsed in the microeukaryotic network, and modules 1 and module 2 accounted for 30.03% and 25.82%, respectively (Figure 4d).
The node-level topological features of the 16S and 18S taxa were examined (Table 1), and the degree, betweenness centrality, and closeness centrality were higher in the bacterial network than in the microeukaryotic network. The average degree of the bacterial network was larger than that of the microeukaryotic network, which illustrated the tighter connectivity of bacterial taxa. The average path length was lower in the bacterial network, which revealed closer relationships among the bacterial communities. These results indicated that species co-occurred more frequently within the bacterial communities than in the microeukaryotic communities.

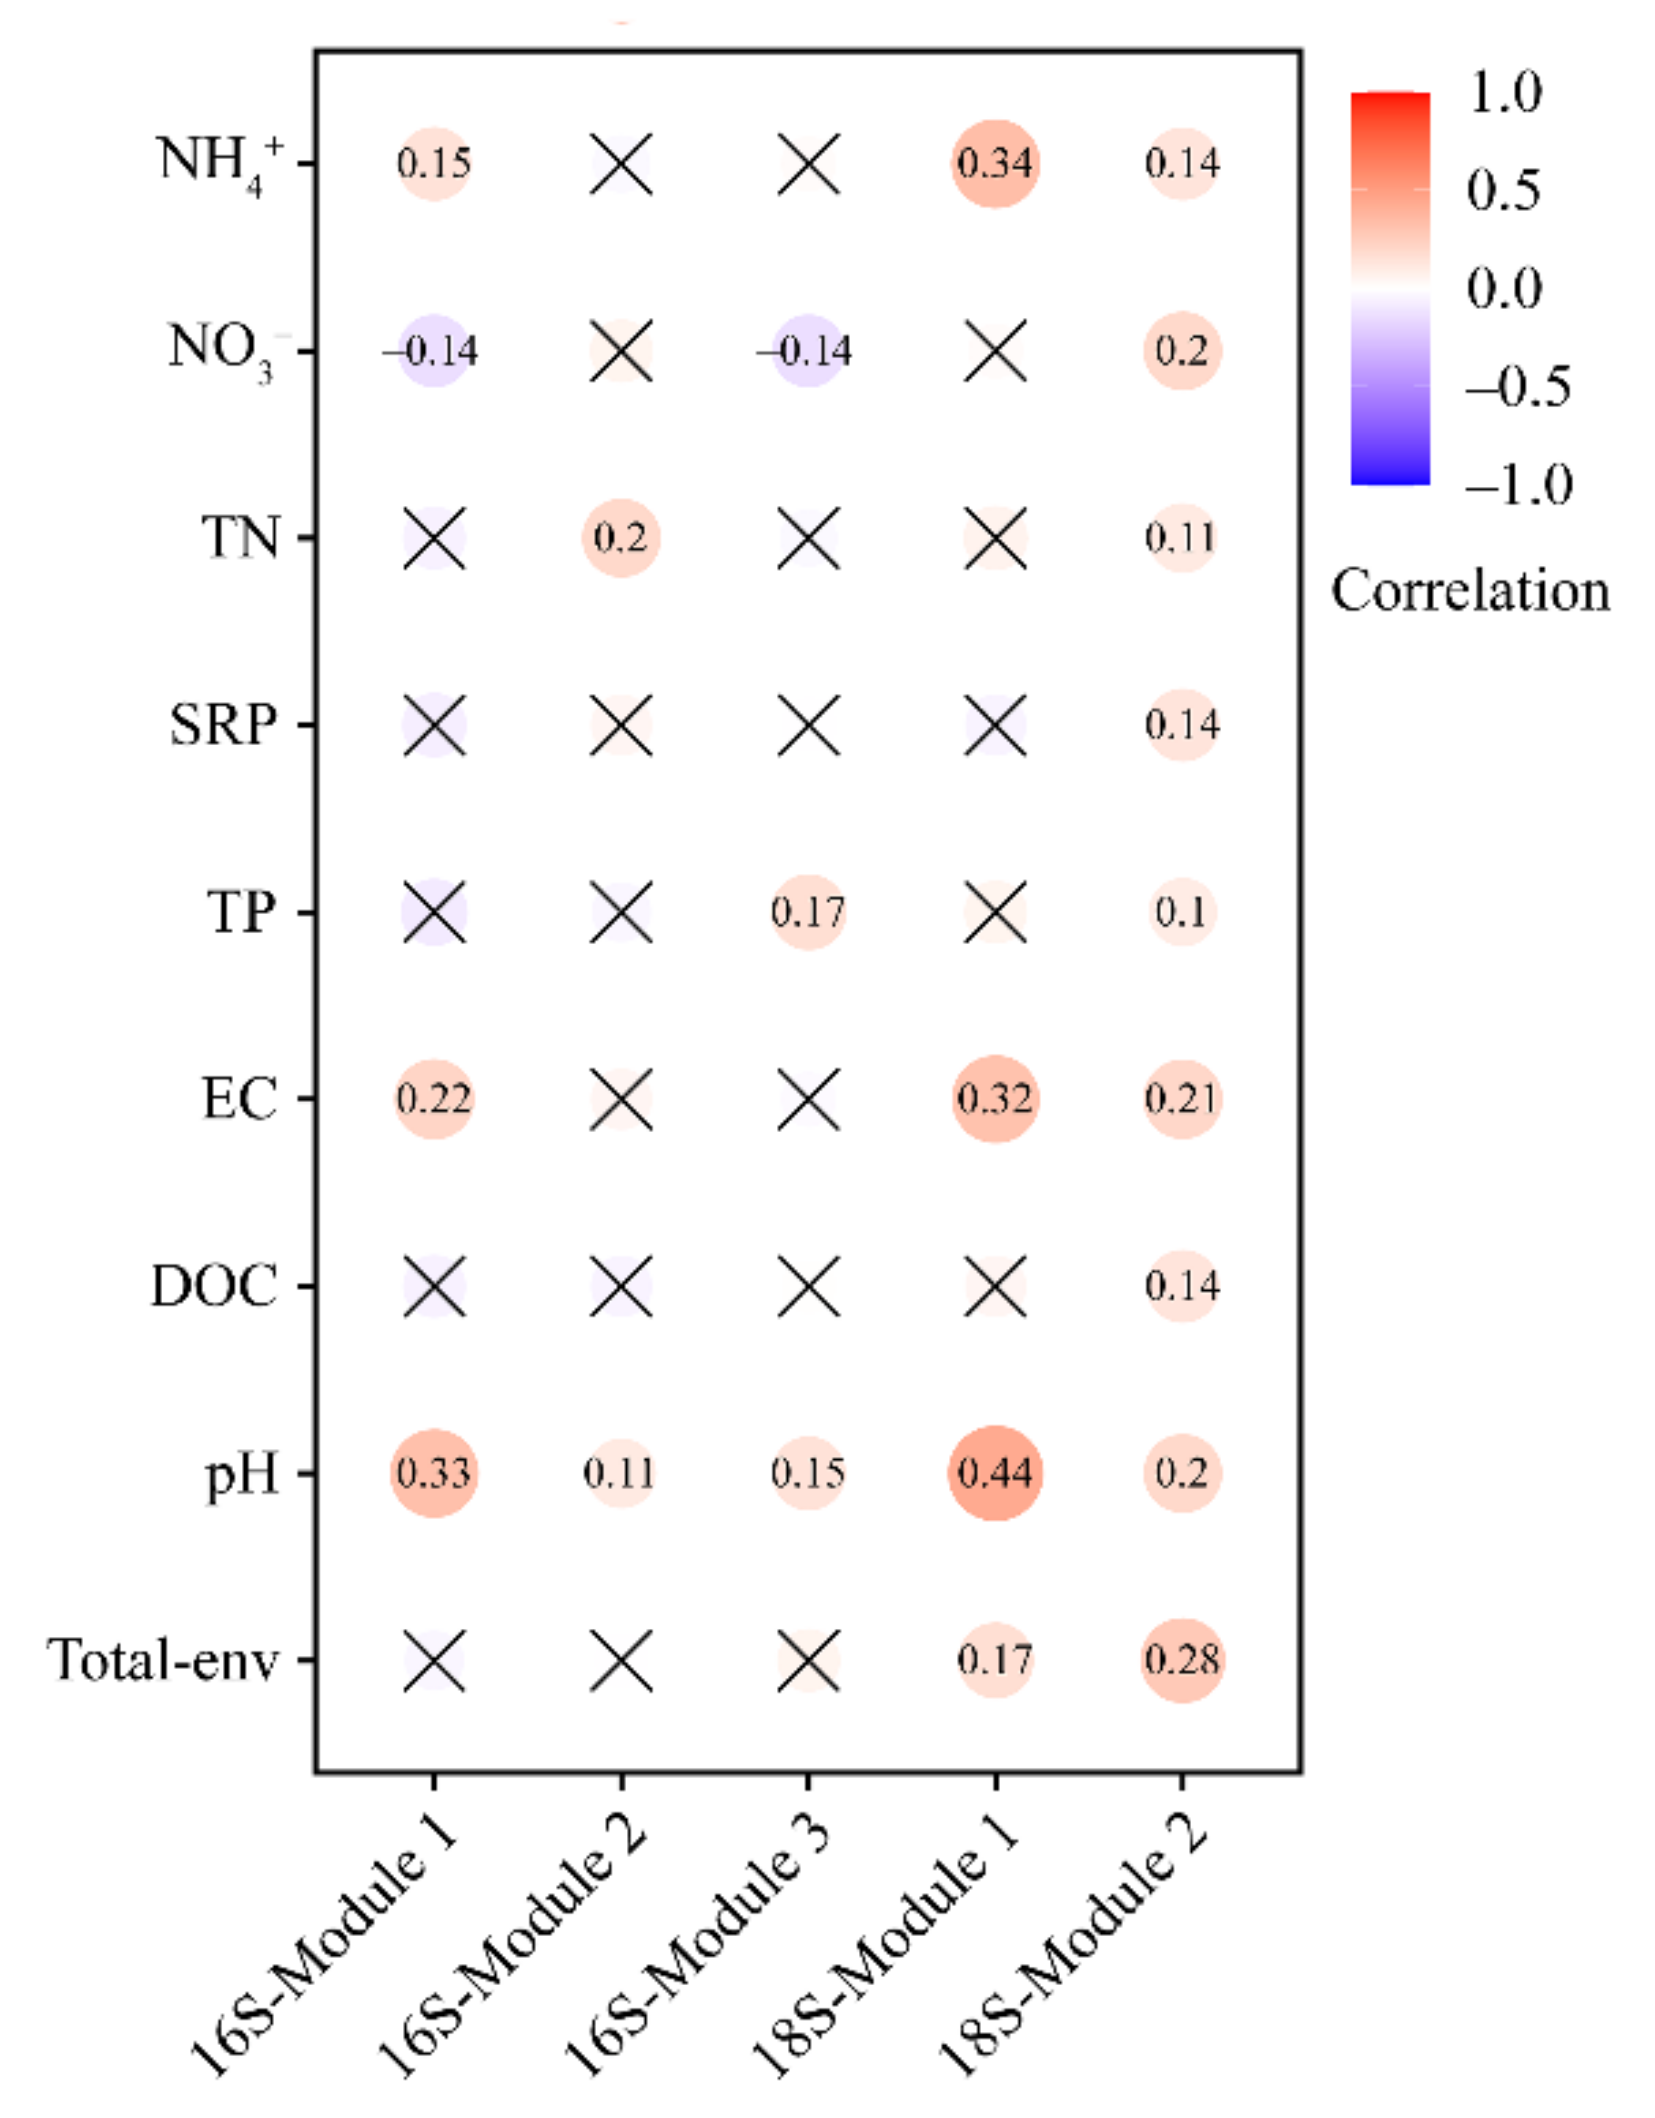
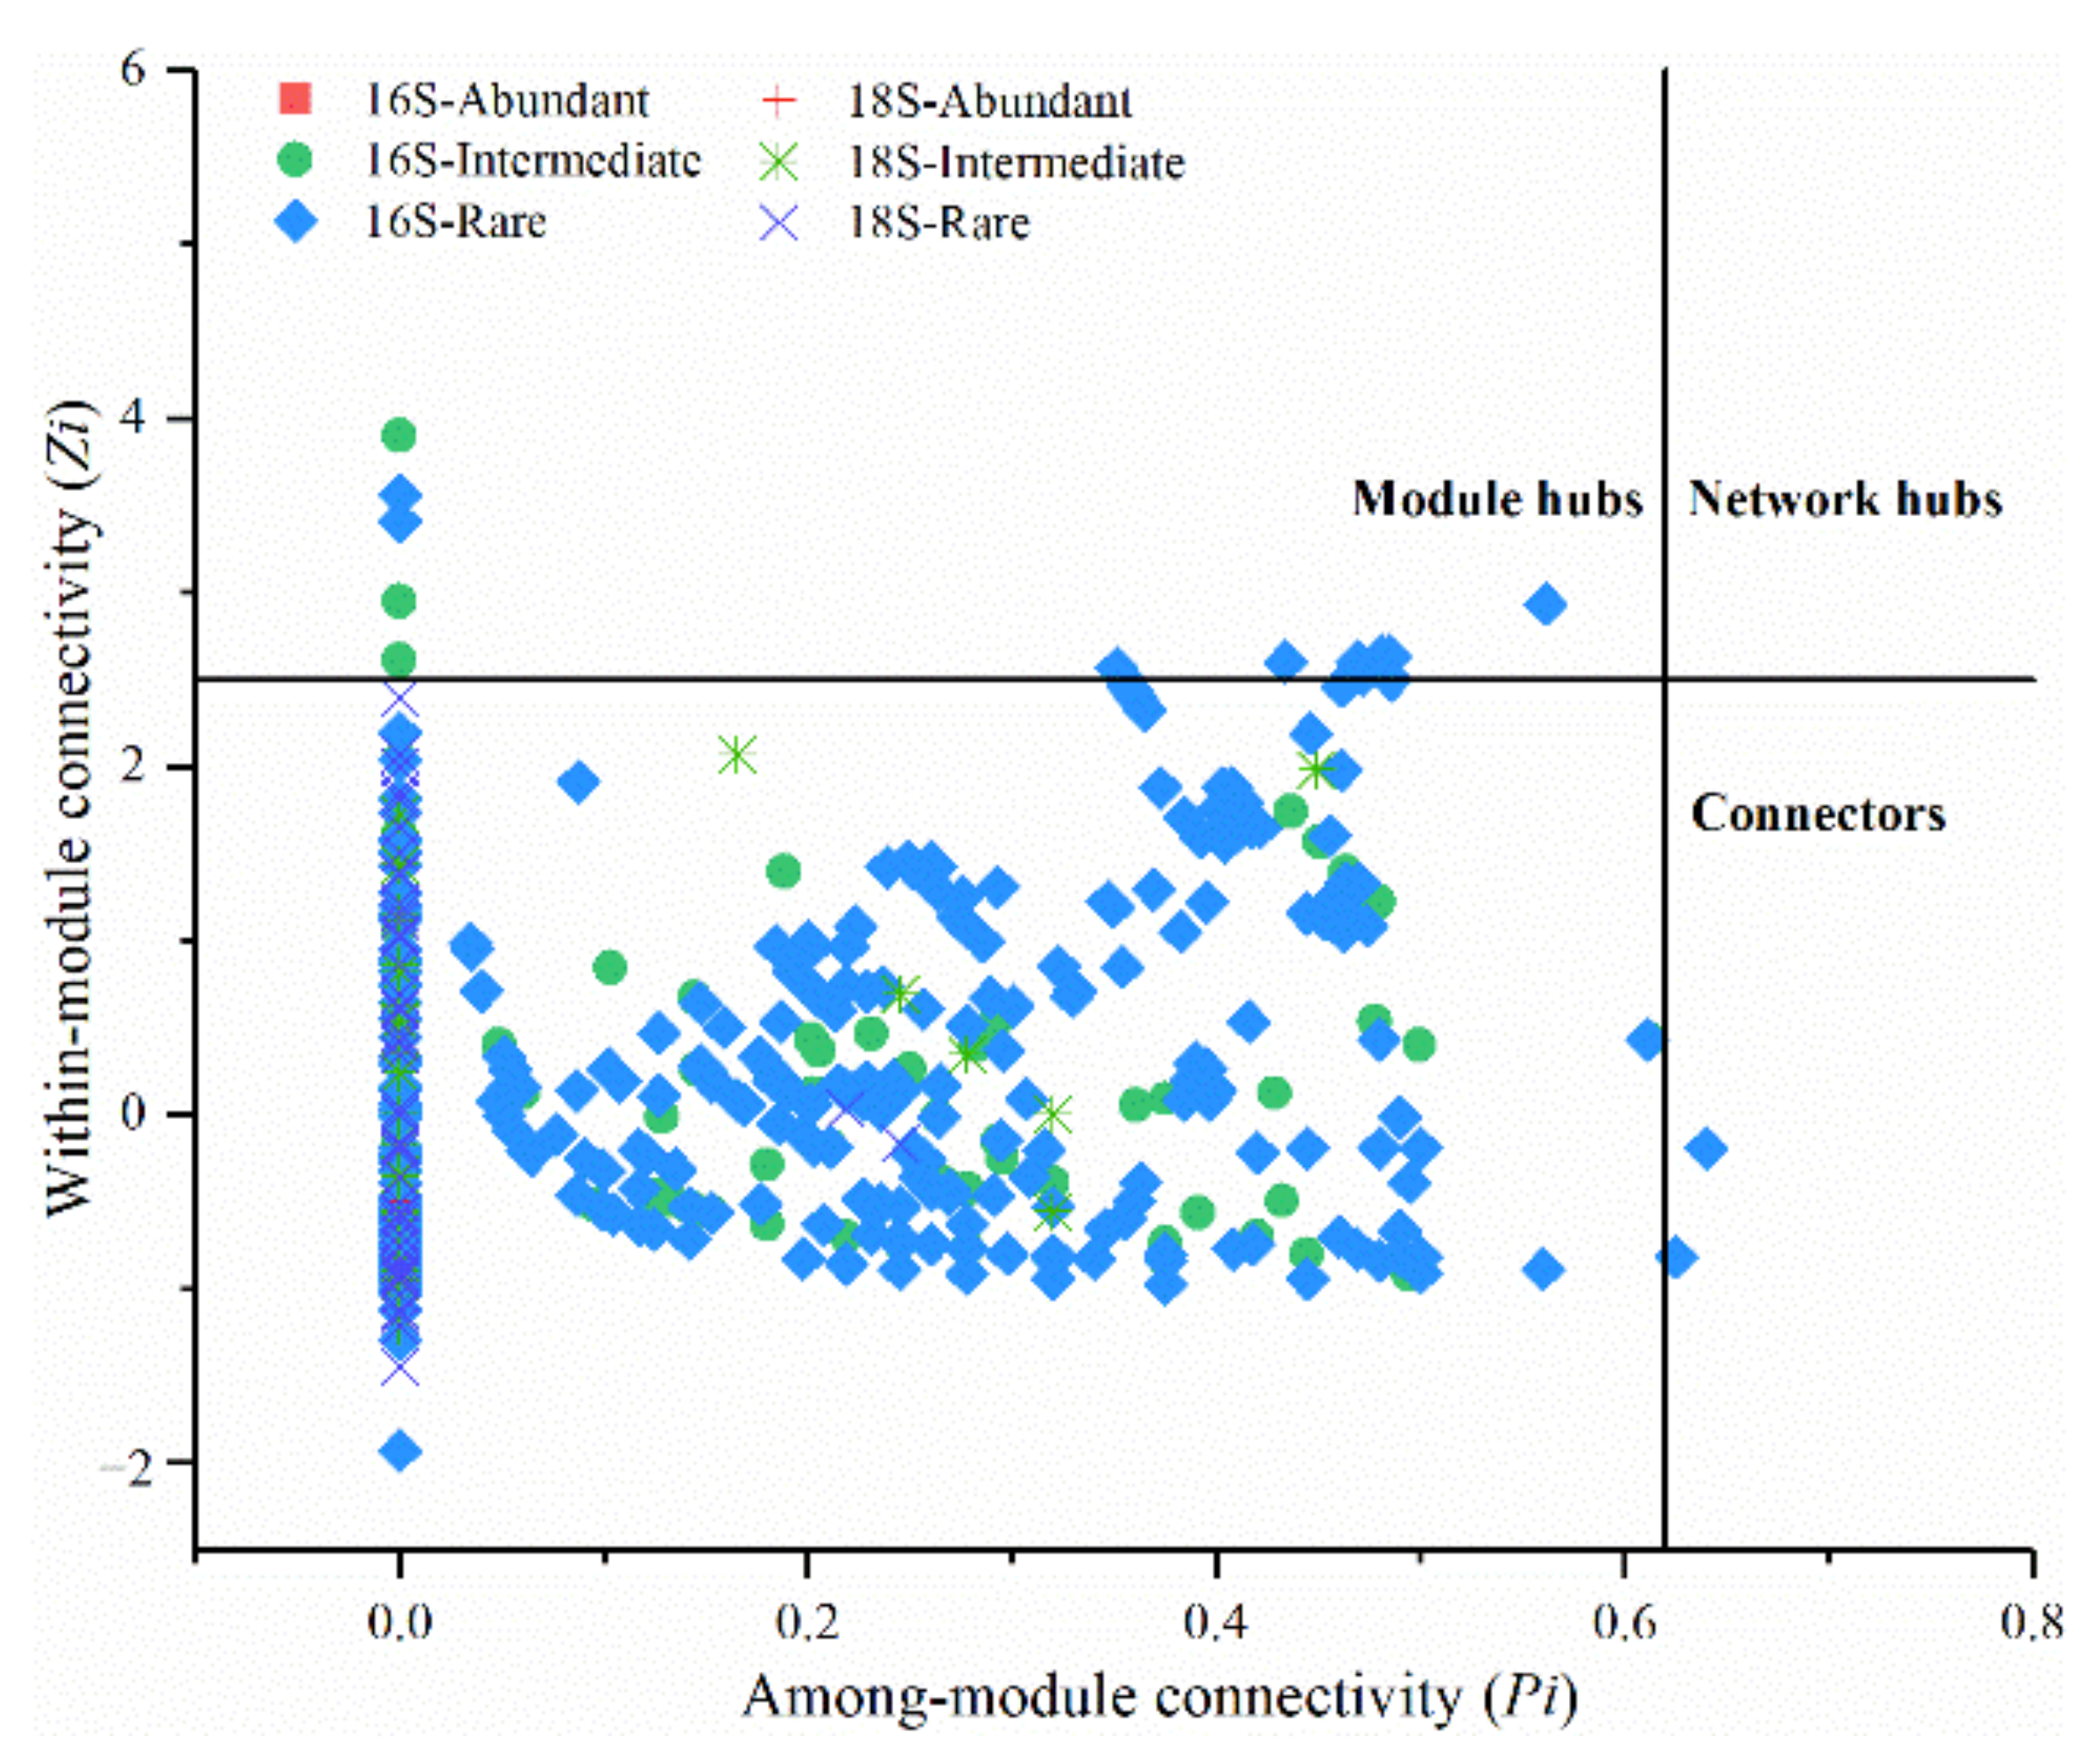
3.5. Modularity and Keystone Species of Networks

The phylogenetic compositions of the modules with node numbers that were greater than 10% of the total node numbers in the bacterial and microeukaryotic networks were extracted, and the correlations among the modules and environmental factors were calculated (Figure 5). In the 16S network, module 1 was significantly negatively correlated with NO3 and positively with pH, EC, and NH4+. Module 2 had significant and positive correlations with pH and TN. The pH values were also significantly correlated with Module 1 and Module 2 of the 18S network. Compared to 16S, the modules of the 18S network had a greater number of positive correlations with all variables. A greater number of significant correlations was found between the 18S modules and environmental factors when compared to the 16S modules. pH was the best correlation factor for the distribution patterns of the topological features of both the 16S and 18S networks, and EC was also an important environmental factor. Moreover, these results further confirm that the aquatic microeukaryotes are less stable under changes in environmental conditions than the bacteria.
The network nodes (OTUs) were classified into four categories (e.g., peripherals, module hubs, network hubs, and connectors) based on the Pi and Zi values, and the putative keystone taxa were identified (Figure 6). All microeukaryotic taxa and most bacterial taxa in each network were peripheral. The 12 module hubs were identified and consisted of nine rare OTUs and three intermediate OTUs. These 12 nodes included four belonging to the Actinobacteria phylum, three belonging to Firmicutes, two belonging to Proteobacteria, and one each belonging to Bacteroidetes and Entotheonellaeota. All the connectors belonged to rare taxa and were from Actinobacteria.

4. Discussion

Our study showed that the bacterial and microeukaryotic communities have different patterns and biogeography, and that the eukaryotic communities exhibit broader environmental adaptation than the bacterial communities. Moreover, by enlarging the analysis of the microbial subcommunity structure, investigating the variations of the communities and sub-communities to the environmental heterogeneity, and elucidating the species interactions of microbial communities, the findings are pivotal for improving the understanding of the intrinsic mechanisms that maintain microbial diversity in this essential habitat.

4.1. Patterns of Bacterial and Microeukaryotic Communities

Previous findings have shown that the abundant subcommunities usually occupy the main sequences in the microbial community but account for a few OTUs, but the rare subcommunity consisted of the majority of the total OTUs with only a few sequences [4,25]. This distinct pattern was corroborated in our study and showed that the rare taxa were critical components of the whole community diversity. In our study, the dominant lineages of the bacterial and microeukaryotic communities were similar to the microbial communities of other rivers [26,27,28]. Betaproteobacteriales commonly occurs and dominates freshwater ecosystems, and a recent study found Betaproteobacteriales in other rivers and lakes of China, such as the Yangtze River [4,29,30]. Bacterial plankton plays significant roles in freshwater ecosystems. Our study results showed that typical freshwater microeukaryotic assemblages were observed in the Pearl River, with the dominant lineages being Cryptophyceae, SAR, and Opisthokonta. The function of Cryptophyceae was found to be an important primary producer in freshwater ecosystems [31,32,33]. The OTUs were divided to ascertain the roles and to measure the contributions of the abundant and rare subcommunities based on their relative abundances. It is worth noting that Proteobacteria and Cryptophyceae occupied nearly half of the abundances in the bacterial and microeukaryotic communities, respectively. Consequently, compared with the rare taxa, the abundant taxa are more able to compete for nutrient resources [13].

4.2. The Controlling Factors of the Microbial Community Pattern

To understand the patterns of microbial communities, determining the relationships of the controlling factors and the distribution of species of microbial communities is important. Recent studies have revealed that different controlling elements influence the compositions of the rare and abundant subcommunities [13]. For example, the nutrients in reservoirs had significant impacts on the structure of microeukaryotic plankton community, especially on the rare plankton diversity [34]; it was found that the assembly of abundant and rare subcommunities was mediated by the soil pH and temperature, respectively [11]; and the river environmental factors govern the assembly of abundant and rare bacterioplankton taxa, and uncover more community change in abundant subcommunity than that in rare subcommunity [8]. In our study, the Mantel tests revealed significant correlations among the entire distribution patterns of the environmental conditions and those of the bacterial and microeukaryotic communities. However, further analysis showed that the responses of the abundant and rare subcommunities to environmental disturbances were not according to the responses of the whole micro-community, either bacteria or microeukaryotes.
Only DOC and NH4+ had significant correlations with the entire bacterial community, but pH, EC, and TP were found to be significantly correlated with the bacteria abundant subcommunity. This finding showed that the responses of microbial subcommunities may be consistent with the response of the entire bacterial community under environmental variations. Similar patterns were also found for the microeukaryotes. Previous research showed that rare taxa were susceptible to environmental fluctuations and were more liable to extinction because of the low abundances [5,35]. The abundant taxa are more competitive in utilizing environmental resources and grow more actively to adapt to ecosystem fluctuations than the rare taxa [36]. The rare taxa are crucial to microbial resilience and resistance under environmental disturbances [37]. The above strategies partly explain our findings; however, when compared with the bacterial community, the entire microeukaryotic community had more significant correlations than its subcommunities with the environmental indicators.

4.3. Co-Occurrence Networks of Bacterial and Microeukaryotic Communities

Co-occurrence networks have been used to explore the relationships within microbial communities and to analyze the patterns of microbial communities [16,38,39]. The evidence has been increasing in recent years that different parts of the microbial community may have different responses to environmental change due to the properties of the microbial ecology co-occurrence networks, which might indicate the interactions among co-existing organisms [40,41,42]. The bacterial and microeukaryotic network showed that the number of positive correlations was greater than that of the negative correlations. A positive interaction of networks represents cooperation between two parts. Therefore, our findings may conclude that the pattern of the microbial communities in the Pearl River is mature, and niche separation and the absence of competition between microbes exists [43].
Here, the compositions and structures of the co-occurrence networks provided insights into the assembly of microbial communities. In the bacterial co-occurrence network, Actinobacteria, Proteobacteria, and Firmicutes had more connected nodes and primarily occupied the entire network. This result was in accordance with the above results for the bacterial community structure. Similar results were found for the microeukaryotic community. When considering all correlations and topological parameters of the network of bacterial and microeukaryotic community networks, the connecting lines of bacterial OTUs were consistently stronger than those of microeukaryotic OTUs. It has been suggested that bacterial communities have higher complexities but lower stability [39].
Modules are regions of densely linked network parts that have more links inside them than outside, and high modularity mainly signifies diverse micro-niches and structured microbial communities [44]. Compared to the microeukaryotes, bacterial networks exhibit more modularity; thus, we infer that the degree of niche differentiation in the bacteria is lower than that in the microeukaryotes. This inference also demonstrates the lower biodiversity of the microeukaryotic community. Additionally, the relationships among the modules and environmental variables exhibited habitat heterogeneity in microorganism formulations [45,46]. Thus, our results indicate that environmental changes exerted considerable effects on the microeukaryotes, but not on the bacteria in our studied area. This finding may be due to the complexity of the bacterial network, which helps to improve the buffering capacities of microbes against environmental change [29].
We inferred that a more complex and connected network was formed within the bacterial communities, while a more clustered network was formed within the microeukaryotic communities. The taxa that are defined as module hubs and connectors of the network are regarded as keystone taxa due to their role in maintaining network structures, and they may play a role in maintaining ecosystem stability [46]. Interestingly, the most prominent keystone taxa in our study belonged to the bacteria rare subcommunity, which indicated that some rare microbes may compose the hidden backbone of microbial communities. We propose that the investigations of rare microorganisms will enhance our comprehension of microbial community function and help resolve the underlying mechanisms of microbial ecosystems against environmental change in the future.

5. Conclusions

We observed distinct distribution patterns of the bacterial and microeukaryotic communities in the Pearl River Estuary. The presence of rare taxa in the bacterial communities is more prevalent than that in microeukaryotic communities. The responses of the abundant and rare taxa to environmental variations indicated that the abundant subcommunities are more able to compete for nutrient resources and play a dominant role in the stability and maintenance of the entire microbial community, while the rare subcommunities may be more closely related to the resilience and resistance of microorganisms under environmental variations. Thus, compared with the bacterial community, the entire microeukaryotic community had more significant correlations with the environmental indicators. Moreover, the network analysis showed that the links among the bacterial OTUs were consistently stronger than those among the microeukaryotic OTUs. The keystone taxa belonged to rare taxa, which may play fundamental roles in network persistence. It is suggested that the bacterial community has more complex interactions within the community. The complexity of the bacterial network may help to improve the buffering capacities of microbes against environmental change. These findings provide some consideration of the ecological mechanisms and the responses of microbial communities to environmental heterogeneity and reveal the intrinsic biodiversity–stability relationships of microorganisms in response to environmental disturbances in a subtropical estuary.

Supplementary Materials

The following supporting information can be downloaded at: https://www.mdpi.com/article/10.3390/w14081227/s1, Figure S1: Sampling sites for microbes of the Pearl River basin; Figure S2: Taxonomic composition of the bacterial communities (a) and the microeukaryotic communities (b) in 29 samples. (a) Relative abundance of the phyla. (b) Relative abundance of the lineages; Figure S3: The co-occurrence network patterns among OTUs of bacteria (a) and microeukaryotes (b) colored by each subcommunity.

Author Contributions

Conceptualization, K.M. and J.L.; methodology, K.M. and Z.R.; formal analysis, K.M., J.M. and Z.R.; writing—original draft preparation, K.M.; writing—review and editing, Z.R., J.L. and N.C.; project administration, Z.R. and J.L.; funding acquisition, J.L. All authors have read and agreed to the published version of the manuscript.

Funding

This research was funded by the Key Project of National Natural Science Foundation of China, grant number U1901212.

Institutional Review Board Statement

Not applicable.

Informed Consent Statement

Not applicable.

Data Availability Statement

Raw sequence data can be accessed at the China National Center for Bioinformation (CRA006055).

Acknowledgments

We are grateful to the anonymous reviewers for the comments to Cheng Zhang and Shuling Yu for their assistances in the field and laboratory work.

Conflicts of Interest

The authors declare no conflict of interest.

References

  1. Azam, F.; Malfatti, F. Microbial structuring of marine ecosystems. Nat. Rev. Microbiol. 2007, 5, 782–791. [Google Scholar] [CrossRef] [PubMed]
  2. Duffy, J.E.; Cardinale, B.J.; France, K.E.; McIntyre, P.B.; Thebault, E.; Loreau, M. The functional role of biodiversity in ecosystems: Incorporating trophic complexity. Ecol. Lett. 2007, 10, 522–538. [Google Scholar] [CrossRef] [PubMed] [Green Version]
  3. Fuhrman, J.A. Microbial community structure and its functional implications. Nature 2009, 459, 193–199. [Google Scholar] [CrossRef] [PubMed]
  4. Liu, L.; Yang, J.; Yu, Z.; Wilkinson, D.M. The biogeography of abundant and rare bacterioplankton in the lakes and reservoirs of China. ISME J. 2015, 9, 2068–2077. [Google Scholar] [CrossRef]
  5. Jousset, A.; Bienhold, C.; Chatzinotas, A.; Gallien, L.; Gobet, A.; Kurm, V.; Kusel, K.; Rillig, M.C.; Rivett, D.W.; Salles, J.F.; et al. Where less may be more: How the rare biosphere pulls ecosystems strings. ISME J. 2017, 11, 853–862. [Google Scholar] [CrossRef]
  6. Nemergut, D.R.; Costello, E.K.; Hamady, M.; Lozupone, C.; Jiang, L.; Schmidt, S.K.; Fierer, N.; Townsend, A.R.; Cleveland, C.C.; Stanish, L.; et al. Global patterns in the biogeography of bacterial taxa. Environ. Microbiol. 2011, 13, 135–144. [Google Scholar] [CrossRef]
  7. Jiao, S.; Chen, W.; Wei, G. Biogeography and ecological diversity patterns of rare and abundant bacteria in oil-contaminated soils. Mol. Ecol. 2017, 26, 5305–5317. [Google Scholar] [CrossRef]
  8. Chen, J.; Wang, P.; Wang, C.; Wang, X.; Miao, L.; Liu, S.; Yuan, Q.; Sun, S. Distinct Assembly Mechanisms Underlie Similar Biogeographic Patterns of Rare and Abundant Bacterioplankton in Cascade Reservoirs of a Large River. Front. Microbiol. 2020, 11, 158. [Google Scholar] [CrossRef] [Green Version]
  9. Debroas, D.; Hugoni, M.; Domaizon, I. Evidence for an active rare biosphere within freshwater protists community. Mol. Ecol. 2015, 24, 1236–1247. [Google Scholar] [CrossRef] [Green Version]
  10. Lynch, M.D.; Neufeld, J.D. Ecology and exploration of the rare biosphere. Nat. Rev. Microbiol. 2015, 13, 217–229. [Google Scholar] [CrossRef]
  11. Jiao, S.; Lu, Y. Soil pH and temperature regulate assembly processes of abundant and rare bacterial communities in agricultural ecosystems. Environ. Microbiol. 2020, 22, 1052–1065. [Google Scholar] [CrossRef]
  12. Jiao, S.; Xu, Y.; Zhang, J.; Lu, Y. Environmental filtering drives distinct continental atlases of soil archaea between dryland and wetland agricultural ecosystems. Microbiome 2019, 7, 15. [Google Scholar] [CrossRef] [PubMed]
  13. Zhang, W.; Pan, Y.; Yang, J.; Chen, H.; Holohan, B.; Vaudrey, J.; Lin, S.; McManus, G.B. The diversity and biogeography of abundant and rare intertidal marine microeukaryotes explained by environment and dispersal limitation. Environ. Microbiol. 2018, 20, 462–476. [Google Scholar] [CrossRef] [PubMed] [Green Version]
  14. Hugoni, M.; Taib, N.; Debroas, D.; Domaizon, I.; Jouan Dufournel, I.; Bronner, G.; Salter, I.; Agogue, H.; Mary, I.; Galand, P.E. Structure of the rare archaeal biosphere and seasonal dynamics of active ecotypes in surface coastal waters. Proc. Natl. Acad. Sci. USA 2013, 110, 6004–6009. [Google Scholar] [CrossRef] [PubMed] [Green Version]
  15. Shade, A.; Jones, S.E.; Caporaso, J.G.; Handelsman, J.; Knight, R.; Fierer, N.; Gilbert, J.A. Conditionally rare taxa disproportionately contribute to temporal changes in microbial diversity. MBio 2014, 5, e01371-14. [Google Scholar] [CrossRef] [PubMed] [Green Version]
  16. Ren, Z.; Gao, H. Ecological networks reveal contrasting patterns of bacterial and fungal communities in glacier-fed streams in Central Asia. PeerJ 2019, 7, e7715. [Google Scholar] [CrossRef] [Green Version]
  17. Widder, S.; Besemer, K.; Singer, G.A.; Ceola, S.; Bertuzzo, E.; Quince, C.; Sloan, W.T.; Rinaldo, A.; Battin, T.J. Fluvial network organization imprints on microbial co-occurrence networks. Proc. Natl. Acad. Sci. USA 2014, 111, 12799–12804. [Google Scholar] [CrossRef] [Green Version]
  18. Du, S.Q.; Van Rompaey, A.; Shi, P.J.; Wang, J.A. A dual effect of urban expansion on flood risk in the Pearl River Delta (China) revealed by land-use scenarios and direct runoff simulation. Nat. Hazards 2015, 77, 111–128. [Google Scholar] [CrossRef]
  19. Ou, S.Y.; Yang, Q.S.; Luo, X.X.; Zhu, F.; Luo, K.W.; Yang, H. The influence of runoff and wind on the dispersion patterns of suspended sediment in the Zhujiang (Pearl) River Estuary based on MODIS data. Acta Oceanol. Sin. 2019, 38, 26–35. [Google Scholar] [CrossRef]
  20. Xu, Q.; Yang, R.; Zhuang, D.C.; Lu, Z.L. Spatial gradient differences of ecosystem services supply and demand in the Pearl River Delta region. J. Clean. Prod. 2021, 279, 123849. [Google Scholar] [CrossRef]
  21. Campbell, B.J.; Yu, L.; Heidelberg, J.F.; Kirchman, D.L. Activity of abundant and rare bacteria in a coastal ocean. Proc. Natl. Acad. Sci. USA 2011, 108, 12776–12781. [Google Scholar] [CrossRef] [Green Version]
  22. Olesen, J.M.; Bascompte, J.; Dupont, Y.L.; Jordano, P. The smallest of all worlds: Pollination networks. J. Theor. Biol. 2006, 240, 270–276. [Google Scholar] [CrossRef] [PubMed]
  23. Deng, Y.; Jiang, Y.H.; Yang, Y.; He, Z.; Luo, F.; Zhou, J. Molecular ecological network analyses. BMC Bioinform. 2012, 13, 113. [Google Scholar] [CrossRef] [PubMed] [Green Version]
  24. Shi, S.; Nuccio, E.E.; Shi, Z.J.; He, Z.; Zhou, J.; Firestone, M.K. The interconnected rhizosphere: High network complexity dominates rhizosphere assemblages. Ecol. Lett. 2016, 19, 926–936. [Google Scholar] [CrossRef] [PubMed] [Green Version]
  25. Jiao, S.; Lu, Y. Abundant fungi adapt to broader environmental gradients than rare fungi in agricultural fields. Glob. Change Biol. 2020, 26, 4506–4520. [Google Scholar] [CrossRef] [PubMed]
  26. Haro-Moreno, J.M.; Rodriguez-Valera, F.; Rosselli, R.; Martinez-Hernandez, F.; Roda-Garcia, J.J.; Gomez, M.L.; Fornas, O.; Martinez-Garcia, M.; Lopez-Perez, M. Ecogenomics of the SAR11 clade. Environ. Microbiol. 2020, 22, 1748–1763. [Google Scholar] [CrossRef] [Green Version]
  27. Giovannoni, S.J. SAR11 Bacteria: The Most Abundant Plankton in the Oceans. Annu. Rev. Mar. Sci. 2017, 9, 231–255. [Google Scholar] [CrossRef]
  28. Morris, R.M.; Rappe, M.S.; Connon, S.A.; Vergin, K.L.; Siebold, W.A.; Carlson, C.A.; Giovannoni, S.J. SAR11 clade dominates ocean surface bacterioplankton communities. Nature 2002, 420, 806–810. [Google Scholar] [CrossRef]
  29. Wang, Y.; Ye, F.; Wu, S.; Wu, J.; Yan, J.; Xu, K.; Hong, Y. Biogeographic pattern of bacterioplanktonic community and potential function in the Yangtze River: Roles of abundant and rare taxa. Sci. Total Environ. 2020, 747, 141335. [Google Scholar] [CrossRef]
  30. Liu, J.; Tu, T.; Gao, G.; Bartlam, M.; Wang, Y. Biogeography and Diversity of Freshwater Bacteria on a River Catchment Scale. Microb. Ecol. 2019, 78, 324–335. [Google Scholar] [CrossRef]
  31. Porter, K.G. Selective Grazing and Differential Digestion of Algae by Zooplankton. Nature 1973, 244, 179–180. [Google Scholar] [CrossRef]
  32. Cavalier-Smith, T.; Chao, E.E. Phylogeny and classification of phylum Cercozoa (Protozoa). Protist 2003, 154, 341–358. [Google Scholar] [CrossRef] [Green Version]
  33. Sherr, E.B.; Sherr, B.F. Significance of predation by protists in aquatic microbial food webs. Antonie Van Leeuwenhoek 2002, 81, 293–308. [Google Scholar] [CrossRef] [PubMed]
  34. Xue, Y.; Chen, H.; Yang, J.R.; Liu, M.; Huang, B.; Yang, J. Distinct patterns and processes of abundant and rare eukaryotic plankton communities following a reservoir cyanobacterial bloom. ISME J. 2018, 12, 2263–2277. [Google Scholar] [CrossRef] [PubMed] [Green Version]
  35. Zhou, L.; Zhou, Y.; Yao, X.; Cai, J.; Liu, X.; Tang, X.; Zhang, Y.; Jang, K.S.; Jeppesen, E. Decreasing diversity of rare bacterial subcommunities relates to dissolved organic matter along permafrost thawing gradients. Environ. Int. 2020, 134, 105330. [Google Scholar] [CrossRef]
  36. Pedros-Alio, C. Marine microbial diversity: Can it be determined? Trends Microbiol. 2006, 14, 257–263. [Google Scholar] [CrossRef]
  37. Jiao, S.; Wang, J.; Wei, G.; Chen, W.; Lu, Y. Dominant role of abundant rather than rare bacterial taxa in maintaining agro-soil microbiomes under environmental disturbances. Chemosphere 2019, 235, 248–259. [Google Scholar] [CrossRef]
  38. Jones, A.C.; Hambright, K.D.; Caron, D.A. Ecological Patterns Among Bacteria and Microbial Eukaryotes Derived from Network Analyses in a Low-Salinity Lake. Microb. Ecol. 2018, 75, 917–929. [Google Scholar] [CrossRef]
  39. De Vries, F.T.; Griffiths, R.I.; Bailey, M.; Craig, H.; Girlanda, M.; Gweon, H.S.; Hallin, S.; Kaisermann, A.; Keith, A.M.; Kretzschmar, M.; et al. Soil bacterial networks are less stable under drought than fungal networks. Nat. Commun. 2018, 9, 3033. [Google Scholar] [CrossRef] [Green Version]
  40. Kuiper, J.J.; van Altena, C.; de Ruiter, P.C.; van Gerven, L.P.A.; Janse, J.H.; Mooij, W.M. Food-web stability signals critical transitions in temperate shallow lakes. Nat. Commun. 2015, 6, 7727. [Google Scholar] [CrossRef] [Green Version]
  41. De Vries, F.T.; Wallenstein, M.D. Below-ground connections underlying above-ground food production: A framework for optimising ecological connections in the rhizosphere. J. Ecol. 2017, 105, 913–920. [Google Scholar] [CrossRef] [Green Version]
  42. De Vries, F.T.; Liiri, M.E.; Bjørnlund, L.; Bowker, M.A.; Christensen, S.; Setälä, H.M.; Bardgett, R.D. Land use alters the resistance and resilience of soil food webs to drought. Nat. Clim. Change 2012, 2, 276–280. [Google Scholar] [CrossRef]
  43. Mikhailov, I.S.; Zakharova, Y.R.; Bukin, Y.S.; Galachyants, Y.P.; Petrova, D.P.; Sakirko, M.V.; Likhoshway, Y.V. Co-occurrence Networks Among Bacteria and Microbial Eukaryotes of Lake Baikal During a Spring Phytoplankton Bloom. Microb. Ecol. 2019, 77, 96–109. [Google Scholar] [CrossRef] [PubMed]
  44. Zhang, C.; Liu, Q.; Li, X.; Wang, M.; Liu, X.; Yang, J.; Xu, J.; Jiang, Y. Spatial patterns and co-occurrence networks of microbial communities related to environmental heterogeneity in deep-sea surface sediments around Yap Trench, Western Pacific Ocean. Sci. Total Environ. 2021, 759, 143799. [Google Scholar] [CrossRef] [PubMed]
  45. Zhou, H.; Gao, Y.; Jia, X.H.; Wang, M.M.; Ding, J.J.; Cheng, L.; Bao, F.; Wu, B. Network analysis reveals the strengthening of microbial interaction in biological soil crust development in the Mu Us Sandy Land, northwestern China. Soil Biol. Biochem. 2020, 144, 107782. [Google Scholar] [CrossRef]
  46. Olesen, J.M.; Bascompte, J.; Dupont, Y.L.; Jordano, P. The modularity of pollination networks. Proc. Natl. Acad. Sci. USA 2007, 104, 19891–19896. [Google Scholar] [CrossRef] [Green Version]
Figure 1. The proportion of OTU richness and relative abundance of the abundant and rare taxa, compared to the whole community in bacterial (a) and microeukaryotic (b) communities in each sample.
Water 14 01227 g001
Figure 2. Chord plots showing the taxonomic distribution of the abundant and rare taxa of bacteria (a) and microeukaryotes (b). The thickness of each ribbon represents the numbers of abundant and rare taxa.
Water 14 01227 g002
Figure 3. Spearman’s correlations of the bacterial and microeukaryotic communities with environmental factors based on the Mantel test. The magnitudes of the correlation coefficients are shown without a cross when the correlation is significant (p < 0.05).
Water 14 01227 g003
Figure 4. The co-occurrence network patterns among the OTUs of bacteria (a,c) and microeukaryotes (b,d) colored by taxonomic group (a,b) and modules (c,d).
Water 14 01227 g004
Figure 5. Spearman’s correlations between modules (>10%) and environmental variables in 16S and 18S networks. The magnitude of correlation coefficient is shown without a cross when the correlation is significant (p < 0.05).
Water 14 01227 g005
Figure 6. Classification of nodes to identify putative keystone species within the 16S and 18S networks. Each symbol represents an OTU. Module hubs have Zi ≥ 2.5, whereas connectors have Pi > 0.62.
Water 14 01227 g006
Table 1. The key topological features of aquatic microbial networks.
Topological ParametersBacteriaMicroeukaryotes
Number of edges10,360350
Number of nodes800243
Network density0.03240.0119
Characteristic degree25.90002.8807
Characteristic path length2.82513.5617
Clustering coefficient0.54160.5343
Modularity0.38680.8538
Publisher’s Note: MDPI stays neutral with regard to jurisdictional claims in published maps and institutional affiliations.

