
Can Potato Crop on Sandy Soil Be Safely Irrigated with Heavy Metal Polluted Water?
by
 , , and
Tarek Selim
1,* ,
,
Samah M. Elkefafy
2,
Ronny Berndtsson
3,4,*,
Mohamed Elkiki
1 and
Ahmed A. El-kharbotly
5 1
Civil Engineering Department, Faculty of Engineering, Port Said University, Port Said 42523, Egypt
2
Civil Engineering Department, Faculty of Engineering, Suez Canal University, Ismailia 41522, Egypt
3
Division of Water Resources Engineering, Lund University, Box 118, 22100 Lund, Sweden
4
Centre for Advanced Middle Eastern Studies, Lund University, Box 201, 22100 Lund, Sweden
5
Soil and Water Department, Faculty of Agriculture, Suez Canal University, Ismailia 41522, Egypt
*
Authors to whom correspondence should be addressed.
Water 2022, 14(8), 1226; https://doi.org/10.3390/w14081226
Submission received: 11 March 2022
/
Revised: 5 April 2022
/
Accepted: 9 April 2022
/
Published: 11 April 2022
(This article belongs to the Section Water, Agriculture and Aquaculture)
Abstract
:Heavy metal (HM) accumulation in soil and plants can occur when water contaminated with HMs is used as a source of irrigation (El-Salam Canal, Egypt). In this study, the effect of watering potato crop in sandy soil from a polluted water source under flood irrigation (FI), sprinkler irrigation (SI), and surface drip irrigation (DI) on the transport of the HMs copper (Cu), manganese (Mn), lead (Pb), and zinc (Zn) in the root zone was experimentally investigated. HM concentrations in potato plant parts was also determined. The field experiments were conducted in a completely randomized block with three replicates for each irrigation method by using nine field lysimeters. Soil and plant samples were collected at the end of the growing season to determine their HM content. The results showed that regardless of irrigation method, irrigation with HM contaminated water raised HM concentrations in both soil and potato plants. DI produced the highest concentrations of most HMs (Cu, Mn, and Pb) in the upper soil layer (0–40 cm) and highest Cu, Pb, and Zn concentrations in plant tubers as well. Maximum Zn concentration in the upper soil layer and maximum Mn concentration in plant tubers occurred under SI. The maximum concentrations of Cu, Mn, Pb, and Zn in both the upper soil layer and plant tubers were 12.0, 140.0, 11.6 and 67.9 mg/kg and 6.3, 9.4, 2.3 and 23.9 mg/kg, respectively. However, FI produced the highest concentrations in the deep soil layer (40–60 cm) and the least concentration of HMs in plant tubers. These concentrations were 18.8, 203.8, 13.3 and 70 mg/kg and 4.0, 6.0, 0.6 and 17.1 mg/kg in soil and plant tubers for Cu, Mn, Pb, and Zn, respectively. The maximum concentrations of HMs in soil and potato plants were lower than the maximum permissible limits. Therefore, El-Salam Canal water appears not to be harmful in the short term. However, as shown in the results, HM accumulation depends on irrigation technique; thus, more studies are needed to determine harmful effects in the long term.
1. Introduction
Water use in agriculture has grown significantly to meet growing food demands as the world’s population increases. Many countries are forced to use low quality water or water contaminated with heavy metals (HMs) for watering crops [1]. Using such water in Egypt is imperative due to the limited water supply and high demand. Large agricultural areas in Egypt are irrigated with Nile River water mixed with agricultural drainage water. For instance, about 260,000 ha of reclaimed areas, which lie to the south of El-Bardawil and El-Manzala lakes in North Sinai and the Eastern Delta, are irrigated from the El-Salam Canal [2]. This canal is a mixture of fresh water from the Nile (2.1 billion m3 year−1) and urban and rural drainage water (1.9 billion m3 year−1). Farag and Mehana [3] reported the possibility of using such water to irrigate coarse to medium textured soils with small effects on the soil. Although HM concentrations in water often are low, long-term irrigation with HM contaminated water can lead to HM accumulation in the soil [4]. This is an irreversible process and accumulated HMs in soil cannot be destroyed or changed to forms that are harmless [5]. Furthermore, crops are one of the primary sinks for HM accumulation. Thus, metals can find their way into the edible portion of the crop providing a health risk to both humans and farm animals [6,7,8]. Irrigation with water containing different amounts of HMs generally increase their concentrations in the soil [7,9,10,11]. Al-Subu et al. [9] conducted laboratory experiments (i.e., soil column experiments) to investigate the effect of using irrigation water containing HMs on clay loam soil contamination levels. They concluded that by irrigating with water containing varying amounts of copper (Cu), lead (Pb), and zinc (Zn), HM concentrations increased with soil depth and the duration of application. Omron et al. [12] compared the effect of long-term irrigation with sewage water and well water on HM concentrations in loamy sand soil. They found that long-term sewage water irrigation resulted in a considerable increase in the total concentrations of zinc (Zn), lead (Pb), copper (Cu), manganese (Mn), iron (Fe), nickel (Ni), chromium (Cr), cobalt (Co), and arsenic (As) by 130, 55, 40, 30, 82, 84, 75, 78, and 67%, respectively, in soil samples as compared to those of irrigating with well water. Patel [5] explored the influence of irrigation by wastewater on HM accumulation in soil and their removal by plants. He stated that although the HMs content in soil was below the permissible limits, the continuous use of untreated wastewater in the long term may pose a threat of entry of such metals into the food chain.
Siddique et al. [8] evaluated the Fe, Pb, and Mn concentrations in soil irrigated with wastewater at different depths (0–15 and 16–30 cm). They found a larger increase in HM concentrations in the upper layer (depth of 0–15 cm) than the lower layer (16–30 cm). Nzediegwu et al. [13] concluded that when potato plants are grown in sandy soil and irrigated with untreated wastewater, the HMs (i.e., Fe, Pb, and Zn) accumulating in the surface soil layer (0–0.10 m) was the greatest, while only Fe was found at a 0.3 m soil depth. Soil texture and heavy metal ion properties have a combined effect on heavy metal transport. Metals differentially migrate in different soils. The transport process of the same metal in various soils may be very different [14]. Moreover, under the same soil conditions, different metals have different transport patterns [11,14]. The mechanisms of HMs transport and accumulation in a soil-plant system can be also greatly affected by soil pH, organic matter content, soil salinity, nature and amount of nutrients, weather patterns, soil microbes, and other factors [15].
The transport and distribution of HMs in the soil profile are also affected by the irrigation method. Khawla et al. [16] investigated HMs distribution in sandy loam soil under different irrigation methods, namely, surface irrigation, sprinkler irrigation (SI), drip irrigation (DI), and subsurface drip irrigation (SDI) with treated wastewater and fresh water for maize crop. They found that surface irrigation with treated wastewater yielded the highest Fe, Zn, Pb, and cadmium (Cd) concentrations. Lower concentrations were observed under subsurface drip irrigation. Asgari et al. [17] investigated the effect of emitter depth on HMs distribution within the soil profile when using SDI with treated municipal wastewater in sandy loam soil. Results revealed that different depths of emitters (0, 15, and 30 cm) below the soil surface have no considerable effect on HM concentrations in soil. Cakmakci and Sahi [15] evaluated the effect of irrigation techniques on HM distribution through sandy clayey loam soil cultivated with silage maize. They used flood irrigation (FI), DI, and SDI with recycled wastewater and fresh water. They concluded that FI yielded a higher concentration of Zn, Cu, Cd, Ni, and Pb than DI and SDI techniques. Najafi [18] studied the effect of five different irrigation methods on HMs (i.e., Fe, Zn, Cu, and Mn) transport through soil planted with tomatoes. The investigated irrigation methods were FI with drinking water, DI with treated wastewater, SDI with an emitter at a 15 cm depth with treated wastewater, SDI with an emitter at a 30 cm depth with treated wastewater, and FI with treated wastewater. Results showed that SDI with emitters at a 15 cm depth with treated wastewater represented the lowest HM accumulation in the soil.
HMs may accumulate in the different parts of the potato plant (flesh, peel, root, stem, and leaf) after irrigating with untreated wastewater [13]. Brar et al. [11] investigated the effect of furrow irrigation with sewage water on HMs in potato crop. They found that using such water under furrow irrigation raised the HM concentrations in potato leaves and tubers with higher concentrations in leaves than in tubers. Furthermore, plants had a lower proportional rise in Cu, Fe, Zn, and aluminum (Al) than soils. However, Mn and Cr concentrations were almost similar in plants and in soil, and Ni concentration was higher in plants than in soil [11]. HM concentrations in different parts of maize were observed to be remarkably higher under treated wastewater irrigation than freshwater irrigation [16].
Based on the above and relying on the fact of water scarcity worldwide, using alternate water resources (low quality water) is becoming imperative. The integrated understanding of the HM dynamics under different irrigation methods with contaminant irrigation water is considered the keystone for selecting a suitable irrigation method from environmental and health points of view.
The aims of the present study were to: (1) investigate HMs (Cu, Mn, Pb, and Zn) distribution in sandy soil cultivated with potato crop under different irrigation methods, namely, sprinkler, flood, and surface drip irrigation with irrigation water from the El-Salam Canal and (2) propose a proper irrigation method that has fewer potential side effects on the environment and human health when using irrigation water contaminated with HMs (i.e., El-Salam Canal water). We believe that our findings will be useful for farmers and decision makers regarding the selection of environmentally sound irrigation methods for sandy soil within the El-Salam Canal command. It will also be useful for agricultural lands possessing similar climate, soil, and irrigation water conditions.
2. Materials and Methods
2.1. Experimental Site
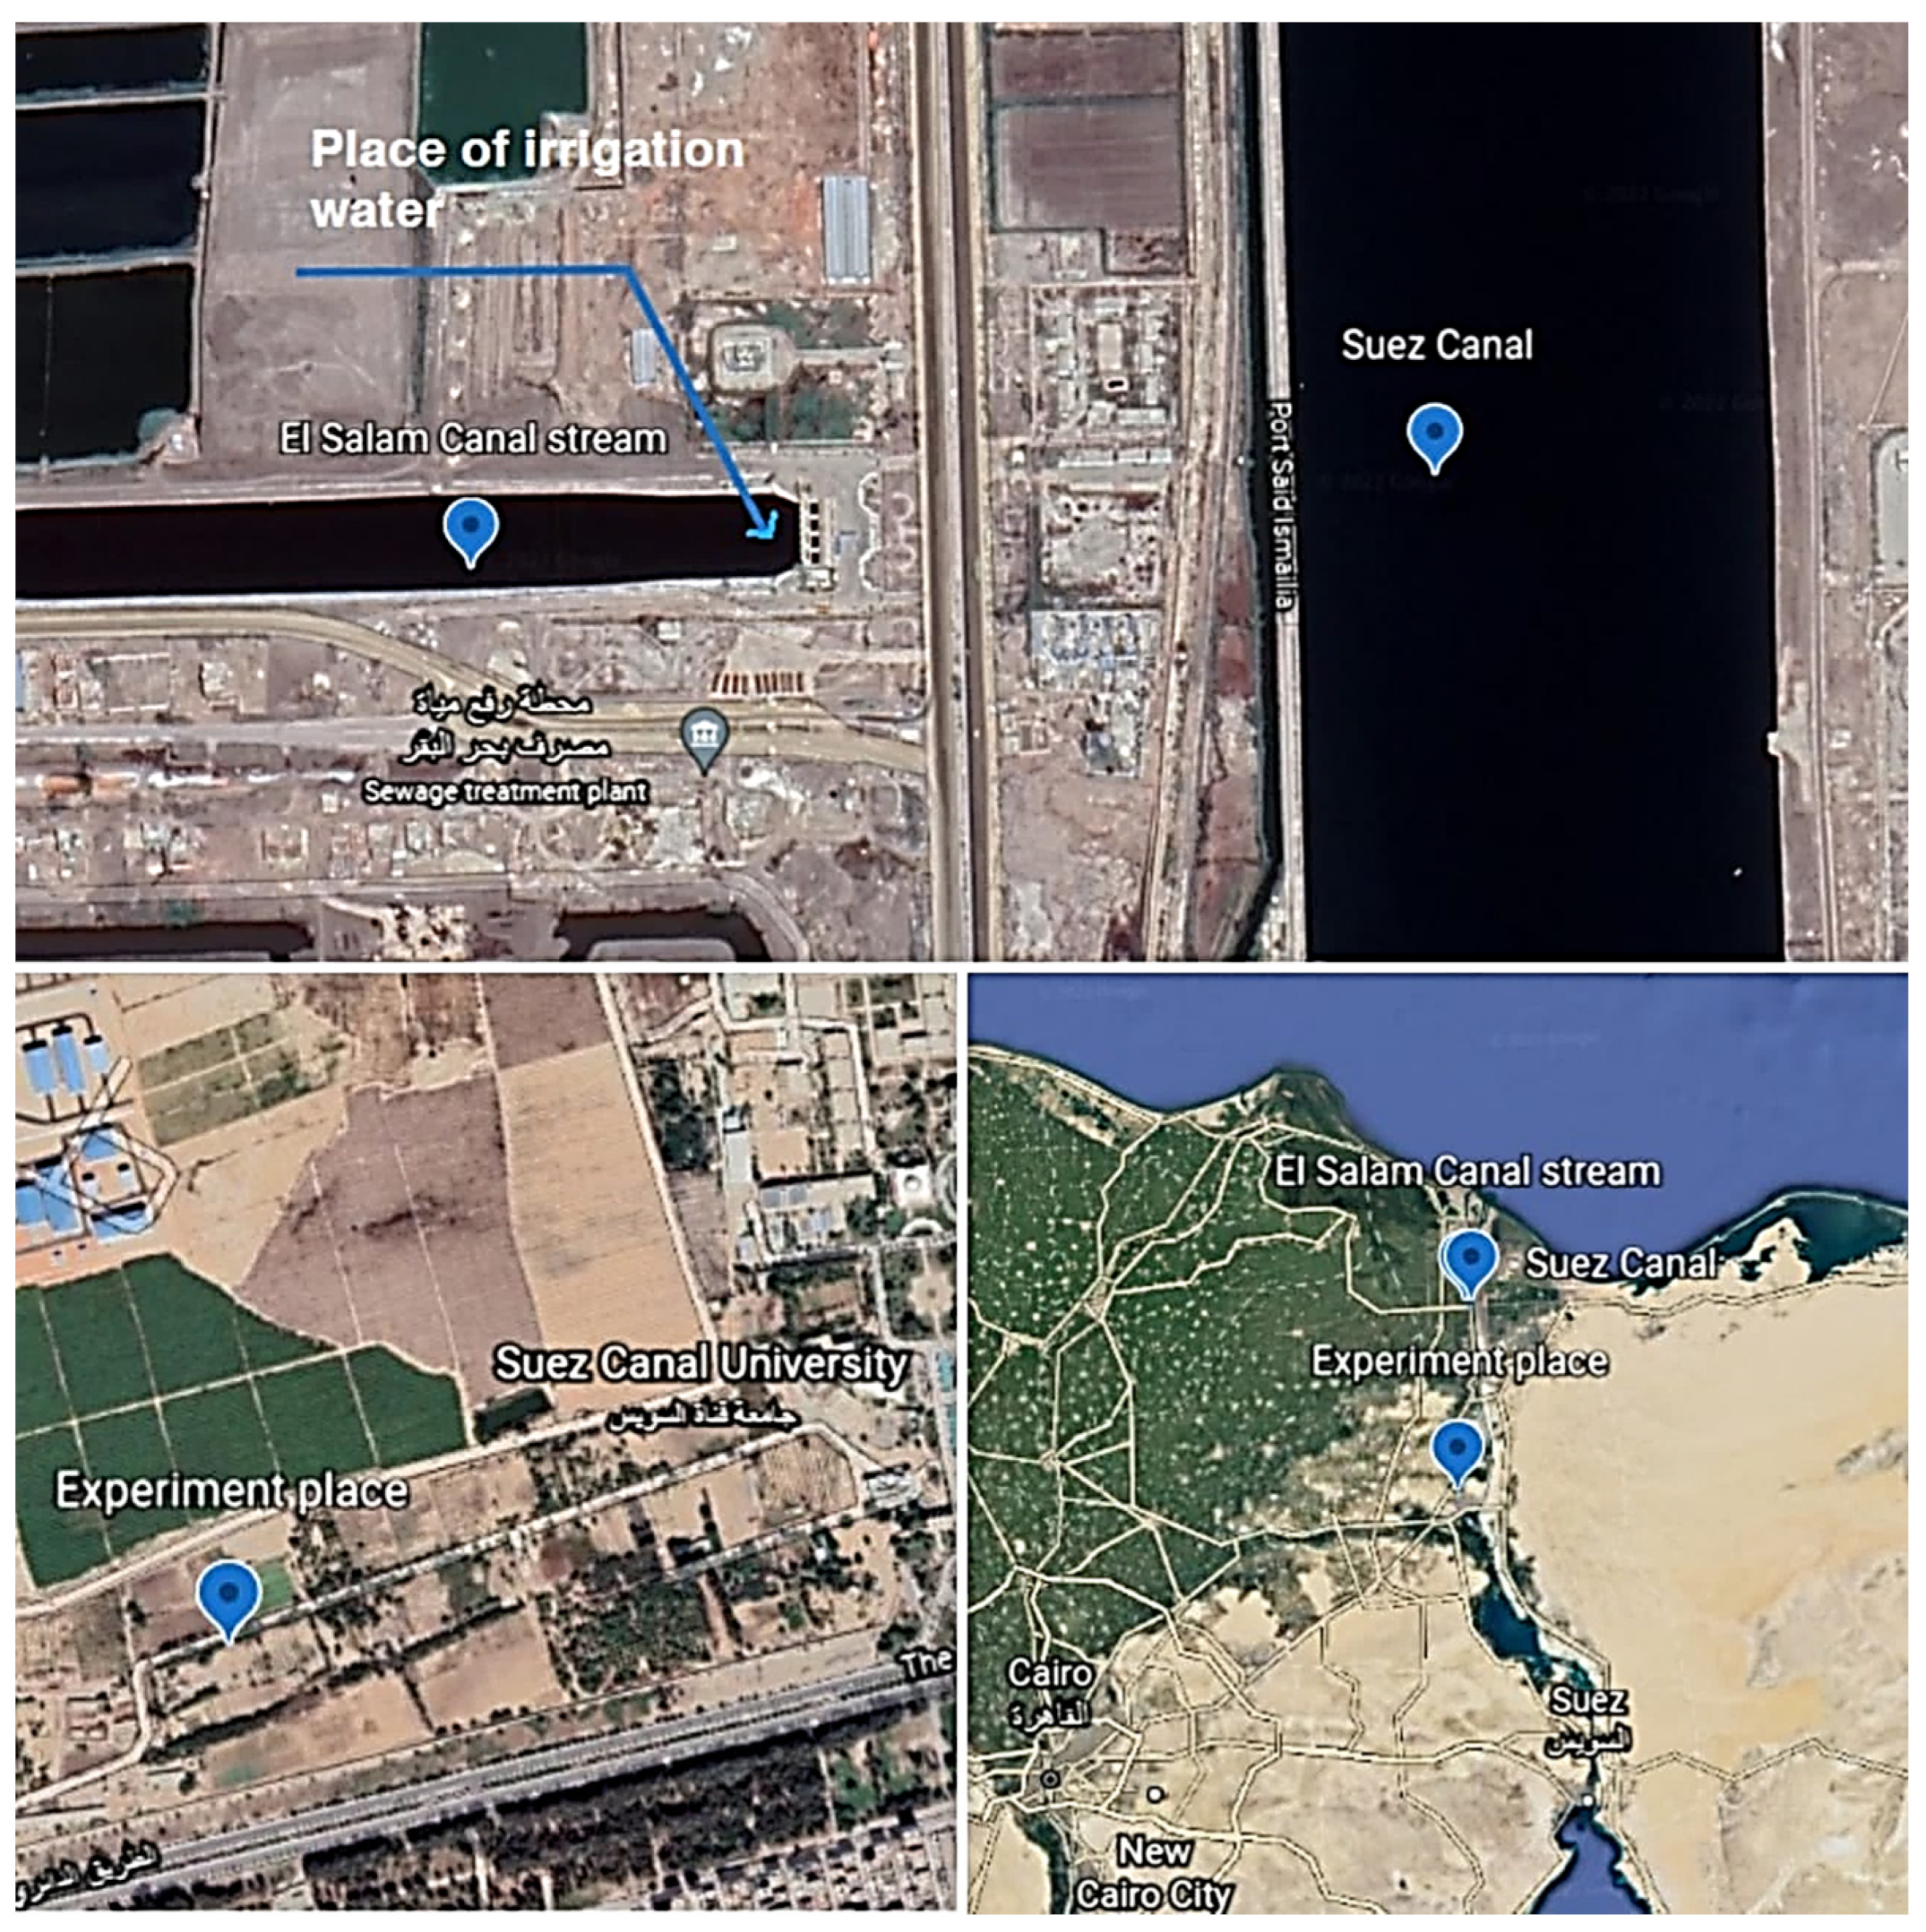
The study was conducted in the experimental farm of the Faculty of Agriculture, Suez Canal University, Ismailia, Egypt (30°37′06″ N 32°15′40″ E), as shown in Figure 1 during the growing season (November 2020 to February 2021). The average daily rainfall was 0.59 mm, with minimum temperatures varied from 6 to 20 °C and maximum temperatures varied from 15 to 33 °C during the growing season.
2.2. Experimental Design
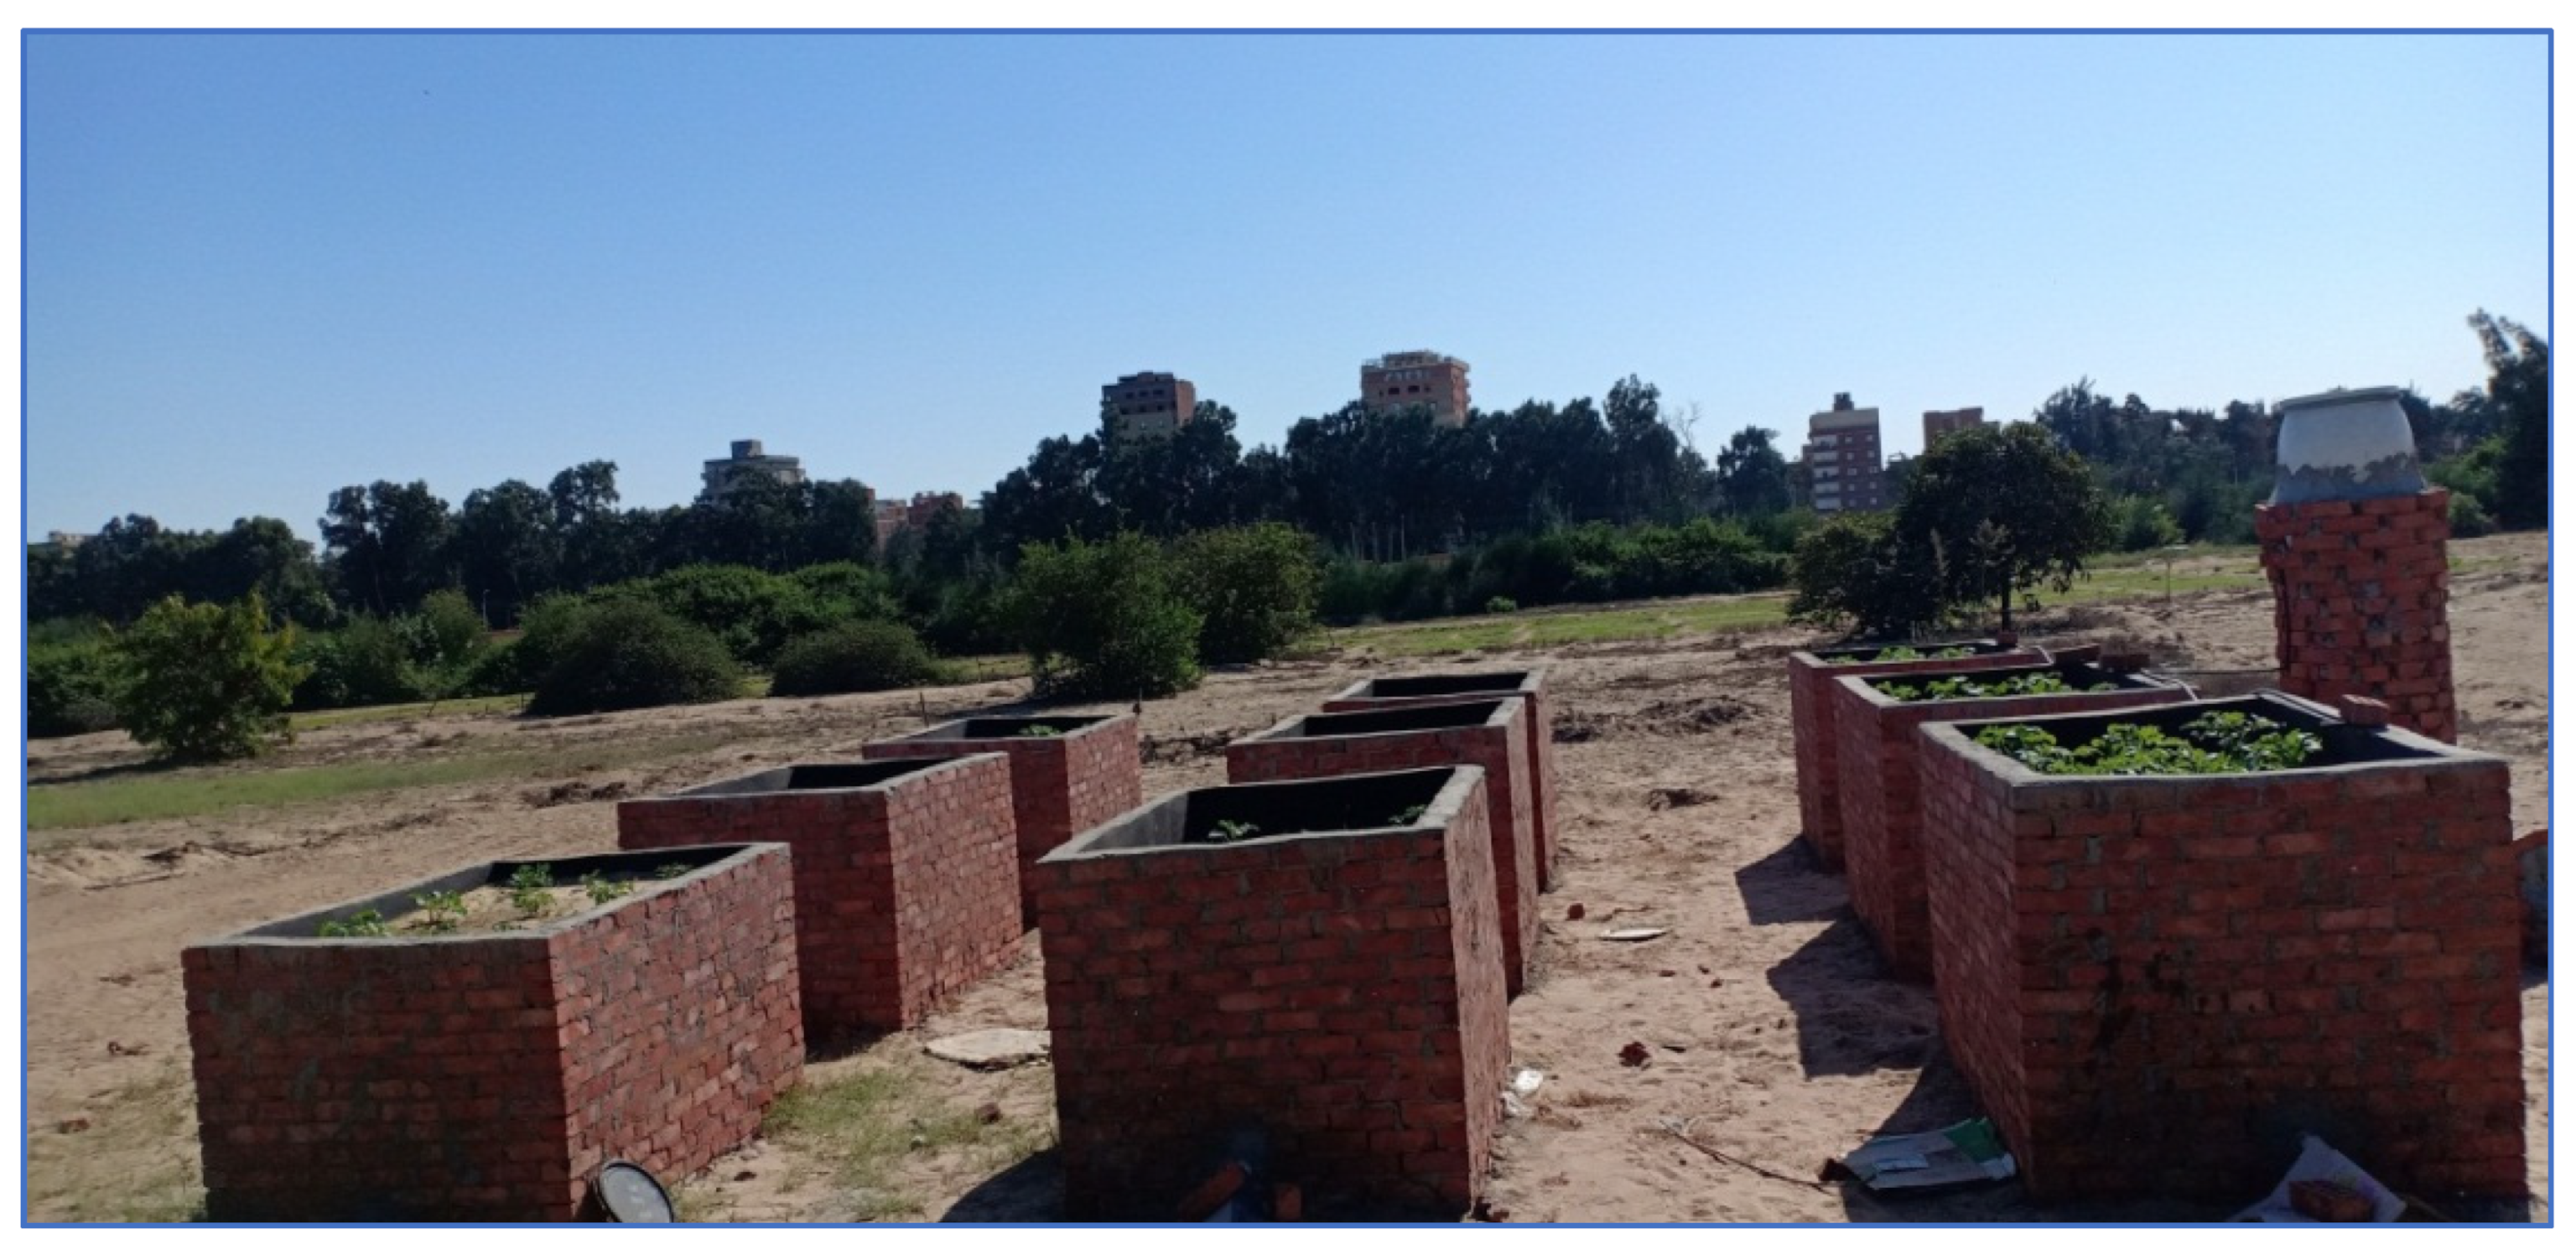
Three irrigation methods were investigated in the experiments, namely, sprinkler irrigation (SI), surface drip irrigation (DI), and flood irrigation (FI). The experimental design was a complete randomized block in three replicates for each method of irrigation. Based on this, nine equal soil lysimeters (Figure 2) were used in the current study. Each lysimeter had a length, width, and height of 1.5, 1.0, and 1.0 m, respectively. Height was chosen according to the maximum root depth of the potato crop (40 to 60 cm) [19]. The lysimeters’ bottoms and walls were built of brick with cement plastering. The sidewalls and the bottom of the lysimeters were carefully sealed by cement and painted with water-repellant bitumen emulsion.
At the bottom of each lysimeter, a drainage hole connected to a drain tube was implemented to collect drainage water in sumps. To fill the lysimeters with soil, representative local soil of the Faculty of Agriculture farm, Suez Canal University, Ismailia, Egypt, was used. The collected soil was from the top 40 cm soil layer and the portion of this soil that passed through a 2.0 mm sieve was used to fill the lysimeters. A layer of 0.05 m of pre-washed gravel was placed at the bottom of each lysimeter and covered with a cheesecloth sheet and a 5 cm layer of pre-washed sand. Soil was then re-packed in successive 5 cm soil layers. Each layer was compacted to the original bulk density using a wooden piston with a studded surface. Fifteen packing steps were performed for each lysimeter until reaching a 75 cm soil depth.
2.2.1. Soil and Irrigation Water
The soil used was a sandy soil, collected from the experimental farm, Faculty of Agriculture, Suez Canal University, Ismailia, Egypt. The physical and chemical properties of the soil are shown in Table 1. The soil is classified as Typic Torripesamments [20]. As the main aim was to investigate HMs distribution in sandy soil cultivated with potato crop under different irrigation methods, irrigation water was brought from the El-Salam Canal. The canal water is a mixture of Nile water and drainage water with an approximate mixing ratio of 1:1. The water contains heavy metals such as Cd, Al, Co, Cr, Mn, Fe, Pb, and Zn [21]. Due to the long distance between the El-Salam Canal and the study area (approximately 45 km), the required water was transported from the El-Salam Canal to the study area and stored in tanks. The location of the collected water was 31°01′07″ N 32°18′20″ E as shown in Figure 1. It is worth mentioning that the length of the El-Salam Canal is 277 km and in some cases water travels long distances through the canal to irrigate agricultural lands.
2.2.2. Irrigation Scheduling under Different Irrigation Methods
The Penman–Monteith equation [19] was used to calculate reference evapotranspiration (ETo). The climatic data were provided by CLIMWAT (version 2.0) software and integrated in CROPWAT (version 8.0) to calculate crop water requirements ETc by multiplying ETo with the crop coefficient (Kc) for each growing stage for potato plants grown in Ismailia, Egypt [22,23]. The leaching requirements (LR) of 0.15 ETc were added to the calculated ETc to avoid salinity buildup that may be caused by irrigation water (El-Salam Canal water) [24]. The electrical conductivity of the canal water ranges from 1.00 to 2.00 dS m−1 [2]. To calculate the amount of irrigation water for each irrigation method, the total applied water was calculated by dividing the summation of total ETc and LR by the irrigation efficiency. The irrigation efficiency of FI, SI, and DI was taken equal to 65, 80, and 90%, respectively [25,26]. The initial, development, mid, and late stages of the potato plant were from 1–25 November, 26 November–25 December, 26 December–24 January, and 25 January–23 February, respectively. The corresponding crop coefficient (Kc) for each growing stage was 0.50, from 0.50 to 1.15, 1.15, and from 1.15 to 0.75, respectively. In total, 25 irrigation events were executed for each irrigation method during the growing season. The date of each irrigation event and the amount of irrigation water corresponding to each event are shown in Table 2. The total height of the irrigation water was 441.4, 385.7, and 318.8 mm for each lysimeter under FI, SI, and DI, respectively. These amounts equal to 1.77, 1.44, and 1.27 ETc for FI, SI, and DI, respectively. In the DI method, a polyethylene drip line (locally manufactured and commonly used by local farmers) was used for each plant row 50 cm apart. Emitter spacing on the drip line and flow rate were 30 cm and 2 L h−1, respectively. In the SI method, irrigation water was manually sprayed with a flow rate of 1.05 L min−1. As the investigated soil was sand, water ponding was not observed after ceasing SI. On the other hand, FI was applied by adding a certain amount of irrigation water based on the required quantity of water for a given irrigation event. This amount caused a water ponding on the lysimeter soil surface. The irrigation duration for each irrigation event under DI and SI was adjusted based on the crop water requirement and the emitter and spraying flow rate.
2.2.3. Experimental Layout and Cultivation
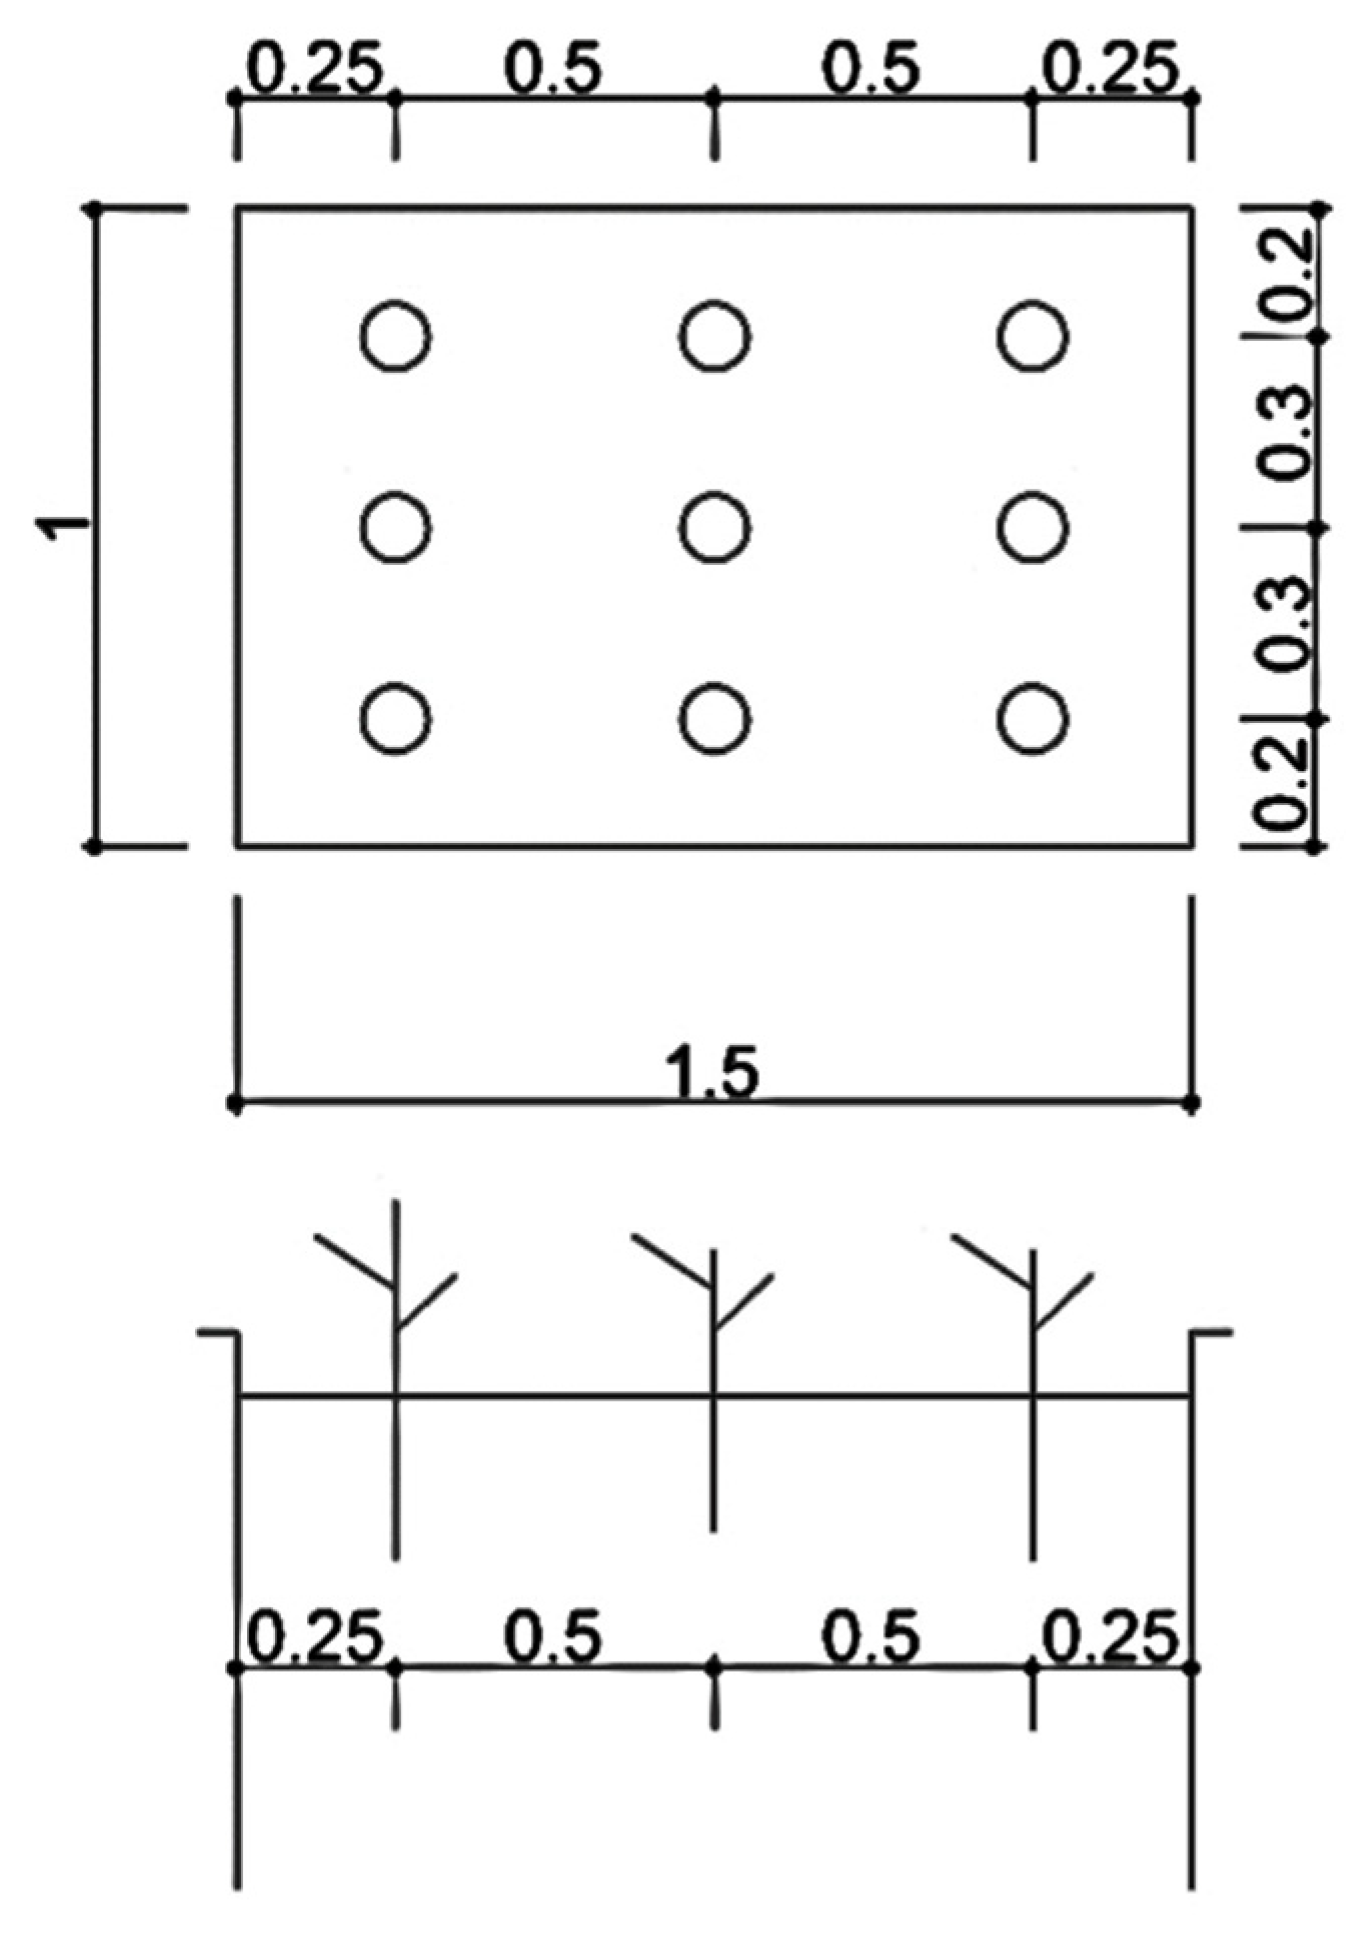
Nine potato tubers were planted in each lysimeter on the 1 November 2020.The in-row spacing between plants was 0.3 m, and the spacing between rows was 0.5 m as shown in Figure 3.
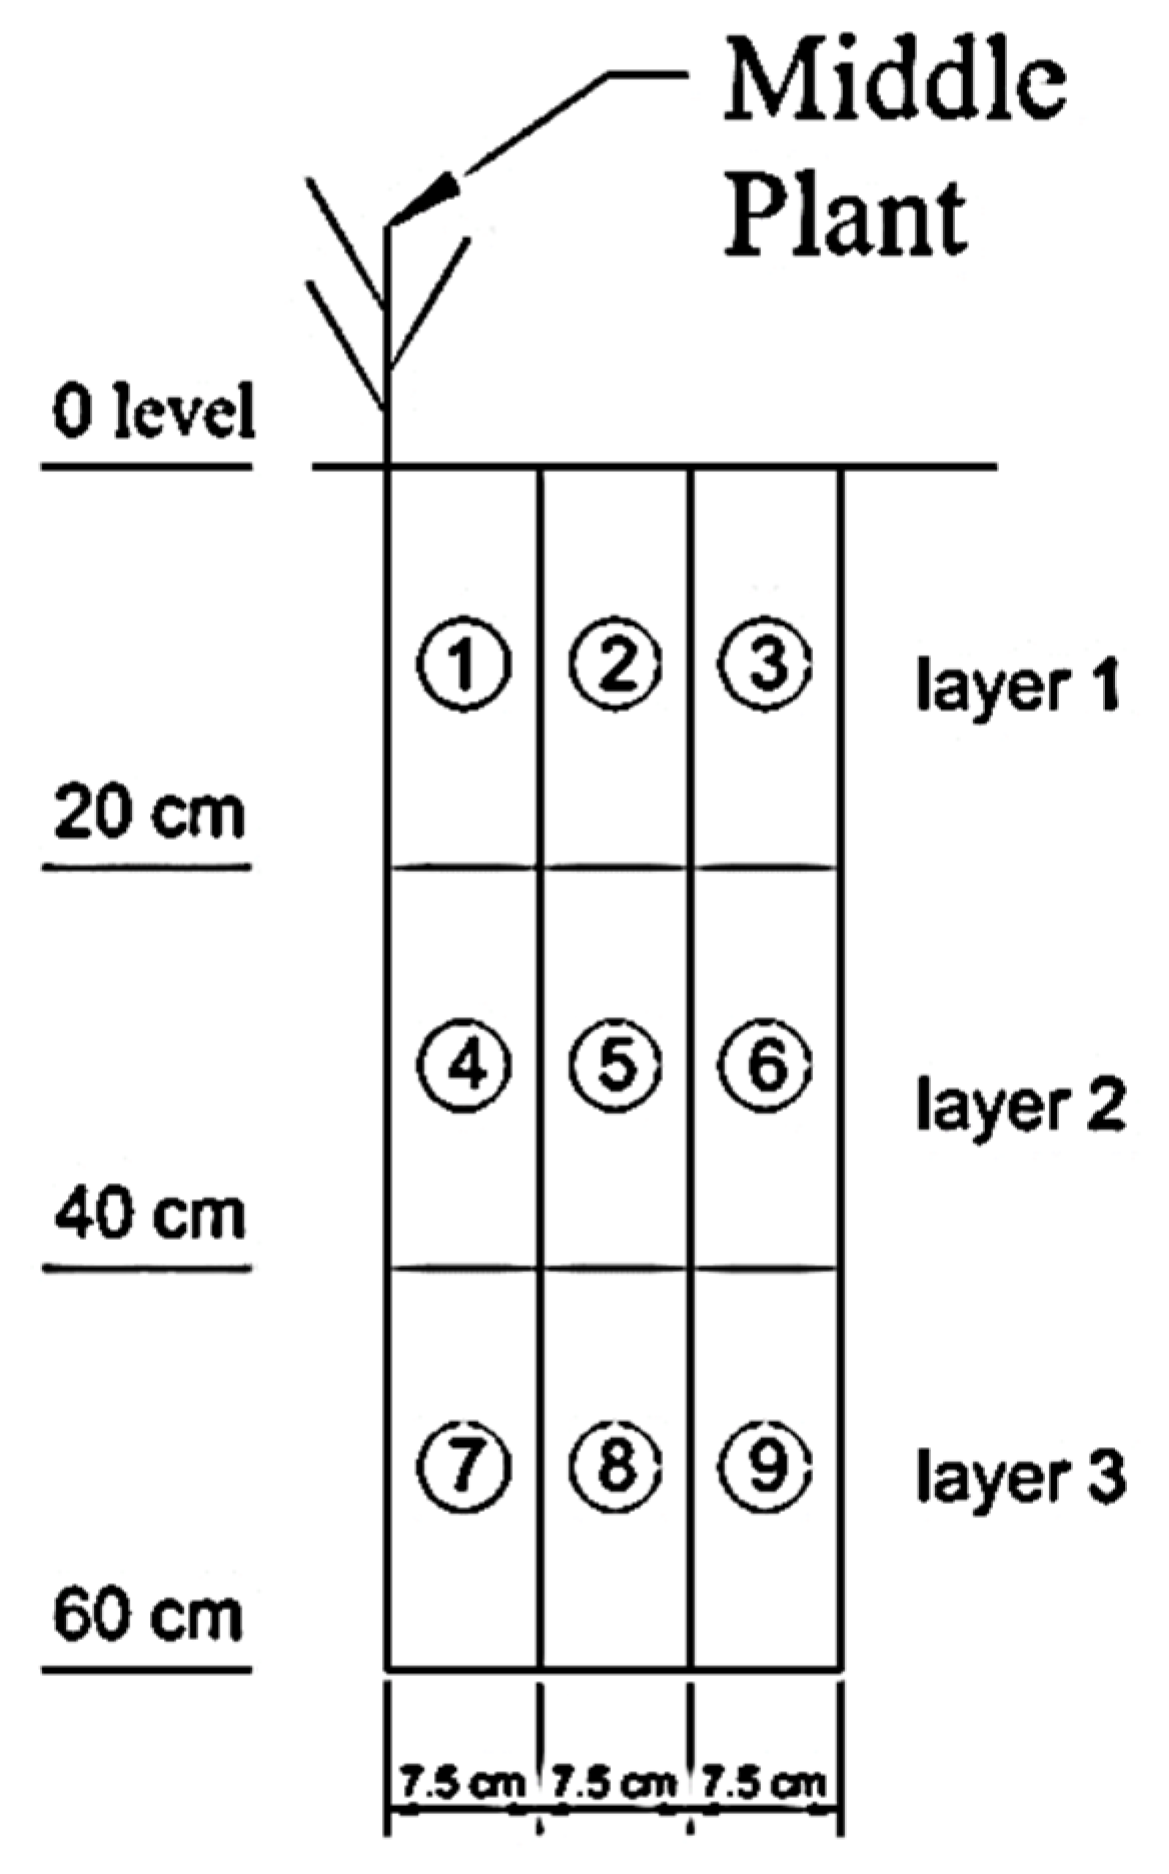
Soil preparation, cultivation method, fertilization, and weed and pest control were conducted according to the recommendations of the potato agricultural bulletin provided by the Egyptian Ministry of Agriculture for potato plants grown in sandy soils. The drainage water flow from the drain tubes was monitored and collected during the growing season. The total volume of the collected drainage water was measured by a volumetric cylinder. During soil preparation, a soil sample was collected to determine the initial properties of the investigated soil as shown in Table 2. At the end of the growing season, potato plant shoots were cut above the soil surface and kept in paper bags. Nine soil samples were taken for each lysimeter using a riverside auger. To represent the root zone of the middle plant, soil samples were obtained from three layers: 0–20, 20–40, and 40–60 cm, with distances as shown in Figure 4. Soil physical and chemical analyses were conducted according to [27,28].
After collecting soil samples, the potato tuber yield under different irrigation methods was calculated. The yield was calculated as an average for the three lysimeters with the same irrigation method. In addition, based on average crop yield, the irrigation water use efficiency (WUE) under different irrigation methods was calculated.
2.2.4. Heavy Metals Determination in Soil, Water, and Plant Samples
Preparation of Soil Samples
After collecting the soil samples from the experimental site, the samples were air dried, crushed with a wooden mortar and pestle, sieved through a 2 mm sieve, and stored in plastic containers. The soil samples were prepared for analysis by using the wet digestion method using a mixture of concentrated nitric and hydrochloric acids at a ratio of 1:3. Exactly 2 g of each dry soil sample was mixed with 7 mL of concentrated nitric acid and 21 mL of concentrated hydrochloric acid in a 100 mL glass flask. The mixture was heated by a hot plate for approximately 5 h at a temperature of 120 °C and 3 mL of hydrogen peroxide was slowly added until reaching a clear solution, then left to cool down. The digested soil samples were filtered using Whatman No 40-filter paper (Whatman™, Kent, UK), then diluted with pure deionized water to a constant volume of 50 mL using a measuring flask and then stored in glass bottles.
Preparation of Plant Samples
The vegetative parts of the potato plants at the harvesting stage were cut exactly above the soil surface and the tubers were collected after taking the soil samples. Three samples were selected randomly from each soil lysimeter. Both vegetative parts and tubers were collected in paper pages and sent directly to the laboratory. All the dirt or the attached soil particles on the plant parts were removed carefully using a fine brush. The vegetative parts were put back in paper pages. The tubers were cut into small pieces with a plastic knife and put into glass dishes. Both vegetative parts and tubers were dried in an oven at 55–60 °C until they reached a constant weight. The dried plant samples were crushed to small pieces using a wooden mortar and pestle then stored in small plastic containers. Exactly 0.50 g of each plant samples were wet digested using the same method described for soil samples.
Preparation of Irrigation Water Samples
Irrigation water samples were collected four times during the growing season. The samples were collected in clear sterilized glass bottles and stored directly in a refrigerator. An amount of 200 mL was taken from each water sample, put in a 250 mL conical flask, evaporated over a water bath to about 50 mL, then digested using a mixture of concentrated nitric and hydrochloric acids at a ratio of 1:3 as aforementioned. The digested samples were stored in glass bottles. This method was recommended by APHA (American Public Health Association), AWWA (American Water Works Association), and WEF (Water Environment Federation) [29].
Inductively Coupled Plasma–Optical Emission Spectrometer (ICP-OES) Measurements
Analyses of Cu, Mn, Pb, and Zn were performed at the Spectroscopy lab, Central laboratories network, National Research Center, Cairo, Egypt, with Inductively Coupled Plasma-Optical Emission Spectrometer (ICP-OES) (Agilent 5100 Synchronous Vertical Dual View (SVDV), Santa Clara, CA, USA). For each observation series, an intensity calibration curve was created composed of a reagent blank solution and five more standard solutions of different concentrations prepared by adequate dilutions of ICP single-element standard solutions of 1000 mg L−1. The ICP standard solutions are criterion traceable for standard reference material (SRM) from The National Institute of Standards and Technology (NIST; Gaithersburg, Maryland, USA). The ICP single-element standard solutions were copper nitrate (Cu(NO3)2), manganese nitrate (Mn(NO3)2), lead nitrate (Pb(NO3)2) and, zinc nitrate (Zn(NO3)2) in nitric acid (HNO3) 2–3% Certipur® for Cu, Mn, Pb, and Zn, respectively. These standard solutions were purchased from Merck, Darmstadt, Germany. To check and validate the reading of the ICP-OES, certified reference materials for soil, plant, and water samples (e.g., SRM 2709a, SRM 1573a, and SRM 1643e) from NIST (Gaithersburg, MD, USA) were used. The wavelengths chosen for the ICP-OES determination of Cu, Mn, Pb, and Zn were 327.40, 257.61, 214.44, and 213.89 nm, respectively.
Chemicals and Reagents
All reagents used for conducting the required analyses were of analytical grade. Nitric acid 65% (w/w), hydrochloric acid 37% (w/w), and hydrogen peroxide 30% (w/w) were purchased from Merck, Darmstadt, Germany. The water used to prepare the reagents and solutions was pure deionized water from a Milli-Q water purification system (Milli-Q IQ-7003; Merck, Darmstadt, Germany). All used glassware and sample containers were deeply soaked in hydrochloric acid 5% over night then washed by deionized water and dried before use.
2.3. Statistical Analysis
All measurements were subjected to an analysis of variance (ANOVA) using SPSS statistical software (version 25). Duncan’s multiple range test at a 5% significance level was executed to compare means.
3. Results and Discussion
3.1. Presence of Heavy Metals in Soil and Irrigation Water
Table 3 shows average HM concentrations in irrigation water and the initial concentrations in lysimeters. The initial HM concentrations in lysimeters soil were the average concentrations of three soil samples collected from the raw soil (i.e., soil of the experimental farm, Faculty of Agriculture, Suez Canal University, Ismailia, Egypt) before filling the lysimeters, whereas HM concentrations in the irrigation water were the average of four water samples collected from the El-Salam Canal. The location of the collected water samples was 31°01′07″ N 32°18′20″ E. The concentrations of all studied HMs in both irrigation water and soil were lower than the maximum permissible limits. Similar results regarding HM concentrations in irrigation water were reported for the same irrigation water source by Farag and Mehana [3]. They also stated that this irrigation water can be used to irrigate light to medium textured soil without problems to soil.
3.2. Heavy Metal Distribution within the Soil Profile under FI
HM concentrations in different locations within the soil profile irrigated with FI are shown in Table 4. The maximum concentration of Cu, Mn, Pb, and Zn was found in location 9 corresponding to the third soil layer. These were 18.8, 203.8, 13.3, and 70.0 mg/kg, respectively. This can be attributed to a downward movement of the excess irrigation water associated with FI that caused HMs to accumulate in this location. This location was far from the plant root zone, which minimizes the possibility of HM extraction by plant roots. In FI, the applied water amount was greatly exceeding the crop water requirements (1.77 ETc) that causes irrigation water percolate beyond the maximum root density zone. This finding is confirmed by comparing the amount of drainage water collected from each lysimeter during the whole growing season. The average quantity of drainage water (average of three lysimeters) corresponding to FI, SI, and DI was 91.4, 34.5, and 8.9 L, respectively. The minimum concentrations of Cu, Mn, and Zn were found at location 3 in the first soil layer. These concentrations were 4.13, 60.6, and 19.9 mg/kg, respectively. A minimum Pb concentration of 5.77 mg/kg was found at location 2 in the first soil layer as well. The difference in Pb concentrations between the two locations (2 and 3) is insignificant, as shown in Table 4. This may be due to the downward movement of excess irrigation water that allows HMs to migrate to deeper soil layers. By comparing the average concentration for each layer, it was found that the third soil layer contained the highest concentrations of all investigated HMs followed by the second and the first soil layer. The average HM concentration in the third soil layer was 12.5, 130.9, 10.8, and 46.4 mg/kg for Cu, Mn, Pb, and Zn, respectively. The highest HM concentration in the deepest soil layer associated with FI is logical due to the leaching process occurring with FI as applied irrigation water is much larger than the crop water need.
3.3. Heavy Metal Distribution within the Soil Profile under SI
As demonstrated in Table 5, the maximum concentrations of Cu, Mn, Pb, and Zn under SI were observed in location 5 of the second layer. These concentrations were 10.9, 140.8, 9.90 and 67.9 mg/kg for Cu, Mn, Pb, and Zn, respectively. On the other hand, the minimum concentration of Cu and Zn were found at location 7 in the third layer and equal to 3.63 and 24.0 mg/kg, respectively. This may be attributed to the relatively limited applied water (1.44 ETc) associated with SI as compared to FI (1.77 ETc). The Pb and Mn minimum concentrations of 4.30 and 51.27 mg/kg were found in location 1 and location 3, respectively, in the first layer. This can be attributed to a non-uniform distribution of irrigation water associated with SI. It is worth mentioning that, unfortunately, the uniformity coefficient under SI was not measured during SI experiments. Table 5 also shows that the maximum HM accumulation (i.e., concentration) was observed in the second soil layer for all HMs. This might be caused by the limited downward movement of irrigation water as compared to FI. The applied water in SI was much lower than that of FI. This likely caused higher accumulation of heavy metals in the second soil layer as compared to the deepest soil layer (i.e., third layer).
3.4. Heavy Metal Distribution within the Soil Profile under DI
As shown in Table 6, when applying DI, the maximum concentration of all HMs were found in the upper two soil layers. The maximum concentration of Mn and Zn was found in location 5 in the second soil layer; however, the maximum concentration of Pb and Cu was observed in location 4 and 2, respectively. These concentrations were 12.0, 140.0, 11.6 and 56.3 mg/kg for Cu, Mn, Pb, and Zn, respectively. The maximum average concentrations of Cu, Mn, Pb, and Zn were 9.40, 114.8, 9.84, and 40.6 mg/kg, respectively in the second soil layer. This can be attributed to the shape of the wetted bulb under the dripper and the amount of drainage water for DI that accumulates HMs in the second soil layer as compared to the deepest (third) soil layer. As the applied water under DI was equal to 1.27 ETc, some excess water is stored in soil and some water drains below the zone of maximum root density. It is worth mentioning that the average amount of drainage water from lysimeters under DI was 8.85 L compared to 34.5 and 91.4 L for SI and FI, respectively. This explains why the maximum HM concentrations were found within the upper two soil layers.
3.5. Effect of Irrigation Method on Heavy Metal Distribution within the Soil Profile
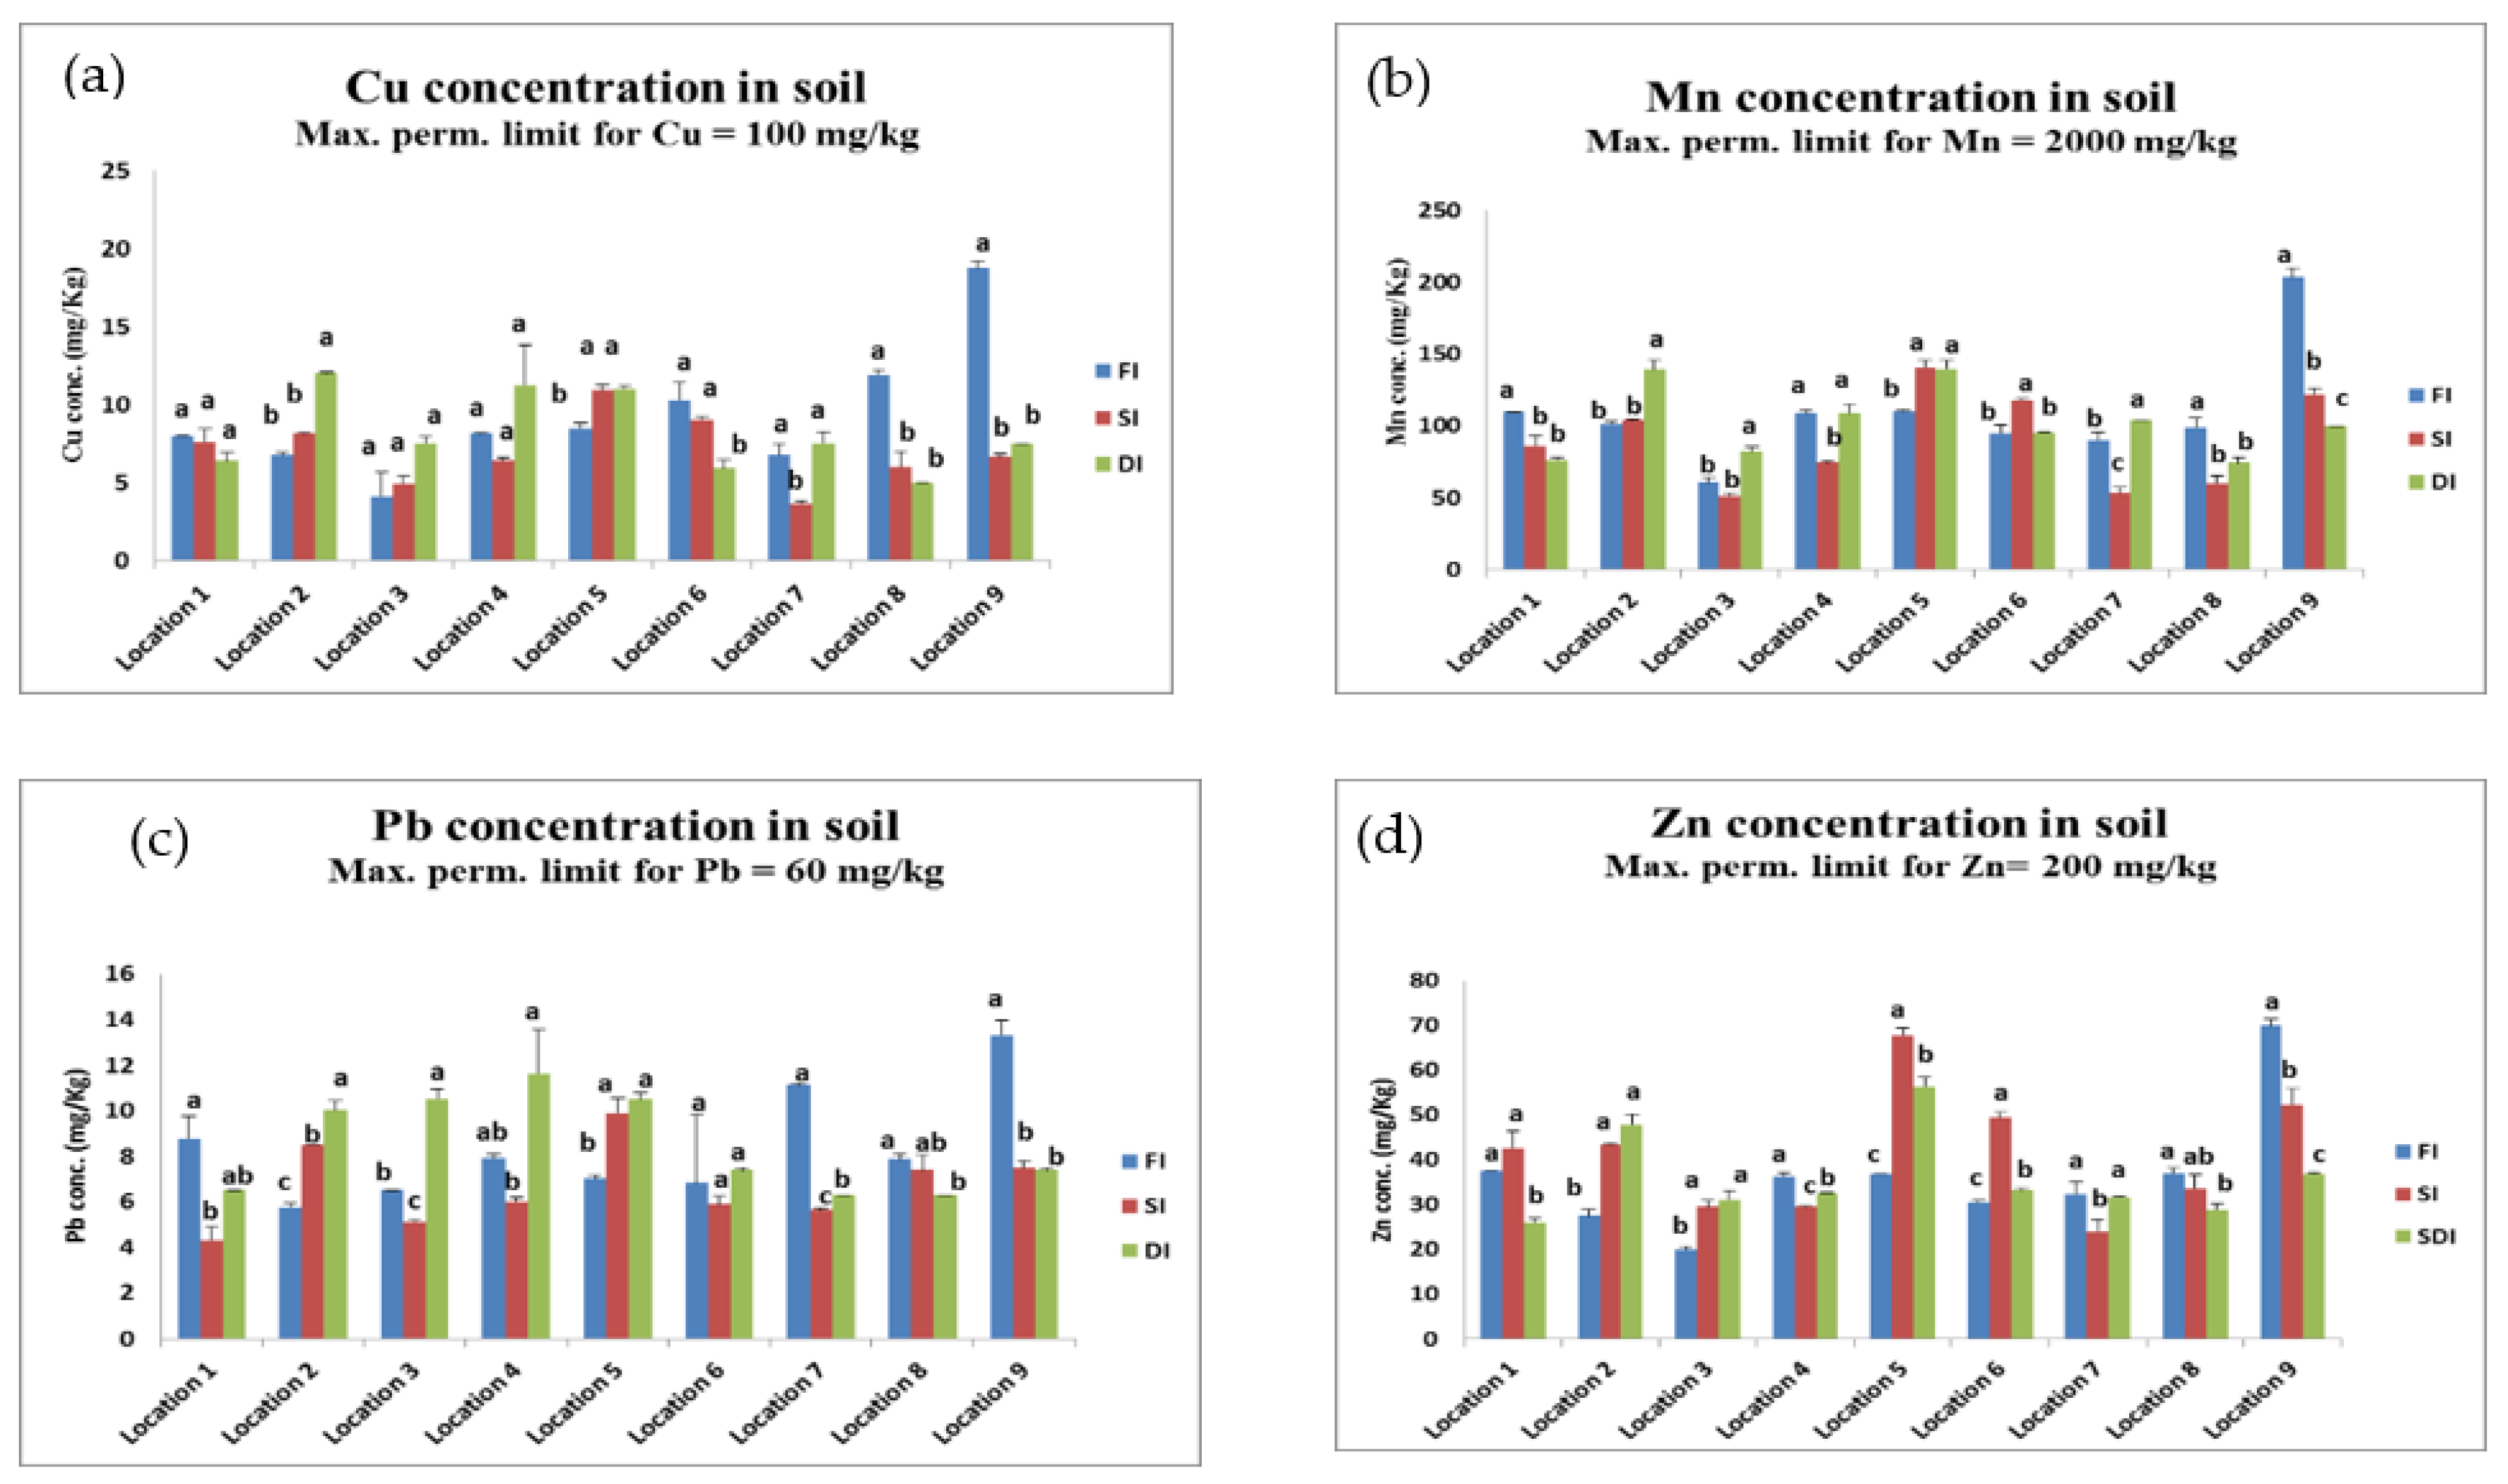
HM concentrations at different locations within the soil profile under different irrigation methods were shown in Figure 5a–d for Cu, Mn, Pb, and Zn, respectively. The figures show that irrigating with HM contaminated water increased the HM concentrations within the soil profile regardless of irrigation method. Average Cu, Mn, Pb, and Zn concentrations in different soil layers were higher than the initial HM concentrations. The figures also show that the maximum concentrations of HMs in soil irrigated with the three different irrigation methods are lower than the maximum permissible limits for HMs in soil, as mentioned by Weldegebriel et al. [7]. These limits are 100, 2000, 60 and 200 mg/kg for Cu, Mn, Pb, and Zn, respectively. For the upper two soil layers, DI produced the highest concentrations of Cu, Mn, and Pb at most locations within the upper soil layers (0–40 cm) as compared to FI and SI. The maximum concentrations of Cu, Mn, and Pb in the upper 40 cm soil layer were 12.0, 140.0, and 11.6 mg/kg, respectively. Maximum Zn concentration in the upper soil layer was observed under SI. This concentration was equal to 67.9 mg/kg. For the third soil layer, on the other hand, FI produced higher HM concentrations than SI and DI. Under FI, the maximum Cu, Mn, Pb, and Zn concentrations within the third soil layer were 18.8, 203.8, 13.3 and 70.0 mg/kg, respectively. This can be attributed to the wetted zone, the amount of water seeping below the root zone, and the irrigation efficiency. Under DI, the extension of the wetted bulb was limited to the upper two soil layers until a 40 cm soil depth, and the leaching amount below the zone of maximum root density was small. Therefore, maximum HM concentrations under DI were observed within the upper two soil layers. On the other hand, due to that the applied water was much higher than ETC in FI, a considerable amount of irrigation water seeped downward below the root zone causing the maximum accumulation of Cu, Mn, and Pb in the deepest (third) soil layer. Higher Zn concentrations in the first 20 cm soil layer were found under DI except for at location 1. However, they were observed in the second soil layer (20–40 cm) under SI except for at location 4. On the other hand, maximum Zn concentrations were found in the third soil layer (40–60 cm) under FI. Irrigating with water contaminated by HMs increases HM concentrations within the soil domain. Therefore, HM concentrations increased considerably in the first 40 cm soil depth under DI and up to a 60 cm soil depth under FI. These results concur with findings of Brar et al. [11] when investigating HM distribution under FI. The analysis of variance at p-level <0.05 showed that the concentrations of Cu, Mn, Pb, and Zn in soil were significantly affected by irrigation method. DI produced the highest concentrations of HMs in the upper soil layers (0–40 cm) and in FI the highest concentrations in the lower soil layer (40–60 cm). These results contradict with the findings of Cakmakci and Sahin [15]. They concluded that maize cultivation under FI with wastewater in sandy clayey loam resulted in statistically higher HM concentrations in all soil layers as compared to DI and SDI. The reason for this discrepancy may be attributed to the difference in soil texture that affects adsorption behavior. Moreover, the mechanisms of HM transport and accumulation in a soil–plant system can be greatly influenced by changes in soil pH, organic matter content, cation exchange capacity, soil salinity, metal chemical speciation, soil texture, nature and amount of nutrients, weather patterns, soil microbes, and other factors [15].
3.6. Heavy Metal Accumulation in Plant Parts
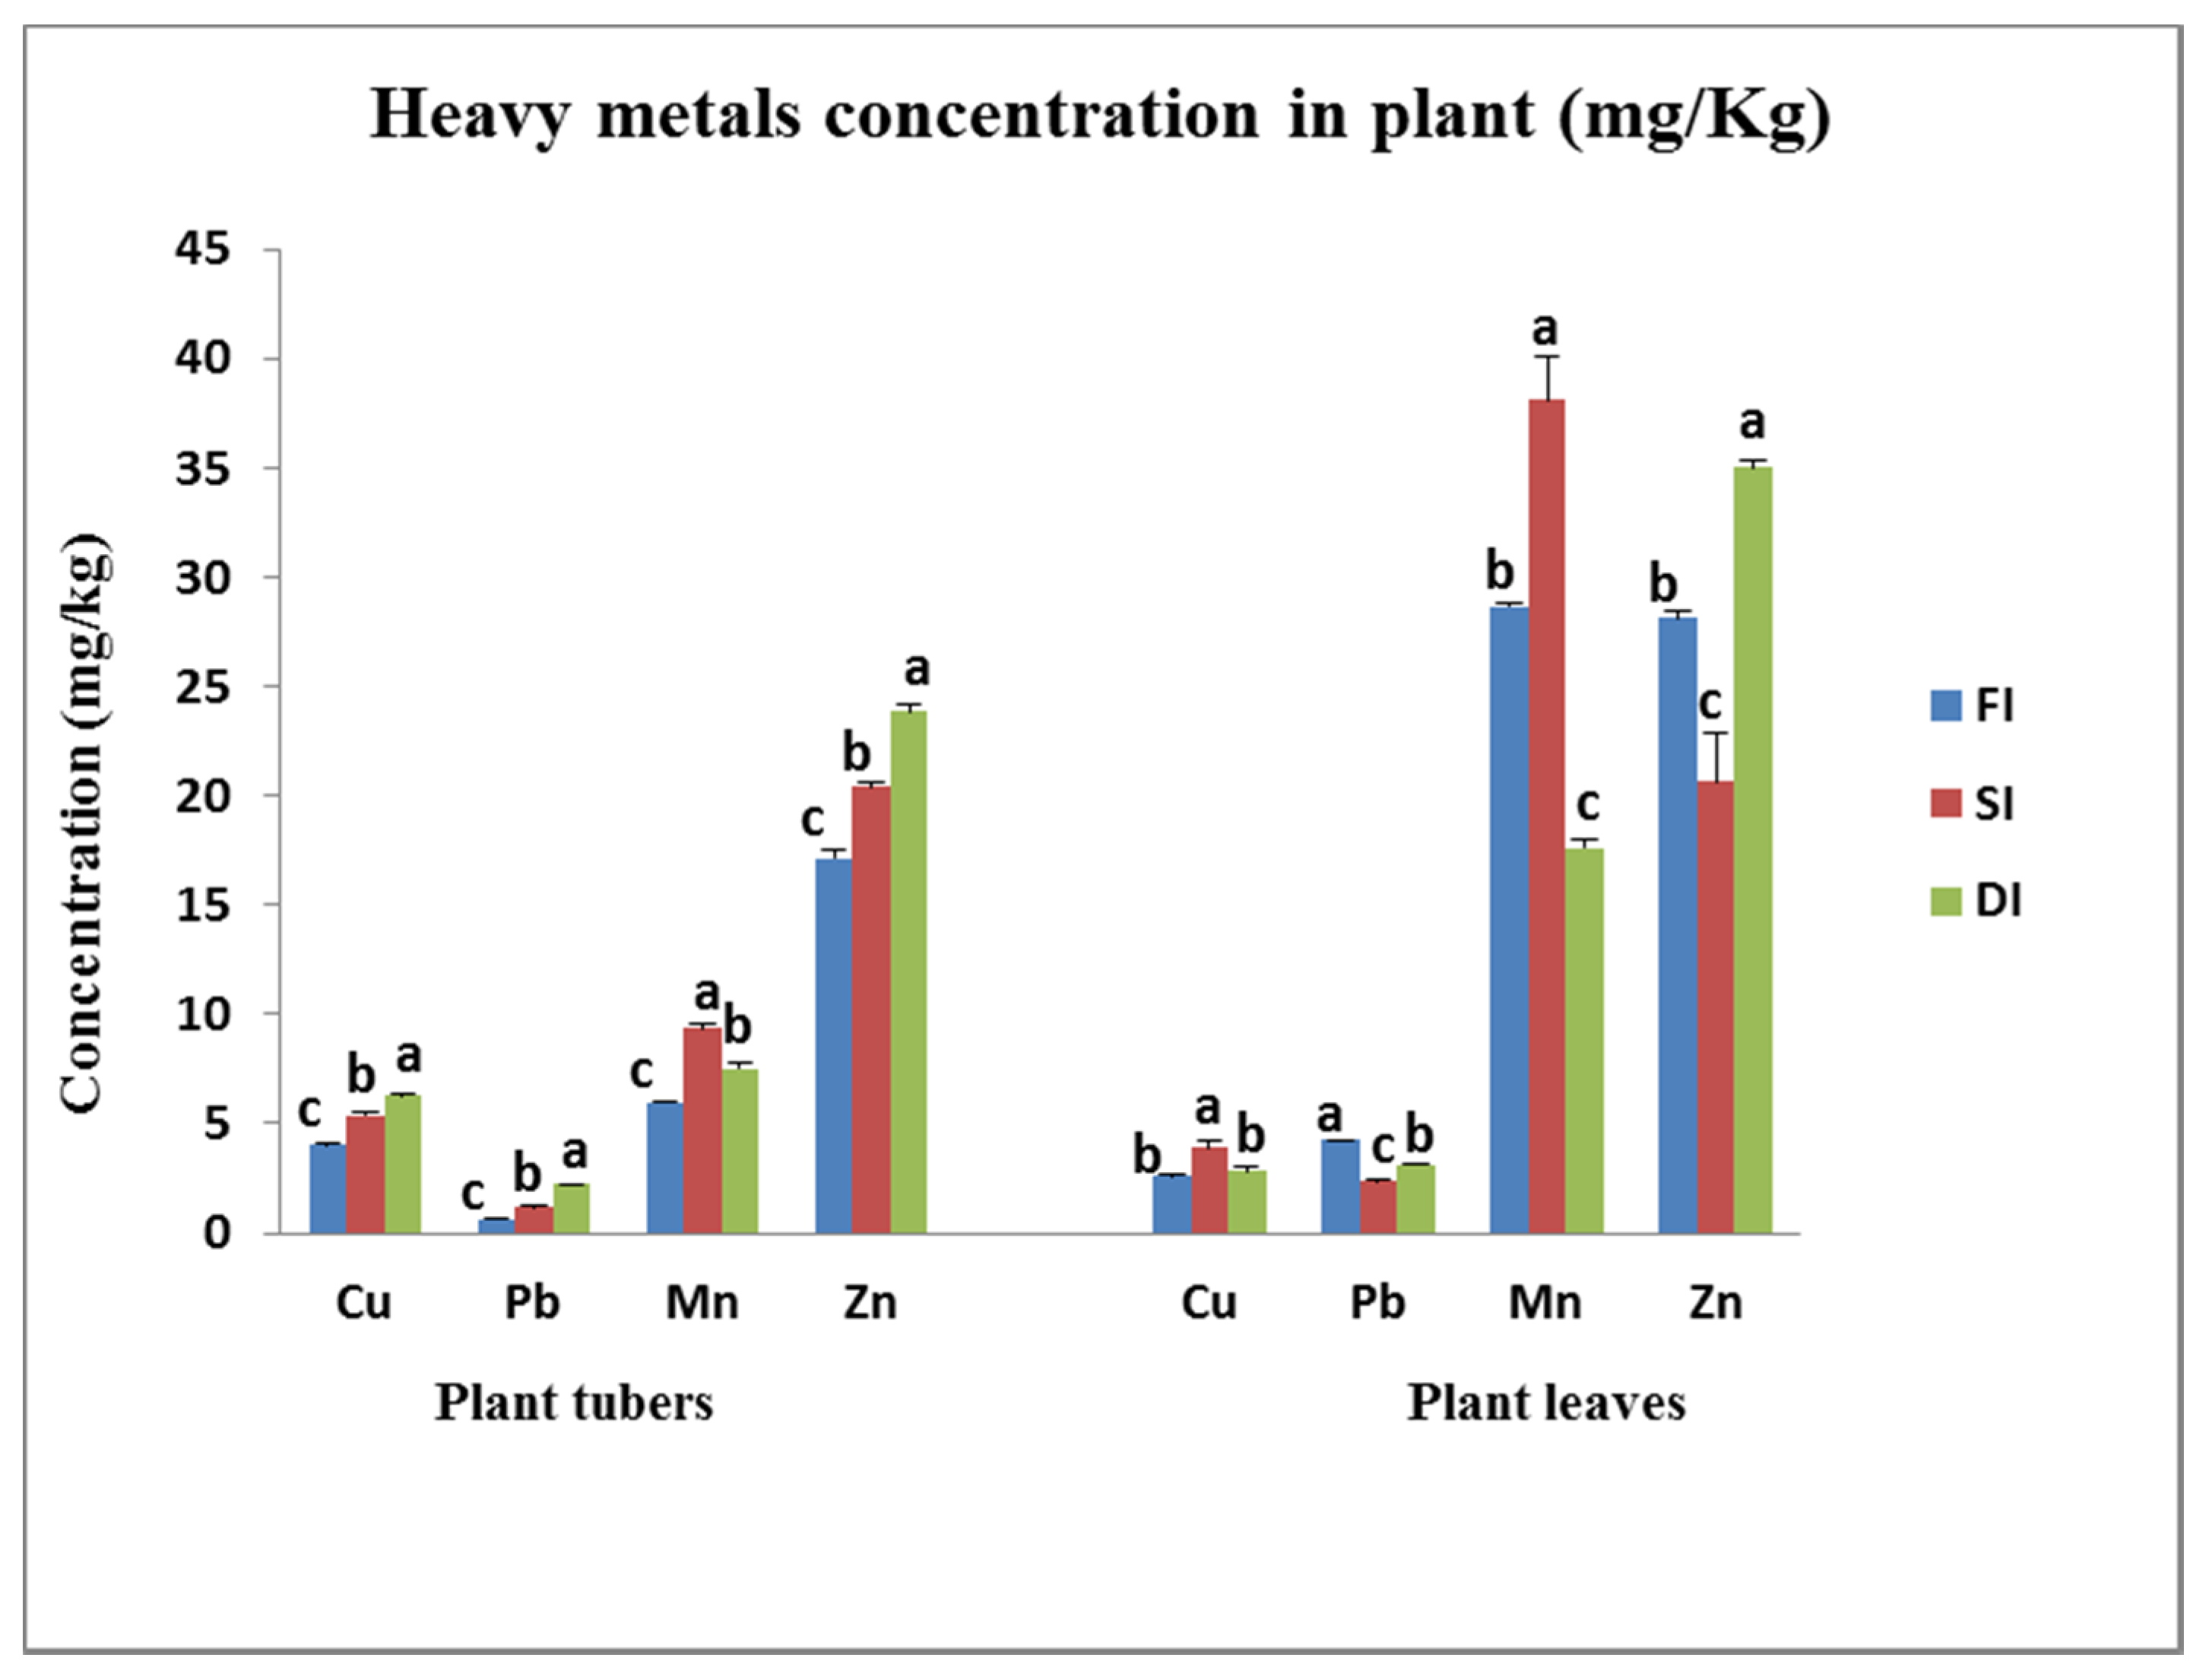
As shown in Table 7 and Figure 6, HMs extracted by a plant shoot system depend mainly on heavy metal type regardless of irrigation method. Although, the concentration of Cu, Mn, Pb, and Zn in a plant shoot system is not the same, the ratio between HM concentrations (i.e., Cu, Mn, Pb, and Zn) in plant shoots and soil was approximately the same regardless of irrigation method. The reason for the different concentrations of HMs in plant shoots may be attributed to HM uptake by foliar pathways. This uptake is greatly affected by the physico-chemical characteristics of the HM, chemical and physical forms of the adsorbed metal, deposition and adsorption of HMs in the atmosphere on plant leaves, and plant metabolism [30,31]. It was noted that higher concentrations of Cu and Mn in plant shoots were found under SI equal to 3.88 and 38.1 mg/kg, respectively. Under SI the water is sprayed over the plant, thereby, a certain amount of irrigation water is intercepted by plant leaves. When HM contaminated irrigation water is used under SI, the potential HM adsorption on plant leaves increases. This can explain the finding of higher Cu and Mn concentrations in plant shoots under SI than under FI and DI methods. On the other hand, maximum Pb and Zn concentrations of 4.25 and 35.0 mg/kg were found under FI and DI, respectively. This may be attributed to the translocation of metal through plant parts that depends on the physiological behavior of the HMs [32].
DI produced the highest concentration of HMs (Cu, Pb, and Zn) in potato tubers followed by SI. These concentrations under DI were 6.25, 2.25, and 23.9 mg/kg, respectively. FI yielded the lowest values of Cu, Pb, Mn, and Zn in the tubers. These minimum concentrations were 4.00, 0.63, 6.00, and 17.13 mg/kg, respectively. Higher HM concentrations in potato tubers found under DI can be assigned to the effect of higher HMs content in the wetted bulb below the dripper. Under DI, the irrigation water is approximately distributed (i.e., spread) in the zone of maximum root density with a minimal amount of leaching below the root zone. This increases the possibility of extracting large amounts of HMs by plant roots as compared to SI and FI. On the other hand, the highest Mn concentration in plant tubers was equal to 9.38 mg/kg and found under SI followed by DI. This can be attributed to the foliar uptake of Mn by plant leaves and the translocation of Mn throughout plant parts and finally stored in plant tubers.
Although DI produced higher HM concentrations in potato tubers than FI, these concentrations were much lower than the maximum permissible limits. Therefore, DI is recommended as a water saving technique especially in water scarce countries. Though potato yield and irrigation water use efficiency (WUE) under different irrigation methods are not the aim of the current study, these parameters were compared to the recommended irrigation method within the El-Salam Canal command. The average yield (average yield in the three lysimeters) of potato crop under FI, SI, and DI was 5.6, 5.2 and 5.4 kg, respectively. The corresponding WUE was 8.39, 9.58 and 11.3 kg m−3, respectively. As there was a slight difference in potato yield under FI and DI and as the WUE of DI was higher than FI, DI is generally recommended over FI. Moreover, DI with HM contaminated water is also recommended for agricultural land characterized by shallow groundwater as higher HM concentrations were found in the deeper soil layer under FI that may lead to potential groundwater contamination risks.
According to the analysis of variance at p-level = 0.05, different irrigation methods significantly affected Cu, Mn, Pb, and Zn contents in the plant tubers. It can be concluded that the application of FI produced the least amount of HMs in plant tubers, whereas, DI resulted in the maximum amount of HMs in plant tubers. It was noted that irrigating potato crop with HM contaminated water raised Mn, Pb, Cu, and Zn concentrations in potato shoots and tubers. This increase was generally greater in shoots than in tubers for all metals except for Cu. This may be due to Cu translocation via plant parts that depends on the metal’s physiological behavior [32]. It was also noted that HM concentrations in plants were lower than that of the soil. This concurs with the findings of Brar et al. [11]. It is worth mentioning that the maximum concentrations of all HMs in plant tubers and shoots under the investigated irrigation methods were lower than the maximum permissible limits of HMs [7,33] in potato crop. The maximum limits of Cu, Mn, Pb, and Zn in potato tubers and in potato shoots are 40, 500, 5 and 60 mg/kg and 40, 500, 5 and 60 mg/kg, respectively.
4. Conclusions
Based on the results of the current study, the following conclusions can be drawn:
- 1-
- Irrigating potato crop with irrigation water containing HMs increased concentrations of HMs in the soil and the potato shoots and tubers.
- 2-
- The accumulation behavior of HMs in the agricultural soils was greatly affected by the irrigation method. Under DI, the highest concentrations of HMs occurred in the upper soil layer (0–40 cm), while they occurred in the deep soil layer (40–60 cm) under FI. Therefore, FI is not recommended on agricultural land characterized by shallow groundwater to avoid the potential groundwater contamination risks.
- 3-
- The concentrations of HMs in the potato tubers differed according to the type of irrigation method. FI produced the least amount of HMs in plant tubers, while DI produced the maximum amount of HMs in plant tubers.
- 4-
- When using HM contaminated irrigation water, concentrations of HMs (Cu, Mn, Pb, and Zn) in plants were lower than those in the soil.
- 5-
- As the maximum concentrations of HMs in soil and potato crop irrigated from the El-Salam Canal water under FI, SI, and DI methods were lower than the maximum permissible limits, it is likely that using contaminated irrigation water over several growing seasons will not increase HMs to dangerous levels in soil and crops. However, continued long-term use of the El-Salam Canal water for irrigation purposes may bring HM contents in both soil and plant parts to the limiting levels. In addition, the DI method is recommended as it represents a water saving technique and as well limits the supply of HMs to soil. However, further research is suggested to investigate the environmental effects of using this water on plants and soil for the long-term.
Author Contributions
Conceptualization, T.S., M.E. and A.A.E.-k.; Data curation, T.S., S.M.E., R.B. and A.A.E.-k.; Formal analysis, T.S., S.M.E., M.E. and A.A.E.-k.; Funding acquisition, R.B.; Investigation, T.S., S.M.E. and A.A.E.-k.; Methodology, T.S., S.M.E. and A.A.E.-k.; Project administration, T.S., R.B. and M.E.; Resources, T.S., S.M.E., R.B., M.E. and A.A.E.-k.; Software, S.M.E.; Supervision, T.S., M.E. and A.A.E.-k.; Validation, S.M.E.; Visualization, T.S., S.M.E. and A.A.E.-k.; Writing—original draft, T.S., S.M.E. and A.A.E.-k.; Writing—review and editing, T.S., R.B., M.E. and A.A.E.-k. All authors have read and agreed to the published version of the manuscript.
Funding
This research received no specific grant from any funding agency in the public, commercial, or not for profit sectors.
Data Availability Statement
The data presented in this study is available on request from the corresponding author.
Acknowledgments
This study was supported by the MECW (Middle East in the Contemporary World) project at the Centre for Advanced Middle Eastern Studies, Lund University.
Conflicts of Interest
The authors declare that there is no conflict of interest.
References
- Tanji, K.K.; Yaron, B. Management of Water Use in Agriculture; Springer Science & Business Media: Berlin/Heidelberg, Germany, 2012; Volume 22, ISBN 978-3-642-78564-1. [Google Scholar]
- Selim, T.; Berndtsson, R.; Persson, M. Simulation of soil water and salinity distribution under surface drip irrigation. Irrig. Drain. 2013, 62, 352–362. [Google Scholar] [CrossRef]
- Farag, F.; Mehana, T. Studies on the quality of El-Salam canal water and its sources. In Proceedings of the Conference of Social and Agriculture Development of Sinai, El-Arish, Egypt, 2000; pp. 523–533. [Google Scholar]
- Wuana, R.A.; Okieimen, F.E. Heavy metals in contaminated soils: A review of sources, chemistry, risks and best available strategies for remediation. Int. Sch. Res. Not. 2011, 2011, 402647. [Google Scholar] [CrossRef] [Green Version]
- Patel, G. Effect of Waste Irrigation on Heavy Metal Accumulation in Soil and its Removal by Plants. Master’s Thesis, JNKVV, Jabalpur, India, 2013. [Google Scholar]
- Gupta, N.; Khan, D.; Santra, S. An assessment of heavy metal contamination in vegetables grown in wastewater-irrigated areas of Titagarh, West Bengal, India. Bull. Environ. Contam. Toxicol. 2008, 80, 115–118. [Google Scholar] [CrossRef]
- Weldegebriel, Y.; Chandravanshi, B.S.; Wondimu, T. Concentration levels of metals in vegetables grown in soils irrigated with river water in Addis Ababa, Ethiopia. Ecotoxicol. Environ. Saf. 2012, 77, 57–63. [Google Scholar] [CrossRef] [PubMed]
- Siddique, K.; Ali, S.; Farid, M.; Sajid, S.; Aslam, A.; Ahmad, R.; Taj, L.; Nazir, M.M. Different heavy metal concentrations in plants and soil irrigated with industrial/sewage waste water. Int. J. Environ. Monit. Anal. 2014, 2, 151–157. [Google Scholar] [CrossRef]
- Al-Subu, M.M.; Haddad, M.; Mizyed, N.; Mizyed, I. Impacts of irrigation with water containing heavy metals on soil and groundwater–a simulation study. Water Air Soil Pollut. 2003, 146, 141–152. [Google Scholar] [CrossRef]
- Sayo, S.; Kiratu, J.M.; Nyamato, G.S. Heavy metal concentrations in soil and vegetables irrigated with sewage effluent: A case study of Embu sewage treatment plant, Kenya. Sci. Afr. 2020, 8, e00337. [Google Scholar] [CrossRef]
- Brar, M.; Malhi, S.; Singh, A.; Arora, C.; Gill, K. Sewage water irrigation effects on some potentially toxic trace elements in soil and potato plants in northwestern India. Can. J. Soil Sci. 2000, 80, 465–471. [Google Scholar] [CrossRef]
- Al Omron, A.; El-Maghraby, S.; Nadeem, M.; El-Eter, A.; Al-Mohani, H. Long term effect of irrigation with the treated sewage effluent on some soil properties of Al-Hassa Governorate, Saudi Arabia. J. Saudi Soc. Agric. Sci. 2012, 11, 15–18. [Google Scholar] [CrossRef] [Green Version]
- Nzediegwu, C.; Prasher, S.; Elsayed, E.; Dhiman, J.; Mawof, A.; Patel, R. Effect of biochar on heavy metal accumulation in potatoes from wastewater irrigation. J. Environ. Manag. 2019, 232, 153–164. [Google Scholar] [CrossRef]
- Wang, Z.; Lei, G. Study on penetration effect of heavy metal migration in different soil types. IOP Conf. Ser. Mater. Sci. Eng. 2018, 394, 052033. [Google Scholar] [CrossRef]
- Cakmakci, T.; Sahin, U. Productivity and heavy metal pollution management in a silage maize field with reduced recycled wastewater applications with different irrigation methods. J. Environ. Manag. 2021, 291, 112602. [Google Scholar] [CrossRef] [PubMed]
- Khawla, K.; Besma, K.; Enrique, M.; Mohamed, H. Accumulation of trace elements by corn (Zea mays) under irrigation with treated wastewater using different irrigation methods. Ecotoxicol. Environ. Saf. 2019, 170, 530–537. [Google Scholar] [CrossRef] [PubMed]
- Asgari, K.; Cornelis, W.M. Heavy metal accumulation in soils and grains, and health risks associated with use of treated municipal wastewater in subsurface drip irrigation. Environ. Monit. Assess. 2015, 187, 1–13. [Google Scholar] [CrossRef]
- Najafi, P. Effects of using subsurface drip irrigation and treated municipal waste water in irrigation of tomato. Pakistan J. Biol. Sci. 2006, 9, 2672–2676. [Google Scholar] [CrossRef]
- Allen, R.G.; Pereira, L.S.; Raes, D.; Smith, M. Crop Evapotranspiration-Guidelines for Computing Crop Water Requirements-FAO Irrigation and Drainage Paper 56; FAO: Rome, Italy, 1998. [Google Scholar]
- Burt, R. Kellogg Soil Survey Laboratory Methods Manual; Soil Survey Investigations Report no. 42, Version 5.0; USDA: Lincoln, NE, USA, 2014; pp. 1–219.
- Geriesh, M.; El-Rayes, A.; Gomaa, R.; Kaiser, M.; Mohamed, M. Geoenvironmental impact assessment of El-Salam Canal on the surrounding soil and groundwater flow regime, Northwestern Sinai, Egypt. Catrina Int. J. Environ. Sci. 2015, 12, 17–29. [Google Scholar]
- Muñoz, G.; Grieser, J. Climwat 2.0 for CROPWAT; Water Resources, Development and Management Service: Rome, Italy, 2006; pp. 1–5. [Google Scholar]
- Clarke, D.; Smith, M.; El-Askari, K. New software for crop water requirements and irrigation scheduling. Irrig. Drain. 1998, 47, 45–58. [Google Scholar]
- Pescod, M. Wastewater Treatment and Use in Agriculture-FAO Irrigation and Drainage Paper 47; Food and Agriculture Organization of the United Nations: Rome, Italy, 1992. [Google Scholar]
- Kumar, M.D.; Turral, H.; Sharma, B.; Amarasinghe, U.; Singh, O.P. Water saving and yield enhancing micro irrigation technologies in India: When and where can they become best bet technologies? In Managing Water in the Face of Growing Scarcity, Inequity and Declining Returns: Exploring Fresh Approaches, Proceedings of the 7th Annual Partners Meet, IWMI TATA Water Policy Research Program, ICRISAT, Patancheru, Hyderabad, India, 2–4 April 2008; Kumar, M.D., Ed.; Volume 1, pp. 1–36. Available online: https://ideas.repec.org/p/ags/iwmicp/138984.html (accessed on 10 March 2022).
- Howell, T.A. Irrigation efficiency. Encycl. Water Sci. 2003, 467, 500. [Google Scholar]
- Helmke, P.A.; Sparks, D.L. Lithium, sodium, potassium, rubidium, and cesium. Methods Soil Anal. Part 3 Chem. Methods 1996, 5, 551–574. [Google Scholar]
- Gee, G.; Bauder, J.W. Particle size analysis. In Methods of Soil Analysis; Klute, I.I., Ed.; Soil Science Society of America: Madison, WI, USA, 1986; pp. 383–412. [Google Scholar]
- Rice, E.W.; Baird, R.B.; Eaton, A.D.; Clesceri, L.S. (Eds.) Standard Methods for the Examination of Water and Wastewater, 23rd ed.; American Public Health Association, American Water Works Association, Water Environment Federation: Washington, DC, USA, 2017. [Google Scholar]
- Beckett, K.P.; Freer-Smith, P.; Taylor, G. Particulate pollution capture by urban trees: Effect of species and windspeed. Glob. Chang. Biol. 2000, 6, 995–1003. [Google Scholar] [CrossRef]
- Beckett, K.P.; Freer-Smith, P.H.; Taylor, G. The capture of particulate pollution by trees at five contrasting urban sites. Arboric. J. 2000, 24, 209–230. [Google Scholar] [CrossRef]
- Shahid, M.; Dumat, C.; Khalid, S.; Schreck, E.; Xiong, T.; Niazi, N.K. Foliar heavy metal uptake, toxicity and detoxification in plants: A comparison of foliar and root metal uptake. J. Hazard. Mater. 2017, 325, 36–58. [Google Scholar] [CrossRef] [PubMed] [Green Version]
- WHO/FAO. Joint FAO/WHO Food Standard Programme Codex Alimentarius Commission 13th Session; Report of the Thirty Eight Session of the Codex Committee on Food Hygiene: Houston, TX, USA, 2007. [Google Scholar]
Figure 1.
Location of field experiments and irrigation water source.

Figure 2.
Nine experimental lysimeters, each 1.5 m long, 1.0 m wide, and 1.0 m high.

Figure 3.
Schematic of the distance between potato plants in lysimeters (m).

Figure 4.
Schematic (2D vertical cross section) showing positions of the collected soil samples in each lysimeter at the end of the experiment.
Figure 4.
Schematic (2D vertical cross section) showing positions of the collected soil samples in each lysimeter at the end of the experiment.

Figure 5.
HM concentrations (mean ± SE; mg/kg soil) in soil profile under different irrigation methods; (a) Cu, (b) Mn, (c) Pb, and (d) Zn. Small letters show significant difference between different irrigation methods. Bars with the same letters for the same location refer to insignificant difference and bars with different letters for the same location refer to the existence of significant difference at p-level < 0.05 according to Duncan’s multiple range test.

Figure 6.
HM concentrations (mean ± SE; mg/kg) in both shoots and tubers of potato plants under different irrigation methods with HM contaminated water. Small letters show significant difference between irrigation methods. Bars with the same letter for the same metal refer to insignificant difference and bars with different letters for the same metal refer to significant difference at p-level < 0.05 according to Duncan’s multiple range test.


Table 1.
Physical and chemical properties of the experimental soil.
| Particle Size Distribution (%) | Texture | Physical Parameters | Chemical Parameters | ||||||||
|---|---|---|---|---|---|---|---|---|---|---|---|
| Coarse Sand | Fine Sand | Silt | Clay | Sand | Bulk Density (g cm−3) | Particle Density (g cm−3) | Total Porosity % | Saturated Water Content (θs; cm3 cm−3) | Residual Water Content (θr; cm3 cm−3) | ECe * (dS m−1) | pH ** |
| 80.1 | 15.1 | 1.8 | 3.0 | 1.63 | 2.60 | 37.17 | 0.310 | 0.019 | 1.50 | 7.31 | |
* In soil paste extract and ** in soil water suspension 1:2.5.
Table 2.
Irrigation events and corresponding irrigation water (in mm) under FI, SI, and DI.
| Irrigation Date | Applied Water for Each Lysimeter (mm) | ||
|---|---|---|---|
| DI | SI | FI | |
| 03/11/2020 | 5.7 | 6.4 | 7.9 |
| 06/11/2020 | 5.7 | 6.4 | 7.9 |
| 10/11/2020 | 7.6 | 8.5 | 10.5 |
| 13/11/2020 | 5.7 | 6.4 | 7.9 |
| 17/11/2020 | 7.7 | 8.5 | 10.5 |
| 20/11/2020 | 5.7 | 6.4 | 7.9 |
| 23/11/2020 | 5.7 | 6.4 | 7.9 |
| 27/11/2020 | 7.8 | 8.8 | 10.8 |
| 01/12/2020 | 8.5 | 9.5 | 11.7 |
| 05/12/2020 | 7.9 | 8.9 | 10.9 |
| 10/12/2020 | 11.3 | 12.7 | 15.6 |
| 14/12/2020 | 10.1 | 11.4 | 14.0 |
| 17/12/2020 | 8.3 | 9.3 | 11.4 |
| 21/12/2020 | 11.9 | 13.4 | 16.4 |
| 25/12/2020 | 12.9 | 14.5 | 17.8 |
| 29/12/2020 | 13.2 | 14.9 | 18.3 |
| 01/01/2021 | 12.0 | 13.5 | 16.6 |
| 07/01/2021 | 32.5 | 36.5 | 44.9 |
| 11/01/2021 | 21.6 | 24.3 | 30.0 |
| 14/01/2021 | 16.2 | 18.3 | 22.5 |
| 16/01/2021 | 10.8 | 12.2 | 15.0 |
| 21/01/2021 | 27.0 | 30.4 | 37.4 |
| 26/01/2021 | 26.9 | 30.2 | 37.2 |
| 29/01/2021 | 15.5 | 17.5 | 21.5 |
| 02/02/2021 | 21.0 | 23.6 | 29.0 |
| Total applied water for each lysimeter (mm) | 318.8 | 358.7 | 441.4 |
| Total ETc (mm) | 249.5 | 249.5 | 249.5 |
Table 3.
Initial HM concentrations in the agricultural soil (mg/kg), and average concentration in irrigation water (mean ± standard deviation; mg/L) during the growing season.
Table 3.
Initial HM concentrations in the agricultural soil (mg/kg), and average concentration in irrigation water (mean ± standard deviation; mg/L) during the growing season.
| Metal | Cu | Mn | Pb | Zn |
|---|---|---|---|---|
| Concentration in irrigation water (mg/L) | 0.078 ± 0.011 | 0.031 ± 0.004 | 0.045 ± 0.010 | 0.140 ± 0.010 |
| Maximum permissible limit in irrigation water (mg/L) [22] | 0.20 | 0.20 | 5.00 | 2.00 |
| Concentration in soil (mg/kg) | 4.75 | 56.75 | 5.75 | 27.75 |
| Maximum permissible limit for soil (mg/kg) [7] | 100 | 2000 | 60 | 200 |
Table 4.
HM concentrations * (mean ± SE; mg/kg soil) in different locations within the soil profile under FI at the end of growing season.
Table 4.
HM concentrations * (mean ± SE; mg/kg soil) in different locations within the soil profile under FI at the end of growing season.
| Depth | Location | Cu | Mn | Pb | Zn |
|---|---|---|---|---|---|
| Layer 1 0–20 cm | Location 1 | 8.00 d ± 0.00 | 109.5 b ± 0.29 | 8.77 bc ± 1.01 | 37.50 b ± 0.00 |
| Location 2 | 6.77 d ± 0.15 | 101.27 bcd ± 2.17 | 5.77 c ± 0.15 | 27.40 d ± 1.50 | |
| Location 3 | 4.13 e ± 1.53 | 60.63 e ± 3.95 | 6.50 c ± 0.00 | 19.90 e ± 0.64 | |
| Average | 6.3 ± 1.14 | 90.47 ± 15.10 | 7.01 ± 0.90 | 28.27 ± 5.10 | |
| Layer 2 20–40 cm | Location 4 | 8.13 cd ± 0.09 | 108.77 bc ± 2.17 | 7.90 bc ± 0.23 | 36.20 b ± 0.97 |
| Location 5 | 8.5 cd ± 0.29 | 110.00 b ± 1.44 | 7.03 c ± 0.15 | 36.77 b ± 0.15 | |
| Location 6 | 10.30 c ± 1.15 | 94.63 cd ± 5.86 | 6.83 c ± 2.98 | 30.50 cd ± 0.29 | |
| Average | 8.98 ± 0.67 | 104.47 ± 4.93 | 7.25 ±0.34 | 34.49 ± 2.00 | |
| Layer 3 40–60 cm | Location 7 | 6.77 d ± 0.72 | 90.00 d ± 5.77 | 11.13 ab ± 0.09 | 32.27 c ± 2.74 |
| Location 8 | 11.90 b ± 0.35 | 98.77 bcd ± 6.50 | 7.87 bc ± 0.23 | 37.00 b ± 1.15 | |
| Location 9 | 18.77 a ± 0.43 | 203.77 a ± 6.50 | 13.33 a ± 0.66 | 70.00 a ± 1.44 | |
| Average | 12.48 ± 3.48 | 130.85 ± 36.54 | 10.78 ± 1.53 | 46.42 ± 11.87 |
* Small letters in the same column show the significant difference between locations. Values followed by letter (a) refer to the maximum mean and values followed by letter (e) refer to the minimum mean. Values followed by the same letter within the same column indicate that there are no significant differences between investigated values. However, values followed by different letters within the same column indicate that there are significant differences at p-level < 0.05 according to Duncan’s multiple range test.
Table 5.
Heavy metal concentrations * (mean ± SE; mg/kg soil) in different locations within the soil profile under SI at the end of growing season.
Table 5.
Heavy metal concentrations * (mean ± SE; mg/kg soil) in different locations within the soil profile under SI at the end of growing season.
| Depth | Location | Cu | Mn | Pb | Zn |
|---|---|---|---|---|---|
| Layer 1 0–20 cm | Location 1 | 7.63 bcd± 0.78 | 86.03 d ± 7.07 | 4.30 d ± 0.58 | 42.50 c ± 3.75 |
| Location 2 | 8.13 bc ± 0.09 | 104.27 c ± 0.43 | 8.50 b ± 0.00 | 43.27 c ± 0.43 | |
| Location 3 | 4.90 fg ± 0.52 | 51.27 f ± 2.17 | 5.13 cd ± 0.09 | 29.40 de ± 1.50 | |
| Average | 6.89 ± 1.00 | 80.52 ± 15.55 | 5.98 ± 1.28 | 38.39 ± 4.50 | |
| Layer 2 20–40 cm | Location 4 | 6.40 def ± 0.23 | 74.3 e ± 1.44 | 6.03 c ± 0.15 | 29.40 de ± 0.23 |
| Location 5 | 10.90 a ± 0.35 | 140.80 a ± 4.62 | 9.90 a ± 0.64 | 67.90 a ± 1.39 | |
| Location 6 | 9.03 b ± 0.15 | 118.13 b ± 1.07 | 5.90 c ± 0.35 | 49.40 bc ± 1.21 | |
| Average | 8.78 ± 1.31 | 111.08 ± 19.52 | 7.28 ± 1.31 | 48.90 ± 11.11 | |
| Layer 3 40–60 cm | Location 7 | 3.63 g ± 0.20 | 53.27 f ± 3.61 | 5.63 c ± 0.09 | 24.03 e ± 2.54 |
| Location 8 | 6.00 ef ± 0.98 | 60.13 f ± 5.00 | 7.40 b ± 0.64 | 33.5 d ± 3.18 | |
| Location 9 | 6.63 cde ± 0.20 | 122.13 b ± 4.24 | 7.50 b ± 0.29 | 52.27 b ± 3.61 | |
| Average | 5.42 ± 0.91 | 78.51 ± 21.9 | 6.84 ± 0.61 | 36.6 ± 8.29 |
* Small letters in the same column show the significant difference between locations. Values followed by letter (a) refer to the maximum mean and values followed by letter (g) refer to the minimum mean. Values followed by the same letter within the same column indicate that there are no significant differences between investigated values. However, values followed by different letters within the same column indicate that there are significant differences at p-level < 0.05 according to Duncan’s multiple range test.
Table 6.
HM concentrations * (mean ± SE; mg/kg soil) in different locations within the soil profile under DI at the end of growing season.
Table 6.
HM concentrations * (mean ± SE; mg/kg soil) in different locations within the soil profile under DI at the end of growing season.
| Depth | Location | Cu | Mn | Pb | Zn |
|---|---|---|---|---|---|
| Layer 1 0–20 cm | Location 1 | 6.40 b ± 0.52 | 76.27 d ± 2.17 | 6.50 b ± 0.00 | 26.00 e ± 0.87 |
| Location 2 | 12.00 a ± 0.087 | 139.4 a ± 6.12 | 10.03 a ± 0.43 | 47.77 b ± 2.47 | |
| Location 3 | 7.53 b ± 0.43 | 82.50 d ± 2.89 | 10.53 a ± 0.43 | 31.00 d ± 2.02 | |
| Average | 8.64 ± 1.71 | 99.39 ± 20.09 | 9.02 ± 1.27 | 34.92 ± 6.58 | |
| Layer 2 20–40 cm | Location 4 | 11.27 a ± 2.54 | 108.77 b ± 6.50 | 11.63 a ± 1.93 | 32.50 cd ± 0.00 |
| Location 5 | 11.03 a ± 0.15 | 140 a ± 5.77 | 10.5 a ± 0.29 | 56.27 a ± 2.17 | |
| Location 6 | 5.90 b ± 0.52 | 95.50 c ± 0.29 | 7.40 b ± 0.06 | 33.13 cd ± 0.38 | |
| Average | 9.40 ± 1.75 | 114.76 ± 13.19 | 9.84 ± 1.27 | 40.63 ± 7.82 | |
| Layer 3 40–60 cm | Location 7 | 7.53 b ± 0.72 | 103.90 bc ± 0.06 | 6.30 b ± 0.00 | 31.50 d ± 0.29 |
| Location 8 | 5.00 b ± 0.00 | 74.50 d ± 4.04 | 6.30 b ± 0.00 | 28.77 de ± 1.30 | |
| Location 9 | 7.50 b ± 0.00 | 100.00 bc ± 0.00 | 7.40 b ± 0.06 | 36.77 c ± 0.43 | |
| Average | 6.68 ± 0.84 | 92.8 ± 9.23 | 6.67 ± 0.37 | 32.35 ± 2.34 |
* Small letters in the same column show the significant difference between locations. Values followed by letter (a) refer to the maximum mean and values followed by letter (e) refer to the minimum mean. Values followed by the same letter within the same column indicate that there are no significant differences between investigated values. However, values followed by different letters within the same column indicate that there are significant differences at p-level < 0.05 according to Duncan’s multiple range test.
Table 7.
Concentrations of HMs in plant (mean + SE; mg/kg) under FI, SI, and DI methods with water containing HMs.
Table 7.
Concentrations of HMs in plant (mean + SE; mg/kg) under FI, SI, and DI methods with water containing HMs.
| Type | Metal | Fl | SI | DI | Guideline for Safe Limits of HMs * |
|---|---|---|---|---|---|
| Tubers | Cu | 4.00 c ± 0.14 | 5.37 b ± 0.22 | 6.25 a ± 0.14 | 40 |
| Pb | 0.63 c ± 0.07 | 1.17 b ± 0.08 | 2.25 a ± 0.00 | 5 | |
| Mn | 6.00 c ± 0.00 | 9.38 a ± 0.22 | 7.50 b ± 0.29 | 500 ** | |
| Zn | 17.13 c ± 0.36 | 20.38 b ± 0.22 | 23.87 a ± 0.36 | 60 | |
| Vegetative part (shoots) | Cu | 2.62 b ± 0.07 | 3.88 a ± 0.36 | 2.83 b ± 0.17 | 40 |
| Pb | 4.25 a ± 0.00 | 2.38 c ± 0.07 | 3.13 b ± 0.07 | 5 | |
| Mn | 28.63 b ± 0.22 | 38.13 a ± 1.95 | 17.62 c ± 0.36 | 500 ** | |
| Zn | 28.13 b ± 0.36 | 20.62 c ± 2.24 | 35.00 a ± 0.29 | 60 |
* WHO/FAO [33] and ** Weldegebriel et al. [7]. Small letters show significant difference between irrigation methods. Values with the same letter for the same metal refer to insignificant difference and values with different letters for the same metal refer to significant difference at p-level < 0.05 according to Duncan’s multiple range test.
Publisher’s Note: MDPI stays neutral with regard to jurisdictional claims in published maps and institutional affiliations. |
© 2022 by the authors. Licensee MDPI, Basel, Switzerland. This article is an open access article distributed under the terms and conditions of the Creative Commons Attribution (CC BY) license (https://creativecommons.org/licenses/by/4.0/).
Share and Cite
MDPI and ACS Style
Selim, T.; Elkefafy, S.M.; Berndtsson, R.; Elkiki, M.; El-kharbotly, A.A. Can Potato Crop on Sandy Soil Be Safely Irrigated with Heavy Metal Polluted Water? Water 2022, 14, 1226. https://doi.org/10.3390/w14081226
AMA Style
Selim T, Elkefafy SM, Berndtsson R, Elkiki M, El-kharbotly AA. Can Potato Crop on Sandy Soil Be Safely Irrigated with Heavy Metal Polluted Water? Water. 2022; 14(8):1226. https://doi.org/10.3390/w14081226
Chicago/Turabian StyleSelim, Tarek, Samah M. Elkefafy, Ronny Berndtsson, Mohamed Elkiki, and Ahmed A. El-kharbotly. 2022. "Can Potato Crop on Sandy Soil Be Safely Irrigated with Heavy Metal Polluted Water?" Water 14, no. 8: 1226. https://doi.org/10.3390/w14081226
Note that from the first issue of 2016, this journal uses article numbers instead of page numbers. See further details here.