
A Mobile Laboratory Enables Fecal Pollution Source Tracking in Catchments Using Onsite qPCR Assays


School of Engineering, Newcastle University, Newcastle upon Tyne NE1 7RU, UK
*
Author to whom correspondence should be addressed.
Water 2022, 14(8), 1224; https://doi.org/10.3390/w14081224
Submission received: 1 March 2022
/
Revised: 30 March 2022
/
Accepted: 7 April 2022
/
Published: 11 April 2022
(This article belongs to the Special Issue Field Methods for Water Quality Surveying)
Abstract
:Onsite molecular diagnostics can revolutionize fecal pollution source tracking. We aimed to validate a method for onsite qPCR assays with a miniature speaker-sized Q qPCR instrument and other portable equipment items. We showed that marker genes for total bacteria (16S) and E. coli (rodA) in 100 mL of river water measured with this method agreed within ±0.3 log10 units with results obtained when using conventional laboratory equipment items. We then deployed the portable method in a mobile laboratory (‘lab in a van’) and quantified HF183 marker genes for human host associated Bacteroides in river water within 3 h of sampling. We also used the mobile laboratory to investigate urban river water and effluents from two storm drains and a retention pond and collected comprehensive microbial and physicochemical water quality data. We found significantly higher HF183 gene levels in the older storm drain compared to the river water (6.03 ± 0.04 vs. 4.23 ± 0.03 log10 gene copies per 100 mL), and a principal component analysis revealed that storm drain effluent retention in a pond beneficially altered water characteristics, making them more like those of the receiving river. In conclusion, onsite qPCR assays can be performed with portable equipment items to quickly test water.
1. Introduction
As rapid progress is being made with molecular diagnostics in the global response to the COVID-19 pandemic, opinion pieces in the scientific literature [1] and mainstream media [2] are calling for near real-time monitoring of microbial hazards not only ”in the prison sick bay or the rural health center”, but also “on the farm, or at the town sewage works”. In line with these calls for onsite diagnostics, environmental scientists and engineers are adapting nucleic acid-based tests such as paper-based analytical devices [3], miniaturized loop-mediated isothermal amplification (LAMP) polymerase chain reaction (PCR) assays [4,5], and portable next generation sequencing (NGS) devices [6] to applications in sewage epidemiology [7], fecal pollution source tracking [8], environmental pathogen monitoring [9], and antimicrobial resistance surveying [10]. According to the WHO, there are globally nearly 1.7 billion cases of childhood diarrheal disease every year, the second leading cause of death in children under five years old, which mostly results from contaminated food and water sources [11]. Hence, it is vital to also deploy molecular diagnostic tools and scientific advances made during the COVID-19 pandemic in the fight against the ‘permanent pandemic’ of waterborne disease. This can be done by quickly testing water for indicators for fecal pollution [12], which may transmit pathogens such as Giardia lamblia, Cryptosporidium parvum, Entamoeba coli, rotavirus, norovirus, Campylobacter jejuni, Salmonella typhi, Shigella dysenteriae, Vibrio cholerae, or enterotoxigenic and enteroadherent Escherichia coli [13].
Environmental samples will typically contain much lower amounts of the targeted nucleic acids than clinical specimens, and the extraction of sufficient amounts of genomic material, the removal of interferents and inhibitors, and preventing the clogging of miniaturized devices are method development challenges for molecular diagnostics in environmental applications [9]. Such challenges are frequently side-stepped in proof-of-concept work for portable diagnostics by using cultured samples of high bacterial concentration [5] or genetic material already extracted and purified with conventional laboratory methods [4,14]. However, the main advantages of onsite diagnostics are near real-time availability of data for decision making and the avoidance of sample alterations during transport and storage [15]. To realize these advantages, the entire workflow from sampling to nucleic acid extraction and purification, followed by molecular analysis and data interpretation, must be performed onsite [16].
For conventional, culturing-based microbial water quality assessments, field deployable tools such as the Oxfam DelAgua® Water Testing Kit are commercially available [17]. For molecular diagnostics, we have recently developed and validated a suitcase laboratory for microbial community characterization by NGS of 16S rRNA gene amplicons with the memory-stick sized MinION sequencer of Oxford Nanopore Technologies [6,15]. This suitcase laboratory costed about £10,000 and included a powerful laptop computer and all the required equipment items for the concentration, extraction, purification, amplification, and sequencing of environmental DNA (eDNA) in water samples. With this suitcase laboratory, we have successfully demonstrated onsite characterization of microbial communities at a sewage treatment plant in the United Kingdom, and fecal pollution source tracking in low resource settings across Africa and South Asia [8,15,18,19,20]. NGS is an excellent tool for the fingerprinting of microbial communities to identify signatures of fecal pollution in water using SourceTracker [8,21] or alternative multivariate data analysis methods [18,19,20]. However, NGS based diagnostics have limitations when it comes to the identification of rare species in diverse communities, and when the absolute rather than relative abundance of environmental microorganisms is of interest [6]. In such instances, quantitative polymerase chain reaction (qPCR) is the method of choice to more specifically and sensitively target and quantify marker genes of special interest such as those identifying human-host associated Bacteroides [22] or enteric human pathogens [23].
Our study aim was to develop and demonstrate a methodology for onsite qPCR assays that can rapidly quantify fecal pollution marker genes in water samples using only portable equipment items. To this end, we (1) compared portable with conventional qPCR workflows in a well-controlled laboratory setting; (2) compared the DNeasy Power Water and SoilPro extraction kits for a stormwater sample with a high amount of total suspended solids; (3) quantified marker genes for human host associated Bacteroides onsite within hours of taking a river water sample; and (4) demonstrated the comprehensive onsite characterization of urban river, storm drain, and stormwater retention pond samples with microbiological and physicochemical methods using a mobile laboratory in the back of a van. These work packages tested the hypotheses that (i) the mean results of qPCR assays obtained with portable and conventional equipment items are comparable within the typical range of uncertainty for three sample replicates; (ii) the DNeasy Power Water Kit is an appropriate choice for DNA extraction, even for stormwater samples with high suspended solid content; (iii) qPCR assays can be performed onsite to generate quantitative microbial water quality information within hours; and (iv) onsite qPCR assays and physicochemical water quality tests can identify human sewage pollution sources in an urban catchment. This study is, to the best of our knowledge, the first field demonstration of onsite qPCR assays for the quantification of fecal pollution marker genes in environmental water at the sampling site.
2. Materials and Methods
2.1. Equipment
We purchased a portable, light-weight Q qPCR instrument (Quantabio, Beverly, MA, USA). This instrument is miniature speaker-sized and the most portable qPCR instrument currently on the market. This qPCR instrument can process up to 48 samples per run and was controlled via a laptop computer. For comparison and method validation, we used a conventional Bio-Rad CFX Connect Real-Time PCR Detection System (Bio-Rad Laboratories, Watford, UK). For the water filtration and DNA extraction from the filter membranes, we used a Rocker 400 oil free vacuum pump (Severn Sales, Shrewsbury, UK), Nalgene Reusable Filter Unit 250 × 250 mL (Scientific Laboratory Supplies, Nottingham, UK), Vortex (Thermo Fisher Scientific, Loughborough, UK) with an adaptor for six 5 mL tubes (Scientific Industries, Bohemia, NY, USA), High-Speed Mini-centrifuge (Thermo Fisher Scientific, Loughborough, UK), Qubit fluorometer for DNA quantification (Life Technologies, Paisley, UK), and other small equipment items as described in our previous publication [15]. For comparison and validation of the DNA extraction procedure, we used a conventional bench-top ribolyzer (FastPrep-24™ 5G bead beating grinder and lysis system, Thermo Fisher Scientific, Loughborough, UK). Specifications and costs of conventional and portable equipment items for cell lysis and qPCR are compared in Table 1.
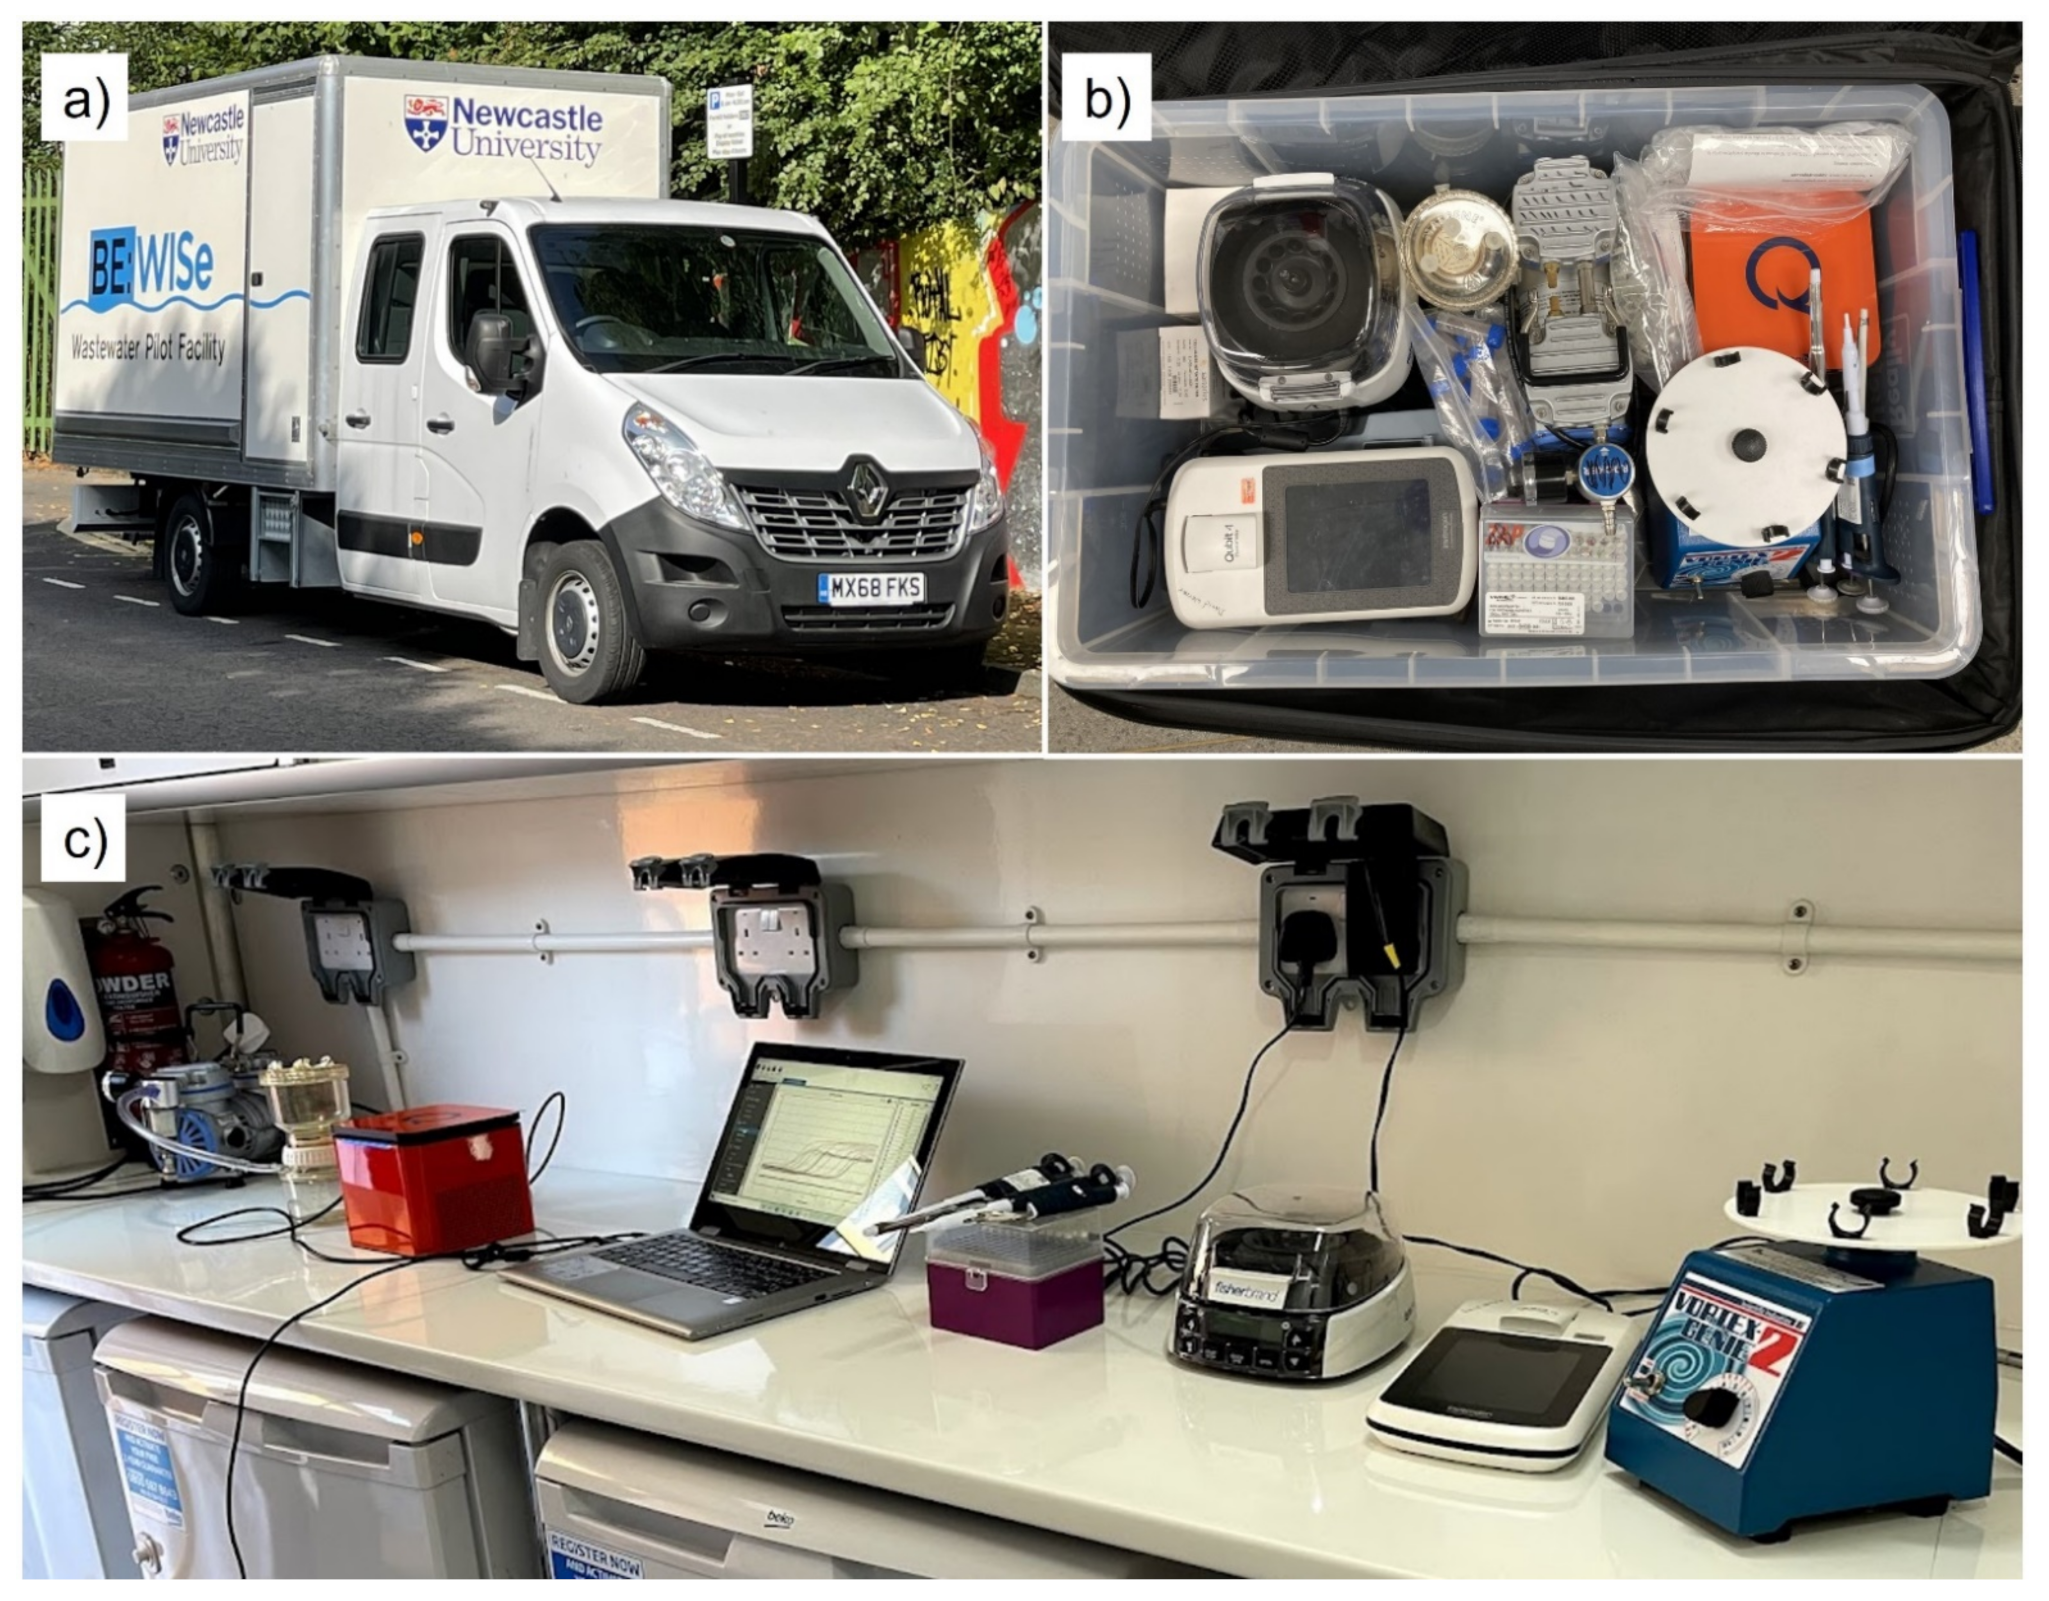
For the fieldwork, we rented a “van with a lab” from Newcastle University’s Bio Engineering: Wastewater Innovation at Scale facility BEWISe (https://www.ncl.ac.uk/be-wise/, accessed on 6 April 2022). This van contains a small laboratory in the back (Figure 1a), giving mobile access to power from rechargeable batteries, and shelter to set up the portable equipment (Figure 1b) on a bench (Figure 1c). We also generated conventional microbiology and water chemistry metadata with a DelAgua® Water Testing Kit (DelAgua, Marlborough, UK) and with cuvette tests on a portable spectrophotometer DR1900 (Hach, Manchester, UK). An ExStik handheld probe (Extech Instruments, Nashua, NH, USA), HQ40D Digital two channel multi meter (HACH, Manchester, UK), and 2100Q portable turbidity meter (HACH, Manchester, UK) were used to measure water temperature, pH, conductivity, dissolved oxygen, and turbidity during sampling. A Model AL-DT portable alkalinity test kit (HACH, Manchester, UK) was used to measure alkalinity by titration.
2.2. Comparison of Portable and Conventional qPCR Workflows
For the portable method validation, we used river water from the Ouseburn, an urban river in Newcastle upon Tyne in northeast England. Several liters of river water with 2.6 ± 0.1 NTU turbidity were collected in a sterile 5 L PE bottle from the Environment Agency gauging station at Crag Hall (55.025255N, −1.634742E), and 9 × 300 mL aliquots of the well-mixed river water were filtered through 0.22 µm Gridded Sterile Cellulose Nitrate Membrane Filters (Sartorius, Göttingen, Germany) and stored at −20 °C. We then compared three different DNA extraction procedures: (i) using a vortex with lysis tubes from the DNeasy PowerWater Kit following the manufacturer’s protocols (Qiagen, Crawley, UK); (ii) using the same protocol with the vortex, but with the addition of 40 µL of 50 mg/mL lysozyme (Merck, Gillingham, UK) to the lysis tubes followed by incubation at 37 °C for one hour; and (iii) using our standard laboratory procedure with the ribolyzer and Lysing Matrix E tubes (MpBiomedicals, Irvine, CA, USA), instead of those provided with the extraction kits, so that the tubes would fit into the ribolyzer slots. Each procedure was conducted in triplicate using one of the nine filters. Extracted DNA was quantified with the Qubit ds DNA HS Assay Kit (Life Technologies, Paisley, UK) on a Qubit fluorometer (Life Technologies, Paisley, UK). Following DNA quantification, all the DNA samples were diluted with nuclease free water (Thermo Fisher Scientific, Loughborough, UK) to 5 ng/µL to avoid inhibitor effects in the qPCR assays. We then quantified 16S rRNA and rodA marker genes for each extract in duplicates using both the conventional and portable qPCR instrument. The 16S rRNA and rodA qPCR assays were chosen for this work because the portable and conventional qPCR instruments both had channels for the detection of the SYBR® Green and FAM dye used in these assays. The 16S rRNA assay, originally developed for Denaturing Gradient Gel Electrophoresis (DGGE) [24], is nowadays a widely utilized qPCR primer set for the 16S rRNA gene found in all bacteria and archaea, which informs phylogenetics. The rodA assay targets E. coli, a commonly used fecal pollution indicator bacterium, and uses a probe to increase the specificity of the assay [25]. Details of the primers and probes and temperature programs used in these assays are shown in Table 2.
For the 16S rRNA gene qPCR assay, the reaction mixtures were prepared as follows: 2 µL of the DNA samples, 7.5 µL of SsoAdvanced™ Universal Inhibitor-Tolerant SYBR® Green Supermix, 4 µL of nuclease free water (Thermo Fisher Scientific, Loughborough, UK), and 0.75 µL of each forward and reverse primer solutions (@ 10 micromol·L−1) were combined for a 15 µL final volume with 500 (nmol·L−1) of each primer. For the rodA probe-based reactions, we used 2 µL of DNA samples, 5 µL of PerfeCTa® qPCR ToughMix® (Quantabio, Beverly, MA, USA), 1.75 µL of nuclease free water (Thermo Fisher Scientific, Loughborough, UK), 0.25 µL of the probe solution (@ 10 micromol·L−1), and 0.5 µL of each forward and reverse primer solutions (@ 10 micromol·L−1) for 10 µL of final volume with 500 (nmol·L−1) of each primer and 250 (nmol·L−1) of the probe. All the standards, samples, and no template control reactions were conducted in duplicate. Standard curves were created by 10-fold dilutions of a known target gene concentration from 107 to 10 genes/µL, as described in our previous work [6].
2.3. Comparison of Soil and Water DNA Extraction Kits
Since stormwater may contain a high amount of suspended sediment, we were interested to see whether a soil DNA Extraction Kit (DNeasy PowerSoil Pro Kit, Qiagen, Crawley, UK) would perform better than a water kit (DNeasy PowerWater Kit, Qiagen, Crawley, UK) when analyzing such samples. For this experiment, we used a stormwater sample containing a high amount of suspended solids (TSS = 748 ± 248 mg/L), which we collected on paved surfaces on the Newcastle University campus into a sterile 1 L polyethylene (PE) bottle. This TSS content is equivalent to about 402 NTU turbidity [27]. We filtered 4 × 40–50 mL of stormwater through 0.22 µm filter membranes for DNA extraction, as explained above. Due to the high solid content, these were the maximum volumes we could readily filter. In these experiments, we used the portable qPCR instrument for the gene quantification.
2.4. Proof-of-Concept: Onsite Quantification of Human Sewage Marker Genes in River Water
We first trialed the portable qPCR methodology onsite on 15 September 2021. The analysis was conducted at the outlet of the river Ouseburn catchment, Newcastle upon Tyne, in northeast England, where the Ouseburn reaches the Tyne estuary at Foundry Ln (54.975582N, −1.590909E). Weather conditions were dry with baseflow in the river, and turbidity was 2.5 ± 0.2 NTU. We parked the van with the mobile laboratory opposite Ouseburn farm (Figure 1a) and collected 1 L of river water into an autoclaved PE bottle. In the van, we filtered 2 × 350 mL of the well-mixed river water and extracted DNA from each filter separately using the vortex method without the enzyme, and the DNeasy PowerWater Kit in accordance with the standard manufacturer protocol. We then processed this DNA for onsite qPCR using the portable equipment items illustrated in Figure 1c. For this trial, we used a probe-based qPCR assay to specifically target human host associated Bacteroides bacteria, instead of the rodA assay, which targets E. coli bacteria also found in warm-blooded animal hosts such as cattle and dogs. In the fieldwork, we were specifically interested in evidence for human sewage pollution of the Ouseburn River. This HF183 assay (details in Table 1) has been used successfully in many microbial source tracking studies [22]. We have previously used this assay to analyze eDNA preserved from our fieldwork in Africa and have demonstrated a strong association of Vibrio cholerae hazards in an Ethiopian catchment with this human sewage marker gene [20]. The entire workflow from sampling to the data analysis was completed onsite by two skilled workers within 3 h.
2.5. Fecal Pollution Source Tracking with a Mobile Laboratory
Finally, a more comprehensive field demonstration of the portable qPCR method in combination with onsite physicochemical water quality testing was conducted on 6 October 2021, further upstream in the catchment of the Ouseburn River, near recently established stormwater retention ponds at Great Park (55.025255N, −1.634742E). Weather conditions were dry following a day of intensive rainfall that had filled the ponds to their capacity. Water samples were taken from the Ouseburn River just upstream of two major storm drains (RiverUp @ 55.024800N, −1.652820E); the Kingston Park storm drain, which is a drainage system from residential development in 1978 that discharges directly into the Ouseburn River (KPStDrain @ 55.024714N, −1.652305E); the Great Park storm drain (GPStDrain @ 55.025304N, −1.649730E), which originates in a residential area developed since 2004 and discharges into a stormwater retention pond; and from an outlet of this retention pond into the Ouseburn River (PondEff at 55.024542N, −1.650996E). The sampled storm drains were, in theory, separated from the local sanitary sewer system and designed to drain excess urban surface run-off and groundwater but may have been impacted by some misconnections. Indications for sewage discharge into the river such as sanitary plastic waste became notable in the low hanging branches and roots of the Ouseburn embankment after the older drain KPStD (Figure A1 in Appendix A). There was low-level discharge from both storm drains and the pond at the times of sampling. Water samples were collected with a pole-mounted stainless-steel vessel that was repeatedly rinsed with the local water before taking composite samples into sterile PE bottles (2 × 1 L) over a period of 5–10 min, by sampling each location repeatedly. Additional composite samples were collected in 250 mL PE bottles for the chemical analysis. Handheld probes were used to immediately measure water temperature, pH, conductivity, dissolved oxygen, and turbidity. All sample bottles were stored in a cooling box and returned to the mobile laboratory. In the van, we filtered the water samples and extracted the DNA from the filters using the vortex method (without the enzyme) and the DNeasy PowerWater Kit, and then processed this DNA for onsite quantification of marker genes. For this fieldwork, we used the 16S qPCR assay for total bacteria and the HF183 assay targeting human host associated Bacteroides in combination with chemical markers, as recommended in a review of methods for identification, evaluation, and characterization of fecal contamination in receiving urban surface waters [12]. The DNA from two filter extractions was pooled to address low DNA content in the pond effluent extracts, which then enabled DNA quantification. We used the pooled extraction without dilution for qPCR assays run in triplicate.
For conventional membrane filtration plate counts, we filtered 0.5 mL of each water sample, diluted with 10 mL sterile saline solution, through 0.45 μm Gridded Sterile Cellulose Nitrate Membrane Filters (Sartorius, Göttingen, Germany). We placed the membranes onto sterile 47 mm pads (Pall Corporation, Ann Arbor, NH, USA) soaked with sterile m-FC broth from 2 mL ampules (Hach, Manchester, UK) and placed inside autoclaved stainless steel Petri dishes (DelAgua, Marlborough, UK). The Petri dishes were incubated at 44 °C in the portable DelAgua® Water Testing Kit. The next day, after 21 h incubation, the colonies on the membranes were counted and multiplied with a factor of 200 to give the fecal coliform (FC) count per 100 mL.
2.6. Statistical Methods
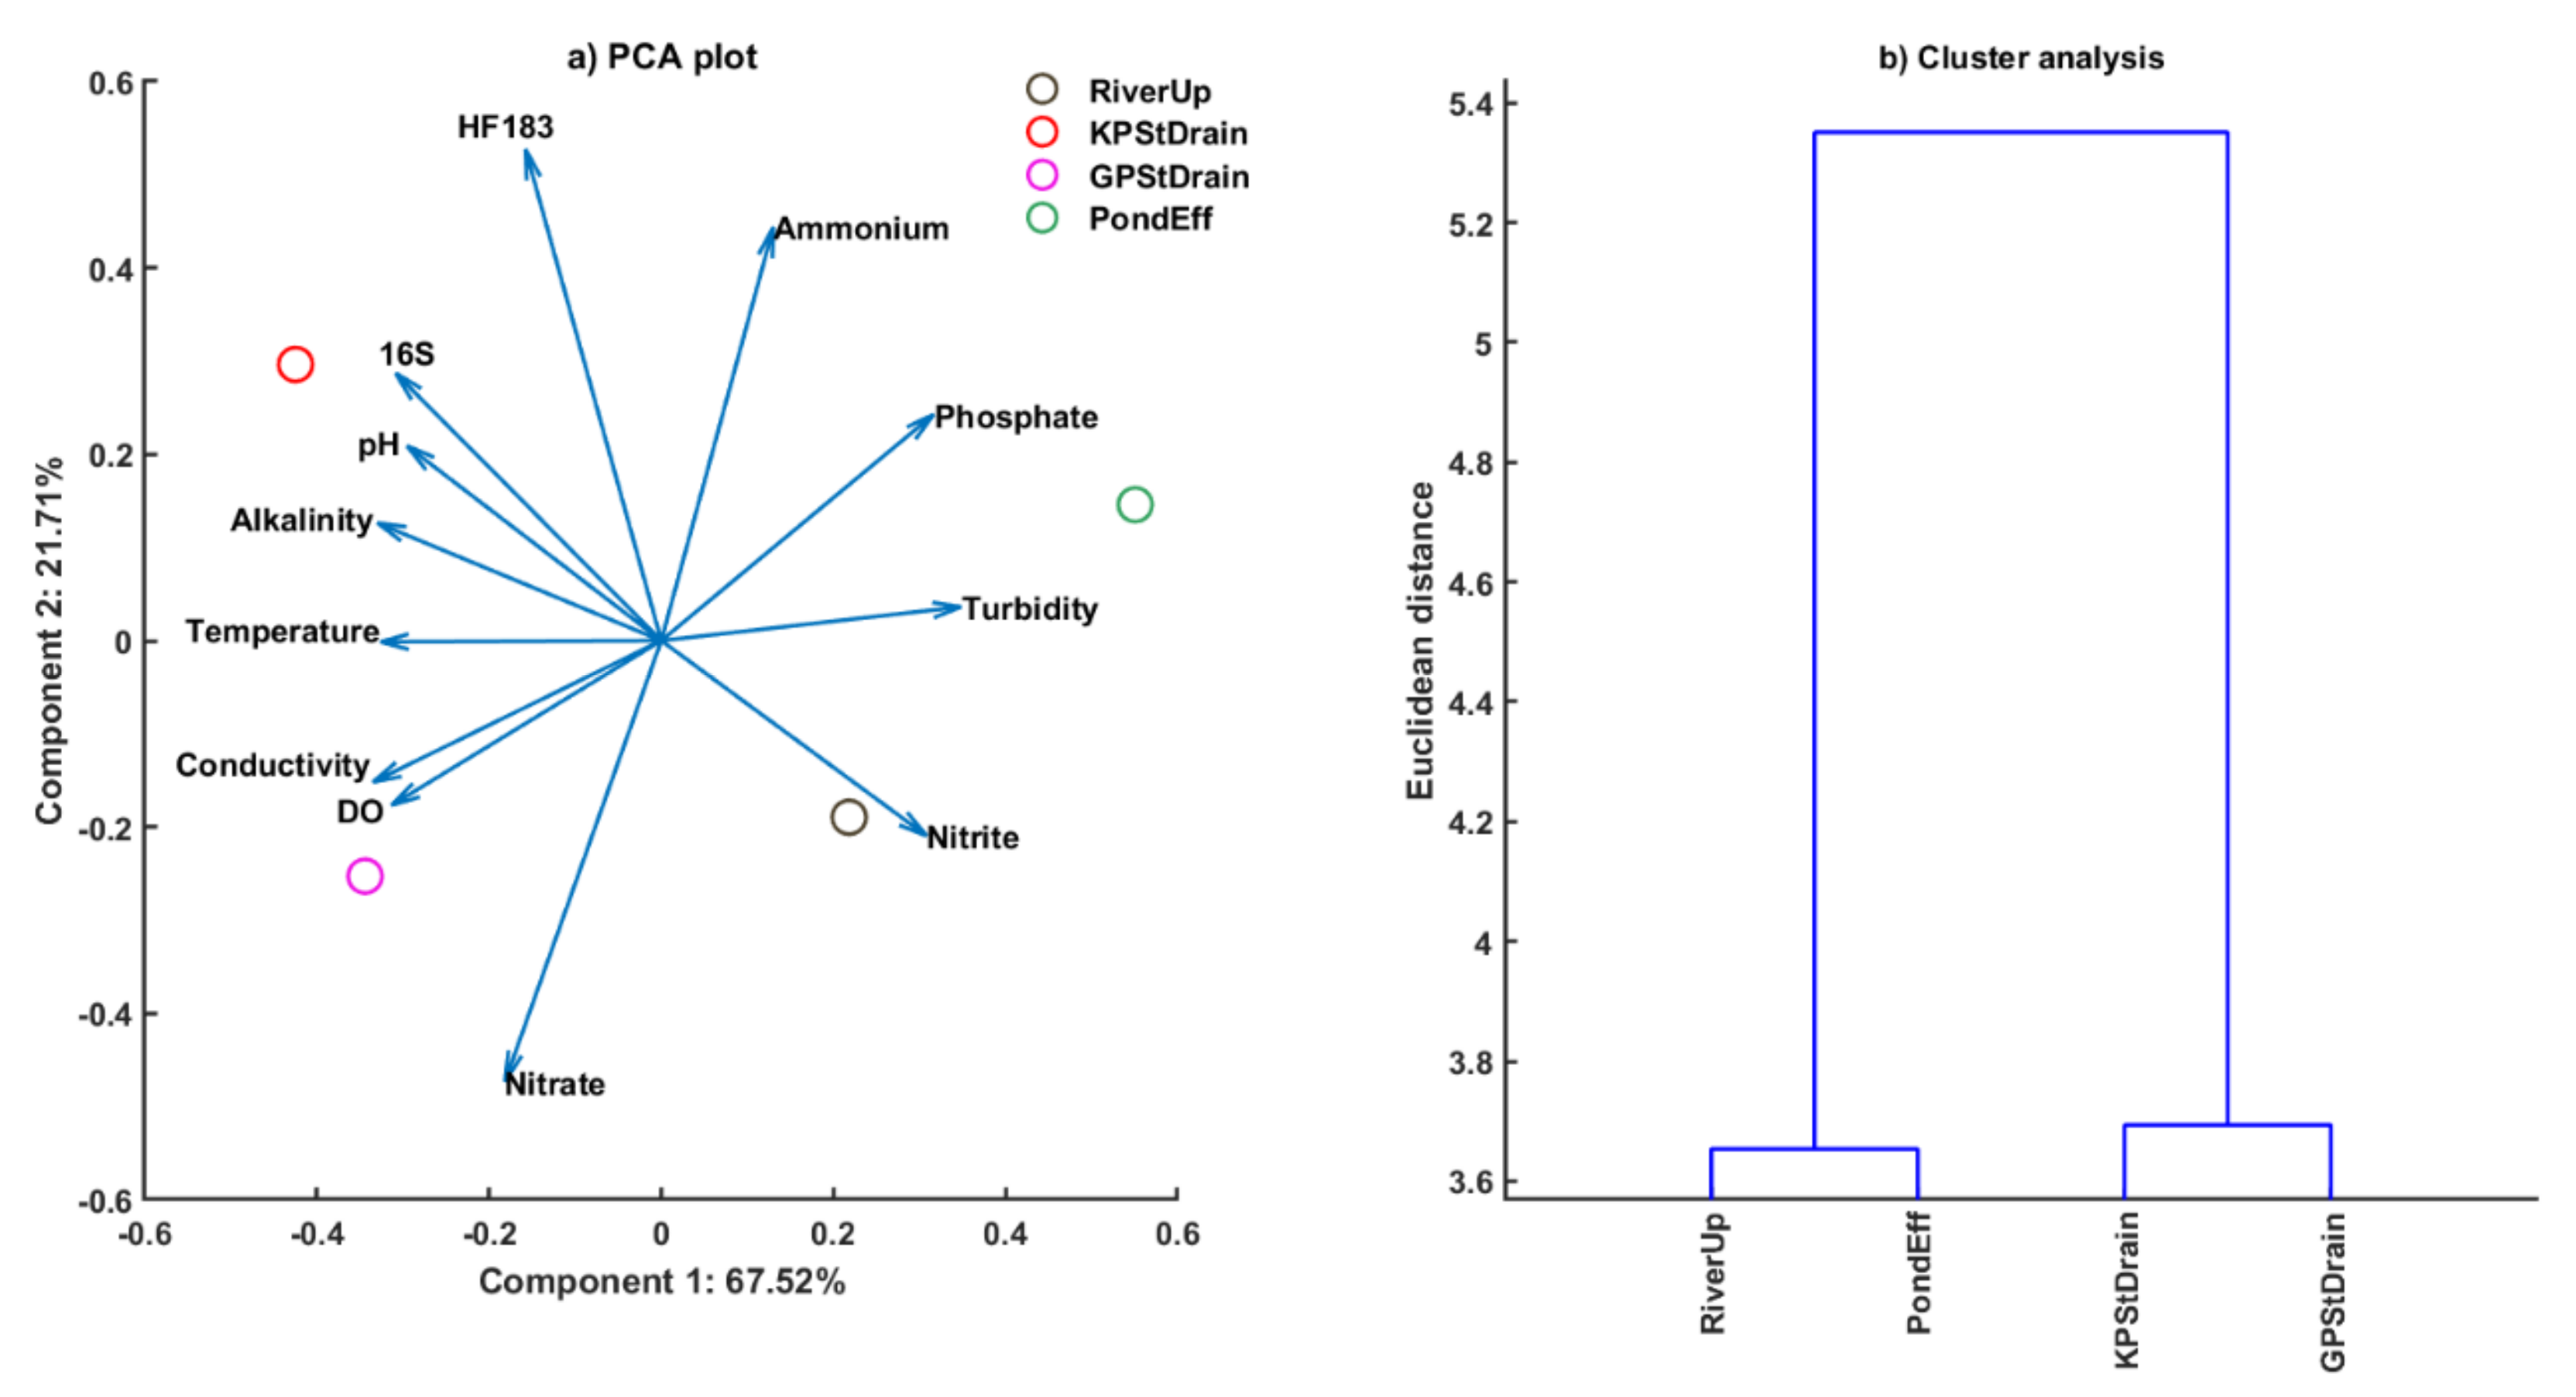
For the statistical analysis, we used MATLAB© (Version R2019a, Mathworks, Portola Valley, CA, USA). We used MATLAB© function ttest2 for the comparison of the measurement means between the two DNA extraction kits with the two-sample t-test. We used MATLAB© function anovan for one-way or two-way crossed analysis of variance (ANOVA) to test the effects of factors such as DNA extraction procedures and qPCR instrument on the measurement means across more than two sample groupings. This was then followed by pairwise comparison of means using MATLAB© function multicompare, which applies Tukey’s honest significant difference criterion. We also wrote a MATLAB© script to quickly visualize the zscore transformed, multivariate data obtained onsite with a biplot based on principal component analysis (PCA) using the MATLAB© function pca, and a hierarchical binary cluster tree with the MATLAB© functions linkage and dendrogram.
3. Results
3.1. Comparing Portable with Conventional Workflows for the DNA Extraction and Marker Gene Quantification by qPCR
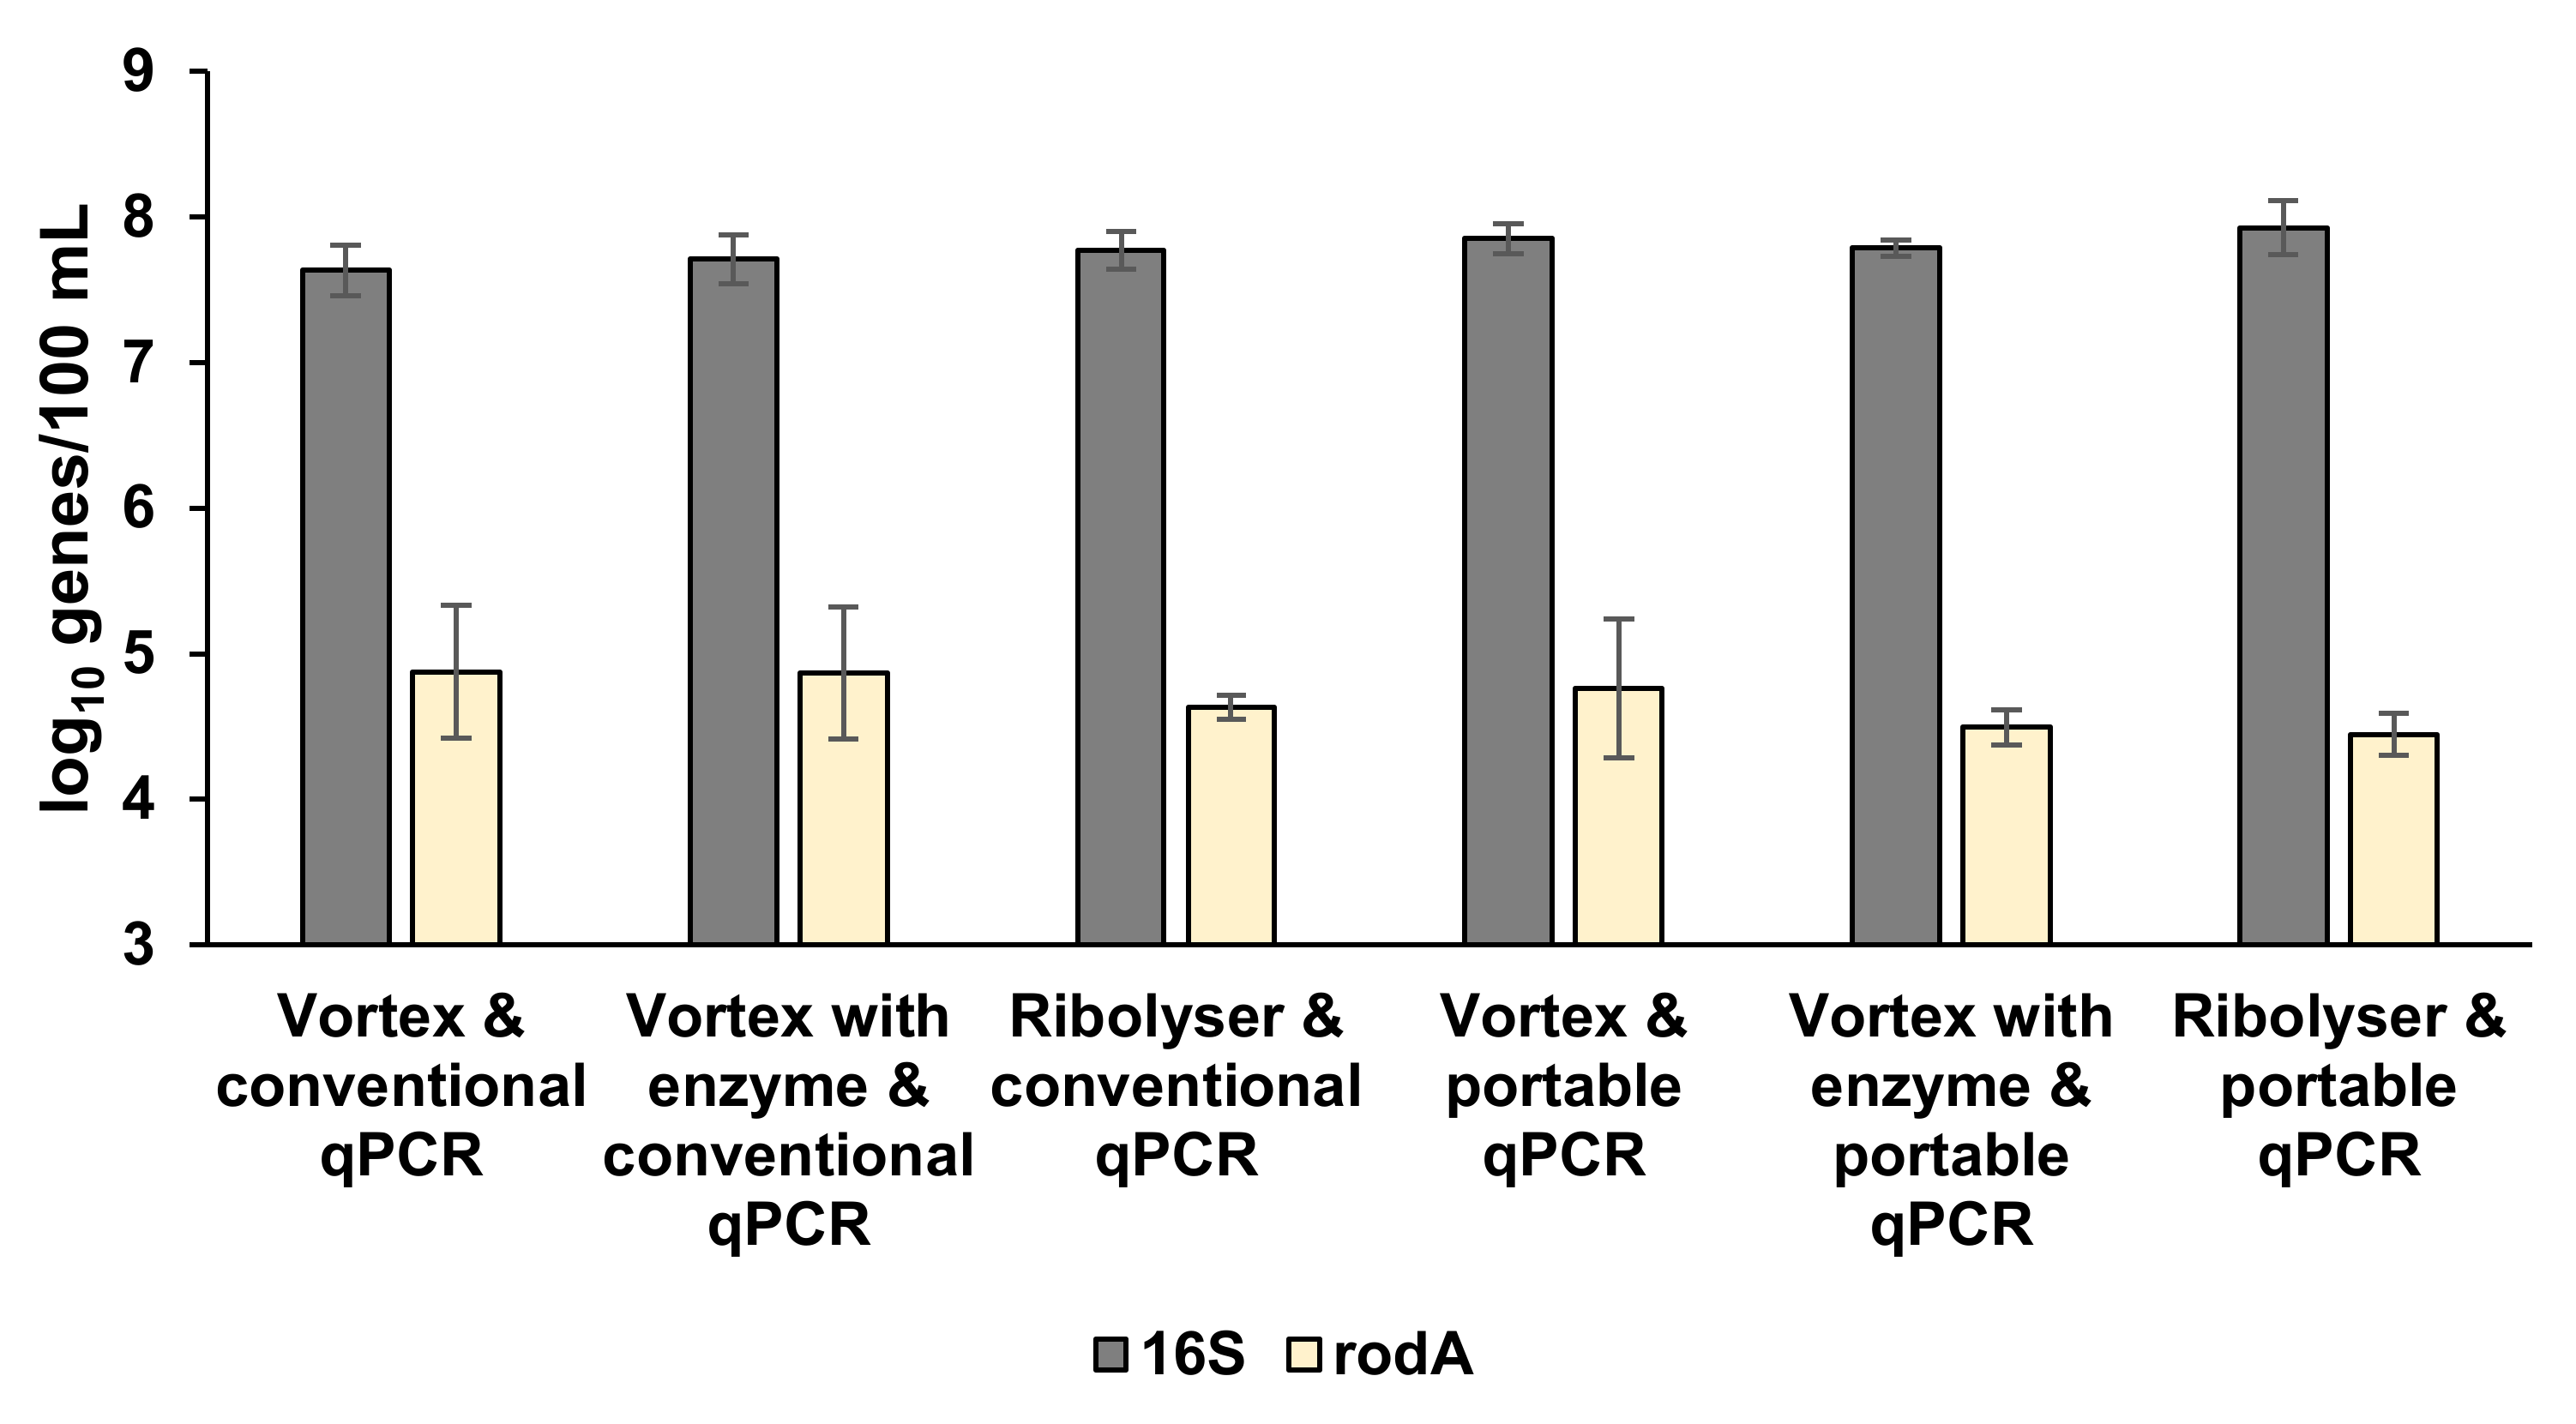
Figure 2 illustrates how the choice of portable versus conventional DNA extraction and PCR equipment applied to the analysis of river water affected the measurements of the 16S rRNA and rodA gene copies. In this comparison, the vortex and portable qPCR instrument were considered field-deployable due to their smaller size, lesser weight, and lower costs when compared with a benchtop ribolyzer and conventional qPCR instrument. Overall, there was 87% reduction in weight and 53% reduction in costs for the two equipment items (Table 1). We also tested whether the use of lysozyme to assist the cell lysis would be a worthwhile addition to the vortex protocol. More detailed results and statistical test outcomes for this method comparison are summarized in Appendix A in Table A1.
Overall, there was no significant effect of the choice of the DNA extraction method on the mean DNA yield, 16S rRNA, and rodA gene copy numbers, while the choice of the qPCR instrument had a significant overall effect in the case of the 16S rRNA gene copy number (two-way crossed ANOVA, p = 0.042). However, despite the significant difference, the mean 16S rRNA gene copy numbers quantified with the portable qPCR instrument differed by no more than 0.22 log10 units (they were higher) from those obtained with the conventional qPCR instrument. In the post hoc analysis with pairwise comparison of the six DNA extraction and qPCR quantification protocols, there were no significant differences between the protocols for any of the three metrics. There were also no significant interactions between the choice of the DNA extraction method and qPCR instrument for both qPCR assays. We concluded that the use of the vortex and portable qPCR instrument without the addition of lysozyme is the most appropriate methodology for qPCR work in the field, since it only uses portable equipment items and avoids the 1 h enzyme incubation period, while the results were well aligned with the other protocols. The mean 16S rRNA and rodA gene copy numbers measured with this protocol agreed within ±0.3 log10 units (or a factor 2) with the results from five alternative protocols. The calibration curve metrics obtained with the portable and conventional PCR instrument (Table A2 in Appendix A) both met the qPCR quality requirements [28].
3.2. DNA Extraction Kit Comparison
Table 3 summarizes how the choice of the DNeasy PowerWaterTM versus DNeasy PowerSoilProTM extraction kits affected the DNA yields, 16S rRNA, and rodA gene copies measured in stormwater with a very high suspended solid content. Overall, there were no significant differences between the mean values of the three types of measurements for the two DNA extraction kits (ttest, all p > 0.05). We concluded that the DNeasy PowerWaterTM is an appropriate choice for our portable method, since there was no evidence for the superior performance of the DNeasy PowerSoilProTM Kit, even for a sample with a very high total suspended solid content of 748 ± 248 mg/L. We were also encouraged to see that high DNA yields were obtained when filtering relatively small volumes of this water (40–50 mL) with a high content of suspended solids, which would have clogged the 0.2 μm membranes for larger filtration volumes.
3.3. Pilot Trial at the Catchment Outlet
On September 15th, we successfully used our portable qPCR method in a “lab in a van” (Figure 1a) to quantify HF183 marker genes for human host associated Bacteroides at the Ouseburn catchment outlet within 3 h of taking river water samples. The results of 4.25 ± 0.02 log10 HF183 gene copies per 100 mL were repeatable within 0.12 log10 units for both filtration and qPCR replicates (Table A3 in Appendix A).
3.4. Fieldwork to Investigate the Impact of Storm Drains on River Water Quality
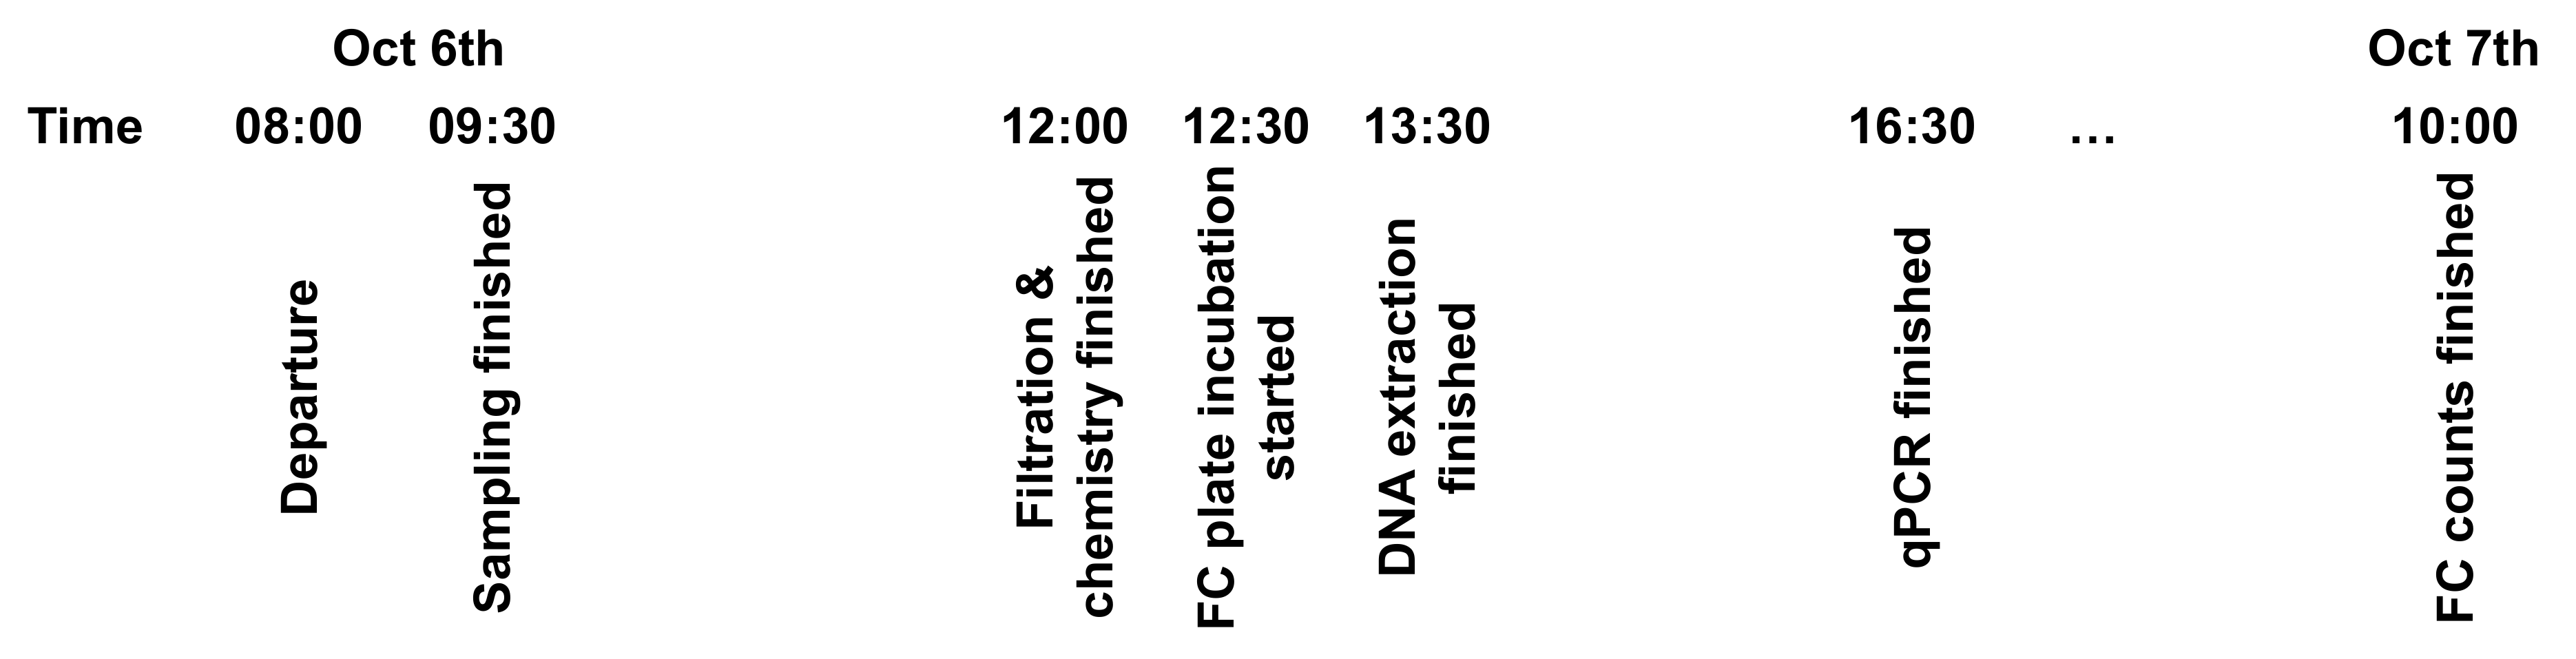
Figure 3 shows the timeline of when different tasks were completed during our more comprehensive fieldwork to investigate storm drains and their impact on river water quality with the ‘lab in a van’. We left the university around 8:00 am and drove to the site at Kingston Park in half an hour. The sampling of four locations was completed within 1 hour and included the immediate measurement of water temperature, conductivity, pH, dissolved oxygen, and turbidity with portable probes. The water chemistry cuvette tests (ammonium, nitrate, nitrite, phosphate, fluoride) and alkalinity measurements were completed within 2.5 h, which was also the time required for filtering between 150 and 400 mL of water from the four locations in duplicate. The DNA extraction and cleanup took 1.5 h and was completed by 1:30 pm. In the afternoon, each of two subsequent qPCR runs for 16S rRNA and HF183 gene quantifications took one hour to complete. The onsite qPCR results and physicochemical metadata were all available for interpretation by 4:30 pm, or within 8 h from arrival at the site. Membranes for the plate counts were incubated onsite in the DelAgua® Field Kit at 12:30 pm, but because of the required incubation period, the colony counts only became available the next day at 10:00 am.
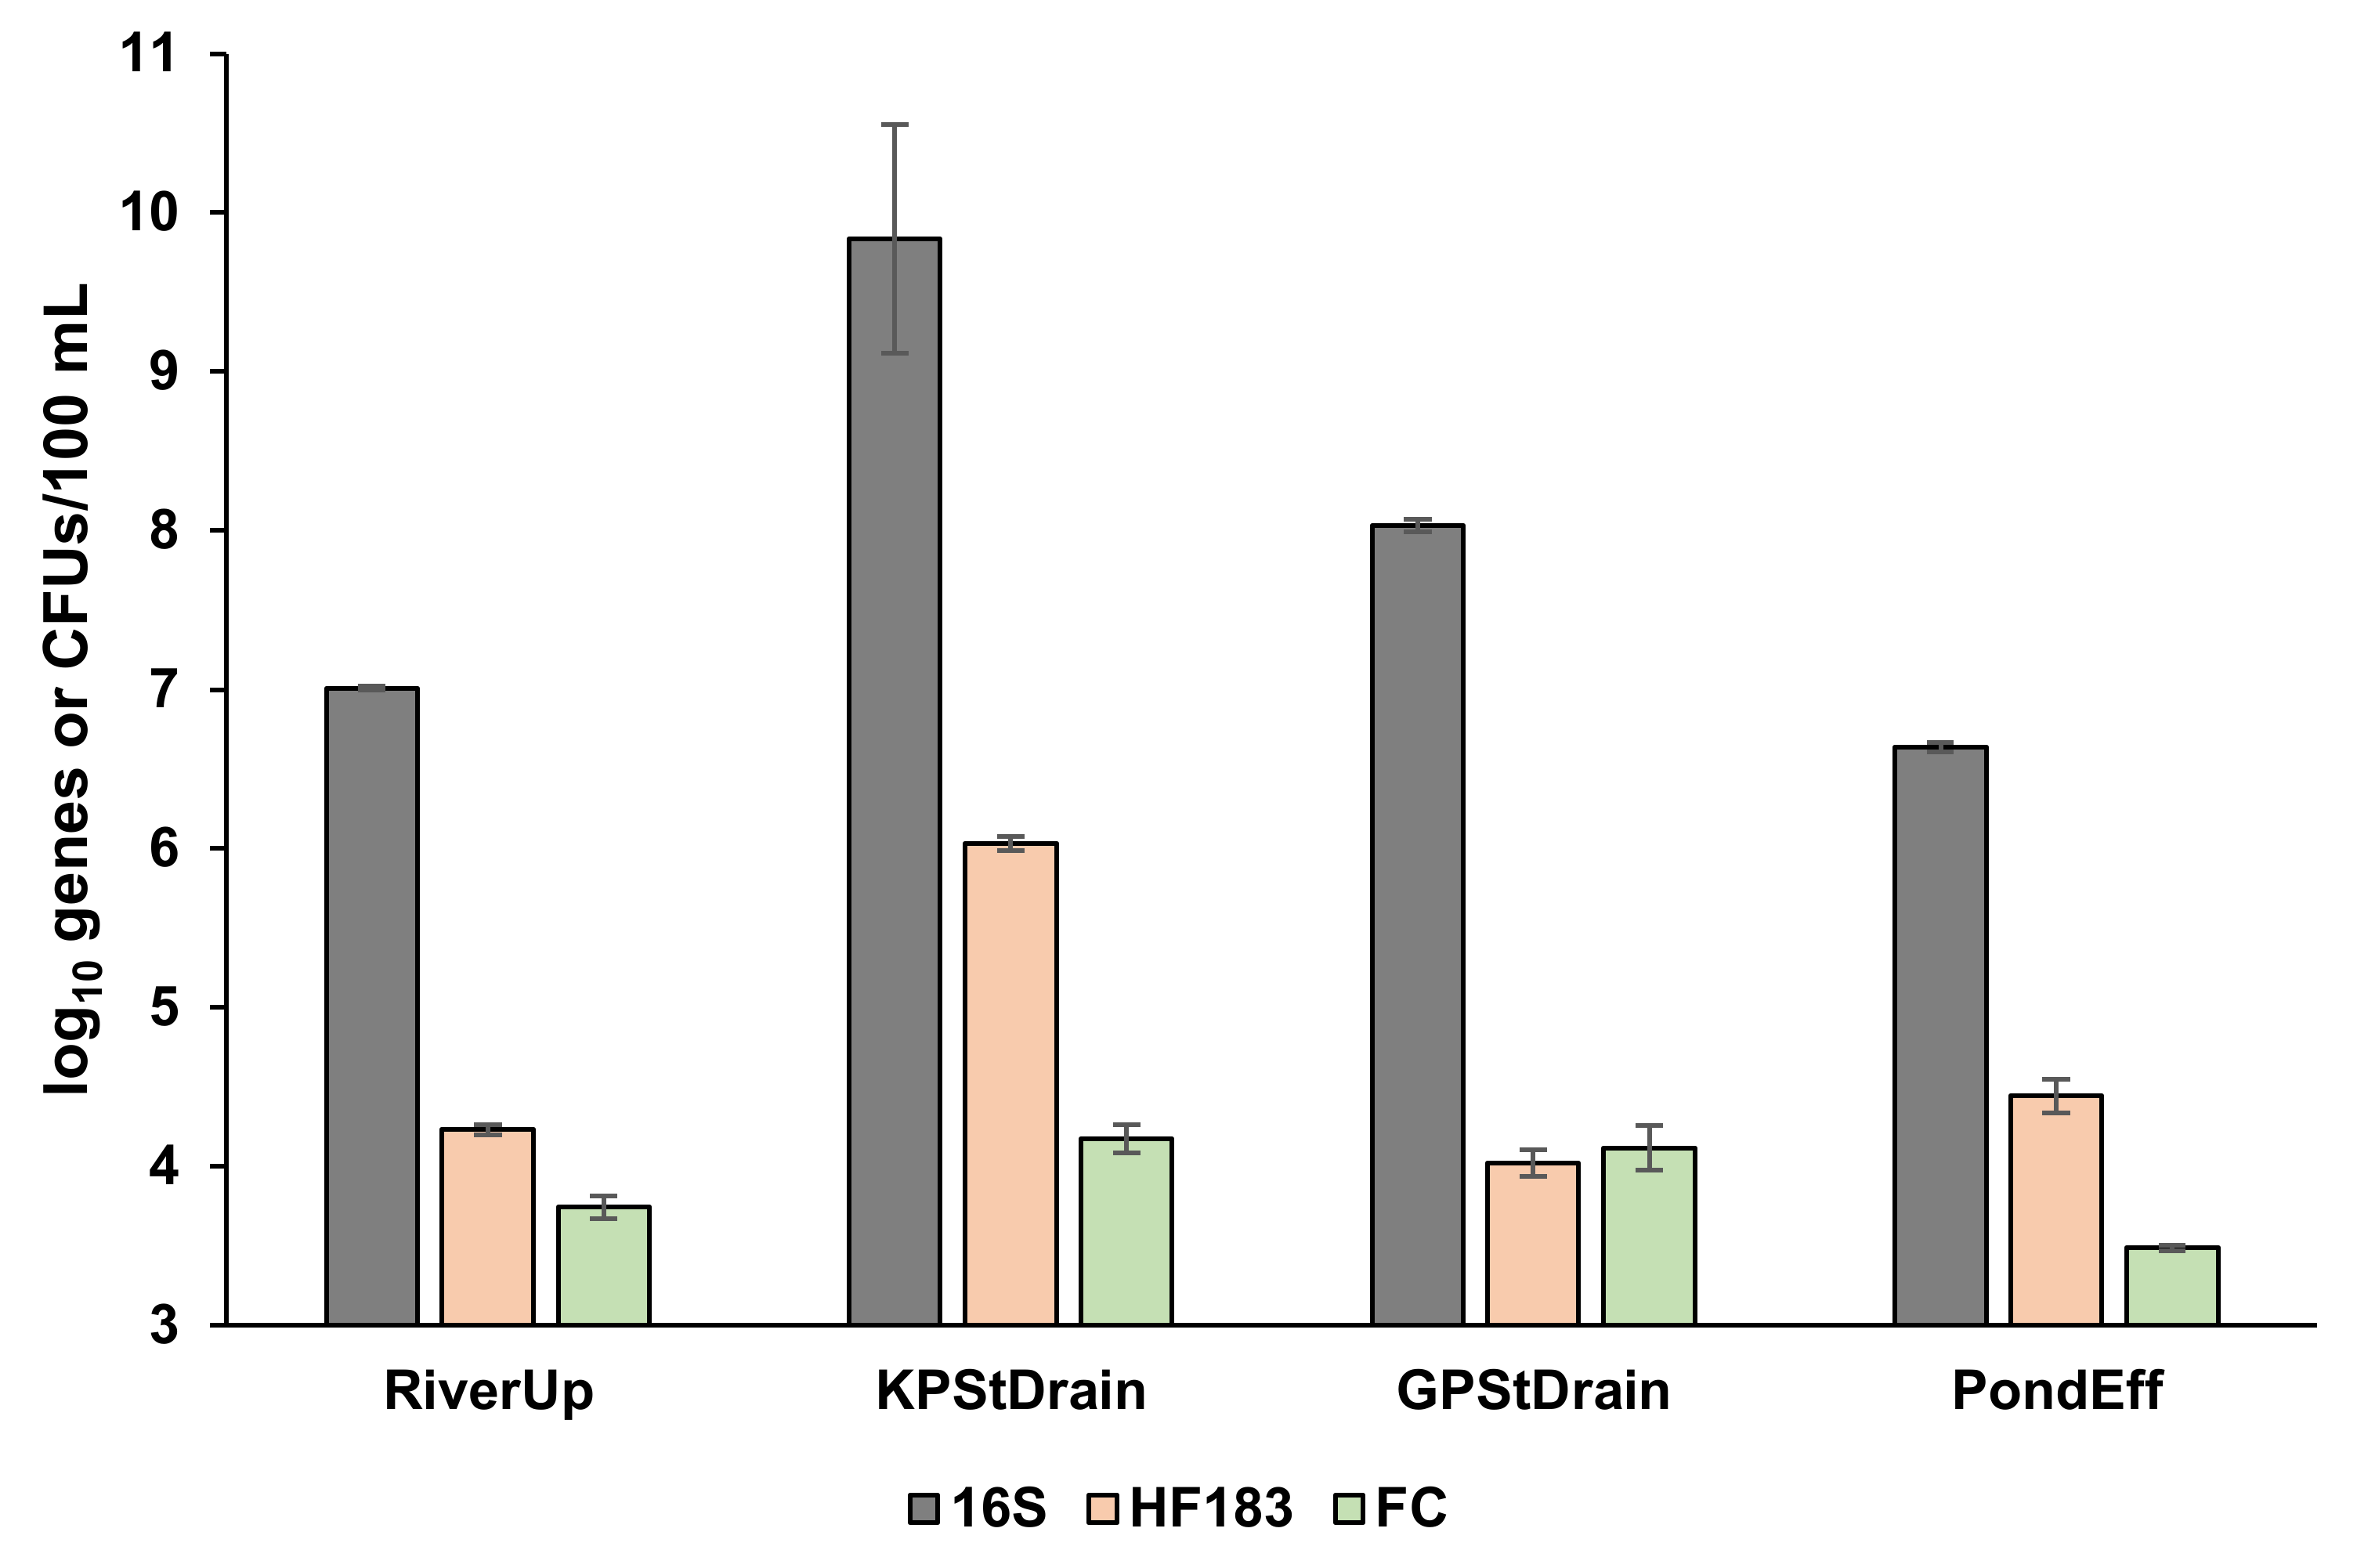
Figure 4 illustrates how 16S rRNA marker genes for total bacteria, HF183 marker genes for human-host associated Bacteroides, and fecal coliform counts varied between sampling sites. There was a significant overall effect of sampling locations on the mean value of the three microbiological metrics (one-way ANOVA, all p < 0.001), and in the post hoc analysis, there were significant differences in all pairwise comparisons of sampling locations, except for the 16S rRNA gene copies in the river upstream versus stormwater retention pond effluent (p = 0.61), and for FC counts in the two storm drains (p = 0.86). More statistical details are provided in Table A4 in Appendix A. The two storm drain effluents had higher numbers of total and FC bacteria than the river upstream of these two storm drains, while the storm water retention pond effluent had the lowest number of total and FC bacteria. The older storm drain from Kingston Park had the highest concentration of marker gene HF183 for human-host associated Bacteroides, and was thus identified as a source augmenting these bacteria in the Ouseburn River.
Table 4 summarizes the physicochemical water quality data measured on site. Storm drain effluent was characterized by higher temperature, higher alkalinity, and lower turbidity than the river upstream and pond effluent samples. Nutrient concentrations varied between the samples, and the highest ammonium concentration was measured in the Kingston Park storm drain, while the highest phosphate concentration was measured in the retention pond effluent.
Figure 5 visualizes the mean values or stabilized readings of the multivariate data that we had generated onsite by the end of the fieldwork day (i.e., excluding the FC plate count data) in a PCA biplot and hierarchical binary cluster tree. In the PCA biplot (Figure 5a), principal component 1 (PC1) accounted for 67.52% of the total sample variance and clearly separated the two storm drain samples from the river upstream and retention pond samples. In agreement with this, the cluster analysis (Figure 5b) also revealed greater similarity between the two storm drains versus the river and pond water samples. Principal component 2 (PC2) in the PCA biplot (Figure 5a) accounted for 21.71% of the total sample variation and was characterized by positive loadings of marker gene HF183 and ammonium, and negative loadings of nitrate, nitrite, and dissolved oxygen. PC2 was thus strongly shaped by the impact of sewage pollution indicators (HF183 and ammonium) versus indicators for more oxygenated conditions (i.e., higher dissolved oxygen concentration), which enable nitrification (formation of nitrate and nitrite from ammonium and organic nitrogen). PC2 separated the older storm drain sample (KPStDrain) in a positive sign direction from the more modern storm drain sample (GPStDrain), indicating a stronger sewage signature in the older drain.
4. Discussion
4.1. Validation of a Portable qPCR Method
We successfully validated our workflow for qPCR assays with portable equipment items by showing that the 16S rRNA and rodA marker gene results for river water samples obtained with the method agreed with those obtained when using our conventional laboratory equipment within the range of uncertainty for three filtration replicates. In previous studies, we showed that 2–3 filtration replicates per site are sufficient to establish statistically significant differences between river sites and seasons, since spatiotemporal variation in metrics such as 16S, rodA, and HF183 genes per 100 mL can be up to 6 log10 units across catchments [20]. In comparison, the ±0.3 log10 unit variation between the final and alternative protocols in our study were very small indeed. Filtration of environmental water through 0.2 µm membranes took ~30 min and was the most time-consuming sample preparation step (Figure 3). Numerous filtration replicates per sampling location would therefore be unrealistic in fieldwork, since the filtration should be carried out on the day of sampling to avoid sample alteration. From our fieldwork experience, 2–3 replicates are sufficient to establish significant differences between sampling locations [18,19,20]. Here, we show that the differences between qPCR results obtained with portable and conventional cell lysis and qPCR instruments fell within the range of measurement uncertainty when analyzing three filtration replicates. The addition of an enzymatic cell lysis step did not notably affect the results obtained. In principle, incubation of the enzyme could be conducted onsite by placing the amended lysis tubes inside the DelAgua® Field Kit after adjusting the temperature of its incubator to 37 °C. But an incubation step would add one hour to the sample processing time and work against our objective of rapidly generating results onsite.
4.2. Method Suitability for the Analysis of Stormwater with High Total Suspended Solids Content
Previous studies of portable qPCR protocols have emphasized miniaturized devices for sample preparation [29] or marker gene quantification [5]. However, samples with a high amount of suspended solids may clog microfluidic channels in miniaturized devices [9], while the settling out of suspended solids from the water as pretreatment [29] causes sample alteration. Our onsite qPCR protocol with readily portable, but not fully miniaturized, equipment items enabled eDNA extraction and marker gene quantification from between 40 to 400 mL of unaltered environmental water samples. We successfully filtered stormwater with a high content of 748 ± 248 mg/L total suspended solids, which is at the upper limit of what is typically observed in surface water [27]. We found no advantage in using the DNeasy PowerSoilProTM Kit instead of the DNeasy PowerWaterTM for the analysis of this sample.
4.3. Method Suitability for Rapid onsite Water Testing
The UNICEF Office of Innovation has recently announced a rapid water quality testing challenge that calls for the detection of fecal indicator bacteria in water samples in under six hours [30]. Although formulated with drinking water testing in mind, the metrics of the UNICEF challenge provide interesting points of reference for our onsite qPCR assays. Our portable qPCR protocol can easily meet the six hour challenge, as the analysis of a river water sample for the fecal pollution marker gene HF183 with duplicate filtration and triplicate qPCR assays were completed in the pilot test within 3 h. How many water samples can be processed within a given time interval will depend on the number of workers and equipment items as well as the sample replication and metadata collection requirements. The water filtration step of ~30 min can be a time-consuming bottleneck that could be accelerated with the use of multiple vacuum pumps and filtration units. At Kingston Park, we processed four environmental samples and a blank in a working day, which meets the UNICEF challenge requirement of 5–6 samples in a working day. However, consumable costs per qPCR assay were about £5, and total equipment costs were about £15,000, which gives a price tag of ~£20 per assay to test 1000 samples, versus a UNICEF challenge requirement of $1–6 per test. We also used a mobile lab with rechargeable batteries instead of the portable power requirement specified in the UNICEF challenge. Access to power and sheltered bench space is a requirement for our method, but this could also be provided from battery packs or in a building close to the site of the fieldwork.
4.4. Method Suitability for Fecal Pollution Source Tracking
The qPCR data and physicochemical water quality data we collected onsite provided useful and plausible information for fecal pollution source tracking. It revealed, for example, that the storm drain effluent from Kingston Park had significantly higher concentrations of marker genes for total bacteria and human host associated Bacteroides than the receiving Ouseburn River sampled just upstream of this discharge. The same trend was observed, albeit only 17.5 h later, for the fecal coliform plate count results. The findings aligned with those of an MSc dissertation project at Newcastle University, which previously identified the Kingston Park storm drain as a likely source of fecal coliform and chemical oxygen demand (COD) pollution of the Ouseburn River [31]. The mean measured ammonium concentration was the highest in the Kingston Park storm drain samples, but ammonium levels were not particularly high in any of the analyzed waters. A previous study of storm water drains in the Ouseburn catchment already noted that ammonical nitrogen is variable and not a good indicator of sewerage inputs when used as a sole parameter [32]. A literature review of fecal pollution source methods also recommended combining microbial parameters such as HF183 marker gene copies with chemical sewage markers [12]. In our PCA biplot, the variables HF183 and ammonium were closely aligned, and their significant contributions to PC2 separated the ‘fouler’ Kingston Park storm drain discharge from the less polluted Great Park storm drain discharge. Kingston Park is a stormwater drainage system built in 1978 that discharges directly into the Ouseburn, whereas the residential development at Great Park has been built since 2004 and discharges stormwater into retention ponds before draining into the Ouseburn River [33]. In our PCA biplot and cluster analysis, the stormwater retention pond discharge had characteristics more comparable to those of the receiving river water than either one of the two storm drain effluents. These observations suggest that the retention pond at Great Park beneficially altered stormwater quality by making it more like that of the receiving Ouseburn River. Previously, we demonstrated with onsite sequencing methods that sewage treatment plant effluent microbiomes were beneficially altered by passage through constructed wetlands to produce microbial communities and water quality in the effluent more similar to that of the receiving river [15].
4.5. Future Work and Potential for Applications in Low Resource Settings
Looking toward future applications, the portable qPCR methodology of this study is an ideal complement to the portable MinION nanopore sequencing method of our previous work [15]. 16S rRNA gene quantification by qPCR enables translation of the relative abundance data obtained for thousands of bacteria from 16S rRNA gene sequencing into absolute abundance estimates by multiplication. We have previously used this approach in fecal pollution source tracking applications in Nepal and Ethiopia by quantifying 16S rRNA genes in our UK laboratory using DNA preserved from the fieldwork overseas [8,20]. In future, as restrictions on international travel during the COVID-19 pandemic are being lifted, we will seek to demonstrate the combination of our portable NGS and qPCR methods with fieldwork in low resource settings. As shown in Figure 1b, all the equipment items used for onsite qPCR assays readily fit into a suitcase, which would not have been the case for the conventional ribolyzer and qPCR instrument, given their much larger dimensions and weight (Table 1). The only additional items needed for the NGS are the memory-stick sized MinION device and a 13 × 7 × 9 cm mini-PCR thermocycler. With the further addition of the commercial DelAgua Field Kit for membrane filtration and plate counting, we can, in future fieldwork, deploy a highly versatile laboratory for water microbiology in the field, which combines the complementary methods of culturing, sequencing, and qPCR, as envisioned in Acharya et al. [6]. While culturing based methods are necessary to test the viability of bacteria, sequencing comprehensively characterizes the microbiome of water samples, and qPCR assays can be used to validate sequencing results and to quantify genes of special interest such as the 16S rRNA gene for total bacteria, the rodA gene for E. coli, or the HF183 gene of human-host associated Bacteroides.
5. Conclusions
- ▪
- We validated a methodology for qPCR assays with portable equipment items that produces results in close agreement with those obtained with conventional laboratory equipment items.
- ▪
- Our method can analyze turbid water samples without prefiltration, and we found no advantage in using the DNeasy PowerSoilProTM Kit instead of the DNeasy PowerWaterTM for the analysis of a stormwater sample with a high amount of total suspended solids.
- ▪
- We demonstrated rapid water quality testing with an onsite qPCR assay in a mobile laboratory (‘lab in a van’) by quantifying HF183 marker genes for human host associated Bacteroides in river water within 3 h of taking the sample.
- ▪
- We then deployed the mobile laboratory for fecal pollution source tracking in an urban catchment. Within 8 h of sampling, we collected onsite comprehensive microbial and physicochemical water quality data that indicated human sewage pollution of the river via an old storm drain. The data also showed the benefits of storm drain discharge retention in a pond, with pond effluent water having characteristics more like the receiving river compared to the discharge from the two storm drains.
- ▪
- The portable equipment items enabled 87% reduction in weight and 53% reduction in costs in comparison to the conventional laboratory equivalents. All the equipment items used for the onsite qPCR assays readily fit into a suitcase, making the method deployable for fieldwork overseas.
Author Contributions
Conceptualization, D.W., K.A. and R.Z.; Methodology, K.A. and A.B.; Software, D.W.; Validation, R.Z.; Formal analysis, R.Z. and D.W.; Investigation, R.Z., K.A., A.B. and D.W.; Resources, D.W.; Data curation, R.Z. and D.W.; Writing—original draft preparation, D.W.; Writing—review and editing, R.Z., K.A., A.B. and C.G.K.; Visualization, D.W.; Supervision, D.W.; Project administration, D.W.; Funding acquisition, C.G.K. All authors have read and agreed to the published version of the manuscript.
Funding
This research was funded by The Royal Society, grant number ICA\R1\191241; the Engineering and Physical Sciences Research Council (EPSRC), grant number EP/P028527/1; and the Reece Foundation.
Institutional Review Board Statement
Not applicable.
Informed Consent Statement
Not applicable.
Data Availability Statement
Additional data created during this research are openly available (https://doi.org/10.25405/data.ncl.19228272). Please contact Newcastle Research Data Service at [email protected] for access instructions.
Acknowledgments
We thank Newcastle University’s new Biological Engineering: Wastewater Innovation at Scale (BEWISe) facility for designing and commissioning the research van.
Conflicts of Interest
The authors declare no conflict of interest.
Appendix A
Figure A1.
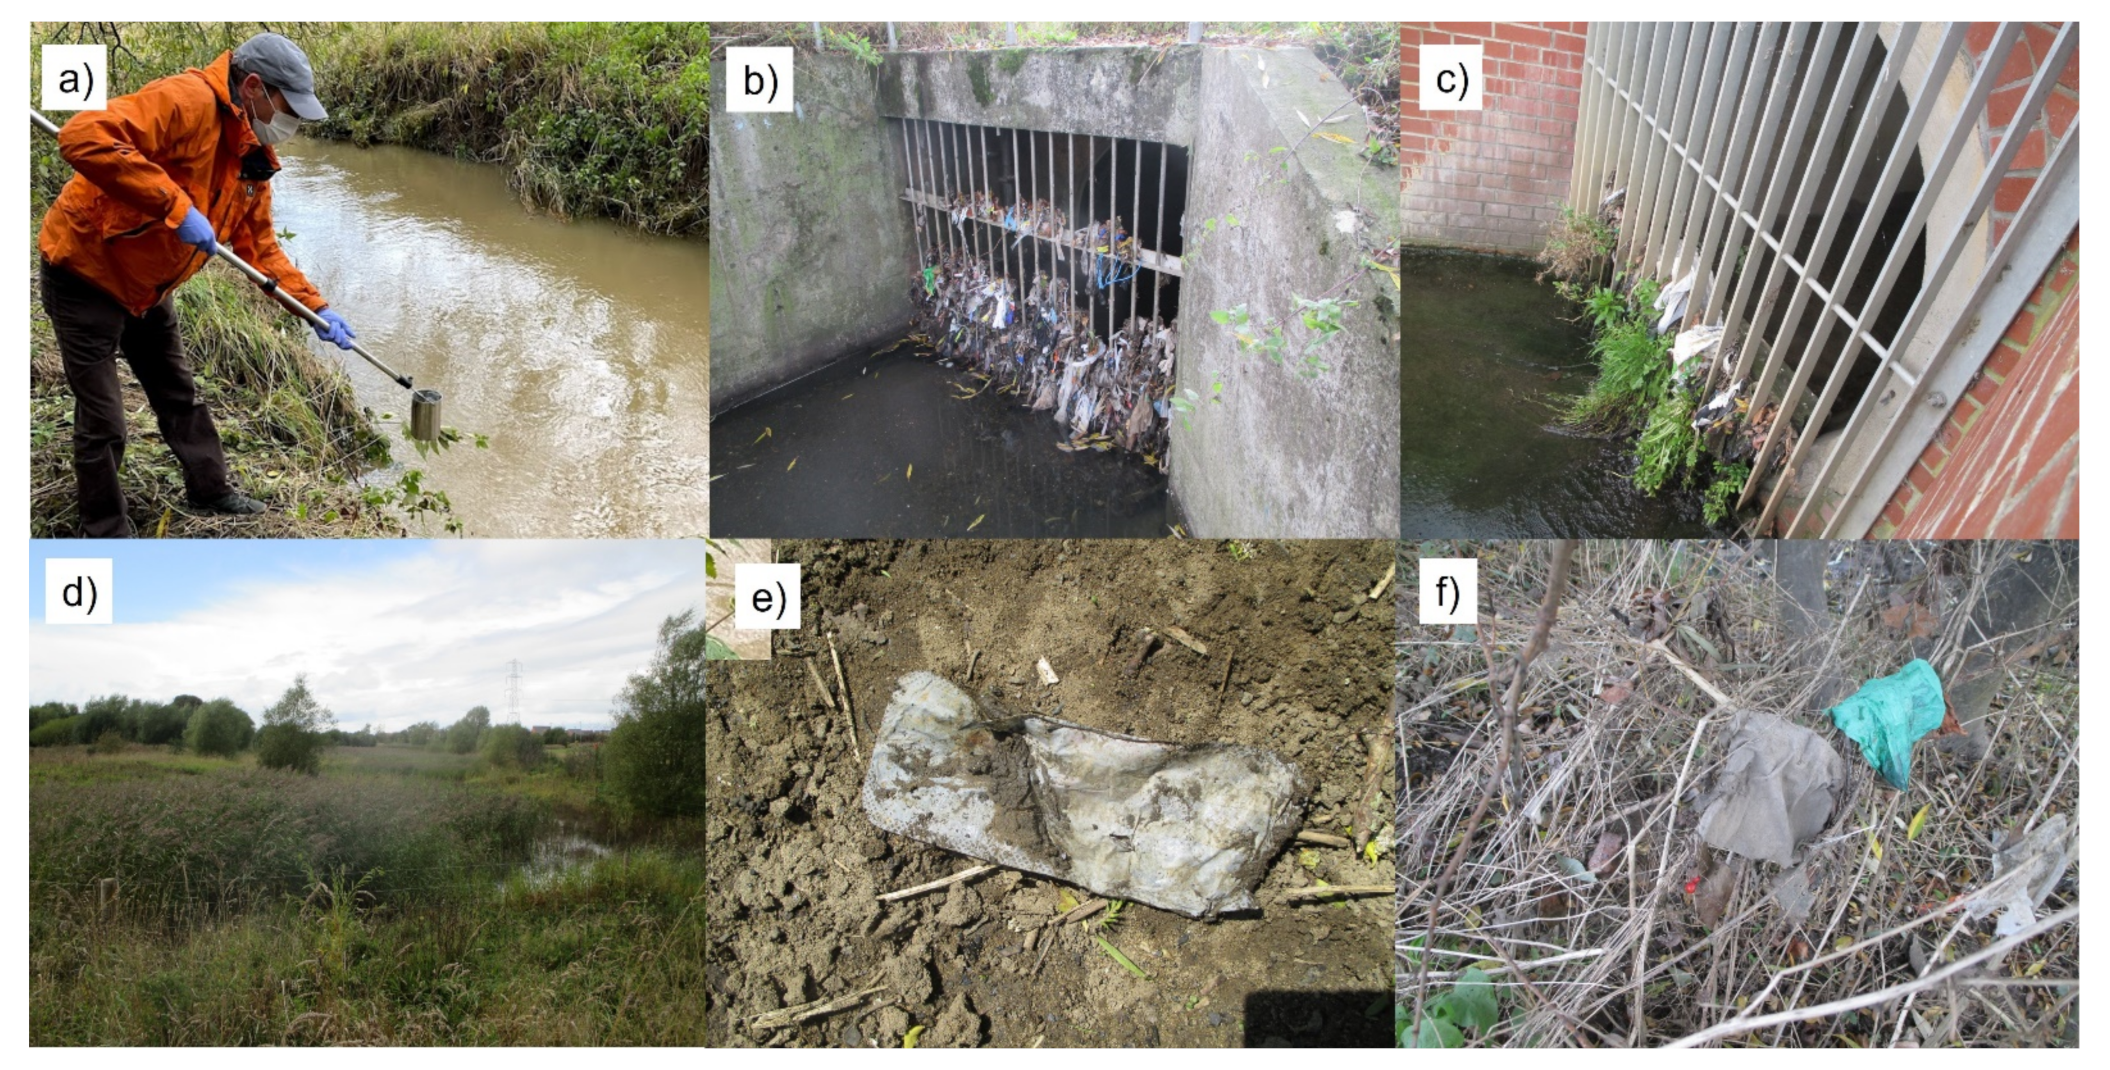
(a) Sampling the Ouseburn River upstream of the storm drains; (b) Kingston Park storm drain; (c) Great Park storm drain; (d) stormwater retention ponds at Great Park; (e,f) sewage litter and other plastic flotsam in the Ouseburn embankment downstream of the Kingston Park storm drain.
Figure A1.
(a) Sampling the Ouseburn River upstream of the storm drains; (b) Kingston Park storm drain; (c) Great Park storm drain; (d) stormwater retention ponds at Great Park; (e,f) sewage litter and other plastic flotsam in the Ouseburn embankment downstream of the Kingston Park storm drain.


Table A1.
DNA yield, 16S rRNA, and rodA gene copies for the different extraction methods and qPCR instruments, showing the data for each filter replicate. qPCR results are the average and standard deviation of duplicate analysis from each DNA extract, * means significant at p < 0.05.
Table A1.
DNA yield, 16S rRNA, and rodA gene copies for the different extraction methods and qPCR instruments, showing the data for each filter replicate. qPCR results are the average and standard deviation of duplicate analysis from each DNA extract, * means significant at p < 0.05.
| Method | Filter (#) | DNA Yield (ng/100 mL) | Log10 16S rRNA (Genes/100 mL) | Log10 rodA (Genes/100 mL) |
|---|---|---|---|---|
| Vortex and conventional qPCR | 1 | 143 | 7.70 ± 0.02 | 5.39 ± 0.21 |
| 2 | 157 | 7.76 ± 0.10 | 4.68 ± 0.16 | |
| 3 | 102 | 7.44 ± 0.06 | 4.55 ± 0.14 | |
| Vortex with enzyme and conventional qPCR | 4 | 151 | 7.52 ± 0.00 | 4.69 ± 0.18 |
| 5 | 184 | 7.84 ± 0.11 | 4.54 ± 0.04 | |
| 6 | 190 | 7.77 ± 0.00 | 5.38 ± 1.35 | |
| Ribolyzer and conventional qPCR | 7 | 280 | 7.92 ± 0.10 | 4.68 ± 0.03 |
| 8 | 235 | 7.68 ± 0.04 | 4.68 ± 0.02 | |
| 9 | 132 | 7.72 ± 0.20 | 4.54 ± 0.03 | |
| Vortex and portable qPCR | 1 | See above | 7.85 ± 0.00 | 5.29 ± 0.01 |
| 2 | See above | 7.96 ± 0.01 | 4.61 ± 0.06 | |
| 3 | See above | 7.75 ± 0.01 | 4.38 ± 0.04 | |
| Vortex with enzyme and portable qPCR | 4 | See above | 7.74 ± 0.03 | 4.62 ± 0.04 |
| 5 | See above | 7.85 ± 0.01 | 4.48 ± 0.12 | |
| 6 | See above | 7.78 ± 0.04 | 4.38 ± 0.04 | |
| Ribolyzer and portable qPCR | 7 | See above | 8.14 ± 0.00 | 4.54 ± 0.27 |
| 8 | See above | 7.80 ± 0.51 | 4.52 ± 0.11 | |
| 9 | See above | 7.85 ± 0.01 | 4.28 ± 0.07 | |
| Method comparison ANOVA with post hoc pairwise comparisons using Tukey’s honest significant difference criterion | One-way Extraction method p = 0.199 Pairwise comparison all p > 0.177 | Two-way crossed Extraction method p = 0.358 qPCR instrument p = 0.042 * Interaction p = 0.692 Pairwise comparison all p > 0.179 | Two-way crossed Extraction method p = 0.386 qPCR instrument p = 0.181 Interaction p = 0.792 Pairwise comparison all p > 0.634 |
Table A2.
Comparison of calibration curve metrics for the conventional and portable qPCR instruments.
Table A2.
Comparison of calibration curve metrics for the conventional and portable qPCR instruments.
| PCR Instrument | Gene | LOD 1 (Genes/μL Template) | Slope (Cq/log(Genes/μL)) | Efficiency (%) | R2 |
|---|---|---|---|---|---|
| Conventional | 16S | 10 | −3.376 | 98 | 0.993 |
| rodA | 10 | −3.440 | 95 | 1.000 | |
| Portable | 16S | 10 | −3.383 | 98 | 0.996 |
| rodA | 10 | −3.595 | 90 | 0.992 |
1 The limit of detection is stated as the lowest standard concentration, which is equal to 20 genes in the reaction mixture. All standards amplified, and all sample templates had marker gene concentrations above the lowest standard concentration.
Table A3.
DNA yield and HF183 gene copies for 350 mL volumes of Ouseburn River water collected at the catchment outlet at Foundry Ln and analyzed onsite, showing the data for each filter replicate. qPCR results are the average and standard deviation of triplicate analysis from each DNA extract.
Table A3.
DNA yield and HF183 gene copies for 350 mL volumes of Ouseburn River water collected at the catchment outlet at Foundry Ln and analyzed onsite, showing the data for each filter replicate. qPCR results are the average and standard deviation of triplicate analysis from each DNA extract.
| Location | Filter (#) | DNA Yield (ng/100 mL) | Log10 HF183 (Genes/100 mL) |
|---|---|---|---|
| Catchment outlet at Foundry Ln | 1 | 560 | 4.26 ± 0.02 |
| 2 | 523 | 4.23 ± 0.06 | |
| Filtration replicate comparison, ttest | p = 0.44 |
Table A4.
DNA yield, 16S rRNA, HF183 gene copies, and fecal coliform (FC) counts for the water samples collected in the fieldwork and analyzed onsite. qPCR results are the average and standard deviation of triplicates prepared from each pooled DNA extract, while FC counts are for triplicates of the 0.5 mL water filtrations, * means significant at p < 0.05 and *** at p < 0.001.
| Location | Filter (#) | DNA Yield (ng/100 mL) | Log10 16S rRNA (Genes/100 mL) | Log10 HF183 (Genes/100 mL) | Log10 FC (Genes/100 mL) |
|---|---|---|---|---|---|
| RiverUp | 1&2 | 112 | 7.01 ± 0.01 | 4.23 ± 0.03 | 3.72 ± 0.07 |
| KPStDrain | 2&3 | 247 | 9.83 ± 0.72 | 6.03 ± 0.04 | 4.17 ± 0.09 |
| GPStDrain | 3&4 | 61 | 8.03 ± 0.04 | 4.02 ± 0.08 | 4.12 ± 0.14 |
| PondEff | 5&6 | 15 | 6.64 ± 0.03 | 4.44 ± 0.10 | 3.49 ± 0.02 |
| Blank 1 | 7&8 | n.d. | n.d. | n.d. | n.d. |
| Location comparison ANOVA with post hoc pairwise comparisons using Tukey’s honest significant difference criterion | One-way location p < 0.001 *** Pairwise comparison all p < 0.05 * except RiverUp vs. PondEff p = 0.61 | One-way location p < 0.001 *** Pairwise comparison all p < 0.05 * | One-way location p < 0.001 *** Pairwise comparison all p < 0.05 * except KPStDrain vs. GPStDrain p = 0.86 |
1 Method blanks did not give a quantifiable DNA yield. The 16S rRNA gene concentration in the qPCR tubes derived from the Cq values of the no-template and blank sample control reactions was 17 to 26 genes per μL versus > 100,000 genes for all the water samples. There was no amplification of HF183 genes from the no template and blank sample control reactions. No colonies were observed on filters incubated without the addition of water samples.
References
- Aarestrup, F.M.; Woolhouse, M.E. Using sewage for surveillance of antimicrobial resistance. Science 2020, 367, 630–632. [Google Scholar] [CrossRef] [PubMed]
- Anonymous. Science after the pandemic: Bright side of the moonshots. Economist 2021. Available online: https://www.economist.com/leaders/2021/03/27/bright-side-of-the-moonshots (accessed on 27 March 2021).
- Mao, K.; Zhang, H.; Yang, Z. Can a Paper-Based Device Trace COVID-19 Sources with Wastewater-Based Epidemiology? Environ. Sci. Technol. 2020, 54, 3733–3735. [Google Scholar] [CrossRef] [PubMed]
- Fu, J.; Chiang, E.L.C.; Medriano, C.A.D.; Li, L.; Bae, S. Rapid quantification of fecal indicator bacteria in water using the most probable number-loop-mediated isothermal amplification (MPN-LAMP) approach on a polymethyl methacrylate (PMMA) microchip. Water Res. 2021, 199, 117172. [Google Scholar] [CrossRef] [PubMed]
- Gowda, H.N.; Kido, H.; Wu, X.; Shoval, O.; Lee, A.; Lorenzana, A.; Madou, M.; Hoffmann, M.; Jiang, S.C. Development of a proof-of-concept microfluidic portable pathogen analysis system for water quality monitoring. Sci. Total Environ. 2022, 813, 152556. [Google Scholar] [CrossRef] [PubMed]
- Acharya, K.; Khanal, S.; Pantha, K.; Amatya, N.; Davenport, R.J.; Werner, D. A comparative assessment of conventional and molecular methods, including MinION nanopore sequencing, for surveying water quality. Sci. Rep. 2019, 9, 1–11. [Google Scholar]
- Hui, Q.; Pan, Y.; Yang, Z. Paper-based devices for rapid diagnostics and testing sewage for early warning of COVID-19 outbreak. Case Stud. Chem. Environ. Eng. 2020, 2, 100064. [Google Scholar] [CrossRef]
- Pantha, K.; Acharya, K.; Mohapatra, S.; Khanal, S.; Amatya, N.; Ospina-Betancourth, C.; Butte, G.; Shrestha, S.D.; Rajbhandari, P.; Werner, D. Faecal pollution source tracking in the holy Bagmati River by portable 16S rRNA gene sequencing. NPJ Clean Water 2021, 4, 12. [Google Scholar] [CrossRef]
- Bridle, H.; Miller, B.; Desmulliez, M.P.Y. Application of microfluidics in waterborne pathogen monitoring: A review. Water Res. 2014, 55, 256–271. [Google Scholar] [CrossRef]
- Reddington, K.; Eccles, D.; O’Grady, J.; Drown, D.M.; Hansen, L.H.; Nielsen, T.K.; Ducluzeau, A.-L.; Leggett, R.M.; Heavens, D.; Peel, N.; et al. Metagenomic analysis of planktonic riverine microbial consortia using nanopore sequencing reveals insight into river microbe taxonomy and function. GigaScience 2020, 9, giaa053. [Google Scholar] [CrossRef]
- WHO. Fact Sheets: Diarrhoeal Disease. Available online: https://www.who.int/news-room/fact-sheets/detail/diarrhoeal-disease (accessed on 21 March 2022).
- Tran, N.H.; Gin, K.Y.-H.; Ngo, H.H. Fecal pollution source tracking toolbox for identification, evaluation and characterization of fecal contamination in receiving urban surface waters and groundwater. Sci. Total Environ. 2015, 538, 38–57. [Google Scholar] [CrossRef]
- Teunis, P.; van der Heijden, O.; van der Giessen, J.; Havelaar, A. The Dose-Response Relation in Human Volunteers for Gastrointestinal Pathogens; RIVM Rapport 284550002; RIVM: Bilthoven, The Netherlands, 1996; p. 97.
- Martzy, R.; Kolm, C.; Brunner, K.; Mach, R.L.; Krska, R.; Šinkovec, H.; Sommer, R.; Farnleitner, A.H.; Reischer, G.H. A loop-mediated isothermal amplification (LAMP) assay for the rapid detection of Enterococcus spp. in water. Water Res. 2017, 122, 62–69. [Google Scholar] [CrossRef] [PubMed]
- Acharya, K.; Blackburn, A.; Mohammed, J.; Haile, A.T.; Hiruy, A.M.; Werner, D. Metagenomic water quality monitoring with a portable laboratory. Water Res. 2020, 184, 116112. [Google Scholar] [CrossRef] [PubMed]
- Martzy, R.; Kolm, C.; Krska, R.; Mach, R.L.; Farnleitner, A.H.; Reischer, G.H. Challenges and perspectives in the application of isothermal DNA amplification methods for food and water analysis. Anal. Bioanal. Chem. 2019, 411, 1695–1702. [Google Scholar] [CrossRef] [PubMed] [Green Version]
- Uprety, S.; Dangol, B.; Nakarmi, P.; Dhakal, I.; Sherchan, S.P.; Shisler, J.L.; Jutla, A.; Amarasiri, M.; Sano, D.; Nguyen, T.H. Assessment of microbial risks by characterization of Escherichia coli presence to analyze the public health risks from poor water quality in Nepal. Int. J. Hyg. Environ. Health 2020, 226, 113484. [Google Scholar] [CrossRef]
- Thongsamer, T.; Neamchan, R.; Blackburn, A.; Acharya, K.; Sutheeworapong, S.; Tirachulee, B.; Pattanachan, P.; Vinitnantharat, S.; Zhou, X.-Y.; Su, J.-Q.; et al. Environmental antimicrobial resistance is associated with faecal pollution in Central Thailand’s coastal aquaculture region. J. Hazard. Mater. 2021, 416, 125718. [Google Scholar] [CrossRef]
- Ho, J.Y.; Jong, M.-C.; Acharya, K.; Liew, S.S.X.; Smith, D.R.; Noor, Z.Z.; Goodson, M.L.; Werner, D.; Graham, D.W.; Eswaran, J. Multidrug-resistant bacteria and microbial communities in a river estuary with fragmented suburban waste management. J. Hazard. Mater. 2021, 405, 124687. [Google Scholar] [CrossRef]
- Hiruy, A.M.; Mohammed, J.; Haileselassie, M.M.; Acharya, K.; Butte, G.; Haile, A.T.; Walsh, C.; Werner, D. Spatiotemporal variation in urban wastewater pollution impacts on river microbiomes and associated hazards in the Akaki catchment, Addis Ababa, Ethiopia. Sci. Total Environ. 2022, 826, 153912. [Google Scholar] [CrossRef]
- O’Dea, C.; Zhang, Q.; Staley, C.; Masters, N.; Kuballa, A.; Fisher, P.; Veal, C.; Stratton, H.; Sadowsky, M.J.; Ahmed, W.; et al. Compositional and temporal stability of fecal taxon libraries for use with SourceTracker in sub-tropical catchments. Water Res. 2019, 165, 114967. [Google Scholar] [CrossRef]
- Ahmed, W.; Hughes, B.; Harwood, V.J. Current Status of Marker Genes of Bacteroides and Related Taxa for Identifying Sewage Pollution in Environmental Waters. Water 2016, 8, 231. [Google Scholar] [CrossRef] [Green Version]
- Capone, D.; Berendes, D.; Cumming, O.; Knee, J.; Nalá, R.; Risk, B.B.; Stauber, C.; Zhu, K.; Brown, J. Analysis of Fecal Sludges Reveals Common Enteric Pathogens in Urban Maputo, Mozambique. Environ. Sci. Technol. Lett. 2020, 7, 889–895. [Google Scholar] [CrossRef]
- Muyzer, G.; de Waal, E.C.; Uitterlinden, A.G. Profiling of complex microbial populations by denaturing gradient gel electrophoresis analysis of polymerase chain reaction-amplified genes coding for 16S rRNA. Appl. Environ. Microbiol. 1993, 59, 695–700. [Google Scholar] [CrossRef] [PubMed] [Green Version]
- Chern, E.C.; Siefring, S.; Paar, J.; Doolittle, M.; Haugland, R.A. Comparison of quantitative PCR assays for Escherichia coli targeting ribosomal RNA and single copy genes. Lett. Appl. Microbiol. 2011, 52, 298–306. [Google Scholar] [CrossRef] [PubMed]
- Ahmed, W.; Payyappat, S.; Cassidy, M.; Besley, C. A duplex PCR assay for the simultaneous quantification of Bacteroides HF183 and crAssphage CPQ_056 marker genes in untreated sewage and stormwater. Environ. Int. 2019, 126, 252–259. [Google Scholar] [CrossRef] [PubMed]
- Rügner, H.; Schwientek, M.; Beckingham, B.; Kuch, B.; Grathwohl, P. Turbidity as a proxy for total suspended solids (TSS) and particle facilitated pollutant transport in catchments. Environ. Earth Sci. 2013, 69, 373–380. [Google Scholar] [CrossRef]
- Johnson, G.; Nolan, T.; Bustin, S.A. Real-Time Quantitative PCR, Pathogen Detection and MIQE. In PCR Detection of Microbial Pathogens; Wilks, M., Ed.; Humana Press: Totowa, NJ, USA, 2013; pp. 1–16. [Google Scholar]
- Carvalho, J.; Diéguez, L.; Ipatov, A.; Guerreiro, J.R.; Garrido-Maestu, A.; Azinheiro, S.; Prado, M. Single-use microfluidic device for purification and concentration of environmental DNA from river water. Talanta 2021, 226, 122109. [Google Scholar] [CrossRef]
- Unicef. Rapid Water Quality Testing. Available online: https://www.unicef.org/innovation/rapid-water-quality-testing (accessed on 17 February 2022).
- Rennie, M.J. A Water Quality Survey of the River Ouseburn. Master Thesis, School of Civil Engineering & Geosciences, Newcastle University, Newcastle upon Tyne, UK, 2012; p. 13. [Google Scholar]
- Baker, A.; Inverarity, R.; Charlton, M.; Richmond, S. Detecting river pollution using fluorescence spectrophotometry: Case studies from the Ouseburn, NE England. Environ. Pollut. 2003, 124, 57–70. [Google Scholar] [CrossRef]
- Birkinshaw, S.J.; Kilsby, C.; O’Donnell, G.; Quinn, P.; Adams, R.; Wilkinson, M.E. Stormwater Detention Ponds in Urban Catchments—Analysis and Validation of Performance of Ponds in the Ouseburn Catchment, Newcastle upon Tyne, UK. Water 2021, 13, 2521. [Google Scholar] [CrossRef]
Figure 1.
(a) Mobile laboratory in the back of a van; (b) the equipment items needed for onsite marker gene quantification inside a suitcase for transportation, and (c) the equipment items set up on the bench of the mobile laboratory, from left to right: vacuum pump, filtration unit, qPCR instrument, laptop computer, pipettes and tips, centrifuge, fluorometer, and vortex with adapter.

Figure 2.
16S rRNA and rodA marker gene copies per 100 mL of river water quantified with different DNA extraction methods and qPCR instruments. Error bars indicate the standard deviation of triplicates.
Figure 2.
16S rRNA and rodA marker gene copies per 100 mL of river water quantified with different DNA extraction methods and qPCR instruments. Error bars indicate the standard deviation of triplicates.

Figure 3.
Timeline of the fieldwork at Kingston Park.

Figure 4.
16S rRNA and HF183 marker gene copies and FC per 100 mL of river (RiverUp), storm drain (KPStDrain and GPStDrain), and retention pond (PondEff) water quantified onsite, error bars indicate the standard deviation of triplicates.
Figure 4.
16S rRNA and HF183 marker gene copies and FC per 100 mL of river (RiverUp), storm drain (KPStDrain and GPStDrain), and retention pond (PondEff) water quantified onsite, error bars indicate the standard deviation of triplicates.

Figure 5.
Multivariate analysis of the zscore transformed data collected onsite. Mean values of onsite qPCR assays and cuvette tests, and stabilized readings of the handheld probes are shown in the plots.
Figure 5.
Multivariate analysis of the zscore transformed data collected onsite. Mean values of onsite qPCR assays and cuvette tests, and stabilized readings of the handheld probes are shown in the plots.

Table 1.
Specifications and costs of conventional and portable equipment items for cell lysis and qPCR.
Table 1.
Specifications and costs of conventional and portable equipment items for cell lysis and qPCR.
| Methodology | Equipment | Weight kg | Dimensions (W × L × H in cm) | Costs £ incl. VAT |
|---|---|---|---|---|
| Conventional | FastPrep-24™ 5G ribolyzer | 23.6 | 47.2 × 38.5 × 49 | 7344 |
| Bio-Rad CFX Connect qPCR instrument with software | 21.0 | 33 × 46 × 36 | 14,887 | |
| Portable | Vortex-Genie 2 with adaptor | 4 | 12.2 × 16.5 × 16.5 | 518 |
| Q qPCR instrument | 2 | 15 × 15 × 13 | 9980 |
Table 2.
Primers and probes with literature references, sequence, temperature cycling program, and metrics of the calibration curves on the portable qPCR instrument.
Table 2.
Primers and probes with literature references, sequence, temperature cycling program, and metrics of the calibration curves on the portable qPCR instrument.
| Marker Gene | Primers and Probe | Program | Slope (Cq/log(Genes/µL)) | R2 | Efficiency (%) |
|---|---|---|---|---|---|
| 16S rRNA (total bacteria) [24] | F: ATGGCTGTCGTCAGCT R: ACGGGCGGTGTGTAC | 3 min at 98 °C, 40 cycles of 15 s at 98 °C, 30 s at 60 °C, melt curve from 72 °C to 95 °C | −3.30 ± 0.13 | 0.990 ± 0.019 | 101 ± 6 |
| rodA (E. coli) [25] | F: GCAAACCACCTTTGGTCG R: CTGTGGGTGTGGATTGACAT P: FAM-AACCCCTACAACCGGCAGAATACC | 3 min at 95 °C, 40 cycles of 15 s at 95 °C, 30 s at 60 °C | −3.63 ± 0.09 | 0.992 ± 0.002 | 89 ± 3 |
| HF183 (human host associated Bacteroides) [26] | F: ATCATGAGTTCACATGTCCG R: CTTCCTCTCAGAACCCCTATCC P: HEX-CTAATGGAACGCATCCC | 3 min at 95 °C, 40 cycles of 15 s at 95 °C, 30 s at 60 °C | −3.32 ± 0.17 | 0.992 ± 0.005 | 100 ± 7 |
Table 3.
DNA yield, 16S rRNA, and rodA gene copies for different extraction kits showing the data for each filter replicate. qPCR results were obtained with the ribolyzer and portable qPCR instrument. Errors are the average and standard deviation of duplicate analysis from each DNA extract.
Table 3.
DNA yield, 16S rRNA, and rodA gene copies for different extraction kits showing the data for each filter replicate. qPCR results were obtained with the ribolyzer and portable qPCR instrument. Errors are the average and standard deviation of duplicate analysis from each DNA extract.
| Kit | Filter (#) | DNA Yield (ng/100 mL) | Log10 16S rRNA (Genes/100 mL) | Log10 rodA (Genes/100 mL) |
|---|---|---|---|---|
| DNeasy PowerWater TM | 1 | 52,750 | 10.56 ± 0.02 | 5.26 ± 0.20 |
| 2 | 32,200 | 10.31 ± 0.00 | 5.22 ± 0.26 | |
| DNeasy PowerSoil Pro TM | 3 | 25,600 | 10.30 ± 0.01 | 6.00 ± 0.19 |
| 4 | 22,800 | 10.23 ± 0.01 | 5.61 ± 0.43 | |
| Kit comparison, t-test | p = 0.220 | p = 0.316 | p = 0.101 |
Table 4.
Physicochemical metadata collected with the mobile laboratory. For the handheld probes, stabilized readings are reported. Errors are the average of duplicates for the other measurements.
Table 4.
Physicochemical metadata collected with the mobile laboratory. For the handheld probes, stabilized readings are reported. Errors are the average of duplicates for the other measurements.
| Parameter | RiverUp | KPStDrain | GPStDrain | PondEff |
|---|---|---|---|---|
| Temperature (°C) | 10.3 | 12.8 | 13.3 | 10.4 |
| Conductivity (μS/cm) | 610 | 746 | 769 | 358 |
| pH | 7.31 | 7.75 | 7.69 | 7.45 |
| Dissolved oxygen (mg/L) | 9.15 | 9.55 | 9.54 | 7.52 |
| Alkalinity (mg/L CaCO3) | 96 ± 16 | 145 ± 24 | 113 ± 13 | 64 ± 1 |
| Turbidity (NTU) | 69.3 ± 1.2 | 8.1 ± 0.1 | 3.9 ± 0.0 | 94.7 ± 1.0 |
| Ammonium-N (mg/L) | 0.120 ± 0.003 | 0.135 ± 0.010 | 0.033 ± 0.008 | 0.121 ± 0.003 |
| Nitrate-N (mg/L) | 5.74 ± 0.01 | 4.29 ± 0.02 | 5.72 ± 0.03 | 2.74 ± 0.02 |
| Nitrite-N (mg/L) | 0.098 ± 0.013 | 0.012 ± 0.017 | 0.029 ± 0.003 | 0.079 ± 0.002 |
| Phosphate-P (mg/L) | 0.255 ± 0.001 | 0.212 ± 0.001 | 0.163 ± 0.004 | 0.432 ± 0.011 |
| Fluoride (mg/L) | <0.1 | <0.1 | <0.1 | <0.1 |
Publisher’s Note: MDPI stays neutral with regard to jurisdictional claims in published maps and institutional affiliations. |
© 2022 by the authors. Licensee MDPI, Basel, Switzerland. This article is an open access article distributed under the terms and conditions of the Creative Commons Attribution (CC BY) license (https://creativecommons.org/licenses/by/4.0/).
Share and Cite
MDPI and ACS Style
Zan, R.; Acharya, K.; Blackburn, A.; Kilsby, C.G.; Werner, D. A Mobile Laboratory Enables Fecal Pollution Source Tracking in Catchments Using Onsite qPCR Assays. Water 2022, 14, 1224. https://doi.org/10.3390/w14081224
AMA Style
Zan R, Acharya K, Blackburn A, Kilsby CG, Werner D. A Mobile Laboratory Enables Fecal Pollution Source Tracking in Catchments Using Onsite qPCR Assays. Water. 2022; 14(8):1224. https://doi.org/10.3390/w14081224
Chicago/Turabian StyleZan, Rixia, Kishor Acharya, Adrian Blackburn, Chris G. Kilsby, and David Werner. 2022. "A Mobile Laboratory Enables Fecal Pollution Source Tracking in Catchments Using Onsite qPCR Assays" Water 14, no. 8: 1224. https://doi.org/10.3390/w14081224
Note that from the first issue of 2016, this journal uses article numbers instead of page numbers. See further details here.