
Water Quality Predictive Analytics Using an Artificial Neural Network with a Graphical User Interface


1
College of Graduate Studies, Universiti Tenaga Nasional (UNITEN), Kajang 43000, Malaysia
2
Department of Civil Engineering, College of Engineering, Universiti Tenaga Nasional (UNITEN), Kajang 43000, Malaysia
3
Institute of Energy Policy and Research (IEPRe), Universiti Tenaga Nasional (UNITEN), Kajang 43000, Malaysia
4
Department of Physics, Faculty of Science, Universiti Putra Malaysia (UPM), Serdang 43400, Malaysia
*
Author to whom correspondence should be addressed.
Water 2022, 14(8), 1221; https://doi.org/10.3390/w14081221
Submission received: 21 February 2022
/
Revised: 24 March 2022
/
Accepted: 31 March 2022
/
Published: 11 April 2022
(This article belongs to the Special Issue River Water Management and Water Quality)
Abstract
:Since clean water is well known as one of the crucial sources that all living things need in their daily lives, the demand for clean freshwater nowadays has increased. However, water quality is slowly deteriorating due to anthropogenic and natural sources of pollution and contamination. Therefore, this study aims to develop artificial neural network (ANN) models to predict six different water quality parameters in the Langat River, Malaysia. Moreover, an application (app) equipped with a graphical user interface (GUI) was designed and developed to conduct real-time prediction of the water quality parameters by using real-time data as inputs together with the ANN models. As for the results, all of the ANN models achieved high coefficients of determination (R2), which were between 0.9906 and 0.9998, as well as between 0.8797 and 0.9972 for training and testing datasets, respectively. The developed app successfully predicted the outcome based on the run models. The implementation of a GUI-based app in this study enables a simpler and more trouble-free workflow in predicting water quality parameters. By eliminating sophisticated programming subroutines, the prediction process becomes accessible to more people, especially on-site operators and trainees.
1. Introduction
Water resources come in different types, such as the sea, underground water, and rivers. However, rivers that are free from pollution at an early stage are considered safe to be consumed by most living organisms on planet Earth [1]. Besides living beings, rivers are also used for several sectors of the economy, viz. for irrigation, animal husbandry, as well as agricultural and household purposes [2]. Nevertheless, the growth in global population, as well as the advancement in industries and urbanisation, has caused issues regarding water pollution to become greater than other concerns such as health, land use, and the scarcity of food [3,4].
As stated by Sami et al., pollution and contamination caused by two factors—namely, natural and human factors—will affect water quality [5]. In order to keep the pollution levels from exceeding the maximum level, prediction and assessment of the surface water quality are needed. Therefore, adequate measures and consideration can be applied to ensure the best river basin management [6]. Precautionary measures to prevent further river water pollution and contamination can be implemented by using advanced technologies that have been invented and innovated.
The adoption of the machine learning approach in water quality assessment has gained a lot of traction in recent years, possibly because it is accurate and flexible without requiring any parametric assumptions or complicated physical equations [7]. The artificial neural network (ANN), in particular, has been used by countless researchers to predict water quality parameters in rivers. Other than having the ability to extract such complex relations between the predictor and the predicted variables, ANN models are also able to stimulate the nonlinear and time-varying features of the atmospheric variables at numerous scales (monthly, hourly, or daily) [8]. Moreover, Dogan et al. used ANN to predict biochemical oxygen demand (BOD5) at the Melen River, Turkey. The research successfully predicted BOD5 with eight inputs and one hidden layer using only three nodes and yielded the best results [9]. Sarkar and Pandey also used ANN to predict dissolved oxygen (DO) in the Yamuna River, India. The results were also excellent because the predicted DO values were accurate, with correlation values as high as 0.9 between the predicted and measured values [10]. Therefore, it shows that ANN is able to predict river water quality and obtain satisfying results.
As time passes, new inventions and advanced technologies are made and applied in the hydrology field, especially in monitoring and predicting river water quality parameters. Rather than a user needing to collect historical data for a particular site of research, the usage of real-time data in modelling to conduct research does help in minimising time consumption and providing immediate results [11]. Wireless sensor networks (WSNs) are typically used to achieve real-time modelling, where the water quality data are collected from sensors and then transferred to the cloud for storing. From there, the data can be retrieved and used as inputs for machine learning models in order to predict river water quality.
For instance, in India, Menon et al. used WSN to monitor river water quality. The authors have designed the wireless sensor node in the system to monitor the pH value of the river water [12]. In another study, Wang et al. designed a remote water quality monitoring system based on WSN. The authors used WSN based on ZigBee to realise the real-time monitoring function and the water quality parameter remote probing [13]. Another previous study conducted by Kageyama et al. also applied WSN in their research. They used WSN for water quality monitoring, and it consisted of several sensors, such as turbidity and pH sensors [14].
Although there are many machine learning models developed for river water quality prediction, there is little to no research that integrates the models with a graphical user interface (GUI). The user is able to input real-time data into a GUI that has been connected to a machine learning model, thus minimising time consumption by reducing the number of procedures required to conduct the analysis. The GUI-based app in this study also enables a simpler and more trouble-free workflow in predicting water quality parameters and can be accessible to more people, especially on-site operators and trainees. Therefore, this study aims to develop ANN models to predict six different water quality parameters, viz., biochemical oxygen demand (BOD5), total suspended solids (TSS), dissolved solids (DS), total solids (TS), nitrate, and phosphate in the Langat River, Malaysia. In addition, an application (app) that is equipped with the ANN models was developed to conduct real-time predictions of the six water quality parameters.
2. Materials and Methods
2.1. Study Area
Selangor is one of the states situated in West Malaysia and is known to have five large river basins, which include the Sungai Buloh Basin, Sugai Tengi Basin, Sungai Selangor Basin, Sungai Klang Basin, and lastly, the Sungai Langat Basin, which is also known as the Langat River Basin [15]. Set off from the highest peak of Nuang Mountain (Gunung Nuang) and continuing to flow westward to the Straits of Malacca, the Langat River Basin is acknowledged as the second largest basin in Selangor, having approximately a catchment area of 1815 km2 [16,17]. There are three different types of geographical areas in the basin—namely, the flood plain, the undulating land, and the mountainous areas in the downstream, middle, and upstream of the Langat River, respectively [18]. In addition, the Langat River Basin also faces the northeast monsoon (November to March) and the southwest monsoon (May to September) yearly [19]. In this study, 24 water quality parameters (Station No. 2917601) with few hydrological parameters—namely, rainfall (Station No. 2815001, Station No. 2917001, Station No. 3118102, and Station No. 3218101), water level (Station No. 2816441), and streamflow (Station No. 2917401) were used as inputs for modelling. All of the historical data were retrieved from the Department of Irrigation and Drainage (DID), Malaysia.
2.2. Data Description and Preprocessing
The historical record spans from January 1981 until March 2019 yielded 161 available data points for each parameter. A total of 24 water quality parameters were available—namely, pH value, colour, turbidity, conductivity, alkalinity, hardness, calcium, magnesium, total solids, dissolved solids, solids, chloride, fluoride, ammonia, nitrate, sodium, potassium, manganese, iron, phosphate, sulphate, silica, chemicals, and BOD5 [20]—in addition to TSS that is given by
Total suspended solid = Total solid − Total dissolved solid
The unit for TSS, total solids, and total dissolved solids is mg/L. All 25 water quality parameters, along with 6 hydrological parameters, which gave a total of 31 model inputs, were fed to the ANN models that will output the predicted values of BOD5 (mg/L × 100), TSS (mg/L), DS (mg/L × 100), TS (mg/L), nitrate (mg/L × 100), and phosphate (mg/L × 100). The statistical analysis of the water quality parameters of Langat River is shown in Figure 1.
Furthermore, the model outputs were chosen in the study because sensor measurements for these water quality parameters are difficult to perform, as they require water lab testing and analysis [12]. The measurements also cannot be performed directly, making it impossible to receive immediate results. Moreover, the parameters are more effective in determining the water quality in Langat River. TSS, TS, and DS are considered the most effective water quality parameters that can easily identify pollution or contamination upstream of the river since it is usually affected by natural factors such as floods and landslides [21,22]. Similarly, BOD5, nitrate, and phosphate are effective downstream of the river, as it is highly influenced by human factors of pollution due to industrial and urbanisation activities [23]. Therefore, predicting the six parameters would resolve the technical and time-constraint issues while providing vital information in determining the water quality in both streams of Langat River.
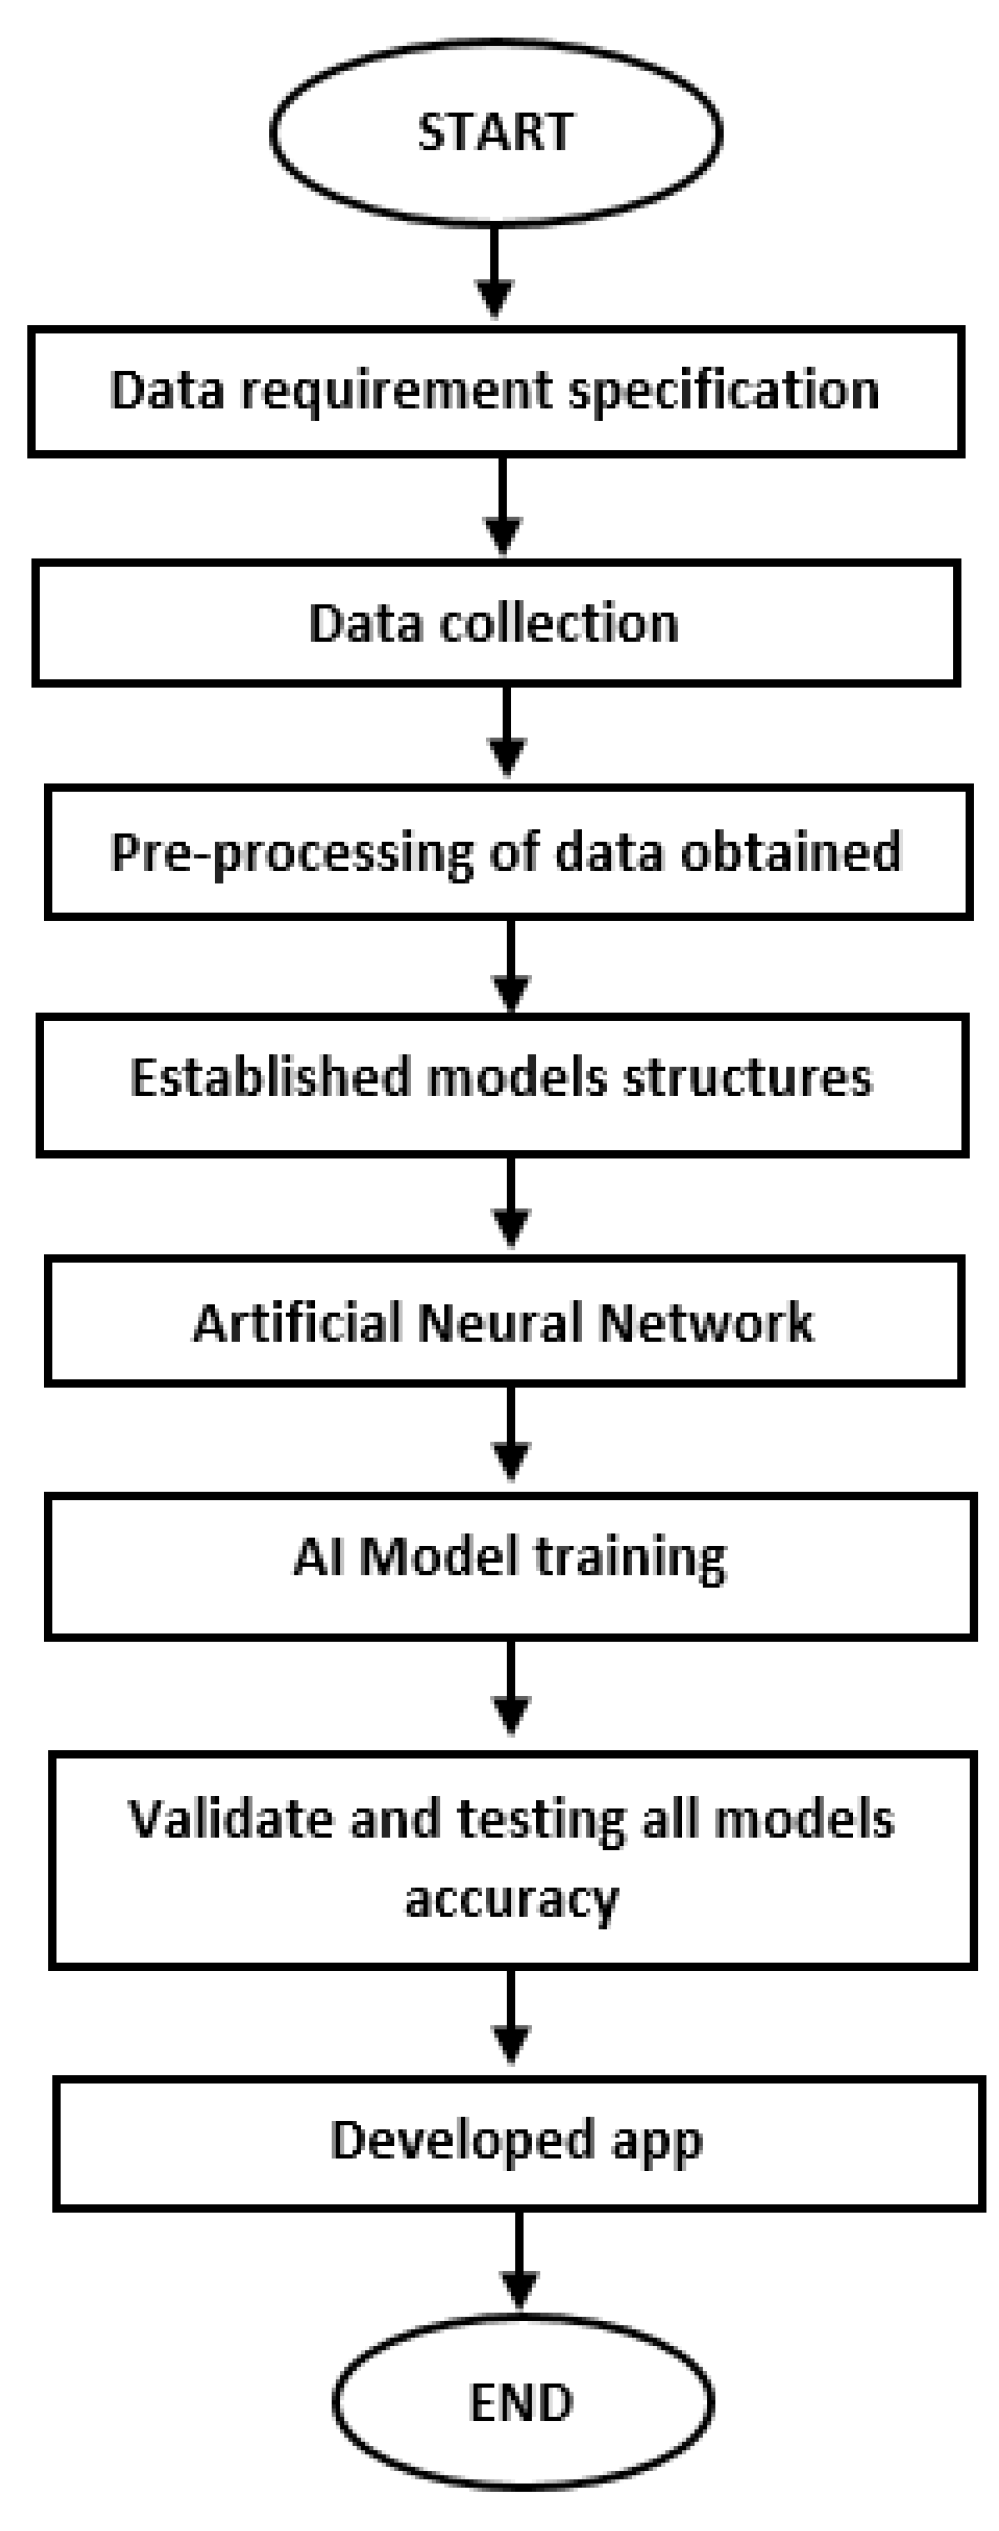
In addition, the raw historical data obtained were reorganised and cleaned to eliminate errors and outliers, before being normalised in the range of 0 to 1. Normalisation is important to avoid possible modelling errors since different datasets have different ranges of values [20]. Figure 2 shows the flowchart based on the research flow process of the study.
2.3. Artificial Neural Network (ANN) Model
In this study, ANN was used as the machine learning model to predict the water quality parameters. ANN model is not outlandish in the field of engineering and science, as it has been applied to several challenging and complex problems [24]. ANN is computationally inexpensive to train and high performance in the sense that it can forecast data without needing prior knowledge or an explicit pattern formalisation [25]. It works by developing a memory capable of correlating a considerable number of input patterns with a resulting set of yields, through the input, hidden, and output layers [26]. Although there is an abundance of machine learning models used to predict water quality parameters, ANN was chosen because it was the easiest model to be inserted into the app without having any complicated subroutines, compared with adaptive neuro-fuzzy inference system (ANFIS), support vector machine (SVM), and other machine learning models that needed more steps and codes to execute the output of the modelling. For a person who is not familiar with computer codes, the approach is indeed simple and trouble-free.
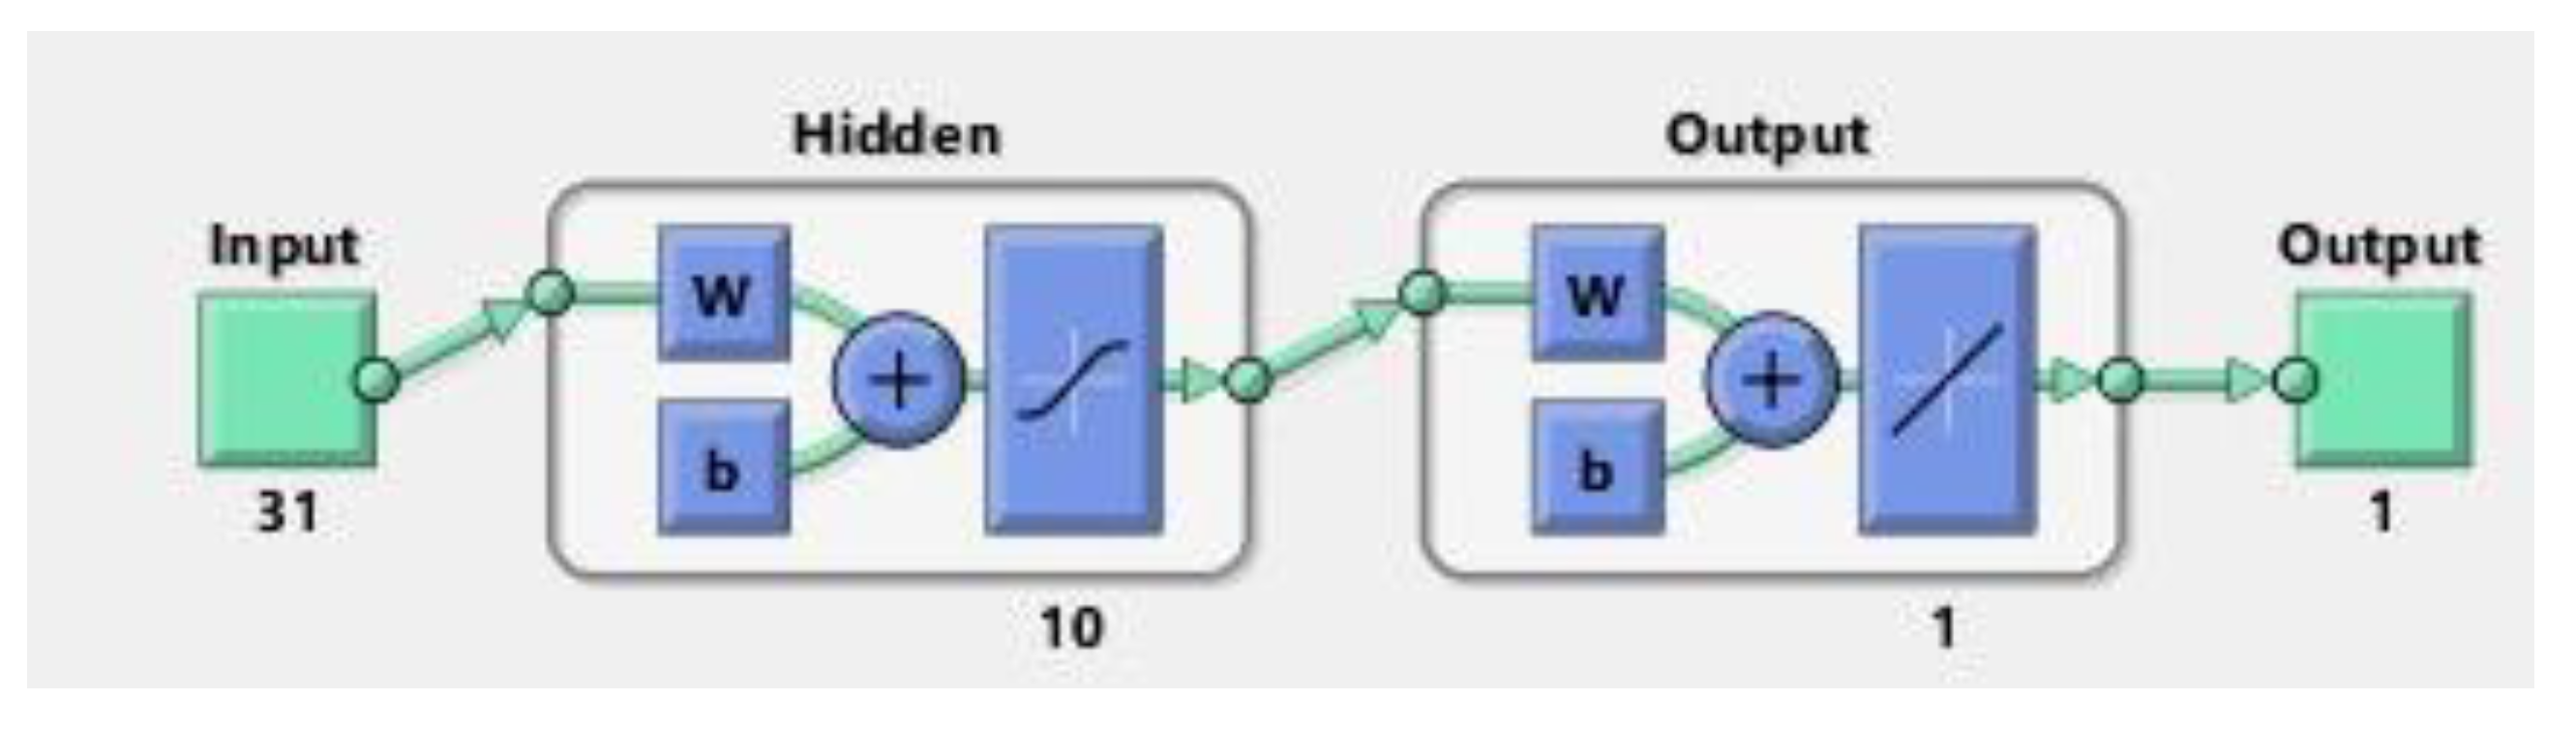
In this study, a neural network fitting application in MATLAB 2020b was used to develop the proposed ANN model. A two-layer feed-forward network with two different transfer functions was trained with the Lavenberg–Marquardt backpropagation algorithm (trainlm), where a sigmoid transfer function was used in the hidden neurons and a linear transfer function at the output neurons. The optimum number of hidden neurons was heuristically determined to be 10, which agrees with previous studies by Khan and Chai, and Ibrahim et al. [27,28]. For training, the data were randomly divided into three sets: 70% of the data were used for training the model, 15% of the data were used for validation, and the remaining 15% were used to test the model. Figure 3 shows the architecture of the ANN model for each of the water quality parameters.
2.4. Model Evaluation Metrics
After the predictions of the water quality parameters were made, the models were assessed using several performance evaluation metrics. A mean square error (MSE) was used to determine the mean of a set of errors, which is influenced by vertical distances between the data points and the regression line, also known as residuals. The lower the MSE, the greater the prediction of the developed models, making the line of best fit closer to being achieved. MSE is calculated using Equation (2) as follows:
where n is the number of items, Y is the observed y-value, and Y′ is the y-value from the regression. Meanwhile, root-mean-square error (RMSE) is the square root of the MSE that measures the concentration of data around the line of best fit, given by Equation (3) as follows:
On the other hand, the correlation coefficient (R) describes the relationship between two datasets, where R = 1 (R = −1) indicates a very strong positive (negative) relationship, whereas the data are not related if R = 0. The coefficient can be calculated by
RMSE is known to have a direct relationship with the correlation coefficient (R); if R = 1, then RMSE = 0, indicating that all the data points are located on the regression line, thus producing hypothetically perfect predictions. Additionally, the determination of coefficient (R2) determines the probability of future events that fall within the forecasted results obtained. Its values can be between 0 (0%) to 1 (100%); the higher the value, the higher the probability of the data points falling on the regression line, and therefore, the higher the chances of achieving the line of best fit.
Mean absolute deviation (MAD) and mean absolute percentage error (MAPE) were also applied to assess the performances of the proposed ANN model. Equations (5) and (6) are used to calculate the respective metrics.
2.5. App Development and Real-Time Modelling
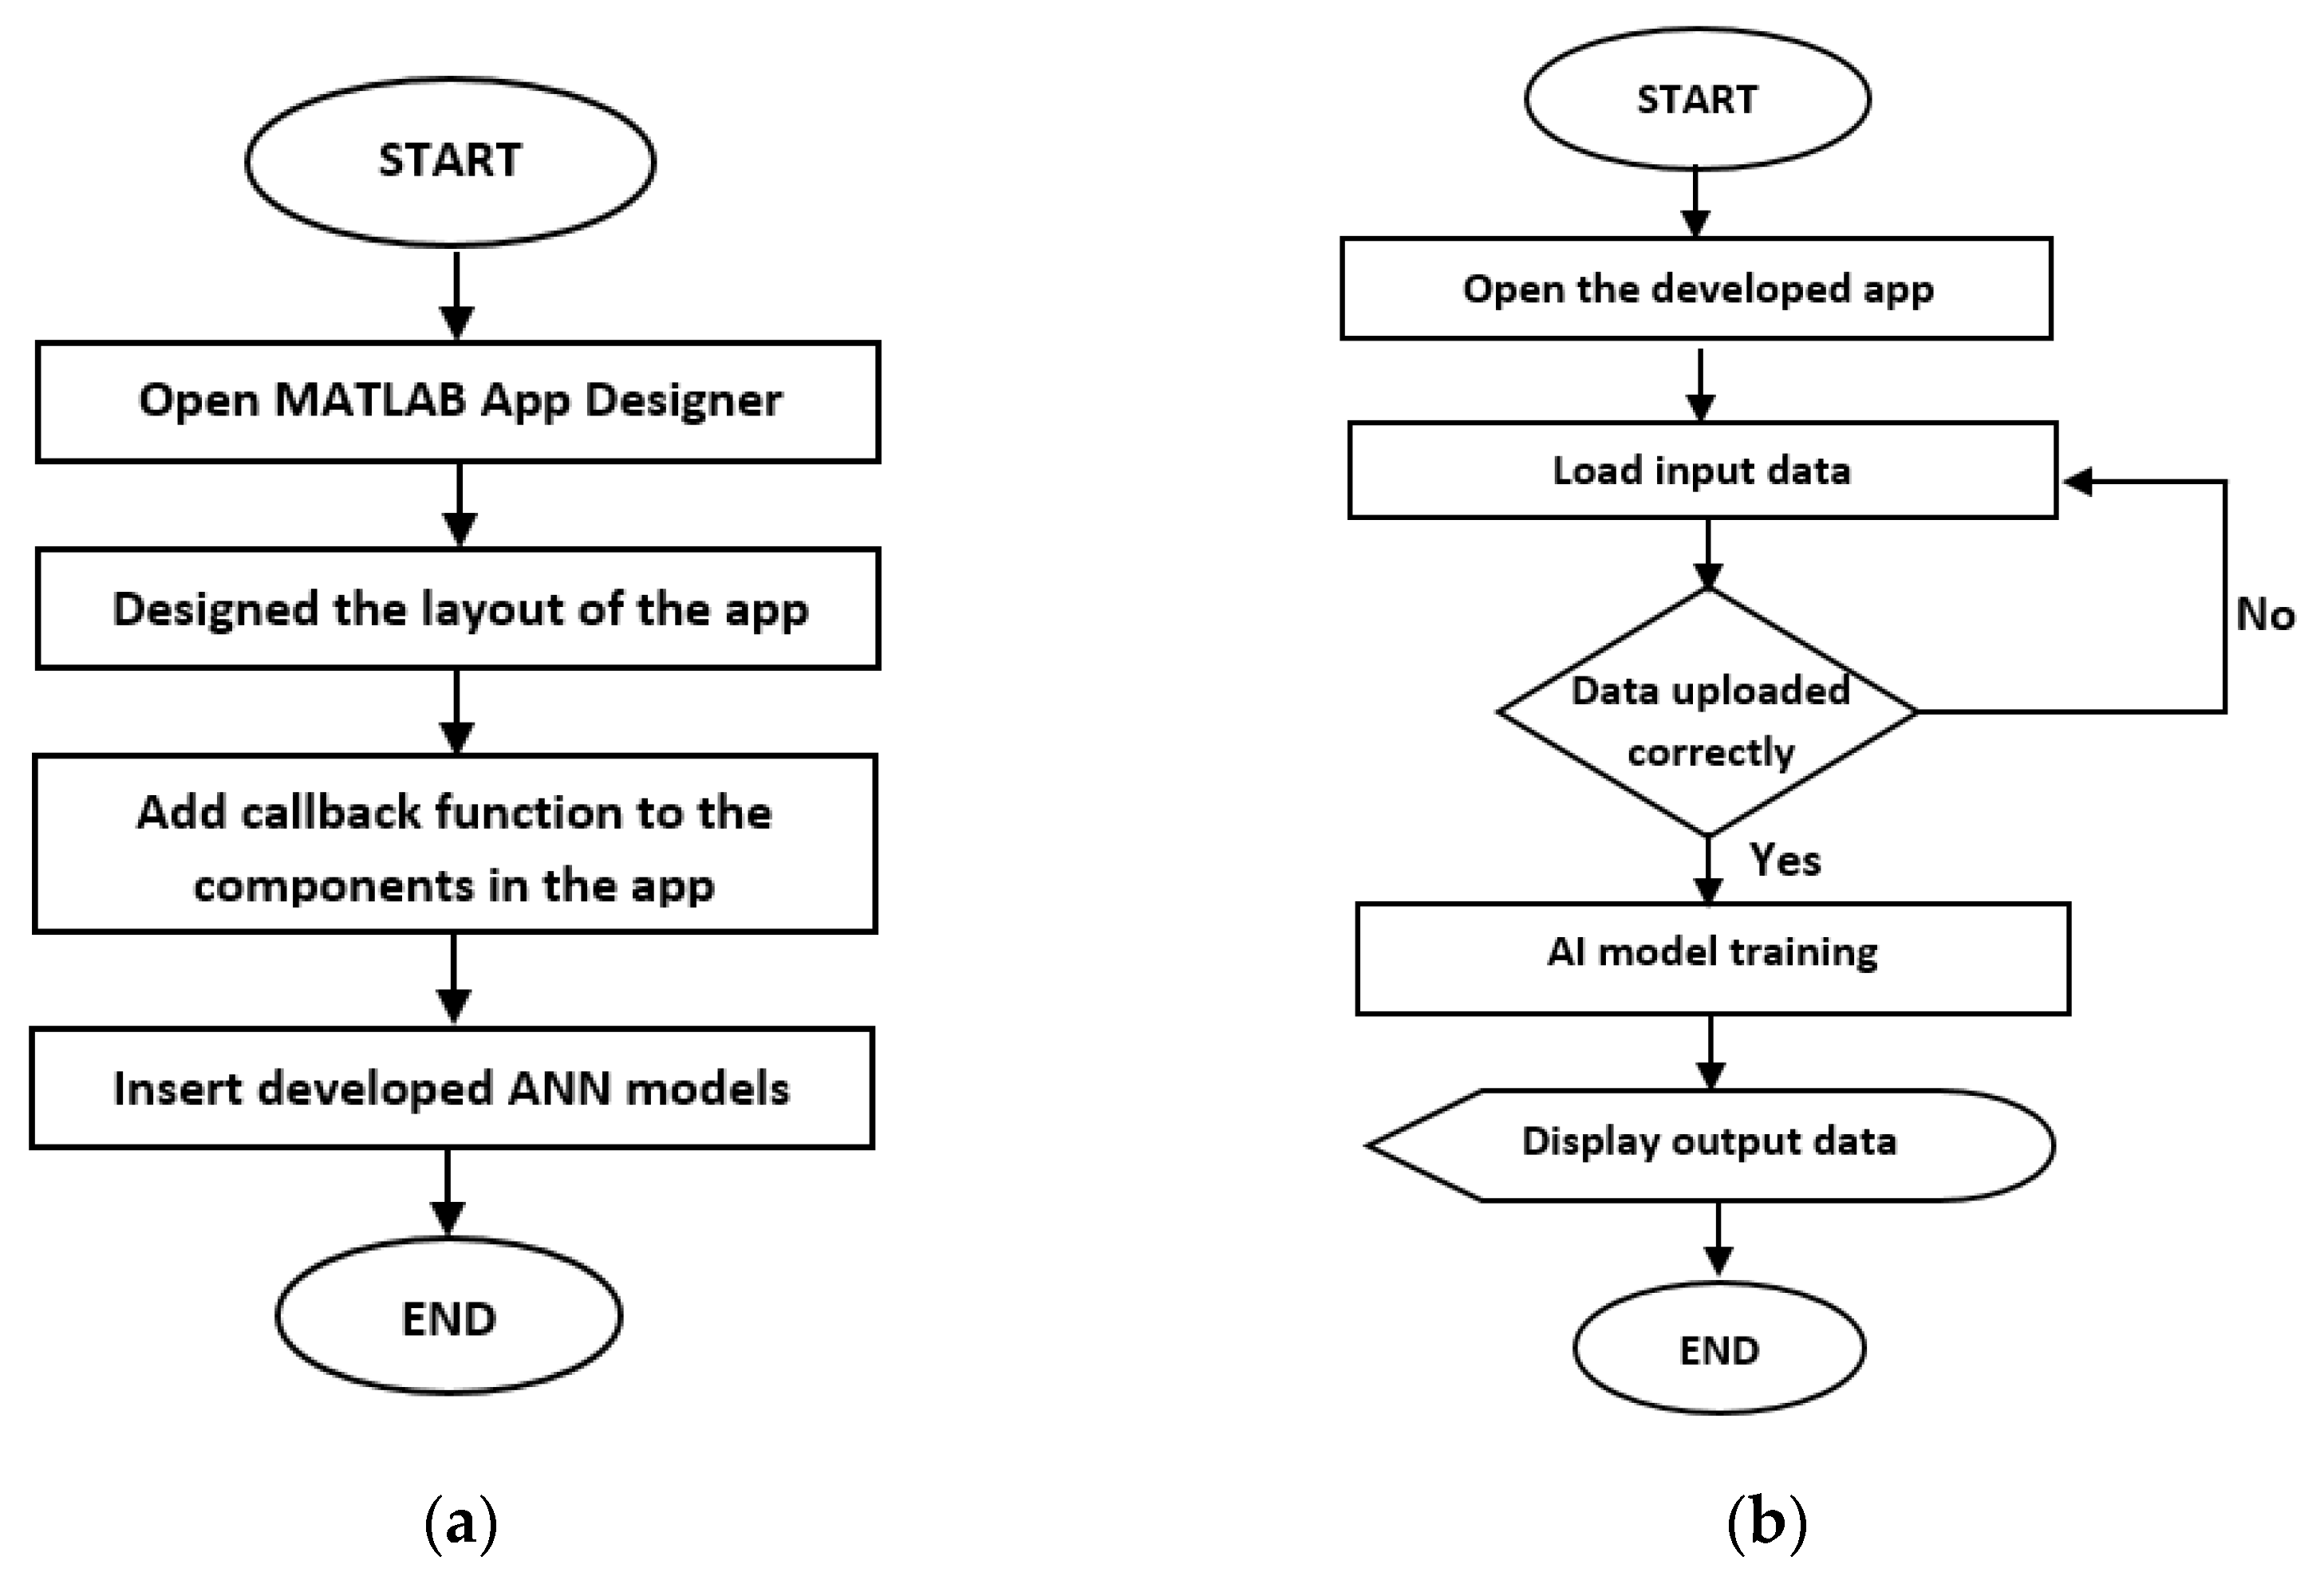
An app that is equipped with the constructed ANN models was developed in-house using MATLAB 2020b. The models were embedded in the app according to each water quality parameter. The app allows users to key in real-time data in the edit field of each parameter to conduct real-time modelling. Figure 4 shows a flowchart of (a) the app development process and (b) the real-time modelling app.
The app can be designed by clicking on the Design App, and a blank canvas was chosen to start designing the app. As for the design, the components of the app can be dragged from the component library to the blank canvas. All of the colours and fonts can be edited freely. The codes for each chosen component are automatically written in the code view section.
3. Results and Discussion
3.1. ANN Model Performances
Table 1 presents the model performance for each parameter obtained through testing and training datasets as inputs. In the training phase, all ANN models achieved very high values of R and R2, i.e., 0.9953–0.9999 and 0.9906–0.9998, respectively. In addition, all models also achieved low values for MSE and RMSE that were 2.5101 × 10⁻⁴ and 0.0158 or lower, respectively. Similarly, in the testing phase, all models exhibited good performance, with high values of R and R2, i.e., 0.9379–0.9986 and 0.8797–0.9972, whereas the MSE and RMSE values were 1.3199 × 10⁻³ and 0.0307 or lower, respectively. Therefore, all models were found to be able to predict the river water quality parameters with great accuracy and precision. Figure 5 shows the regression plots of the models with the best predictions based on training (no. 2, TSS) and testing (no.6, phosphate) sets as examples.
Table 2 shows the performances of the models after being evaluated using MAD and MAPE. From the table, all ANN models obtained small values for MAD that were less than the value of 0.1. As for MAPE, the models achieved low percentage error values in the range between 1.45% and 17.52%. ANN models that predicted phosphate and TSS were considered the best models, as both had the lowest percentage error. However, the rest of the models are still able to be utilised to predict the water quality parameters, as they obtained MAPE values of less than 20% and, therefore, are still considered good models. In a study conducted by Mustafa [29], ANNs were used to predict TDS at the Tigris River, Iraq. The results obtained from the research showed that the ANN with eight hidden neurons was highly accurate in forecasting TDS, with values of RMSE, R, and MAPE of 113.9%, 0.975%, and 11.51%, respectively. Thus, it showed that ANN models that obtained low MAPE values are able to accurately predict the water quality parameters. The results obtained, however, will vary depending on the number of hidden layers, nodes, and inputs, as well as the programming language (MATLAB, Python, etc.) and statistical parameters used for the modelling [30].
3.2. Sensitivity Analysis of the ANN Models
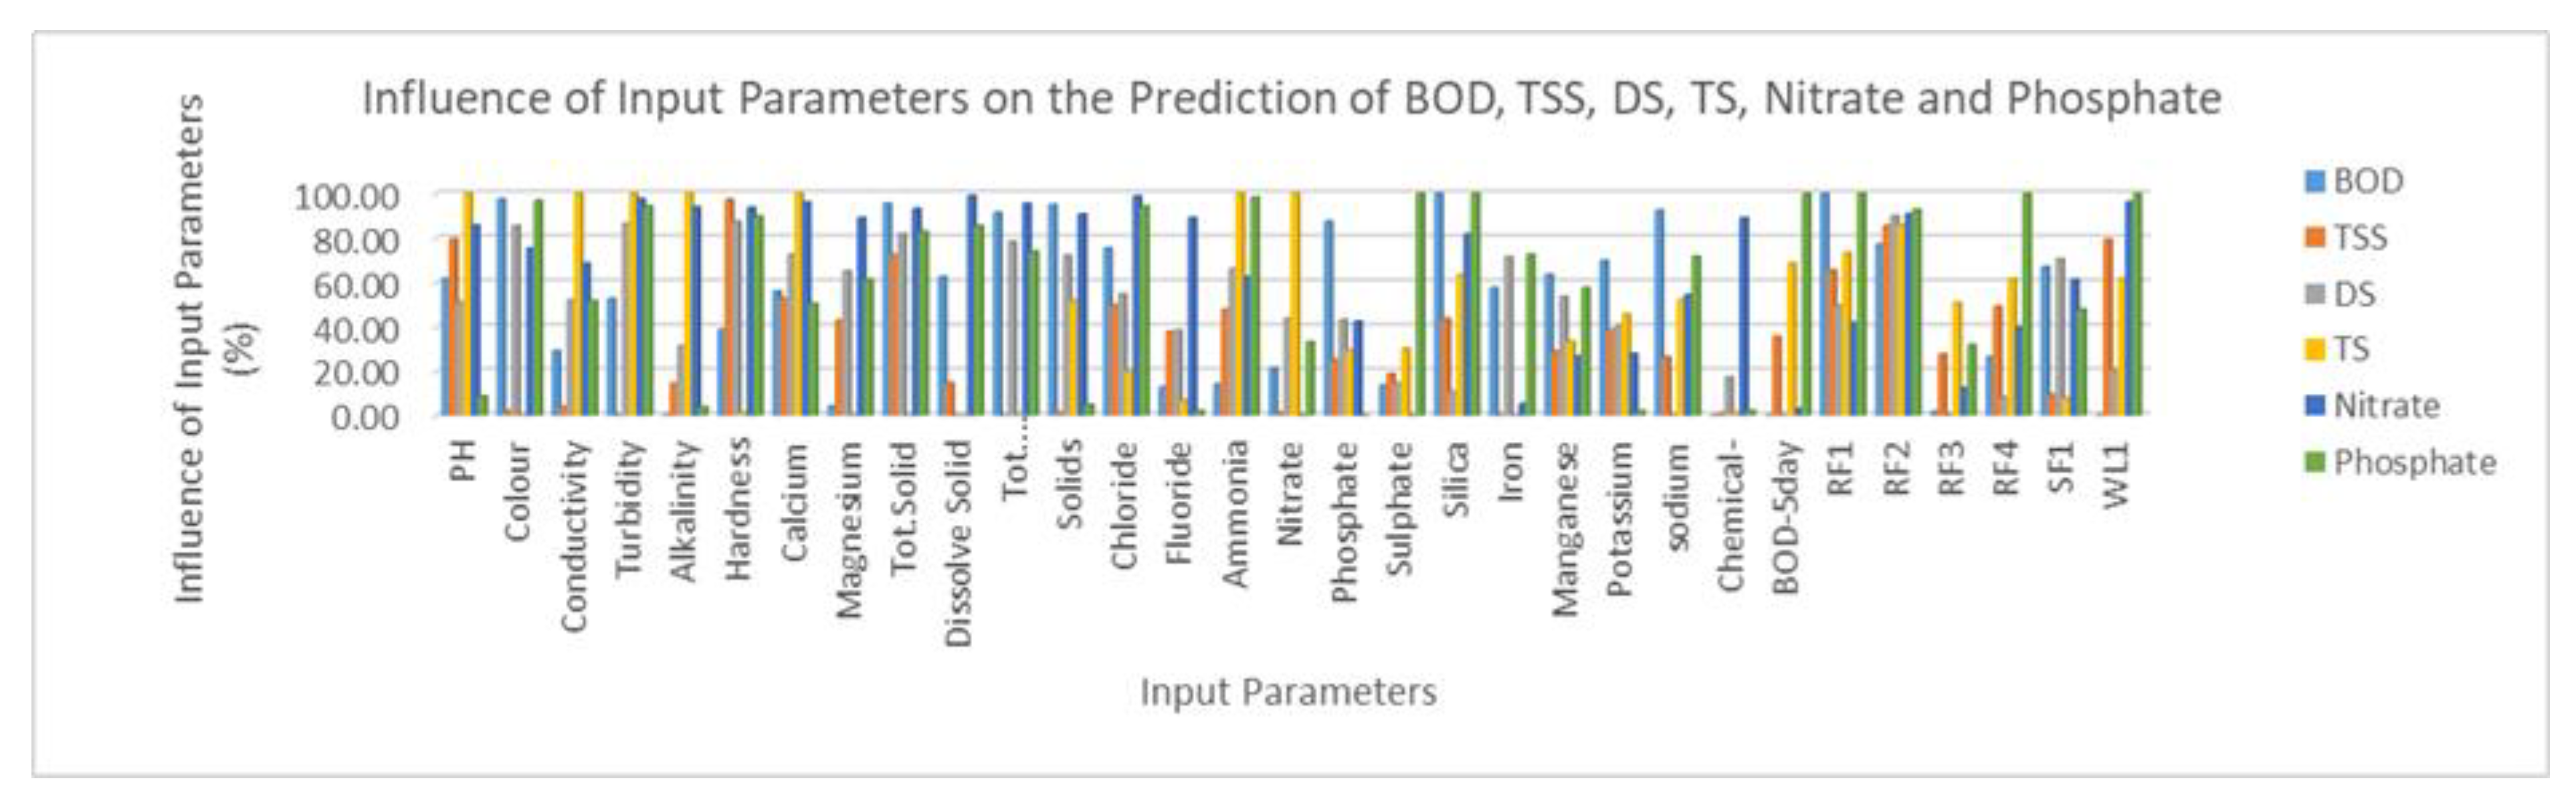
Sensitivity analysis was conducted in order to determine which input parameters have the most influence in predicting the six water quality parameters, viz. BOD, TSS, DS, TS, nitrate, and phosphate. Based on Figure 6, each input parameter has a different percent of influence on the prediction of the six respective water quality parameters. For example, colour, total solids, DS, TDS, phosphate, silica, sodium, and rainfall were the input parameters that had the greatest influence on the prediction of BOD. However, hardness and rainfall were the input parameters that had levels of influence of more than 80% in predicting TSS. As for DS prediction, turbidity, hardness, and rainfall influenced the modelling the most. pH, conductivity, turbidity, and rainfall, on the other hand, were the most important variables needed in the prediction of DS. All of the inputs proved to contribute to predicting nitrate and phosphate, but rainfall seems to be the key input in the modelling. Therefore, it can be concluded that rainfall data were the most important input for all models, but each and every input parameter also contributed and is important in the prediction of the six water quality parameters. Figure 6 shows the influence of each input variable on the modelling.
3.3. Developed App
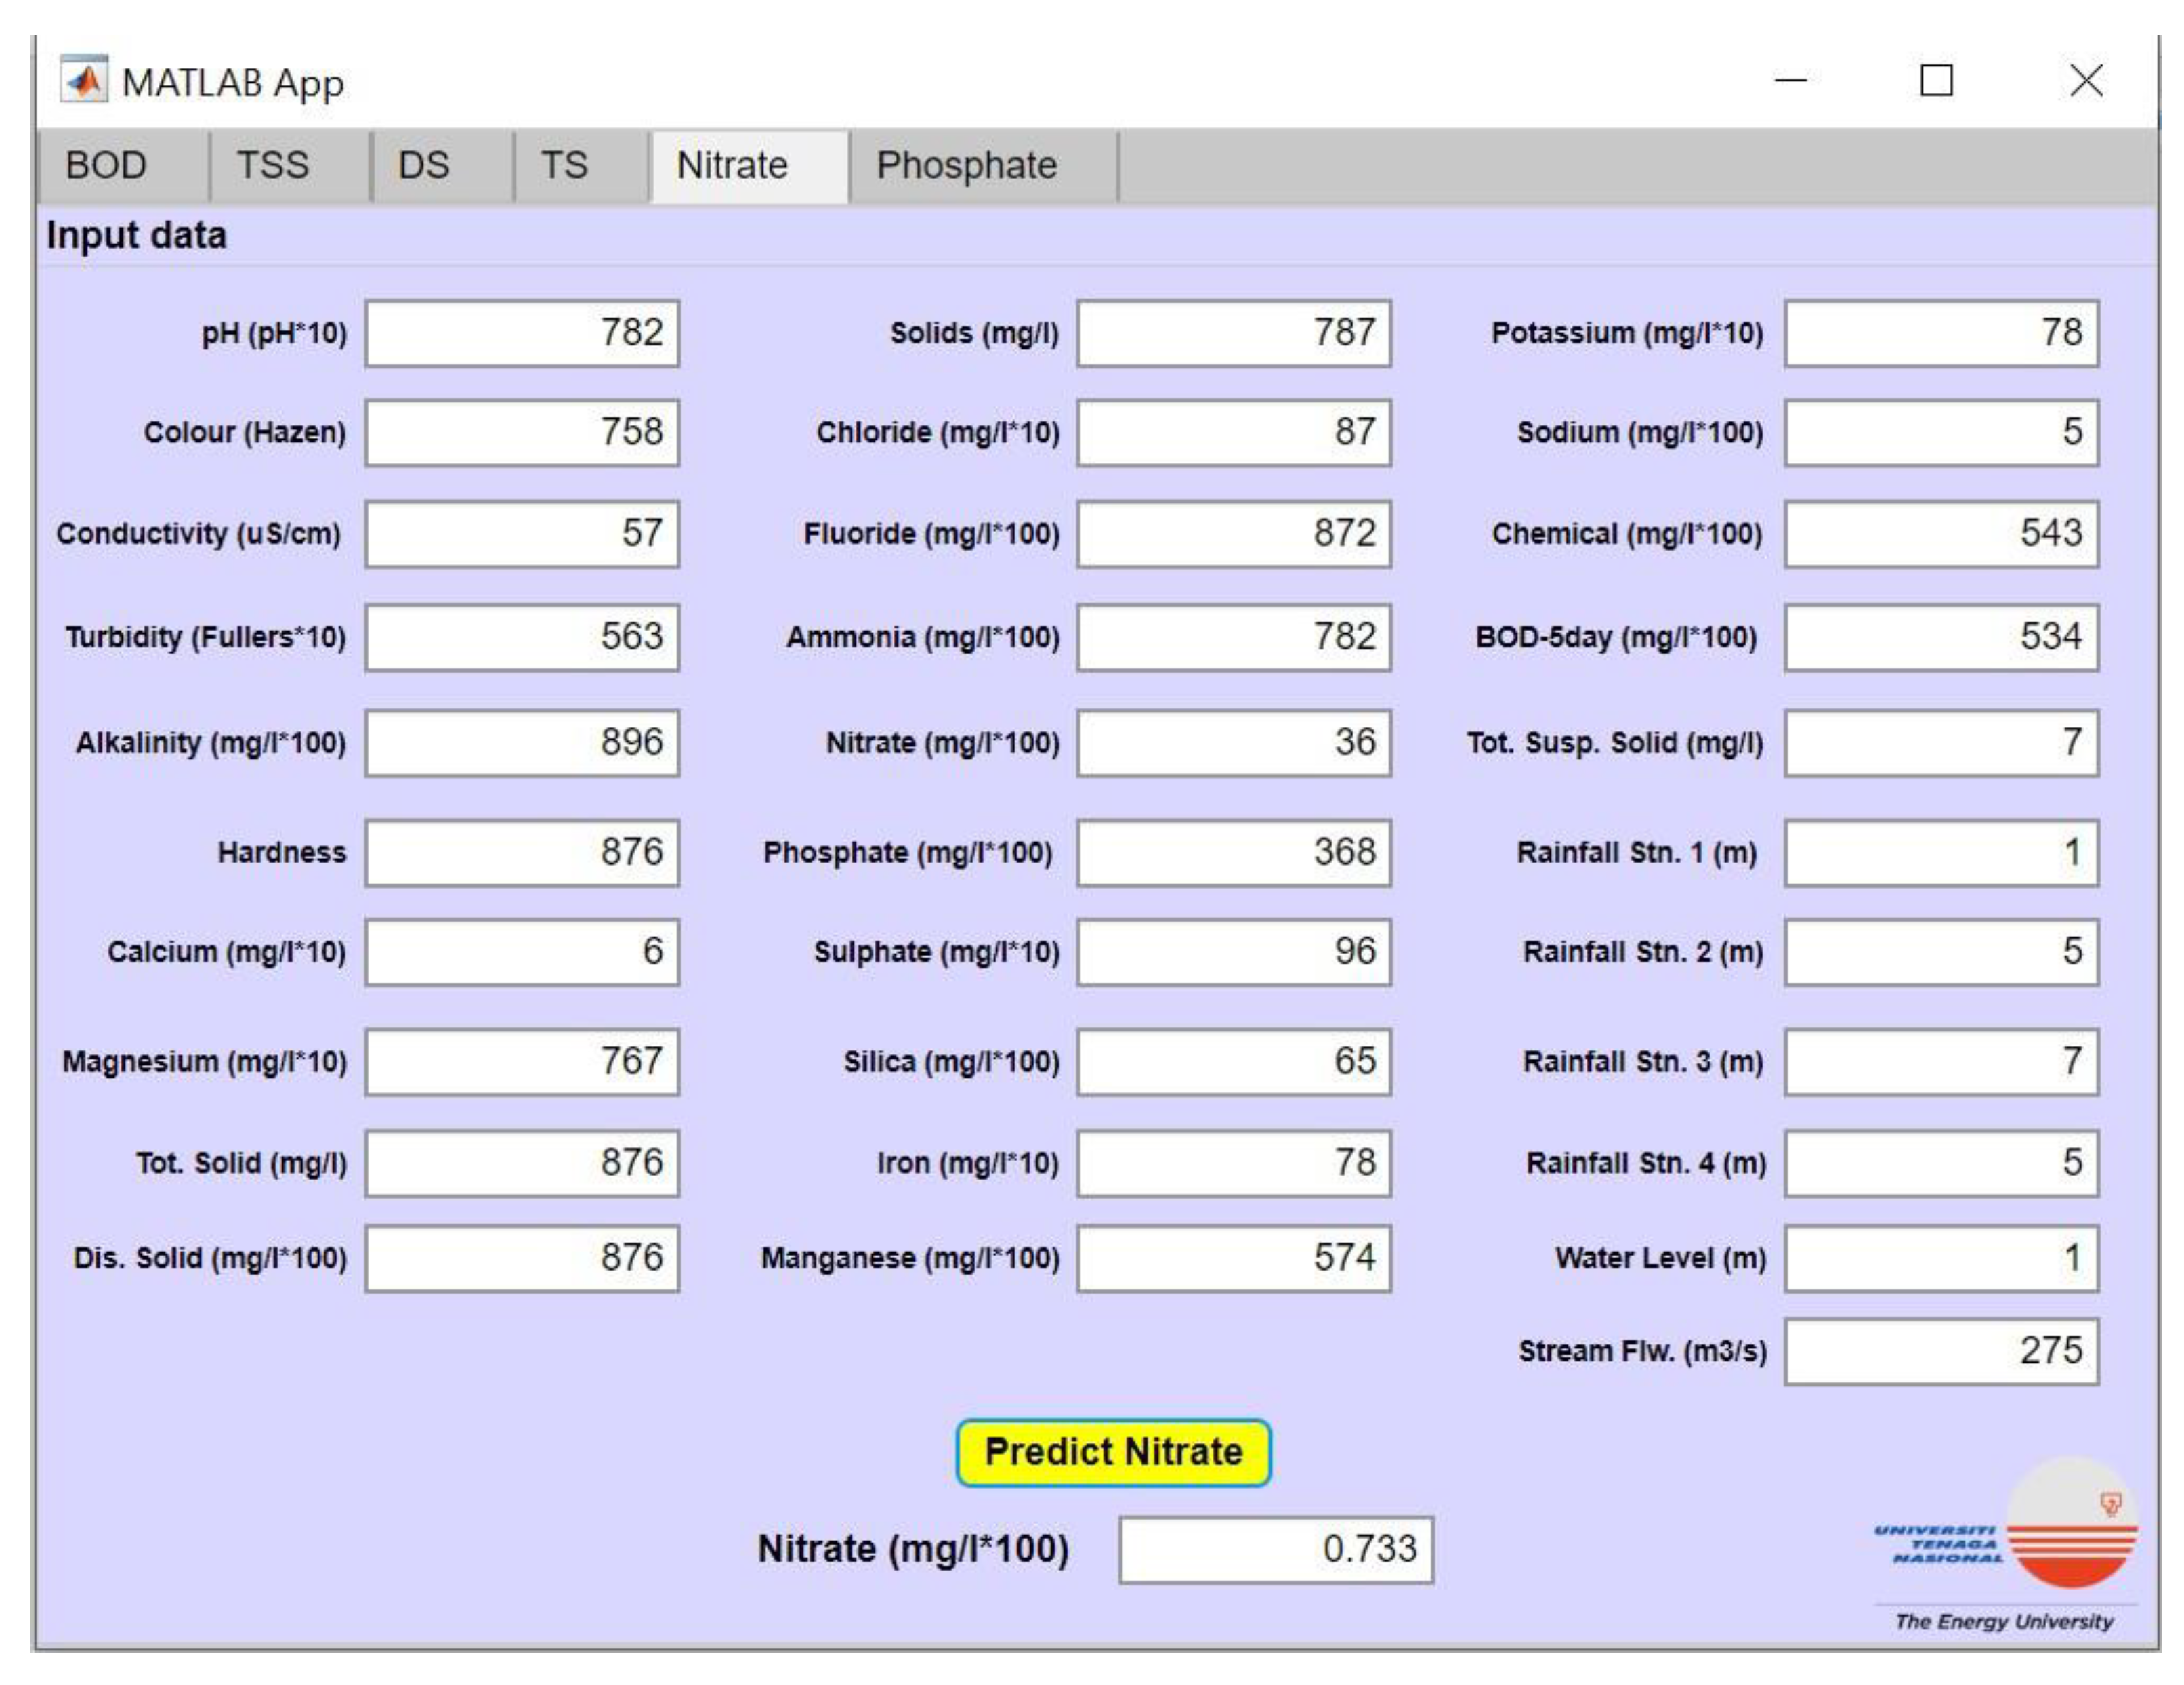
The developed app has six tabs that correspond to the water quality parameters (i.e., BOD5, TSS, TS, DS, nitrate, and phosphate), which facilitate the user to predict the parameters with ease. Upon switching to a tab, the user can key in real-time data in the respective parameter edit fields to initiate a prediction. Figure 7 illustrates the interface of the app where it was demonstrated the prediction of nitrate value based on input values.
There is an abundance of research conducted based on WSN and IoT to predict real-time river water quality parameters. For example, Palwe and Bhosale designed and developed a low-cost system for real-time monitoring of water quality using IoT. The system consists of four sensors—pH sensor, water flow sensor, temperature sensor, and turbidity sensor. The measured values from the sensor can then be processed by a core controller, which was the Raspberry Pi. Lastly, the sensor data can be viewed on the internet via cloud computing. The results obtained were good, as the data obtained from the sensors were normal [31]. Daigavane and Gaikwad also used a similar approach. They used IoT to monitor the water quality, but the difference was that they used an Arduino model as the core controller, and the data obtained from the sensor can be viewed on the internet using a Wi-Fi module [32].
Furthermore, Amruta and Satish monitored water quality using WSN technology that is powered by solar panels. The nodes and base station were connected using Zigbee, a WSN technology. The values collected by several sensors at the node side—namely, turbidity, oxygen level, and pH—were sent via WSN to the base station. Moreover, the base station is normally a PC with a graphic user interface (GUI) for the users to alarm or analyse the water quality when the value that has been detected is below the present standard. The recorded data were analysed using MATLAB software. Based on the results, the authors successfully monitored the water quality using WSN powered by solar panels [33].
On the other hand, in their research, Koditala and Pandey proposed a low-cost water quality monitoring system using IoT along with machine learning and cloud computing. This system contains several sensors—namely, a turbidity sensor, a temperature sensor, and actuators (heater and cooler LEDs)—to measure the chemical composition of water. Then, sensor data were passed to the NodeMCU microcontroller, which has an inbuilt Wi-Fi module, through the use of which data were passed over to an Azure Event Hub. From there, the data were stored in the form of structured data in an Azure Storage Hub. A Microsoft platform called PowerBI was used to display sensor data in the form of a Web page. Moreover, machine learning was used to predict weather conditions using previously labelled datasets and manage the cooler and heater according to external weather conditions. An email alert is sent to the concerned authorities to inform them of the situation whenever the value of turbidity reaches a predefined threshold. The study obtained an R2 score of 0.933 based on the model that they used [34].
Previous research regarding WSN and IoT in river water quality prediction has achieved satisfying results and is able to be used easily. However, there has been no research conducted to predict real-time water quality parameters using machine learning models together with an app. This current study does not require complicated subroutines, and even a layman is able to conduct the prediction, as the app was designed in a simple manner. The developed app is also able to be used in the WSN system, which means it can minimise time consumption and help decision makers quickly respond by receiving immediate results.
4. Conclusions
In this study, six different water quality parameters were predicted using an artificial neural network (ANN), and a graphic user interface (app) was developed based on the constructed ANN models. The study area was located at Langat River, Malaysia, using 25 water quality parameters and 6 hydrological parameters as inputs of the modelling, to predict biochemical oxygen demand (BOD5), total suspended solids (TSS), dissolved solids (DS), total solids (TS), nitrate, and phosphate. Root-mean-square error (RMSE), mean square error (MSE), mean absolute deviation (MAD), mean absolute percentage error (MAPE), determination of coefficient (R2), and correlation coefficient (R) were applied to assess the performance of the models. The following conclusions were obtained from the study:
- ANNs can be utilised to predict different types of water quality parameters using a large number of inputs;
- The outcomes obtained showed that the ANN models have high performance, with R > 0.90 and R2 > 0.85 in both training and testing datasets, for the predictions of all six water quality parameters;
- All of the developed ANN models obtained low values of MAD and MAPE, with MAD < 0.10 and MAPE < 20% error for all datasets;
- Each input parameter had a different level of influence on the prediction of the six water quality parameters, but rainfall data seems to be the key input parameter that needs to be included in all of the models to predict the respective water quality parameters;
- The app was also able to operate to predict water quality parameters by embedding the developed ANN models that were trained by using the historical data obtained;
- Future studies with different machine learning predictive models or more advanced models such as extreme machine learning and hybrid models are recommended as continuations of the present study.
Author Contributions
Formal analysis, N.N.M.R.; methodology, N.N.M.R. and G.H.; writing—original draft preparation, N.N.M.R.; writing—review and editing, N.N.M.R., G.H., and K.A.Y.; Software, N.N.M.R., G.H., and K.A.Y. All authors have read and agreed to the published version of the manuscript.
Funding
This research was funded by the Ministry of Higher Education Fundamental Research Grant Scheme (FRGS), with the project code 20190105FRGS, and Universiti Tenaga Nasional (UNITEN) BOLD Publication Fund 2022.
Institutional Review Board Statement
Not applicable.
Informed Consent Statement
Not applicable.
Data Availability Statement
Not applicable.
Conflicts of Interest
The authors declare no conflict of interest.
References
- Hayder, G.; Kurniawan, I.; Mustafa, H.M. Implementation of machine learning methods for monitoring and predicting water quality parameters. Biointerf. Res. Appl. Chem. 2021, 11, 9285–9295. [Google Scholar]
- Hayder, G.; Solihin, M.I.; Mustafa, H.M. Modelling of River Flow Using Particle Swarm Optimized Cascade-Forward Neural Networks: A Case Study of Kelantan River in Malaysia. Appl. Sci. 2020, 10, 8670. [Google Scholar] [CrossRef]
- Ighalo, J.O.; Adeniyi, A.G. A comprehensive review of water quality monitoring and assessment in Nigeria. Chemosphere 2020, 260, 127569. [Google Scholar] [CrossRef] [PubMed]
- Ewaid, S.; Abed, S.; Al-Ansari, N.; Salih, R. Development and Evaluation of a Water Quality Index for the Iraqi Rivers. Hydrology 2020, 7, 67. [Google Scholar] [CrossRef]
- Sami, B.H.Z.; Khai, W.J.; Fai, C.M.; Essam, Y.; Ahmed, A.N.; El-Shafie, A. Investigating the reliability of machine learning algorithms as a sustainable tool for total suspended solid prediction. Ain Shams Eng. J. 2021, 12, 1607–1622. [Google Scholar] [CrossRef]
- Ahmed, A.N.; Othman, F.B.; Afan, H.A.; Ibrahim, R.K.; Fai, C.M.; Hossain, S.; Ehteram, M.; Elshafie, A. Machine learning methods for better water quality prediction. J. Hydrol. 2019, 578, 124084. [Google Scholar] [CrossRef]
- Yaseen, Z.M.; Jaafar, O.; Deo, R.C.; Kisi, O.; Adamowski, J.; Quilty, J.; El-Shafie, A. Stream-flow forecasting using extreme learning machines: A case study in a semi-arid region in Iraq. J. Hydrol. 2016, 542, 603–614. [Google Scholar] [CrossRef]
- Nourani, V.; Paknezhad, N.J.; Sharghi, E.; Khosravi, A. Estimation of prediction interval in ANN-based multi-GCMs downscaling of hydro-climatologic parameters. J. Hydrol. 2019, 579, 124226. [Google Scholar] [CrossRef]
- Dogan, E.; Sengorur, B.; Koklu, R. Modeling biological oxygen demand of the Melen River in Turkey using an artificial neural network technique. J. Environ. Manag. 2009, 90, 1229–1235. [Google Scholar] [CrossRef]
- Sarkar, A.; Pandey, P. River Water Quality Modelling Using Artificial Neural Network Technique. Aquat. Procedia 2015, 4, 1070–1077. [Google Scholar] [CrossRef]
- Nasirudin, M.A.; Za’Bah, U.N.; Sidek, O. Fresh water real-time monitoring system based on Wireless Sensor Network and GSM. In Proceedings of the 2011 IEEE Conference on Open Systems, Langkawi, Malaysia, 25–28 September 2011; pp. 354–357. [Google Scholar]
- Menon, K.U.; Divya, P.; Ramesh, M.V. Wireless sensor network for river water quality monitoring in India. In Proceedings of the 2012 Third International Conference on Computing, Communication and Networking Technologies (ICCCNT’12), Coimbatore, India, 26–28 July 2012; pp. 1–7. [Google Scholar]
- Wang, Z.; Wang, Q.; Hao, X. The Design of the Remote Water Quality Monitoring System Based on WSN. In Proceedings of the 2009 5th International Conference on Wireless Communications, Networking and Mobile Computing, Beijing, China, 24–26 September 2009; pp. 1–4. [Google Scholar]
- Kageyama, T.; Miura, M.; Maeda, A.; Mori, A.; Lee, S.-S. A wireless sensor network platform for water quality monitoring. In Proceedings of the 2016 IEEE Sensors, Orlando, FL, USA, 30 October–3 November 2016; pp. 1–3. [Google Scholar]
- Hasib, N.A.; Othman, Z. Assessing the Relationship between Pollution Sources and Water Quality Parameters of Sungai Langat Basin using Association Rule Mining. Sains Malays. 2020, 49, 2345–2358. [Google Scholar] [CrossRef]
- Hassim, M.; Yuzir, A.; Razali, M.N.; Ros, F.C.; Chow, M.F.; Othman, F. Comparison of Rainfall Interpolation Methods in Langat River Basin. IOP Conf. Ser. Earth Environ. Sci. 2020, 479, 012018. [Google Scholar] [CrossRef]
- Saudi, A.; Kamarudin, M.; Ridzuan, I.; Ishak, R.; Azid, A.; Rizman, Z. Flood risk index pattern assessment: Case study in Langat River Basin. J. Fundam. Appl. Sci. 2018, 9, 12. [Google Scholar] [CrossRef] [Green Version]
- Noorazuan, M.H.; Rainis, R.; Juahir, H.; Zain, S.M.; Jaafar, N. GIS application in evaluating land use-land cover change and its impact on hydrological regime in Langat River basin, Malaysia. In Proceedings of the 2nd Annual Asian Conference of Map Asia, Kuala Lumpur, Malaysia, 14–15 October 2003; pp. 14–15. [Google Scholar]
- Yusof, N.F.; Lihan, T.; Idris, W.M.R.; Rahman, Z.A.; Mustapha, M.A.; Yusof, M.A.W. Spatially distributed soil losses and sediment yield: A case study of Langat watershed, Selangor, Malaysia. J. Southeast Asian Earth Sci. 2021, 212, 104742. [Google Scholar] [CrossRef]
- Rizal, N.N.M.; Hayder, G.; Yussof, S. River water quality prediction and analysis—deep learning predictive models approach. In Advances in Science, Engineering, and Technology (ASTI); Submitted for Review; Springer: Berlin/Heidelberg, Germany, 2020. [Google Scholar]
- Soo, E.Z.X.; Jaafar, W.Z.W.; Lai, S.H.; Othman, F.; Elshafie, A.; Islam, T.; Hadi, H.S.O. Evaluation of bi-as-adjusted satellite precipitation estimations for extreme flood events in Langat river basin, Malaysia. Hydrol. Res. 2020, 51, 105–126. [Google Scholar] [CrossRef]
- Mohammed, T.A.; Al-Hassoun, S.; Ghazali, A.H. Prediction of flood levels along a stretch of the langat river with insufficient hydrological data. Pertanika J. Sci. Technol. 2011, 19, 237–248. [Google Scholar]
- Saudi, A.S.M.; Juahir, H.; Azid, A.; Toriman, M.E.; Kamarudin, M.K.A.; Saudi, M.M.; Mustafa, A.D.; Amran, M.A. Flood risk pattern recognition by using environmetric technique: A case study in langat river basin. J. Teknol. 2015, 77. [Google Scholar] [CrossRef] [Green Version]
- Shahmansouri, A.A.; Yazdani, M.; Hosseini, M.; Bengar, H.A.; Ghatte, H.F. The prediction analysis of compressive strength and electrical resistivity of environmentally friendly concrete incorporating natural zeolite using artificial neural net-work. Constr. Build. Mater. 2022, 317, 125876. [Google Scholar] [CrossRef]
- Burchard-Levine, A.; Liu, S.; Vince, F.; Li, M.; Ostfeld, A. A hybrid evolutionary data driven model for river water quality early warning. J. Environ. Manag. 2014, 143, 8–16. [Google Scholar] [CrossRef]
- Ahmed, A.M. Prediction of dissolved oxygen in Surma River by biochemical oxygen demand and chemical oxygen demand using the artificial neural networks (ANNs). J. King Saud Univ. Eng. Sci. 2017, 29, 151–158. [Google Scholar] [CrossRef] [Green Version]
- Khan, Y.; Chai, S.S. Ensemble of ANN and ANFIS for water quality prediction and analysis-a data driven approach. J. Telecommun. Electron. Comput. Eng. 2017, 9, 117–122. [Google Scholar]
- Ibrahim, R.K.; Fiyadh, S.S.; AlSaadi, M.A.; Hin, L.S.; Mohd, N.S.; Ibrahim, S.; Afan, H.A.; Fai, C.M.; Ahmed, A.N.; Elshafie, A. Feedforward Artificial Neural Network-Based Model for Predicting the Removal of Phenolic Compounds from Water by Using Deep Eutectic Solvent-Functionalized CNTs. Molecules 2020, 25, 1511. [Google Scholar] [CrossRef] [PubMed] [Green Version]
- Mustafa, A.S. Artificial neural networks modeling of total dissolved solid in the selected locations on tigris river, iraq. J. Eng. 2015, 21, 162–179. [Google Scholar]
- Rizal, N.N.M.; Hayder, G. River water quality prediction using artificial intelligence approach: Literature review. J. Energy Environ. 2020, 12, 1–7. [Google Scholar]
- Palwe, S.S.; Bhosale, J.D. The real time water quality monitoring system based on iot platform. Int. J. S Res. Sci. Eng. Technol. 2018, 4, 434–442. [Google Scholar]
- Daigavane, V.V.; Gaikwad, M.A. Water quality monitoring system based on IoT. Adv. Wirel. Mob. Comun. 2017, 10, 1107–1116. [Google Scholar]
- Amruta, M.K.; Satish, M.T. Solar powered water quality monitoring system using wireless sensor network. In Proceedings of the 2013 International Mutli-Conference on Automation, Computing, Communication, Control and Compressed Sensing (iMac4s), Kottayam, India, 22–23 March 2013; pp. 281–285. [Google Scholar]
- Koditala, N.K.; Pandey, P.S. Water Quality Monitoring System Using IoT and Machine Learning. In Proceedings of the 2018 International Conference on Research in Intelligent and Computing in Engineering (RICE), San Salvador, El Salvador, 22–24 August 2018; pp. 1–5. [Google Scholar]
Figure 1.
The statistical analysis of the water quality parameters of Langat River.

Figure 2.
The flowchart based on the research.

Figure 3.
The architecture of the ANN model for each water quality parameter.

Figure 4.
The flowcharts of (a) the app development process and (b) the real-time modelling app.

Figure 5.
Regression plots of (a) model 2 and (b) model 6.

Figure 6.
Influence of the input parameters on the prediction of the respective water quality parameters.
Figure 6.
Influence of the input parameters on the prediction of the respective water quality parameters.

Figure 7.
The app developed based on real-time data.


Table 1.
Prediction analysis for all models (training and testing datasets).
| Model No. | Parameter | Unit | R | R2 | MSE | RMSE |
|---|---|---|---|---|---|---|
| Training dataset | ||||||
| 1 | BOD5 | mg/L × 100 | 0.9999 | 0.9998 | 6.6655 × 10⁻⁹ | 8.1643 × 10⁻⁵ |
| 2 | TSS | mg/L | 0.9999 | 0.9998 | 8.1599 × 10⁻¹⁶ | 2.8566 × 10⁻⁸ |
| 3 | DS | mg/L × 100 | 0.9999 | 0.9998 | 2.1560 × 10⁻¹¹ | 4.6433 × 10⁻⁶ |
| 4 | TS | mg/L | 0.9953 | 0.9906 | 2.5101 × 10⁻⁴ | 0.0158 |
| 5 | Nitrate | mg/L × 100 | 0.9999 | 0.9998 | 4.8329 × 10⁻¹¹ | 6.9519 × 10⁻⁶ |
| 6 | Phosphate | mg/L × 100 | 0.9999 | 0.9998 | 2.3320 × 10⁻¹¹ | 4.8291 × 10⁻⁶ |
| Testing dataset | ||||||
| 1 | BOD5 | mg/L × 100 | 0.9379 | 0.8797 | 2.9687 × 10⁻⁴ | 0.0172 |
| 2 | TSS | mg/L | 0.9984 | 0.9968 | 6.0338 × 10⁻⁵ | 7.7678 × 10⁻³ |
| 3 | DS | mg/L × 100 | 0.9985 | 0.9970 | 5.4759 × 10⁻⁵ | 7.3999 × 10⁻³ |
| 4 | TS | mg/L | 0.9944 | 0.9888 | 3.8300 × 10⁻⁴ | 0.0196 |
| 5 | Nitrate | mg/L × 100 | 0.9886 | 0.9773 | 9.4506 × 10⁻⁴ | 0.0307 |
| 6 | Phosphate | mg/L × 100 | 0.9986 | 0.9972 | 1.3199 × 10⁻³ | 0.0363 |
Table 2.
Prediction analysis for all models (overall datasets).
| Model No. | Parameter | Unit | MAD | MAPE (%) |
|---|---|---|---|---|
| 1 | BOD5 | mg/L × 100 | 0.0019 | 4.55 |
| 2 | TSS | mg/L | 0.0026 | 1.57 |
| 3 | DS | mg/L × 100 | 0.0016 | 17.52 |
| 4 | TS | mg/L | 0.0147 | 13.92 |
| 5 | Nitrate | mg/L × 100 | 0.0043 | 15.81 |
| 6 | Phosphate | mg/L × 100 | 0.0014 | 1.45 |
Publisher’s Note: MDPI stays neutral with regard to jurisdictional claims in published maps and institutional affiliations. |
© 2022 by the authors. Licensee MDPI, Basel, Switzerland. This article is an open access article distributed under the terms and conditions of the Creative Commons Attribution (CC BY) license (https://creativecommons.org/licenses/by/4.0/).
Share and Cite
MDPI and ACS Style
Rizal, N.N.M.; Hayder, G.; Yusof, K.A. Water Quality Predictive Analytics Using an Artificial Neural Network with a Graphical User Interface. Water 2022, 14, 1221. https://doi.org/10.3390/w14081221
AMA Style
Rizal NNM, Hayder G, Yusof KA. Water Quality Predictive Analytics Using an Artificial Neural Network with a Graphical User Interface. Water. 2022; 14(8):1221. https://doi.org/10.3390/w14081221
Chicago/Turabian StyleRizal, Nur Najwa Mohd, Gasim Hayder, and Khairul Adib Yusof. 2022. "Water Quality Predictive Analytics Using an Artificial Neural Network with a Graphical User Interface" Water 14, no. 8: 1221. https://doi.org/10.3390/w14081221
Note that from the first issue of 2016, this journal uses article numbers instead of page numbers. See further details here.