
Research on the Asymmetry of Cross-Sectional Shape and Water and Sediment Distribution in Wandering Channel
by
 ,
,
Linjuan Xu
1,2 ,
,
Enhui Jiang
1,2,*,
Lianjun Zhao
1,2,
Junhua Li
1,2,
Wanjie Zhao
3 and
Mingwu Zhang
1,2 1
Yellow River Institute of Hydraulic Research, Yellow River Conservancy Commission (YRCC), Zhengzhou 450003, China
2
Key Laboratory of Lower Yellow River Channel and Estuary Regulation, Ministry of Water Resources (MWR), Zhengzhou 450003, China
3
College of Water Conservancy and Hydropower Engineering, Hohai University, Nanjing 210098, China
*
Author to whom correspondence should be addressed.
Water 2022, 14(8), 1214; https://doi.org/10.3390/w14081214
Submission received: 28 February 2022
/
Revised: 7 April 2022
/
Accepted: 7 April 2022
/
Published: 9 April 2022
(This article belongs to the Special Issue Yellow River Basin Management under Pressure: Present State, Restoration and Protection)
Abstract
:The construction of a river regulation project has changed the cross-sectional shape of a river and significantly impacted the evolution of the river regime. In this paper, an asymmetry index was proposed to characterize the changes in the shape of the river cross-section and the distribution of water and sediment factors. According to the transverse distribution formula of the river section and water and sediment factors, the asymmetry of the cross-sectional shape as well as water and sediment factors along with the transverse distribution in the wandering reach of the lower Yellow River before and after the construction project was calculated, respectively. The results showed that the cross-sectional shape of the river channel before and after the building was asymmetric, and the cross-sectional shape of the river channel after the construction was more asymmetric than that of the free development channel without engineering constraints; at the same time, under the action of a limited control boundary, the asymmetry of cross-section flow velocity and sediment concentration and other water and sediment factors along the transverse distribution were more prominent, the flow velocity and sediment concentration along the transverse distribution increased, the river flow was more concentrated, and the sediment transport capacity of the channel improved significantly under a large flow (5000 m3/s). This study revealed the positive effect of river regulation projects on the river regime evolution of the wandering river and provided new ideas for the study of river regime evolution.
1. Introduction
In wandering river channels under natural conditions, the incoming water, sediment conditions, and boundary conditions are complex and changeable. The riverbed is wide and straight. The sandbars are dotted in the river channel, the branches are crisscrossed vertically and horizontally, and their shapes are different. The positions of the beaches and water often change. Taking the Yellow River as an example, the Baihe Town Gaocun reaches the lower reaches of the Yellow River, which is a typical wandering river. The length of the reach is 299 km, the distance between the embankments on both banks is generally ~10 km, the maximum width is 20 km, and the longitudinal gradient of the river is 1.72–2.65‱. The riverbed section is wide and shallow and the channel width is 1.5–3.5 km. Under natural conditions, the river channel is densely covered with sandbars, scattered water flow, and numerous branching streams, sometimes up to 4–5 strands [1,2,3]. The river regime changes frequently and the river facies coefficient under flat beach flow is 20–40. Since the 1980s, the wandering section of the lower Yellow River has been regulated. During the “National Projects of the Eighth Five-Year Plan” period, the Yellow River regulation workers analyzed the laws of the evolution of the wandering river channel in the lower Yellow River and put forward the “slightly curved regulation scheme”. After the implementation of the scheme, the swing range of the main stream and boundary of the wandering river channel was significantly reduced and the river regime of most river sections was initially controlled, which protected the embankment’s safety and relieved the downstream flood control pressure to a certain extent. Since 2006 especially, the process of river regulation has been accelerated, the density of regulation works has increased significantly, and the “wide, shallow, scattered, and chaotic” channel shape has been significantly improved [4,5,6]. At present, there are still some challenges in the wandering river regime which require thorough investigation and excellent river regulation engineering measures [7,8]. River regulation works mainly include control, guidance, and dangerous works [9]. Under the action of regulation works, the wandering range of the river regime has been effectively controlled [10] from 5.5 km in 2000 to 3 km in 2006. In recent years, the swinging range of the main slide of some rivers has become smaller, mostly within 0.5 km.
At the same time, a long-term series of studies on the stabilization of the wandering river regime reported many relevant results that provide constructive opinions on improving the stability of the wandering river regime. Yaoxian et al. [11] found that the longitudinal velocity distribution in a bend is related to the incoming water conditions and boundary conditions through a large-scale bend model test and observation. Liu Yan [12] adopted a slightly curved river regulation scheme to study the impact of changes in the regulation engineering conditions on the river regime of the wandering river in the lower reaches of the Yellow River. The author [8] also studied the change in water and sediment conditions after the construction of Xiaolangdi reservoir. The mismatch between the river regulation project and the new water-sediment relationship led to adjustment of the downstream river regime and frequent occurrence of the abnormal river regime. Hongwu et al. [13] studied the influence of the length of the regulation project on the regulation effect of the wandering river section using the natural river model test, analyzed the adaptability of the built regulation project to medium and small water [14], and discussed the variation law of river length in the straight river section [15,16]. Junhua et al. [7] analyzed the role of downstream wandering river regulation in the new period, analyzed the existing problems of wandering river, and proposed several control countermeasures such as improving river regulation engineering measures. Xinjie [17] studied the impact of beach area project on erosion and deposition in the lower Yellow River. The lower Yellow River has a slightly curved river regulation. River regulation works have strong constraints on the river channel; the riverbed deformation is mainly undercut, the channel width depth ratio is reduced, the river cross-section tends to be narrow and deep, and the river regime tends to be stable [18,19,20]. In the free-developing river bend, the river boundary constraint is weak, the riverbed deformation is mainly widening, the river width depth ratio increases, the river cross-section tends to be broad and shallow, and the river regime changes significantly. The sediment transport capacity of the broad and shallow areas is weaker than that of the narrow and deep areas, which easily aggravates river sedimentation [21,22] and enhances the heterogeneity of riverbed composition, resulting in a continuous change of section shape with water flow and poor stability of the river regime. Following construction of the river regulation project, the evolution of the river regime is limited to a certain extent, the swing range of the central slip of the wandering river channel is significantly reduced, and the river facies relationship changes accordingly [23,24].
The study discussed how the construction of the river regulation project improved and controlled the river regime, resulting in a new river bed shape, especially in the river section where the river regulation works are relatively perfect and the river section is relatively close to the mainstream. The impact on the river cross-section after the construction project and the change in water and sediment transport and riverbed deformation caused by the adjustment of river cross-section were also investigated. The riverbed evolution differs from the natural river channel. The bend circulation in natural rivers causes a prominent asymmetry in the distribution of river sections and water and sediment factors. At present, research on changing the shape of river sections after construction of the river regulation project mostly remains at the level of qualitative description, and quantitative calculation is rarely involved. This paper proposed an asymmetry index and calculation method to characterize the river section shape and water and sediment factors. Using the formula for the river section and water and sediment factors along with the transverse distribution, this study quantitatively calculated the asymmetry of section shape and water and sediment factors along with the transverse distribution of the typical reach of the wandering section of the lower Yellow River before and after the construction project. This revealed the reasons for the improvement in river sediment transport capacity after the construction project.
2. Materials and Methods
2.1. Construction of River Regulation Project in the Lower Yellow River
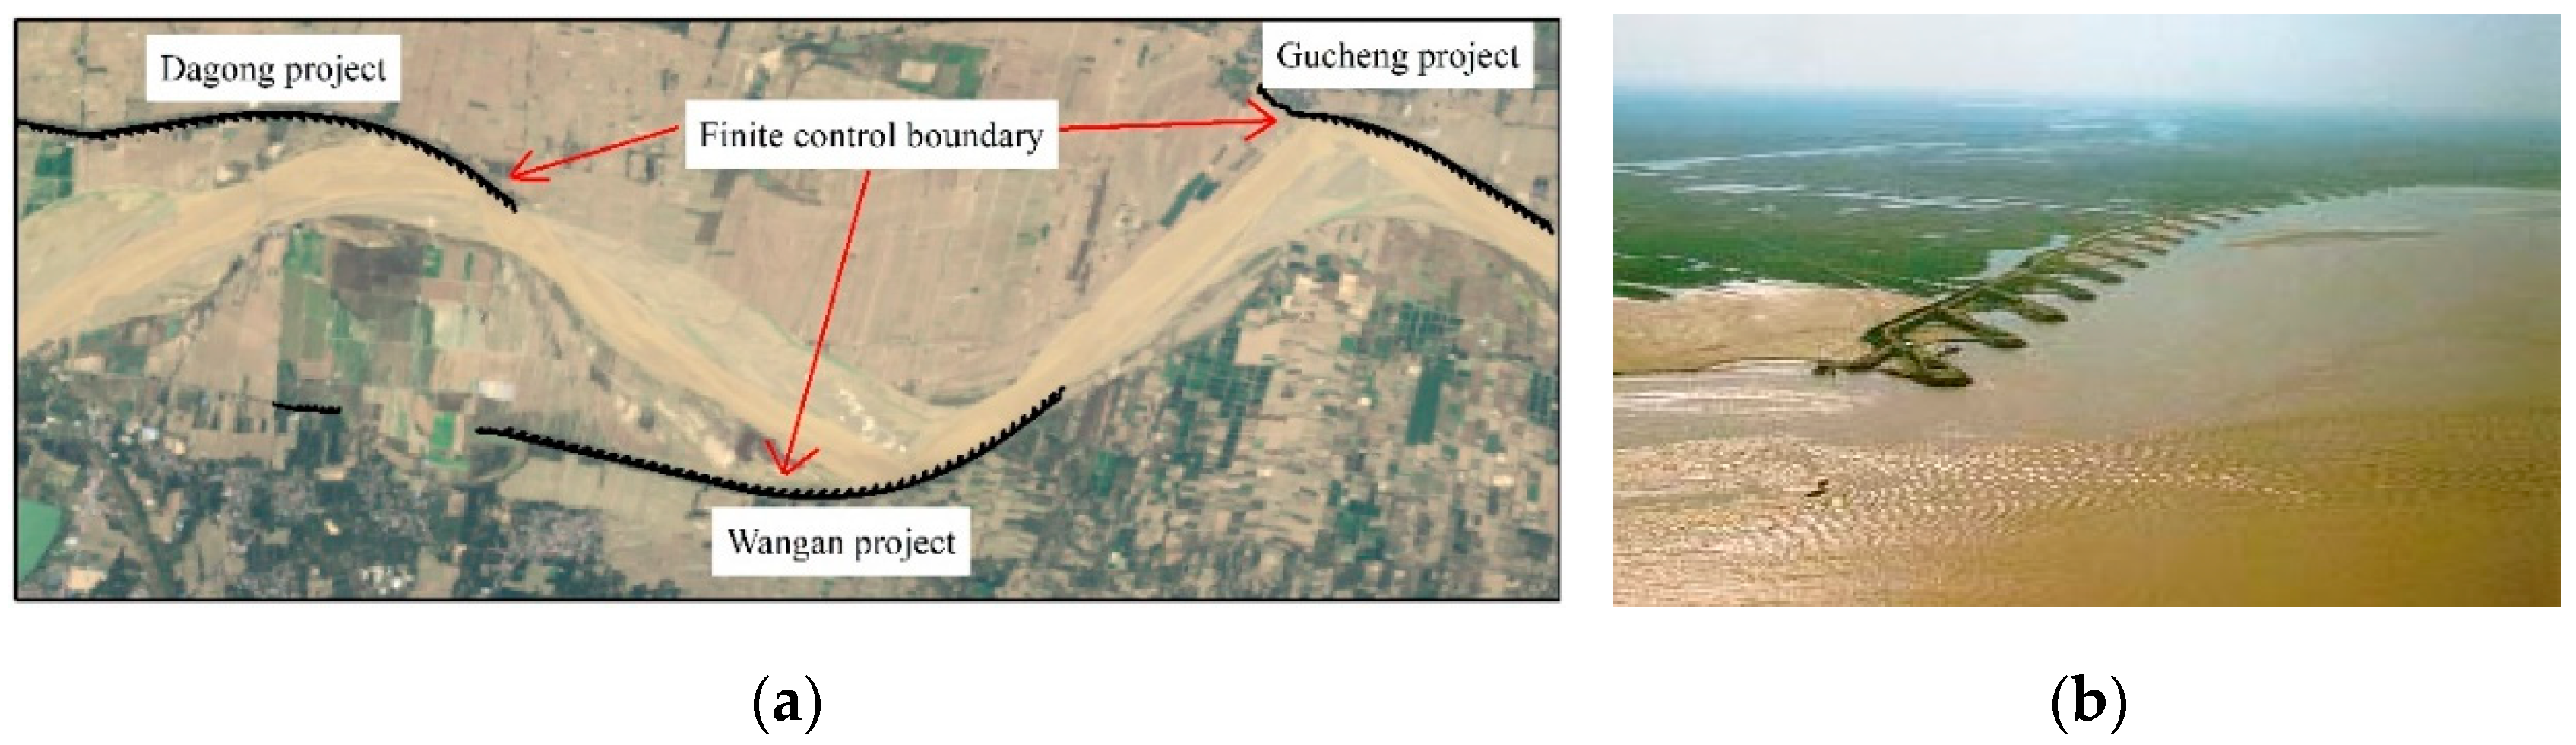
With the enhancement of river development and utilization in the last decade, according to the laws of evolution of a wandering natural river channel, some river regulation projects have been built alternately on the concave bank of the river channel which can transport flood and sediment during large floods and maintain the stability of the river regime in small and medium floods (Figure 1).
In order to reflect the construction of wandering river channel project, the density of a river regulation project was defined as the ratio of the total length of the river regime control project in the wandering river channel to the length of river channel. This index indirectly reflects the restraint ability of river regulation project to the river regime. The construction of the Baihe–Gaocun river regulation project of the wandering river in the lower Yellow River was collected and river regulation project density from 1960 to 2014 was drawn, as shown in Figure 2. The river regulation project here only included the control project that restricted the river regime, excluding dangerous projects. As can be seen from Figure 2, as of 2014, the density of the wandering river regime control project has reached more than 70%.
2.2. Quantitative Characteristics of the Asymmetric Index
In natural rivers, water flow and riverbeds are intrinsically related. Water flow shapes the riverbed, which in turn restricts water flow. Channel evolution occurs and constantly changes its interactions, e.g., vertical evolution and horizontal evolution. The study of lateral evolution involves bend circulation and other problems which are complex. The asymmetry of the river cross-section is caused by bend circulation which affects the transverse distribution of water and sediment factors, resulting in concave scouring and convex siltation under certain water and sediment conditions. All erosion and deposition evolution of the river is related to asymmetry; therefore, study of the river asymmetry is significant.
For the wandering channel, the asymmetry of the section shape and the distribution of water and sediment factors on the section is obvious and there is a strong causal relationship between them. River regulation works in the wandering reach of the lower Yellow River are arranged according to the asymmetric characteristics of water and sediment movement. The limited engineering boundary is always arranged on one side of the river, and most of the projects on the opposite side are not arranged. Hence, the river boundary condition was termed the limited control boundary condition in this study. Therefore, the limited control boundary is also an asymmetric boundary. After a large number of river regulation projects were built in the lower Yellow River, the distribution of river water and sediment factors in the cross-section has been strongly disturbed, which is bound to change significantly under natural conditions and in turn affects the cross-sectional shape and the adjustment of the river regime. Therefore, it is important to study the asymmetric variation law of the channel cross-sectional shape and transverse distribution of water and sediment factors under limited control boundary conditions.
Here, we discussed some important characteristics of the asymmetry of water and sediment factors along with the transverse distribution, focusing on the comparative analysis of the overall characteristics of the asymmetry of water and sediment factors on the left and right sides of the river. Taking the centerline of the river cross-section under flat discharge as the axis, it was divided into left and right sides, and the square root of the area ratio of each physical quantity on both sides was used to qualitatively describe the asymmetry. Here, regardless of the left and right sides or the left or the right bank bend, the large side index was used as the numerator and the small side as the denominator. Thus, the asymmetry index ASi is expressed as
where i is any physical quantity, e.g., river cross-section, cross-sectional velocity, sediment concentration, suspended sediment composition, and sediment-carrying capacity. ASi > 1, and the greater the ASi, the stronger the asymmetry. When ASi = 1, the overall distribution of each physical quantity on both sides of the river section is symmetrical.
According to the above definition, we derived a formula for the asymmetry index of the overall distribution of the channel cross-sectional shape as well as water and sediment factors on both sides of the channel cross-section (Equations (2)–(6)), marking the specific contents of each element with the lower corner mark. The asymmetry index of the channel cross-sectional shape (ASA) as well as those of the overall distributions of velocity (ASV), sediment concentration (ASS), average suspended sediment size (ASdcp), and sediment carrying capacity (ASS*) on both sides of the river cross-section were obtained.
Using the above formula, the asymmetry of the channel cross-sectional shape and the asymmetry of the water and sediment factor distribution caused by the asymmetric adjustment of the channel cross-sectional shape were calculated. The calculation method for the transverse distribution of river water and sediment factors is given below. Using this method, the transverse distribution values of water and sediment factors could be calculated and substituted into Equations (2)–(6) to obtain the quantitative indicators of the asymmetry of the river cross-section and water and sediment factors.
2.3. Calculation Method for the Lateral Distribution of Water and Sediment Factors
2.3.1. Transverse Distribution of the Velocity
Through analyzing a large volume of measured data from the Yellow River, we observed that the transverse distribution of velocity was mainly related to water depth. Therefore, the formula for the velocity distribution along the transverse direction was as follows:
where V and Vi represent the average velocity of the section and the velocity at any point, respectively; h represents the average section and water depth at any point, respectively; C1 is the section shape coefficient of ~1, which can be obtained by mass conservation.
where Q is the average flow of the section, y is the transverse coordinate, and a and b are the starting point distances between the two ends of the river width of the section (b > a).
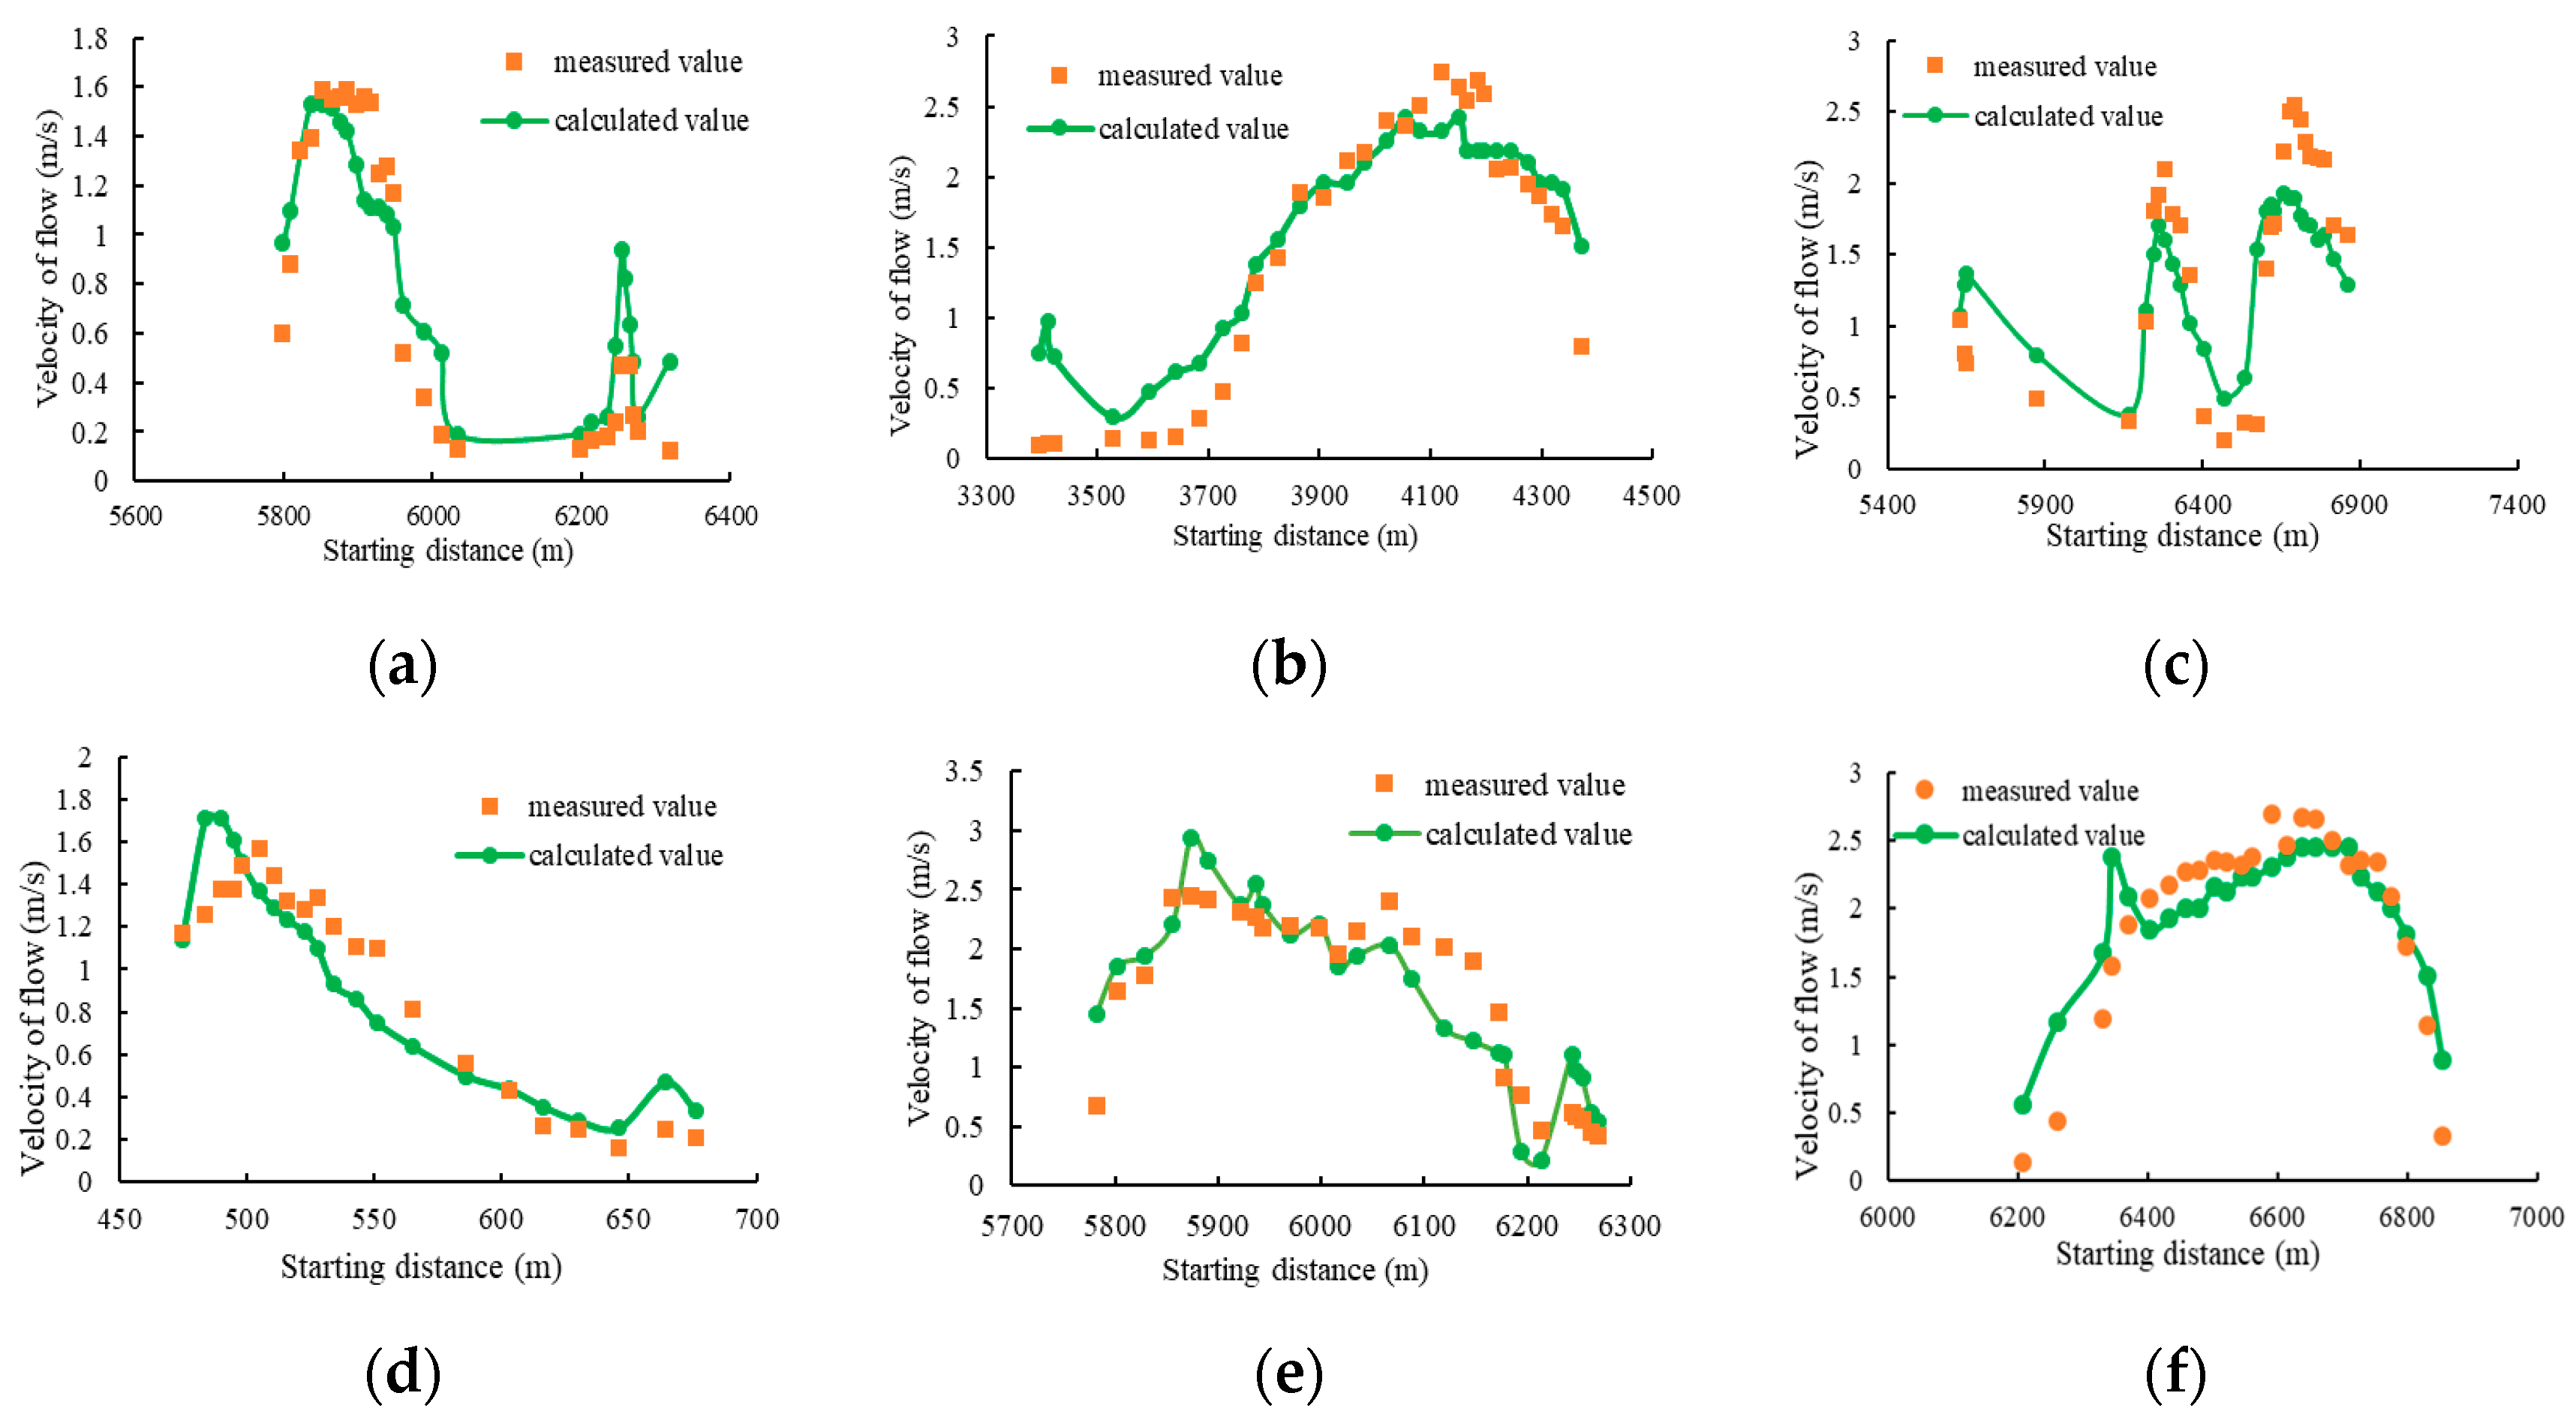
Hundreds of measured data sets from the lower Yellow River were used to verify Equation (7). The average velocity range of the section was 0.10–3.56 m/s, of which the data range covered the pre-flood and flood seasons. The results are shown in Figure 3. Equation (7) could be used to accurately calculate the transverse distribution law of velocity before flood season and during the flood season. This formula has comprehensive considerations and convenient applications.
2.3.2. Transverse Distribution of Sediment Concentration
As the non-uniformity of water depth and resistance distribution along the river width of the wandering channel is prominent, the distribution of sediment transport capacity along the river width is quite different, resulting in obvious differences in the distribution of sediment concentration along the river width in the process of sediment transport. Through analyzing a large volume of measured data of the Yellow River, Enhui et al. [25] observed that the transverse distribution law of sediment concentration is not only related to hydraulic factors and sediment concentration but also closely related to the composition of suspended sediment. The finer the suspended sediment composition, the more uniform the transverse distribution of the sediment concentration. Therefore, in addition to introducing the sediment concentration factor, the suspension index ω/ku* was also introduced to reflect the thickness of the suspended sediment composition, and the transverse distribution formula of sediment concentration was established as follows [25]:
where S and Si represent the average sediment concentration of the section and at any point, respectively; SV is the volume sediment concentration, and SV = S/2650; h, hi, Vi, and V have the same meaning as previously described. C2 is the section shape coefficient of ~1, which could be obtained from sediment conservation.
where qi is the unit width flow at any point of the section, ωs is the settling velocity of particles, calculated by Equations (11)–(14) [26]; k is the Carmen constant, which was calculated using Equation (15); u* is the average frictional velocity of the section, and , J = 2‱; Q has the same meaning as before.
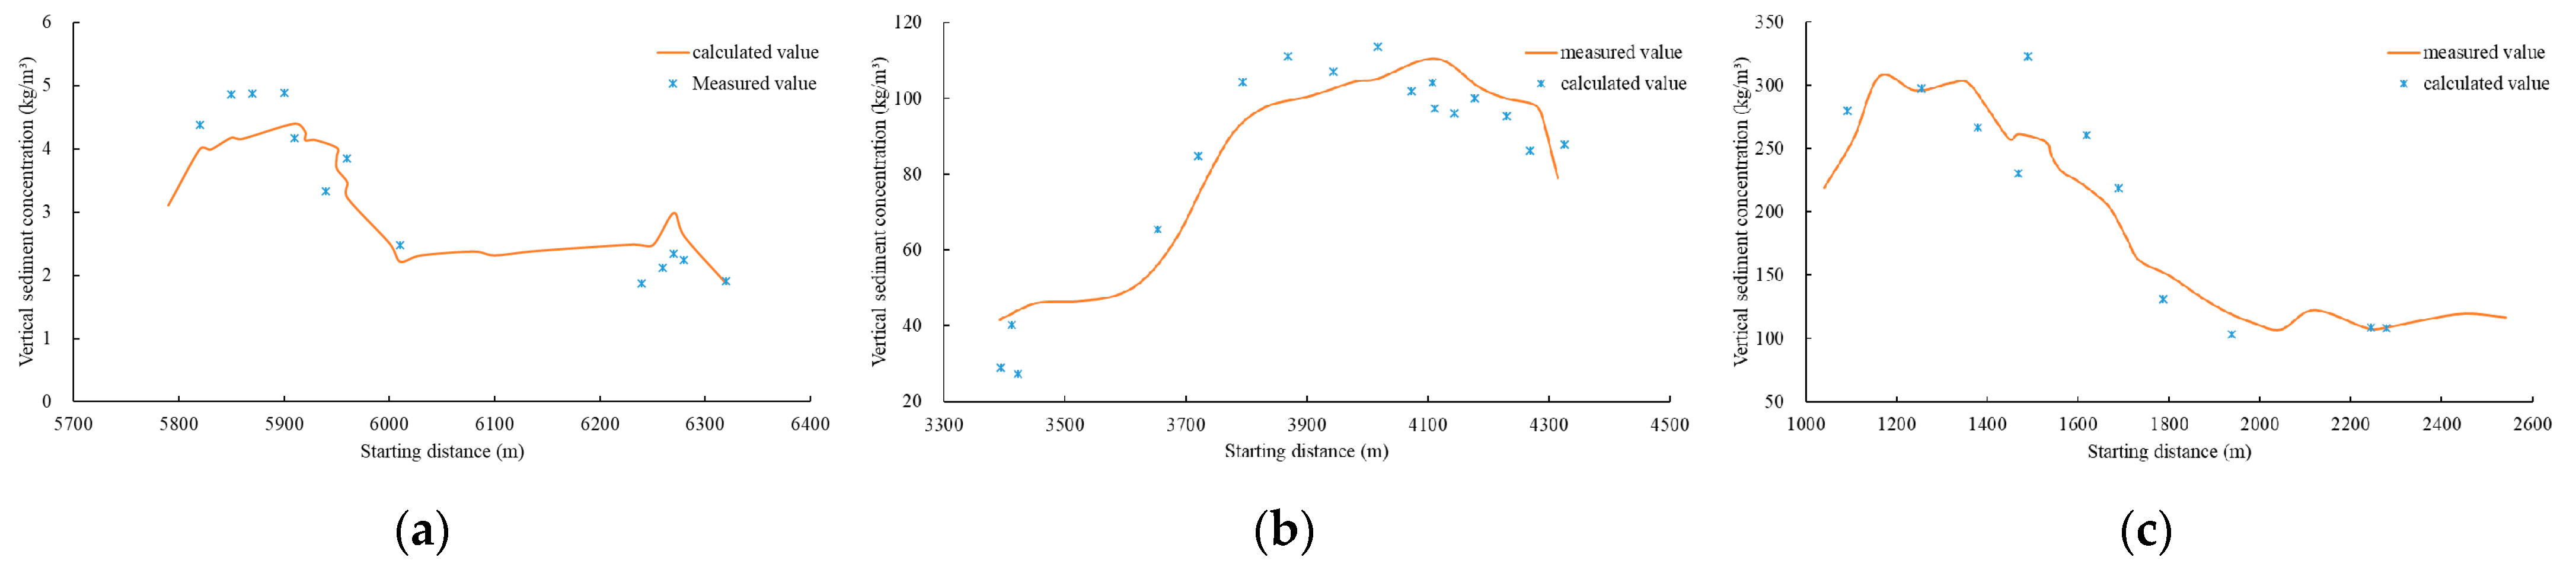
More than 150 measured data sets from the lower reaches of the Yellow River were used to verify Equation (9). The average flow sediment concentration of the section ranged from 3 kg/m3 to 480 kg/m3, including both floodplain and non-floodplain flood data (Figure 4). The verification results showed that Equation (9) could not only accurately calculate the transverse distribution law of sediment concentration in non-floodplain floods but also calculate the transverse distribution law of sediment concentration in the floodplain flood main channel, beach, and mixing area. The formula is suitable for both general and high sediment-laden flows, and the factors considered in the formula are comprehensive and easy to apply.
2.3.3. Lateral Distribution of the Suspended Sediment Composition
In natural rivers, the distribution of velocity and sediment concentration along the river width is uneven, which also leads to an uneven distribution of suspended sediment composition along the river width, and the suspended sediment composition in the mainstream area is generally coarse.
Based on the analysis of the measured data in the lower reaches of the Yellow River, the following formula for the distribution of the average particle size of suspended sediment along the river width was obtained:
where dcp is the average suspended sediment particle size of the section, dcpi is the average suspended sediment particle size at any point of the section, and C3 is the section shape coefficient, which could be obtained from the sediment conservation.
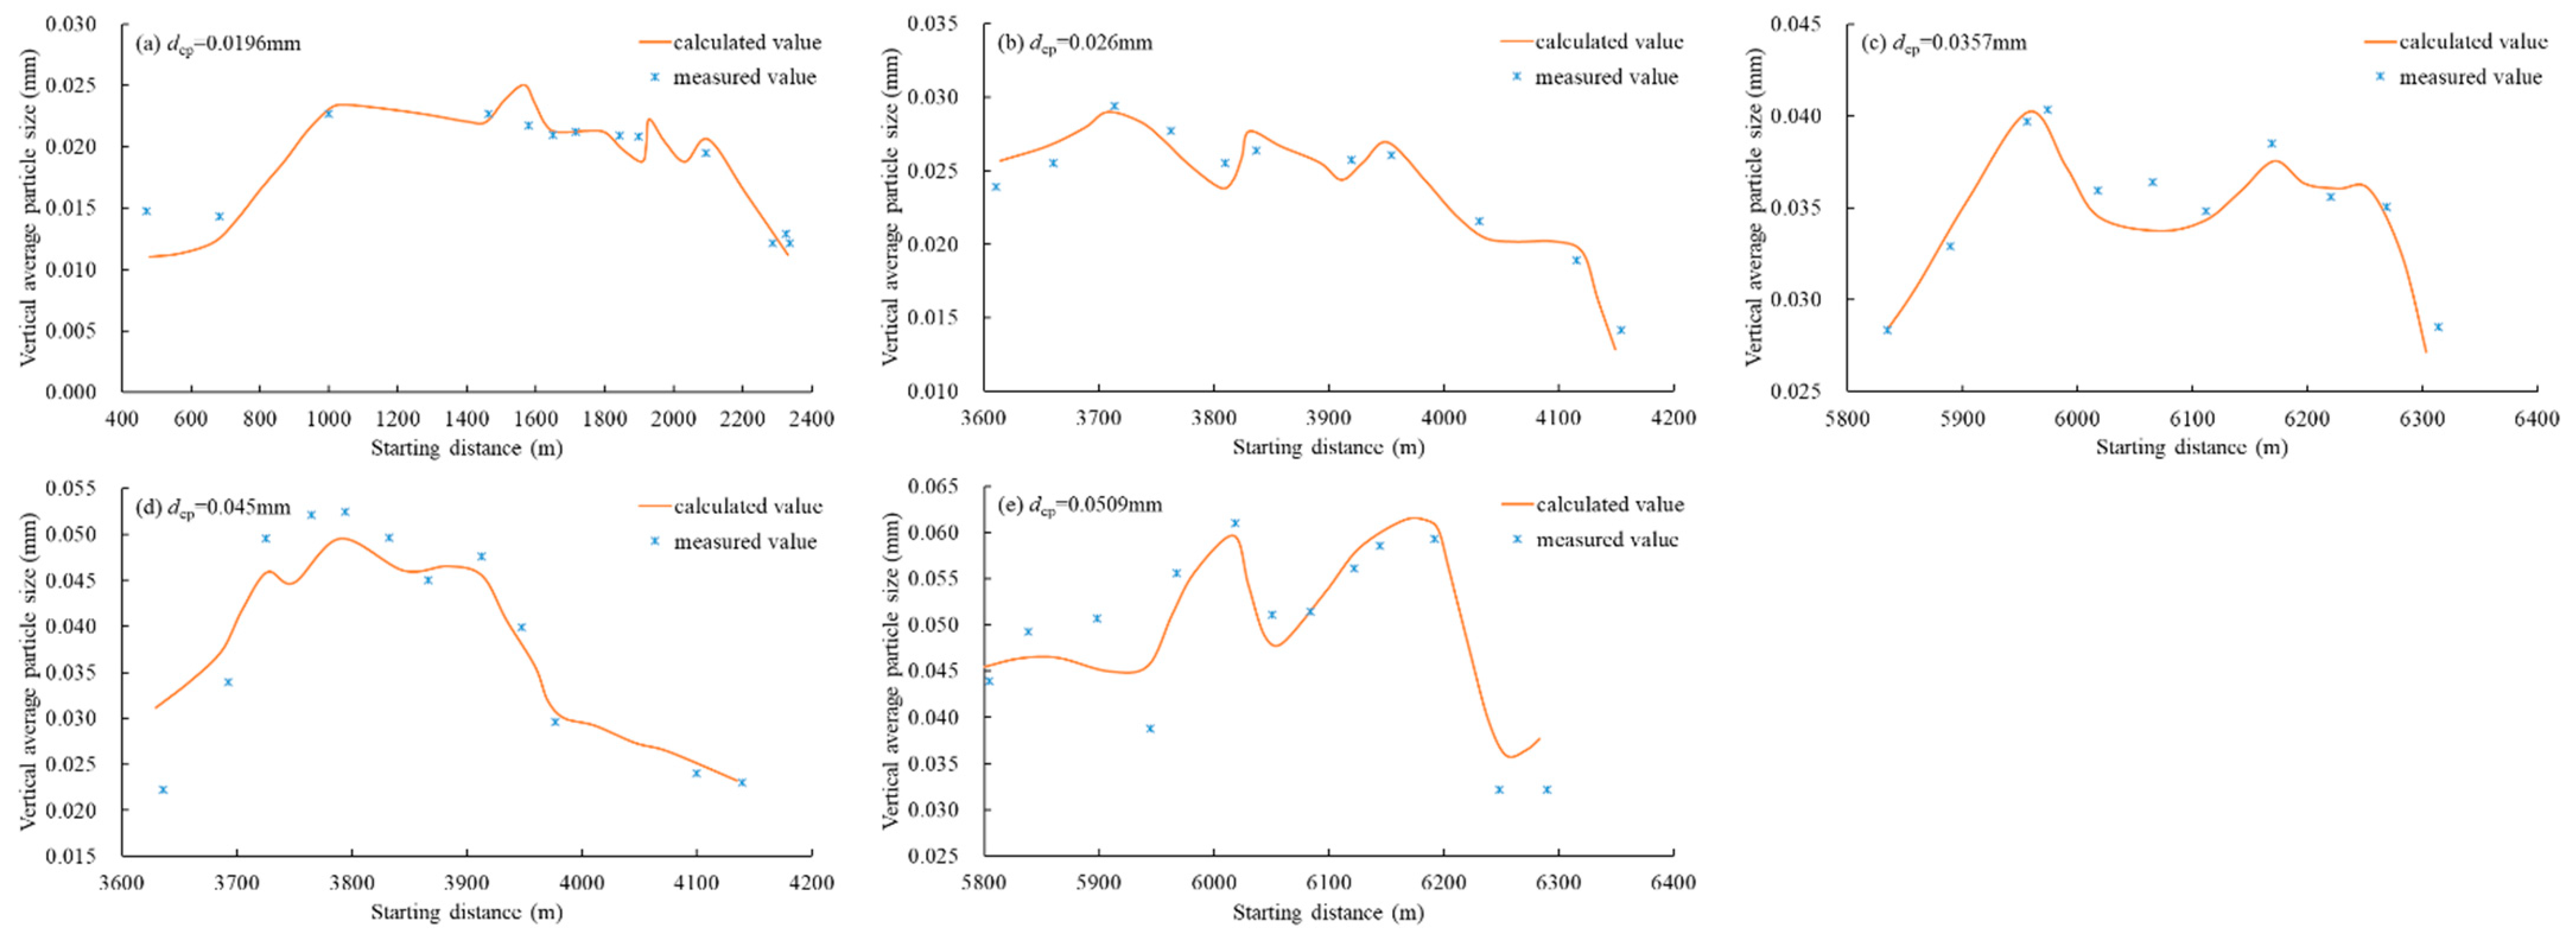
Based on the suspended sediment gradation data measured by Tiexie–Xinzhai in the lower Yellow River in 1966 and corrected according to the suspended sediment gradation correction method, the average particle size was calculated and verified using Equation (16). The average dcp range of the section was 0.01–0.06 mm (Figure 5). The results showed that the calculated results were satisfactory regardless of the size and concentration of suspended sand.
2.3.4. Sediment-Carrying Capacity of Water Flow
Following sediment concentration, the physical properties and turbulent structure change, which impacts the flow energy loss, velocity, and sediment concentration distribution. Therefore, to obtain a sediment-carrying capacity formula suitable for both general flow and high sediment concentration flow, it is necessary to consider the influence of sediment on flow from the energy consumption graph of secondary flow. Hongwu et al. obtained a sediment-carrying capacity formula including all suspended sediments (for alluvial rivers, R ≈ h):
Equation (18) adopts kg, m, and s as the unit system.
The verification process of the formula of sediment concentration distribution along the transverse direction, the formula for suspended sediment composition distribution along the transverse direction, and the general formula for flow sediment carrying capacity is detailed in a previous report [25].
The lower Yellow River channel is constantly adjusted with changes in incoming water and sediment and strives to adapt the water and sediment transport in the riverbed to the incoming water and sediment. Adjustment of the riverbed is reflected in the adjustment of the transverse shape of the river section. The cross-section of the lower Yellow River is a compound cross-section. Different water and sediment conditions determine the adjustment form and variation range of the cross-section. At the same time, the adjustment law of the cross-section of the beach and main channel in the lower Yellow River is different. This study mainly focused on the riverbed evolution under flat discharge, and the adjustment of its cross-section is primarily reflected in the adjustment of the main channel. Therefore, the change in the main channel was analyzed here.
3. Results
3.1. Asymmetry of Wandering Channel without Engineering Constraints
3.1.1. Overall Change in the River Cross-Sectional Shape before and after Construction
The year 1960 was selected as the representative year for the free development river bend without engineering constraints, and the year 2019 was selected as the representative year under the action of the limited control boundary. According to the asymmetry index formula proposed above, the asymmetry of the cross-sectional morphology of the free-development river bend without engineering constraints in 1960 and the river channel under the action of the limited control boundary in 2019 in the wandering section of the lower Yellow River was calculated (Figure 6). In 1960, most of the asymmetry indexes of the cross-section between Tiexie and Gaocun in the wandering section of the lower Yellow River were in the range of 1.01–1.50 and the average value of the asymmetry indexes of the entire wandering section was 1.19. Following construction of the project, most of the cross-sectional shape asymmetry indexes of the river reach in 2019 were in the range of 1.10–1.70 and the average value of the asymmetry indexes of the entire wandering section during this period was 1.33, indicating that there was a certain asymmetry in the cross-section shape of the river before and after the construction project and the asymmetry of the cross-section shape of the river after the construction project was greater than that without the project, and that the river after the construction project was constrained by the project boundary and the asymmetry of the cross-sectional shape was more prominent.
3.1.2. Calculation of the Asymmetry Index of Water and Sediment Factors in the Free Developing River Bend
In the 1950s and the 1960s, the lower reaches of the Yellow River belonged to a typical wandering channel. The channel was wide and shallow, scattered, densely covered with sandbars, the mainstream fluctuated, and the river regime changed sharply. It was difficult to determine the obvious and compliant curved top and transition sections. The planned river regulation in the wandering section of the lower Yellow River began in the 1970s and 1980s. Therefore, the lower Yellow River before 1980 can be regarded as a quasi-free development bend in the period without engineering constraints. Therefore, 1979 was selected as the representative year for the free development of the bend before the construction of the wandering section of the lower Yellow River. To study the asymmetry of the distribution of water and sediment factors in a typical section of a free developing river, we selected the typical section based on two principles: (a) the river regime is relatively stable and (b) at the reach where the mainstream swing is obvious, a relatively obvious bend is observed as the bend top section, and the mainstream in the transition section is relatively stable.
Based on these principles, the section between the Heishi River channel in the wandering section of the lower Yellow River was selected as the representative section (Figure 7). According to the river regime map before the flood in 1979 and the measured large section data of the section, the Liuyuankou and Jiahetan river channels were selected as the representative sections of the transition section, and Heishi, Gucheng, and Mazhai were selected as the representative sections of the bend top section without considering the variation of gradient along the river width, and the gradient value was 2‱ and the roughness values were 0.01, 0.012, and 0.015, respectively. According to Manning’s formula, the velocity was calculated, the discharge was inversely deduced, and the calculated flat discharge was 5000 m³/s. The flat water level, flat area, and other characteristic parameters of each section were calculated, and the transverse distribution of each water and sediment factor was calculated using Equations (6), (8), (15), and (17). Finally, the scouring and silting balance (S = 23 kg/m ³) of each section of the Heishi River section was determined using Equations ((1)–(5)) (scouring (S = 5 kg/m³), siltation (S = 50 kg/m³)). The asymmetry indexes of the cross-sectional shape and water sediment factors under the three states and the calculation results of the asymmetry indexes under the three states were not different (Table 1).
Table 1 shows that: (a) the asymmetry index of each section under the three scouring and silting states was >1, indicating that the river cross-section and the distribution of water and sediment factors during the free development period had certain asymmetry. (b) There was no obvious difference in the calculation results of asymmetry indexes of each section under the three scouring and silting states, indicating that the overall change in the asymmetry of the channel cross-sectional shape and water and sediment distribution under different scouring and silting states during the period of free development of the river bend was small. (c) Each asymmetry index of the section at the top of the river bend was significantly greater than that of the transition section, indicating that during the period of free development of the river bend, the shape and water and sediment distribution of the section at the top of the river bend were more asymmetric than that of the transition section.
Table 2 shows the verification of erosion and deposition balance, erosion, and deposition of each section of the Heishi River reach. The results showed that when the flow was 5000 m3/s, the sediment transport of each representative section under different scouring and silting states had the following laws: (a) when the sediment concentration was 23 kg/m3, at left and right, the distribution of sediment concentration in the whole reach was relatively uniform, and the river channel was basically in the balance state of erosion and deposition, which is manifested in the micro-scouring state of the section at the top of the bend and the micro silting state of the section at the transition section. (b) When the sediment concentration was 5 kg/m³, the whole reach was in the entire cross-section scouring state at the left and right. (c) When the sediment concentration was 50 kg/m3, the whole reach was in the full section siltation state. According to the verification results, the calculation results of river flow sediment-carrying capacity under various scouring and silting states reflect the distribution of water and sediment factors in each section.
3.2. Asymmetry of Wandering Channel under Finite Control Boundary
3.2.1. Asymmetry of Channel Cross-Sectional Shape
The typical reach of the wandering section of the lower Yellow River was selected to study the asymmetry of the river cross-section under the action of finite engineering. The section selection principles were as follows: (a) the river regime of the reach is relatively stable; (b) the curved top section works are closely combined with the water flow, the main sliding works are better, and the river regime in the transition section is relatively stable. Based on these principles, the section between Fanzhuang and Yuanfang in the wandering section of the lower Yellow River was selected as the representative section (Figure 8). According to the river regime map before the flood season in 2018 and the measured large section data, the cross-sectional asymmetry indexes of the bend top section and transition section with good engineering slip in this section were statistically analyzed (Table 3). According to the river regime map, the sections of Sizhuang and Chenqiao are at the top of the bend, and the project is relatively smooth. The three sections of Fanzhuang, Gucheng, and Yuanfang are the transition section between the two curved tops. As shown in Table 3, compared with the transition section, the cross-section at the bend top section had a stronger asymmetry. This shows that the shape of the river cross-section was more asymmetric under the action of a limited control boundary.
3.2.2. Asymmetric Distribution of Water and Sediment Factors in the River Channel
To further analyze the influence of the asymmetric change in the cross-sectional shape on the asymmetry of river water and sediment-transport capacity, we selected the Fanzhuang–Yuanfang section of the lower Yellow River as the representative section. The gradient value was 2‱ and the flat discharge was 5000 m3/s. The asymmetry indexes of water and sediment factors under various scouring and silting conditions at each section of the Fanzhuang–Yuanfang reach were calculated, as shown in Table 3, Table 4 and Table 5. The results showed that: (1) the asymmetry indexes of water and sediment factors in the Fanzhuang–Yuanfang reach were >1, indicating that after the construction project, the cross section of the reach and the distribution of water and sediment factors had a certain asymmetry. (2) The calculation results of cross-sectional erosion, deposition balance, and erosion state were basically the same, which shows that the asymmetric distribution of river factors changed slightly under the two erosion and deposition states. Compared with these two states, in the state of cross-section deposition, the cross-sectional asymmetry index at the transition increased and the cross-section asymmetry index at the bend top decreased, indicating that in the state of cross-section deposition, the cross-section riverbed deformation at the bend top was small and the cross-section riverbed deformation at the transition was large. (3) Each asymmetry index of the section at the bend top of the river section was larger than that at the transition section, indicating that after the construction project, the distribution of water and sediment factors at the bend top of the river section was more asymmetric than that at the transition section.
These results resembled the asymmetric results of the downstream swing channel without engineering constraints. The difference was that after construction of the project, compared with the cross-section scouring and silting balance and scouring state, the cross-section riverbed deformation at the bend top was smaller and the cross-section riverbed deformation at the transition was larger in the cross-section silting state.
Table 6 shows the verification of the erosion and deposition balance, erosion, and deposition of each section. The difference between the set sediment concentration and the calculated sediment-carrying capacity of the section under various states was small, indicating that the above calculation reflected the distribution state of water and sediment factors of each section.
Based on the above calculation results, when the flow was 5000 m3/s, under the condition of different sediment concentrations, the sediment transport of each section obeyed the following laws: (a) when the sediment concentration was 32 kg/m3 at the left and right, the sediment concentration distribution of the entire river section was relatively uniform and the river channel was basically in a balanced state of erosion and deposition. In particular, the section at the top of the bend was in a state of micro-erosion, and the section at the transition section was in the state of micro-deposition. (b) When the sediment concentration was 5 kg/m3, the entire reach was in a full cross-section scouring state on the left and right. (c) When the sediment concentration was 90 kg/m3, the entire reach was in the full section siltation state. According to the calculation results of sediment concentration and sediment-carrying capacity under various scouring and silting states at a flow of 5000 m3/s before and after the construction project, the sediment concentration and sediment-carrying capacity under various scouring and silting states improved after the construction of the project, which indicated that the construction of a river regulation project could improve the sediment transport capacity of the river after enhancing the control effect on river regime stability.
4. Discussion
4.1. Adjustment of Cross-Sectional Shape and Distribution of Water and Sediment Factors before and after Construction
Table 7 shows the comparison results of the asymmetric indexes of river section shape, velocity, sediment concentration, suspended sediment composition, and sediment-carrying capacity along with the transverse distribution before and after the construction project. (a) The asymmetry of each factor of the section at the bend top of the river channel before and after the construction project was significantly greater than that of the transition section. (b) compared with that before the construction project, the asymmetry of the river cross-section shape and water and sediment factors after the construction project was significantly increased, which made the river cross-section flow more concentrated and the river regime more stable. (c) Compared with that before the construction project, the overall increase in cross-sectional shape and asymmetry index of the river channel at the top of the bend after the construction project was 14–30%, and the overall increase in the cross-section shape and asymmetry index of the river channel at the transition section was 6–20%.
4.2. Sediment Transport Capacity of River Channel before and after Construction
Comparative analysis of Table 2 and Table 6 revealed that in a large flow (5000 m³/s), regardless of the scouring and silting state of the river (i.e., scouring, silting, or scouring and silting equilibrium state), the sediment-carrying capacity of the river section was improved to a certain extent after the construction project. Taking the scouring and silting balance state of the river as an example, the average sediment-carrying capacity of a typical section of a downstream swing river without engineering constraints is 23 kg/m³, and after construction, the average sediment-carrying capacity of a typical section of a wandering river channel was 32 kg/m³, which showed that the construction of river regulation works did improve the sediment transport capacity of the river.
Table 8 and Table 9 showed the small flow before and after construction (flow: 800 m³/s). The results showed that the sediment-carrying capacity of the river section slightly changed after the construction of the project, indicating that the construction of the river regulation project did not significantly improve the sediment-carrying capacity of the river channel at small flows.
4.3. Effect of Asymmetric Distribution of Water and Sediment Factors on River Bend Creep
In natural rivers, the flow structure that affects and is affected by the riverbed form is often complex. In addition to the longitudinal flow, bend circulation occurs. Bend circulation is closely related to the transverse evolution of the riverbed and transverse sediment transport. The research showed that after the construction of the river regulation project, under the action of the bend circulation, the cross-sectional shape and the non-uniformity and asymmetry of the distribution of water and sediment factors at the bend were more prominent than those in the transition section, which improved the sediment transport capacity of the river to a certain extent. This is because, at the bend section, circulation is an important factor that promotes sediment transport on the concave bank. The circulation exerts a downward force on the concave bank to move the sediment from the concave bank to the convex bank. Under the influence of bend circulation along the horizontal axis, the surface flow with less sediment is inserted into the bottom of the concave bank riverbed, resulting in scouring of the riverbed; in the bottom layer with more sediment, the flow rises to the surface of the convex bank, resulting in siltation of the convex bank riverbed. Over time, under the influence of the bend circulation, the concave bank gradually retreats, and the convex bank extends forward and silts year by year. The whole bend showed a trend of moving slowly downstream, and the plane form showed that the river bend is creeping slowly.
5. Conclusions
(1) The construction of river regulation works had a stronger constraint on water flow and river regime, particularly due to the increase in the density of river regulation works. By comparing and analyzing the adjustment of river cross-section and water and sediment factor distribution before and after the construction project, it was confirmed that the construction of a river regulation project could enhance the asymmetry of the river cross-section and water and sediment factor distribution, making river flow more concentrated and river regime more stable.
(2) Compared with the river bend during the free development period, the asymmetry of the river cross-section and water sediment factor distribution after the construction project increased by 6–30% as a whole at the same flow (5000 m³/s). When the erosion and deposition of the lower channel were balanced, the sediment-carrying capacity of the flow increased by 39%, and the sediment transport capacity of the channel increased significantly.
(3) Compared with no engineering constraints, the asymmetry of the cross-sectional shape of the river under the action of the limited control boundary was stronger, which could block the sediment supply on one side of the river regulation project and easily cause a sudden change (significant increase) in the sediment gradient along the river at the junction of the soft and hard boundary of the river, resulting in a decline in the river regime.
Author Contributions
Conceptualization, E.J.; methodology, L.Z.; validation, L.Z.; formal analysis, L.X. and M.Z.; investigation, W.Z.; resources, E.J. and J.L.; data curation, L.X.; writing—original draft preparation, L.X.; writing—review and editing, L.X. and E.J.; visualization, W.Z.; supervision, E.J.; project administration, J.L. All authors have read and agreed to the published version of the manuscript.
Funding
This research was funded by This research was funded by [Special Project of National Natural Science Fund], grant number [42041004,42041006], [Key Project of National Natural Science Fund], grant number [51539004], [National Natural Science Foundation of China], grant number [51809106], [Special Project of Basic Scientific Research Business Expenses of Central Public Welfare Research Institutes], grant number [HKY-JBYW-2018-03, HKY-JBYW-2020-15].
Institutional Review Board Statement
Not applicable.
Informed Consent Statement
Not applicable.
Data Availability Statement
The data presented in this study are available on request from the corresponding author.
Acknowledgments
We would like to thank the potential reviewer very much for their valuable comments and suggestions. We also thank my other colleagues’ valuable comments and suggestions that have helped improve the manuscript.
Conflicts of Interest
The authors declare no conflict of interest.
References
- Hu, Y.S. Evolution of river regime of the Yellow River. J. Hydraul. Eng. 2003, 4, 8–13. [Google Scholar] [CrossRef]
- Xu, G.B.; Si, C.D. Effect of water and sediment regulation on lower Yellow River. Trans. Tianjin Univ. 2009, 15, 113–120. [Google Scholar] [CrossRef]
- Hu, Y.S.; Jiang, E.H.; Cao, C.S.; Cao, Y.T.; Zhang, X.H.; Li, Y.Q. Yellow River Regulation; Science Press: Beijing, China, 2020. [Google Scholar]
- Jiang, E.H.; Cao, Y.T. General Report on River Regime Evolution Mechanism and Some Key Technologies of River Regulation in Wandering Reach of the Lower Yellow River; Yellow River Institute of Hydraulic Research: Zhengzhou, China, 2005. [Google Scholar]
- Wang, C.; Lu, W.; Lin, S.F.; Bao, J.P. Analysis on construction and effect of river regulation project in the lower Yellow River. Water Conserv. Sci. Technol. Econ. 2013, 19, 15–16. [Google Scholar]
- Zhang, H.W.; Jiang, E.H. Model Test Study on River Regulation from Huayuankou to Dongbatou of the Yellow River; The Yellow River Water Conservancy Press: Zhengzhou, China, 2000. [Google Scholar]
- Li, J.H.; Xu, L.J.; Jiang, E.H. Objective and Countermeasures of the Improvement of Wandering River Channel in the Lower Yellow River. Yellow River 2020, 42, 81–85, 116. [Google Scholar] [CrossRef]
- Liu, Y.; Li, J.H.; Dong, Q.H.; Yu, K.Z. Effect of River Regime Control after Continuation of Training Projects in the Lower Yellow River. Yellow River 2020, 42, 86–89. [Google Scholar] [CrossRef]
- Zhang, J.H. River Regulation and Dike Management; The Yellow River Water Conservancy Press: Zhengzhou, China, 1998. [Google Scholar]
- Li, J.H.; Jiang, E.H.; Cao, Y.T.; Li, J.; Ma, P.Z. Study on Layout of River Training Works at Braided Channel of the Lower Yellow River. Yellow River 2008, 6, 21–23. [Google Scholar] [CrossRef]
- Zhang, Y.X.; Jiao, A.P. Development of Sediment-laden Flow Movement Law Research in the River Bend. J. Sediment Res. 2002, 2, 53–58. [Google Scholar] [CrossRef]
- Liu, Y. Experimental study on the influence of river regulation works on the wandering reach of the lower Yellow River. In Proceedings of the 18th National Symposium on hydrodynamics, Urumchi, China, 30 June 2004. [Google Scholar]
- Zhang, H.W.; Zhao, L.J.; Cao, F.S. Research of the cause of formation of wandering river model and its changes. Yellow River 1996, 10, 11–15, 61. [Google Scholar]
- Jiang, E.H.; Liang, Y.P.; Zhang, Y.F.; Zhang, Q. Study for designs of river training works in wandering reach of the Lower Yellow River under new circumstances. J. Sediment Res. 1999, 4, 28–33. [Google Scholar] [CrossRef]
- Li, Y.Q.; Zhang, B.; Liu, X. Discussion on the length of straight reaches of the lower Yellow River training works layout. Yellow River 2014, 36, 28–30. [Google Scholar] [CrossRef]
- Zhang, H.W.; Bu, H.L. Length formula of straight river in river regulation project of Lower Yellow River. Yellow River 2013, 35, 1–3, 6. [Google Scholar] [CrossRef]
- Li, X.J.; Geng, M.Q. Discussion on the influence of hydraulic projects for the floodplain flow in lower stream of Yellow River. China Water Resour. 2017, 15, 43, 53–56. [Google Scholar] [CrossRef]
- Xia, J.Q.; Li, J.; Zhang, S.Y. Channel adjustments in the Lower Yellow River after the operation of Xiaolangdi reservoir. Yellow River 2016, 38, 49–55. [Google Scholar] [CrossRef]
- Yu, Y.; Xia, J.Q.; Li, J.; Zhang, X.L. Influences of the Xiaolangdi Reservoir on the channel geometry and flow capacity of wandering reach in the Lower Yellow River. J. Sediment Res. 2020, 45, 7–15. [Google Scholar] [CrossRef]
- Li, J.; Xia, J.Q.; Zhang, S.Y. Variation in width-depth ratio of the braided reach in the Lower Yellow River undergoing hyper concentrated flood processes. Yellow River 2016, 38, 26–30. [Google Scholar] [CrossRef]
- Shen, G.Q.; Zhang, Y.F.; Zhang, M. Definition of channel and floodplain and spatial-temporal sedimentation characteristics for overbank hyper concentrated flood in the lower Yellow River. Adv. Water Sci. 2017, 28, 641–651. [Google Scholar] [CrossRef]
- Li, X.J.; Xia, J.Q.; Li, J.; Zhang, X.L. Variation in bankfull channel geometry in the LYR undergoing continuous aggradation and degradation. J. Sichuan Univ. 2015, 47, 97–104. [Google Scholar] [CrossRef]
- Cheng, Y.F.; Xia, J.Q.; Zhou, M.R.; Deng, S.S. Response of flood discharge capacity to the incoming flow and sediment regime and channel geometry in the braided reach of the Lower Yellow River. Adv. Water Sci. 2020, 31, 337–347. [Google Scholar] [CrossRef]
- Wu, B.S.; Li, L.Y. Characteristics of cross-section in the lower channel of the Yellow River. Yellow River 2008, 2, 15–16, 79. [Google Scholar] [CrossRef]
- Jiang, E.H.; Zhao, L.J.; Zhang, H.W. Numerical Models of Flood Routing and Morphological Changes in Sediment-Laden Rivers and Applications; The Yellow River Water Conservancy Press: Zhengzhou, China, 2008. [Google Scholar]
- Zhao, L.J.; Tan, G.M.; Wei, Z.L. Calculation of Gradation Distribution and Average Mixed Deposition Rate of Suspended Sediment in Natural River. China Rural Water Hydropower 2004, 9, 40–42. [Google Scholar]
Figure 1.
River channel with a finite control boundary: (a) Local reach in the lower Yellow River; (b) river regulation project in the lower Yellow River.
Figure 1.
River channel with a finite control boundary: (a) Local reach in the lower Yellow River; (b) river regulation project in the lower Yellow River.

Figure 2.
Density of wandering river regulation works in the lower Yellow River from 1960 to 2014.

Figure 3.
Verification of transverse velocity distribution by flow data before, and during flood season: (a) Tiexie, 24 April 1966 (before flood season); (b) Peiyu, 23 July 1966 (flood season); (c) Guanzhuangyu, 1 April 1966 (before flood season); (d) Huayuankou, 23 May 1966 (flood season); (e) Tiexie, 2 July 1966 (flood season); (f) Guanzhuangyu, 24 July 1966 (flood season).

Figure 4.
Verification of formula 9 by flood data with different sediment concentration: (a) low sediment concentration flood; (b) medium sediment concentration flood; and (c) high sediment concentration flood.
Figure 4.
Verification of formula 9 by flood data with different sediment concentration: (a) low sediment concentration flood; (b) medium sediment concentration flood; and (c) high sediment concentration flood.

Figure 5.
Verification of Formula (16) with different suspended sand particle size data: (a) dcp = 0.0196 mm; (b) dcp = 0.026 mm; (c) dcp = 0.0357 mm; (d) dcp = 0.045 mm; and (e) dcp = 0.0509 mm.
Figure 5.
Verification of Formula (16) with different suspended sand particle size data: (a) dcp = 0.0196 mm; (b) dcp = 0.026 mm; (c) dcp = 0.0357 mm; (d) dcp = 0.045 mm; and (e) dcp = 0.0509 mm.

Figure 6.
Asymmetry of channel cross-section in wandering section of the lower Yellow River.

Figure 7.
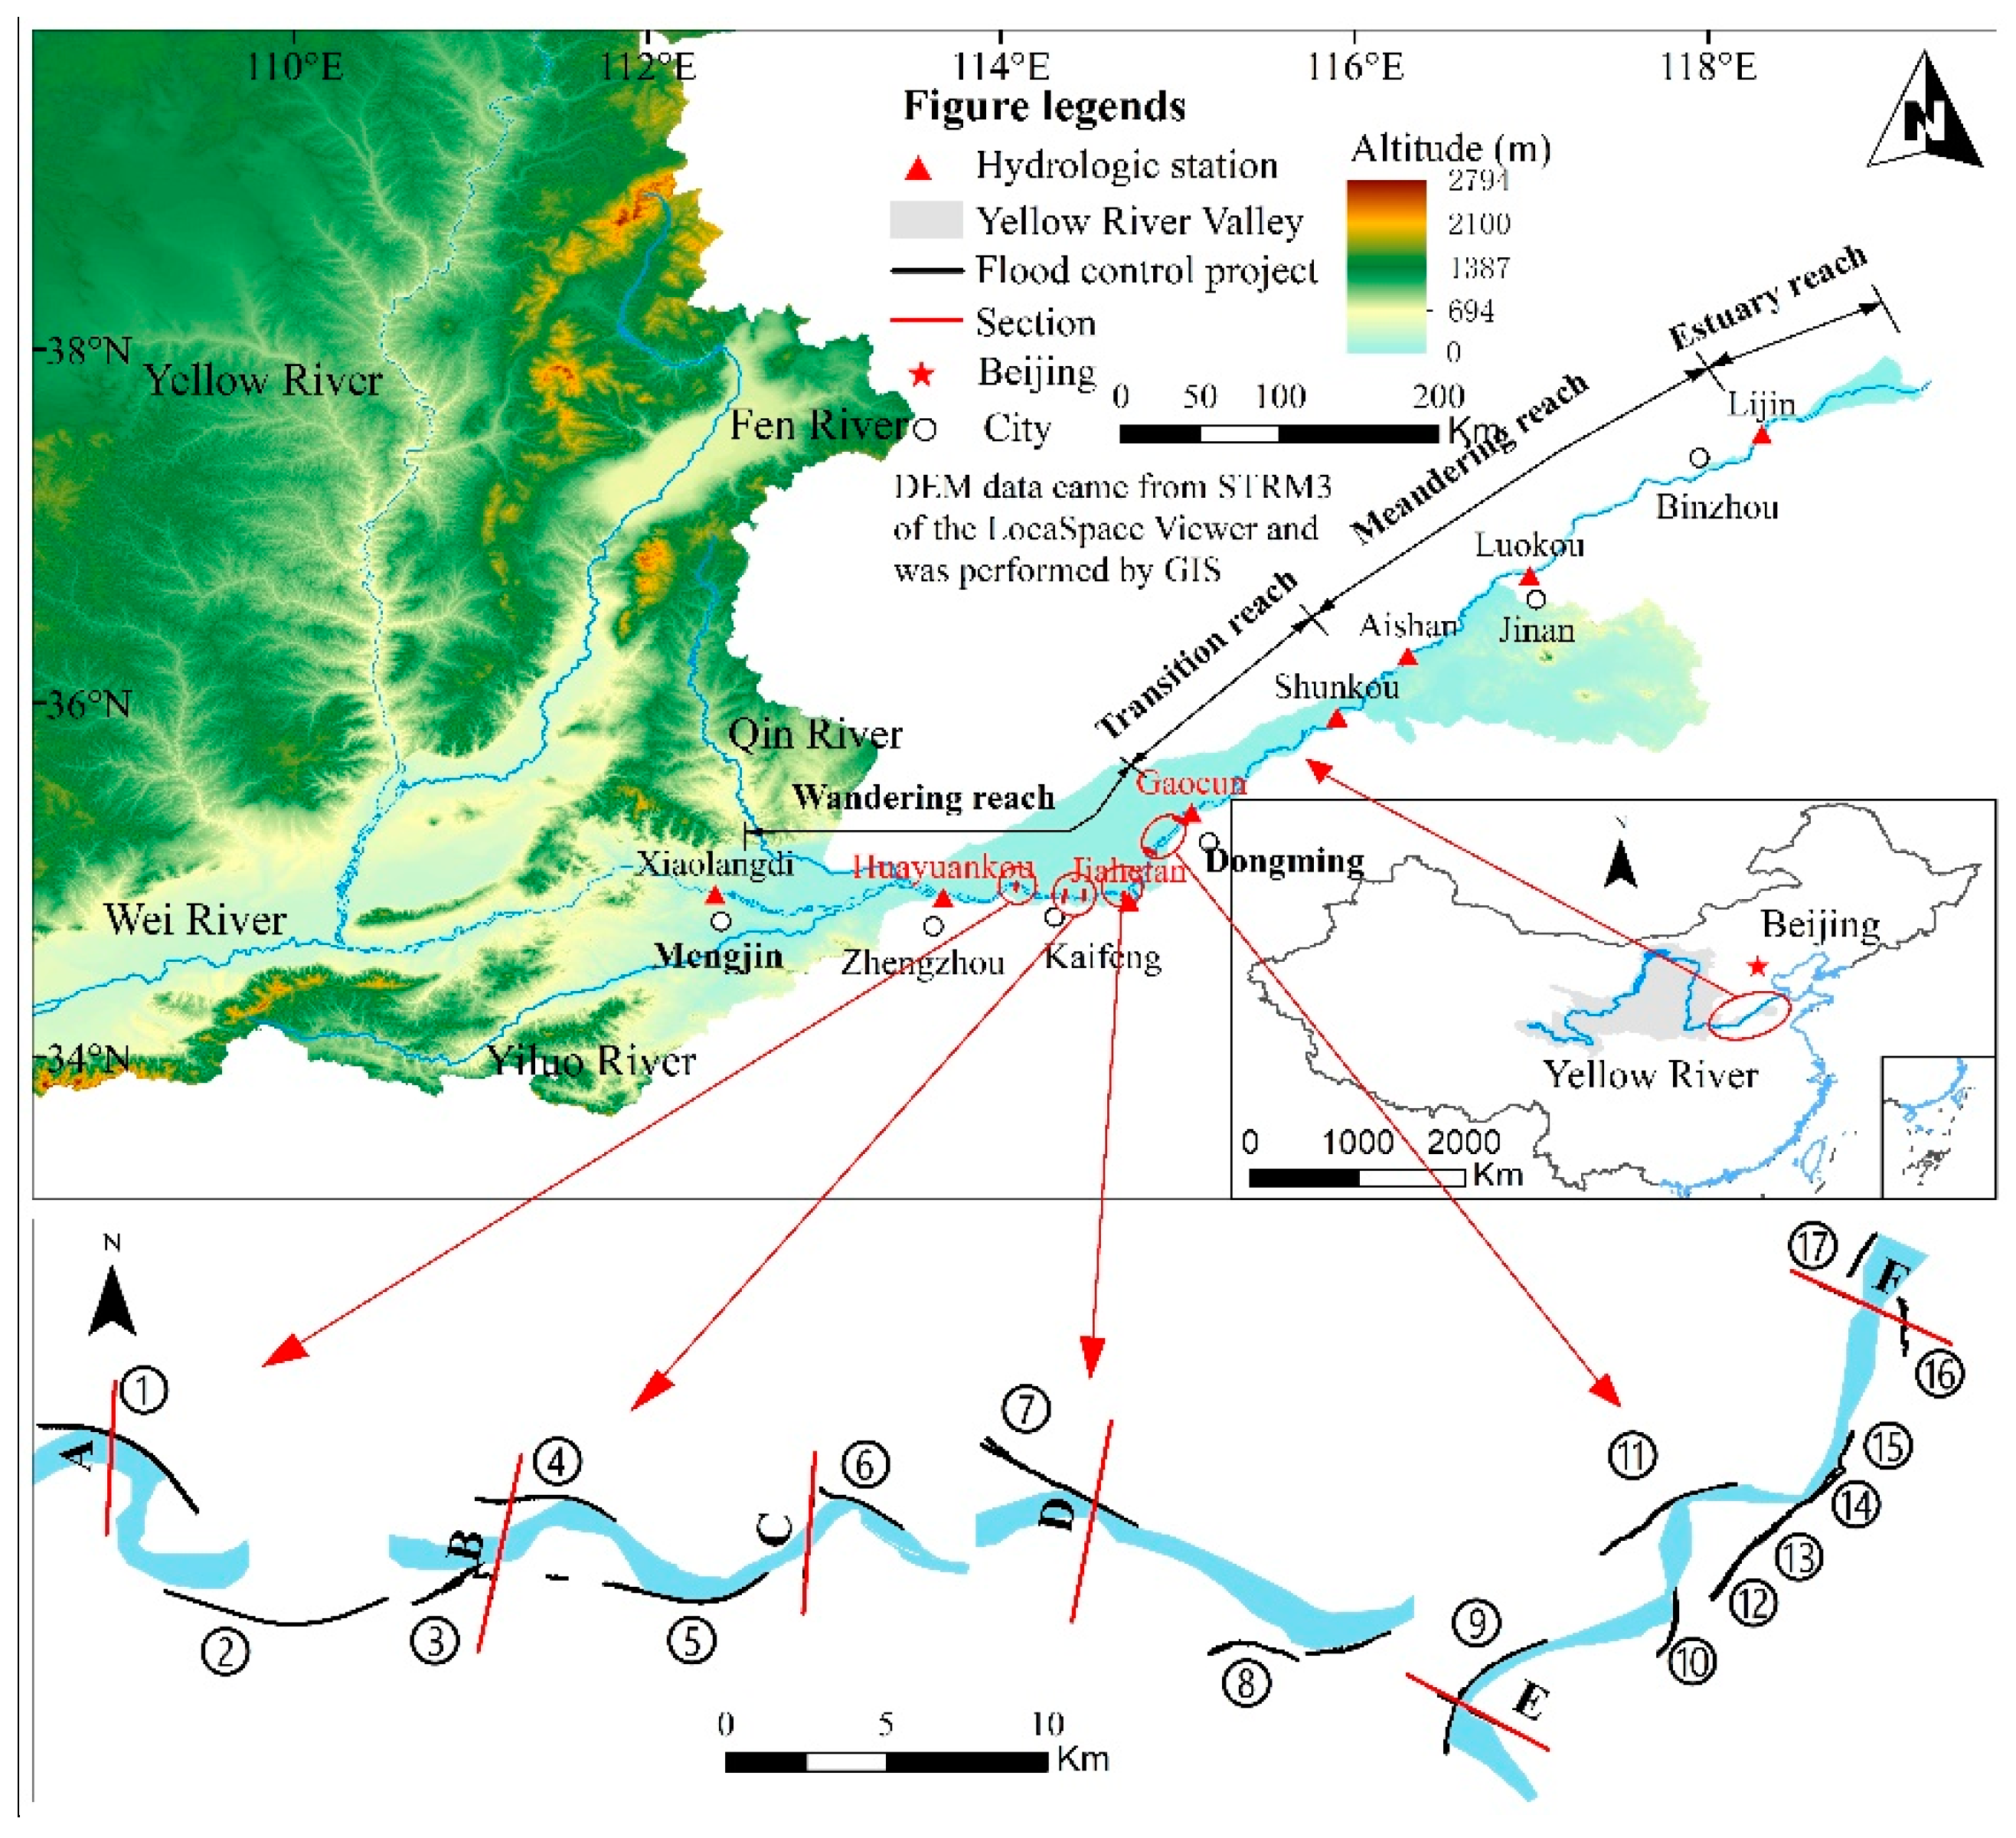
Wandering reach of the lower Yellow River (Heishi–Hedao): ① Sanguanmiao control project ② Weitan control project ③ Liuyuankou extension project ④ Dagong project ⑤ WANGan project ⑥ Gucheng project ⑦ Guantai project ⑧ Jiahetan project ⑨ Zhouying project ⑩ Laojuntang project ⑪ Yulin project ⑫ Wuzhuang vulnerable project ⑬ Huangzhai vulnerable project ⑭ Huozhai vulnerable project ⑮ Baocheng vulnerable project ⑯ Hedao project ⑰ Sanhecun project. A. Heishi section, B. Liuyuankou section, C. Gucheng section, D. Jiahetan section, E. Mazhai section, and F. Hedao section.
Figure 7.
Wandering reach of the lower Yellow River (Heishi–Hedao): ① Sanguanmiao control project ② Weitan control project ③ Liuyuankou extension project ④ Dagong project ⑤ WANGan project ⑥ Gucheng project ⑦ Guantai project ⑧ Jiahetan project ⑨ Zhouying project ⑩ Laojuntang project ⑪ Yulin project ⑫ Wuzhuang vulnerable project ⑬ Huangzhai vulnerable project ⑭ Huozhai vulnerable project ⑮ Baocheng vulnerable project ⑯ Hedao project ⑰ Sanhecun project. A. Heishi section, B. Liuyuankou section, C. Gucheng section, D. Jiahetan section, E. Mazhai section, and F. Hedao section.

Figure 8.
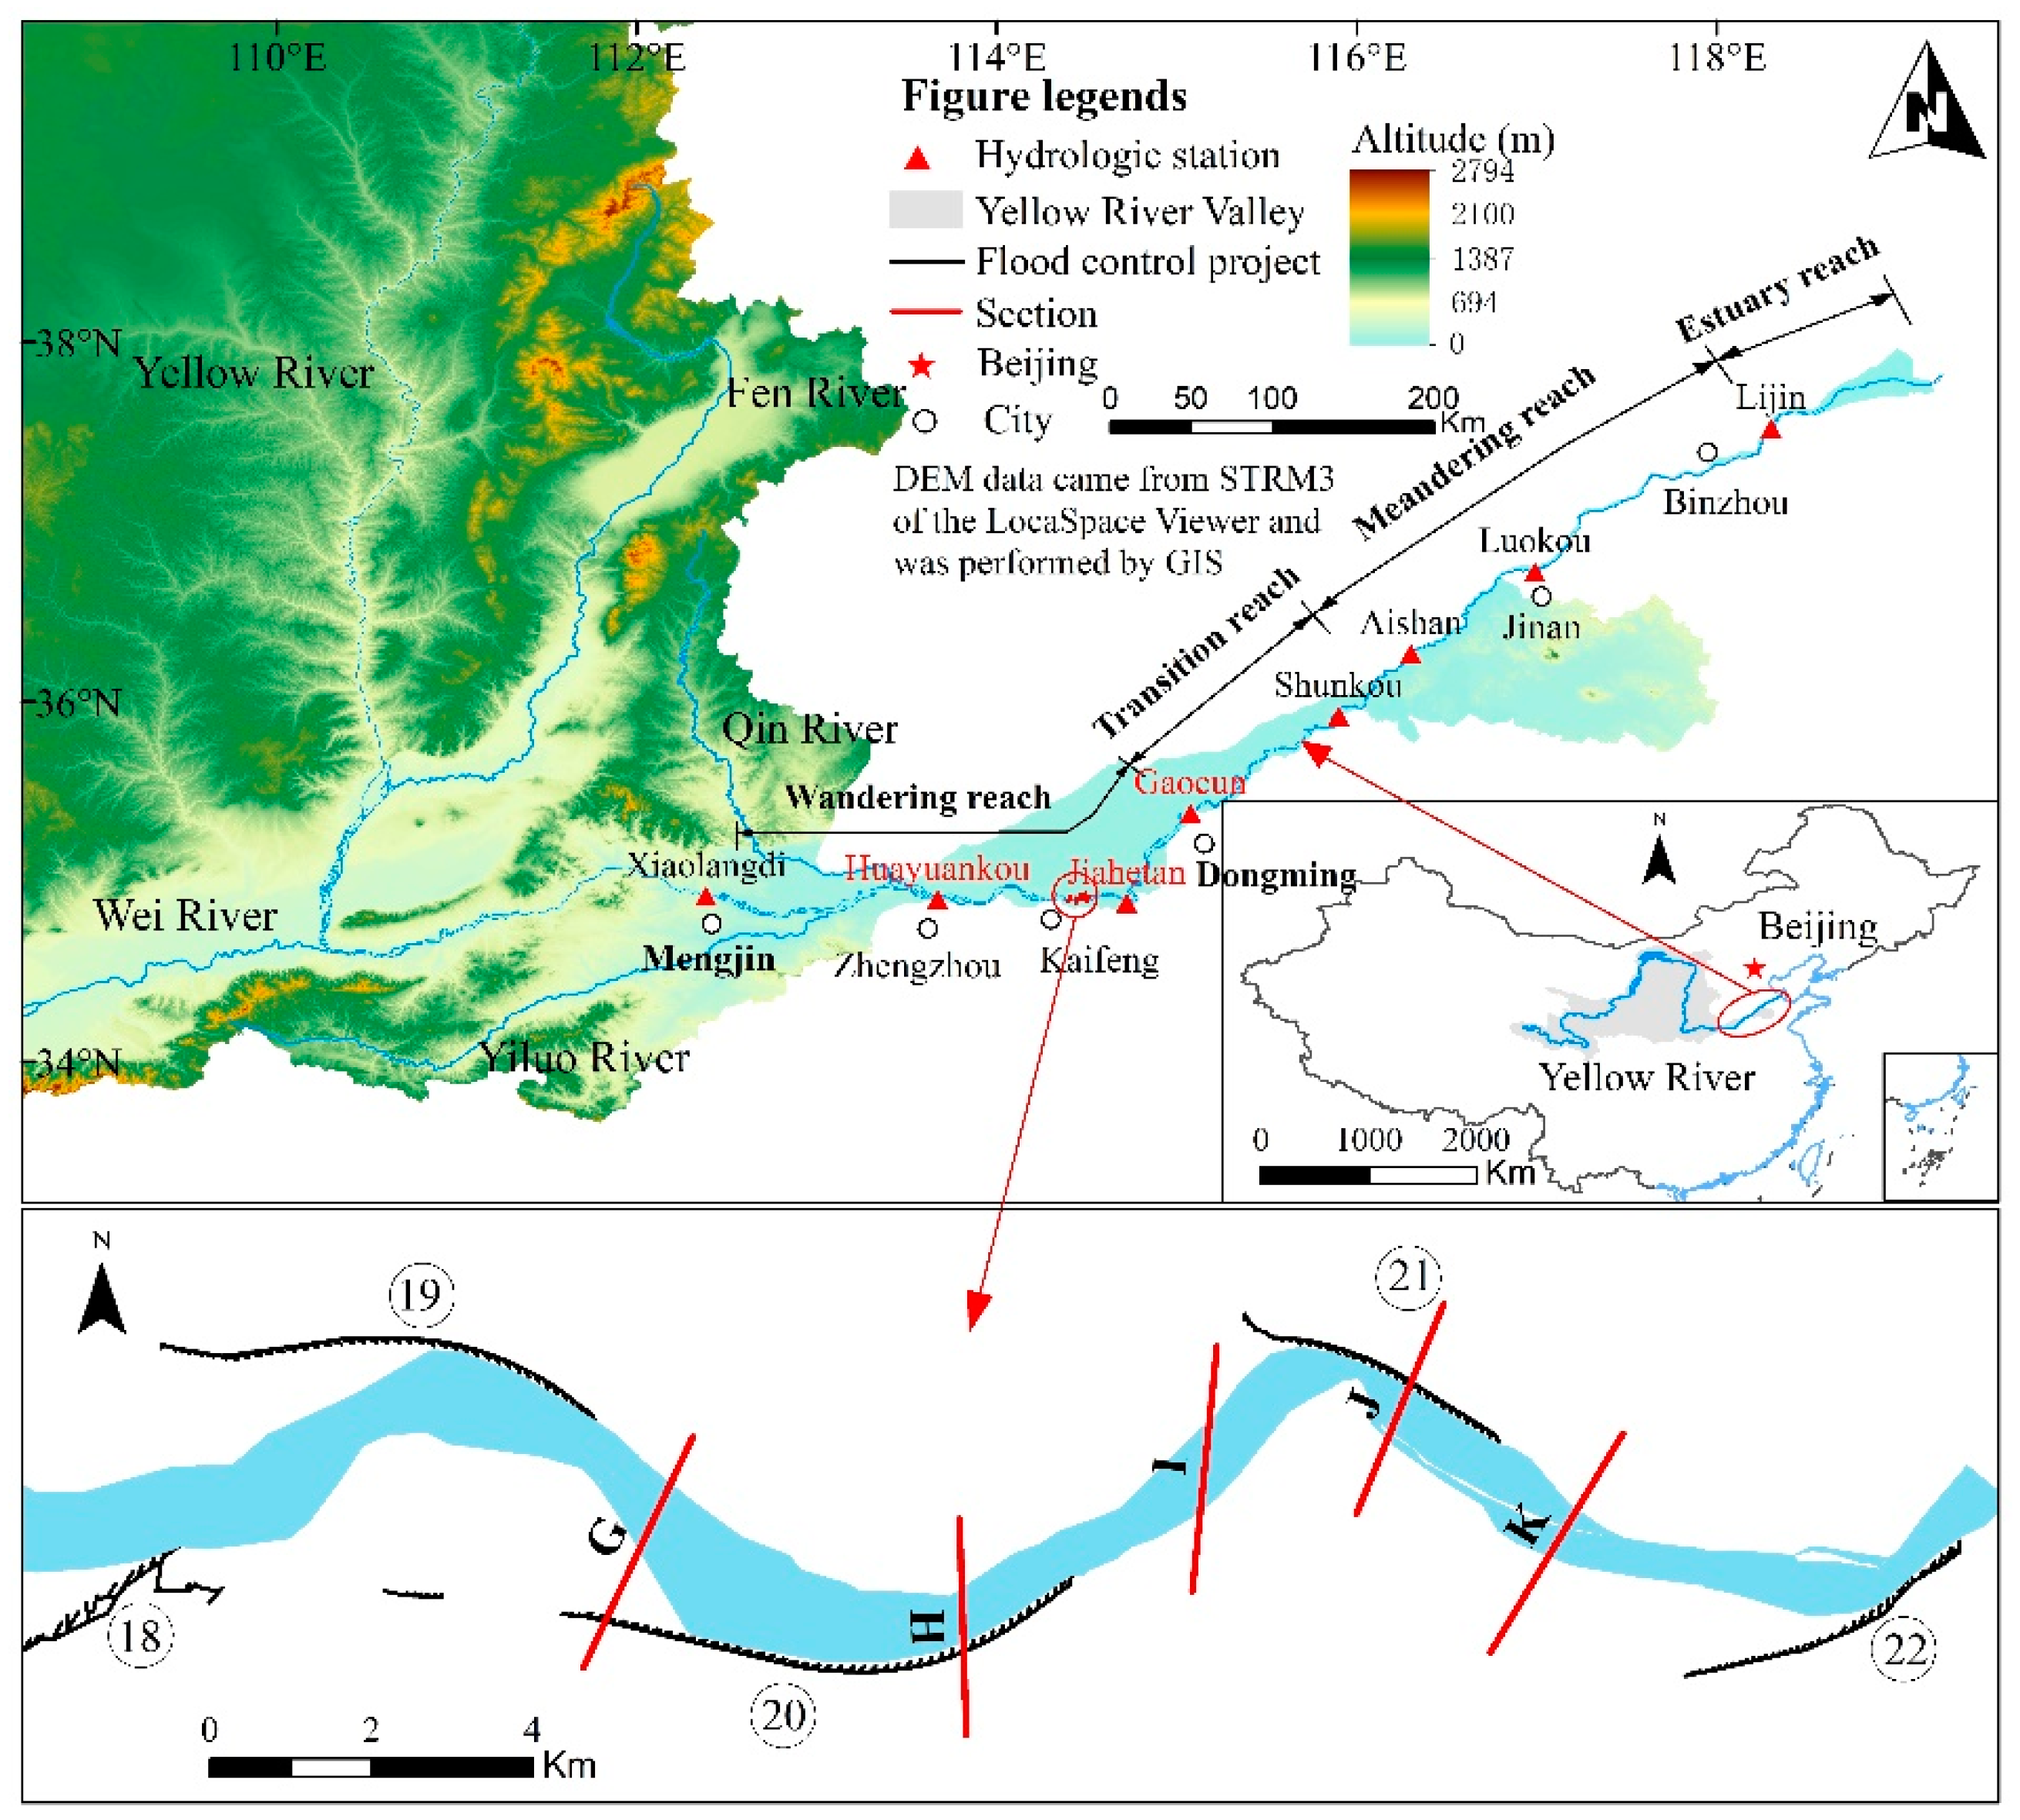
Wandering reach of the lower Yellow River (Fanzhuang–Yuanfang): ⑱ Liuyuankou extension project ⑲ Dagong project ⑳ Wangan project ㉑ Gucheng project ㉒ Fujunshi project G. Fanzhuang section, H. Sizhuang section, I. Gucheng section, J. Chenqiao section, and K. Yuanfang section.
Figure 8.
Wandering reach of the lower Yellow River (Fanzhuang–Yuanfang): ⑱ Liuyuankou extension project ⑲ Dagong project ⑳ Wangan project ㉑ Gucheng project ㉒ Fujunshi project G. Fanzhuang section, H. Sizhuang section, I. Gucheng section, J. Chenqiao section, and K. Yuanfang section.


Table 1.
Asymmetry index of the Heishi–Hedao river reach.
| Asymmetry Index | Heishi (Bend Top Section) | Liuyuankou (Transition Section) | Gucheng (Bend Top Section) | Jiahetan (Transition Section) | Mazhai (Bend Top Section) | Hedao (Transition Section) |
|---|---|---|---|---|---|---|
| ASA | 1.37 | 1.13 | 1.45 | 1.14 | 1.53 | 1.21 |
| ASV | 1.22 | 1.08 | 1.29 | 1.10 | 1.43 | 1.14 |
| ASS | 1.07 | 1.03 | 1.10 | 1.02 | 1.15 | 1.05 |
| ASdcp | 1.06 | 1.02 | 1.08 | 1.01 | 1.09 | 1.05 |
| ASS* | 1.30 | 1.11 | 1.38 | 1.13 | 1.43 | 1.19 |
Table 2.
Verification of scouring and silting state of each section of Heishi–Hedao river reach (5000 m3/s).
Table 2.
Verification of scouring and silting state of each section of Heishi–Hedao river reach (5000 m3/s).
| Scouring and Silting State of Section | Sediment Concentration (kg/m3) ① | Calculation of the Sediment Carrying Capacity with Each Section (kg/m3) | |||||||
|---|---|---|---|---|---|---|---|---|---|
| Heishi (Bend Top Section) | Liuyuankou (Transition Section) | Gucheng (Bend Top Section) | Jiahetan (Transition Section) | Mazhai (Bend Top Section) | Hedao (Transition Section) | Average Value ② | Scouring and Silting Difference ①–② | ||
| Scouring and Silting Balance | 23 | 25.84 | 22.47 | 25.63 | 21.95 | 22.80 | 19.04 | 22.96 | 0.04 |
| Scouring State | 5 | 12.53 | 10.90 | 12.43 | 10.64 | 11.05 | 9.23 | 11.13 | −6.13 |
| Siltation State | 50 | 45.07 | 39.19 | 44.69 | 38.28 | 39.75 | 33.19 | 40.03 | 9.97 |
Table 3.
Asymmetry index of wandering river bend top and transition section (scouring and silting balance, S = 32 kg/m3).
Table 3.
Asymmetry index of wandering river bend top and transition section (scouring and silting balance, S = 32 kg/m3).
| Asymmetry Index | Fanzhuang (Transition Section) | Sizhuang (Bend Top Section) | Gucheng (Transition Section) | Chenqiao (Bend top Section) | Yuanfang (Transition Section) |
|---|---|---|---|---|---|
| ASA | 1.57 | 1.66 | 1.27 | 1.64 | 1.37 |
| ASV | 1.37 | 1.45 | 1.18 | 1.66 | 1.24 |
| ASS | 1.14 | 1.19 | 1.07 | 1.65 | 1.10 |
| ASdcp | 1.12 | 1.17 | 1.06 | 1.65 | 1.08 |
| ASS* | 1.49 | 1.58 | 1.23 | 1.66 | 1.32 |
Table 4.
Asymmetry index of wandering river bend top and transition section (scouring state, S = 5 kg/m3).
Table 4.
Asymmetry index of wandering river bend top and transition section (scouring state, S = 5 kg/m3).
| Asymmetry Index | Fanzhuang (Transition Section) | Sizhuang (Bend top Section) | Gucheng (Transition Section) | Chenqiao (Bend top Section) | Yuanfang (Transition Section) |
|---|---|---|---|---|---|
| ASA | 1.57 | 1.66 | 1.27 | 1.64 | 1.37 |
| ASV | 1.37 | 1.45 | 1.18 | 1.66 | 1.24 |
| ASS | 1.13 | 1.18 | 1.06 | 1.65 | 1.09 |
| ASdcp | 1.12 | 1.16 | 1.05 | 1.65 | 1.08 |
| ASS* | 1.49 | 1.58 | 1.23 | 1.66 | 1.32 |
Table 5.
Asymmetry index of wandering river bend top and transition section (silting state, S = 90 kg/m3).
Table 5.
Asymmetry index of wandering river bend top and transition section (silting state, S = 90 kg/m3).
| Asymmetry Index | Fanzhuang (Transition Section) | Sizhuang (Bend Top Section) | Gucheng (Transition Section) | Chenqiao (Bend Top Section) | Yuanfang (Transition Section) |
|---|---|---|---|---|---|
| ASA | 1.57 | 1.66 | 1.27 | 1.64 | 1.37 |
| ASV | 1.48 | 1.28 | 1.39 | 1.21 | 1.53 |
| ASS | 1.30 | 1.18 | 1.25 | 1.14 | 1.33 |
| ASdcp | 1.13 | 1.07 | 1.10 | 1.06 | 1.14 |
| ASS* | 1.10 | 1.06 | 1.09 | 1.05 | 1.11 |
Table 6.
Validation of scouring and silting state of Fanzhuang–Yuanfang section (5000 m3/s).
| Scouring and Silting State of Section | Sediment Concentration (kg/m3) ① | Calculation of the Sediment Carrying Capacity with Each Section (kg/m³) | Scouring and Silting Difference ①–② | |||||
|---|---|---|---|---|---|---|---|---|
| Fanzhuang (Transition Section) | Sizhuang (Bend Top Section) | Gucheng (Transition Section) | Chenqiao (Bend Top Section) | Yuanfang (Transition Section) | Average Value ② | |||
| Scouring and Silting Balance | 32 | 31.61 | 33.19 | 26.92 | 33.74 | 31.31 | 31.35 | 0.65 |
| Scouring State | 5 | 12.31 | 12.93 | 10.49 | 13.14 | 12.19 | 12.21 | −7.21 |
| Silting State | 90 | 75.62 | 79.38 | 64.40 | 80.72 | 74.88 | 75.00 | 15.00 |
Table 7.
Comparison of asymmetry indexes of various factors before and after construction.
| Section | Asymmetry Index | 1979 (Before Construction) | 2018 (After Construction) | Asymmetry Index Change (%) | ||
|---|---|---|---|---|---|---|
| Variation Range | Average Value ① | Variation Range | Average Value ② | (②–①)/① | ||
| Bend Top Section | ASA | 1.37–1.53 | 1.45 | 1.64–1.66 | 1.65 | 13.79 |
| ASV | 1.22–1.43 | 1.31 | 1.45–1.65 | 1.56 | 19.08 | |
| ASS | 1.07–1.15 | 1.11 | 1.19–1.65 | 1.42 | 27.93 | |
| ASdcp | 1.06–1.09 | 1.08 | 1.17–1.65 | 1.41 | 30.56 | |
| ASS* | 1.30–1.43 | 1.37 | 1.58–1.66 | 1.62 | 18.25 | |
| Transition Section | ASA | 1.13–1.21 | 1.16 | 1.27–1.57 | 1.40 | 20.69 |
| ASV | 1.08–1.14 | 1.11 | 1.18–1.37 | 1.26 | 13.51 | |
| ASS | 1.02–1.05 | 1.03 | 1.07–1.14 | 1.10 | 6.80 | |
| ASdcp | 1.01–1.05 | 1.03 | 1.06–1.12 | 1.09 | 5.83 | |
| ASS* | 1.11–1.19 | 1.14 | 1.23–1.49 | 1.35 | 18.42 | |
Table 8.
Verification of scouring and silting state of each section before the construction project (800 m³/s).
Table 8.
Verification of scouring and silting state of each section before the construction project (800 m³/s).
| State of Section | Year | Sediment Concentration (kg/m3) ① | Calculation of the Sediment Carrying Capacity with Each Section (kg/m3) | |||||||
|---|---|---|---|---|---|---|---|---|---|---|
| Heishi (Bend Top Section) | Liuyuankou (Transition Section) | Gucheng (Bend Top Section) | Jiahetan (Transition Section) | Mazhai (Bend Top Section) | Hedao (Transition Section) | Average Value ② | Scouring and Silting Difference ①–② | |||
| Scouring and Silting Balance | 1979 | 7 | 9.06 | 8.77 | 6.06 | 5.59 | 7.86 | 4.84 | 7.03 | −0.03 |
Table 9.
Verification of scouring and silting state of each section after the construction project (800 m³/s).
Table 9.
Verification of scouring and silting state of each section after the construction project (800 m³/s).
| State of Section | Year | Sediment Concentration (kg/m3) ① | Calculation of the Sediment Carrying Capacity with Each Section (kg/m3) | ||||||
|---|---|---|---|---|---|---|---|---|---|
| Fanzhuang (Transition Section) | Sizhuang (Bend Top Section) | Gucheng (Transition Section) | Chenqiao (Bend top Section) | Yuanfang (Transition Section) | Average Value ② | Scouring and Silting Difference ①–② | |||
| Scouring and Silting Balance | 2018 | 7 | 8.21 | 7.33 | 5.47 | 7.04 | 6.12 | 6.83 | 0.17 |
Publisher’s Note: MDPI stays neutral with regard to jurisdictional claims in published maps and institutional affiliations. |
© 2022 by the authors. Licensee MDPI, Basel, Switzerland. This article is an open access article distributed under the terms and conditions of the Creative Commons Attribution (CC BY) license (https://creativecommons.org/licenses/by/4.0/).
Share and Cite
MDPI and ACS Style
Xu, L.; Jiang, E.; Zhao, L.; Li, J.; Zhao, W.; Zhang, M. Research on the Asymmetry of Cross-Sectional Shape and Water and Sediment Distribution in Wandering Channel. Water 2022, 14, 1214. https://doi.org/10.3390/w14081214
AMA Style
Xu L, Jiang E, Zhao L, Li J, Zhao W, Zhang M. Research on the Asymmetry of Cross-Sectional Shape and Water and Sediment Distribution in Wandering Channel. Water. 2022; 14(8):1214. https://doi.org/10.3390/w14081214
Chicago/Turabian StyleXu, Linjuan, Enhui Jiang, Lianjun Zhao, Junhua Li, Wanjie Zhao, and Mingwu Zhang. 2022. "Research on the Asymmetry of Cross-Sectional Shape and Water and Sediment Distribution in Wandering Channel" Water 14, no. 8: 1214. https://doi.org/10.3390/w14081214
Note that from the first issue of 2016, this journal uses article numbers instead of page numbers. See further details here.