Article

Transport of Potentially Toxic Elements in Solid Particulate Matter during Flash Flood Events in Upper and Lower Stretch of the Sava River

by
Tea Zuliani
1,2,*,
Janja Vidmar
1,2,
Janez Ščančar
1,2,
Margareta Kračun Kolarević
3,
Stoimir Kolarević
3,
Momir Paunović
3 and
Radmila Milačič
1,2
1
Department of Environmental Sciences, Jožef Stefan Institute, Jamova 39, 1000 Ljubljana, Slovenia
2
Jožef Stefan International Postgraduate School, Jamova 39, 1000 Ljubljana, Slovenia
3
Institute for Biological Research “Siniša Stanković”, University of Belgrade, Bulevar Despota Stefana 142, 11060 Belgrade, Serbia
*
Author to whom correspondence should be addressed.
Water 2022, 14(8), 1213; https://doi.org/10.3390/w14081213
Submission received: 1 February 2022 / Revised: 15 March 2022 / Accepted: 4 April 2022 / Published: 9 April 2022
(This article belongs to the Special Issue Freshwater Ecosystems under Anthropogenic Stress)

Abstract

:
During extreme hydrological conditions such as flood events, sediments and alluvial soils may become re-suspended. As a consequence, the concentration of solid particulate matter (SPM) in the water column increases. As sediments represent a sink for the contaminants, when such perturbation occurs, the toxic substances may be re-dissolved into the water, causing harmful effects to the freshwater habitat. The purpose of this study was to evaluate the release of potentially toxic elements associated to SPM during flash floods. Two sampling sites on the Sava River were chosen: Litija (Slovenia), where the river has still the characteristics of an alpine river, and in Belgrade (Serbia), where Sava is a lowland river with a flat riverbed, slower flow and bigger quantities of fine-grained sediment. The results of the study showed a good correlation between the SPM mass concentration and water level/discharge. At both sampling sites, elevated concentrations of As, Cd, Cr, Cu, Pb, Ni and Zn were determined in SPM, indicating a moderate level of contamination at Litija and a high level at Belgrade. The results demonstrated that during the two investigated flash flood events limited the dissolution of PTE from SPM-bearing particles.

1. Introduction

The aquatic systems that were once controlled by climate, relief, vegetation and lithology are nowadays severely influenced by population growth, urbanization, industrialization and water engineering, resulting in pollution with different kind of toxic compounds. Potentially toxic elements (PTE) such as Pb, As, Cd, Cr, Zn, Cu and Ni are an example of these compounds, being the most important inorganic contaminants of the aquatic environment [1]. Naturally, they originate from the weathering of the parent materials and/or soils [2,3]. Nevertheless, in urbanized and industrialized areas, through time, the levels of PTE in the aquatic environment has increased as a consequence of urban runoff, agriculture, combustion of fossil fuels, cement production, mining, extractive metallurgy, pulp and paper production, etc [4,5]. PTE of anthropogenic origin may be highly mobile and bioavailable. Therefore, they could more likely have a negative impact on the aquatic ecosystems [6].
When present in the river water, it is likely that PTE will be removed by the suspended solids or sediments because of adsorption, hydrolysis and co-precipitation [1,7]. In sediments, PTE are preferentially bound to fine particle fractions. During extreme hydrological conditions such as flood events, sediments may become re-suspended. As a consequence, the fine sediment fraction is disturbed, and the concentration of solid particular matter (SPM) in the water column is increased. In this way, the pollutants may be transported long distances, with rivers being their most important route [8]. In addition to riverbed sediments, other channel sources of SPM are mid-channel and point bars, fine particles associated with aquatic vegetation, and other biotic particles such as phyto- and zooplankton [9]. There exist also non-channel sources of SPM, such as exposed soil subject to erosion, litter fall and atmospheric deposition [9].
The transport or release of PTE in the water column can be influenced by numerous parameters, such as the nature of the element and the physico-chemical conditions in the water column and of the SPM, comprising the grain size, surface area, mineralogy and organic composition of the natural SPM [3,10].
The transport of SPM and dissolved matter during a flood event depends on the spatial and temporal distribution of the rainfall, as well as the particle size distribution of the sediment, the gradient of channel-bed, and the adaptability of the flora and fauna in the river channel [11]. Occasional periodic increases in both suspended and deposited sediment are a natural phenomenon, and river habitats can adapt to a range of sediment concentrations resulting from natural events. If the rate and magnitude of sediment loading resulting from human activities exceed those of natural events, this can put serious stresses on watercourses and associated habitats [12].
The distribution coefficient (KD) between SPM and water has been widely used to analyse the migration and transformation of pollutants in field and laboratory tests [6,13]. It was often combined with other influential factors (such as pH and dissolved oxygen) in order to model the transfer trend of pollutants [13,14]. Detailed knowledge of the main sources of pollutants in the river basin and their transport behaviour is needed to promote the sustainable development of the river system with regard to the protection of floodplains and the sea. Therefore, it is of upmost importance that the transport pathways of sediments and SPM are well studied, and that the fluxes of PTE are accurately estimated [15,16,17]. Moreover, the study of PTE bound to SPM is important for their hazard assessment during floods.
The Sava River, with its 97,713.20 km2 large catchment, is the major draining basin in south-eastern Europe and the biggest tributary of the Danube River. It flows through Slovenia, Croatia, Bosnia, and Herzegovina and Serbia. In its upper reaches, it has a steep riverbed with an average slope of 0.07‰. It is formed of coarse-grained sediment in prevailing limestone bedrock. From Croatia, downstream the Sava River changes to a lowland river, with a flat riverbed formed from alluvial sediments [18]. At its spring, the Sava River is still pristine, while in the downstream direction the anthropogenic stress increases. Concentrations of PTE in the water, sediments and SPM are the highest near the confluence with the Danube River [19].The ecological status of the Sava River has already been evaluated in different studies [18,19,20,21,22,23,24,25], but none have considered the role of the SPM to the transport of PTE, especially during extreme water conditions. The aim of the present study was to evaluate the release, partitioning and transport of PTE associated with SPM during flash flood events.

2. Materials and Methods

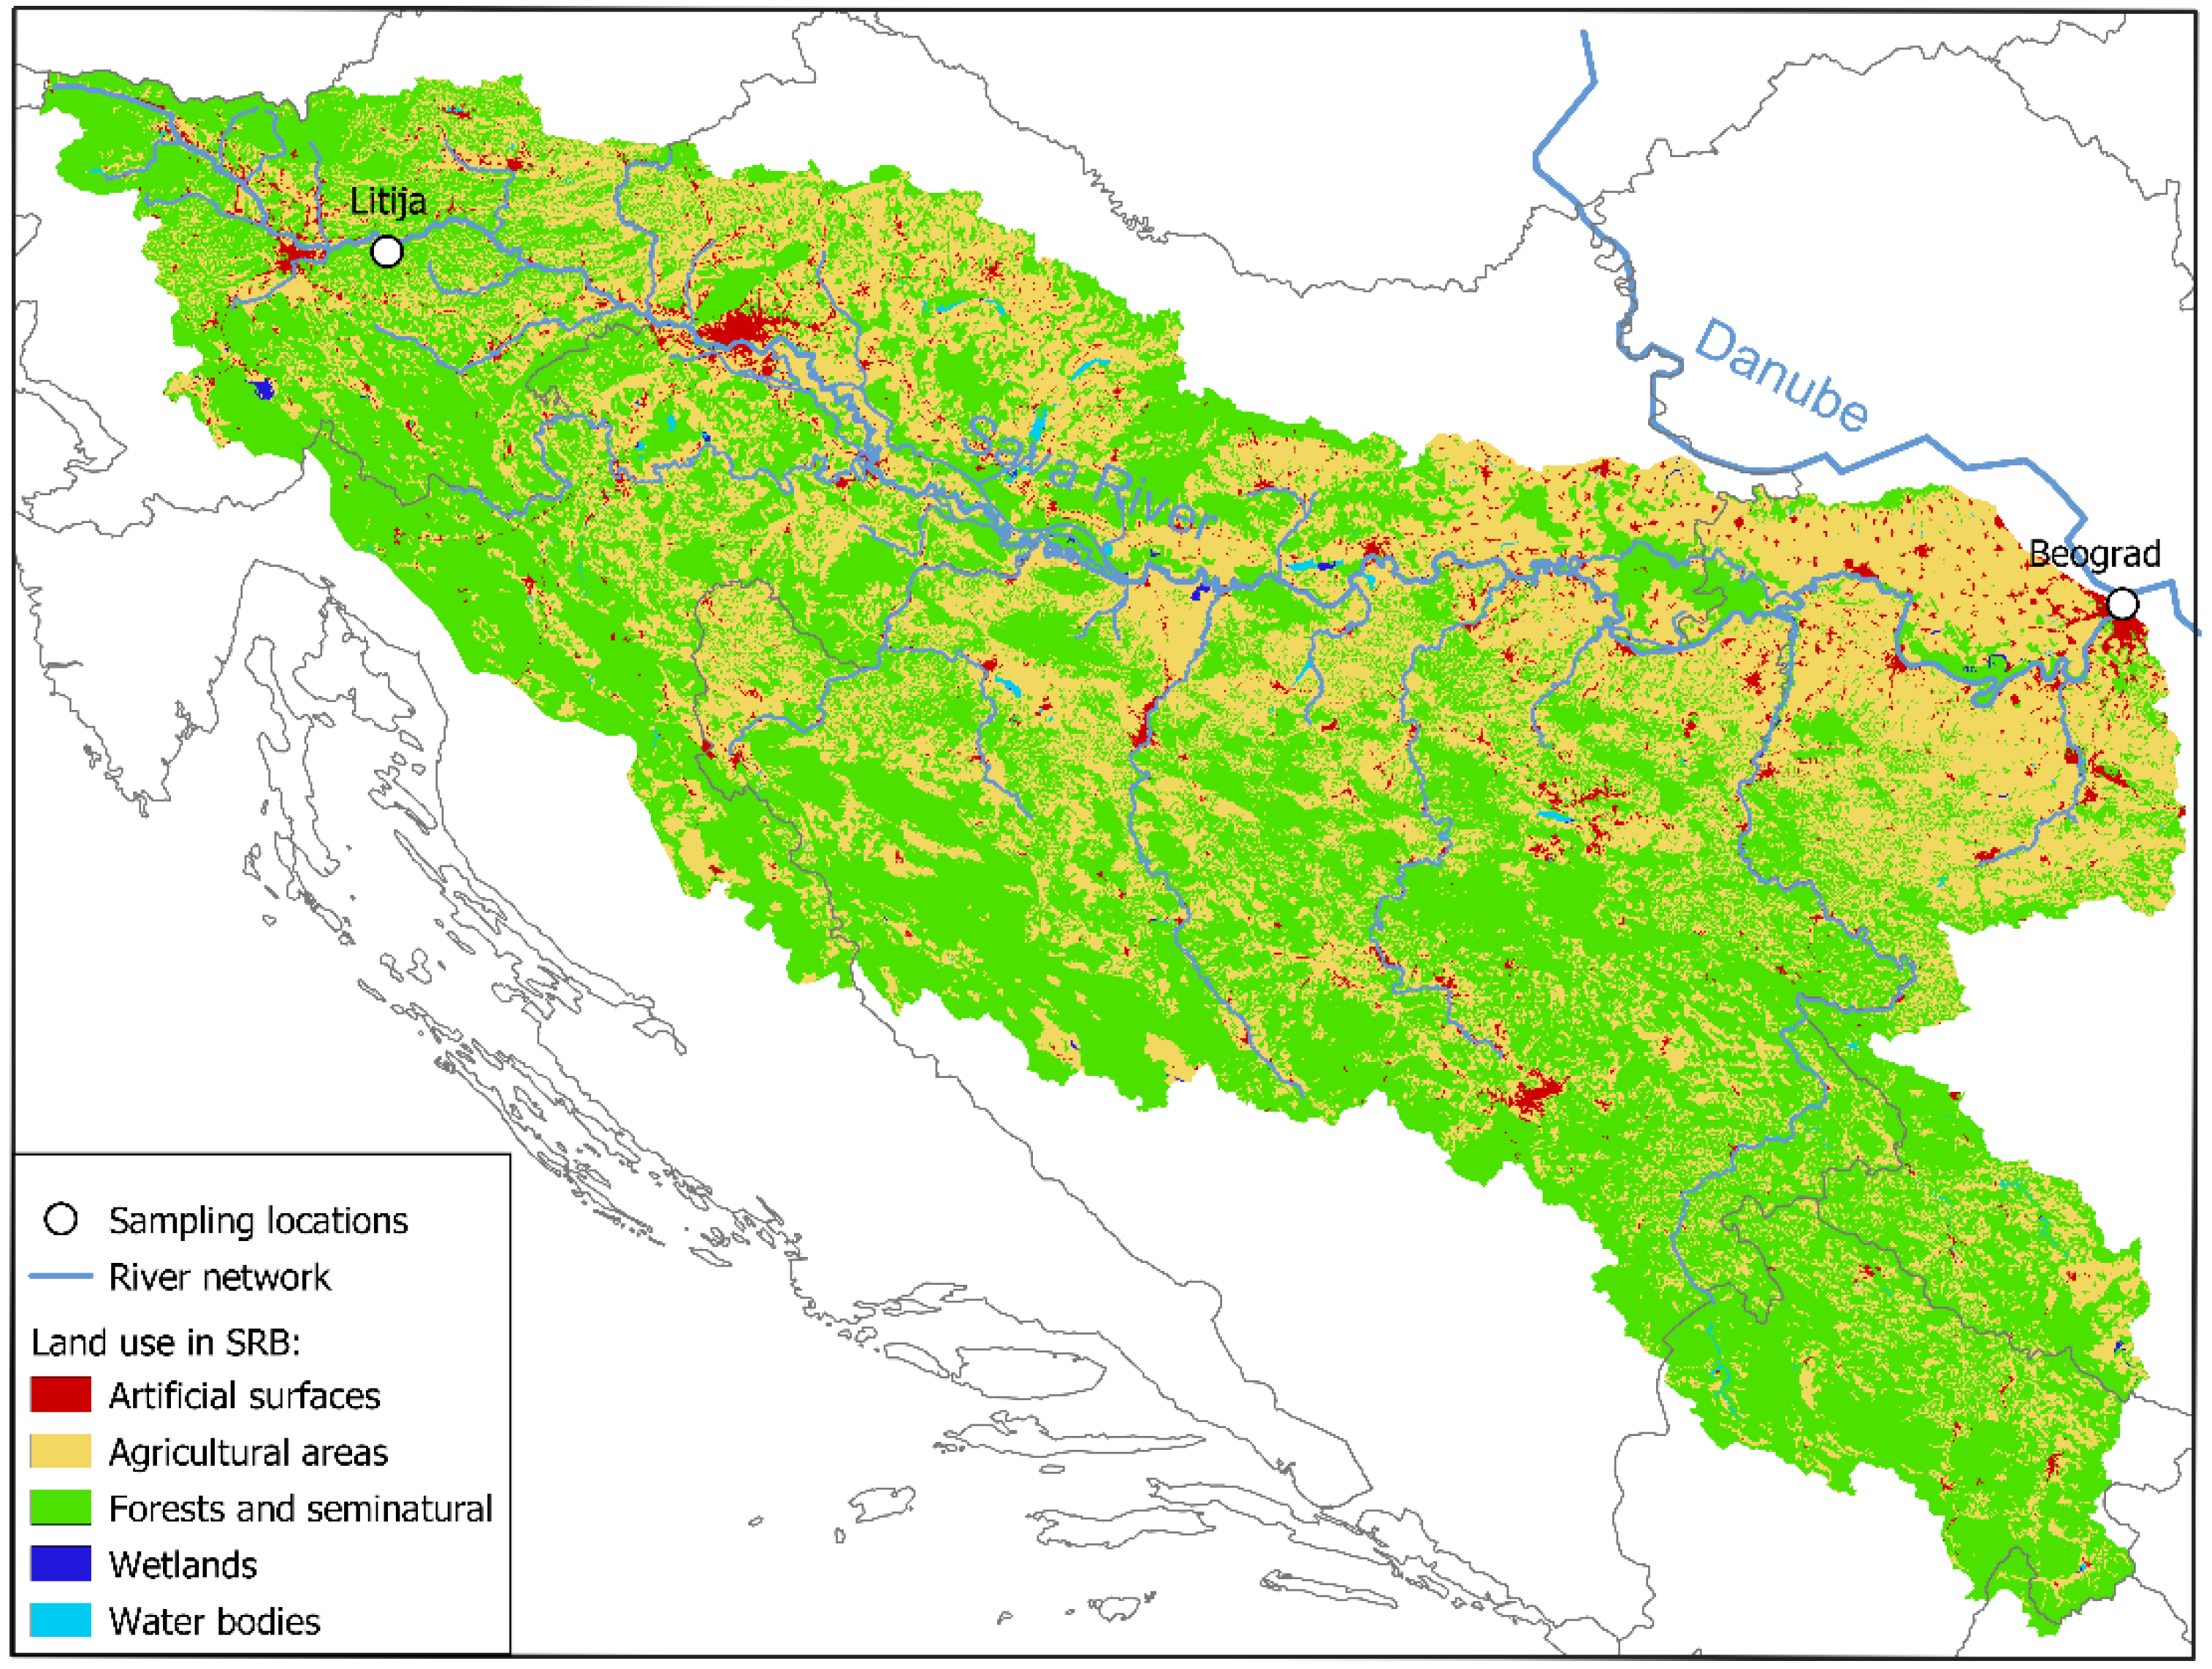
2.1. Sampling Site Description

High population density, hydropower generation, industrial (metalworks, oil refineries, chemical, leather, textile, food, pulp and paper industry) and agricultural activities along the river have a strong impact on its ecological status. The Sava is navigable for 593 km, from its confluence with the Danube to Sisak (Croatia). In addition to intensive ship traffic, the river is under the influence of hydro-morphological alterations. In the Serbian and Bosnian part, the river is also impacted by untreated effluents from municipal wastewaters.
For the study of the behaviour of the SPM during flash flood events, two sampling sites on the Sava River were chosen (Figure 1). The first sampling site was Litija in the upper river stretch, and the other was the lower stretch of the river in Belgrade. At Litija, a gauging station for water level and discharge is situated, while in Belgrade, only water level is recorded.
In Litija, Sava still has the characteristics of an alpine river. In this part, the river has a steep riverbed and, consequentially, a fast flow and small number of fine-grained sediments, about 10%. In Belgrade, where Sava is a lowland river, the amount of fine sediment fraction increases up to 60% [18]. Consequently, the average amount of SPM in Litija and Belgrade is 5 mg L−1 and 15 mg L−1, respectively [18,19]. The average annual water levels and discharges in Litija and Belgrade are 80 cm and 60 m3 s−1, and 300 cm and 1500 m3 s−1, respectively.
In the surroundings of Litija, mining activities had occurred. Upstream of Belgrade, the Sava River is strongly impacted by heavy industry, untreated municipal sewage waters and agriculture. Therefore, some impact from the past activities may still be present, especially during intense rainfalls, when the surrounding soil and slag deposits are washed into the river.

2.2. Sample Collection and Analytical Procedures

The water samples were collected during a heavy rain event in Litjia May 2016 and in Belgrade in March 2016. At both locations, the water for SPM and elemental analyses was sampled in 2 L polypropylene bottles that were pre-cleaned with 10% HNO3. The samples were sampled twice a day (morning and evening) during the flood wave. When the water level started to decrease and until the water level was restored, the samples for SPM and elemental analysis were sampled once per day.
The SPM content in the river water was determined by filtering the water (from 200 to 1000 mL) in the laboratory through pre-dried and pre-weighted 0.45 μm nitrocellulose membranes (Millipore, Burlington, MA, USA). The filtrated water, in which the dissolved concentrations of potentially toxic elements were determined, was acidified with concentrated HNO3 (65%) and stored in a fridge (4 °C) until analysis. Filters with SPM were dried in the oven at 60 °C until constant weight in order to determine the amount of SPM by the difference in weight. Afterward, the filters were subjected to microwave assisted digestion (MARS 5, CEM Corporation, Matthews, NC, USA) in the presence of HNO3 (65%), HCl (30%), H2O2 (30%) and H3BO3 (4%) for the dissolution of minerals present in SPM for the total element concentration determination. The detailed procedure was described in Vidmar et al., 2017 [19]. Concentrations of dissolved elements and those present in the SPM were determined by inductively coupled plasma mass spectrometer (ICP-MS) (7700x, Agilent Technologies, Tokyo, Japan). The operating parameters were described in detail by Milačič et al. (2017) [18].
Physicochemical parameters were measured on site. Dissolved oxygen and water temperature were measured using a YSI model 58 m and a YSI 5239 DO probe with high-sensitivity membranes. Electrical conductivity was measured using a Corning 316 meter with a two-point calibration of 0 and 1413 μS/cm. The dissolved oxygen and electrical conductivity measurements had a precision of ±5%. A Corning 315 high-sensitivity pH meter with an Orion Ross combination pH electrode, calibrated with low ionic strength buffers of 4.1 and 6.97 (corrected for temperature), was used to measure the pH in the field as close to the water temperature as possible. The reproducibility of field pH determinations was ±0.02 pH units.

2.3. Reagents and Certified Reference Materials

Ultrapure 18.2 MΩ cm water, obtained from a Direct-Q 5 system (Millipore, Watertown, MA, USA), was used for preparation of samples and reagents. Merck (Darmstadt, Germany) suprapur acids were used. The certified reference materials CRM 320R Trace Elements in River Sediment, Community Bureau of Reference (Geel, Belgium) and SLRS-5, River water reference material purchased from the National Research Council (Ottawa, ON, Canada) were used for accuracy check. Good agreement between the certified and determined values for both materials was obtained. In general, the recoveries ranged from 96 to 102% for all elements analysed.

2.4. Calculation of Distribution Coefficient

In order to describe the relationship between the dissolved and particulate PTE fraction, the distribution coefficient (KD) was calculated in accordance with Equation (1) [13]:
K D ( L   k g 1 ) = concentration   of   element t S P M   ( µ g / k g ) concentration   of   element t d i s s o l v e d   ( µ g / L )

2.5. Flood Event Load Calculation

On the basis of time intervals of discharge, SPM and PTE concentrations loads during the flood events were estimated in accordance with Equation (2):
F = i = 1 n ( Q × C ) ,
where Q (m3/s) is the river water discharge, C is the element concentration (mg/L for SPM and μg/L for PTE) and n is the number of measurements.

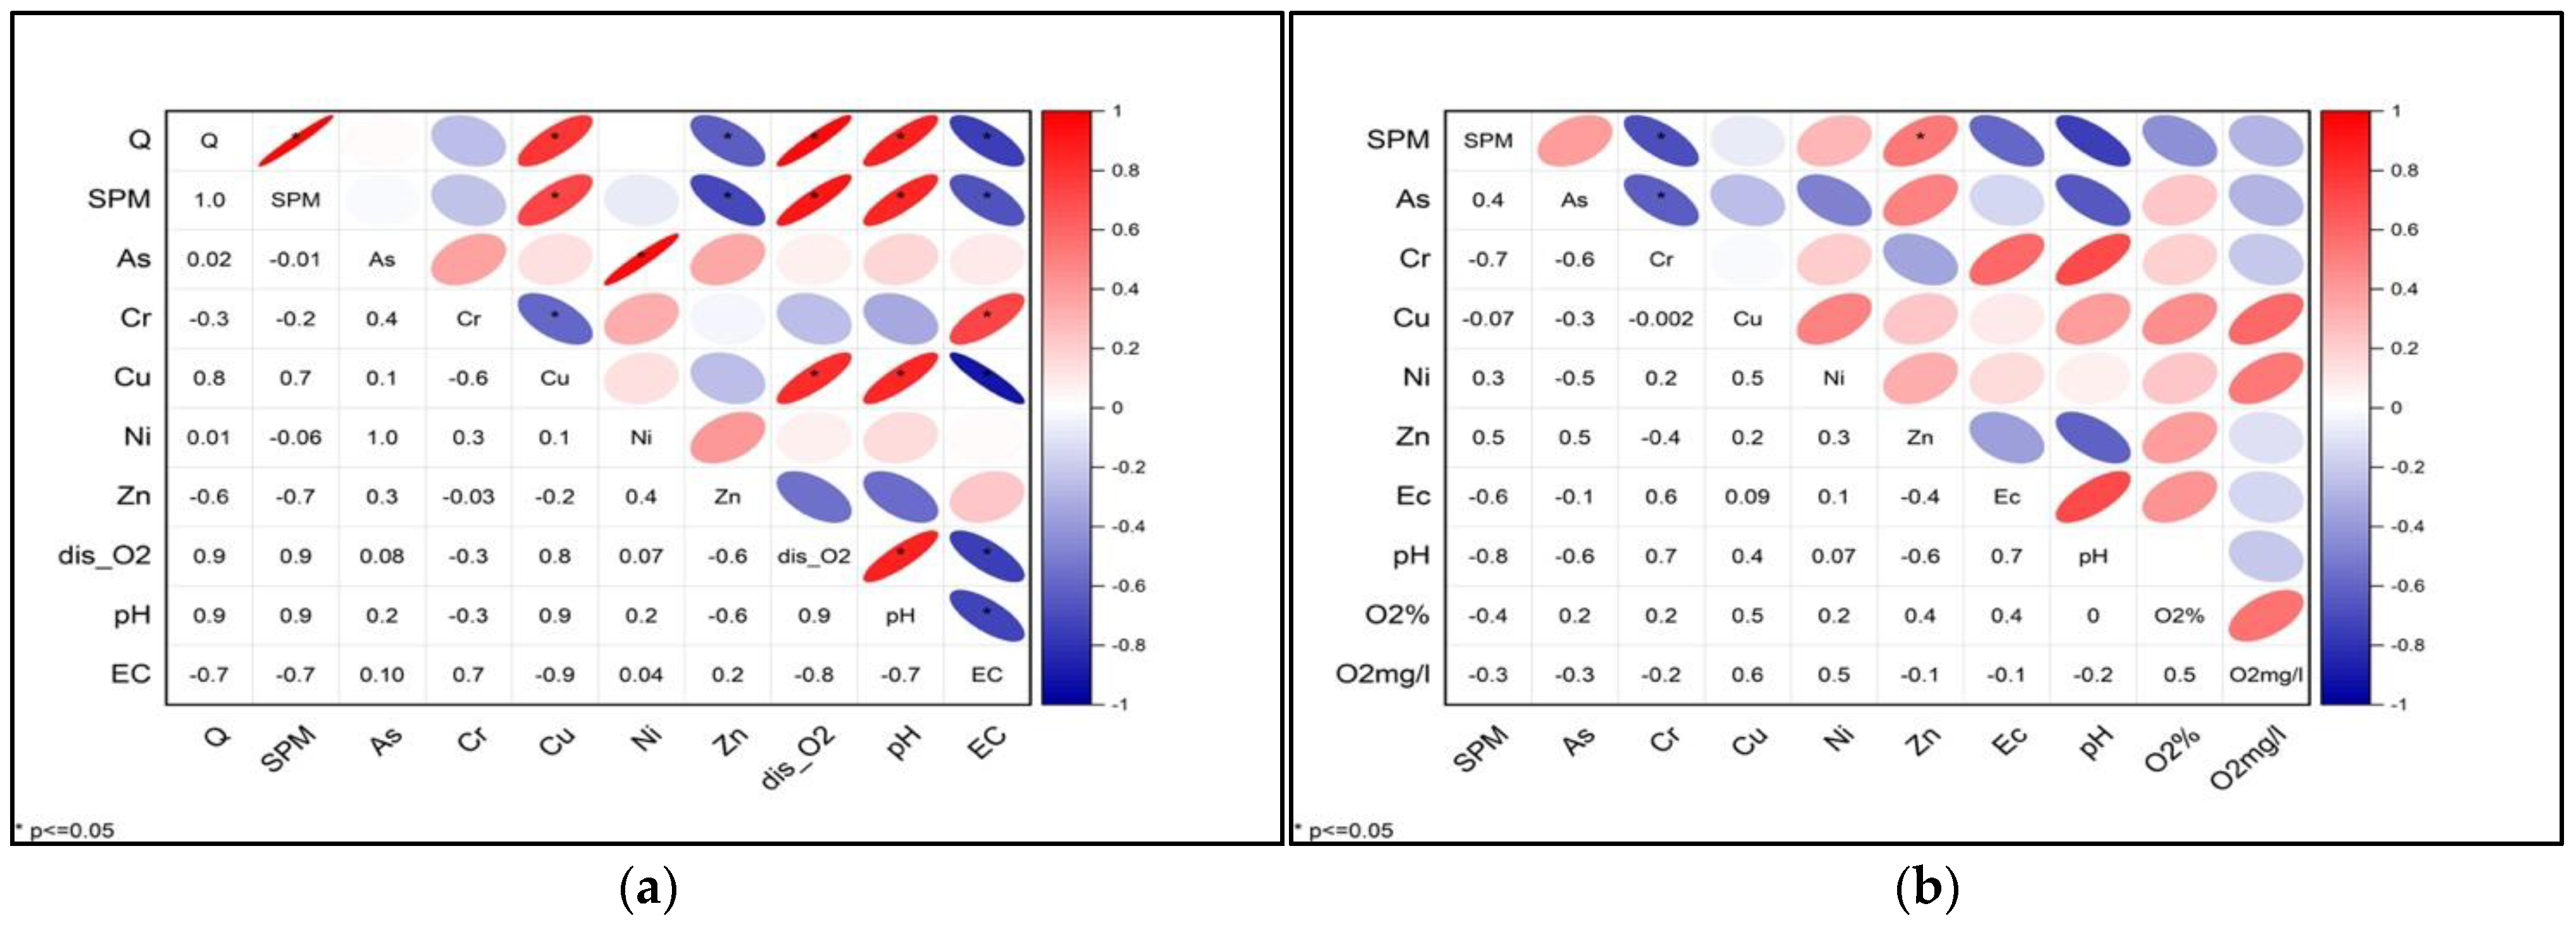
2.6. Statistical Analysis

Correlations between the determined parameters were performed and visualized using OriginPro 2021 (OriginLab Corporation, Northampton, MA, USA). Spearman’s correlation analysis was used to identify correlations between dissolved elements in Litija and Belgrade, respectively. The significance level was p < 0.05.

3. Results and Discussion

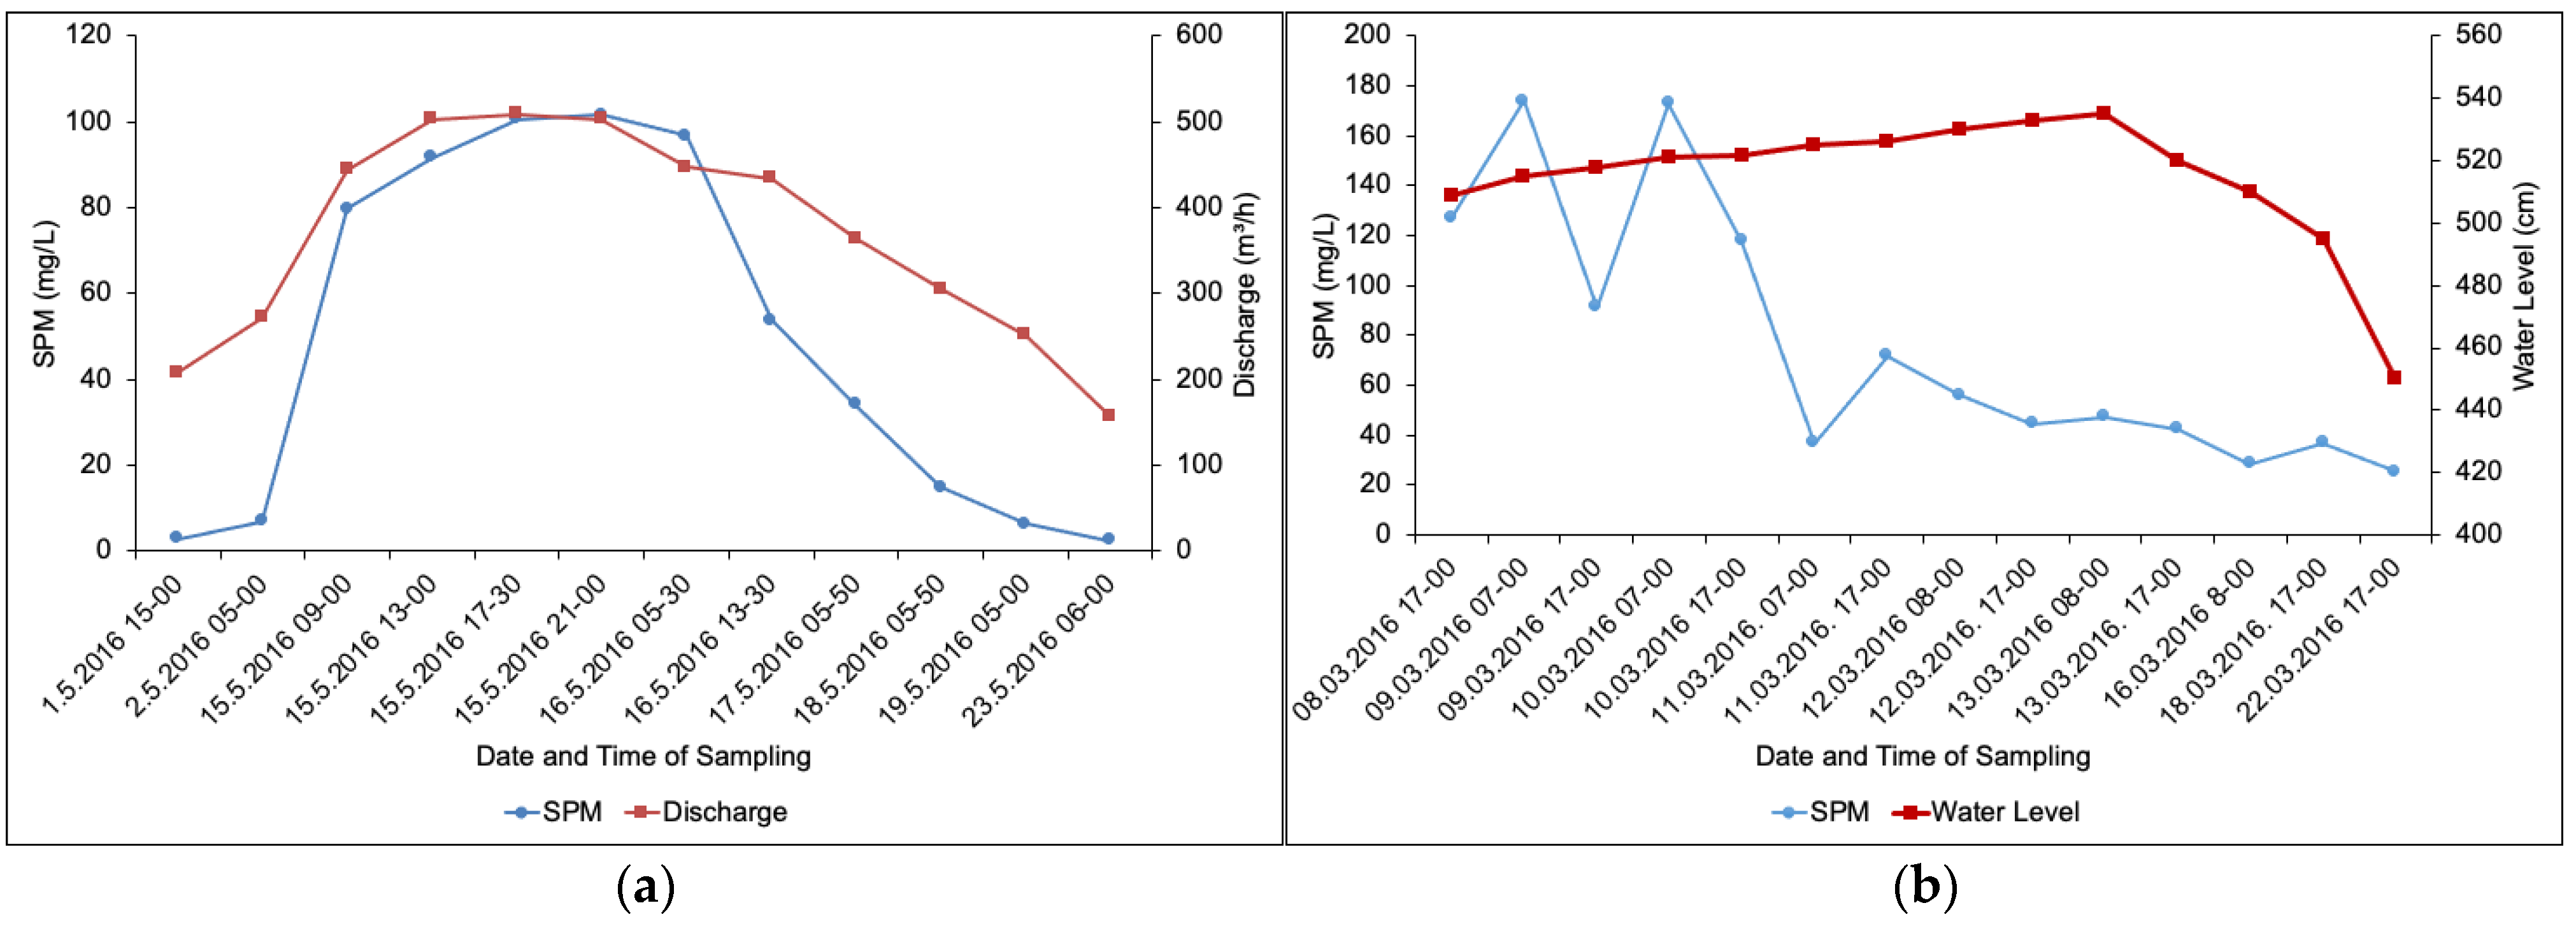
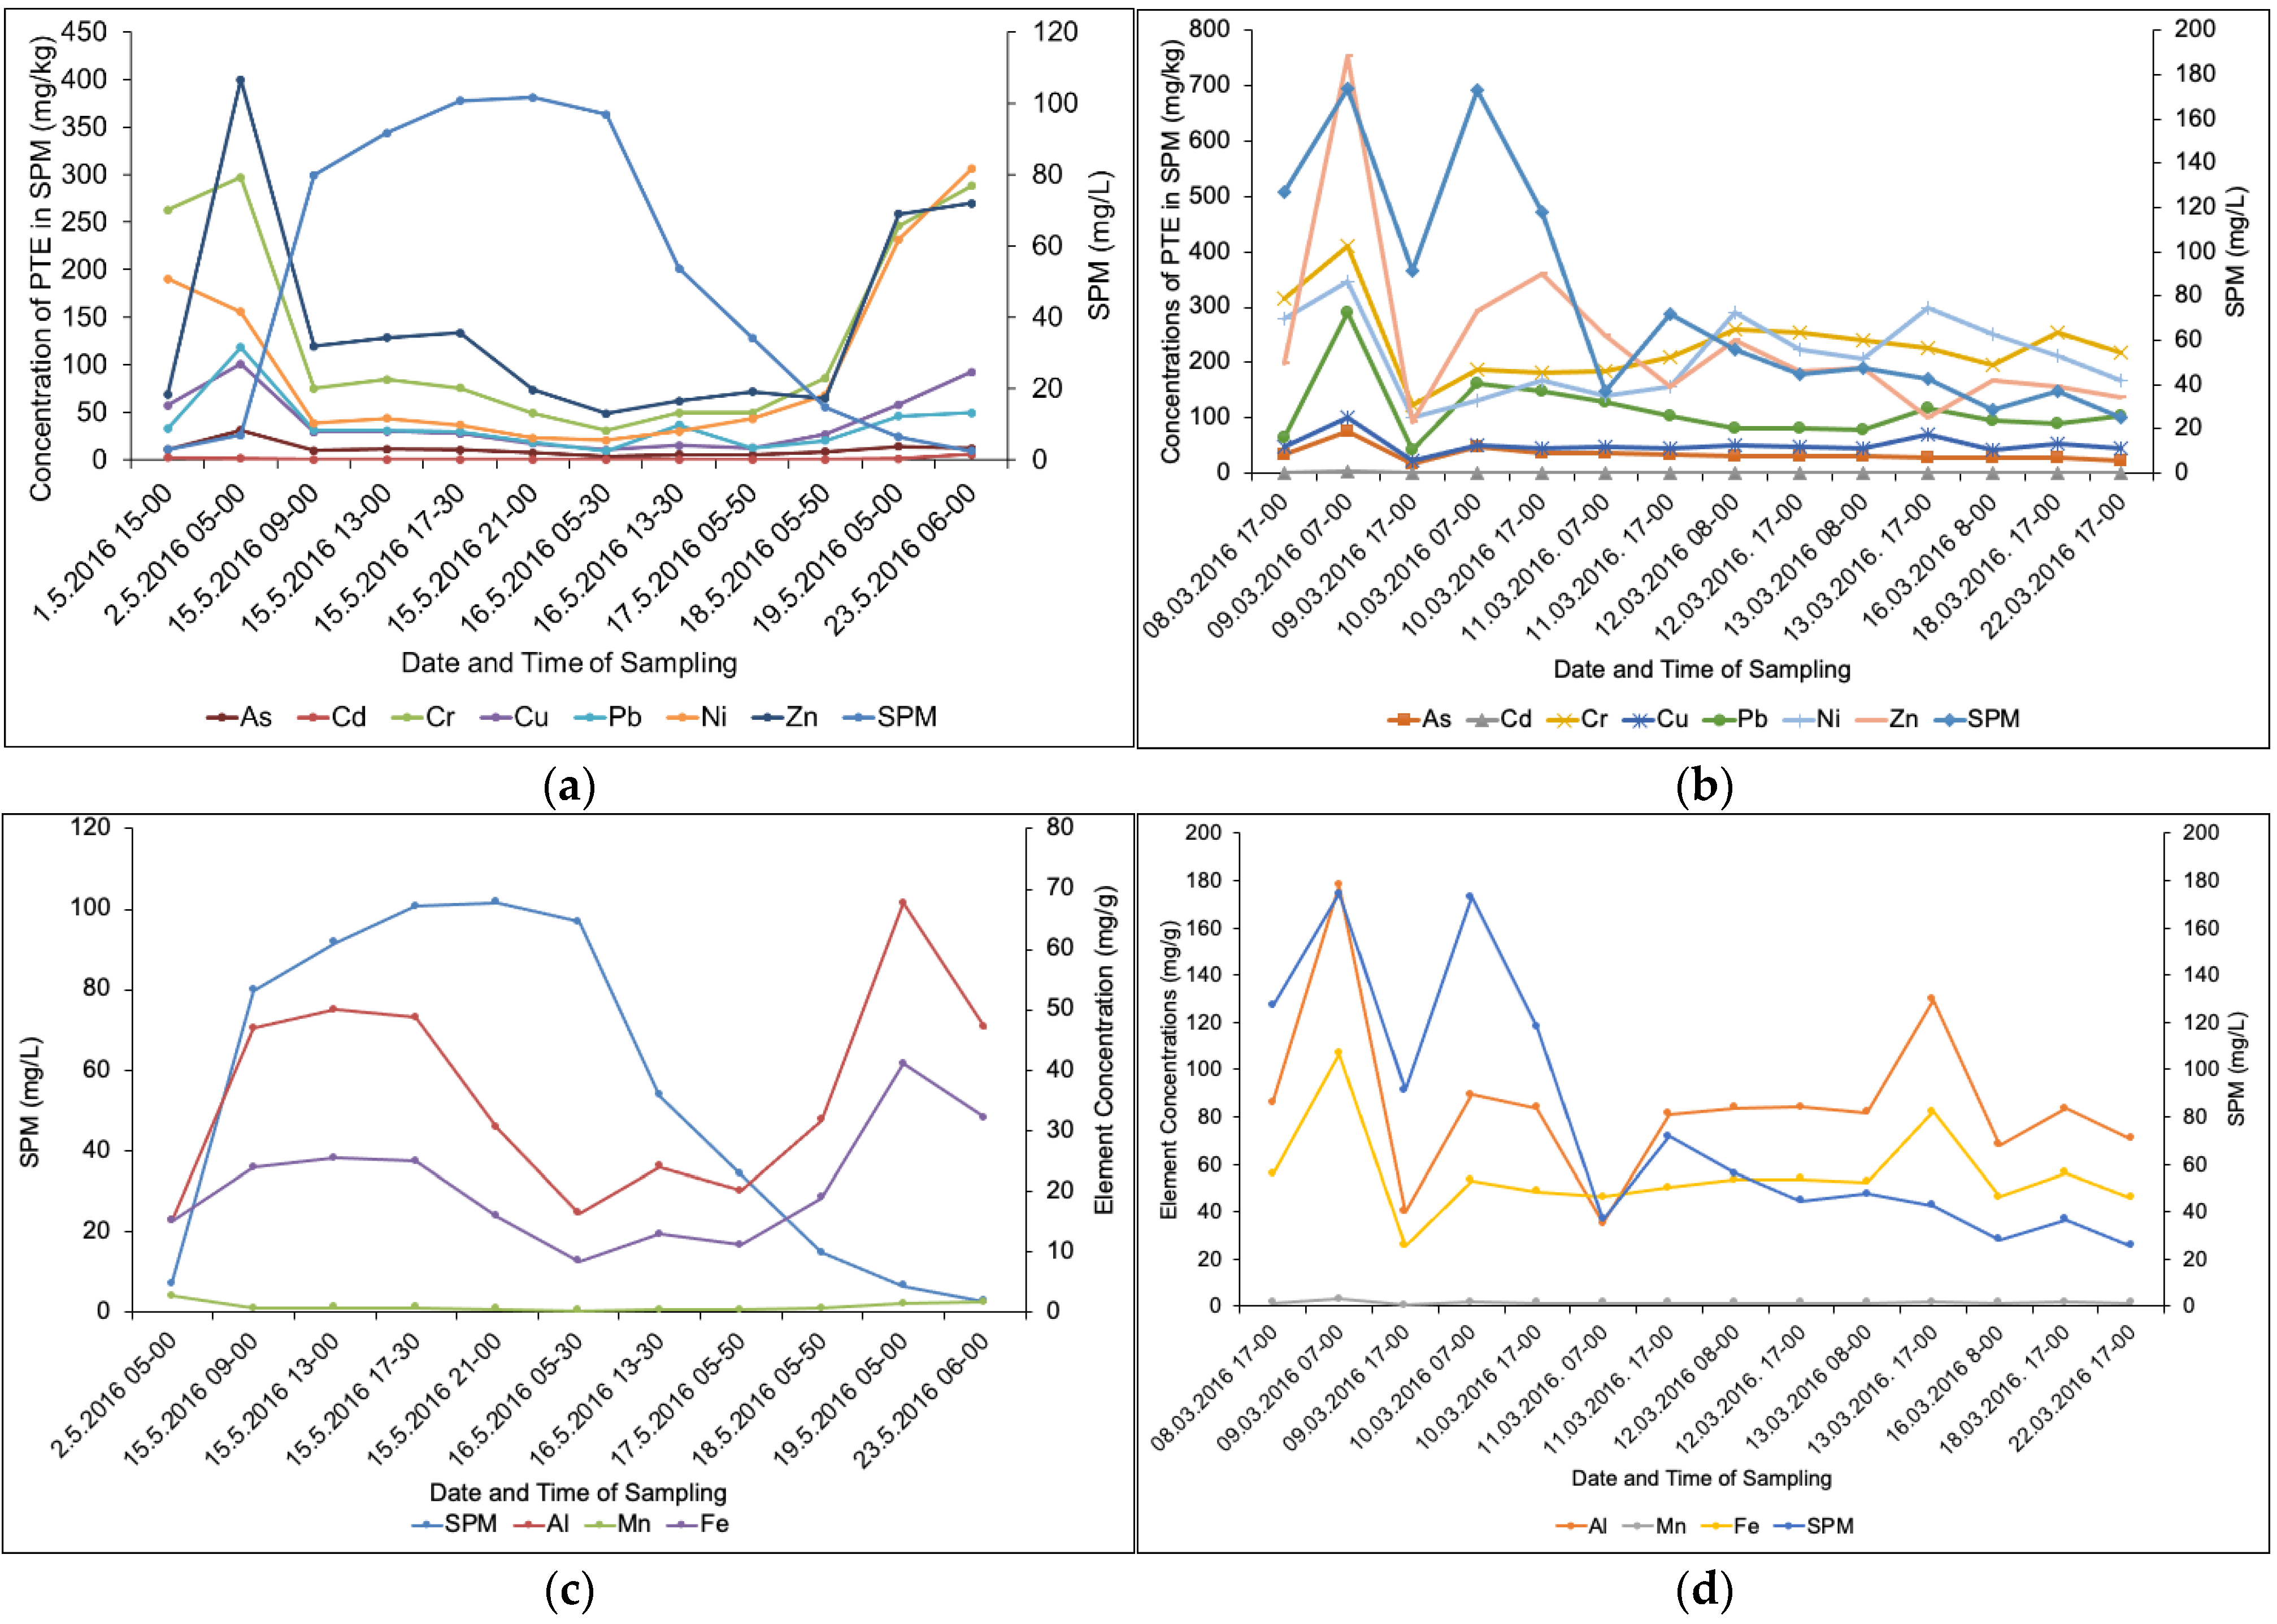
3.1. SPM Behaviour during the Flood Events

The SPM was determined in samples collected during the flash flood events at Litija and Belgrade. During normal conditions, the average water discharge and water level at was 60 m3/s and 80 cm, and 1500 m3/s and 300 cm, respectively, at the Litija and Belgrade sampling point [19]. During the flood event under study, the maximum discharge and water level at Litija were 509 m3/s and 211 cm, respectively. At the peak of the meteorological event, from 12th to 15th of May, between 10 and 40 L/m3 per day of rainfall was recorded [26]. This means that in 4 days, an average monthly amount of rainfall occurred. At Litija, the Sava River still has the characteristics of an alpine river, with a fast flow and steep riverbed, and the response to higher water inputs is almost immediate. In a study performed by Ogrinc et al. (2018) [27] using oxygen isotope ratio measurements, the researchers demonstrated that the Sava River in Slovenia has a fast response time to precipitations. The data from the present survey confirm their hypothesis, as the water discharge and level reacted promptly to the amount of rainfall.
At the Belgrade sampling location, the water level reached the maximum water level of 530 cm. At the automatic gauging station of Sremska Mitrovica, 70 km upstream of Belgrade, the water discharge reached 4300 m3/s [28], a much higher discharge than during the big floods in 2014 (3200 m3/s) [18]. In the case of Belgrade, the sampling site was situated in the pre-urban area. Therefore, to some extent, the impact of the urban runoff was expected. The paved surfaces and scarce vegetation prevent water infiltration, causing excess precipitation to move quickly as overland flow toward the river and contributing to the short-term stream response. On the other side, most likely due to the waste floodplains situated just a few kilometres before the sampling site with a high capacity to retain water, the increase of the water level during the flood wave was slow. Moreover, due to its channel size, the Sava River in Belgrade reacted slowly to the sudden increase in rainfall.
Figure 2 presents the correlation between water discharge and the amount of SPM at Litija and Belgrade. In Supplementary Data Figure S1, the correlation of SPM and water discharge at Sremska Mitrovica, the nearest official gauging station to Belgrade, is presented.
In Litija (Figure 2a), the amount of SPM reached its maximum 100 mg L−1 slightly after the hydrological maximum, and then decreased much faster than the water level. The highest concentrations of SPM detected was 20-times higher than the average SPM levels at Litija (5 mg/L). In Belgrade, the increase in SPM content was almost 15-fold, from an average value of 15 mg/L to 180 mg/L. Data from the literature show that in mountain rivers such as Adige and Avisio in Italy, the amount of SPM ranges from 53 to 150 mg/L and from 47 to 150 mg/L, respectively, during normal flow, whereas during a flood event, the Adige River reached 560 mg/L of SPM [29]. The results are, to some extent in agreement, with data from the present study at Litija. In a study of Toth and Bodis (2015) [30] the researchers determined the SPM amount in the Hungarian part of the Danube River during the years 2003 and 2011 to range from 3 to 177 mg/L during extremely low and high water levels, respectively, which is similar to the data for the Sava River at Belgrade sampling site as both rivers flow through similar landscapes.
At Belgrade (Figure 2b), contrary to Litija, the highest amount of SPM was determined just before the hydrological peak, followed by a sudden decrease in the SPM concentrations. The reason for such behaviour could be that the increase in water level was not only due to the heavy rain in Belgrade area but also upstream. Hence, the flood wave from the upstream rain event was recorded in addition to the fresh entrance of the urban runoff at Belgrade. As the SPM concentration was the highest at the beginning of the flood wave, SPM could have resulted from soil and sediment erosion from the upstream areas. After a few days, the urban runoff with coarser particles may have caused the dilution of the SPM. From Figure 2, some fluctuations of the SPM amount can be observed at Belgrade sampling site as the decrease in the third and sixth sampling points, most likely due to the inconsistency of the sampling method, for example, different sampling depths.

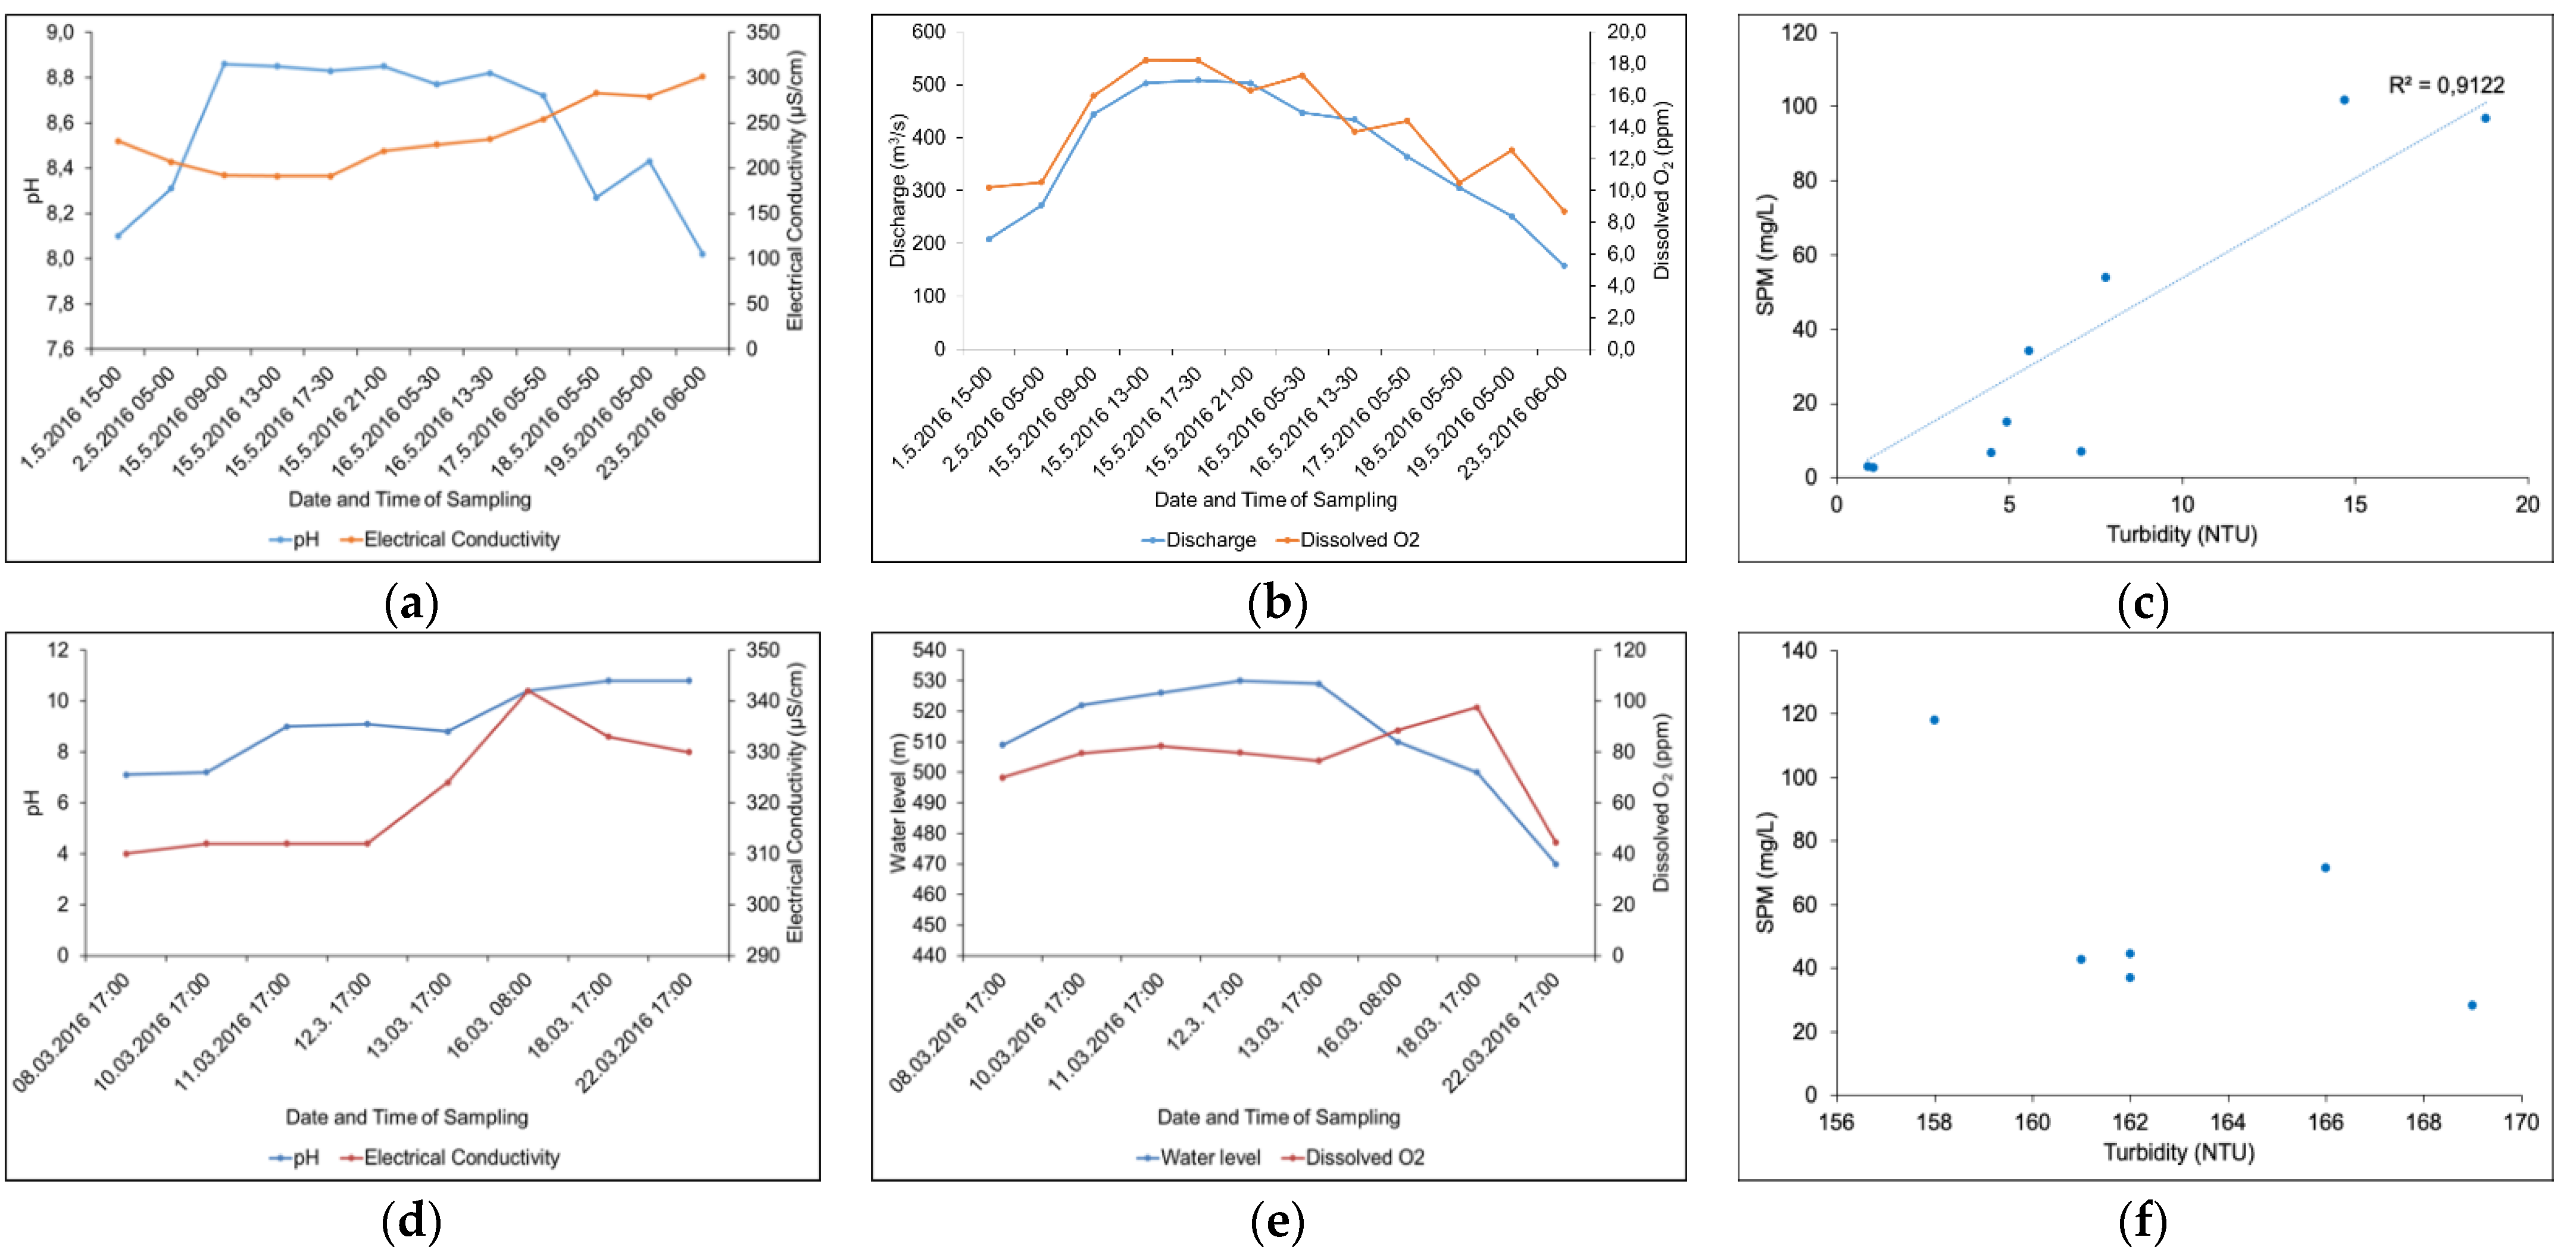
3.2. Changes in Physicochemical Parameters during the Flood Events

River water parameters such as pH, electrical conductivity and dissolved oxygen at the Litija and Belgrade sampling sites are presented in Figure 3. For Litija, data are presented in correlation to the discharge. Unfortunately, in Belgrade, only the water level was recorded.
It can be seen that in Litija (Figure 3a,b), both pH and dissolved O2 concentration increased (pH from 8.0 to 8.9, and O2 from 8.8 to 18.5 ppm) with the increasing discharge as a consequence of enhanced dissolution of oxygen due to the turbulent flow. Contrary, electrical conductivity at sampling site in Litija (Figure 3b) decreased, most likely due to the dilution of the riverine water with the rainwater that has lower electrical conductivity. From 12th to 15th of May, between 10 and 40 L/m3 per day of rainfall was recorded [26]. At the end of the event, the values returned to the starting point.
From the increase of the water level in Belgrade, we can assume that the discharge was also increased, as was the case in Sremska Mitrovica (Figure S1). From Figure 3d, it can be seen that the pH values during the flood wave increased and did not return at their values before the event. This could be due to an uncontrolled discharge from the paper-producing industry situated not far upstream. Similar behaviour was observed for the electrical conductivity, while the dissolved oxygen reached a maximum value at the water level maximum and then decreased as the aeration, due to the turbulent flow, diminished.
The turbidity and amount of SPM at Litija followed the water discharge, and the turbidity was almost linearly correlated with the amount of SPM (Figure 3c). Similar to our finding at Litija, Rugner et al. (2013) [31] observed good correlation between turbidity and SPM concentrations in five neighbouring catchments in southern Germany. In Belgrade (Figure 3f), no correlation was observed, most likely due to the limited number of observations.

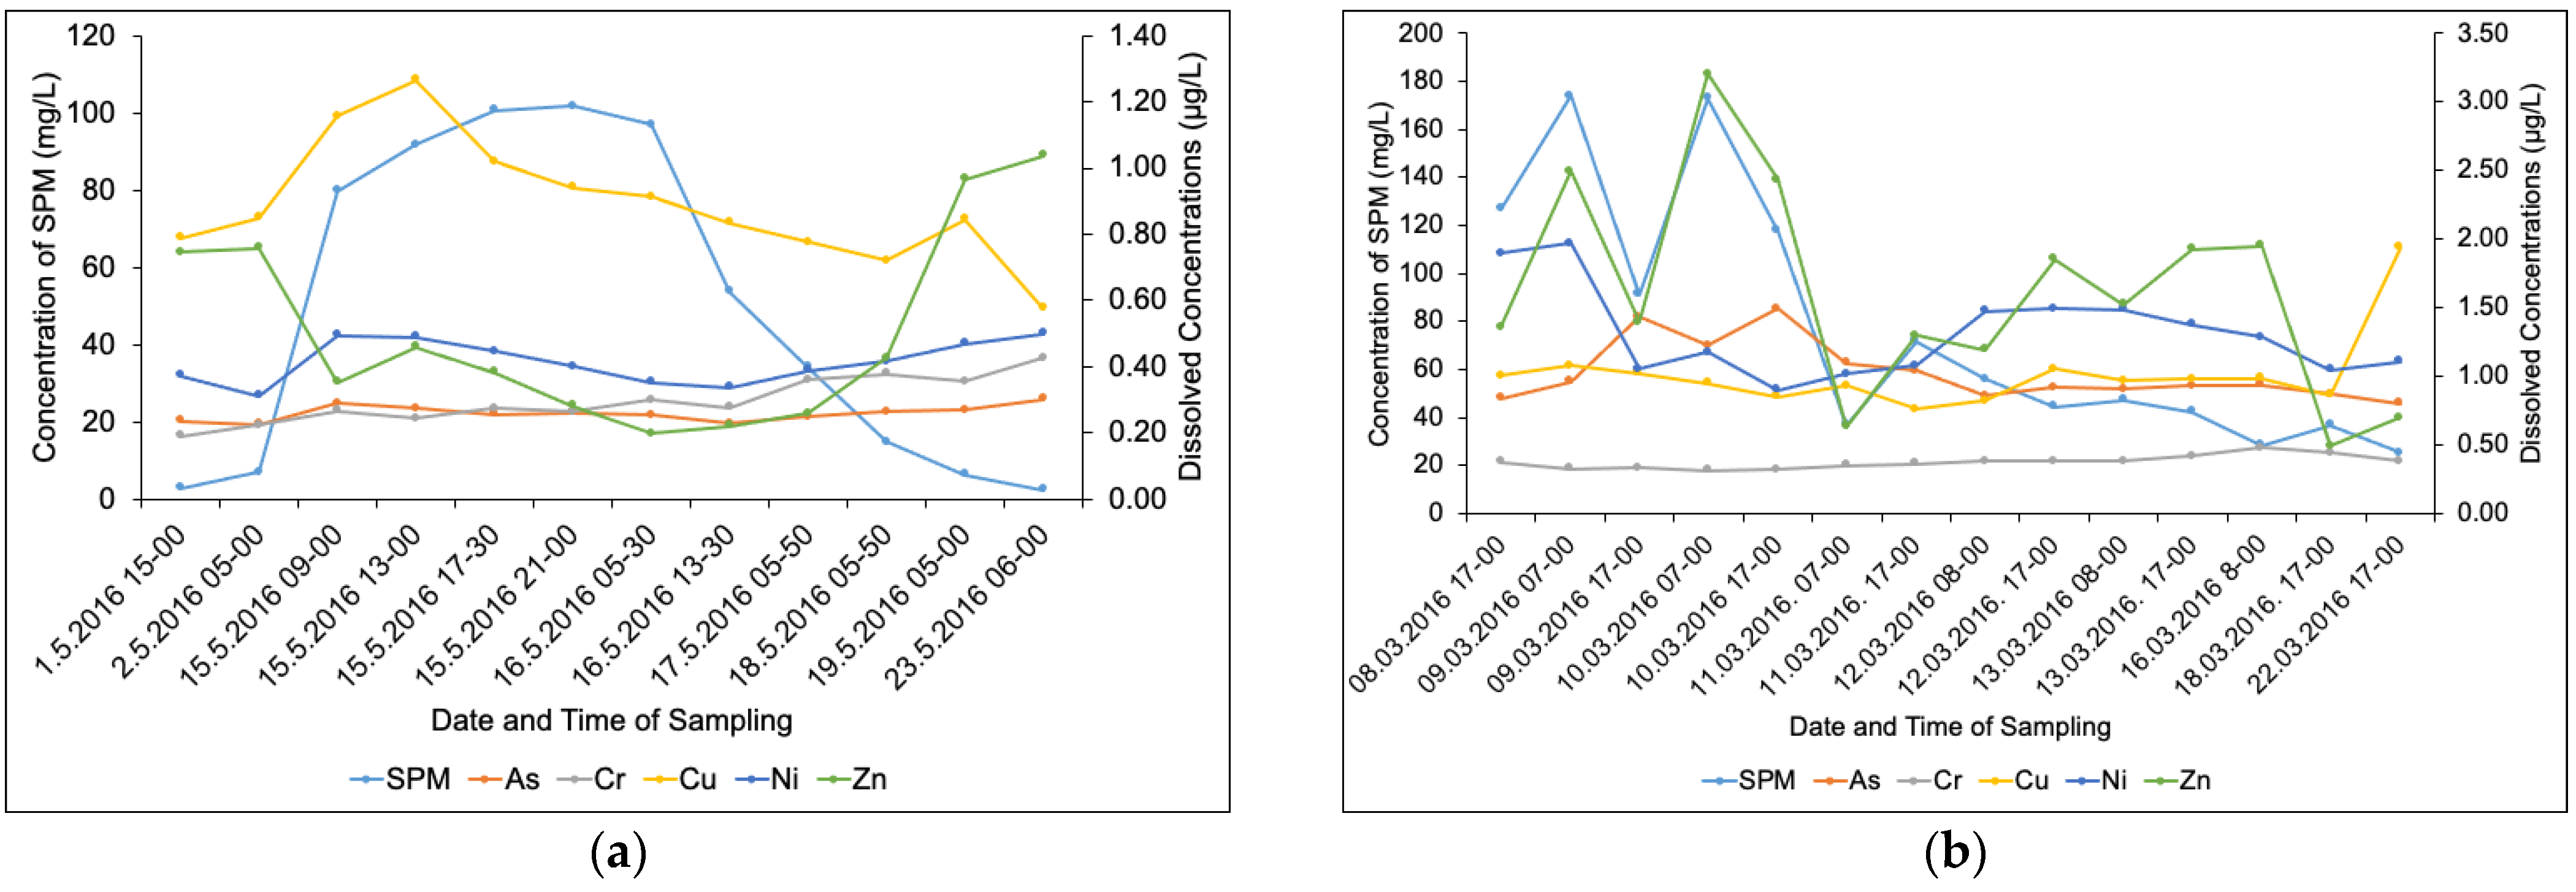
3.3. Potentially Toxic Elements in Dissolved Phase

In the dissolved phase, the concentrations of Pb, Cd, As, Cu, Cr, Ni and Zn were determined, as Tables S1 and S2 (Supplementary Data) for Litija and Belgrade, respectively. Variations in the concentration of dissolved elements with the concentration of SPM are shown in Figure 4 (a) for Litija and (b) for Belgrade.
Concentrations of PTEs in the dissolved phase at both sampling sites were low and followed the trends Cu > Zn > Ni > Cr > As in Litija, and Zn > Ni > As > Cu > Cr in Belgrade. The dissolved concentrations of Pb and Cd at both sampling sites were under the limit of detection during the entire flood event. The average concentrations of Pb and Cd during normal hydrological conditions are generally low at Litija, ranging from 0.01 to 0.35 μg/L for Pb and from 0.001 to 0.006 μg/L for Cd. In Belgrade, the average concentrations during normal hydrological conditions ranged from 0.05 to 0.15 μg/L for Pb and from 1.5 to 2 μg/L for Cd [18,19]. During the flood events at both sampling sites, no washout of Pb and Cd from the environment occurred. Therefore, the already-low concentrations were further diluted.
From Figure 4a, it can be seen that in Litija, dissolved Zn concentrations decreased with increased discharge. With the increase in the amount of water, the dissolved concentration decreased. During the recede of water, it started to increase, and finished at higher concentration (1.05 μg/L) than the starting one (0.75 μg/L). The concentrations of Ni and As at the beginning of the event were 0.237 and 0.373 μg/L, respectively. During the flush event, they slightly increased, while those of Cu increased the most, from 0.80 to 1.30 μg/L, until the flow reached the maximum value as a consequence of their transfer from SPM to the water. In the study of Milačič et al. (2010) [22] it was shown that As, Ni, Cd and Cu were present in the easily extractable fraction of the sediment from a dam downstream Litija, meaning that they could be transferred into water during a turbulent flow. During the hydrological maximum, As, Cu and Ni concentrations started to decrease, most likely as a consequence of dilution with rainwater. When the water began to recede, the concentrations of dissolved As and Ni again started to increase, so that the final concentrations were higher than the starting ones (0.303 μg/L for As and 0.500 μg/L for Ni). No correlation was found between the two elements and the water discharge (r = 0.02 and r = 0.01 for As and Ni, respectively; p < 0.05) (Figure 5). On the other hand, the dissolved concentration of Cu at the beginning of the event increased together with the amount of SPM and the flow. They had a positive corelation (r = 0.8 and r = 0.7 for discharge and SPM, respectively; p < 0.05). It can be assumed that at the beginning of the flash flood, Cu was transferred into water from SPM. The dissolved Cu concentrations started to decrease right after the discharge reached its maximum, indicating that the fresh rainwater caused its dilution. After the flash flood event, the dissolved concentration of Cu was lower than at the beginning of the event (0.577 μg/L). The dissolved concentration of Cr increased during the entire event, from 0.190 μg/L at the start up to 0.425 μg/L at the end of the event. There was no correlation with the SPM (r = −0.2, p < 0.05) nor the flow (r = −0.3, p < 0.05). Although the concentrations of As, N, and Cr increased, they were generally still lower than the average values as previously reported by Milačič et al. (2010) [22], Vidmar et al. (2017) [19] and Milačič et al. (2017) [18].
At the Belgrade sampling point (Figure 4b), the dissolved concentrations of PTE followed the same pattern as the amount of SPM as they reached their extreme values before the hydrological maximum. For As and Zn, there was an increase in their dissolved concentrations as the water level, and consequentially the amount of SPM, increased. The starting concentrations of As and Zn were 0.80 μg As/L and 1.40 μg Zn/L, while the maximal concentrations reached 1.50 μg As/L and 3.20 μg Zn/L, respectively. The concentrations started to decrease before the hydrological maximum occurred. The dissolved concentrations stayed constant for As (0.80 μg/L) until the end of the event, while those of Zn decreased, reaching a lower concentration (2.0 μg L−1) than the starting one. The dissolved concentrations of other PTE remained generally constant, a slight decrease just before the hydrological peak. No correlation between the elements and the amount of SPM was found (Figure 5). However, to some extent, there was a transfer of elements from the SPM into the water during the re-suspension of the material at the beginning of the event.
Therefore, it can be assumed that a transfer of As, Cr and Ni occurred from the SPM. This phenomenon was described also in the study of Roussiez et al. (2013), [10] where the researchers described a rapid flash of soluble material from the upper soil horizon at the beginning of the flood event. It is also possible that a third anthropogenic input occurred, possibly originating from the urban environment [31]. In addition, concentrations of dissolved Ni, Cd and Cr at both sampling sites remained below the EU WFD average annual allowable limits [32] during the entire event at both sampling sites.
Generally, SPM originates from river sediment or represents the eroded fine particles from soil from the banks and floodplains [11]. In the study of Milačič et al. (2010) [22], the fractionation of elements (As, Cd, Cr, Zn, Ni, Cu and Pb) between different components of the sediments were studied. They found that all elements were present in the easy extractable fraction at very low concentrations, most likely bound to the insoluble residual fraction, meaning that they were not mobile under normal conditions. In the study of Pavlović et al. (2019) [33], the PTE were bound to sparingly soluble fractions of soil in the riparian zone and were identified as being of possible anthropogenic origin [23]. Some transfer of elements from the suspended material into the water during the flash flood occurred. The concentration of elements was relatively low in regard to the sediments with high loads of PTE present, especially in the lower river stretch. The dissolved concentrations did not increase over the average values representative for the Sava River along its entire flow.

3.4. Potentially Toxic Elements in SPM

The variation of PTE Al, Mn and Fe concentrations in SPM is presented in Figure 6.
As can be seen from Figure 6, at the Litija sampling site, the concentrations of PTE in SPM at the beginning of the event jumped to very high concentrations, indicating a runoff from the surrounding area. At Litija, lithogenic contribution is the main source of PTE, with possible minor anthropogenic contributions from the main tailings from former Pb and Zn ore excavations [19,22,34]. With the increase of the amount of SPM, the PTE concentrations in SPM quickly decreased. The most probable explanation is that at the hydrological maximum, the river flow is turbulent. Therefore, coarser particles are suspended, causing the dilution of fine particles [3]. From Figure 6c, where the concentrations of Mn, Fe and Al in relation to the amount of SPM are presented, it can be observed that they have a good corelation (r = 0.98, p < 0.05). Al, Fe and Mn are abundant in the Earth’s crust and present in rather insoluble species under oxidising conditions [13]. As they are the main constituent of the sediments, they were consequently mobilised during the turbulent flow, causing the dilution of smaller particulate particles. Since PTE preferentially binds to small particles, their concentrations tend to decrease with the increased presence of bigger particles [10].
At the Belgrade sampling site, the PTE concentration in the SPM generally followed the amount of SPM. This was also the case for the Al, Fe and Mn concentrations (Figure 6d). At Belgrade, it seems that there was less dilution of SPM with the coarser particles. In general, the concentrations of PTE in SPM at Belgrade are higher than at Litija. The main contributions of PTE at the Belgrade sampling site are its intensive industry, agriculture and urban areas [19,21].

3.5. Partitioning and Transport of PTE and SPM

For the partitioning of PTEs between the dissolved and particulate phase, the distribution coefficient (KD) was calculated (Table 1). A wide range of KD values were obtained as a result of the wide difference in concentrations between dissolved PTE and those present in the SPM. Therefore, the KD values are expressed in logKD form. Elevated KD means that the elements have high affinity for the solid phase, and elements with low KD are more easily weathered [13].
In general, for all PTE from both sampling sites, the KD values ranged between 4.0 and 6.1. The highest KD was obtained for Cr (between 5.0 and 6.1), while for As, the KD was the lowest (between 4.0 and 4.9) at both sampling locations. For all PTE, the KD values did not change significantly during the flood events, indicating that there was limited or no dissolution of elements from the SPM.
The amount of transferred SPM and PTE following the Equation (2) was evaluated only for Litija because no data about the discharge exist for Belgrade. The average amount of SPM in Litija is about 5 mg/L. During the flash flood, which lasted for 3 days, the maximum SPM amount was 100 mg/L. The load of SPM during the 3 days of the event, almost 1 kg of SPM, was transported downstream. At Belgrade, the load of SPM would be even bigger, since the SPM concentration and the discharge during the flood were much higher. The estimated SPM load at the maximum discharge (4000 m3/s) recorded at Sremska Mitrovica would be 500 kg day−1 during the flood peak, showing the significance of the SPM in the transfer of PTE through the Sava River.

4. Conclusions

The results of the resent study highlighted the significance of the suspended particulate matter in the transport of PTE elements in the Sava River system. There were big differences in the amount of SPM at the two studied locations. In Litija, the Sava is still an alpine river, with a fast flow, small amounts of sediments in the riverbed and, consequently, low concentrations of SPM. At Litija, the major PTE sources are of lithological origin, with minor influence of past mining activities. Therefore, the concentration of PTE is low. During the flood event, the concentrations of PTE in dissolved form increased slightly, while those present in the SPM decreased as a consequence of dilution with coarser fractions. At Belgrade, the concentrations of SPM, as well as those of PTE, were much higher compared to Litija. During the flood, they increased even further. At both locations, to some extent, the transfer of PTE from the SPM was observed The KD values did not change significantly during the events, indicating limited dissolution of the elements from SPM.
The majority of PTE present in the Sava River is bound to solid particles in sediments as well as in SPM. From the study, it was shown that SPM is an important transport medium for PTE. During the duration of the flood events, from 1 kg (Litija) to more than 1t (Belgrade) of SPM was transported downstream, indicating that the majority of anthropogenic forms of PTE is likely exported in association to SPM.

Supplementary Materials

The following supporting information can be downloaded at: https://www.mdpi.com/article/10.3390/w14081213/s1, Table S1. Concentrations of Pb, Cd, As, Cu, Cr, Ni and Zn in the dissolved phase during the flood event at Litija sampling site; Table S2. Concentrations of Pb, Cd, As, Cu, Cr, Ni and Zn in the dissolved phase during the flood event Belgrade sampling site; Figure S1. Amount of SPM versus discharge at Sremska Mitrovica, Serbia (70 km upstream Belgrade sampling point).

Author Contributions

Conceptualization, T.Z. and R.M.; methodology, T.Z. and J.V.; validation, T.Z. and J.V.; formal analysis, T.Z. and J.V.; investigation, T.Z.; resources, R.M.; data curation, T.Z.; writing—original draft preparation, T.Z.; writing—review and editing, T.Z., J.V., J.Š., M.K.K. and S.K.; visualization, T.Z.; supervision, R.M. and M.P.; project administration, R.M. and M.P.; funding acquisition, R.M. All authors have read and agreed to the published version of the manuscript.

Funding

This research was funded by the Slovenian Research Agency through the ARRS Programme P1-0143 and by the European Communities Seventh Framework Programme Funding under grant agreement no. 603629-ENV-2013-6.2.1-Globaqua and by.

Data Availability Statement

Not applicable.

Acknowledgments

Special thanks go to David Kocman for his help in preparing Figure 1. We would like to thank the two anonymous reviewers for their constructive comments.

Conflicts of Interest

The authors declare no conflict of interest.

References

  1. Ji, H.; Ding, H.; Tang, L.; Li, C.; Gao, Y.; Briki, M. Chemical Composition and Transportation Characteristic of Trace Metals in Suspended Particulate Matter Collected Upstream of a Metropolitan Drinking Water Source, Beijing. J. Geochem. Explor. 2016, 169, 123–136. [Google Scholar] [CrossRef]
  2. Binda, G.; Pozzi, A.; Livio, F.; Piasini, P.; Zhang, C. Anomalously High Concentration of Ni as Sulphide Phase in Sediment and in Water of a Mountain Catchment with Serpentinite Bedrock. J. Geochem. Explor. 2018, 190, 58–68. [Google Scholar] [CrossRef]
  3. le Meur, M.; Montargès-Pelletier, E.; Bauer, A.; Gley, R.; Migot, S.; Barres, O.; Delus, C.; Villiéras, F. Characterization of Suspended Particulate Matter in the Moselle River (Lorraine, France): Evolution along the Course of the River and in Different Hydrologic Regimes. J. Soils Sediments 2016, 16, 1625–1642. [Google Scholar] [CrossRef]
  4. Hayzoun, H.; Garnier, C.; Durrieu, G.; Lenoble, V.; le Poupon, C.; Angeletti, B.; Ouammou, A.; Mounier, S. Organic Carbon, and Major and Trace Element Dynamic and Fate in a Large River Subjected to Poorly-Regulated Urban and Industrial Pressures (Sebou River, Morocco). Sci. Total Environ. 2015, 502, 296–308. [Google Scholar] [CrossRef]
  5. Lourino-Cabana, B.; Lesven, L.; Billon, G.; Proix, N.; Recourt, P.; Ouddane, B.; Fischer, J.C.; Boughriet, A. Impacts of Metal Contamination in Calcareous Waters of Deûle River (France): Water Quality and Thermodynamic Studies on Metallic Mobility. Water Air Soil Pollut. 2010, 206, 187–201. [Google Scholar] [CrossRef]
  6. Feng, C.; Guo, X.; Yin, S.; Tian, C.; Li, Y.; Shen, Z. Heavy Metal Partitioning of Suspended Particulate Matter–Water and Sediment–Water in the Yangtze Estuary. Chemosphere 2017, 185, 717–725. [Google Scholar] [CrossRef]
  7. Hill, N.A.; King, C.K.; Perrett, L.A.; Johnston, E.L. Contaminated Suspended Sediments Toxic to an Antarctic Filter Feeder: Aqueous- and Particulate-Phase Effects. Environ. Toxicol. Chem. 2009, 28, 409–417. [Google Scholar] [CrossRef]
  8. Babcsányi, I.; Tamás, M.; Szatmári, J.; Hambek-Oláh, B.; Farsang, A. Assessing the Impacts of the Main River and Anthropogenic Use on the Degree of Metal Contamination of Oxbow Lake Sediments (Tisza River Valley, Hungary). J. Soils Sediments 2020, 20, 1662–1675. [Google Scholar] [CrossRef] [Green Version]
  9. Grove, M.K.; Bilotta, G.S.; Woockman, R.R.; Schwartz, J.S. Suspended Sediment Regimes in Contrasting Reference-Condition Freshwater Ecosystems: Implications for Water Quality Guidelines and Management. Sci. Total Environ. 2015, 502, 481–492. [Google Scholar] [CrossRef] [Green Version]
  10. Roussiez, V.; Probst, A.; Probst, J.L. Significance of Floods in Metal Dynamics and Export in a Small Agricultural Catchment. J. Hydrol. 2013, 499, 71–81. [Google Scholar] [CrossRef] [Green Version]
  11. Baborowski, M.; von Tümpling, W.; Friese, K. Behaviour of Suspended Particulate Matter (SPM) and Selected Trace Metals during the 2002 Summer Flood in the River Elbe (Germany) at Magdeburg Monitoring Station. Hydrol. Earth Syst. Sci. 2004, 8, 135–150. [Google Scholar] [CrossRef] [Green Version]
  12. Chen, J.; Bouchez, J.; Gaillardet, J.; Louvat, P. Behaviors of Major and Trace Elements during Single Flood Event in the Seine River, France. Procedia Earth Planet. Sci. 2014, 10, 343–348. [Google Scholar] [CrossRef] [Green Version]
  13. Peraza-Castro, M.; Sauvage, S.; Sánchez-Pérez, J.M.; Ruiz-Romera, E. Effect of Flood Events on Transport of Suspended Sediments, Organic Matter and Particulate Metals in a Forest Watershed in the Basque Country (Northern Spain). Sci. Total Environ. 2016, 569–570, 784–797. [Google Scholar] [CrossRef] [PubMed]
  14. Zhang, C.; Yu, Z.-g.; Zeng, G.-m.; Jiang, M.; Yang, Z.-z.; Cui, F.; Zhu, M.-y.; Shen, L.-q.; Hu, L. Effects of Sediment Geochemical Properties on Heavy Metal Bioavailability. Environ. Int. 2014, 73, 270–281. [Google Scholar] [CrossRef]
  15. Ma, Y.; Qin, Y.; Zheng, B.; Zhang, L.; Zhao, Y. Seasonal Variation of Enrichment, Accumulation and Sources of Heavy Metals in Suspended Particulate Matter and Surface Sediments in the Daliao River and Daliao River Estuary, Northeast China. Environ. Earth Sci. 2015, 73, 5107–5117. [Google Scholar] [CrossRef]
  16. Matsunaga, T.; Tsuduki, K.; Yanase, N.; Kritsananuwat, R.; Ueno, T.; Hanzawa, Y.; Naganawa, H. Temporal Variations in Metal Enrichment in Suspended Particulate Matter during Rainfall Events in a Rural Stream. Limnology 2014, 15, 13–25. [Google Scholar] [CrossRef]
  17. Fliedner, A.; Rüdel, H.; Knopf, B.; Weinfurtner, K.; Paulus, M.; Ricking, M.; Koschorreck, J. Spatial and Temporal Trends of Metals and Arsenic in German Freshwater Compartments. Environ. Sci. Pollut. Res. 2014, 21, 5521–5536. [Google Scholar] [CrossRef]
  18. Milačič, R.; Zuliani, T.; Vidmar, J.; Oprčkal, P.; Ščančar, J. Potentially Toxic Elements in Water and Sediments of the Sava River under Extreme Flow Events. Sci. Total Environ. 2017, 605–606, 894–905. [Google Scholar] [CrossRef]
  19. Vidmar, J.; Zuliani, T.; Novak, P.; Drinčić, A.; Ščančar, J.; Milačič, R. Elements in Water, Suspended Particulate Matter and Sediments of the Sava River. J. Soils Sediments 2017, 17, 1917–1927. [Google Scholar] [CrossRef] [Green Version]
  20. Sanchís, J.; Milačič, R.; Zuliani, T.; Vidmar, J.; Abad, E.; Farré, M.; Barceló, D. Occurrence of C60 and Related Fullerenes in the Sava River under Different Hydrologic Conditions. Sci. Total Environ. 2018, 643, 1108–1116. [Google Scholar] [CrossRef]
  21. Marković, M.; Zuliani, T.; Simić, S.B.; Mataruga, Z.; Kostić, O.; Jarić, S.; Vidmar, J.; Milačič, R.; Ščančar, J.; Mitrović, M.; et al. Potentially Toxic Elements in the Riparian Soils of the Sava River. J. Soils Sediments 2018, 18, 3404–3414. [Google Scholar] [CrossRef] [Green Version]
  22. Milačič, R.; Ščančar, J.; Murko, S.; Kocman, D.; Horvat, M. A Complex Investigation of the Extent of Pollution in Sediments of the Sava River. Part 1: Selected Elements. Environ. Monit. Assess. 2010, 163, 263–275. [Google Scholar] [CrossRef] [PubMed]
  23. Heath, E.; Ščančar, J.; Zuliani, T.; Milačič, R. A Complex Investigation of the Extent of Pollution in Sediments of the Sava River: Part 2: Persistent Organic Pollutants. Environ. Monit. Assess. 2010, 163, 263–275. [Google Scholar] [CrossRef] [PubMed]
  24. Ščančar, J.; Heath, E.; Zuliani, T.; Horvat, M.; Kotnik, J.; Perko, S.; Milačič, R. Elements and Persistent Organic Pollutants in the Sediments of the Sava River; Springer: Berlin/Heidelberg, Germany, 2015; Volume 31. [Google Scholar] [CrossRef]
  25. ARSO. Slovenian Environmental Agency. Available online: https://www.arso.gov.si/en/ (accessed on 10 January 2022).
  26. Ogrinc, N.; Kocman, D.; Miljević, N.; Vreča, P.; Vrzel, J.; Povinec, P. Distribution of H and O Stable Isotopes in the Surface Waters of the Sava River, the Major Tributary of the Danube River. J. Hydrol. 2018, 565, 365–373. [Google Scholar] [CrossRef]
  27. ISRBC. Available online: Https://Savagis.Org/Map (accessed on 10 January 2022).
  28. Rügner, H.; Schwientek, M.; Milačič, R.; Zuliani, T.; Vidmar, J.; Paunović, M.; Laschou, S.; Kalogianni, E.; Skoulikidis, N.T.; Diamantini, E.; et al. Particle Bound Pollutants in Rivers: Results from Suspended Sediment Sampling in Globaqua River Basins. Sci. Total Environ. 2019, 647, 645–652. [Google Scholar] [CrossRef]
  29. Tóth, B.; Bódis, E. Estimation of Suspended Loads in the Danube River at Göd (1668 River Km), Hungary. J. Hydrol. 2015, 523, 139–146. [Google Scholar] [CrossRef] [Green Version]
  30. Rügner, H.; Schwientek, M.; Beckingham, B.; Kuch, B.; Grathwohl, P. Turbidity as a Proxy for Total Suspended Solids (TSS) and Particle Facilitated Pollutant Transport in Catchments. Environ. Earth Sci. 2013, 69, 373–380. [Google Scholar] [CrossRef]
  31. Hurley, R.R.; Rothwell, J.J.; Woodward, J.C. Metal Contamination of Bed Sediments in the Irwell and Upper Mersey Catchments, Northwest England: Exploring the Legacy of Industry and Urban Growth. J. Soils Sediments 2017, 17, 2648–2665. [Google Scholar] [CrossRef]
  32. EU Water Framework Directive. Available online: https://www.pianc.org/eu-water-framework-directive (accessed on 15 November 2021).
  33. Pavlović, P.; Marković, M.; Kostić, O.; Sakan, S.; Đorđević, D.; Perović, V.; Pavlović, D.; Pavlović, M.; Čakmak, D.; Jarić, S.; et al. Evaluation of Potentially Toxic Element Contamination in the Riparian Zone of the River Sava. Catena 2019, 174, 399–412. [Google Scholar] [CrossRef]
  34. Šajn, R.; Gosar, M. Soil Pollution in Surroundings of Litija as a Reflectionofmining, Metallurgy and Natural Conditions. Geologija 2007, 50, 131–145. [Google Scholar] [CrossRef]
Figure 1. The Sava River Basin, indicating the sampling locations and land cover.
Water 14 01213 g001
Figure 2. Amount of SPM and discharge/water level at different sampling times during the flash flood events at (a) Litija, Slovenia, and (b) Belgrade, Serbia.
Water 14 01213 g002
Figure 3. Time series of behaviour of (a) pH and electrical conductivity in Litija, (b) discharge and dissolved oxygen in Litija, (c) correlation of SPM concentration and turbidity in Litija, (d) pH and electrical conductivity in Belgrade, (e) water level and dissolved oxygen in Belgrade, and (f) correlation of SPM concentration and turbidity in Belgrade.
Water 14 01213 g003
Figure 4. Relationship between SPM concentration and dissolved PTE at (a) Litija and (b) Belgrade sampling sites.
Water 14 01213 g004
Figure 5. Spearman correlation matrix for all analysed elements with significance model set at p < 0.05: (a) dissolved elements from Litija and (b) dissolved elements from Belgrade.
Water 14 01213 g005
Figure 6. Relationship between the amount of SPM and PTE concentrations in SPE for (a) Litija and (b) Belgrade, and the relationship between the amount of SPM and AL, Mn and Fe for (c) Litija and (d) Belgrade.
Water 14 01213 g006
Table 1. Distribution coefficients calculated for Litija and Belgrade data.
LocationDate and Time of SamplingKD
AsCrCuNiZn
Litija1.5.2016 15-004.76.14.95.75.0
2.5.2016 05-004.86.15.15.75.7
15.5.2016 09-004.55.54.44.95.5
15.5.2016 13-004.65.54.44.95.4
15.5.2016 17-304.65.44.44.95.5
15.5.2016 21-004.45.34.34.85.4
16.5.2016 05-304.45.24.14.85.4
16.5.2016 13-304.45.24.35.05.4
17.5.2016 05-504.35.14.25.05.4
18.5.2016 05-504.35.04.65.25.2
19.5.2016 05-004.75.84.85.75.4
23.5.2016 06-004.65.85.25.85.4
Belgrade8.3.2016 17-004.65.94.75.25.2
9.3.2016 07-004.96.15.05.25.5
9.3.2016 17-004.05.64.35.04.8
10.3.2016 07-004.65.84.75.05.0
10.3.2016 17-004.45.84.75.35.2
11.3.2016 07-004.55.74.75.15.6
11.3.2016 17-004.55.84.85.25.1
12.3.2016 08-004.65.84.85.35.3
12.3.2016 17-004.55.84.65.25.0
13.3.2016 08-004.55.84.75.15.1
13.3.2016 17-004.55.74.85.34.7
16.3.2016 8-004.55.64.65.34.9
18.3.2016 17-004.55.84.85.35.5
22.3.2016 17-004.55.84.45.25.3
Publisher’s Note: MDPI stays neutral with regard to jurisdictional claims in published maps and institutional affiliations.

