
Effects of Irrigation and N Fertilization on 15N Fertilizer Utilization by Vitis vinifera L. Cabernet Sauvignon in China


College of Water & Architecture Engineering, Shihezi University, Shihezi 832000, China
*
Author to whom correspondence should be addressed.
Water 2022, 14(8), 1205; https://doi.org/10.3390/w14081205
Submission received: 17 March 2022
/
Revised: 6 April 2022
/
Accepted: 7 April 2022
/
Published: 8 April 2022
(This article belongs to the Special Issue Fertigation in Agriculture: Challenges and Solutions)
Abstract
:This study investigated the interactions between different irrigation and nitrogen (N) fertilization rates and their effects on the 15N fertilizer absorption and utilization of Cabernet Sauvignon grapevines in a vineyard near Xinjiang, China. The fertilizer treatments consisted of three 15N-labeled urea nitrate fertilizer applications (191.4, 254.4, and 317.4 kg/ha). The irrigation treatments included two fractions (0.75 and 1.0) of estimated vineyard water use (ETc). The results showed that: (i) the residual amount of 15N fertilizer in the soil was mainly in the surface layer (0–20 cm), the residual fertilizer N in the surface layer accounted for 68–87% of the total residual N, the residual 15N fertilizer at different depths differed significantly, and the residual 15N was positively correlated with the amount of fertilizer applied (p < 0.05); (ii) The absorption of fertilizer N by grapevines accounted for only 12–17% of the total N absorption, and the proportion absorbed from soil N was as high as 82–87%. There was no significant difference in the amount of N absorbed between different water and fertilizer treatments; (iii) The 15N uptake under the different water and fertilizer treatments differed and was significantly higher in the roots than in other organs, followed by the fruit, the leaves, and finally, the stems. Our results provide a reference for improving the soil environment and encouraging a sustainable development of the grape industry. According to the experimental results, it was recommended that farmers adopt irrigation levels of 1.0 ETc and fertilizer application of 254.4 kg N/ha.
1. Introduction
Excessive nitrogen (N) application in crop production in China results in serious economic losses, as well as environmental pollution. Research has shown that China’s fertilization level is three to four times the world average [1]. Farmers tend to apply more chemical fertilizer into cultivated land in an effort to increase productivity. Reducing loss during and after N fertilizer application is the key to optimizing N fertilizer inputs, increasing N fertilizer use efficiency, and reducing environmental pollution [2]. Grape is one of the primary fruits cultivated in China and plays an important role in promoting local economic development and increasing agricultural income. At present, N management in many grape-producing areas in China is highly problematic [3,4,5] due to excessive and extensive N application, as well as the incongruous application of water and N, which negatively impacts soil physical, chemical, and biological properties and causes imbalances in soil water, fertilizer, gas, and heat factors, resulting in extensive soil hardening. This weakens the ability of the soil to provide a buffer against water stress and nutrient deficiencies, forcing farmers to irrigate more frequently and apply fertilizer regularly to maintain yields. This reduces the utilization rate of water and nutrients and increases farmland management costs. Some studies have shown that the excessive application of N and unreasonable fertilization methods not only result in gradual decreases in the N utilization rate [6] but also have many other adverse consequences, such as aggravating fruit disease and environmental pollution [7].
Fertilizer absorption and utilization have been shown to be dependent upon irrigation techniques [8,9], soil types [10], phenological stages [11], fertilizer amounts and fertilization application frequency [12,13], and fertilizer application methods [14] in grapevines. In terms of fertilizer absorption and utilization in grapevines, it has been reported that nearly 40% of the spring-applied N that is still present in the leaves at harvesting is translocated to the shoots and permanent structures during leaf senescence [15]. The N recovery efficiency (REN) of grapevines has been reported to be similar at budbreak (7.1%) and blooming (10.6%) [16]. In another study on grapevines, fertilizer quantity had a significant effect on the REN under different fertilization and irrigation rates, and full irrigated vineyard water use tended to increase the REN when compared with deficit irrigation [17]. Another study reported that N application during budbreak and the post-harvesting period resulted in the highest content of labeled N in the dormant storage tissue and in the leaf tissue during rapid spring growth and at flowering [18]. A previous 15N tracer test showed that 15N urea could be transported to the fine roots at 12–24 h after absorption [19]. In the aforementioned study, both total N and fertilizer N were stored in the roots, especially in the coarse roots, and the growth and development of new organs after germination preferentially utilized the fertilizer N absorbed by the leaves. One study showed that more than 80% of the fertilizer N was distributed in the roots and branches in the first year, while about 50% was distributed in the fruit in the second year, and with an increase in fertilizer application, the N utilization rate decreased [20]. The 15N distribution rates and use efficiencies of various grapevine organs under different water and fertilizer applications were found to differ [21].
While studies in various species have found that the interaction between irrigation and fertilizer application increases [21] or decreases [22,23] fertilizer absorption, this aspect remains unclear in grapevine. The interactive effects of different applied water and N fertilizer amounts on grapevine fertilizer absorption have yet to be determined. This interaction may have implications for vineyard management. The effect of the soil water balance on N availability could be considered as important as the direct effects of water stress on plant growth, because the rate of nutrient flow to the roots, especially nitrates, is one of the most limiting factors constraining nutrient availability and uptake by the roots [24]. It has been shown that soil water conditions impact the vegetative and reproductive growth of grapevine [25]. In addition, different irrigation practices and irrigation quantities might also alter the soil water balance and the mobilization of N and other nutrients to the roots. Similarly, plant N status can affect the plant water status under similar conditions of water availability [26,27].
At present, drip irrigation technology has been widely used in grape planting in arid regions of China because of its strong topographic adaptability, high water-use efficiency and yield increases. In areas with sufficient water sources and other climate type areas, ditch irrigation, micro-sprinkler irrigation, infiltration irrigation, and flood irrigation are commonly used for grape planting. From the perspective of China’s comprehensive water resources planning, drip irrigation will be the mainstream grape water-saving irrigation technology in the future because of its mature technology, low energy consumption, and high efficiency. Compared with cotton and wheat, grapes have stronger drought tolerance, and the amount of irrigation is 750–1500 m3/ha more than them. However, compared with apple, pear, peach, and other fruit trees, grapes need about twice as much water, as the water demand of grape under the growth period of surface drip irrigation in arid areas is about 4500 m3/ha. Due to the differences in soil texture and climate in different areas, water demand varies greatly. Grapevine is a tree with high N demand, and there are differences in the absorption and utilization characteristics of N in various organs at different growth stages. Studies have found that the utilization rate of N fertilizer applied to fruit trees with soil is low, while the 15N utilization rate of multiple fertilization treatments was significantly higher than that of single fertilization treatment [28]. The absorption and utilization rate of 15N decreases with the decrease in irrigation, and the amount of irrigation is inversely proportional to the 15N residue in soil [28]. Studies have shown that late topdressing can promote the movement of fertilizer N to fruit, and starting N topdressing can improve the absorption and utilization of fertilizer N [29]. It has been found that the N absorbed by plants mainly comes from soil N, while the proportion of fertilizer N is lower. Therefore, the fertilization time and fertilization method should be fully considered.
The primary objective of this study was thus to determine the effects of the interaction between different irrigation and N fertilizer rates on the fertilizer absorption of the current-season aboveground organs of Cabernet Sauvignon grapevine (Vitis vinifera L.). The secondary objective was to evaluate the general distribution patterns of labeled N in the vine organs, as well as the effects of N fertilizer and irrigation and their interaction on fertilizer N utilization efficiency in the current season in order to provide a reference for the efficient utilization of N in drip irrigation grapes in arid areas of China.
2. Materials and Methods
2.1. Site Description
In 2018, the experiment was conducted in a vineyard of the 147th regiment of the Production and Construction Corps in Xinjiang, China (latitude: 44°50′ N, longitude: 86°15′ E). According to data obtained from the China’s Tianqi intelligent meteorological station, which is located at the nearby site of the 10th company of the 29th regiment of Kolar, Xinjiang, the region has a temperate continental arid climate, the annual average temperature is 6–8 °C, the annual precipitation is 106.1–178.3 mm, the annual evaporation is 1722.5–2260.5 mm, the annual sunshine hours exceed 2800 h, the active accumulated temperature (≥10 °C) is more than 3300 °C, and the frost-free period is about 160 d. The sunshine duration is long, and the temperature difference between night and day is great particularly in August and September, which is conducive to the accumulation of grape pigments and sugars. The region constitutes a high-quality production area for grapevine cultivation. The soil in the test area is a sandy loam with an organic matter content of 0.8%, total N of 0.04%, total phosphorus (P) of 0.14%, available P of 9.2 mg/kg, available potassium (K) of 244 mg/kg, and alkali hydrolyzed N of 33 mg/kg at depths ranging from 0.1 to 1 m. The soil is characterized by N deficiency, P deficiency, and K enrichment (Table 1 and Table 2). The soil bulk density is 1.47 g/cm3, and the groundwater level is 15 m below the surface.
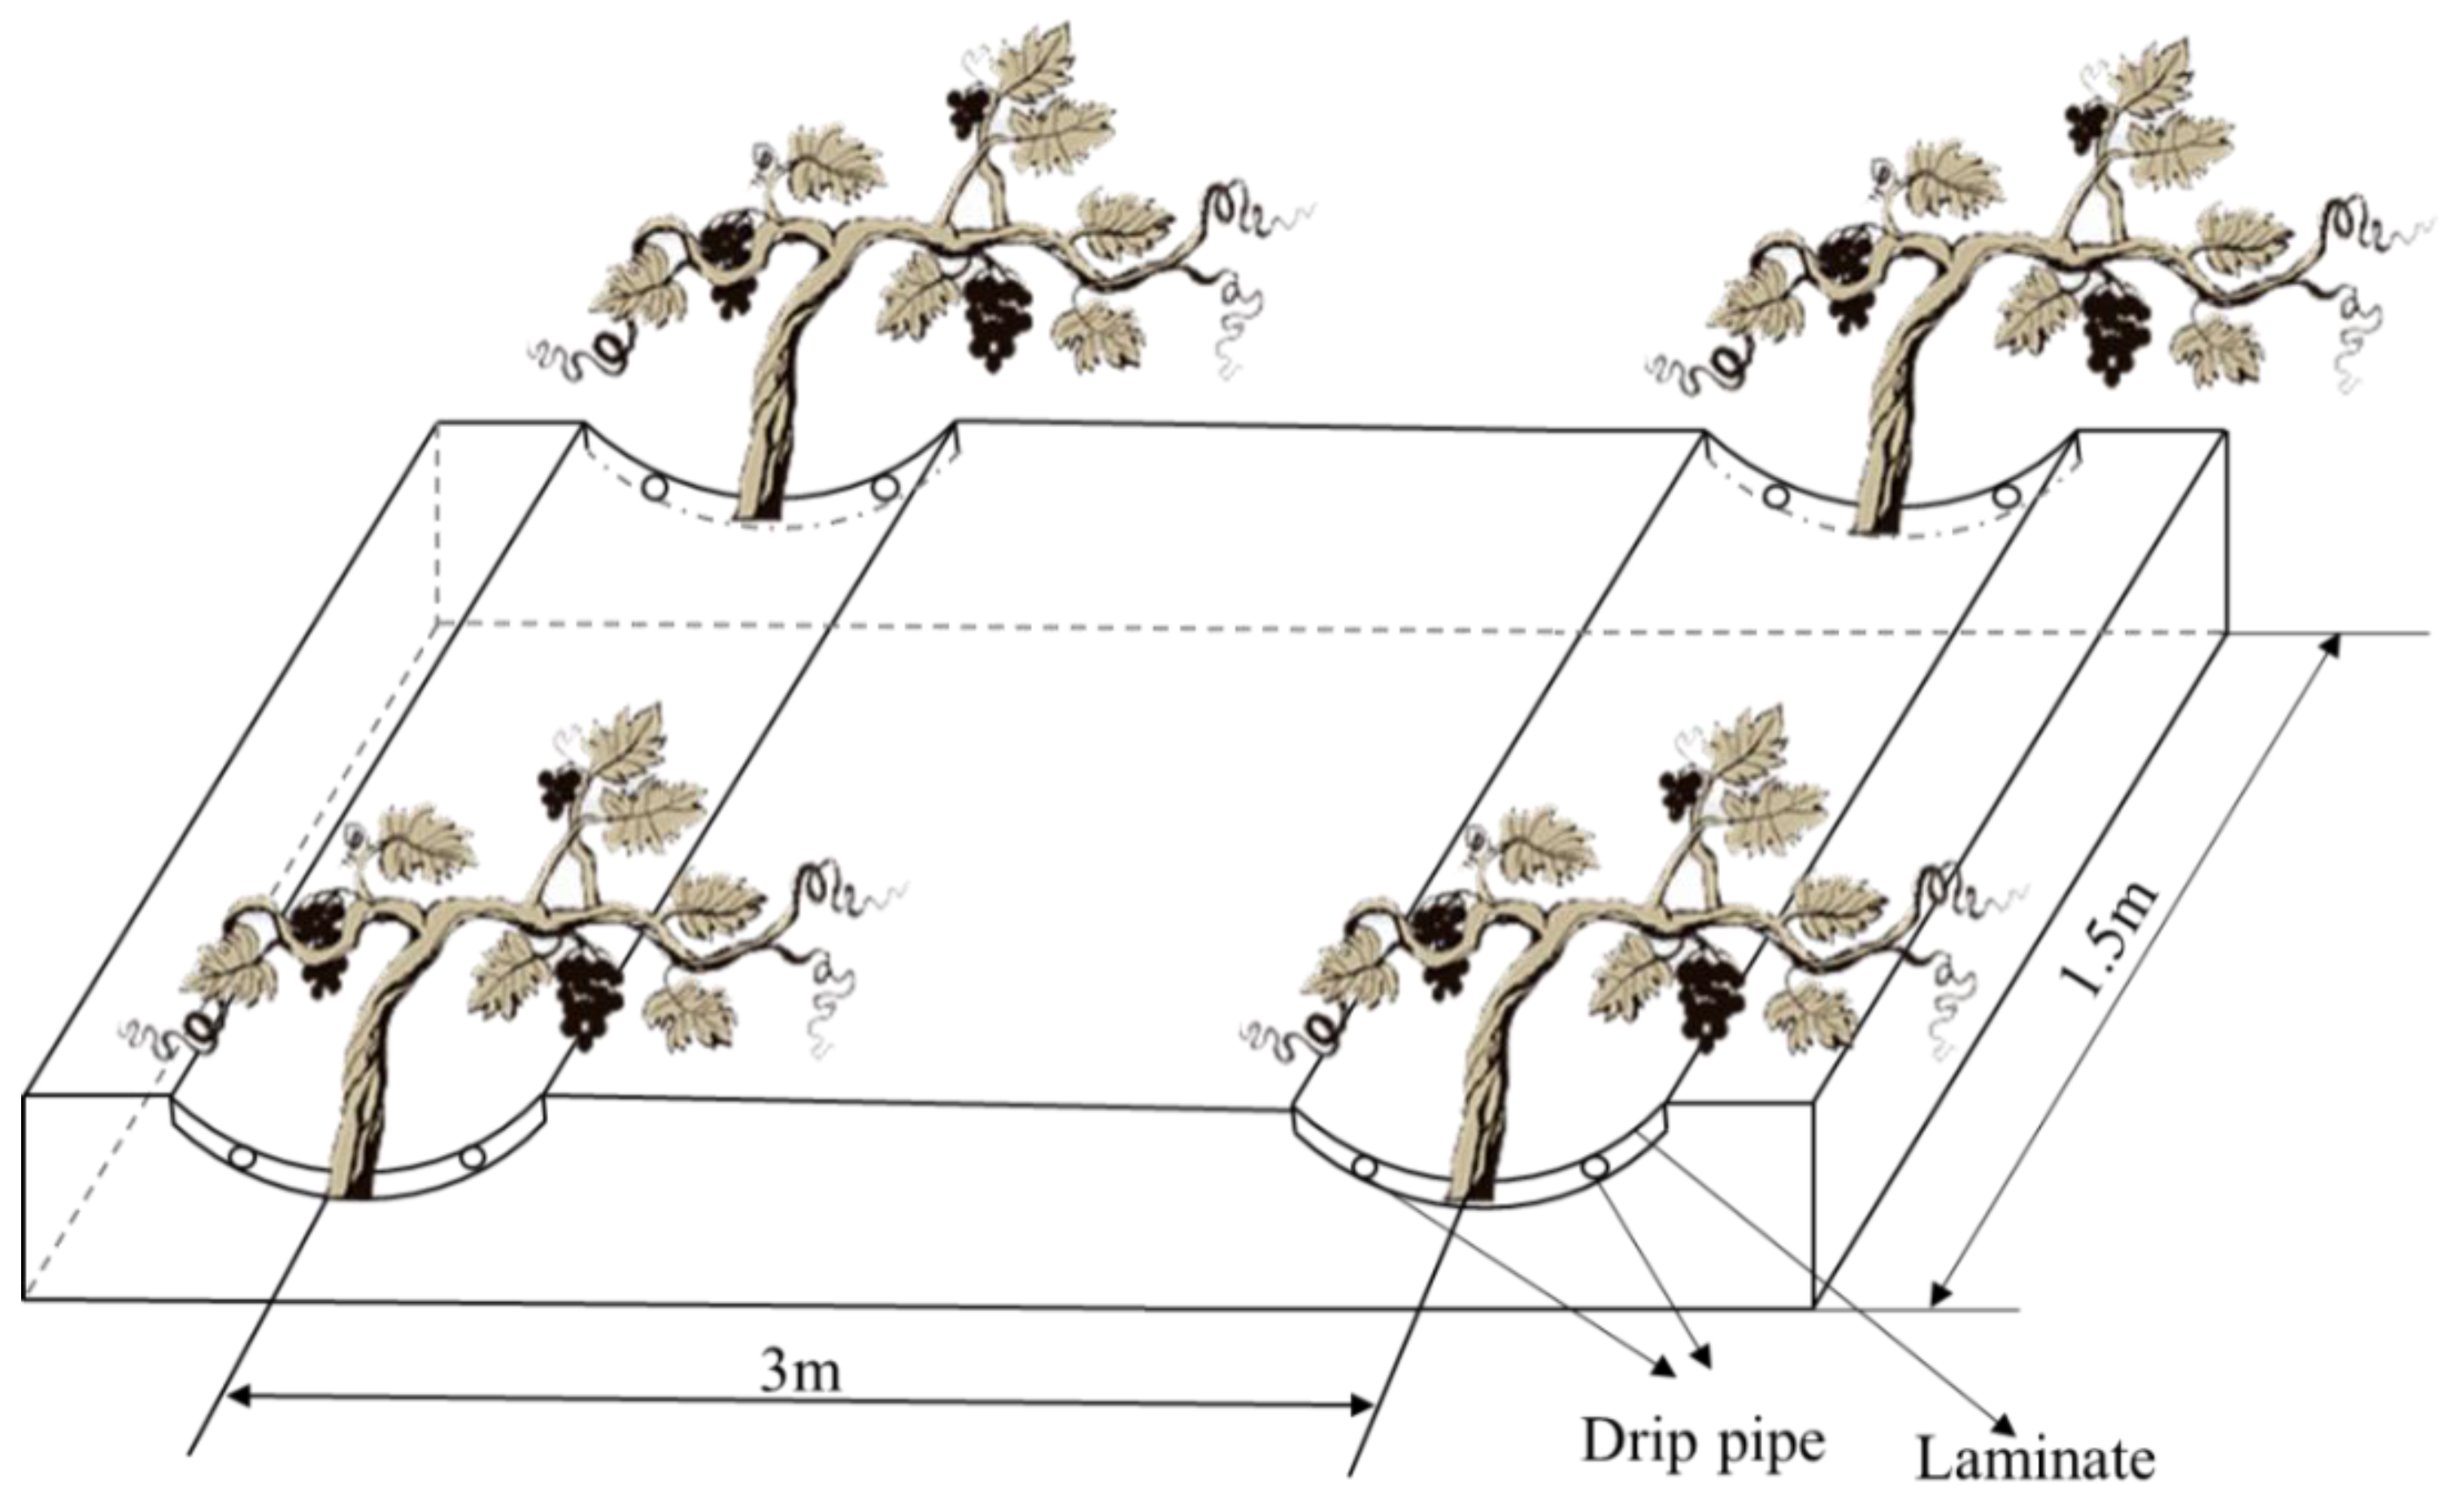
Twelve-year-old Vitis vinifera L. Cabernet Sauvignon plants were used in this experiment. Plants were grafted onto the rootstock of grape variety “3309C”. The vine and row spacings were 1.5 and 3 m, respectively, and the vines were trained onto a trellis (Figure 1). Trellises help vines climb and grow. The vine planting, weeding, pruning, trimming, ploughing, and winter burying were conducted according to local management practices.
2.2. Experimental Design
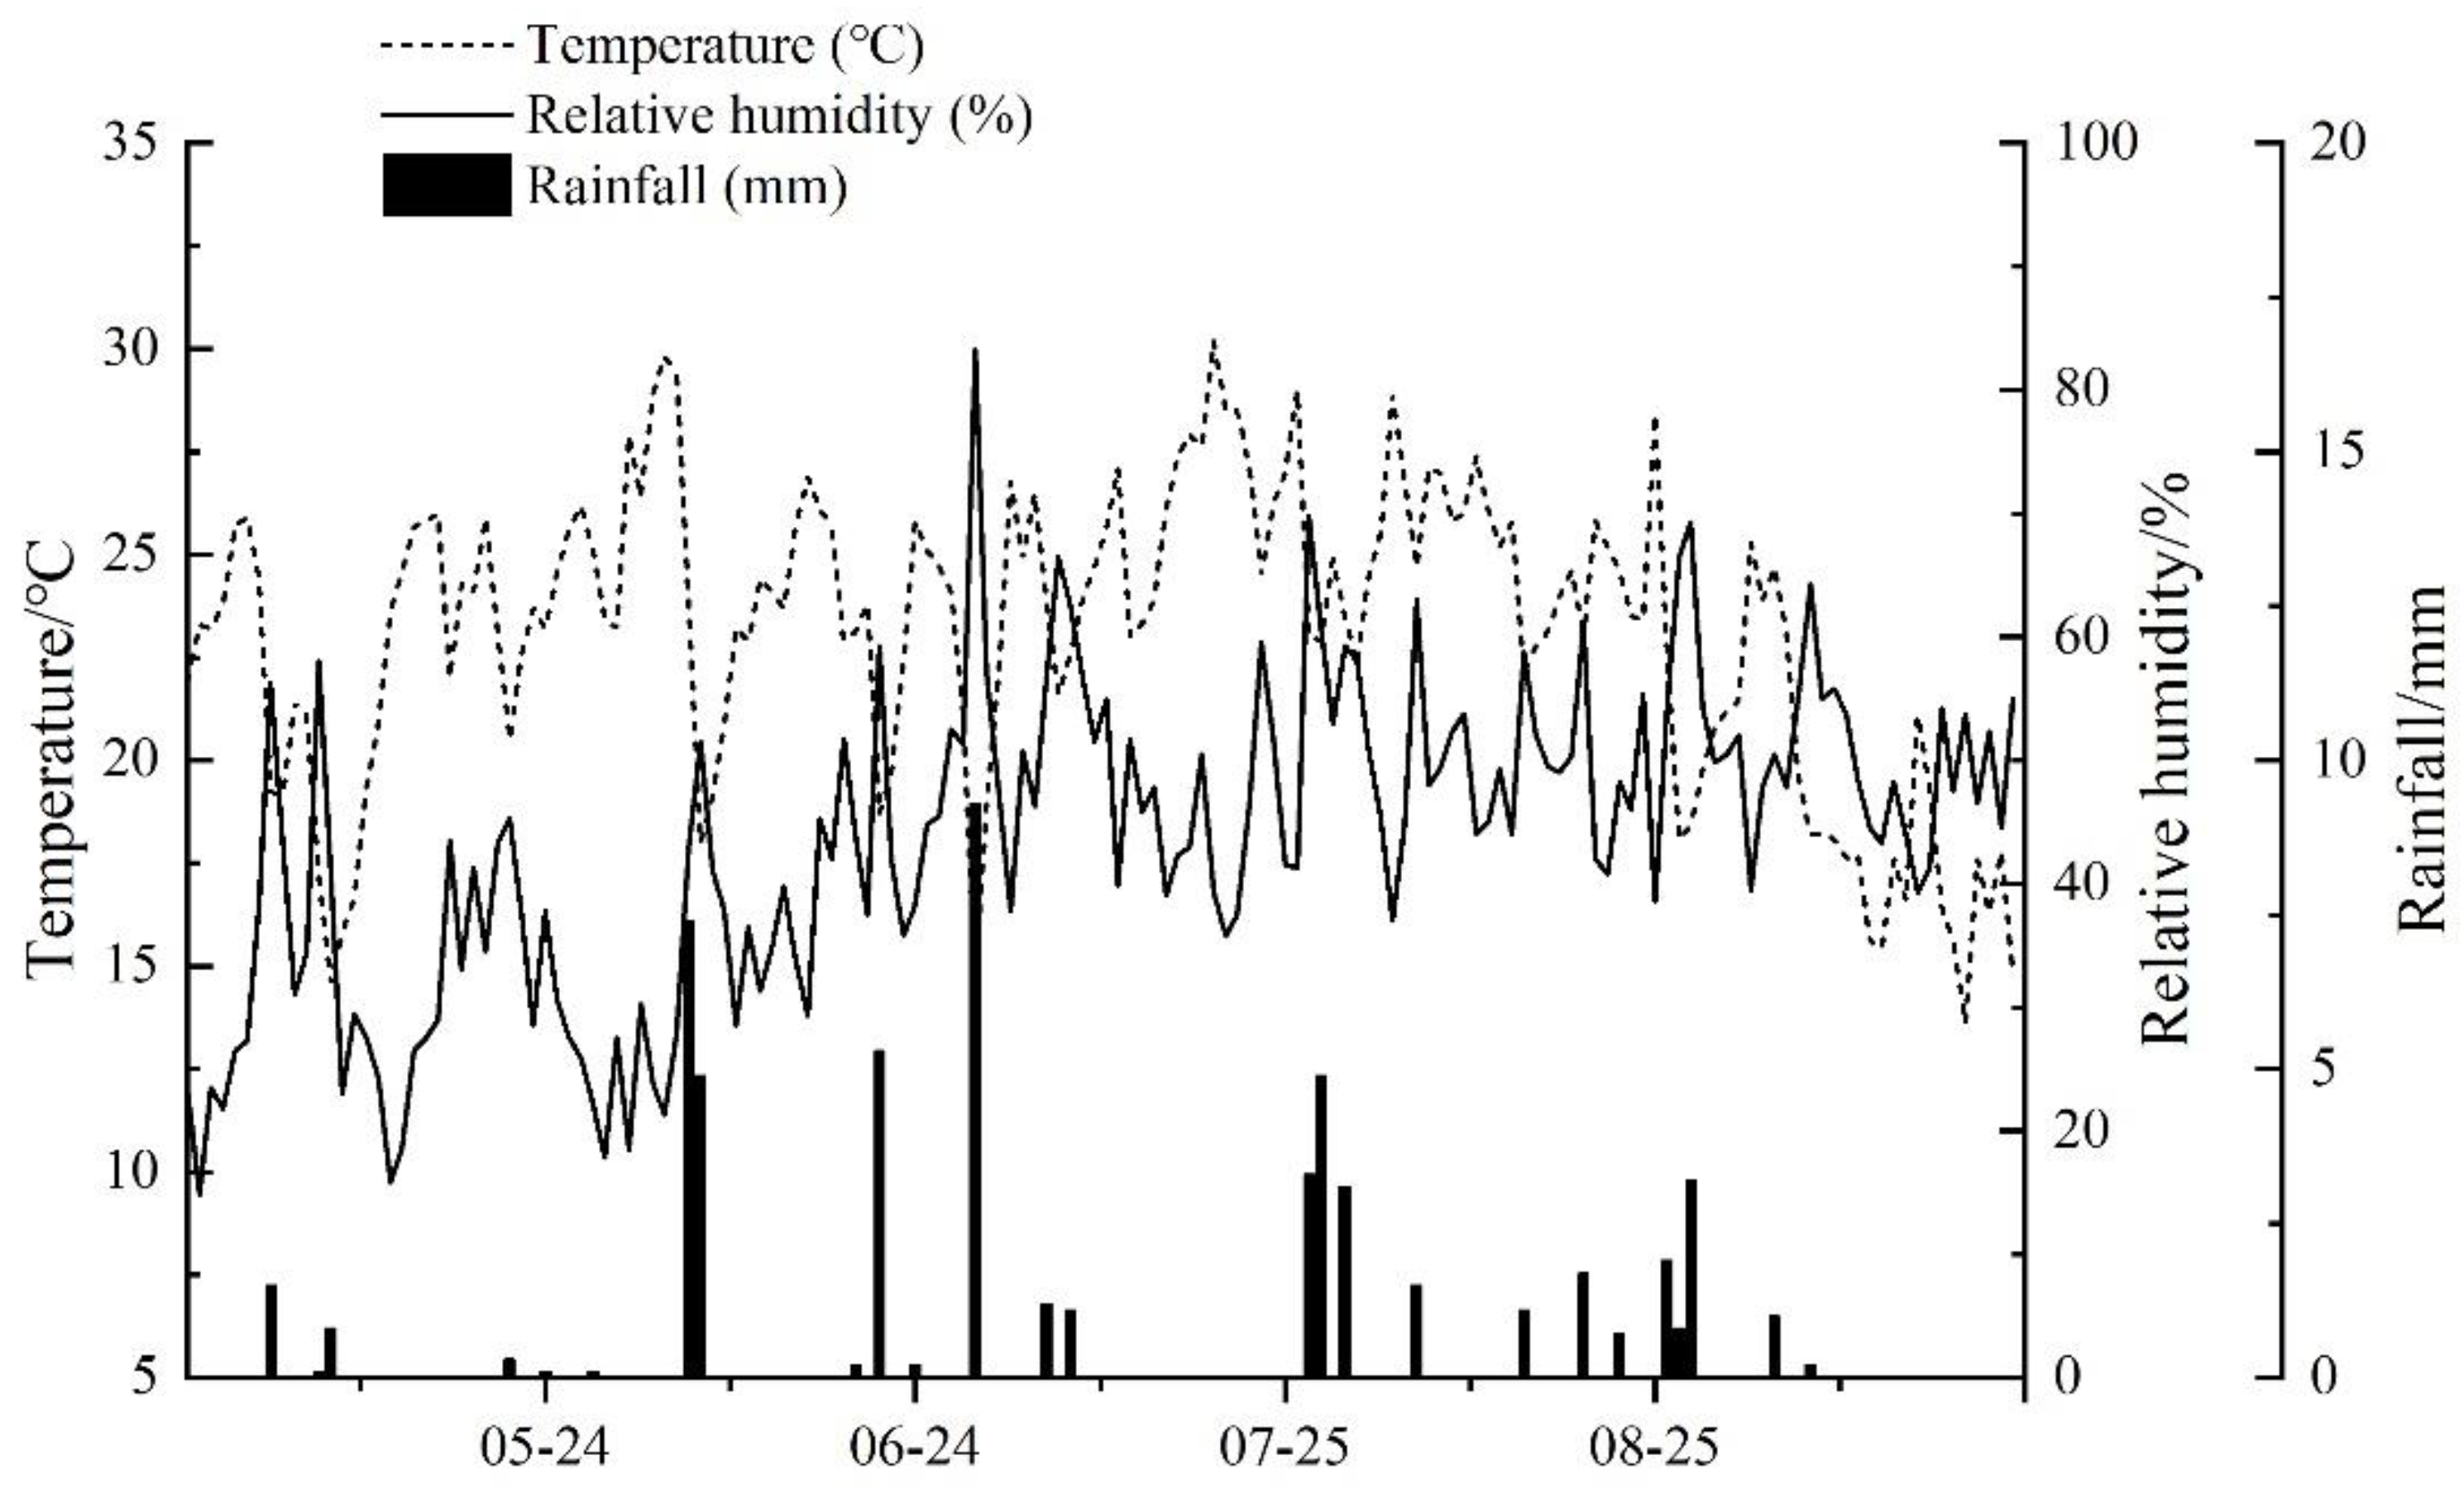
There were six treatments in the experiment, (two irrigation levels × three fertilization levels, with three repetitions conducted for each treatment (W1N1, W1N2, W1N3, W2N1, W2N2, W2N3, the capital letter “W” represents the irrigation level, and the letter “N” represents the level of nitrogen fertilizer applied). Drip irrigation treatments were 0.75 estimated vineyard water use (ETC) and 1.0 ETC and were irrigated from 15 April to 30 September. The irrigation interval was about 15 days. Irrigation was conducted a total of eight times in the whole growth period. According to the meteorological data downloaded from meteorological stations, the crop water requirements were calculated once every 15 days, and irrigation was carried out. The rainfall, temperature, and relative humidity during the experiment are shown in Figure 2. The calculation formula of crop water requirement is as follows:
ETc = Kc × ET0.
In the formula, Kc is the crop coefficient (the FAO-56 recommended value is adopted, where Kc = 0.3 in the early growth stage, Kc = 1.2 in the middle growth stage, and Kc = 0.6 in the late growth stage); and ET0 is the reference evapotranspiration of crops and is calculated by the Penman–Monteith formula recommended by FAO-56. Using this formula, ETc was calculated at 540 mm (whole growth period). The differing irrigation amounts were obtained by varying the irrigation duration of the emitters in each treatment. The soil water status was monitored with a soil moisture probe (PR2–6 Soil Profile Moisture Tester, Produced by Delta-T Company, Cambridge, UK) at regular intervals during the growing season.
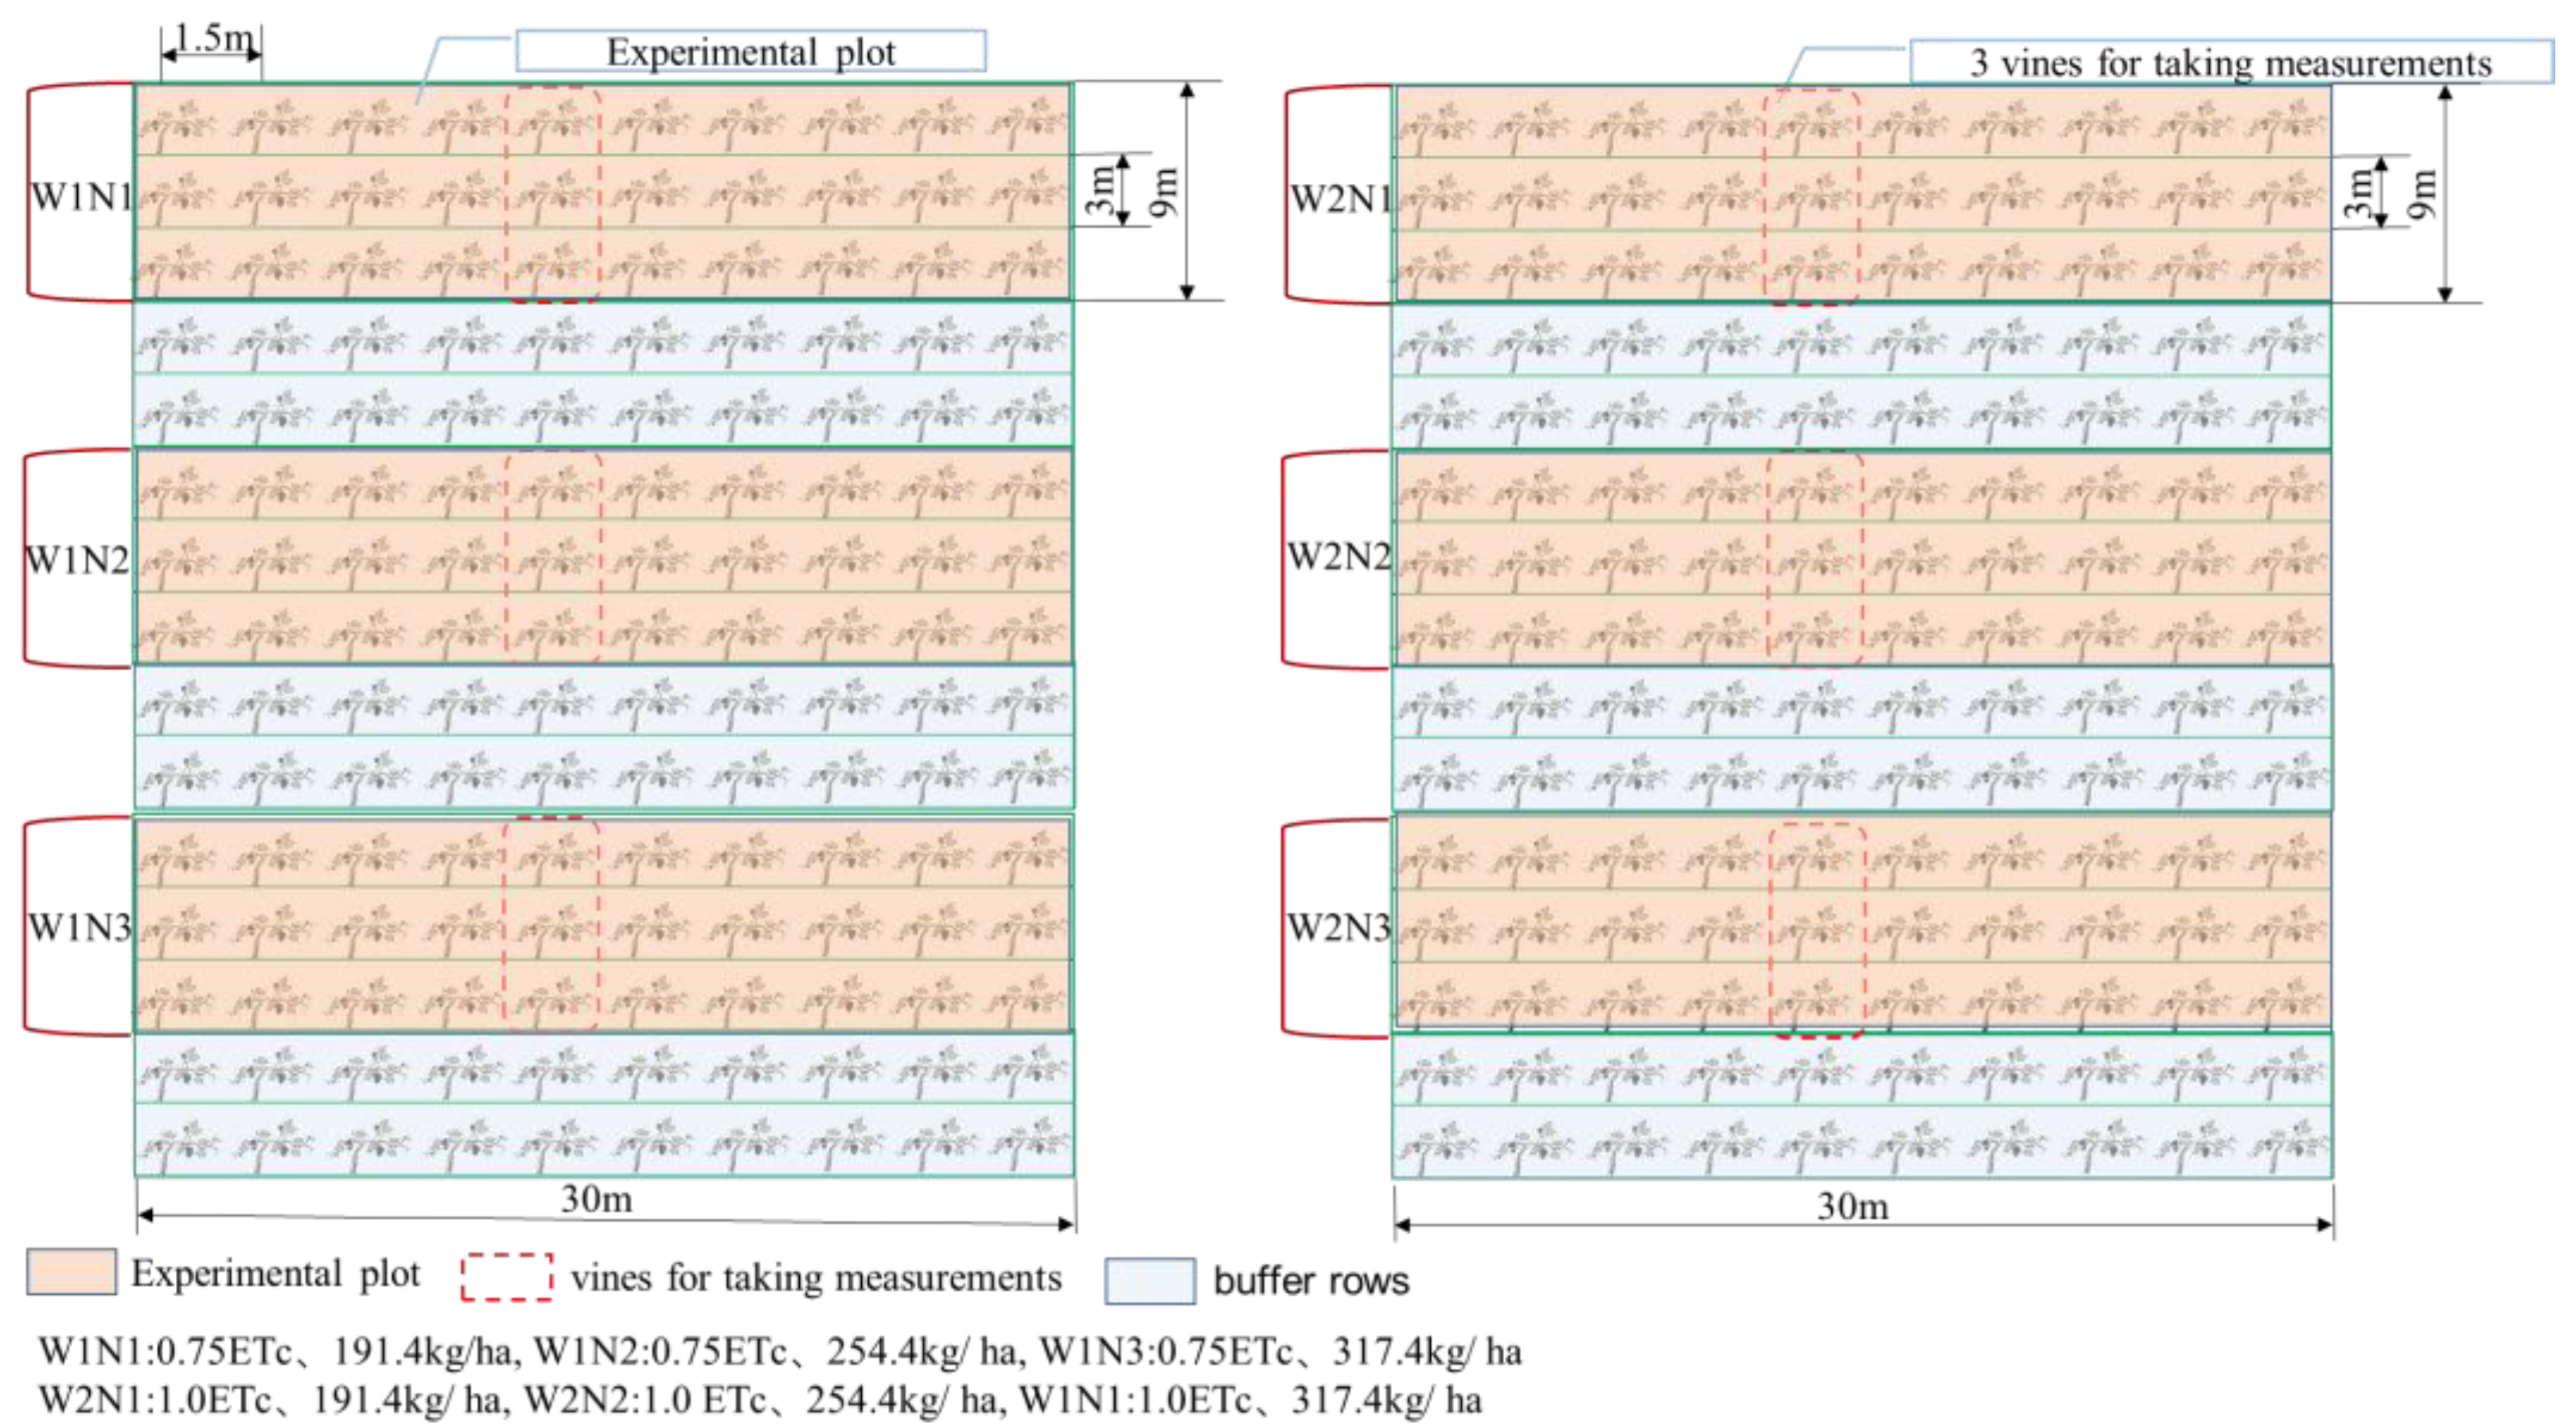
Two drip irrigation pipes were laid for each row of vines; the drip irrigation pipes were composed of polyethylene, with an inner diameter of 16 mm and a spacing of 30 cm between pipes. The experimental plot was 9 m × 30 m; each experimental plot was separately equipped with a water flowmeter, a ball valve, and an independent fertilization system to control irrigation and fertilization. One experimental plot was used for each treatment, and each experimental plot had three rows of vines. Each treatment was tested on three adjacent rows, each one of which represented a replicate, and three vines per replicate were randomly sampled for taking measurements. Two buffer rows separated the replicates of one treatment from those of the other treatments (Figure 3). The three fertilization treatments consisted of three doses of labeled N (15N): N1 (191.4, kg/ha), N2 (254.4, kg/ha), and N3 (317.4, kg/ha). These doses were set according to the initial soil nutrients and the local appropriate fertilization level (N-P2O5-K2O:1:2:2). The fertilizers used were urea (N content 40%, abundance 5.16%, produced by the Shanghai Research Institute of Chemical Technology, Shanghai in China), ammonium dihydrogen phosphate (P2O5 content 52%), and potassium chloride (K2O content 50%). Fertilization was divided into base fertilizer and chasing fertilizer, with a ratio of 7:3. The base fertilizer was applied in furrows, and the chasing fertilizer was applied with water three times (on 8 May, 5 June, and 3 July 2018); the amount of chasing fertilizer applied on these dates was 40%, 30%, and 30% of the total amount of chasing fertilizer, respectively.
2.3. Measurement Items and Methods
(1) Biomass of different vine organs: Three branches were selected from the upper, middle, and lower part of each vine and marked with identification plates, and the length of branches was measured with a steel ruler. The roots, stems, leaves, and fruits of fruit trees selected from each treatment were collected in the vine expansion stage, mature stage, and harvesting stage, respectively. After drying and grinding, the total N content and 15N abundance were determined. The dry weight was determined for each sample by placing the samples into an oven at 105 °C for 30 min and then baking at 75 °C [30] until a constant weight was attained. The dry samples were weighed and then milled. Approximately 15 mg of each sample was placed into 8 × 5 mm aluminum foil for further analysis.
(2) Total N content in the vine and soil samples: Soil samples were collected at the ripe stage of vines, and a sampling point was set every 20 cm in the horizontal direction (0–100 cm away from the trunk) and vertical direction (0–100 cm deep) of the fruit trees selected in each experimental plot, for root sampling and rhizosphere soil sampling. The weight of soil samples was about 100 g. The roots were separated from the soil and cleaned, and the soil was dried at 105 °C for 6–8 h. After drying, the soil was ground and sieved. The total N content was determined by the Kjelsner method [31], and the 15N isotope abundance was determined using a stable isotope mass spectrometer MAT-253 (Semefi MAT-253 stable isotope ratio mass spectrometer produced in Germany). The fertilization position was 30 cm away from both sides of the tree in the vertical tree row direction.
(3) 15N content in the vine and soil samples (%): The 15N contents were determined with a MAT-253 isotope ratio mass spectrometer at the Stable Isotope Lab Institute of Geography and Resources, Chinese Academy of Sciences (Beijing, China).
(4) The percent N derived from fertilizer (Ndff) is the relative amount of N present in the organs that originated from the labeled fertilizer in relation to the total amount of N in the sample. Ndff is calculated as
Ndff = As/Af.
In the equation, Ndff is the percentage of N that originated from fertilizer in each organ of the vine, As is the 15N atom percentage in each organ of the vine, and Af is the 15N atom percentage in the fertilizer.
The 15N fertilizer utilization efficiency in the current season was defined as the fraction of fertilizer N taken up by the vines in relation to the amount of N applied. The 15N fertilizer utilization efficiency is calculated as
where 15Ns represents the relative amount of 15N found in the sample in relation to TN (total N), 15Nna is the relative natural abundance of the isotope (15Nna = 0.3663%), and 15Nap is the amount of 15N applied per vine.
UEN = (((15Ns − 15Nna) × TN)/15Nap) × 100,
The 15N residual rate is calculated as
where NR is the amount of residual fertilizer N in the soil, and Nap is the amount of applied N in the soil.
RNr = NR/Nap × 100
2.4. Statistical Analysis
Microsoft Excel 2017 was used for data processing, and Origin 2017 software (Origin Lab Corporation) was used to generate illustrations. Data were analyzed with SPSS statistical 19.0 software (IBM Corporation, Armonk, NY, USA), applying analysis of variance (ANOVA) and Tukey’s post hoc tests for multiple comparisons of the means.
3. Results
3.1. Distribution of 15N Abundance and 15N Residue in the Soil
The 15N was detected in the 0–100 cm soil layer after the grapes were collected. A large amount of 15N fertilizer remained in the soil profile, and the 15N fertilizer residue in each soil layer was consistent with the 15N abundance trend of the soil (Figure 4). The residual 15N fertilizer in the soil in each treatment mainly included surface residue (0–20 cm), accounting for 68–87% of the total residual N. The residual 15N fertilizer in the remaining layers gradually decreased with the increase in soil depth.
There was a significant difference in the residual amount of labeled N fertilizer in the different layers of the soil profile between the different treatments. There were significant differences in 15N fertilizer residues between the three fertilization treatments (W1N1, W1N2, W1N3) under relatively low irrigation. The residues were positively correlated with fertilizer application (p < 0.05). The more fertilizer was applied, the more fertilizer remained in the soil. When the same quantity of fertilizer was applied, there was a negative association between the residual fertilizer and irrigation quantity (p < 0.05). It can be clearly seen from Figure 4 that the residual 15N fertilizer in the treatments with less irrigation at different depths was significantly greater than that in the treatments with higher irrigation. The residual amount of labeled N fertilizer in the soil profile decreased rapidly with the increase in soil depth. The residual fertilizer N in the 0–20 cm soil layer accounted for 68.13–86.06% of the total residual N. Although the residual N in the 80–100 cm soil layer accounted for less than 10% of the total residual N, there was a small amount of labeled fertilizer N residue present in the 80–100 cm soil in all treatments. It can thus be inferred that a small amount of N fertilizer may move below the 100 cm soil layer.
The residual rate of fertilizer N indicates the ratio of the residual amount of labeled fertilizer N in the soil to the total amount of applied N. The residual rates in the 0–100 cm soil layer (20 cm/layer) after grape harvest are displayed in Table 3. The residual rate of the labeled fertilizer in the 0–20 cm soil layer was high. The residual rate of each treatment in the 0–20 cm soil layer ranged between 10.82% and 23.51%, and the total residual rate in the 0–100 cm soil layer ranged between 12.71% and 26.94%. Based on the total residual rate of 15N fertilizer in the soil between the different treatments in this experiment, the residual rate was closely related to the amount of irrigation and fertilization, and the residual rate was positively associated with the amount of fertilizer (p < 0.05) and negatively associated with the amount of irrigation (p < 0.05). The 15N residual rate differed significantly between that of the different treatments. The residual rate of the W1N2 treatment was the highest, whereas the W2N1 treatment was 2.1 times lower than the W1N2 treatment. The results shown in Table 3 indicated that even under high irrigation (W2), the amount of 15N remaining in the soil was small. In combination with irrigation, it can be found that during vine growth, the probability of large amounts of N-applied N fertilizer leaching is very low.
3.2. Distribution of Fertilizer N during the Vine Growth Period
Table 4 shows that with the same amount of irrigation, the biomass of the roots, stems, and leaves of fruit trees increased with the increase in N application, and the biomass of all organs increased with the increase in irrigation amount with the same amount of nitrogen application. Under the same irrigation amount, a higher N application rate (N3) resulted in excessive stem and leaf length and was not conducive to fruit biomass accumulation. The biomass of root, stem, and leaf tissues in W2N3 was significantly higher than that of other treatments, and W1N1 was most unfavorable to the accumulation of organ biomass in fruit trees and resulted in the lowest biomass accumulation. The biomass per plant of fruit trees in W2N3 was the highest (5.40 kg), and that of fruit tree trees in W1N1 was the lowest (4.35 kg), with a difference of 1.05 kg. When the irrigation amount was W1, the fruit yield of W1N2 was the highest (at 19,987 kg/ha), which was significantly higher than that of other treatments. When the irrigation amount was W2, the fruit yield of W2N2 was 20,253 kg/ha, but there was no significant difference between W2N1 and W2N2.
The 15N-N content in the leaves and stems of the vegetative growth organs gradually decreased with the progression of the growth period [24,26]. From anthesis to harvesting, the 15N-N content in the leaves decreased by 44.8–48.5%, which may have been caused by the decline of N in the leaves. As reported by Qin [32], the N content in vine leaves tends to decrease during the growth period, reaching the lowest value before the leaf fall stage. Another study [33] reported that the N content of vine leaves decreases from the vegetative growth stage to the reproductive growth stage. In the present study (Table 5), the 15N-N content in the stem tissues decreased by 30.1–60.7%, while the 15N-N content in the fruit and root system gradually accumulated. Furthermore, the 15N-N content in the fruit increased by 64.3–75%, and that in the root system increased by 74.4–83% at harvest, which confirmed that the growing leaf tissue effectively acted as a reservoir for N compounds imported from the roots, confirming the results of Titus [34]. When large amounts of N are applied during spring, some of the N is transferred to the leaves and branches to generate N turnover, following which it is transferred to the fruits [35,36,37].
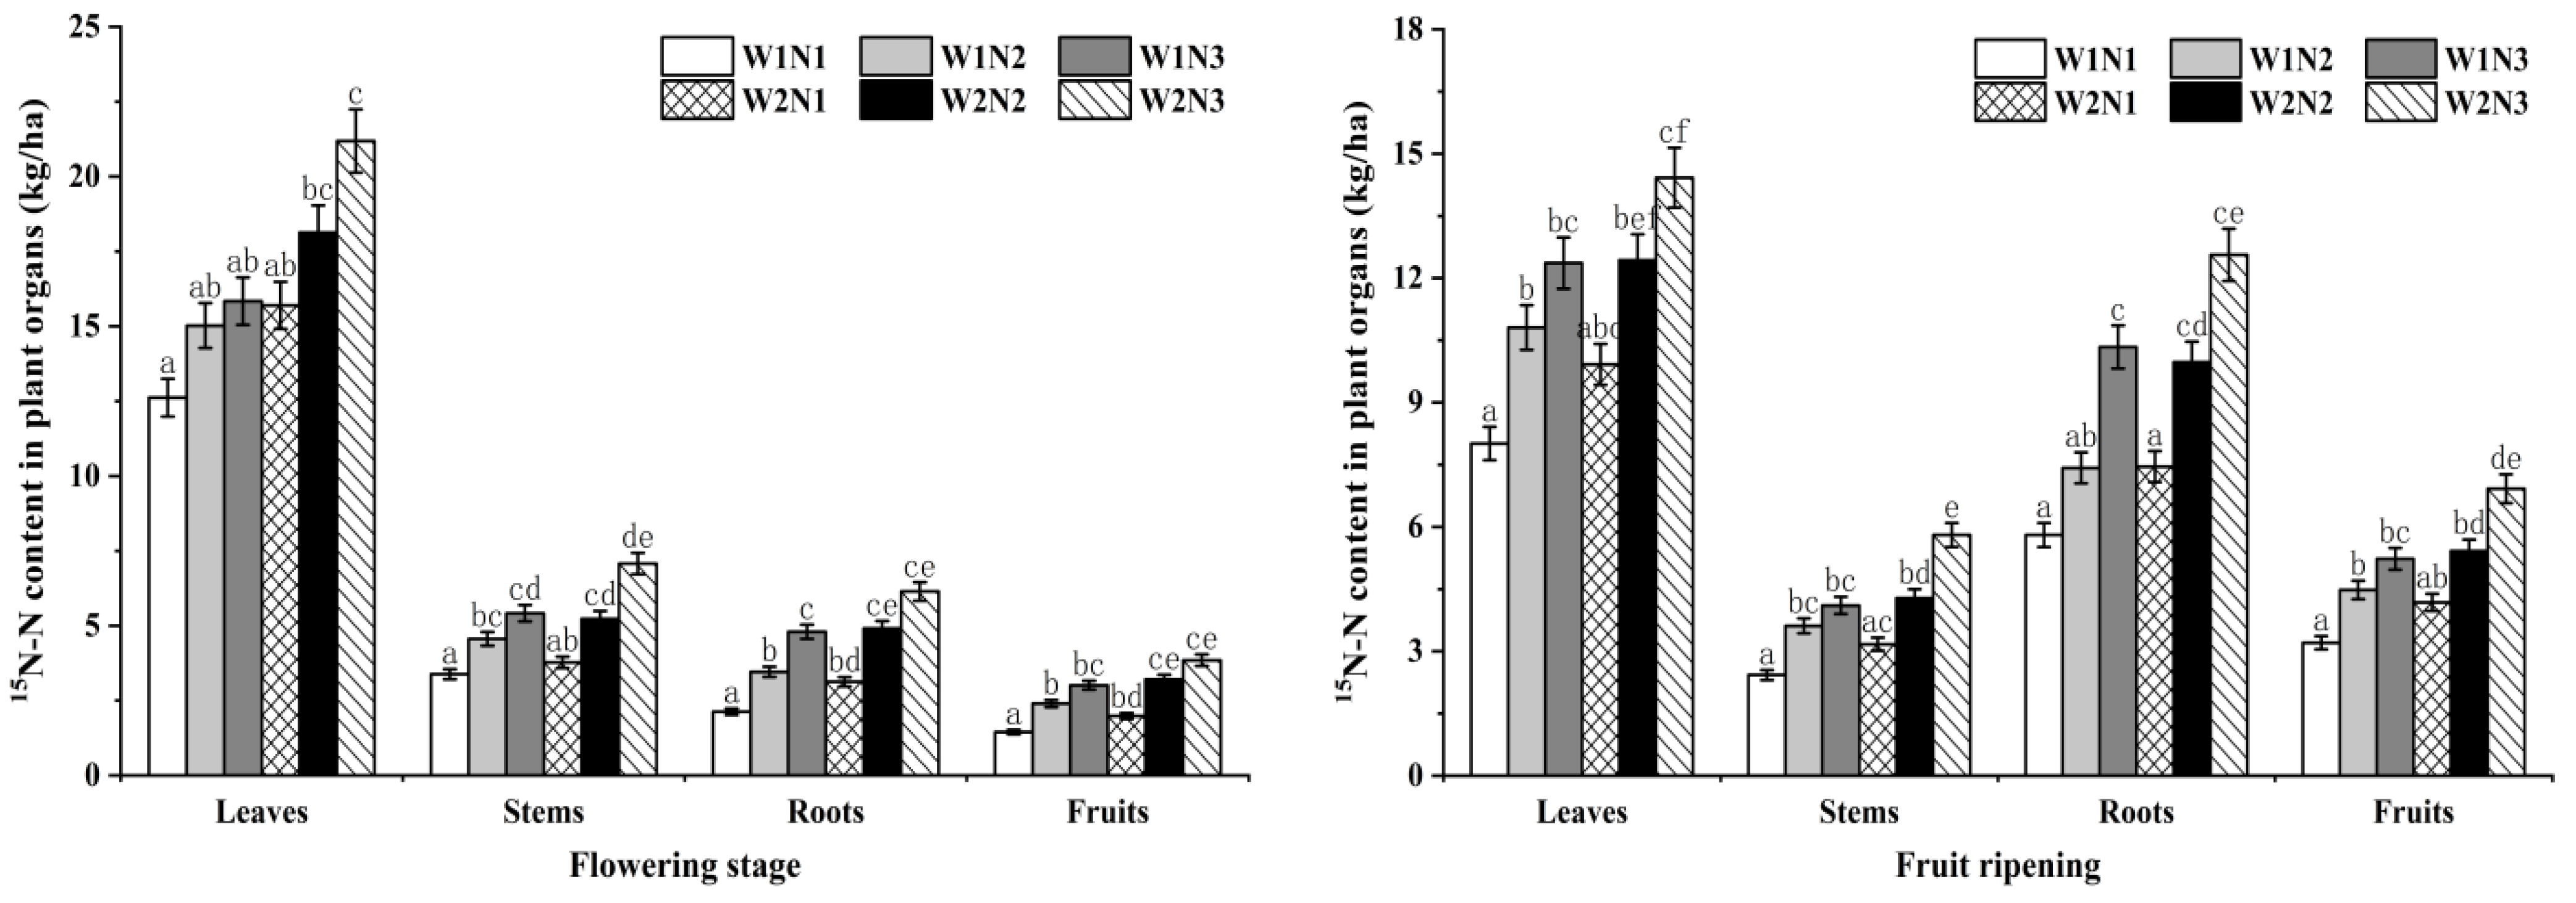
There were significant differences in 15N-N uptake among the different treatments. At anthesis, the N absorbed by the vines was preferentially distributed in the leaves, and thus, the 15N-N accumulation in the leaves was higher than that in the other organs, which corroborated previous results [38,39]. The cumulative content of fertilizer N in the leaves of the different treatments under the same irrigation quantity was directly proportional to the amount of fertilizer applied. There were obvious differences between W1N1 and the W2N2 and W2N3 treatments, as well as between the W2N1 and W2N3 treatments. This was mainly attributed to the different quantities of fertilizer applied, and to a lesser extent, the amount of irrigation. Increasing the irrigation appropriately will thus promote the absorption of fertilizer by vines.
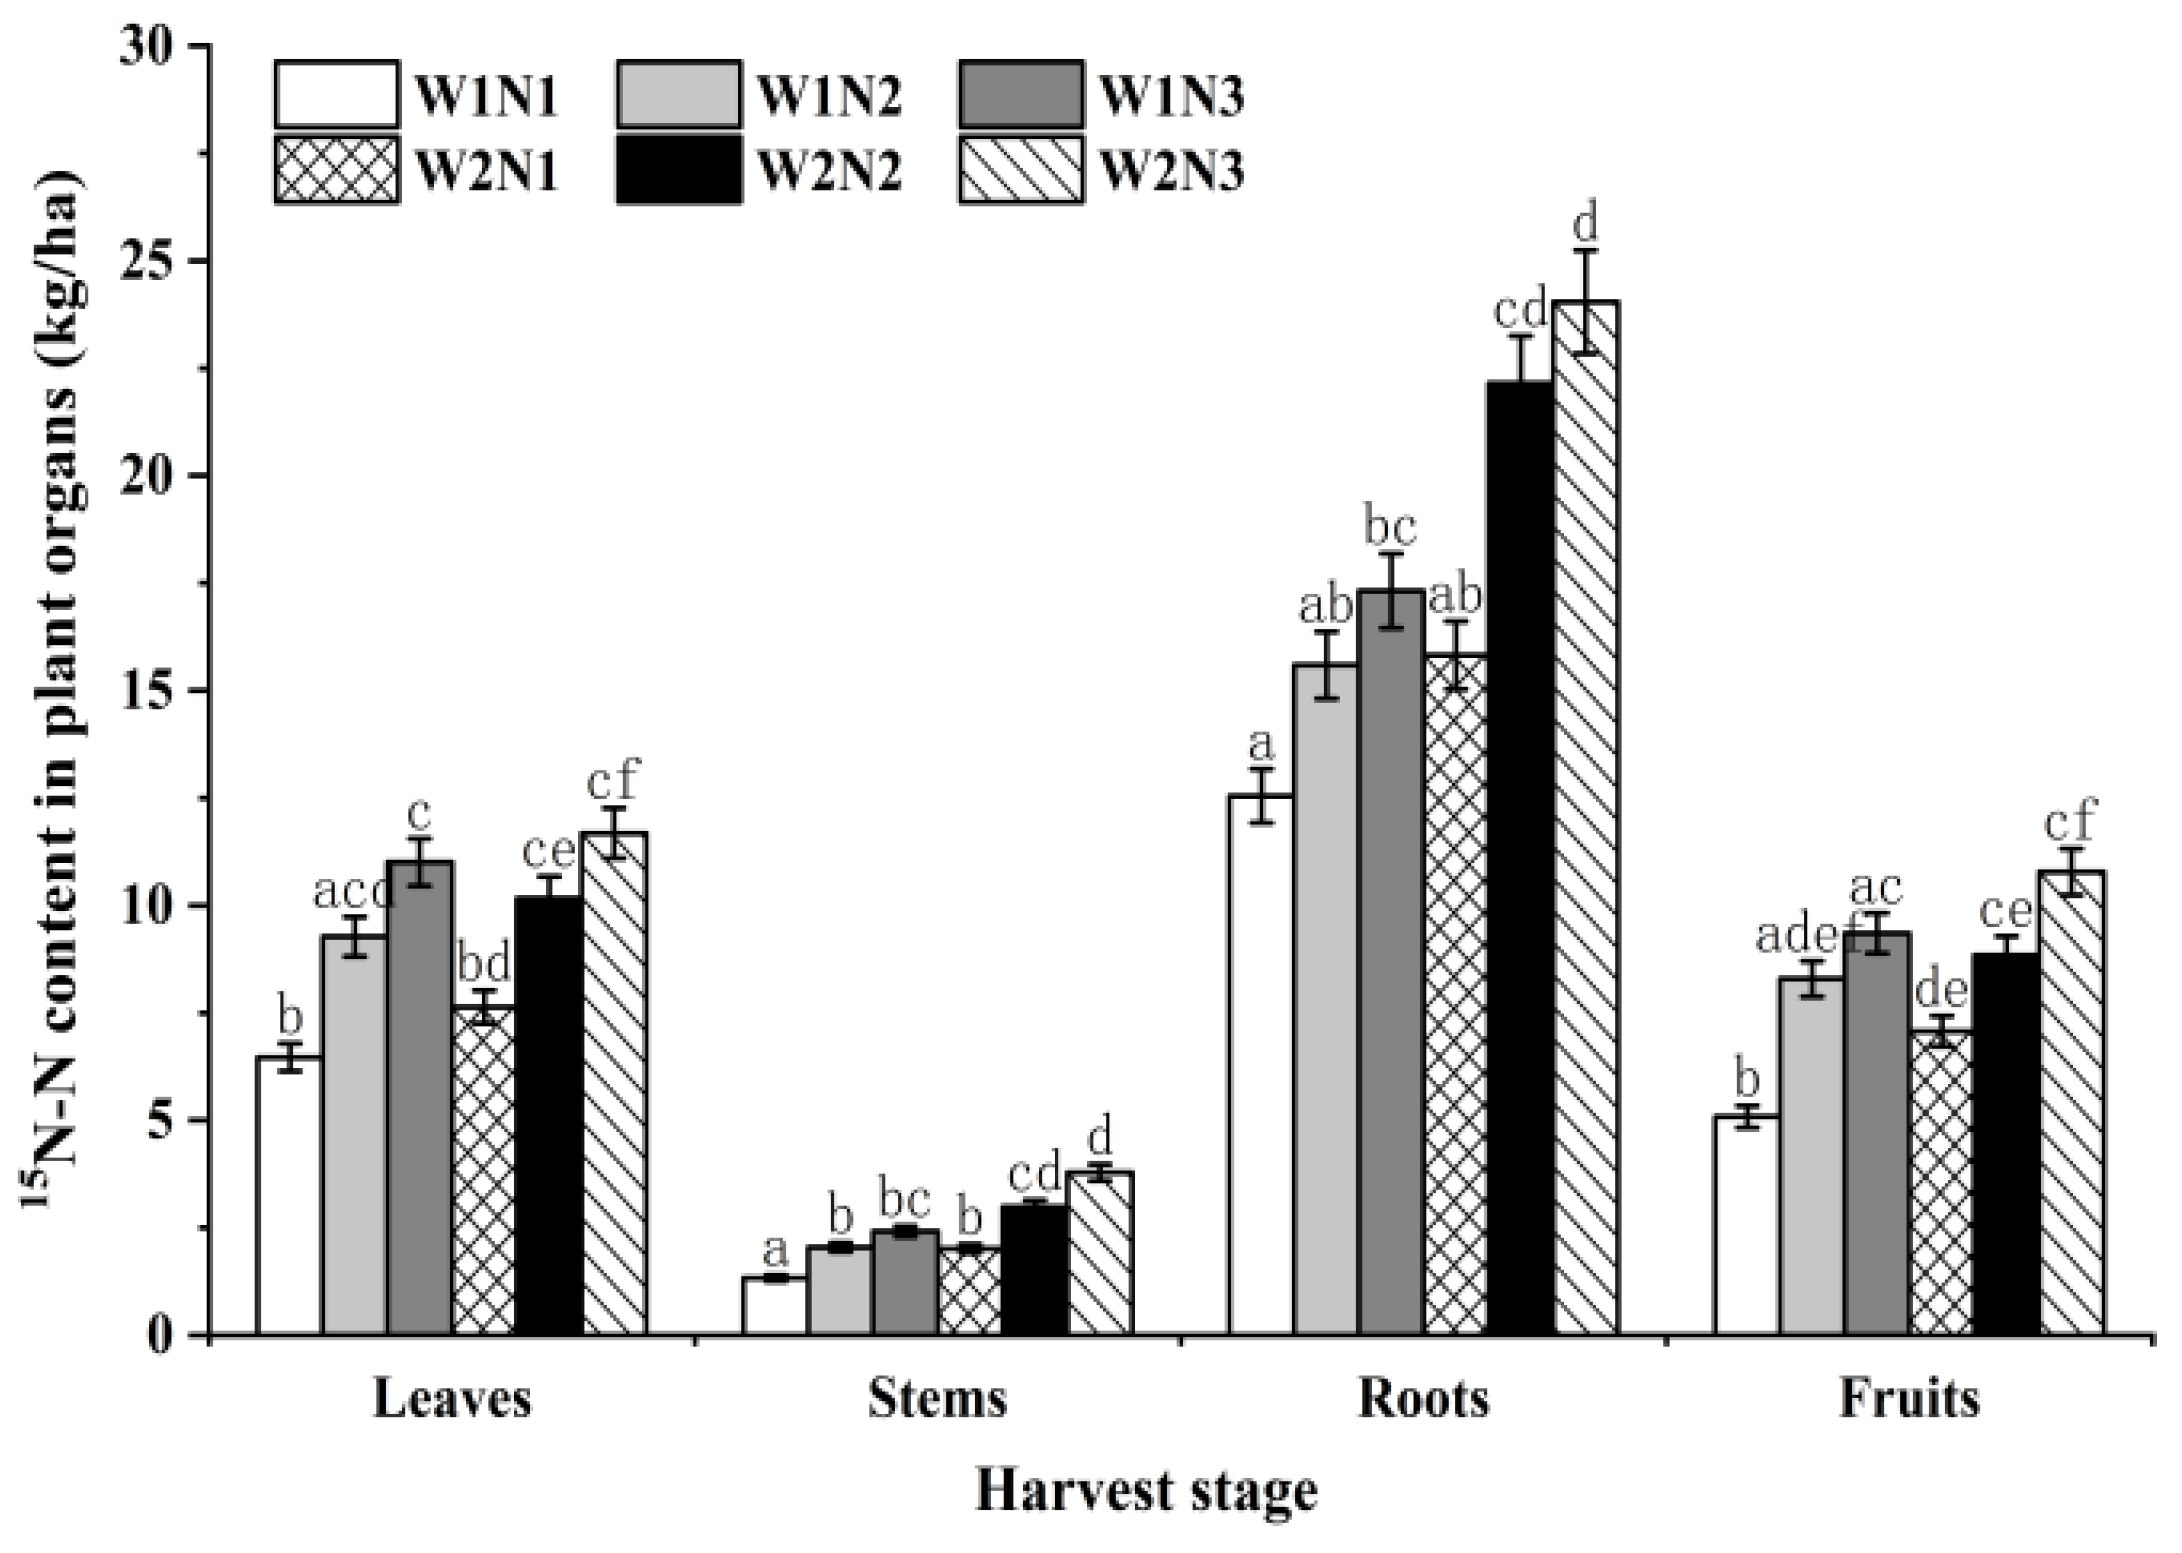
As indicated in Figure 5, the 15N-N content in all the organs (leaves, stems, roots, and fruits) at the anthesis, fruit ripening, and harvesting stages differed significantly between the W1N1 and W1N3, W2N1, and W2N3 treatments, indicating that the application of fertilizer N was the main factor accounting for the differences in 15N-N content in all organs. There was no significant difference in the 15N-N content of the leaves at the flowering stage and fruit ripening stages, or between the treatments with the same N application amount and different irrigation amounts at the harvesting stage, but there was a significant difference between the treatments with different N applications but the same irrigation quantity. The amount of 15N-N in the stem tissues in each treatment showed different trends in each growth period. Overall, the accumulation of 15N-N in the stem tissues was mainly affected by the N application quantity, and there was no obvious correlation in the accumulation of fertilizer N in the stem under different water and fertilizer treatments. There was a significant difference between the treatments with the lowest and highest N application. The amount of N absorbed by the roots at the flowering stage was lower than the N stored in the roots due to the growth of the vegetative organs, following which the N absorption gradually accumulated. The amount of N that accumulated in the roots peaked at the harvest stage, which supported previous findings [33,34,35,37]. A previous study has shown that from harvesting to defoliation, grapevine tree trunks and roots typically accumulate nutrients to support early spring growth [40].
Ndff represents the contribution rate of the 15N absorbed and distributed by different organs of the plant from fertilizer to the total N accumulated in the organs, reflecting the absorption competitiveness of the plant organs for 15N fertilizer [41]. It can be seen from Table 6 that the Ndff values of the different organs differed in the different periods. The fertilizer N absorption capacity of the leaves was stronger than that of the roots during the flowering period. In the flowering period, the Ndff values of the various organs were as follows: leaves > stems > roots > fruits. The fertilizer N absorption capacity of the roots and fruits was stronger in the fruit ripening and harvesting periods, while that of the leaves and stems was weaker. The Ndff values of the various organs in the maturity and harvest periods were as follows: roots > fruits > stems > leaves. The Ndff values of the various organs in the harvesting period were in the order of root > fruit > leaf > stem, which corroborated earlier results [14]. At the flowering stage, the plants exhibit relatively vigorous vegetative growth, and the N absorbed by the root system is mainly supplied to the vegetative organs of the aboveground parts; as a result, the 15N accumulation in the leaves and stems of the aboveground parts is greater. In contrast, at the fruit maturity and harvest stages, plant growth changes from vegetative growth to reproductive growth, and the 15N accumulation in the leaves and stems decreases as N distribution is prioritized to the fruits. Additionally, some N was lost due to the pruning of branches and leaves after flowering in this study; this was consistent with previously reported findings [42].
After grape harvesting, 11–14.3% of the N absorbed by the aboveground parts originated from fertilizer. As indicated in Table 6, there were differences in the 15N absorption competitiveness of the various organs of grapevines under different water and fertilizer treatments. The data demonstrated that the Ndff of the root system was significantly higher than that of the other organs, with the highest value reaching 7.4%, followed by Ndff values of the fruits and leaves and then the stems. The results showed that the distribution and storage of fertilizer N were mainly concentrated in the root system, followed by the fruit. The distribution ratio of 15N in the leaves and stems was low overall and did not differ significantly between organs. With leaf aging and senescence, nutrients are gradually stored in the roots and trunk, with water and fertilizer treatments having increasingly less influence on the leaves. Different ratios of fertilizer and water had obvious effects on the Ndff of each organ. Under the same level of irrigation, significant differences were observed between the lowest and highest fertilization treatments. The difference in Ndff in the root system was significant, as the root system directly absorbed nutrients, and thus, the amount of fertilizer N in the soil would directly influence the quantity of nutrients absorbed by the root system. The trend of Ndff observed in the fertilizer and water treatment of the leaves and stems was similar, with the treatment with the highest fertilizer having a significantly higher Ndff than the treatment with the lowest amount of fertilizer.
3.3. The 15N Utilization Rate in the Vine Growth Period
The fertilizer utilization ratio calculated by the 15N tracer method directly reflects the efficiency of N utilization in crops. W2N1 had the highest 15N utilization rate and W1N3 had the lowest 15N utilization rate, with a difference of 35.2% (Table 7). The 15N utilization rate of the different treatments decreased with an increase in fertilizer dosage, thus exhibiting an inverse relationship. During the period of vigorous growth in vines under sufficient soil moisture, the greater the N supply, the higher the N content of the leaves (Figure 5). A greater loss of ammonium N volatilization on the leaf surface results in a concurrent increase in the concentration of ammonium N and nitrate N in the soil, which is more conducive to the volatilization of NH3. Furthermore, denitrification in the deep soil layer produces N2 and N2O, which leads to a loss of N and a decrease in the N utilization rate. There was no significant difference in the 15N utilization rate among the different treatments under the same irrigation and different fertilization amounts (p < 0.05), but there was a significant difference between the W1N3, W2N1, and W2N2 treatments (p < 0.05). The absorption and utilization of water and nutrients by crops are closely related [43,44], and N fertilizer can effectively improve the utilization efficiency of water and fertilizer resources [45]. The 15N utilization rate is related to the water and N level in the soil and is dependent not only on fertilization but also on the water and N coupling effect on the 15N utilization rate.
4. Discussion
There was no significant difference in the amount of N absorbed by the vines between the different water and fertilizer treatments. Under different fertilizer and soil fertility conditions, the N absorbed by the vines at the test site was mainly soil N, and the proportion of N absorbed by the vines in the different treatments was only 12–17%. This is consistent with previous studies [34]. The results of the present study revealed that the 15N fertilizer residues in the soil under different water and fertilizer treatments were mainly surface residues (0–20 cm), which was largely related to the irrigation and fertilization regime. In this experiment, hole fertilization was applied, with fertilizer applied to the 20–40 cm soil layer and the drip irrigation penetrating to the 0–40 cm soil layer. Using this irrigation and fertilization combination, only part of the N will be absorbed and utilized by the plant root system; some will be rapidly assimilated and will remain in the soil, and some will be lost through the leaching of nitrate N and denitrification as gaseous N. Thus, only a small amount of fertilizer will permeate below the root zone. This irrigation and fertilization technique saves water and fertilizer resources, reduces the loss of N, and decreases groundwater pollution [2,3,4].
Yield is an important indicator of the economic benefits of vineyards. Du et al. [46] found that, compared with the ground irrigation amount, high irrigation amounts could significantly improve apple yield. Increasing the water and N inputs can significantly improve the biomass of vines, but for fruit growth, when the irrigation amount is constant, excessive N input will reduce the accumulation of fruit biomass and yield. High N application will lead to long stems and leaves, and is not conducive to improving grapevine yields. Therefore, applying a reasonable ratio of water and N can not only improve yield and quality, but can also avoid excessive residual N fertilizer.
The results showed that N application significantly affected the 15N content in each organ and also promoted the enrichment of 15N in each organ. Under the same irrigation conditions, the 15N in each organ differed significantly between the highest and lowest N fertilizer treatments. When the fertilizer increased by 40%, the 15N in each organ increased about 1.65 times. This was consistent with a previous study in V. vinifera [16]. In the flowering stage, the content of fertilizer N in the leaves and stems was higher than that in the roots. In the maturity and harvest stages, the content of fertilizer N in the leaves and stems decreased, while the content of fertilizer N in the roots and fruits increased. This is mainly because the distribution of N nutrition in the trees is transferred with the shift toward reproductive growth. In the early growth stage, in order to support the rapid growth of the roots and other reservoirs, the N in the plant is redistributed to the aboveground vegetative organs, following which reproductive growth occurs, followed by vegetative growth after harvest. The N is gradually accumulated in the fruit, and the harvest period is the N storage period. At this time, the N is recycled and distributed in the roots, which prepares the tree for growth in early spring the following year. This is in line with the results of earlier studies [11,36,37,38]. N application in spring plays an important role in providing an N reserve for the next season; however, the relative importance of this contribution is influenced by the soil conditions, and thus, this aspect should be studied in greater detail.
Different ratios of fertilizer and water had obvious effects on the Ndff of each organ. Under the same irrigation application, the highest and lowest fertilizer treatments had significantly different effects, but when the amount of irrigation increased, there was no significant difference in Ndff between the organs. This suggested that increased water application did not significantly improve the Ndff of each organ, and the absorption and regulation of N in each organ largely depended on the fertilizer content in the soil. The amount of N absorbed by the roots increased correspondingly with fertilizer supply. Additionally, the Ndff of the roots was significantly higher than that of the other organs in the harvest period, which was consistent with previous research results [18,38]. The roots are a stronger N reservoir than other organs during the harvest period.
The 15N utilization rate of the different fertilizer and water treatments decreased with increased fertilizer dosage. Under the same fertilizer dosage, the 15N utilization rate of the increased irrigation treatment was higher than that of the lower irrigation treatment. The 15N utilization rate was evidently related to the water and N level in the soil, as the N supply of the plants mainly originated from the soil and fertilizer. The main soil environmental factor affecting the nutrient flow to the root surface is the soil water potential. A lack of water makes the soil water potential drop, which results in the soil pores filling with air, following which the N moves slowly to the root surface. In grapevine, water stress inhibits the growth of the root system, reduces the absorption area and capacity of the root system, increases the viscosity of xylem fluid flow, and reduces the absorption and transportation of N. The results showed that the N utilization rate was inversely proportional to the amount of fertilizer applied within a certain range of soil water supply conditions.
5. Conclusions
The residual amount of 15N fertilizer at different depths was significantly different and was negatively correlated with the amount of fertilizer applied (p < 0.05). Under the same fertilizer application, there was a positive correlation between the amount of residual fertilizer and the amount of irrigation (p < 0.05).
Under the same fertilization application, the amount of N absorbed by the plants was directly proportional to the amount of irrigation, but an increase in irrigation had no significant effect on the amount of N absorbed, and there was no significant difference in the amount of N absorbed by the plants between different water and fertilizer treatments.
The 15N utilization rate of the different fertilizer and water treatments decreased with the increase in fertilizer application. Under the same fertilizer application, the 15N utilization rate of the increased irrigation treatment was higher than that of the lower irrigation treatment. There was a difference in the 15N absorption and competition ability of the different water and fertilizer treatments in each organ, and the Ndff of the root system was significantly higher than that of the other organs, followed by the fruit and leaf Ndff values, and finally, the stem.
The results of the field trial showed that the appropriate ratio of irrigation and N fertilizer application was 1.0 ETC water and 254 kg N/ha, which was beneficial to improving the economic benefits of vineyards. These findings provide a basis for further research on the optimal ratio of irrigation and N fertilization in vineyards in arid areas.
Author Contributions
Conceptualization, methodology, H.L.; Validation, data curation, writing—original draft preparation, P.G.; writing—review and editing, P.G. and Y.Z. All authors have read and agreed to the published version of the manuscript.
Funding
This research was funded by the National Natural Science Foundation Project (Grant No. 51769030), and the Financial Science and Technology Plan Project of the Xinjiang Production and Construction Corps (Grant No. 2021DB012).
Institutional Review Board Statement
Not applicable.
Informed Consent Statement
Not applicable.
Data Availability Statement
Not applicable.
Conflicts of Interest
The authors declare no conflict of interest.
References
- Wang, Y.Y.; Miao, J.Y. Analysis on fertilization application level in world and China. Phosphate Compd. Fertil. 2016, 31, 22–24. [Google Scholar] [CrossRef]
- Ju, X.T.; Gu, B.J. Current situation, problems and trends of nitrogen fertilizer application in China’s farmland. J. Plant Nutr. Fertil. 2014, 20, 783–795. [Google Scholar] [CrossRef]
- Ma, Z.C.; Wang, J.Y.; Pang, X.Y.; Li, R.; Xie, F.; Sun, H.; Ji, Y.Z. Analysis on the current situation of grape fertilization and the potential of energy conservation and emission reduction in Hebei Province. Jiangsu Agric. Sci. 2018, 46, 135–139. [Google Scholar] [CrossRef]
- Ma, W.J.; Tong, Y.A.; Wang, Z.Z. Assessment of grape fertilization in Shaanxi Province. Anhui Agric. Sci. 2014, 42, 716–719. [Google Scholar] [CrossRef]
- Liu, A.H.; Yue, C.Y.; Kong, T.T.; Jiao, S.P.; Zhang, J.W.; Zhang, X.P.; Yang, J. Analysis of soil nutrient status of Munage grape in Atush City, Xinjiang. China Agron. Bull. 2015, 31, 199–202. [Google Scholar]
- Yi, Z.X.; Wang, P.; Tao, H.B.; Lu, L.Q.; Yu, G.J. The effect of nitrogen base/topdressing ratio on the growth, development, water and nitrogen utilization of Summer Maize in North China Plain II. Nitrogen accumulation, transport and soil inorganic nitrogen dynamics of summer maize. Chin. J. Ecol. Agric. 2008, 16, 86–90. [Google Scholar]
- Hayashi, K.; Yan, X.Y. Airborne nitrogen load in Japanese and Chinese agroecosystems. Soil Sci. Plant Nutr. 2010, 56, 2–18. [Google Scholar] [CrossRef] [Green Version]
- Pérez-Álvarez, E.P.; Garde-Cerdán, T.; García-Escudero, E.; Martínez-Vidaurre, J.M. Effect of two doses of urea foliar application on leaves and grape nitrogen composition during two vintages. J. Sci. Food Agric. 2017, 97, 2524–2532. [Google Scholar] [CrossRef]
- Metay, A.; Magnier, J.; Guilpart, N.; Christophe, A. Nitrogen supply controls vegetative growth, biomass and nitrogen allocation for grapevine (cv. Shiraz) grown in pots. Funct. Plant Biol. 2015, 42, 105–114. [Google Scholar] [CrossRef]
- Conradie, W.J. Utilization of nitrogen by the grapevine as affected by time of application and soil type. S. Afr. J. Enol. Vitic. 1986, 7, 76–83. [Google Scholar]
- Ma, W.J.; Tong, Y.A.; Gao, Y.M. Law of annual cycle change of nitrogen absorption, utilization and accumulation in grape. J. Plant Nutr. Fertil. 2010, 16, 504–509. [Google Scholar]
- Brunetto, G.; Ceretta, C.A.; de Melo, G.W.B.; Girotto, E.; Ferreira, P.A.A.; Lourenzi, C.R.; Lazzaretti, B.P. Contribution of nitrogen from urea applied at different rates and times on grapevine nutrition. Sci. Hortic. 2016, 207, 1–6. [Google Scholar] [CrossRef] [Green Version]
- Holzapfel, B.P.; Watt, J.; Smith, J.P.; Suklje, K.; Rogiers, S.Y. Effects of timing of N application and water constraints on N accumulation and juice amino N concentration in ‘Chardonnay’ grapevines. Vitis 2015, 54, 203–211. [Google Scholar] [CrossRef]
- Sun, C.W.; Chen, Z.; Zhao, Y.Z.; Niu, S.; Yang, L.L. Uptake, distribution and utilization of ~(15) N-urea by grape seedlings under different fertilization methods. J. N. China Agric. 2017, 32, 260–264. [Google Scholar]
- Conradie, W.J. Distribution and Translocation of Nitrogen Absorbed during Late Spring by Two-Year-Old Grapevines Grown in Sand Culture. Am. J. Enol. Vitic. 1990, 3, 241–250. [Google Scholar]
- Hanson, E.J.; Howell, G.S. Nitrogen Accumulation and Fertilizer Use Efficiency by Grapevines in Short-season Growing Areas. Hortscience 1995, 30, 504–507. [Google Scholar] [CrossRef] [Green Version]
- Iandolino, A.B.; Williams, E.L. Recovery of 15N Labeled Fertilizer by Vitis vinifera L. cv. Cabernet Sauvignon: Effects of N Fertilizer Rates and Applied Water Amounts. Am. J. Enol. Vitic. 2014, 65, 189–196. [Google Scholar] [CrossRef]
- Peacock, W.L.; Christensen, L.P.; Broadbent, F.E. Uptake, Storage, and Utilization of Soil-applied Nitrogen by Thompson Seedless as Affected by Time of Application. Am. J. Enol. Vitic. 1989, 1, 16–20. [Google Scholar]
- Guan, C.; Zeng, Y.; Meng, Z. Absorption, transportation, storage and redistribution of 15N urea applied to Jufeng grape leaves in late autumn. Acta Hortic. Sin. 1993, 03, 237–242. [Google Scholar]
- Fang, Y.L.; Chen, H.M.; Liu, S.R.; Jia, Z.F.; He, C.Y.; Wang, Q. Application of ~(15) n to study the utilization, distribution and balance of fertilizer nitrogen in sweet peak grape. Grape Cultiv. Wine Mak. 1994, 04, 17–19. [Google Scholar]
- Zhou, X.B.; Guo, X.W.; Wang, C.C.C.; Liu, S.C.; Li, K.; Guo, Y.S.; Li, C.X. The effect of water and fertilizer ratio on the growth and development of grape and the absorption, distribution and utilization of 15N ammonium sulfate. Agric. Res. Arid Areas 2015, 33, 183–190. [Google Scholar] [CrossRef]
- Ro, H.M.; Park, J.M. Nitrogen requirements and vegetative growth of pot-lysimeter-grown ‘Fuji’ apple trees fertilized by drip irrigation with three nitrogen rates. J. Hortic. Sci. Biotechnol. 2000, 75, 237–242. [Google Scholar] [CrossRef]
- Weinbaum, S.A.; Johnson, R.S.; DeJong, T.M. Causes and consequences of over fertilization in orchards. Hort Technol. 1992, 2, 112–121. [Google Scholar] [CrossRef]
- Chapin, F.S. Effects of multiple environmental stresses on nutrient availability and use. In Responses of Plants to Multiple Stresses; H.A. Academic Press: San Diego, CA, USA, 1991; pp. 67–88. [Google Scholar]
- Li, H.Y. Soil Water Status Respects the Growth and Development of Grapevine; Shanghai Jiao Tong University: Shanghai, China, 2009. [Google Scholar]
- Fife, D.N.; Nambiar, E.K.S. Effect of nitrogen on growth and water relations of radiata pine families. Plant Soil 1995, 168–169, 279–285. [Google Scholar] [CrossRef]
- Radin, J.W.; Mauney, J.R.; Kerridge, P.C. Effects of nitrogen fertility on water potential of irrigated cotton. Agron. J. 1991, 83, 739–743. [Google Scholar] [CrossRef] [Green Version]
- Liu, Z.X. Effects of Optimized Fertilization in Root Zone on Apple Growth and Nitrogen Absorption and Utilization; Shanghai Jiao Tong University: Shanghai, China, 2021. [Google Scholar] [CrossRef]
- Ding, N. Studies on Leaf Senescence and 15N-Urea Absorption and Utilization of Apple in Response to Topdressing Nitrogen Application; Shandong Agricultural University: Tai’an, China, 2012. [Google Scholar] [CrossRef]
- Chen, L.N.; Han, X.R.; Sun, Z.X.; Liu, X.C. Coupling Effects of Alternate Partial Root-Zone Irrigation and Nitrogen Rate on Growth and 15N-Urea Use of Grapes. J. Nuclear Agric. Sci. 2021, 35, 447–453. [Google Scholar]
- Zeng, Q.T. The influence factors and elimination methods of the determination of nitrogen in Geochemical Samples by semi micro Kjeldahl method. Guangdong Chem. Ind. 2018, 45, 445–459. [Google Scholar]
- Qin, S.J.; Wang, M.; Guo, T.J.; He, H.X.; Wang, X.R. Study on dynamic changes of mineral nutrition in petiole of shuangyoushan grape. J. Jilin Agric. Univ. 2001, 23, 47–50. [Google Scholar] [CrossRef]
- Sun, Q.; Wang, J.F.; Wang, S.F.; Yang, Q.; Wang, Z.P. Effect of different fertilization depth on nutrient, yield and quality of grape leaves. J. Fruit Trees 2007, 24, 455–459. [Google Scholar]
- Titus, J.S.; Kang, S.M. Nitrogen metabolism, translocation and recycling in apple trees. Hortic. Rev. 1982, 4, 204–246. [Google Scholar]
- Zheng, Z.-X.; Wang, Y.; Gong, Q.-L.; Zheng, W.; Zhao, Z.-Y.; Zhai, B.-N.; Han, M.-Y. Absorption, distribution and utilization of soil applied 15N-urea in young dwarf rootstock ‘Fuji’ apple trees. J. Plant Nutr. Fertil. 2018, 24, 237–244. [Google Scholar] [CrossRef]
- Zhang, M.W.; Wang, M.Y.; Ma, Q.; Ding, J.F.; Zhu, M.; Li, C.Y.; Zhu, X.K.; Feng, C.N.; Guo, W.S. Effects of density on characteristics of 15N accumulation, distribution and utilization of late-sowing wheat in rice-wheat rotation. J. Yangzhou Univ. (Agric. Life Sci. Ed.) 2021, 42, 92–97. [Google Scholar] [CrossRef]
- Sun, M.-D.; Wu, Y.; Liang, Z.-X.; Tian, H.-Q.; Zhao, Y.-Y.; Du, R.-R.; Liu, J.; Liu, S.-Z. Nitrogen uptake, distribution, and utilization in young bearing Huangguan pear trees under 15N-urea application in spring. Chin. J. Appl. Ecol. 2020, 31, 1875–1881. [Google Scholar] [CrossRef]
- Legaz, F.; Primo-Millo, E.; Primo-Yúfera, E.; Gil, C. Dynamics of 15N-labeled nitrogen nutrients in Valencia orange trees. Proc. Int. Soc. Citric. 1981, 2, 575–582. [Google Scholar]
- Weinbaum, S.A.; Klein, I.; Broadbent, F.E.; Micke, W.C.; Muraoka, T.T. Effects of time of nitrogen application and soil texture on the availability of isotopically labeled fertilizer nitrogen to reproductive and vegetative tissue of mature almond trees. J. Am. Soc. Hortic. Sci. 1984, 109, 339–343. [Google Scholar]
- Conradie, W.J. Translocation and storage of nitrogen by grapevines as affected by time of application. In Proceedings of the International Symposium on Nitrogen in Grapes and Wine, Seattle, Washington, DC, USA, 18–19 June 1991; pp. 32–42. [Google Scholar]
- Gu, M.R. Application of 15N in Apple nitrogen nutrition research. Chin. Fruit Tree 1990, 2, 46–48. [Google Scholar]
- Men, Y.G. Study on the Relationship between 15N Absorption and 13C Distribution of Apple and Its Influencing Factors; Shandong Agricultural University: Tai’an, China, 2014. [Google Scholar] [CrossRef]
- Amon, I. Physiological principles of dry and crop production. In Grpta US Physiological Aspects of Dry Land Farming; Oxford & IBH Publishing Co.: New Dehli, India, 1975; pp. 133–145. [Google Scholar]
- Viets, F.G. Water deficits and Nutrient Availability. In Water deficits and Plant Growth; Kozlowski, T.T., Ed.; Academic Press: New York, NY, USA, 1972; Volume III, pp. 217–236. [Google Scholar]
- Lathwal, O.P.; Rathore, D.N. Effect of nitrogen and irrigation levels on NUE in wheat. Haryana Agric. Univ. J. Res. 1992, 22, 113–124. [Google Scholar]
- Du, S.; Kang, S.; Li, F.; Du, T. Water use efficiency is improved by alternate partial root-zone irrigation of apple in arid northwest China. Agric. Water Manag. 2017, 179, 184–192. [Google Scholar] [CrossRef]
Figure 1.
Vine planting scheme.

Figure 2.
Meteorological data of the experimental site in company 10, 29th regiment, Korla, Xinjiang, 2018.
Figure 2.
Meteorological data of the experimental site in company 10, 29th regiment, Korla, Xinjiang, 2018.

Figure 3.
Diagram of experimental treatment.

Figure 4.
Distribution of 15Nna (left) and 15N residues (right) in the soil. Note: different letters indicate significant differences between different treatments (at p < 0.05 (Tukey’s post hoc test). W1N1:0.75 ETc, 191.4 kg/ha, W1N2:0.75 ETc, 254.4 kg/ha, W1N3:0.75 ETc, 317.4 kg/ha; W2N1:1.0 ETc, 191.4 kg/ha, W2N2:1.0 ETc, 254.4 kg/ha, W1N1:1.0 ETc, 317.4 kg/ha. All abbreviations in this document have the same meaning as those in this picture.

Figure 5.
Distribution of 15N-N in the different organs of vines at the flowering (top left), fruit ripening (top right), and harvesting stages (bottom). Note: different letters indicate significant differences between different treatments (at p < 0.05 (Tukey’s post hoc test).
Figure 5.
Distribution of 15N-N in the different organs of vines at the flowering (top left), fruit ripening (top right), and harvesting stages (bottom). Note: different letters indicate significant differences between different treatments (at p < 0.05 (Tukey’s post hoc test).


Table 1.
Main physical properties of the soil.
| Soil Layer (cm) | Soil Texture | Particle Mass Fraction (%) | Weight Capacity (g/cm3) | Field Water-Holding Rate (%) | Saturated Moisture Content (%) | ||
|---|---|---|---|---|---|---|---|
| Sand Grains | Powder Particles | Viscous Particles | |||||
| 0–20 | Sandy loam | 65.79 | 32.75 | 4.6 | 1.39 | 28.06 | 43.81 |
| 20–40 | Sandy loam | 72.74 | 26.76 | 4.32 | 1.45 | 27.75 | 46.55 |
| 40–60 | Sandy loam | 74.13 | 18.96 | 3.23 | 1.58 | 29.02 | 48.29 |
| 60–80 | Sandy loam | 83.59 | 11.94 | 2.43 | 1.59 | 28.13 | 48.25 |
Table 2.
Soil fertility status.
| pH | Cation Exchange Capacity (cmol/kg) | Salt Content (g/kg) | Organic Matter Content (%) | Total N (%) | Available P2O5 (mg/kg) | Available K2O (mg/kg) |
|---|---|---|---|---|---|---|
| 7.3 | 8.6 | 9.8 | 0.8 | 0.04 | 9.2 | 244 |
Table 3.
Residual rate of 15N fertilizer in each layer of the soil following harvesting.
| Soil Layer (cm) | Residual Rate (%) | |||||
|---|---|---|---|---|---|---|
| W1N1 | W1N2 | W1N3 | W2N1 | W2N2 | W2N3 | |
| 0 | 13.921 | 15.301 | 13.693 | 6.750 | 12.087 | 9.533 |
| 20 | 2.586 | 5.660 | 9.814 | 4.070 | 3.398 | 7.949 |
| 40 | 1.243 | 1.981 | 3.269 | 1.293 | 2.736 | 2.437 |
| 60 | 1.006 | 2.149 | 3.442 | 0.522 | 1.797 | 1.942 |
| 80 | 0.361 | 1.403 | 2.303 | 0.073 | 0.814 | 2.040 |
| 100 | 0.064 | 0.448 | 1.127 | 0.005 | 0.228 | 1.758 |
| 0–100 | 19.181 | 26.943 | 33.648 | 12.714 | 21.060 | 25.658 |
Notes: W1N1:0.75 ETc, 191.4 kg/ha, W1N2:0.75 ETc, 254.4 kg/ha, W1N3:0.75 ETc, 317.4 kg/ha. W2N1:1.0 ETc, 191.4 kg/ha, W2N2:1.0 ETc, 254.4 kg/ha, W1N1:1.0 ETc, 317.4 kg/ha.
Table 4.
Biomass of different vine organs.
| Treatment | Biomass | |||||
|---|---|---|---|---|---|---|
| Root (kg/vine) | Stem (kg/vine) | Blade (kg/vine) | Fruit (kg/vine) | Single Plant (kg) | Yield (kg·ha) | |
| W1N1 | 0.56 f | 1.21 f | 0.77 f | 1.80 e | 4.35 f | 17694 e |
| W1N2 | 0.62 e | 1.33 c | 0.85 d | 2.03 c | 4.83 e | 19987 c |
| W1N3 | 0.65 d | 1.40 b | 0.93 d | 1.96 d | 4.94 d | 19289 d |
| W2N1 | 0.78 c | 1.24 e | 0.94 c | 2.06 s | 5.02 c | 20214 s |
| W2N2 | 0.82 b | 1.30 d | 0.99 b | 2.06 s | 5.17 b | 20253 s |
| W2N3 | 0.86 a | 1.46 a | 1.04 s | 2.04 b | 5.40 s | 20079 b |
Notes: Different lowercase letters in the same column indicate significant differences at the 5% level. W1N1:0.75 ETc, 191.4 kg/ha, W1N2:0.75 ETc, 254.4 kg/ha, W1N3:0.75 ETc, 317.4 kg/ha; W2N1:1.0 ETc, 191.4 kg/ha, W2N2:1.0 ETc, 254.4 kg/ha, W1N1:1.0 ETc, 317.4 kg/ha.
Table 5.
The 15N-N content in vine organs under different treatment conditions at harvest (kg/ha).
| Organ | W1N1 | W1N2 | W1N3 | W2N1 | W2N2 | W2N3 |
|---|---|---|---|---|---|---|
| blade | 6.464 | 9.272 | 11.007 | 7.636 | 10.164 | 11.681 |
| stem | 1.329 | 2.048 | 2.416 | 2.015 | 2.992 | 3.788 |
| fruit | 5.084 | 8.294 | 9.352 | 7.072 | 8.842 | 10.782 |
| root | 12.548 | 15.590 | 17.322 | 15.822 | 22.145 | 24.039 |
Table 6.
Percentage of nitrogen in the grapevines originating from fertilizer nitrogen at different growth stages (Ndff%).
Table 6.
Percentage of nitrogen in the grapevines originating from fertilizer nitrogen at different growth stages (Ndff%).
| Growth Stage | Organ | Treatment | |||||
|---|---|---|---|---|---|---|---|
| W1N1 | W1N2 | W1N3 | W2N1 | W2N2 | W2N3 | ||
| Anthesis Ndff (%) Early June | Blade | 3.024 a | 3.545 ab | 3.587 ab | 3.253 ab | 3.691 ab | 3.796 b |
| Stem | 2.419 a | 3.003 ab | 3.358 b | 2.607 ac | 3.170 ab | 3.545 b | |
| Fruit | 1.168 a | 1.773 b | 2.127 bc | 1.356 a | 1.898 bc | 2.252 c | |
| Root | 1.293 a | 1.981 b | 2.398 bc | 1.502 a | 2.127 b | 2.649 c | |
| Aboveground | 6.611 a | 8.321 bc | 9.072 bc | 7.216 acd | 8.759 bd | 9.593 b | |
| Fruit development stage Ndff (%) Late June | Blade | 1.898 a | 2.523 bc | 2.878 c | 2.148 ab | 2.690 bc | 3.024 c |
| Stem | 2.127 a | 2.753 bc | 3.003 c | 2.377 ab | 2.920 bc | 3.149 c | |
| Fruit | 2.294 a | 2.878 bc | 3.233 c | 2.482 ab | 3.045 bc | 3.399 c | |
| Root | 3.128 ac | 3.858 abc | 4.254 b | 3.358 c | 4.004 bc | 4.380 b | |
| Aboveground | 7.550 a | 9.489 bc | 10.490 c | 8.217 ab | 9.969 bc | 10.928 c | |
| Harvest Ndff (%) Late August | Blade | 1.585 a | 2.190 bc | 2.544 b | 1.814 ac | 2.357 b | 2.690 b |
| Stem | 1.481 a | 2.086 bc | 2.440 b | 1.710 ac | 2.252 b | 2.586 b | |
| Fruit | 3.233 a | 3.837 abc | 4.192 bc | 3.462 abc | 4.004 abc | 4.338 c | |
| Root | 6.298 a | 6.903 b | 7.258 c | 6.528 d | 7.070 e | 7.424 f | |
| Aboveground | 11.011 a | 12.826 abc | 13.889 bc | 11.700 abc | 13.326 abc | 14.348 c | |
Notes: Ndff means “Percent of Nitrogen Derived from Fertilizer”; Different letters in the same column indicate significant differences at p < 0.05 (Tukey’s post hoc test).
Table 7.
Comparison of the 15N utilization rates of the different treatments.
| Treatment | Total Nitrogen Content of Vines (%) | Total 15N Atom Percentage | 15Nap (kg/ha) | Af (%) | 15N UEN (%) |
|---|---|---|---|---|---|
| W1N1 | 7.125 | 0.604 | 191.4 | 4.795 | 46.89 ab |
| W1N2 | 8.038 | 0.72 | 254.4 | 4.795 | 47.44 ab |
| W1N3 | 8.287 | 0.788 | 317.4 | 4.795 | 42.91 a |
| W2N1 | 8.22 | 0.648 | 191.4 | 4.795 | 58.04 b |
| W2N2 | 9.161 | 0.752 | 254.4 | 4.795 | 56.47 b |
| W2N3 | 9.618 | 0.817 | 317.4 | 4.795 | 51.63 ab |
Notes: Different letters in the same column indicate significant differences at p < 0.05 (Tukey’s post hoc test). UEN means “Use Efficiency of Nitrogen”. Nitrogen uptake values measured in the table are the sum of root, stem, leaf, and fruit contents of vines during harvest.
Publisher’s Note: MDPI stays neutral with regard to jurisdictional claims in published maps and institutional affiliations. |
© 2022 by the authors. Licensee MDPI, Basel, Switzerland. This article is an open access article distributed under the terms and conditions of the Creative Commons Attribution (CC BY) license (https://creativecommons.org/licenses/by/4.0/).
Share and Cite
MDPI and ACS Style
Gong, P.; Zhang, Y.; Liu, H. Effects of Irrigation and N Fertilization on 15N Fertilizer Utilization by Vitis vinifera L. Cabernet Sauvignon in China. Water 2022, 14, 1205. https://doi.org/10.3390/w14081205
AMA Style
Gong P, Zhang Y, Liu H. Effects of Irrigation and N Fertilization on 15N Fertilizer Utilization by Vitis vinifera L. Cabernet Sauvignon in China. Water. 2022; 14(8):1205. https://doi.org/10.3390/w14081205
Chicago/Turabian StyleGong, Ping, Yao Zhang, and Hongguang Liu. 2022. "Effects of Irrigation and N Fertilization on 15N Fertilizer Utilization by Vitis vinifera L. Cabernet Sauvignon in China" Water 14, no. 8: 1205. https://doi.org/10.3390/w14081205
Note that from the first issue of 2016, this journal uses article numbers instead of page numbers. See further details here.