Article

The Coupling Response between Different Bacterial Metabolic Functions in Water and Sediment Improve the Ability to Mitigate Climate Change

1
Hubei Provincial Engineering Laboratory for Pond Aquaculture, Engineering Research Center of Green Development for Conventional Aquatic Biological Industry in the Yangtze River Economic Belt, Ministry of Education, College of Fisheries, Huazhong Agricultural University, Wuhan 430070, China
2
State Key Laboratory of Marine Resource Utilization in South China Sea, Hainan University, Haikou 570228, China
3
Institute of Hydrobiology, Chinese Academy of Sciences, Wuhan 430072, China
*
Author to whom correspondence should be addressed.
Water 2022, 14(8), 1203; https://doi.org/10.3390/w14081203
Submission received: 16 February 2022 / Revised: 30 March 2022 / Accepted: 5 April 2022 / Published: 9 April 2022
(This article belongs to the Section Biodiversity and Functionality of Aquatic Ecosystems)

Abstract

:
Extreme climatic events, such as heat wave and large temperature fluctuations, are predicted to increase in frequency and intensity during the next hundred years, which may rapidly alter the composition and function of lake bacterial communities. Here, we conducted a year-long experiment to explore the effect of warming on bacterial metabolic function of lake water and sediment. Predictions of the metabolic capabilities of these communities were performed with FAPROTAX using 16S rRNA sequencing data. The results indicated that the increase in temperature changed the structure of bacterial metabolic functional groups in water and sediment. During periods of low temperature, the carbon degradation pathway decreased, and the synthesis pathway increased, under the stimulation of warming, especially under the conditions temperature fluctuation. We also observed that nitrogen fixation ability was especially important in the warming treatments during the summer season. However, an elevated temperature significantly led to reduced nitrogen fixation abilities in winter. Compared with the water column, the most predominant functional groups of nitrogen cycle in sediment were nitrite oxidation and nitrification. Variable warming significantly promoted nitrite oxidation and nitrification function in winter, and constant warming was significantly inhibited in spring, with control in sediments. Co-occurrence network results showed that warming, especially variable warming, made microbial co-occurrence networks larger, more connected and less modular, and eventually functional groups in the water column and sediment cooperated to resist warming. We concluded that warming changed bacterial functional potentials important to the biogeochemical cycling in the experimental mesocosms in winter and spring with low temperature. The effect of different bacteria metabolism functions in water column and sediment may change the carbon and nitrogen fluxes in aquatic ecosystems. In conclusion, the coupling response between different bacterial metabolic functions in water and sediment may improve the ability to mitigate climate change.

1. Introduction

Since the last century, the global average temperature and water temperature have been rising at an unprecedented rate [1,2]. The occurrence of extreme weather events such as heat waves has also increased dramatically in recent decades and is expected to further intensify in the future [1,3]. Climate warming will also lead to greenhouse gas emissions, and, over time, the warming will be more intense [4]. Most lakes and ponds on earth are small, shallow-water systems [5] and, due to the large surface-to-volume ratio of lakes and the absence of stratification in summer, they are more sensitive to climate change than deep water [6,7]. Compared with the enhancement in average temperature, extreme climate conditions such as heat waves have greater selective pressure on organisms [8,9], which strongly affects the structure and function of freshwater ecosystems [10]. Therefore, it is necessary to carry out further studies on the effects of climate warming on the function of shallow-water ecosystems to protect lake ecosystems from climate change.
Bacteria are thought to be a sensitive sentinel of climate change [11] and are closely related to the biogeochemical cycle [12,13]. Therefore, microorganisms can respond quickly to environmental changes in shallow-water ecosystems [14,15]. Microbial function and related processes are always determined by microbial communities [16]. The functional composition of the microbial community in the natural environment (such as lakes, soil, etc.) is affected by environmental factors. The functions of microbial communities in similar environments are more similar, but the compositions of functional microbial species may be different [17,18,19]. Previous studies attempted to link microbial structure and functional characteristics but that found microbial metabolic composition or function are relatively constant, but the taxonomic composition is variable under similar environmental conditions [19,20,21]. These results indicate that the change in microbial composition does not necessarily lead to an alteration in microbial function due to the redundancy of microbial function [22].
In ecological research, microbial functional traits are important indicators in the study of microbial community composition [23]. An increase in temperature will accelerate the metabolic rate of microorganisms, affecting the biogeochemical processes referring to the cycling of carbon (C), nitrogen (N), phosphorus (P) and sulfur (S) [24,25]. In addition, warming will directly affect changes in primary producers and indirectly affect the function of microorganisms. Studies have found that a rise in temperature can promote the growth of phytoplankton, especially under eutrophication conditions [15,26]. The number of nitrifying microorganisms in the surface sediments of shallow water is more abundant than that in the overlying water [27,28], and the nitrification is stronger. The oxidation rate of nitrite significantly increases with the temperature rising [29]. Temperature is one of the important factors affecting nitrification [30,31], which changes the activity and community structure of microorganisms [32,33], thus changing microorganisms’ affinity to substrates [34].
Different factors may limit the activity of microorganisms according to the different seasons. For example, in winter, the temperature is considered to be the main limiting factor, but, in summer, nutrients may become the main limitation to microbial activities [27]. The constraints of microbial activity and oxygen may inhibit nitrification in sediments, while the presence of oxygen-releasing plants can reverse this inhibition and stimulate ammonium oxidation [35]. Compared with the rise in average temperature, heat waves may have a more obvious impact on the ecosystem [36] and there may be more seasonal changes in bacterial ecological functions. For example, heat waves directly affect photosynthesis and respiration [37]. Short-term heat waves in summer can promote nitrous oxide emissions [38]. Heat waves in autumn may prolong the growing season of primary producers and stimulate decomposers and, with climate warming, river ecosystems may become more heterotrophic and the degradation rate of recalcitrant carbon will become faster [39]. Heat waves in winter may induce plant growth prematurely [40]. Therefore, investigating the effects of seasonal warming on bacterial metabolic function is of great significance for predicting the future trends in nutrient cycling in shallow lakes.
Although microbial functional traits are crucial in biogeochemical cycles, studies on microbial community structure and function under a climate scenario in recent years have mostly focused on soil ecosystems. In summary, warming significantly changes the composition and diversity of microbial communities [41] and metabolic functions [42]. Research into shallow-lake ecosystems under climate warming are based on aquatic plants [41,43], plankton [25,44], fish and the interaction between fish and macrophytes [41,45]; studies of microbial functions are scarce. Microbial communities of different functions participate in the various processes of the carbon and nitrogen cycle and play an important role in maintaining the stability of the water ecosystem. In light of this, it is necessary to study the processes of carbon and nitrogen cycling in water areas under different warming patterns in depth to clarify the microbial mechanisms of nutrient cycling under the change in water environment.
Studying the changes in bacterial metabolic function caused by warming can provide a theoretical basis for sustainable development for the restoration of the damaged water ecosystem. High-throughput sequencing is commonly used to research microbial communities [46,47]. With the development of bioinformatics, metabolome data can not only be used to explore changes in microbial community structure, but also to predict community function, such as PICRUST [48], BugBase [49], Tax4Fun [50] and FAPROTAX [18]. There are few relevant studies on bacterial metabolic function in shallow-water ecosystems under climate scenarios. Hence, this study aimed to clarify the response trends of different bacterial metabolic functions to climate warming, and enrich the theoretical understanding of microbial ecology in freshwater ecosystems. It may be useful for the environmental protection of shallow-lakes’ ecology under climate warming, providing theoretical support for the future alleviation of the threat of warming to freshwater ecosystems through microbial t.
Therefore, we conducted 18 outdoor mesocosms in Wuhan, the central part of China. These mesocosms mimic shallow-lake systems under three temperature scenarios (ambient temperature, constant and variable warming). We mainly used Functional Annotation of Prokaryotic Taxa (FAPROTAX) to the predict response of ecologically relevant functional groups of bacterial communities in water and sediment [18]. In this work, we hypothesized that (1) climate warming may result in high variability in the composition of bacterioplankton communities in lacustrine water [51,52], while warming (constant and variable warming) may alter the metabolic functional structure of bacteria involved in nutrient cycling. (2) During the low-temperature period, temperature is the main limiting factor driving bacterial activity and, with the increase in temperature, nutrients may become the main limiting factor of microbial activity [27,53,54]. Hence, warming may stimulate the function of bacteria more strongly in colder seasons (such as spring and winter). (3) Compared to continuous warming, variable warming shows significant seasonal differences in microbial stimulation [36,39], and we expect that variable warming can stimulate bacterial function related to carbon and nitrogen cycles more seasonally.

2. Materials and Methods

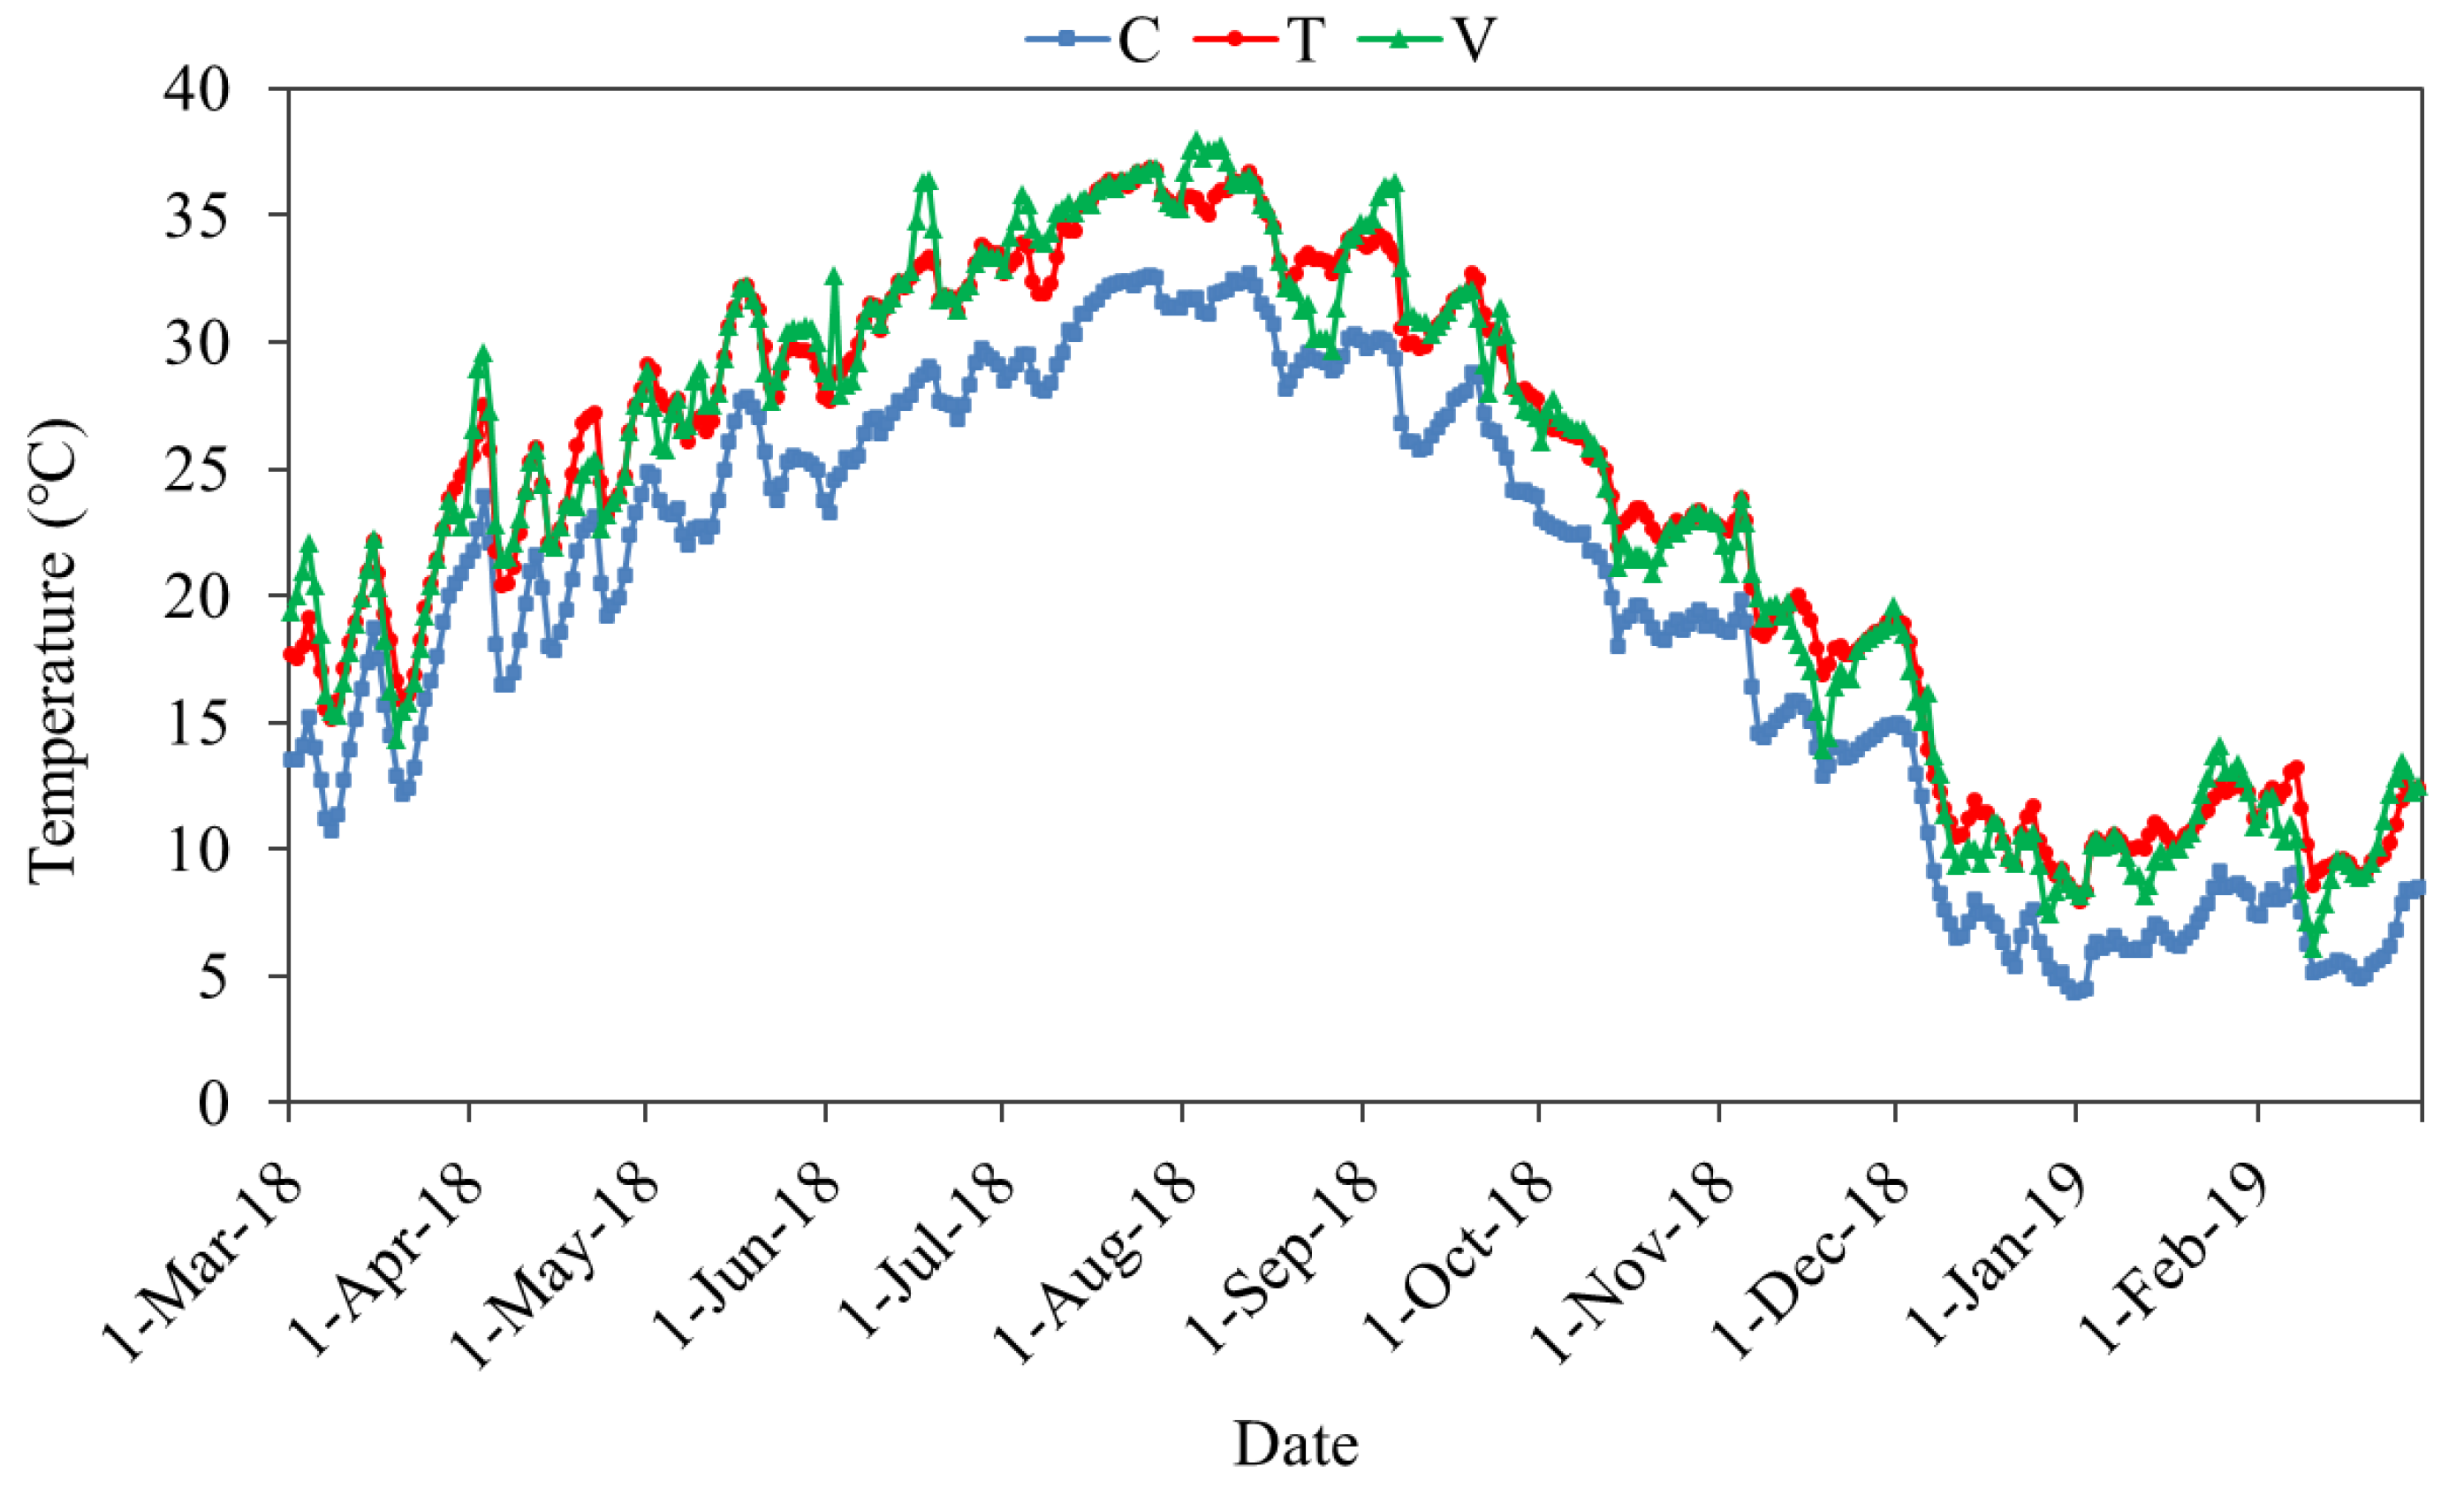
2.1. Mesocosm Experiment Set up and Management

Eighteen cylindrical polyethylene mesocosms (volume: 2500 L, diameter: 1.5 m, height: 1.4 m) were located at Huazhong Agricultural University in Wuhan City, Central China (30°29′ N; 114°22′ E). The outdoor mesocosms simulate shallow-lake ecosystems. We fixed temperature sensors (DS18B20, Maxim IC, TX, USA) and heating units to each polyethylene mesocosms to monitor the temperature of all treatments in real-time [43]. Each mesocosm arranged 10-cm depth of mixed sediments collected from Lake Liangzihu (N 30°11′3″, E 114°37′59″), and then the filtered lake water with a 20-μm mesh filter from Lake Liangzihu was added to a depth of 1 m depth. Lake Liangzihu is a mesotrophic lake (TLI 42.5) [55], with TN and TP concentrations in water column of sampling area of approximately 0.432 mg L−1 and 0.023 mg L−1, respectively [43,56]. All mesocosms were left for colonization under environmental conditions from November to December 2017 before the experiment began.
We investigated microbial community composition of water and sediment in 18 outdoor mesocosms in different seasons. These mesocosms simulated shallow-lake systems under three temperature scenarios with six replicates: ambient temperature (C), constant warming +4 °C (T) according to IPCC climate scenario RCP8.5 [1], and variable warming (V), with water temperatures fluctuating 0~8 °C relative to T treatment [57].

2.2. Sampling and Environmental Physicochemical Properties

Mixed water samples were collected bi-weekly from each mesocosm using a transparent Plexiglas tube (diameter 70 mm, length 1 m) in winter and every week during the other seasons. The filtered water samples were filtered by Whatman GF/C filters. Water samples and filtered water samples were sent to the laboratory within a short period and stored at −20 °C for subsequent physicochemical property determination. Total nitrogen (TN) and total phosphorus (TP) were determined by spectrophotometry (UV-2800, Unico, Shanghai, China) after digestion with alkaline potassium persulfate [58]. The concentration of PO43−-P in water column was determined using the molybdenum blue method [59]. The concentration of NH4+-N in water column were determined by Nessler’s reagent colorimetric method and NO3--N content was determined by ultraviolet spectrophotometry method [58]. Chlorophyll-a after Whatman GF/C membrane was extracted by ethanol and then analyzed by spectrophotometry (UV-2800, Unico, China) [60]. The HACH HQD Portable Meters (HQ40d, HACH, COLO, USA) were used to measure dissolved oxygen (DO), pH and conductivity.
Bacterioplankton and sedimentary bacteria samples were collected once in different seasons (i.e., May, August, November 2018 and February 2019). One hundred milliliters of water from each tank were filtered through a 0.22-μm white polycarbonate membrane and stored at −80 °C until DNA extraction.

2.3. DNA Extraction, PCR Amplification

Microbial community genomic DNA was extracted from water and sediment samples frozen at −80 °C using the MOBIO PowerWater® DNA Isolation Kit (Mobio, USA) according to the manufacturer’s protocols. The purity was calculated by the absorbance ratio A260/A280 and A260/230 and the quantity of DNA samples were determined using a NanoDrop 2000 UV–vis spectrophotometer (Thermo Scientific, Wilmington, DE, USA). Amplification of genomic DNA extracts employed ABI GeneAmp® 9700 PCR thermocycler (ABI, CA, USA) using the universal forward primers, 338F (5′-ACTCCTACGGGAGGCAGCAG-3′), and the reverse primer 806R (5′-GGACTACHVGGGTWTCTAAT-3′), targeting the conserved bacterial 16S rRNA gene [61]. The reaction mixture contained 10 ng of genomic DNA and 0.2 μL of BSA solution as a template, 4 μL of Ex Taq™ buffer (5×), 2 μL (2.5 mM) of dNTP mix, 5 μM of each primer, and the final reaction volume of 20 μL. The cycling conditions were denaturation at 95 °C for 3 min, 27 cycles of denaturing at 95 °C for 30 s, annealing at 55 °C for 30 s and 45 s extension at 72 °C, single extension at 72 °C for 10 min, and end at 4 °C. The library was prepared in triplicate for each sample.

2.4. Illumina MiSeq Sequencing

Purified amplicons were pooled in equimolar and paired-end sequenced on an Illumina MiSeq PE300 platform (Illumina, San Diego, CA, USA) according to the standard protocols by Wefind Biotechnology Co., Ltd. (Wuhan, China).

2.5. Sequence Denoising, OTU Clustering and FAPROTAX Function Prediction

The raw 16S rRNA gene sequencing reads were demultiplexed, quality-filtered by fastp version 0.20.0 [62] and merged by FLASH version 1.2.7 [63] with the following criteria: (i) The 300 bp reads were truncated at any site receiving an average quality score of <20 over a 50 bp sliding window, and truncated reads shorter than 50 bp were discarded, while reads containing ambiguous characters were also discarded; (ii) Only overlapping sequences longer than 10 bp were assembled according to their overlapped sequence. The maximum mismatch ratio of the overlap region was 0.2. Reads that could not be assembled were discarded; (iii) Samples were distinguished according to the barcode and primers, and the sequence direction was adjusted to exact barcode matching, with two nucleotide mismatches in primer matching. Operational taxonomic units (OTUs) were obtained with a 97% similarity level [64] using Usearch (version 7.0 http://drive5.com/uparse (accessed on 15 February 2021)). After quality filtration, we obtained a total of 8,257,236 sequences from the 143 samples, with 23,874 to 55,037 sequences per sample.
Functional annotation of prokaryotic taxa (FAPROTAX) is a functional annotation database of prokaryotic cells based on the literature on culturable bacteria. FAPROTAX is more suitable for the functional annotation and prediction of the biogeochemical cycles (especially carbon, hydrogen, nitrogen, phosphorus, sulfur, etc.) of environmental samples (oceans, lakes, etc.) to establish metabolism or other ecological functions [18]. The complete database for FAPROTAX includes more than 7600 functional annotations from more than 80 functional groups. The annotated OTU table of Greengenes or Silva database based on 16S was run through a Python script to match the species information in the FAPROTAX database (http://www.zoology.ubc.ca/louca/FAPROTAX/ (accessed on 15 February 2021)), then the functional annotation prediction results of the microbial community were output.
The FAPROTAX output table contains the metabolic assignments of 65 different types of metabolisms, including carbon, nitrogen, sulfur, iron, hydrogen and human diseases. According to the aims of this study, we only focused on the functional annotations related to the carbon and nitrogen cycle (Tables S3 and S4). Therefore, 25 functional annotations related to the carbon cycle and 13 functional annotations related to the nitrogen cycle were selected based on the relevant literature [65,66,67]. The specific functions are as follows: FC1-FC25 denote chemoheterotrophy (FC1), aerobic chemoheterotrophy (FC2), phototrophy (FC3), photoautotrophy (FC4), oxygenic photoautotrophy (FC5), methylotrophy (FC6), methanol oxidation (FC7), cyanobacteria (FC8), chloroplasts (FC9), ureolysis (FC10), photoheterotrophy (FC11), hydrocarbon degradation (FC12), methanotrophy (FC13), anoxygenic photoautotrophy (FC14), anoxygenic photoautotrophy S oxidizing (FC15), aerobic anoxygenic phototrophy (FC16), aromatic compound degradation (FC17), cellulolysis (FC18), anoxygenic photoautotrophy H2 oxidizing (FC19), aliphatic non-methane hydrocarbon degradation (FC20), aromatic hydrocarbon degradation (FC21), chitinolysis (FC22), xylanolysis (FC23), reductive acetogenesis (FC24), fermentation (FC25).
There were 13 bacterial groups related to the nitrogen cycle in water column and sediment. The nitrogen cycle functions in the water column and sediment were represented by FN1-FN13, and FN1-FN13 denote nitrogen fixation (FN1), nitrate reduction (FN2), nitrate respiration (FN3), nitrogen respiration (FN4), nitrite respiration (FN5), nitrate denitrification (FN6), nitrite denitrification (FN7), nitrous oxide denitrification (FN8), denitrification (FN9), nitrate ammonification (FN10), nitrite ammonification (FN11), aerobic nitrite oxidation (FN12), and nitrification (FN13).

2.6. Co-Occurrence Network Analysis

To estimate the interaction patterns of bacterial metabolic functions, a co-occurrence networks analysis was carried out based on Spearman rank correlation. The whole datasets were split into two subgroups, water and sediment samples, which were individually analyzed. Only Spearman’s rank correlation coefficients >0.6 (or <−0.6) and p < 0.05 were accepted for network analysis [68,69]. Nodes in the network represent a bacterial metabolic function, while the edges represent close relationships between the two nodes. Small-world is a feature of a co-occurrence network, which means that the average distance between two nodes is short and the nodes in the network are always closely connected [70]. The average clustering coefficient represents the degree of the clustering of nodes; modularity represents the tendency of a network to contain node subclusters; average path length refers to the average network distance between all pairs of nodes; graph density refers to the intensity of connections among nodes [68,71,72]. Therefore, a higher average clustering coefficient and graph density, lower average path length and modularity all indicate that the network is more complex [70,71]. Multiple test corrections were considered, and p-values were corrected for a false discovery rate (FDR) of 0.05 using the Benjamini–Hochberg (BH) method [73]. The resulting correlations were imported into the Gephi (v.0.9.2) platform [74] and then visualized by the Frucherman Reingold algorithms. The topological properties of the networks were also computed in Gephi.

2.7. Statistical Analysis

All statistical analyses were performed using R software (v4.0.3; R Development Core Team). Physical and chemical indexes (such as TP, TN, PO43−-P, NH4+-N, NO3-N, conductivity, DO, pH and chlorophyll-a) and bacterial functional groups in water and sediment were analyzed using linear mixed models with the “lmer” functions from the “lme4” R package [75], and sampling date was used as a random effect for the models. Before the analyses, variables were transformed using arcsine square root or log transformation as necessary. Through the Tukey’s test of the “emmeans” R package, the post-hoc pairwise comparisons among different treatments was made [76]. All of the analyses were performed at a 0.05 statistical significance level. All graphs were made with “ggplot2” R package.

3. Results

3.1. Warming Effects on Physical and Chemical Characteristics

Water temperature in the mesocosms for the duration of the experiment followed the desired experimental design (Figure 1). The water temperature under constant warming (T) was +4 °C higher than that under ambient temperature (C). In the variable temperature treatment (V), the temperature fluctuated relative to the T treatment. The temperature was controlled within the expected range. Changes in environmental parameters in mesocosm during the experiment are shown in Table 1. Constant and variable warming significantly enhanced conductivity, NH4+-N, Chl.a and TN concentration in water column (p < 0.05). Turbidity and NO3-N were significantly higher in the constant-warming treatment compared to the controls. However, other environmental parameters of the elevated temperature treatments, such as DO, pH, PO43−-P and TP, showed no significant effects during the experimental periods.

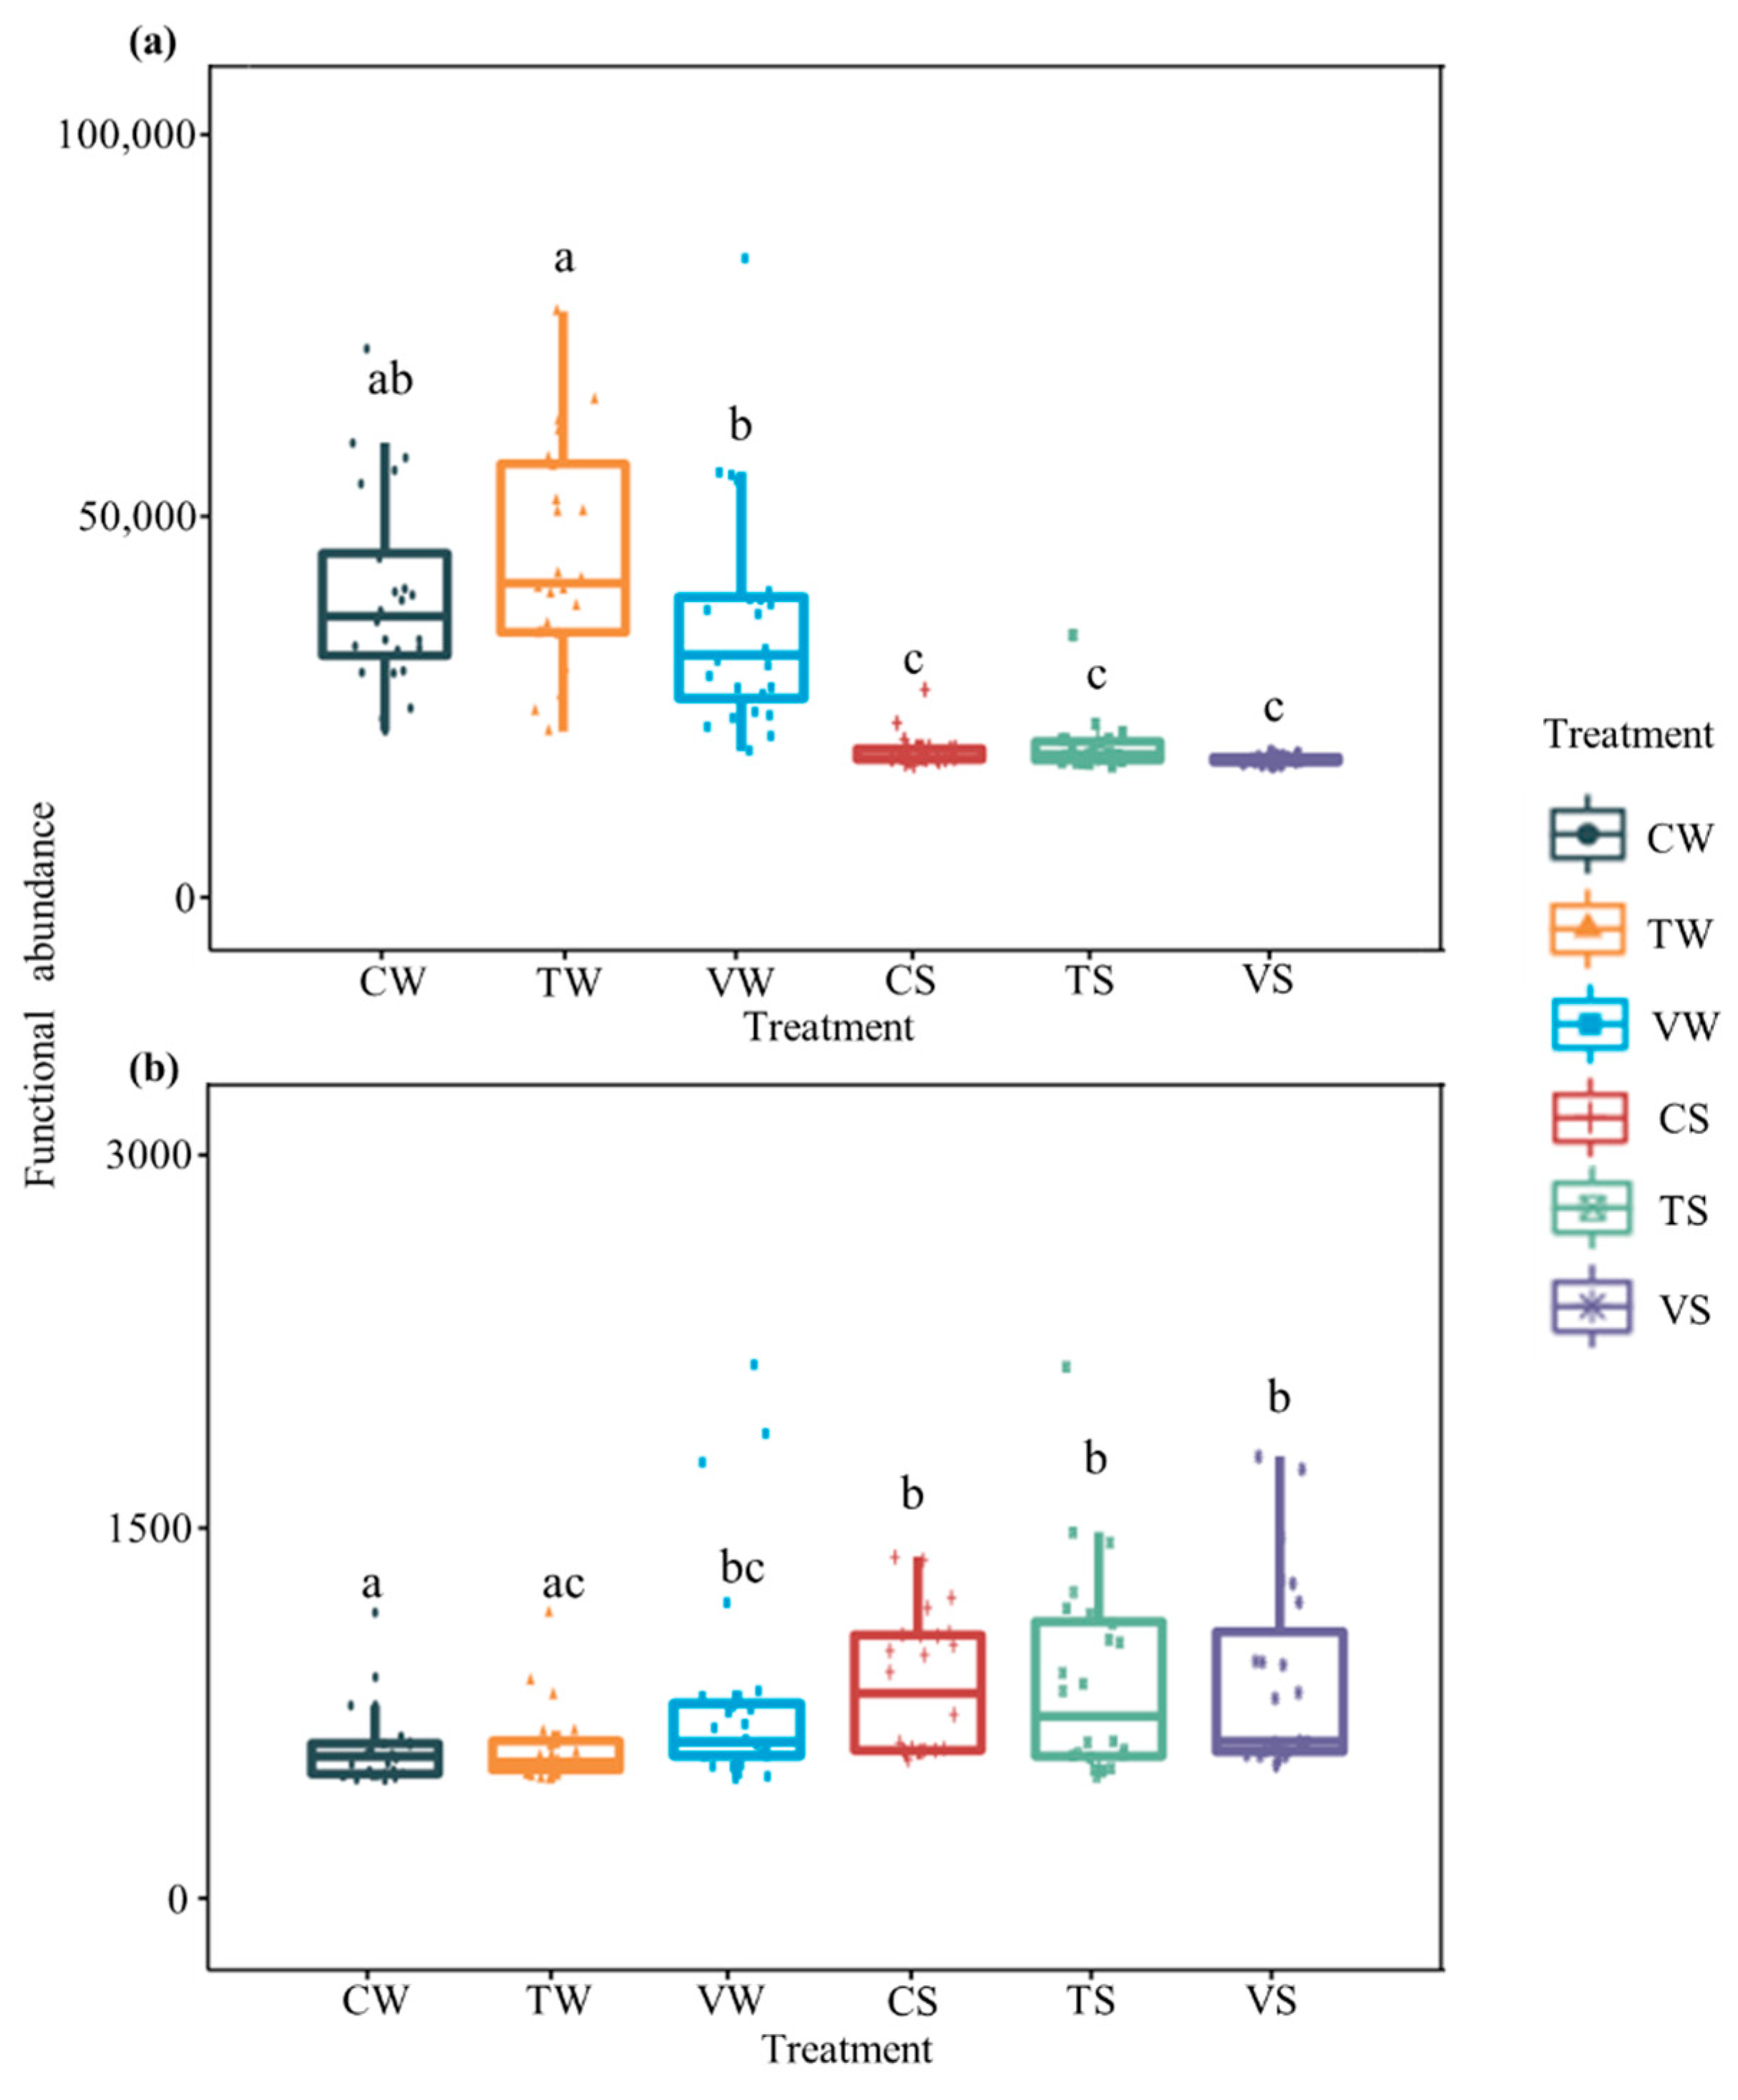
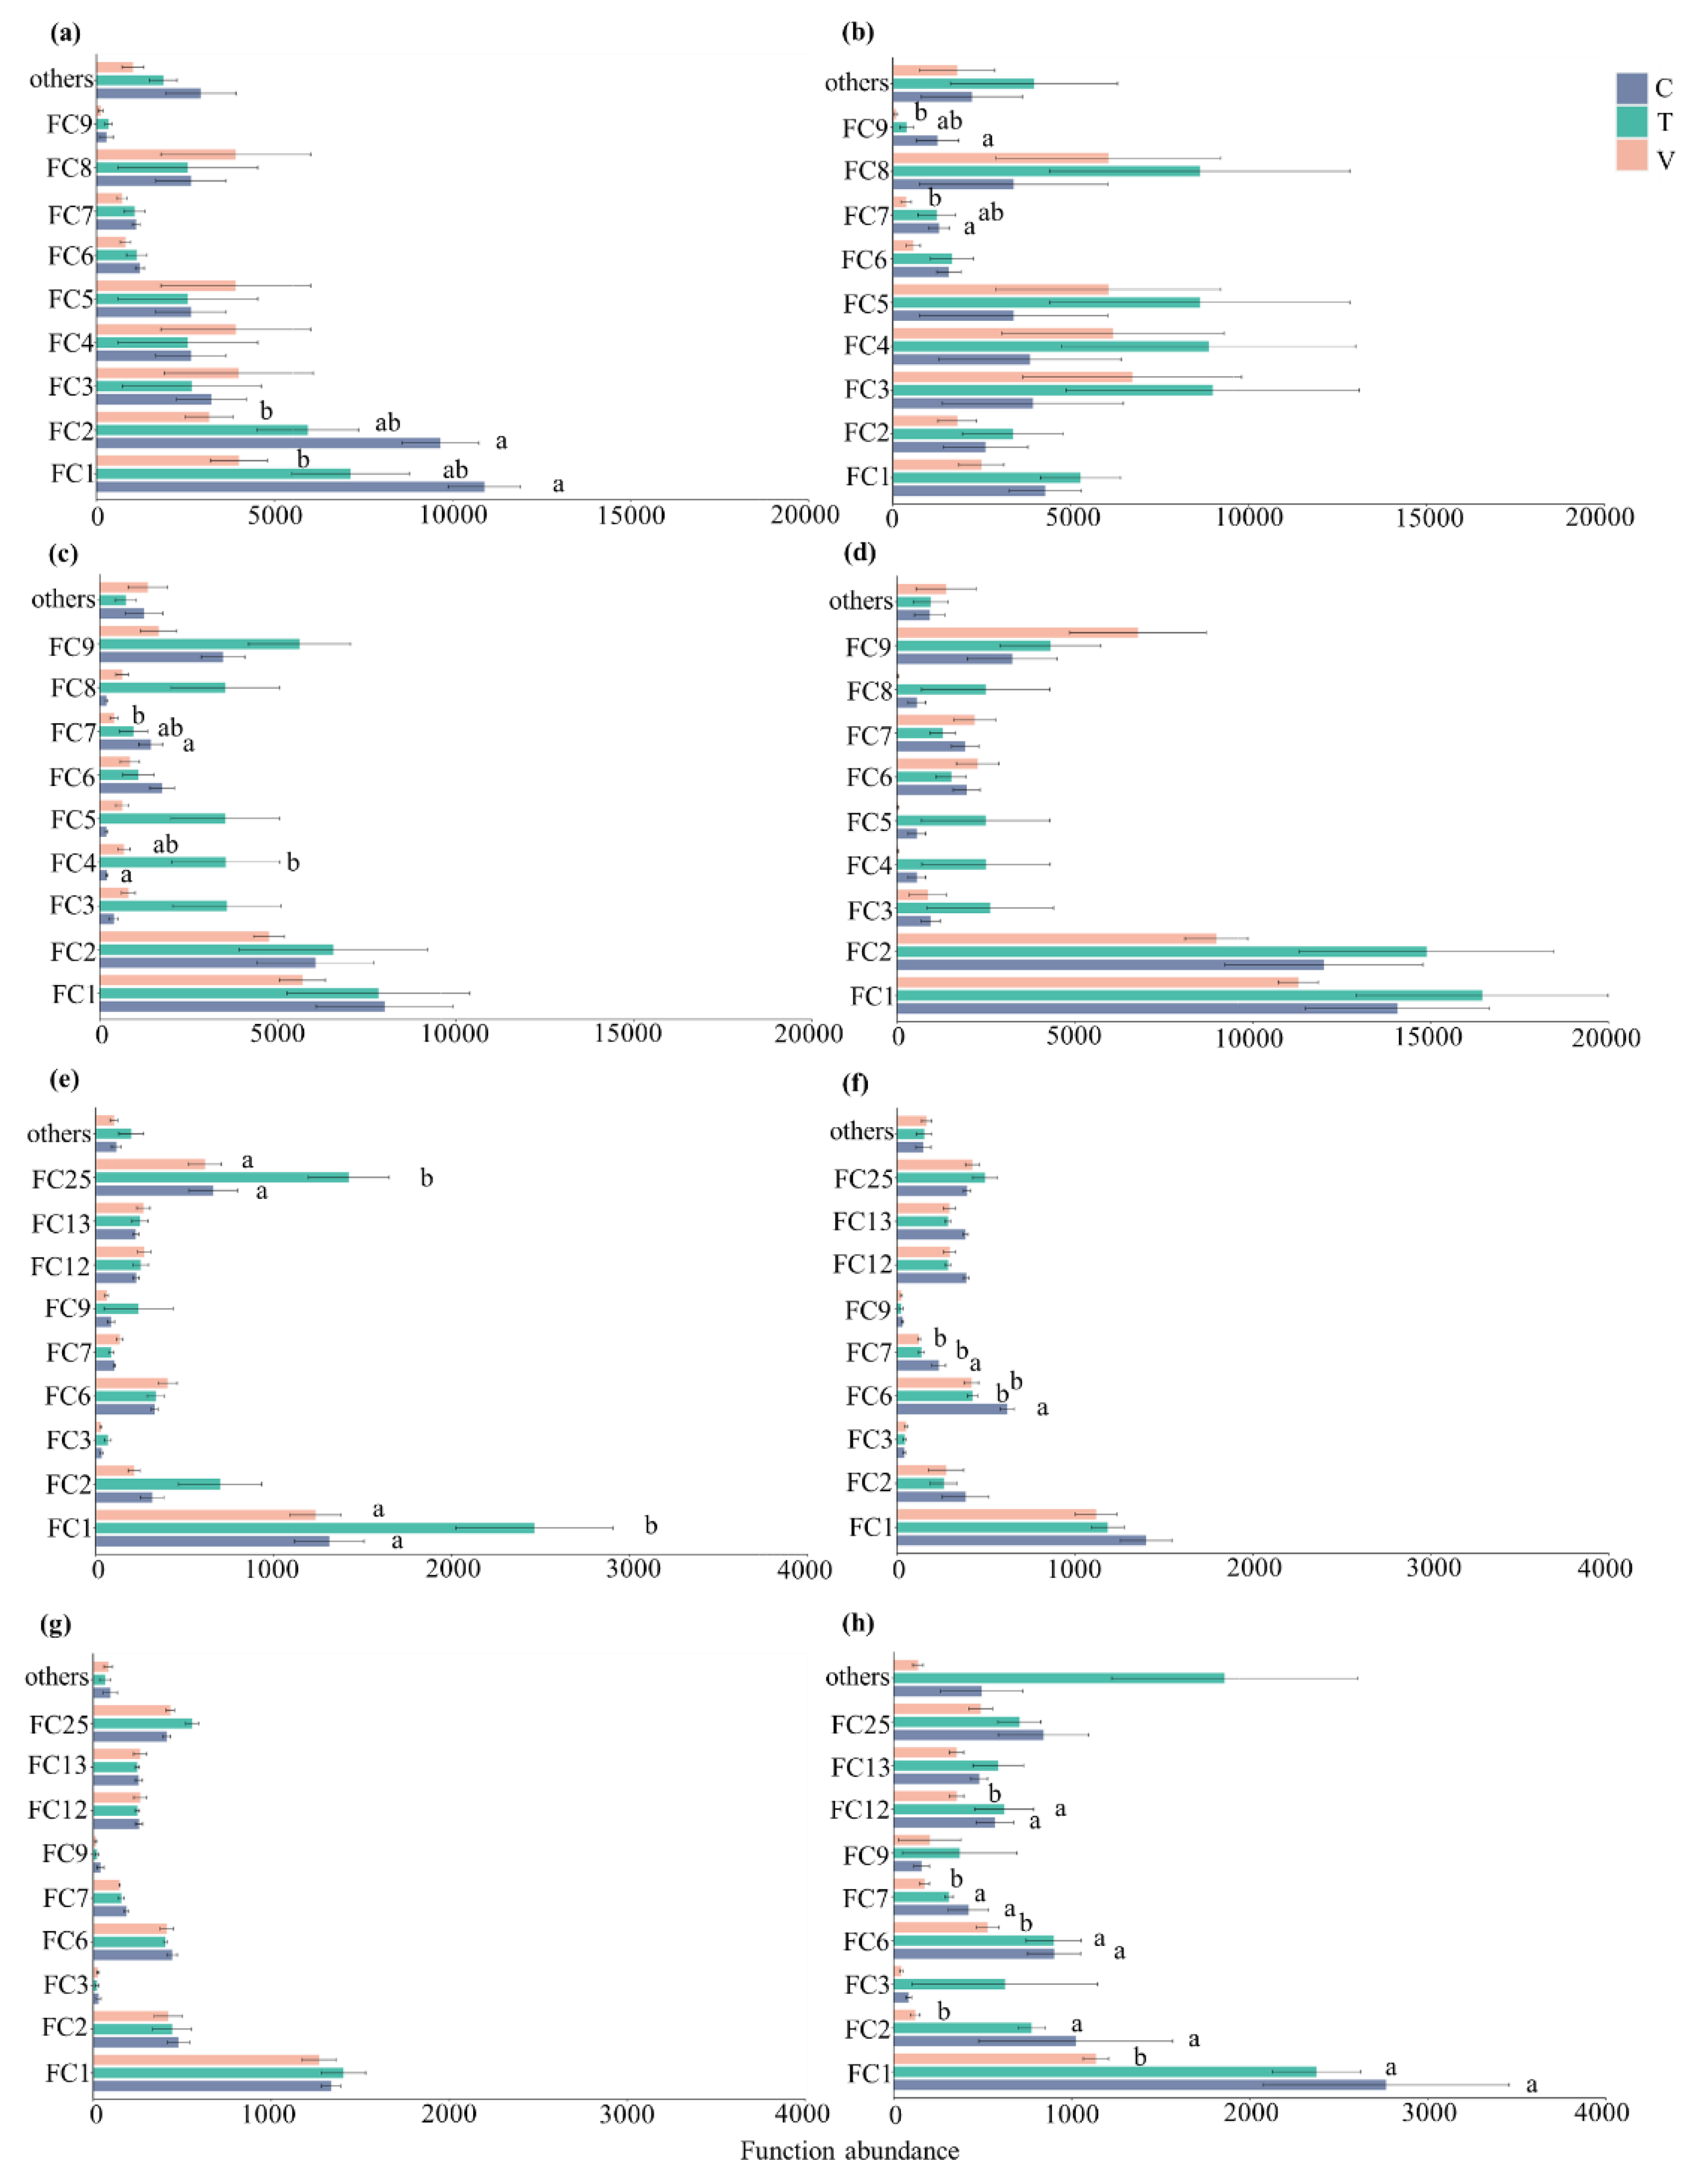
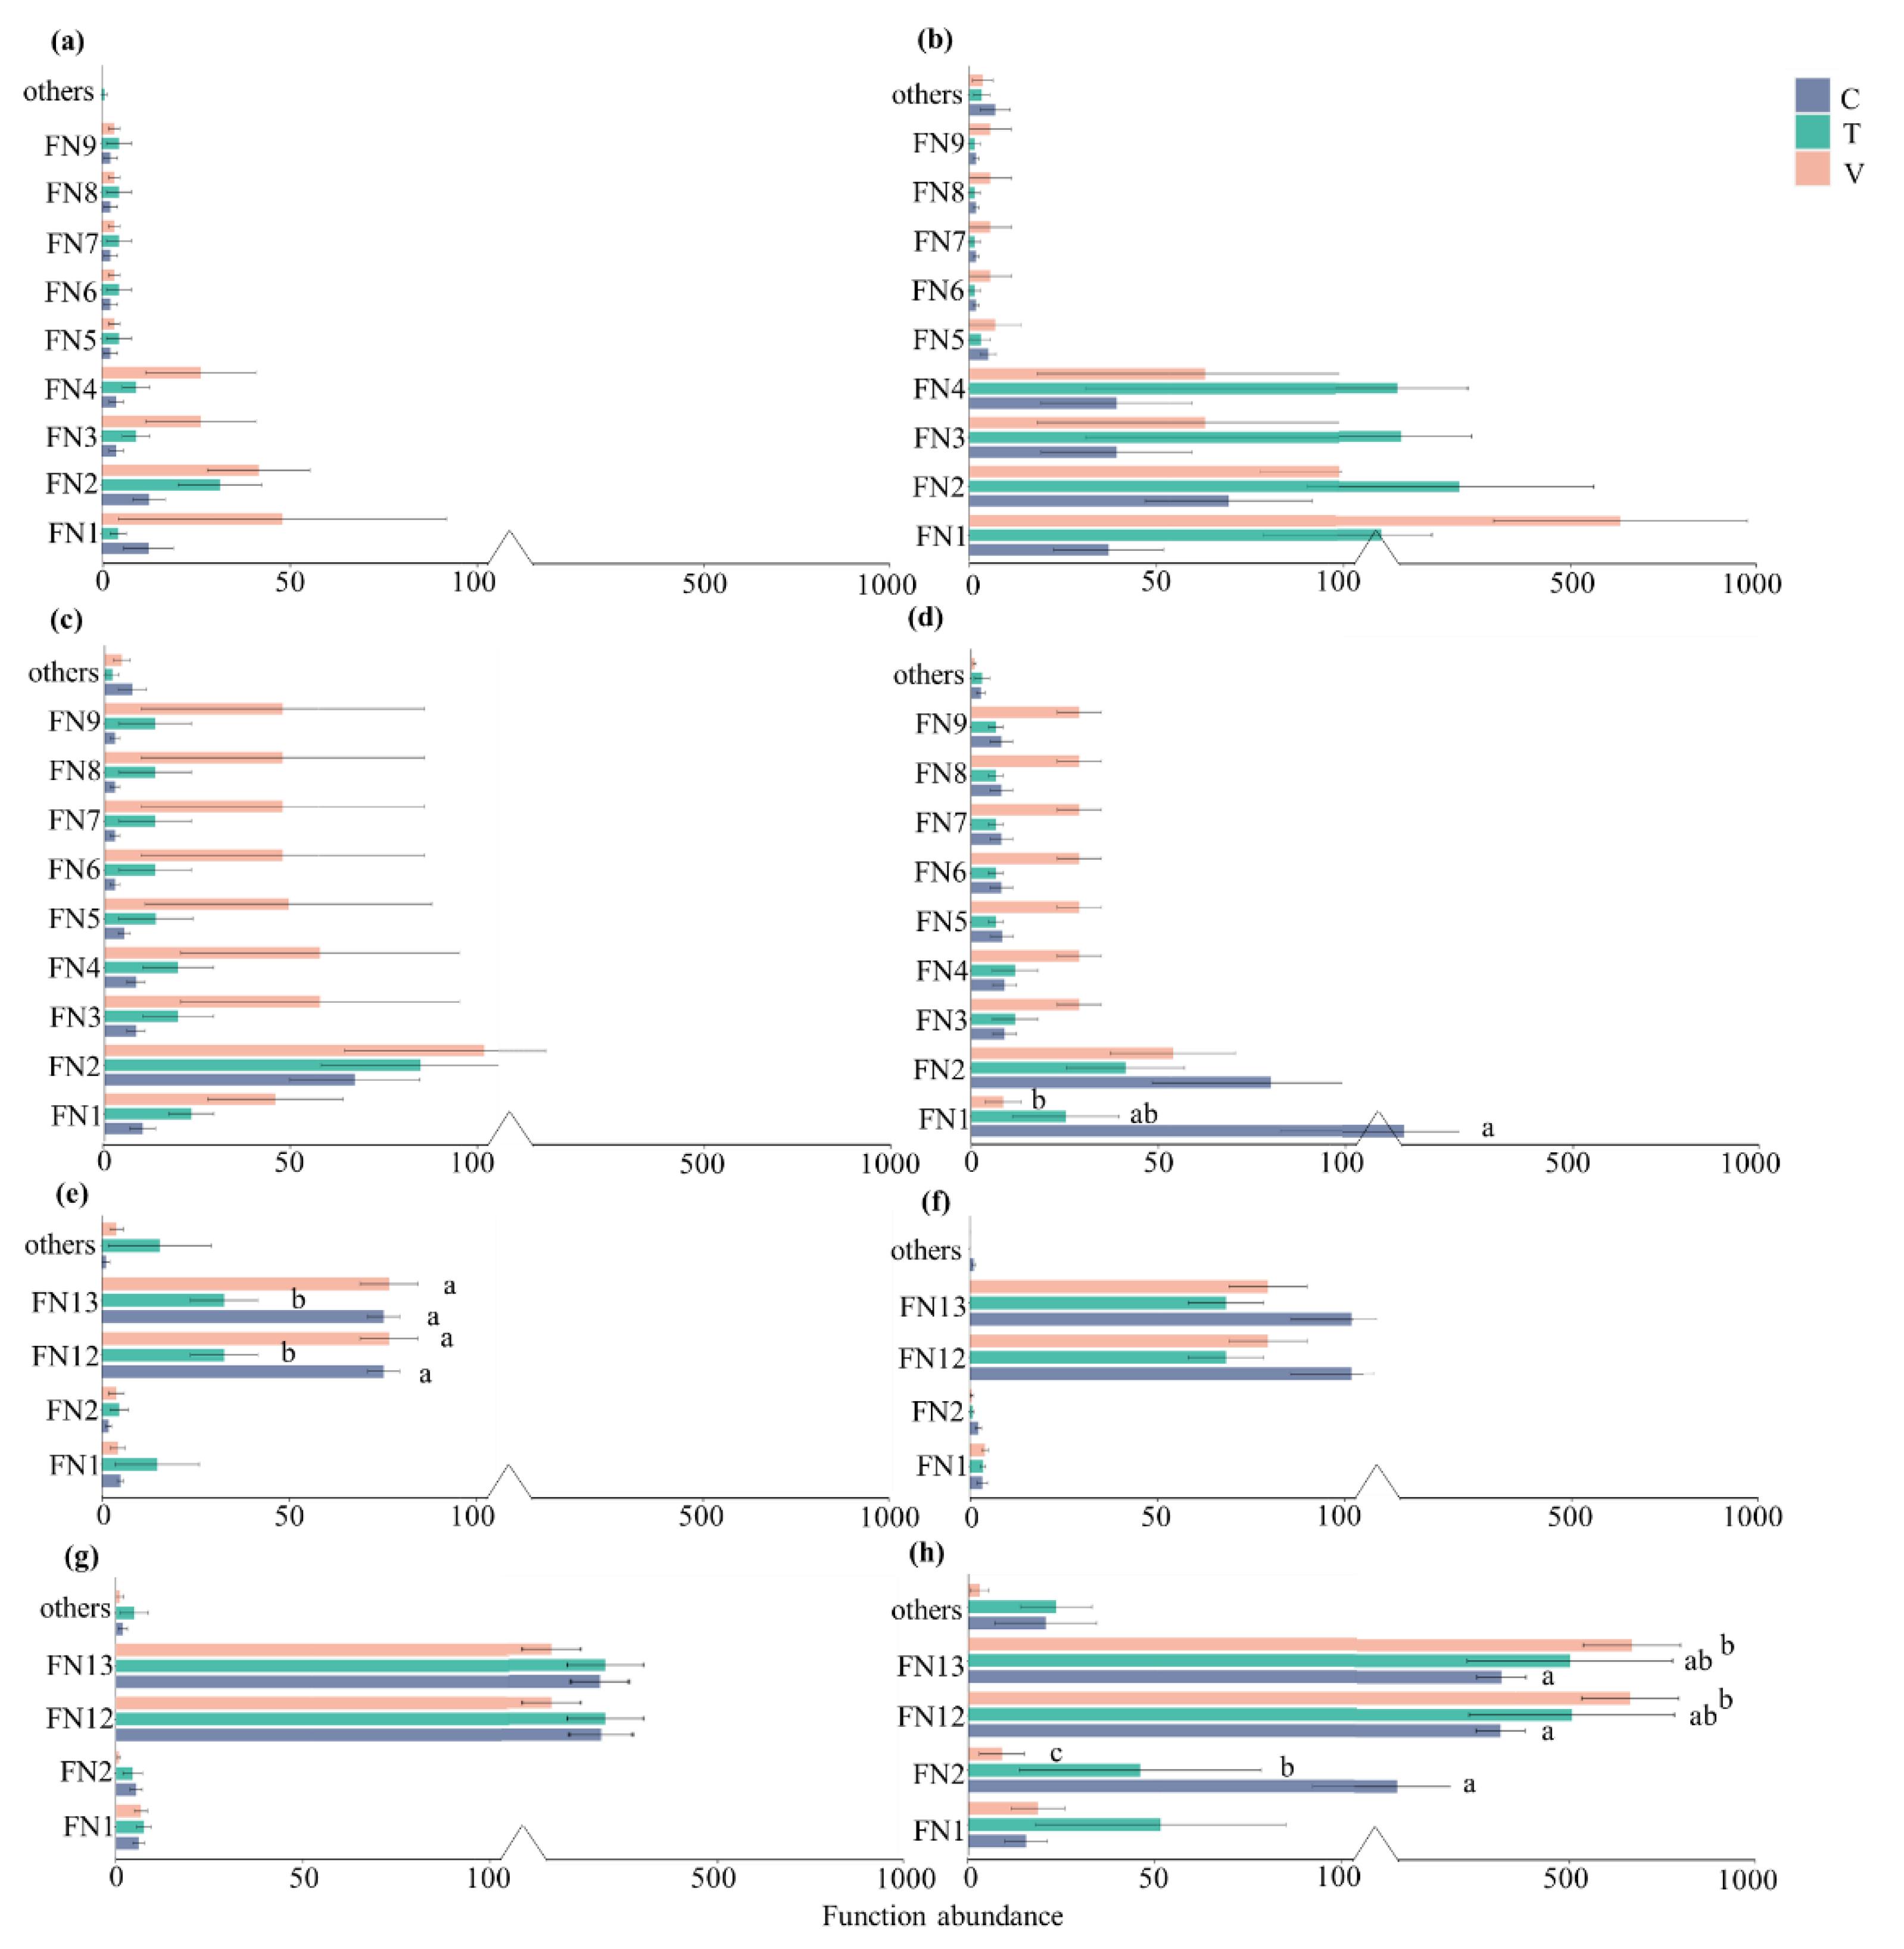
3.2. Bacterial Functional Abundance Analysis

The average total abundance of carbon cycle bacteria was 33,279 in water and 4534 in sediment (Figure 2a). The total abundance of the metabolic function of bacteria related to the carbon cycle in water column was significantly higher than that in sediment (p < 0.05), and there was a significant difference between constant warming (T) and variable warming (V) in water column (p < 0.05, Figure 2a). The average total abundance of nitrogen cycle bacteria was 325 in water column and 529 in sediment (Figure 2b). The total abundance of bacterial metabolic function related to the nitrogen cycle in sediment was significantly higher than that in the water column of C and T treatments (p < 0.05), and variable warming had a significant positive effect on the total abundance of bacterial metabolic (p < 0.05, Figure 2b). Additionally, no significant effect of warming in sediment was detected on the total abundance of bacterial metabolic functions related to the carbon and nitrogen cycle.

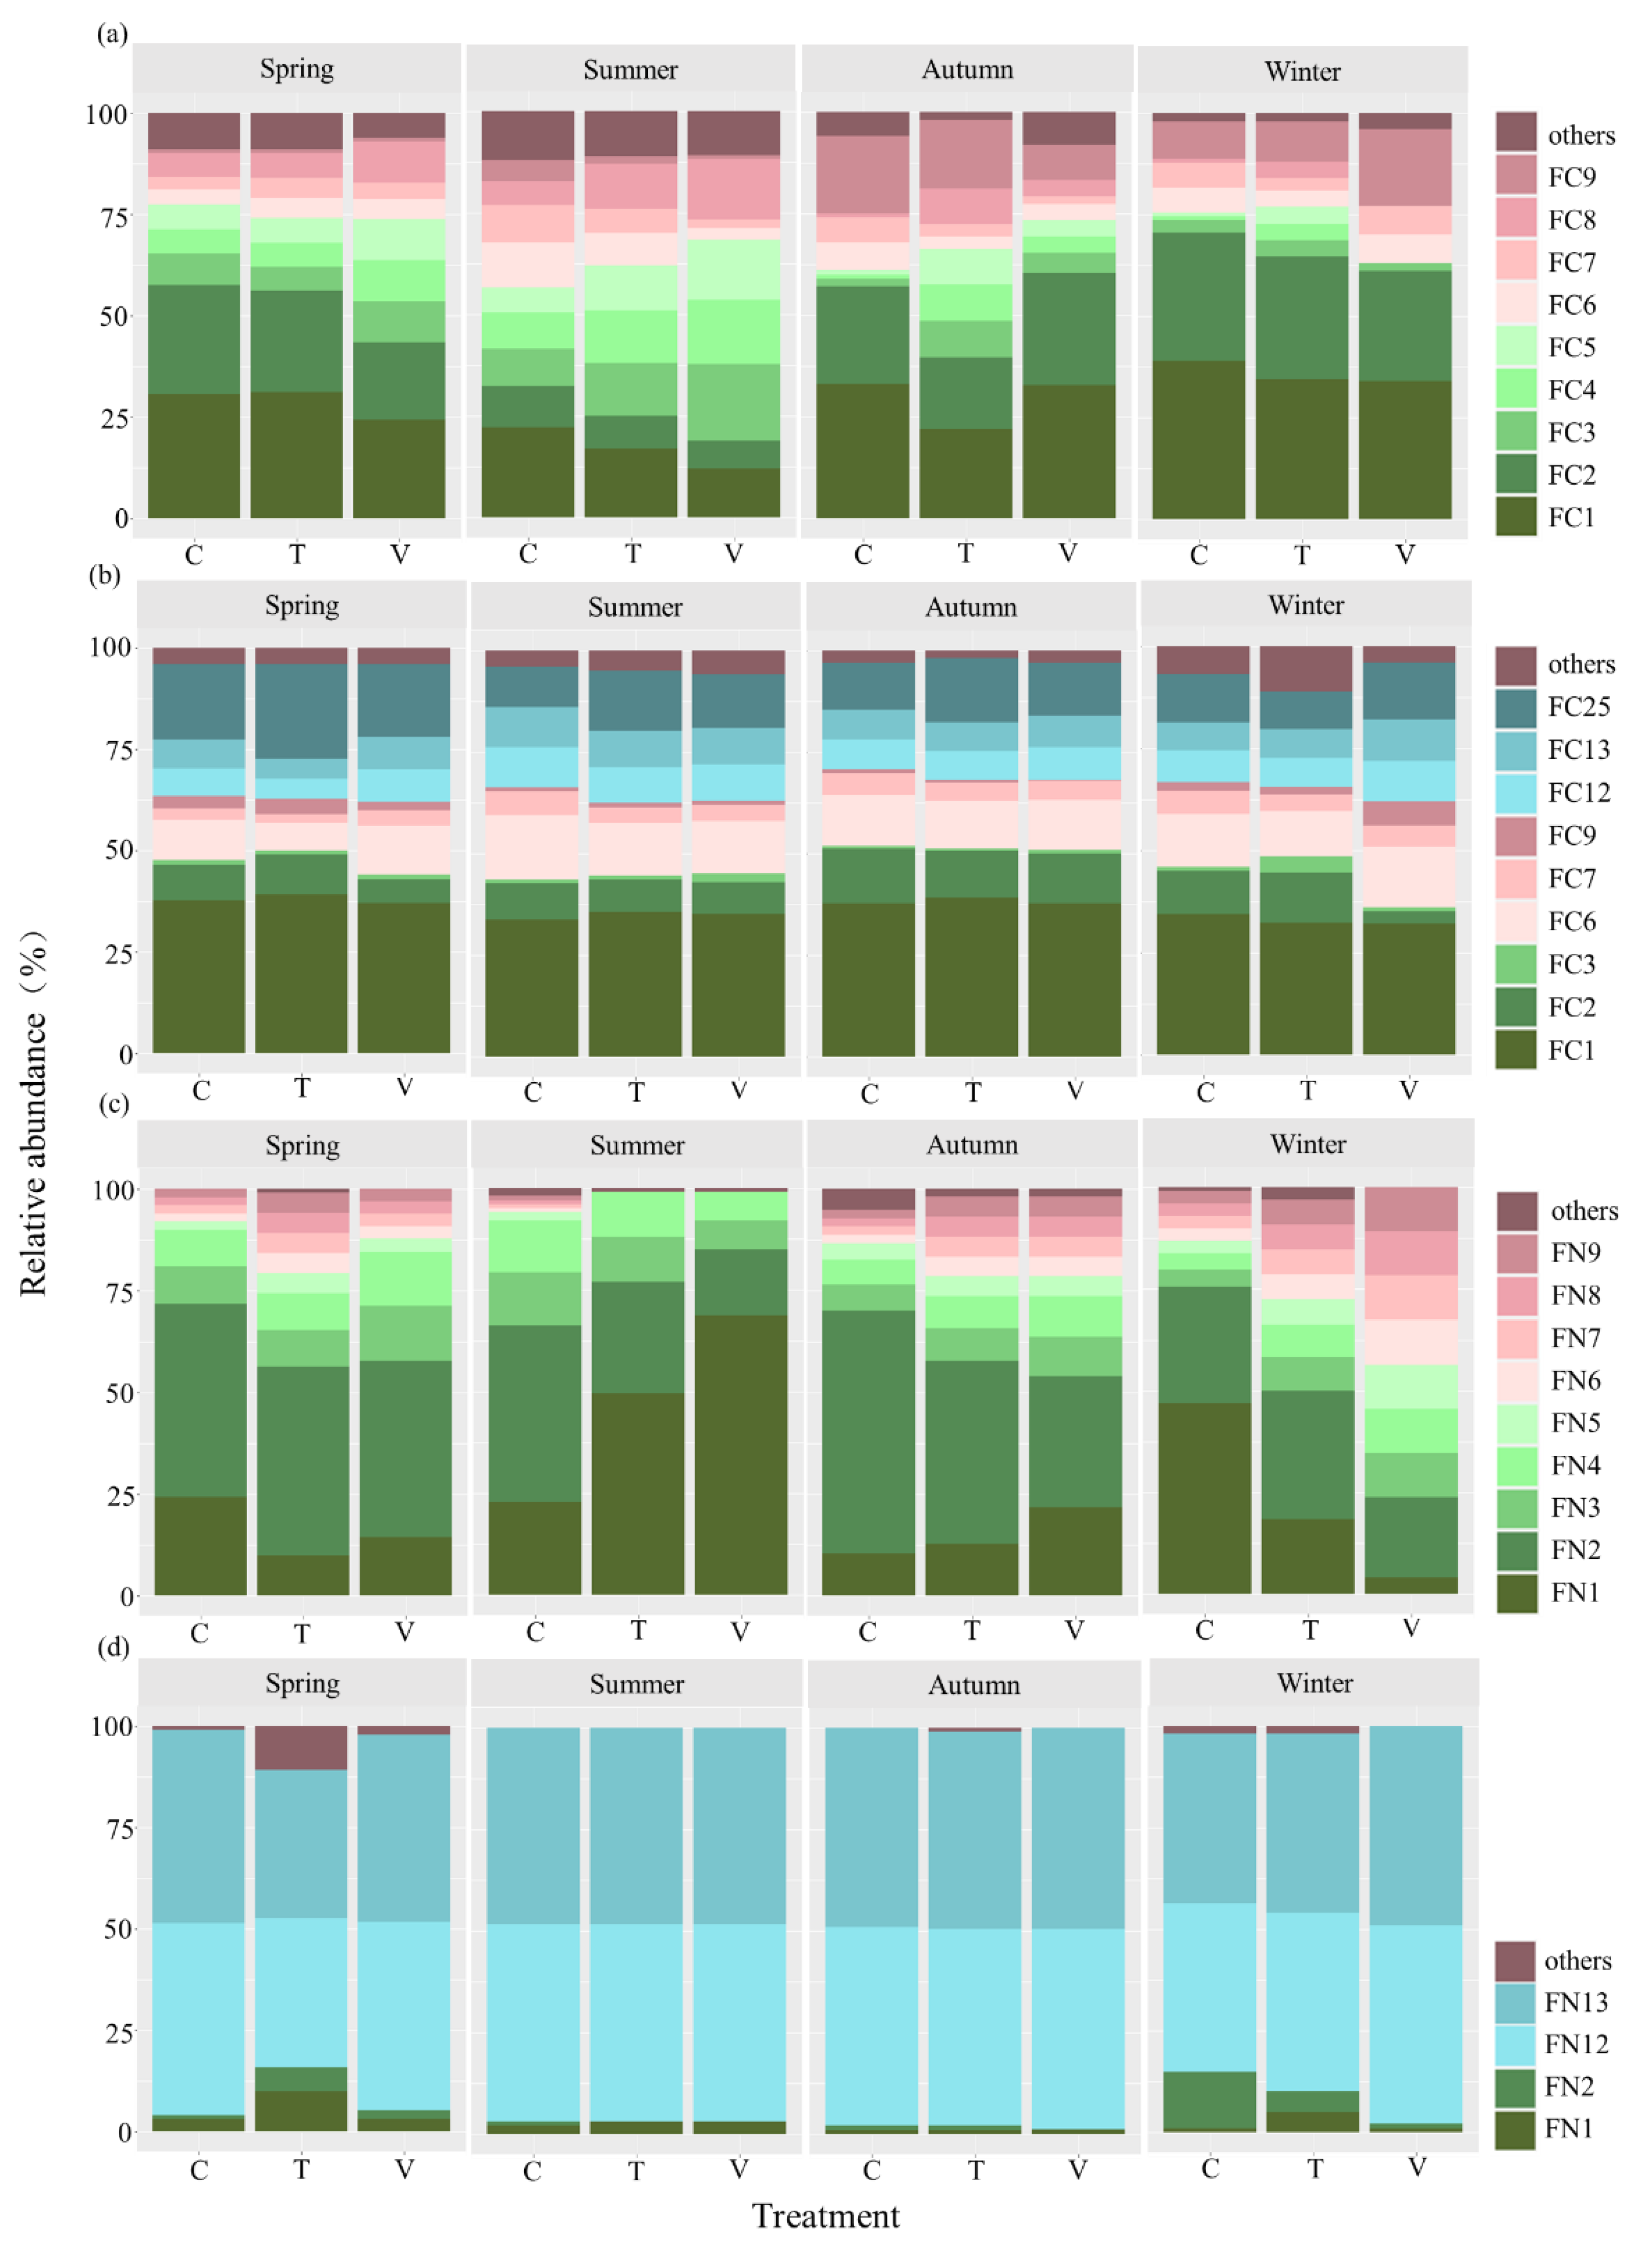
3.3. Composition of Bacterial Functional Community

Changes in metabolic function of dominant bacteria were of primary concern in all treatments (Figure 3). The most predominant functional groups in all samples of carbon cycle in water column were FC1 (chemoheterotrophy) (27% ± 0.04), FC2 (aerobic chemoheterotrophy) (21% ± 0.03), FC3 (phototrophy) (8% ± 0.02), FC4 (photoautotrophy) (7% ± 0.02) and FC9 (chloroplasts) (8% ± 0.03) (Figure 3a). Based on the abundance of the different bacterial functional groups, the chemoheterotrophic metabolisms were the most relevant metabolic functions associated with the carbon cycle in all treatments in spring, autumn and winter (Figure 3a and Figure 4a,c,d), but the photo-autotrophy metabolisms were more relevant in summer (Figure 3a and Figure 4b). Compared with the control, variable warming had a negative significant effect on the chemoheterotrophic metabolisms (FC1 and FC2) of the microbes for the carbon degradation pathway in water column in most seasons, especially in spring (p < 0.05, Figure 3a and Figure 4a), while warming enhanced photo-autotrophy metabolisms for the carbon synthesis to a certain extent.
In addition, the most predominant functional groups in all treatments of the carbon cycle in sediment were FC1 (chemoheterotrophy) (36% ± 0.01), FC2 (aerobic chemoheterotrophy) (9% ± 0.02), FC6 (methylotrophy) (12% ± 0.01) and FC25 (fermentation) (15% ± 0.02) (Figure 3b). The chemoheterotrophic metabolisms and fermentation were the most relevant metabolic functions associated with the carbon cycle in sediment in all seasons (Figure 3b). Warming significantly promoted chemoheterotrophic metabolisms and fermentation in spring (p < 0.05, Figure 3b and Figure 4e), while variable warming had a significant negative effect on chemoheterotrophic metabolisms (FC1 and FC2) and methylotrophy (FC6) in sediment compared with the control during the winter season(p < 0.05, Figure 3b and Figure 4h). In addition, warming significantly inhibited potential methylotrophic and methanol oxidation capacity during the summer seasons (p < 0.05, Figure 3b and Figure 4f).
Regarding nitrogen cycle, the most predominant functional groups in water column were FN1 (nitrogen fixation) (25% ± 0.08), FN2 (nitrate reduction) (37% ± 0.08), FN3 (nitrate respiration) (9% ± 0.03) and FN4 (nitrogen respiration) (9% ± 0.04) (Figure 3c). In the case of nitrogen, nitrogen fixation ability was detected in all seasons, but it was especially important in the warming treatments during the summer season (Figure 5b), associated with the presence of genus Azospirillum. However, an elevated temperature significantly led to reduced nitrogen fixation ability in winter (p < 0.05, Figure 3c and Figure 5d). The dissimilatory nitrate reduction (FN2) was relatively more relevant in the water column, and slightly higher in the warming treatment in most seasons (Figure 3c and Figure 5a–c). However, compared with the water column, the most predominant functional groups in all samples of nitrogen cycle in sediment were FN12 (nitrite oxidation) (46% ± 0.01) and FN13 (nitrification) (46% ± 0.01) (Figure 3d). Constant and variable warming significantly inhibit nitrite oxidation and nitrification function in spring (p < 0.05, Figure 3d and Figure 5e) and winter (p < 0.05, Figure 3b and Figure 5f) compared with the control in sediments.

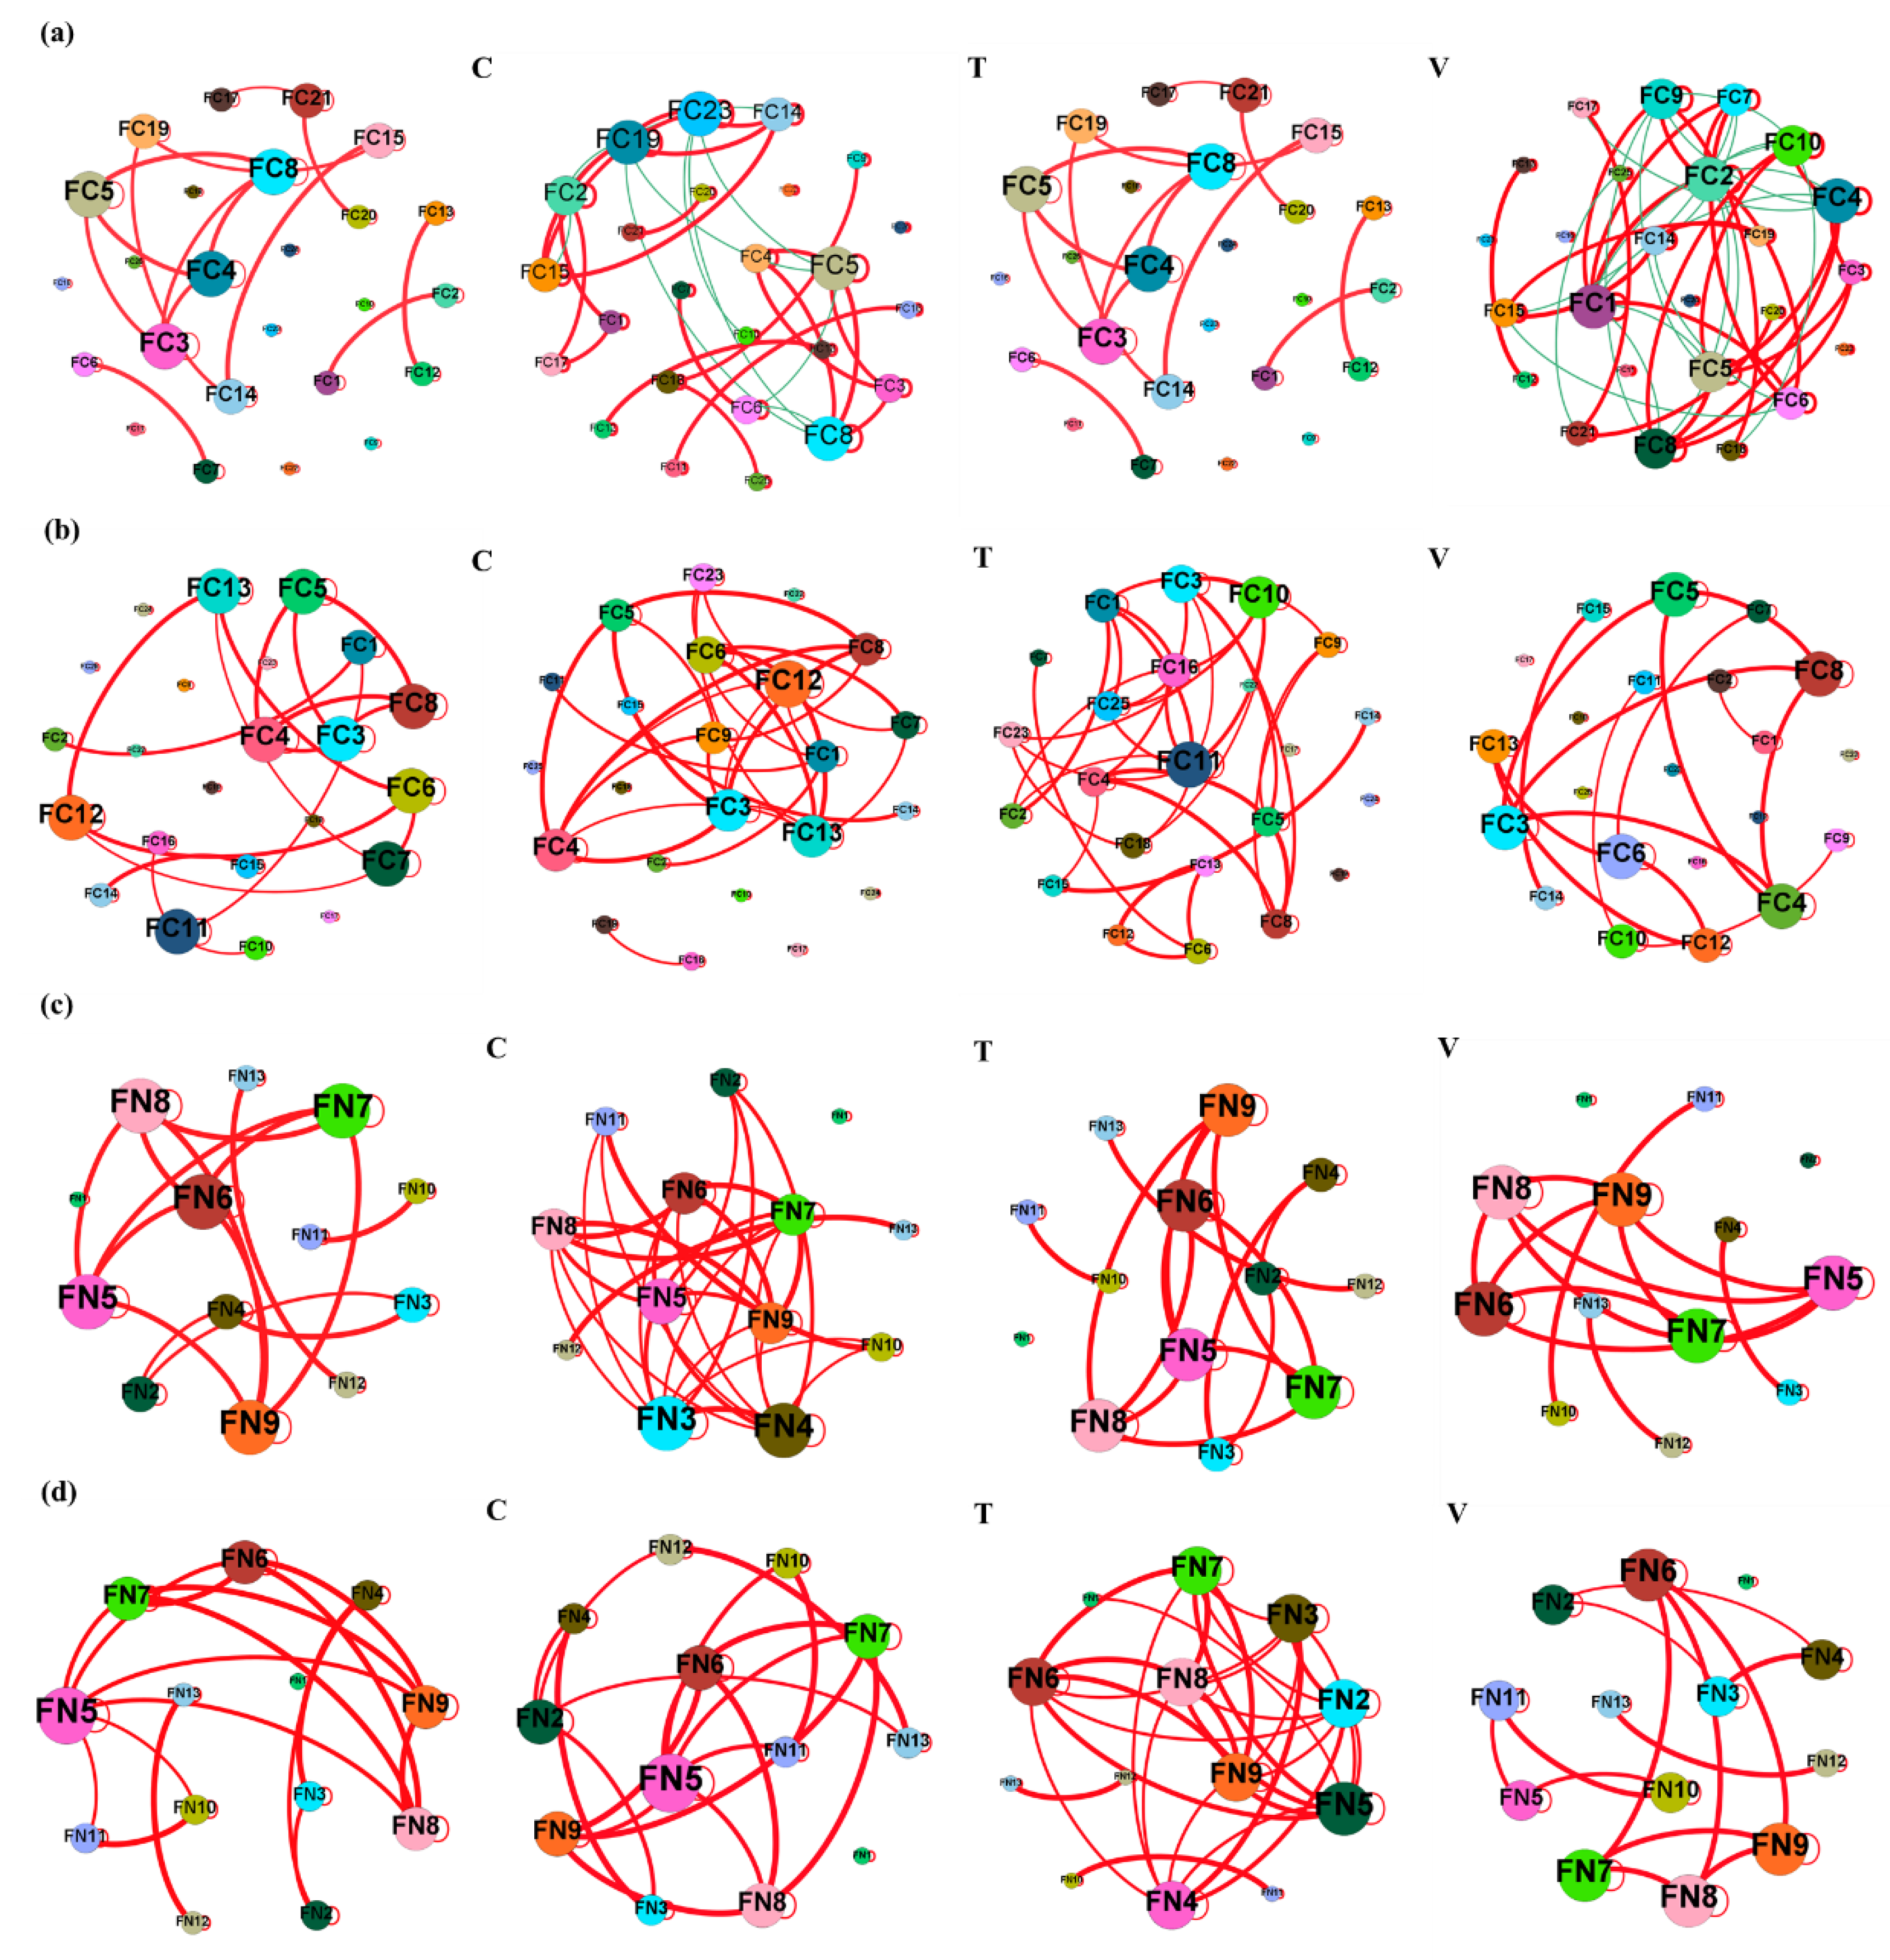
3.4. Co-Occurrence Networks and Topological Features

We explored the interaction patterns across bacterial functional groups in the water column and sediment of carbon and nitrogen cycle through network analysis (Figure 6, Tables S1 and S2). Overall, warming, especially variable warming, made microbial co-occurrence networks larger, more connected and less modular, and eventually functional groups in the water column and sediment cooperated to resist warming. The larger networks of carbon cycle in water column and sediment had a relatively higher degree of modularity than nitrogen cycle networks, and also had a higher node-normalized degree and betweenness. The bacterial function networks of the carbon cycle in the water column and sediment had a relatively higher degree of modularity than the nitrogen cycle (>0.4), and species in the same module had strong interactions or shared niches. The relationships between bacterial functional groups tended to co-occur rather than co-exclude, and more bacterial functional groups network in the water column and sediment of the carbon and nitrogen cycle were positively correlated. In the bacterial functional network of the cycle with carbon, the positive correlation ratio showed T > C > V, indicating that variable warming intensifies the competition between bacterial functions. The average degree comparison of V > C > T showed that the bacteria functional group network of the carbon cycle in water column stimulated by variable warming was more complex, while constant warming enhanced the complexity of the network in sediment. On the other hand, warming (constant and variable) caused the bacterial functional networks of the nitrogen cycle to exhibit small-world characteristics because their average paths were shorter than those of the control treatment. The average path of the bacterial network associated with the carbon cycle under variable warming increased, indicating that bacterial functional networks in water column showed stronger ecological stability under variable warming.

4. Discussion

Global warming and heat waves have become important environmental problems affecting ecosystems and the human living environment [1,10]. Research on ecosystems under climate change has become a hot topic [77,78]. Our experimental climate scenarios, including constant warming and temperature fluctuations, revealed the following three major findings. First, we found that constant warming and temperature fluctuations in different seasons changed the structure of bacterial metabolic function groups in water and sediment. Second, our results showed that warming has a stronger stimulating effect on the function of bacteria in water column and sediment in colder seasons (such as spring and winter). Third, compared with constant warming, variable warming can stimulate more seasonal biogeochemical cycling related to bacterial functions.
Our results confirm the first hypothesis that temperature rising in different seasons changes the bacterial metabolic function structure in water column and sediment. Based on our previous research results, climate change will change the composition of bacterial community structure [51], and the change in the bacterial community structure will also affect bacterial metabolic function. In this study, we concentrated on functional groups related to genomes of carbon and nitrogen cycling. On one hand, we discuss functional genomes related to the carbon cycle. Under the warming trend, chemoheterotrophy and aerobic chemoheterotrophy in water column showed a decreasing trend, which may be related to the temperature conversion and physiological adaptation of the bacterial community [79]. Chemoheterotrophy and aerobic chemoheterotrophy include a wide range of ecosystem functions [79,80]; many of the activities they perform can be completed by most microorganisms [81], and they are also the main functional groups in water column and sediment. This co-occurrence pattern for the bacterial network was also in accordance with the result of potential functions [82], where the dominant chemoheterotrophy function was lower under warming conditions and warming instead promotes the development of functional groups related to carbon synthesis in water (phototrophy, photoautotrophy, aerobic photoautotrophy and cyanobacteria) to enhance autotrophy. The reason for this may be that a higher temperature leads to a higher reproduction speed and cell density for phytoplankton [83], which is more evident in eutrophic lakes during hot summers [84]. A mesocosm experiment in a stream found the same result: that the potential for autumnal heatwave events to motivate autotrophic biofilm growth in rivers [39] and productivity enhancement are more related to resource use efficiency [85]. The sediment is mainly composed of functional groups related to carbon decomposition, such as chemoheterotrophy, aerobic chemoheterotrophy and fermentation. In summer and autumn, the changing trend of functional groups under the two heating treatments is the same, while in winter and spring, the changing trend of functional groups under the two heating treatments is not completely consistent, which may be due to the low temperature in winter and spring and the limited temperature tolerance of bacterial communities in sediment [86,87].
On the other hand, we discuss the relevant functional genomes of the nitrogen cycle. In our study, we also found that warming enhanced the microbial function of nitrate reduction and nitrate respiration, as well as nitrogen fixation and nitrogen respiration, in spring, summer and autumn. As higher temperatures increase the activity of denitrifying microorganisms, and promote denitrifying bacteria to convert oxidized inorganic N, often as NO3, to N2 gas, the resulting N2 can be compensated by nitrogen fixation [88]. Temperature is one of the key factors affecting the denitrification process in most studies [89,90]. The acceleration of denitrification by warming [91] and the relevant data confirm that there are differences in denitrification potential in different seasons [89]. In winter, nitrogen fixation and nitrate reduction capacity decreased under the warming treatments during our experiment, which is perhaps due to the relative abundance of the dominant bacteria Proteobacteria and Bacteroidetes in winter, which greately reduce under the influence of temperature [51]. The competitive advantage between microorganisms changes under conditions such as temperature changes [86,87]. In contrast with the effect of warming, dissolved oxygen also changes the nitrogen cycle in water and sediment [92]. A previous study found that extreme hypoxia under high algal biomass significantly restricted nitrification, which, in turn, limited denitrification due to the lack of available substrates [93]. However, our results showed that nitrite oxidation and nitrification are the main bacterial functions related to nitrogen synthesis in sediment, and warming significantly enhanced nitrite oxidation and nitrification function in winter. The reason for this may be that warming accelerated the growth and senescence of Potamogeton crispus suggesting a more important role in maintaining the clear water state in our experimental system from winter to early spring [43]. Simultaneously, aquatic plants can transport oxygen to roots, increasing the oxygen supply [92,94] and stimulating microbial activity in the root zone to enhance nitrification [95]. Therefore, the effect of temperature on the nitrogen conversion process is complex, because the nitrogen conversion processes and rates in different periods in sediment are also affected by sedimentary physical and chemical factors [93,96,97].
Our results also found that warming had a stronger stimulating effect on bacterial function groups in water column and sediment in colder seasons (such as spring and winter), which also confirmed the second hypothesis. Although a previous study predicted that an increase in temperature will stimulate the decomposition process and algae production, the difference in seasonal factors seems to be more decisive than the temperature itself [98]. The bacterial community is more affected by temperature only in areas where the water temperature remains low in winter [83]. In the river control experiment, seasonal temperature rises had a greater influence on microbial decomposers than similar experimental warming [99]. At the same time, we also found that sediment was more affected by climate change than water column in the metabolic functions of bacteria related to the carbon and nitrogen cycles. The high concentration of substrate and nutrients in sediment constrains the enzyme’s response to temperature [100]. Heat waves can stimulate an increase in bacterial abundance, and this change is more pronounced in sediment, a nutrient-rich substrate [14]. This can also explain why the stimulation of warming in sediment is stronger than that in water, which is possibly because sediment has a higher nutrient level. However, the water in the tank has strong fluidity, the turnover rate of microorganisms is fast [101], and the impact of other physical and chemical factors in water and the redundancy of bacterial function result in a less obvious temperature response in the water than in sediment [102,103,104]. For bacteria, the basal metabolic rate increases with the increase in temperature and the energy requirement also increases with increasing basal metabolic rate [105,106]. At the same time, sediments are also rich in nutrients, which are conducive to the growth of microorganisms, leading to changes in bacterial community composition, an increased growth rate and a shortened response time [107].
Finally, our results also suggest that variable warming does indeed stimulate more seasonal biogeochemical-cycling-related bacterial functions than constant warming. Extreme climate can change several ecological processes in ecosystems, such as primary productivity [108] or nutrient cycling [109]. We found that, in the bacterial functional groups (chemoheterotrophy and aerobic chemoheterotrophy) mainly related to carbon decomposition in water column in spring and sediment in winter, decomposition significantly decreased under the stimulation of heat waves. The reason for this may be that the main microbial functional groups that maintain chemotrophy and aerobic chemoheterotrophy functions stimulated by fluctuating temperature rise have a limited tolerance to temperature [86,87], and microflora cannot adapt to short-term and large temperature fluctuations [14]. Correa-Araneda et al. (2020) also found that short-term extreme temperature changes will slow the decomposition of litter in rivers [110]. Previous experiments that applied constant warming would increase the metabolic rate of microorganisms and promote the decomposition of microorganisms [98,111]. However, since the increase in average temperature may have more complex effects on microbial community composition and physiological tolerance [101], a longer-term study is needed to explore the differences in the effects of average temperature and extreme temperature on microorganisms. In the study of bacterial functions related to nitrogen cycle, we found that the nitrogen cycling process in water and sediment significantly increased under variable warming. Under heat waves, denitrification responded strongly in water column in autumn and winter, and nitrification significantly increased in sediment in winter, indicating that both nitrification and denitrification responded positively to heat waves. A high temperature can promote the rate of nitrification and denitrification [112], and the increase in nitrification may be due to the oxygen provided by the growth of Potamogeton crispus in winter to promote the nitrification of microorganisms in the root zone. Rysgaard et al. (2003) believed that when oxygen was less than 9.6 mg/L, the increase in oxygen would promote the occurrence of nitrification [113]. Zhan et al. (2021) also found a positive response of nitrification to increasing temperature [114]. The increased metabolic process of denitrifying bacteria in the water may be due to the change in the dominant flora in bacteria under heat waves stimulation [82]. Increased nitrification in sediments also increases substrate availability and facilitates denitrification in water [115]. Studies on freshwater ecosystems have shown that, under warming scenarios, denitrification will be promoted and greenhouse gas emissions will increase [116], and eutrophication systems have higher greenhouse gas emissions [117]. To date, studies exploring heat wave effects on the nitrogen cycle have been rare, leading to high uncertainty when assessing the integrated responses of the nitrogen cycle to heat waves.

5. Conclusions

Our results showed that warming changed bacterial functional potentials that were important to the biogeochemical cycling in shallow-lake mesocosms during the low-temperature period. Simultaneously, we also found that sediment was more affected by warming than water column in the metabolic functions of bacteria related to the carbon and nitrogen cycles. The variable warming stimulated more seasonal biogeochemical cycling related bacterial functions than constant warming. The effect of different bacteria metabolism functions in water column and sediment promoted the carbon synthesis pathway and weakened the degradation pathway, and may change the carbon fluxes in the experimental mesocosms. Meanwhile, in water column, variable warming led to a significant reduction in nitrogen fixation ability in winter. Variable warming significantly promoted nitrite oxidation and nitrification function in winter, and constant warming significantly inhibited in spring with the control in sediments. Lake ecosystems can act jointly to resist the effects of climate warming through the coupling between the microbial functions of the water column and the sediment. This paper emphasized the necessity of further improving and applying the microbial function related to nutrient biogeochemical cycle to explore the microbial mechanisms and better understand the aquatic ecosystem’s responses and feedback to climate warming.

Supplementary Materials

The following supporting information can be downloaded at: https://www.mdpi.com/article/10.3390/w14081203/s1, Table S1: Topological properties of co-occurrence network of bacterial function related to the carbon cycle in water and sediment; Table S2: Topological properties of co-occurrence network of bacterial function related to the nitrogen cycle in water and sediment; Table S3: The bacterial function related to the carbon cycle; Table S4: The bacterial function related to the nitrogen cycle.

Author Contributions

Conceptualization, M.Z. and P.S.; methodology, M.Z., P.S. and H.W.; software, P.S., M.F., H.C., Y.Y. and Q.Y.; validation, M.Z., P.S. and H.W.; formal analysis, M.Z., P.S., H.W. and J.X.; investigation, P.S., H.W., M.F. and H.C.; resources, M.Z.; data curation, P.S. and H.W.; writing—original draft preparation, P.S.; writing—review and editing, M.Z., H.W. and J.X.; visualization, P.S.; supervision, M.Z.; project administration, M.Z.; funding acquisition, M.Z. All authors have read and agreed to the published version of the manuscript.

Funding

This research was supported by the National Key R&D Program of China (Grant No. 2018YFD0900904 and 2019YFD0900601), and the International Cooperation Project of the Chinese Academy of Sciences (Grant No. 152342KYSB20190025).

Institutional Review Board Statement

Not applicable.

Informed Consent Statement

Not applicable.

Data Availability Statement

Not applicable.

Acknowledgments

We thank Huan Zhang and Peiyu Zhang for suggestions during the experiment. We also thank Meng Pan and Bowen Hu for their kind help during the experiment.

Conflicts of Interest

The authors declare no conflict of interest.

References

  1. IPCC. Climate Change 2013: The Physical Science Basis. Contribution of Working Group I to the Fifth Assessment Report of the Intergovernmental Panel on Climate Change; Tignor, M., Allen, S., Boschung, J., Nauels, A., Xia, Y., Bex, V., Pm, M., Eds.; Cambridge University Press: New York, NY, USA, 2013; p. 1535. [Google Scholar]
  2. O’Reilly, C.M.; Sharma, S.; Gray, D.K.; Hampton, S.E.; Read, J.S.; Rowley, R.J.; Schneider, P.; Lenters, J.D.; McIntyre, P.B.; Kraemer, B.M.; et al. Rapid and highly variable warming of lake surface waters around the globe. Geophys. Res. Lett. 2015, 42, 773–781. [Google Scholar] [CrossRef] [Green Version]
  3. Seneviratne, S.I.; Donat, M.G.; Mueller, B.; Alexander, L.V. No pause in the increase of hot temperature extremes. Nat. Clim. Chang. 2014, 4, 161–163. [Google Scholar] [CrossRef]
  4. Davidson, T.A.; Audet, J.; Jeppesen, E.; Landkildehus, F.; Lauridsen, T.L.; Søndergaard, M.; Syväranta, J. Synergy between nutrients and warming enhances methane ebullition from experimental lakes. Nat. Clim. Chang. 2018, 8, 156–160. [Google Scholar] [CrossRef]
  5. Downing, J.A.; Prairie, Y.T.; Cole, J.J.; Duarte, C.M.; Tranvik, L.J.; Striegl, R.G.; McDowell, W.H.; Kortelainen, P.; Caraco, N.F.; Melack, J.M.; et al. The global abundance and size distribution of lakes, ponds, and impoundments. Limnol. Oceanogr. 2006, 51, 2388–2397. [Google Scholar] [CrossRef] [Green Version]
  6. Li, Z.; He, L.; Zhang, H.; Urrutia-Cordero, P.; Ekvall, M.K.; Hollander, J.; Hansson, L.A. Climate warming and heat waves affect reproductive strategies and interactions between submerged macrophytes. Glob. Chang. Biol. 2016, 23, 108–116. [Google Scholar] [CrossRef] [PubMed]
  7. Praetzel, L.S.E.; Schmiedeskamp, M.; Knorr, K. Temperature and sediment properties drive spatiotemporal variability of methane ebullition in a small and shallow temperate lake. Limnol. Oceanogr. 2021, 66, 2598–2610. [Google Scholar] [CrossRef]
  8. Parmesan, C. Ecological and Evolutionary Responses to Recent Climate Change. Annu. Rev. Ecol. Evol. Syst. 2006, 37, 637–669. [Google Scholar] [CrossRef] [Green Version]
  9. Reyer, C.P.O.; Leuzinger, S.; Rammig, A.; Wolf, A.; Bartholomeus, R.P.; Bonfante, A.; De Lorenzi, F.; Dury, M.; Gloning, P.; Jaoudé, R.A.; et al. A plant’s perspective of extremes: Terrestrial plant responses to changing climatic variability. Glob. Chang. Biol. 2012, 19, 75–89. [Google Scholar] [CrossRef]
  10. Woodward, G.; Perkins, D.M.; Brown, L.E. Climate change and freshwater ecosystems: Impacts across multiple levels of organization. Philos. Trans. R. Soc. Lond. B Biol. Sci. 2010, 365, 2093–2106. [Google Scholar] [CrossRef] [Green Version]
  11. Newton, R.J.; Jones, S.E.; Eiler, A.; Mcmahon, K.D.; Bertilsson, S. A guide to the natural history of freshwater lake bacteria. Microbiol. Mol. Biol. Rev. 2011, 75, 14–49. [Google Scholar] [CrossRef] [PubMed] [Green Version]
  12. Macarena, M.; Jeannette, V. Microorganisms that participate in biochemical cycles in wetlands. Can. J. Microbiol. 2021, 67, 771–788. [Google Scholar] [CrossRef]
  13. Zhang, L.; Lv, J. Land-use change from cropland to plantations affects the abundance of nitrogen cycle-related microorganisms and genes in the Loess Plateau of China. Appl. Soil Ecol. 2021, 161, 103873. [Google Scholar] [CrossRef]
  14. Zingel, P.; Cremona, F.; Nõges, T.; Cao, Y.; Neif, É.; Coppens, J.; Işkın, U.; Lauridsen, T.L.; Davidson, T.A.; Søndergaard, M. Effects of warming and nutrients on the microbial food web in shallow lake mesocosms. Eur. J. Protistol. 2018, 64, 1–12. [Google Scholar] [CrossRef] [PubMed]
  15. Ren, L.; Liu, Y.; Lauridsen, T.L.; Sndergaard, M.; Han, B.; Wang, J.; Jeppesen, E.; Zhou, J.; Wu, Q.L. Warming exacerbates the impact of nutrient enrichment on microbial functional potentials important to the nutrient cycling in shallow lake mesocosms. Limnol. Oceanogr. 2021, 66, 2481–2495. [Google Scholar] [CrossRef]
  16. Fierer, N.; Ladau, J.; Clemente, J.C.; Leff, J.W.; Owens, S.M.; Pollard, K.S.; Knight, R.; Gilbert, J.A.; Mcculley, R.L. Reconstructing the Microbial Diversity and Function of Pre-Agricultural Tallgrass Prairie Soils in the United States. Science 2013, 342, 621–624. [Google Scholar] [CrossRef] [Green Version]
  17. Gibbons, S.M. Microbial community ecology: Function over phylogeny. Nat. Ecol. Evol. 2017, 1, 32. [Google Scholar] [CrossRef] [PubMed]
  18. Louca, S.; Parfrey, L.W.; Doebeli, M. Decoupling function and taxonomy in the global ocean microbiome. Science 2016, 353, 1272–1277. [Google Scholar] [CrossRef] [PubMed]
  19. Nelson, M.B.; Martiny, A.C.; Martiny, J.B.H. Global biogeography of microbial nitrogen-cycling traits in soil. Proc. Natl. Acad. Sci. USA 2016, 113, 8033–8040. [Google Scholar] [CrossRef] [Green Version]
  20. Coles, V.J.; Stukel, M.R.; Brooks, M.T.; Burd, A.; Crump, B.C.; Moran, M.A.; Paul, J.H.; Satinsky, B.M.; Yager, P.L.; Zielinski, B.L. Ocean biogeochemistry modeled with emergent trait-based genomics. Science 2017, 358, 1149–1154. [Google Scholar] [CrossRef] [PubMed] [Green Version]
  21. Vanwonterghem, I.; Jensen, P.D.; Rabaey, K.; Tyson, G.W. Genome-centric resolution of microbial diversity, metabolism and interactions in anaerobic digestion. Environ. Microbiol. 2016, 18, 3144–3158. [Google Scholar] [CrossRef] [PubMed]
  22. Louca, S.; Doebeli, M. Taxonomic variability and functional stability in microbial communities infected by phages. Environ. Microbiol. 2017, 19, 3863–3878. [Google Scholar] [CrossRef] [PubMed]
  23. Barberán, A.; Fernández-Guerra, A.; Bohannan, B.; Casamayor, E.O. Exploration of community traits as ecological markers in microbial metagenomes. Mol. Ecol. 2012, 21, 1909–1917. [Google Scholar] [CrossRef] [PubMed]
  24. O’Connor, M.I.; Piehler, M.F.; Leech, D.M.; Anton, A.; Bruno, J.F. Warming and Resource Availability Shift Food Web Structure and Metabolism. PLoS Biol. 2009, 7, 1000178. [Google Scholar] [CrossRef]
  25. Özen, A.; Šorf, M.; Trochine, C.; Liboriussen, L.; Jeppesen, E. Long-term effects of warming and nutrients on microbes and other plankton in mesocosms. Freshw. Biol. 2013, 58, 483–493. [Google Scholar] [CrossRef]
  26. Posch, T.; Köster, O.; Salcher, M.M.; Pernthaler, J. Harmful filamentous cyanobacteria favoured by reduced water turnover with lake warming. Nat. Clim. Chang. 2012, 2, 809–813. [Google Scholar] [CrossRef] [Green Version]
  27. Zhang, L.; Shen, T.; Cheng, Y.; Zhao, T.; Qi, P. Temporal and spatial variations in the bacterial community composition in Lake Bosten, a large, brackish lake in China. Sci. Rep. 2020, 10, 304. [Google Scholar] [CrossRef] [Green Version]
  28. Li, X.; Zhang, M.; Liu, F.; Chen, L.; Li, Y.; Li, Y.; Xiao, R.; Wu, J. Seasonality distribution of the abundance and activity of nitrification and denitrification microorganisms in sediments of surface flow constructed wetlands planted with Myriophyllum elatinoides during swine wastewater treatment. Bioresour. Technol. 2018, 248, 89–97. [Google Scholar] [CrossRef] [PubMed]
  29. Zhang, S.; Wang, Y.; He, W.; Wu, M.; Xing, M.; Yang, J.; Gao, N.; Pan, M. Impacts of temperature and nitrifying community on nitrification kinetics in a moving-bed biofilm reactor treating polluted raw water. Chem. Eng. J. 2014, 236, 242–250. [Google Scholar] [CrossRef]
  30. Cavicchioli, R.; Ripple, W.J.; Timmis, K.N.; Azam, F.; Bakken, L.R.; Baylis, M.; Behrenfeld, M.J.; Boetius, A.; Boyd, P.W.; Classen, A.T.; et al. Scientists’ warning to humanity: Microorganisms and climate change. Nat. Rev. Microbiol. 2019, 17, 569–586. [Google Scholar] [CrossRef] [PubMed] [Green Version]
  31. Chatterjee, D.; Saha, S. Response of Soil Properties and Soil Microbial Communities to the Projected Climate Change. In Advances in Crop Environment Interaction; Springer: Singapore, 2018; pp. 87–136. [Google Scholar]
  32. Zhou, X.; Li, B.; Wei, J.; Ye, Y.; Lu, C. Temperature Influenced the Comammox Community Composition in Drinking Water and Wastewater Treatment Plants. Microb. Ecol. 2021, 82, 870–884. [Google Scholar] [CrossRef] [PubMed]
  33. Zhang, Q.; Li, Y.; He, Y.; Brookes, P.C.; Xu, J. Elevated temperature increased nitrification activity by stimulating AOB growth and activity in an acidic paddy soil. Plant Soil 2019, 445, 71–83. [Google Scholar] [CrossRef]
  34. Razavi, B.S.; Liu, S.; Kuzyakov, Y. Hot experience for cold-adapted microorganisms: Temperature sensitivity of soil enzymes. Soil Biol. Biochem. 2017, 105, 236–243. [Google Scholar] [CrossRef]
  35. Minett, D.A.; Cook, P.L.M.; Kessler, A.J.; Cavagnaro, T.R. Root effects on the spatial and temporal dynamics of oxygen in sand-based laboratory-scale constructed biofilters. Ecol. Eng. 2013, 58, 414–422. [Google Scholar] [CrossRef]
  36. Thompson, R.M.; Beardall, J.; Beringer, J.; Grace, M.; Sardina, P.; Lloret, F. Means and extremes: Building variability into community-level climate change experiments. Ecol. Lett. 2013, 16, 799–806. [Google Scholar] [CrossRef] [PubMed]
  37. Frank, D.; Reichstein, M.; Bahn, M.; Thonicke, K.; Frank, D.; Mahecha, M.D.; Smith, P.; van der Velde, M.; Vicca, S.; Babst, F.; et al. Effects of climate extremes on the terrestrial carbon cycle: Concepts, processes and potential future impacts. Glob. Chang. Biol. 2015, 21, 2861–2880. [Google Scholar] [CrossRef] [PubMed] [Green Version]
  38. Audet, J.; Neif, É.M.; Cao, Y.; Hoffmann, C.C.; Lauridsen, T.L.; Larsen, S.E.; Søndergaard, M.; Jeppesen, E.; Davidson, T.A. Heat-wave effects on greenhouse gas emissions from shallow lake mesocosms. Freshw. Biol. 2017, 62, 1130–1142. [Google Scholar] [CrossRef]
  39. Font, R.A.; Khamis, K.; Milner, A.M.; Smith, G.; Ledger, M.E. Low flow and heatwaves alter ecosystem functioning in a stream mesocosm experiment. Sci. Total Environ. 2021, 777, 146067. [Google Scholar] [CrossRef] [PubMed]
  40. Misson, L.; Degueldre, D.; Collin, C.; Rodriguez, R.; Rocheteau, A.; Ourcival, J.M.; Rambal, S. Phenological responses to extreme droughts in a Mediterranean forest. Glob. Chang. Biol. 2011, 17, 1036–1048. [Google Scholar] [CrossRef]
  41. Zhang, P.; Zhang, H.; Wang, H.; Hilt, S.; Li, C.; Yu, C.; Zhang, M.; Xu, J. Warming alters juvenile carp effects on macrophytes resulting in a shift to turbid conditions in freshwater mesocosms. J. Appl. Ecol. 2022, 59, 165–175. [Google Scholar] [CrossRef]
  42. Wu, L.; Yang, F.; Feng, J.; Tao, X.; Qi, Q.; Wang, C.; Schuur, E.A.G.; Bracho, R.; Huang, Y.; Cole, J.R.; et al. Permafrost thaw with warming reduces microbial metabolic capacities in subsurface soils. Mol. Ecol. 2022, 31, 1403–1415. [Google Scholar] [CrossRef] [PubMed]
  43. Xu, J.; Wang, T.; Molinos, J.G.; Li, C.; Hu, B.; Pan, M.; Zhang, M. Effects of warming, climate extremes and phosphorus enrichment on the growth, sexual reproduction and propagule carbon and nitrogen stoichiometry of Potamogeton crispus L. Environ. Int. 2020, 137, 105502. [Google Scholar] [CrossRef]
  44. Diehl, S.; Berger, S.A.; Uszko, W.; Stibor, H. Stoichiometric mismatch causes a warming-induced regime shift in experimental plankton communities. Ecology 2022, e3674. [Google Scholar] [CrossRef] [PubMed]
  45. Moran, R.; Harvey, I.; Moss, B.; Feuchtmayr, H.; Hatton, K.; Heyes, T.; Atkinson, D. Influence of simulated climate change and eutrophication on three-spined stickleback populations: A large scale mesocosm experiment. Freshw. Biol. 2010, 55, 315–325. [Google Scholar] [CrossRef]
  46. Demko, A.M.; Patin, N.V.; Jensen, P.R. Microbial diversity in tropical marine sediments assessed using culture-dependent and culture-independent techniques. Environ. Microbiol. 2021, 23, 6859–6875. [Google Scholar] [CrossRef] [PubMed]
  47. Liao, B.; Yan, X.; Zhang, J.; Chen, M.; Li, Y.; Huang, J.; Lei, M.; He, H.; Wang, J. Microbial community composition in alpine lake sediments from the Hengduan Mountains. MicrobiologyOpen 2019, 8, e00832. [Google Scholar] [CrossRef] [PubMed]
  48. Langille, M.G.I.; Zaneveld, J.; Caporaso, J.G.; Mcdonald, D.; Knights, D.; Reyes, J.A.; Clemente, J.C.; Burkepile, D.E.; Vega Thurber, R.L.; Knightet, R. Predictive functional profiling of microbial communities using 16S rRNA marker gene sequences. Naturebiotechnology 2013, 31, 814–821. [Google Scholar] [CrossRef] [PubMed]
  49. Ward, T.; Larson, J.; Meulemans, J.; Hillmann, B.; Lynch, J.; Sidiropoulos, D.; Spear, J.R.; Caporaso, G.; Blekhman, R.; Knight, R.; et al. BugBase predicts organism-level microbiome phenotypes. bioRxiv 2017, 133462. [Google Scholar]
  50. Aßhauer, K.; Wemheuer, B.; Daniel, R.; Peter, M. Tax4Fun: Predicting functional profiles from metagenomic 16S rRNA data. Bioinformatics 2015, 31, 2882–2884. [Google Scholar] [CrossRef]
  51. Pan, M.; Wang, T.; Hu, B.W.; Shi, P.L.; Xu, J.; Zhang, M. Mesocosm Experiments Reveal Global Warming Accelerates Macrophytes Litter Decomposition and Alters Decomposition-Related Bacteria Community Structure. Water 2021, 13, 1940. [Google Scholar] [CrossRef]
  52. Ren, L.; He, D.; Chen, Z.; Jeppesen, E.; Lauridsen, T.L.; Sondergaard, M.; Liu, Z.; Wu, Q.L. Warming and nutrient enrichment in combination increase stochasticity and beta diversity of bacterioplankton assemblages across freshwater mesocosms. ISME J. 2017, 11, 613–625. [Google Scholar] [CrossRef] [PubMed] [Green Version]
  53. Chen, J.; Luo, Y.; Xia, J.; Jiang, L.; Zhou, X.; Lu, M.; Liang, J.; Shi, Z.; Shelton, S.; Cao, J. Stronger warming effects on microbial abundances in colder regions. Sci. Rep. 2015, 5, 18032. [Google Scholar] [CrossRef] [PubMed] [Green Version]
  54. Xing, P.; Tao, Y.; Jeppesen, E.; Wu, Q.L. Comparing microbial composition and diversity in freshwater lakes between Greenland and the Tibetan Plateau. Limnol. Oceanogr. 2021, 66, S142–S156. [Google Scholar] [CrossRef]
  55. Dong, W.; Min, S.; Tang, L.; Zeng, Q.; Yang, J.; Yao, M. Research of Eutrophication of Honghu Lake and Liangzi Lake. Environ. Prot. Sci. 2016, 42, 66–70. [Google Scholar]
  56. Li, C.; Wang, T.; Zhang, M.; Xu, J. Maternal Environment Effect of Warming and Eutrophication on the Emergence of Curled Pondweed, Potamogeton crispus L. Water 2018, 10, 1285. [Google Scholar] [CrossRef] [Green Version]
  57. Guo, X.; Huang, J.; Luo, Y.; Zhao, Z.; Xu, Y. Projection of heat waves over China for eight different global warming targets using 12 CMIP5 models. Theor. Appl. Climatol. 2017, 128, 507–522. [Google Scholar] [CrossRef]
  58. Jin, X.C.; Tu, Q.Y. Investigation Specifications for Lake Eutrophication, 2nd ed.; China Environmental Science Press: Beijing, China, 1990. [Google Scholar]
  59. Murphy, J.; Riley, J.P. A modified single solution method for the determination of phosphate in natural waters. Anal. Chim. Acta 1962, 27, 31–36. [Google Scholar] [CrossRef]
  60. Jespersen, A.; Christoffersen, K.J. Measurements of chlorophyll-a from phytoplankton using ethanol as extraction solvent. Arch. Hydrobiol. 1987, 109, 445–454. [Google Scholar]
  61. Mori, H.; Maruyama, F.; Kato, H.; Toyoda, A.; Dozono, A.; Ohtsubo, Y.; Nagata, Y.; Fujiyama, A.; Tsuda, M.; Kurokawa, K. Design and Experimental Application of a Novel Non-Degenerate Universal Primer Set that Amplifies Prokaryotic 16S rRNA Genes with a Low Possibility to Amplify Eukaryotic rRNA Genes. DNA Res. 2014, 21, 217–227. [Google Scholar] [CrossRef] [PubMed]
  62. Chen, S.; Zhou, Y.; Chen, Y.; Jia, G. fastp: An ultra-fast all-in-one FASTQ preprocessor. Bioinformatics 2018, 34, i884–i890. [Google Scholar] [CrossRef]
  63. Magoč, T.; Salzberg, S.L. FLASH: Fast Length Adjustment of Short Reads to Improve Genome Assemblies. Bioinformatics 2011, 27, 2957–2963. [Google Scholar] [CrossRef] [PubMed]
  64. Schloss, P.D.; Handelsman, J. Introducing DOTUR, a Computer Program for Defining Operational Taxonomic Units and Estimating Species Richness. Appl. Environ. Microb. 2005, 71, 1501–1506. [Google Scholar] [CrossRef] [PubMed] [Green Version]
  65. Picazo, A.; Villaescusa, J.A.; Rochera, C.; Miralles-Lorenzo, J.; Quesada, A.; Camacho, A. Functional Metabolic Diversity of Bacterioplankton in Maritime Antarctic Lakes. Microorganisms 2021, 9, 2077. [Google Scholar] [CrossRef] [PubMed]
  66. Liang, S.; Deng, J.; Jiang, Y.; Wu, S.; Zhou, Y.; Zhu, W. Functional Distribution of Bacterial Community under Different Land Use Patterns Based on FaProTax Function Prediction. Pol. J. Environ. Stud. 2020, 29, 1245–1261. [Google Scholar] [CrossRef]
  67. Wei, H.; Peng, C.; Yang, B.; Song, H.; Li, Q.; Jiang, L.; Wei, G.; Wang, K.; Wang, H.; Liu, S.; et al. Contrasting Soil Bacterial Community, Diversity, and Function in Two Forests in China. Front. Microbiol. 2018, 9, 1693. [Google Scholar] [CrossRef] [PubMed]
  68. Barberan, A.; Bates, S.T.; Casamayor, E.O.; Fiere, N. Using network analysis to explore co-occurrence patterns in soil microbial communities. ISME J. 2012, 6, 343–351. [Google Scholar] [CrossRef] [PubMed] [Green Version]
  69. Zhang, K.; Shi, Y.; Jing, X.; He, J.-S.; Sun, R.; Yang, Y.; Shade, A.; Chu, H. Effects of Short-Term Warming and Altered Precipitation on Soil Microbial Communities in Alpine Grassland of the Tibetan Plateau. Front. Microbiol. 2016, 7, 1032. [Google Scholar] [CrossRef] [PubMed] [Green Version]
  70. Tu, Q.; Yan, Q.; Deng, Y.; Michaletz, S.T.; Zhou, J. Biogeographic patterns of microbial co-occurrence ecological networks in six American forests. Soil Biol. Biochem. 2020, 148, 107897. [Google Scholar] [CrossRef]
  71. Jiao, S.; Yang, Y.; Xu, Y.; Zhang, J.; Lu, Y. Balance between community assembly processes mediates species coexistence in agricultural soil microbiomes across eastern China. ISME J. 2020, 14, 202–216. [Google Scholar] [CrossRef]
  72. Newman, M. Modularity and community structure in networks. Proc. Natl. Acad. Sci. USA 2006, 103, 8577–8582. [Google Scholar] [CrossRef] [PubMed] [Green Version]
  73. Benjamini, Y.; Hochberg, Y. Controlling the False Discovery Rate: A Practical and Powerful Approach to Multiple Testing. J. R. Stat. Soc. 1995, 57, 289–300. [Google Scholar] [CrossRef]
  74. Bastian, M.; Heymann, S.; Jacomy, M. Gephi: An Open Source Software for Exploring and Manipulating Networks. ICWSM 2009, 3, 361–362. [Google Scholar]
  75. Bates, D.; Mächler, M.; Bolker, B.; Walker, S. Fitting Linear Mixed-Effects Models Using lme4. Statistics and Computing. arXiv 2014, arXiv:14065823. [Google Scholar]
  76. Lenth, R.; Singmann, H.; Love, J.; Buerkner, P.; Herve, M. Package “Emmeans”. R Package Version 4.0-3. 2018. Available online: http://cran.r-project.org/package=emmeans (accessed on 15 February 2021).
  77. Budy, P.; Pennock, C.A.; Giblin, A.E.; Luecke, C.; Kling, G.W. Understanding the effects of climate change via disturbance on pristine arctic lakes-multitrophic level response and recovery to a 12-yr, low-level fertilization experiment. Limnol. Oceanogr. 2021, 67, S224–S241. [Google Scholar] [CrossRef]
  78. Belle, S.; Tõnno, I.; Vrede, T.; Freiberg, R.; Nilsson, J.L.; Goedkoop, W. Both climate trends and short-term fluctuations affected algae–zooplankton interactions in a boreal lake during the late Holocene. Freshwater Biol. 2021, 66, 2076–2085. [Google Scholar] [CrossRef]
  79. Wei, Z.; Liu, Y.; Kai, F.; Li, S.; Shang, W.; Jin, D.; Yu, Z.; Chen, H.; Yin, H.; Xu, M. The divergence between fungal and bacterial communities in seasonal and spatial variations of wastewater treatment plants. Sci. Total Environ. 2018, 628, 969–978. [Google Scholar] [CrossRef] [PubMed]
  80. Luo, X.; Xiang, X.; Yang, Y.; Huang, G.; Fu, K.; Che, R.; Chen, L. Seasonal effects of river flow on microbial community coalescence and diversity in a riverine network. FEMS Microbiol. Ecol. 2020, 96, fiaa132. [Google Scholar] [CrossRef]
  81. Rivett, D.W.; Bell, T. Abundance determines the functional role of bacterial phylotypes in complex communities. Nat. Microbiol. 2018, 3, 767–772. [Google Scholar] [CrossRef]
  82. Pan, M. Effects of Climate Warming on Aquatic Bacterial Community Structure and Decomposition of Submerged Macrophytes Litter. Master Thesis, HuaZhong Agricultural University, Wuhan, China, 2021. [Google Scholar]
  83. Dutta, H.; Dutta, A. The microbial aspect of climate change. Energy Ecol. Environ. 2016, 1, 209–232. [Google Scholar] [CrossRef] [Green Version]
  84. Hasler, C.T.; Butman, D.; Jeffrey, J.D.; Suski, C.D. Freshwater biota and rising pCO2? Ecol. Lett. 2015, 19, 98–108. [Google Scholar] [CrossRef] [PubMed]
  85. Hood, J.M.; Benstead, J.P.; Cross, W.F.; Huryn, A.D.; Johnson, P.W.; Gíslason, G.M.; Junker, J.R.; Nelson, D.; Ólafsson, J.S.; Tran, C. Increased resource use efficiency amplifies positive response of aquatic primary production to experimental warming. Glob. Chang. Biol. 2018, 24, 1069–1084. [Google Scholar] [CrossRef] [PubMed]
  86. He, S.; Chen, Y.; Qin, M.; Mao, Z.; Yuan, L.; Niu, Q.; Tan, X. Effects of temperature on anammox performance and community structure. Bioresour. Technol. 2018, 260, 186–195. [Google Scholar] [CrossRef] [PubMed]
  87. Eduok, S.; Ferguson, R.; Jefferson, B.; Villa, R.; Coulon, F. Aged-engineered nanoparticles effect on sludge anaerobic digestion performance and associated microbial communities. Sci. Total Environ. 2017, 609, 232–241. [Google Scholar] [CrossRef] [PubMed] [Green Version]
  88. Loeks-Johnson, B.M.; Cotner, J.B. Upper Midwest lakes are supersaturated with N2. Proc. Natl. Acad. Sci. USA 2020, 117, 17063–17067. [Google Scholar] [CrossRef] [PubMed]
  89. Wang, X.; Hu, M.; Ren, H.; Li, J.; Tong, C.; Musenze, R.S. Seasonal variations of nitrous oxide fluxes and soil denitrification rates in subtropical freshwater and brackish tidal marshes of the Min River estuary. Sci. Total Environ. 2018, 616–617, 1404–1413. [Google Scholar] [CrossRef] [PubMed]
  90. De Klein, J.J.M.; Overbeek, C.C.; Juncher Jrgensen, C.; Veraart, A.J. Effect of Temperature on Oxygen Profiles and Denitrification Rates in Freshwater Sediments. Wetlands 2017, 37, 975–983. [Google Scholar] [CrossRef] [Green Version]
  91. Wu, J.; Chen, N.; Hong, H.; Lu, T.; Wang, L.; Chen, Z. Direct measurement of dissolved N2 and denitrification along a subtropical river-estuary gradient, China. Mar. Pollut. Bull. 2013, 66, 125–134. [Google Scholar] [CrossRef] [PubMed]
  92. Sand-Jensen, K.; Prahl, C.; Stokholm, H. Oxygen release from roots of submerged aquatic macrophytes. Oikos 1982, 38, 349–354. [Google Scholar] [CrossRef]
  93. Yao, Y.; Liu, H.; Han, R.; Li, D.; Zhang, L. Identifying the Mechanisms behind the Positive Feedback Loop between Nitrogen Cycling and Algal Blooms in a Shallow Eutrophic Lake. Water 2021, 13, 524. [Google Scholar] [CrossRef]
  94. Deng, H.; Zhang, J.; Wu, J.; Yao, X.; Yang, L. Biological denitrification in a macrophytic lake: Implications for macrophytes-dominated lake management in the north of China. Environ. Sci. Pollut. Res. 2020, 27, 42460–42471. [Google Scholar] [CrossRef] [PubMed]
  95. Zhu, L.; Shi, W.; Zhou, J.; Yu, J.; Qin, B. Strong turbulence accelerates sediment nitrification-denitrification for nitrogen loss in shallow lakes. Sci. Total Environ. 2020, 761, 143210. [Google Scholar] [CrossRef]
  96. Wu, H.; Hao, B.; Zhou, Q.; Xu, K.; Liu, G. Contribution of various categories of environmental factors to sediment nitrogen-removal in a low C/N ratio river. Ecol. Eng. 2021, 159, 106121. [Google Scholar] [CrossRef]
  97. Liu, W.; Jiang, X.; Zhang, Q.; Feng, L.; Liu, G. Has Submerged Vegetation Loss Altered Sediment Denitrification, N2O Production, and Denitrifying Microbial Communities in Subtropical Lakes? Glob. Biogeochem. Cycles. 2018, 32, 1195–1207. [Google Scholar] [CrossRef]
  98. Gossiaux, A.; Jabiol, J.; Poupin, P.; Chauvet, E.; Guerold, F. Seasonal variations overwhelm temperature effects on microbial processes in headwater streams: Insights from a temperate thermal spring. Aquat. Sci. 2019, 81, 30. [Google Scholar] [CrossRef] [Green Version]
  99. Duarte, S.; Cássio, S.; Ferreira, V.; Canhoto, C.; Pascoal, C. Seasonal Variability May Affect Microbial Decomposers and Leaf Decomposition More Than Warming in Streams. Microb. Ecol. 2016, 72, 263–276. [Google Scholar] [CrossRef]
  100. Brzostek, E.R.; Finzi, A.C. Seasonal variation in the temperature sensitivity of proteolytic enzyme activity in temperate forest soils. J. Geophys. Res. 2012, 117, 1018. [Google Scholar] [CrossRef] [Green Version]
  101. Berdjeb, L.; Parada, A.; Needham, D.M.; Fuhrman, J.A. Short-term dynamics and interactions of marine protist communities during the spring–summer transition. ISME J. 2018, 12, 1907–1917. [Google Scholar] [CrossRef] [PubMed]
  102. Lindström, E.S.; Feng, X.M.; Graneli, W.; Kritzbergb, E.S. The interplay between bacterial community composition and the environment determining function of inland water bacteria. Limnol. Oceanogr. 2010, 55, 2052–2060. [Google Scholar] [CrossRef]
  103. Barbosa da Costa, N.; Fugère, V.; Hébert, M.P.; Xu, C.C.Y.; Barrett, R.D.H.; Beisner, B.E.; Bell, G.; Yargeau, V.; Fussmann, G.F.; Gonzalez, A.; et al. Resistance, resilience, and functional redundancy of freshwater bacterioplankton communities facing a gradient of agricultural stressors in a mesocosm experiment. Mol. Ecol. 2021, 30, 4771–4788. [Google Scholar] [CrossRef]
  104. Peura, S.; Eiler, A.; Bertilsson, S.; Nykänen, H.; Tiirola, M.; Jones, R. Distinct and diverse anaerobic bacterial communities in boreal lakes dominated by candidate division OD1. ISME J. 2012, 6, 1640–1652. [Google Scholar] [CrossRef]
  105. Smith, T.P.; Clegg, T.; Bell, T.; Pawar, S. Systematic variation in the temperature dependence of bacterial carbon use efficiency. Ecol. Lett. 2021, 24, 2123–2133. [Google Scholar] [CrossRef] [PubMed]
  106. Sinsabaugh, R.L.; Follstad Shah, J.J. Integrating resource utilization and temperature in metabolic scaling of riverine bacterial production. Ecology 2010, 91, 1455–1465. [Google Scholar] [CrossRef] [PubMed]
  107. Degerman, R.; Dinasquet, J.; Riemann, L.; de Luna, S.S.; Andersson, A. Effect of resource availability on bacterial community responses to increased temperature. Aquat. Microb. Ecol. 2013, 68, 131–142. [Google Scholar] [CrossRef] [Green Version]
  108. Ciais, P.; Reichstein, M.; Viovy, N.; Granier, A.; Ogee, J.; Allard, V.; Aubinet, M.; Buchmann, N.; Bernhofer, C.; Carrara, A. Europe-wide reduction in primary productivity caused by the heat and drought in 2003. Nature 2005, 437, 529–533. [Google Scholar] [CrossRef]
  109. Jentsch, A.; Kreyling, J.; Elmer, M.; Gellesch, E.; Glaser, B.; Grant, K.; Hein, R.; Lara, M.; Mirzae, H.; Nadler, S.E. Climate extremes initiate ecosystem-regulating functions while maintaining productivity. J. Ecol. 2011, 99, 689–702. [Google Scholar] [CrossRef]
  110. Correa-Araneda, F.; Tonin, A.M.; Pérez, J.; Álvarez, K.; López-Rojo, N.; Díaz, A.; Esse, C.; Encina-Montoya, F.; Figueroa, R.; Cornejo, A.; et al. Extreme climate events can slow down litter breakdown in streams. Aquat. Sci. 2020, 82, 25. [Google Scholar] [CrossRef]
  111. Martínez, A.; Larrañaga, A.; Pérez, J.; Descals, E.; Pozo, J. Temperature affects leaf litter decomposition in low-order forest streams: Field and microcosm approaches. FEMS Microbiol. Ecol. 2014, 87, 257–267. [Google Scholar] [CrossRef] [PubMed] [Green Version]
  112. Dai, Z.; Yu, M.; Chen, H.; Zhao, H.; Xu, J. Elevated temperature shifts soil N cycling from microbial immobilization to enhanced mineralization, nitrification and denitrification across global terrestrial ecosystems. Glob. Chang. Biol. 2020, 26, 5267–5276. [Google Scholar] [CrossRef]
  113. Rysgaard, S.; Risgaard-Petersen, N.; Peter, S.N.; Kim, J.; Peter, N.L. Oxygen regulation of nitrification and denitrification in sediments. Limnol. Oceanogr. 2003, 39, 1643–1652. [Google Scholar] [CrossRef]
  114. Zhan, Q.; Stratmann, C.N.; van der Geest, H.G.; Veraart, A.J.; Brenzinger, K.; Lürling, M.; de Senerpont Domis, L.N. Effectiveness of phosphorus control under extreme heatwaves: Implications for sediment nutrient releases and greenhouse gas emissions. Biogeochemistry 2021, 156, 421–436. [Google Scholar] [CrossRef]
  115. Hartmann, A.A.; Barnard, R.L.; Marhan, S.; Niklaus, P.A. Effects of drought and N-fertilization on N cycling in two grassland soils. Oecologia 2013, 171, 705–717. [Google Scholar] [CrossRef]
  116. Bergen, T.J.H.M.; Barros, N.; Mendonça, R.; Aben, R.C.H.; Althuizen, I.H.J.; Huszar, V.; Lamers, L.P.M.; Lürling, M.; Roland, F.; Kosten, S. Seasonal and diel variation in greenhouse gas emissions from an urban pond and its major drivers. Limnol. Oceanogr. 2019, 64, 2129–2139. [Google Scholar] [CrossRef]
  117. Peacock, M.; Audet, J.; Jordan, S.; Smeds, J.; Wallin, M.B. Greenhouse gas emissions from urban ponds are driven by nutrient status and hydrology. Ecosphere 2019, 10, e02643. [Google Scholar] [CrossRef]
Figure 1. Water temperature for all treatments during the experiment. C, ambient temperature; T, +4 °C constant warming; V, variable warming.
Water 14 01203 g001
Figure 2. Metabolic function total abundance of bacteria related to the carbon (a) and nitrogen (b) cycle under different treatments in water and sediment. C, ambient temperature; T, +4 °C constant warming; V, variable warming; W, water; S, sediment. All data are presented as the mean ± SE. The letters above the bars represent significant differences between treatments (p < 0.05).
Water 14 01203 g002
Figure 3. Relative functional abundance of bacteria related to carbon cycle in water column (a) and sediment (b), and relative functional abundance of bacteria related to the nitrogen cycle in water column (c) and sediment (d). Figure shows functional groups with more than 85% of the total functional abundance of bacteria. The carbon cycle in the figure is represented by FC1–FC25, and the specific functions are chemoheterotrophy (FC1), aerobic chemoheterotrophy (FC2), phototrophy (FC3), photoautotrophy (FC4), oxygenic photoautotrophy (FC5), methylotrophy (FC6), methanol oxidation (FC7), cyanobacteria (FC8), chloroplasts (FC9), hydrocarbon degradation (FC12), methanotrophy (FC13), and fermentation (FC25). The nitrogen cycle in the figure is represented by FN1-FN13, and the specific functions are nitrogen fixation (FN1), nitrate reduction (FN2), nitrate respiration (FN3), nitrogen respiration (FN4), nitrite respiration (FN5), nitrate denitrification (FN6), nitrite denitrification (FN7), nitrous oxide denitrification (FN8), denitrification (FN9), aerobic nitrite oxidation (FN12), and nitrification (FN13).
Water 14 01203 g003
Figure 4. Columnar difference in bacterial function related to the carbon cycle in water column and sediment. All data are presented as the mean ± SE. The letters above the bars represent significant differences between treatments (p < 0.05). (a), Carbon cycle of water in spring; (b), Carbon cycle of water in summer; (c), Carbon cycle of water in autumn; (d), Carbon cycle of water in winter; (e), Carbon cycle of sediment in spring; (f), Carbon cycle of sediment in summer; (g), Carbon cycle of sediment in autumn; (h), Carbon cycle of sediment in winter. The carbon cycle in the figure is represented by FC1–FC25, and the specific functions are chemoheterotrophy (FC1), aerobic chemoheterotrophy (FC2), phototrophy (FC3), photoautotrophy (FC4), oxygenic photoautotrophy (FC5), methylotrophy (FC6), methanol oxidation (FC7), cyanobacteria (FC8), chloroplasts (FC9), hydrocarbon degradation (FC12), methanotrophy (FC13), and fermentation (FC25).
Water 14 01203 g004
Figure 5. Columnar difference in bacterial function related to the nitrogen cycle in water column and sediment. All data are presented as the mean ± SE. The letters above the bars represent significant differences between treatments (p < 0.05). (a), Nitrogen cycle of water in spring; (b), Nitrogen cycle of water in summer; (c), Nitrogen cycle of water in autumn; (d), Nitrogen cycle of water in winter; (e), Nitrogen cycle of sediment in spring; (f), Nitrogen cycle of sediment in summer; (g), Nitrogen cycle of sediment in autumn; (h), Nitrogen cycle of sediment in winter. The nitrogen cycle in the figure is represented by FN1-FN13, and the specific functions are nitrogen fixation (FN1), nitrate reduction (FN2), nitrate respiration (FN3), nitrogen respiration (FN4), nitrite respiration (FN5), nitrate denitrification (FN6), nitrite denitrification (FN7), nitrous oxide denitrification (FN8), denitrification (FN9), nitrate ammonification (FN10), aerobic nitrite oxidation (FN12), and nitrification (FN13).
Water 14 01203 g005
Figure 6. Co-occurrence network of bacterial functions related to the carbon and nitrogen cycle in water column and sediment. (a), Carbon cycle in water; (b), Carbon cycle in sediment; (c), Nitrogen cycle in water; (d), Nitrogen cycle in sediment. The size of each node indicates the connection degree of the bacterial function, and the color of each node indicates different functional taxa. Red lines represent positive correlations, and green lines represent negative correlations. The thickness represents the absolute value of the correlation coefficient.
Water 14 01203 g006
Table 1. Mean water quality for all treatments during the experiment. Values were calculated from bi-weekly measurements of six replicate mesocosms from March 2018 to February 2019. Values are given as means ± SE. C, ambient temperature; T, +4 °C constant warming; V, variable warming. The letters above the data represent significant differences between treatments (p < 0.05).
VariableTreatment
CTV
DO (mg·L−1)6.12 ± 0.27 a6.43 ± 0.25 a6.06 ± 0.26 a
Cond (μs·cm−1)218.82 ± 2.26 a266.01 ± 3.73 b266.83 ± 3.42 b
pH8.43 ± 0.08 a8.59 ± 0.07 a8.53 ± 0.07 a
Turb (mg·L−1)2.41 ± 0.11 a3.91 ± 0.23 b2.54 ± 0.10 a
PO43−-P (μg·L−1)11.71 ± 0.90 a13.63 ± 0.91 a10.20 ± 0.77 a
NH4 +-N (mg·L−1)0.11 ± 0.01 a0.17 ± 0.01 b0.15 ± 0.01 b
NO3-N (mg·L−1)0.09 ± 0.01 a0.11 ± 0.01 b0.09 ± 0.00 a
Chl.a (μg·L−1)8.30 ± 0.67 a23.64 ± 1.92 b20.49 ± 1.81 b
TP (mg·L−1)0.06 ± 0.00 a0.06 ± 0.00 a0.06 ± 0.00 a
TN (mg·L−1)0.62 ± 0.03 a0.87 ± 0.03 b0.78 ± 0.03 b
Publisher’s Note: MDPI stays neutral with regard to jurisdictional claims in published maps and institutional affiliations.

