
The Impact of Climate Change and Soil Classification on Benzene Concentration in Groundwater Due to Surface Spills of Hydraulic Fracturing Fluids


Abstract
:
1. Introduction
2. Methodology
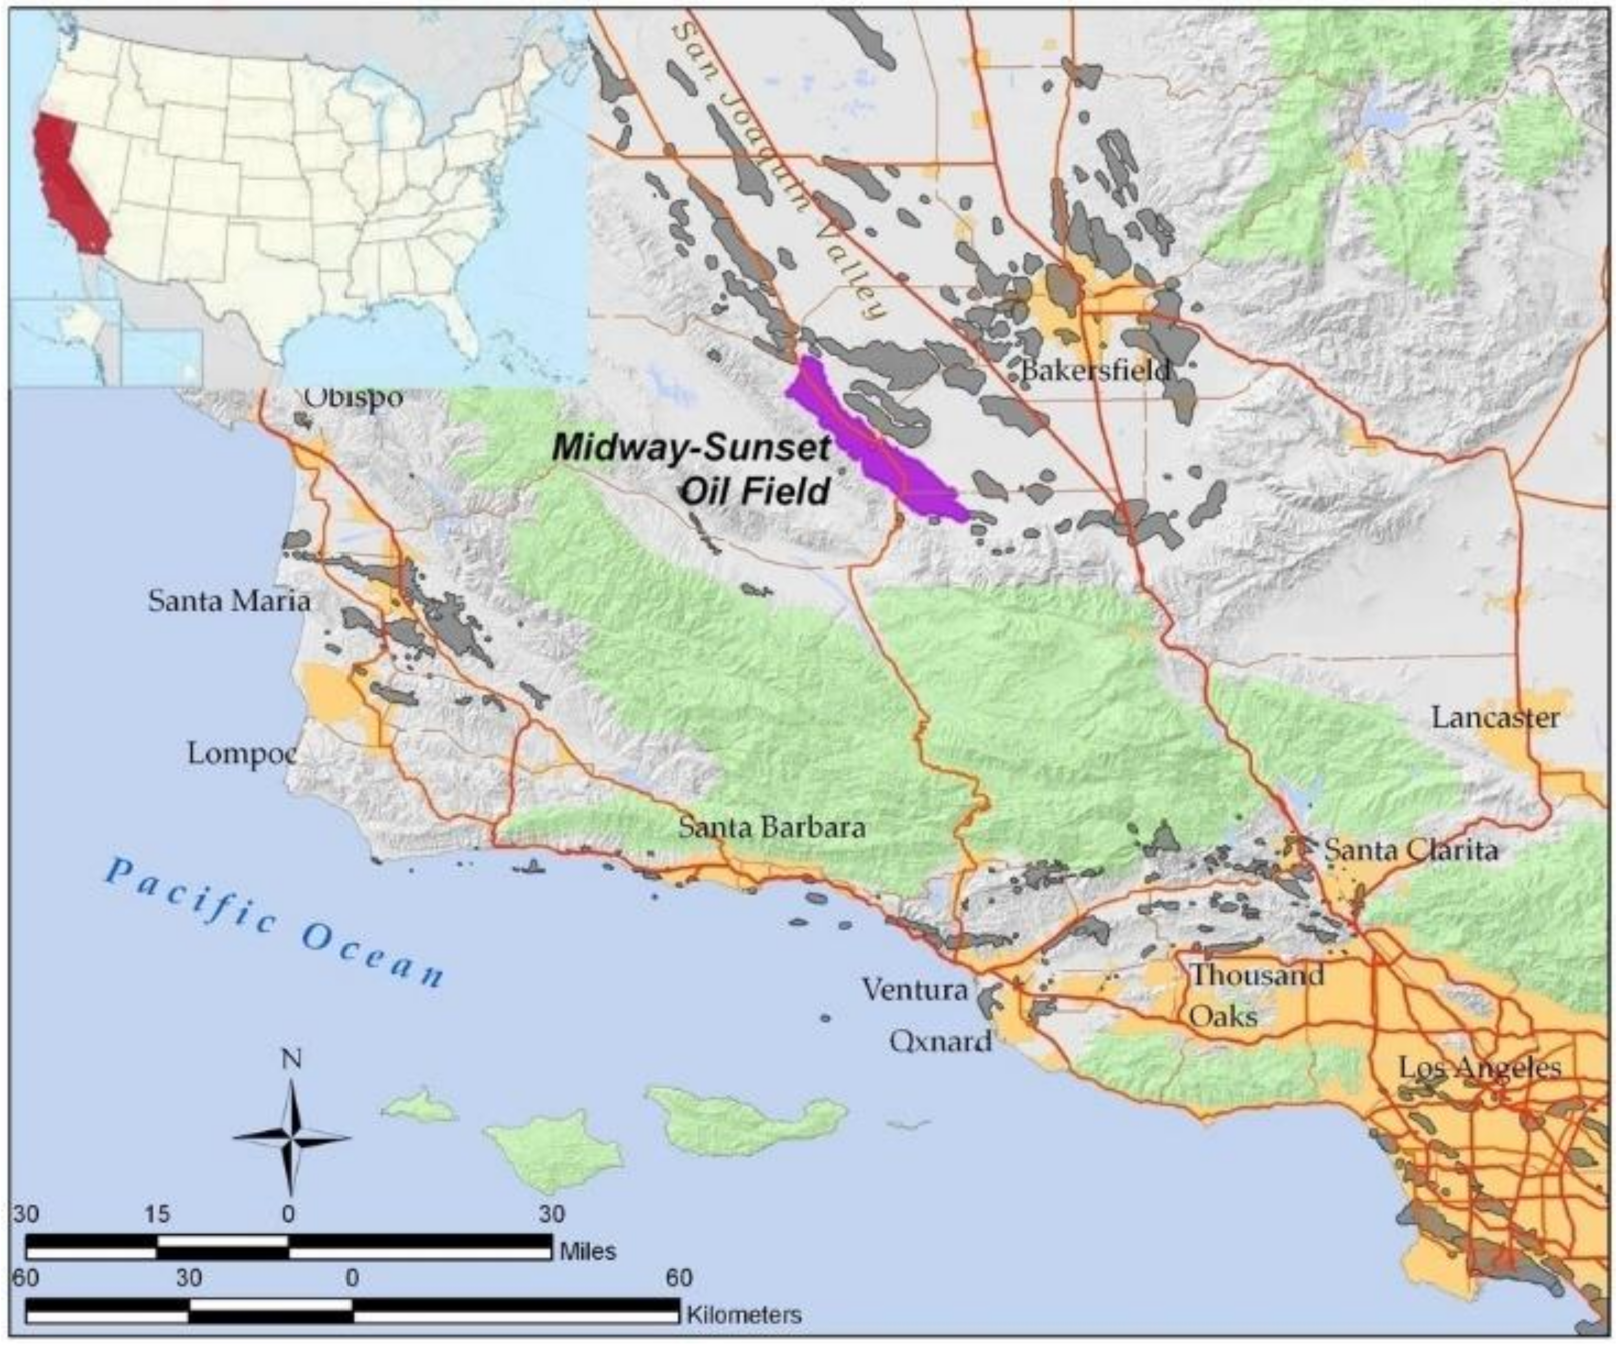
2.1. Study Area
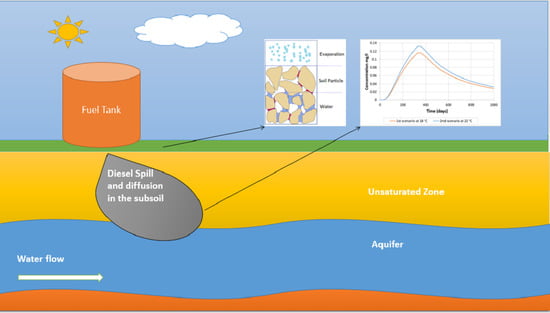
2.2. Transport Model in the Unsaturated Zone
2.2.1. Model Parameterization
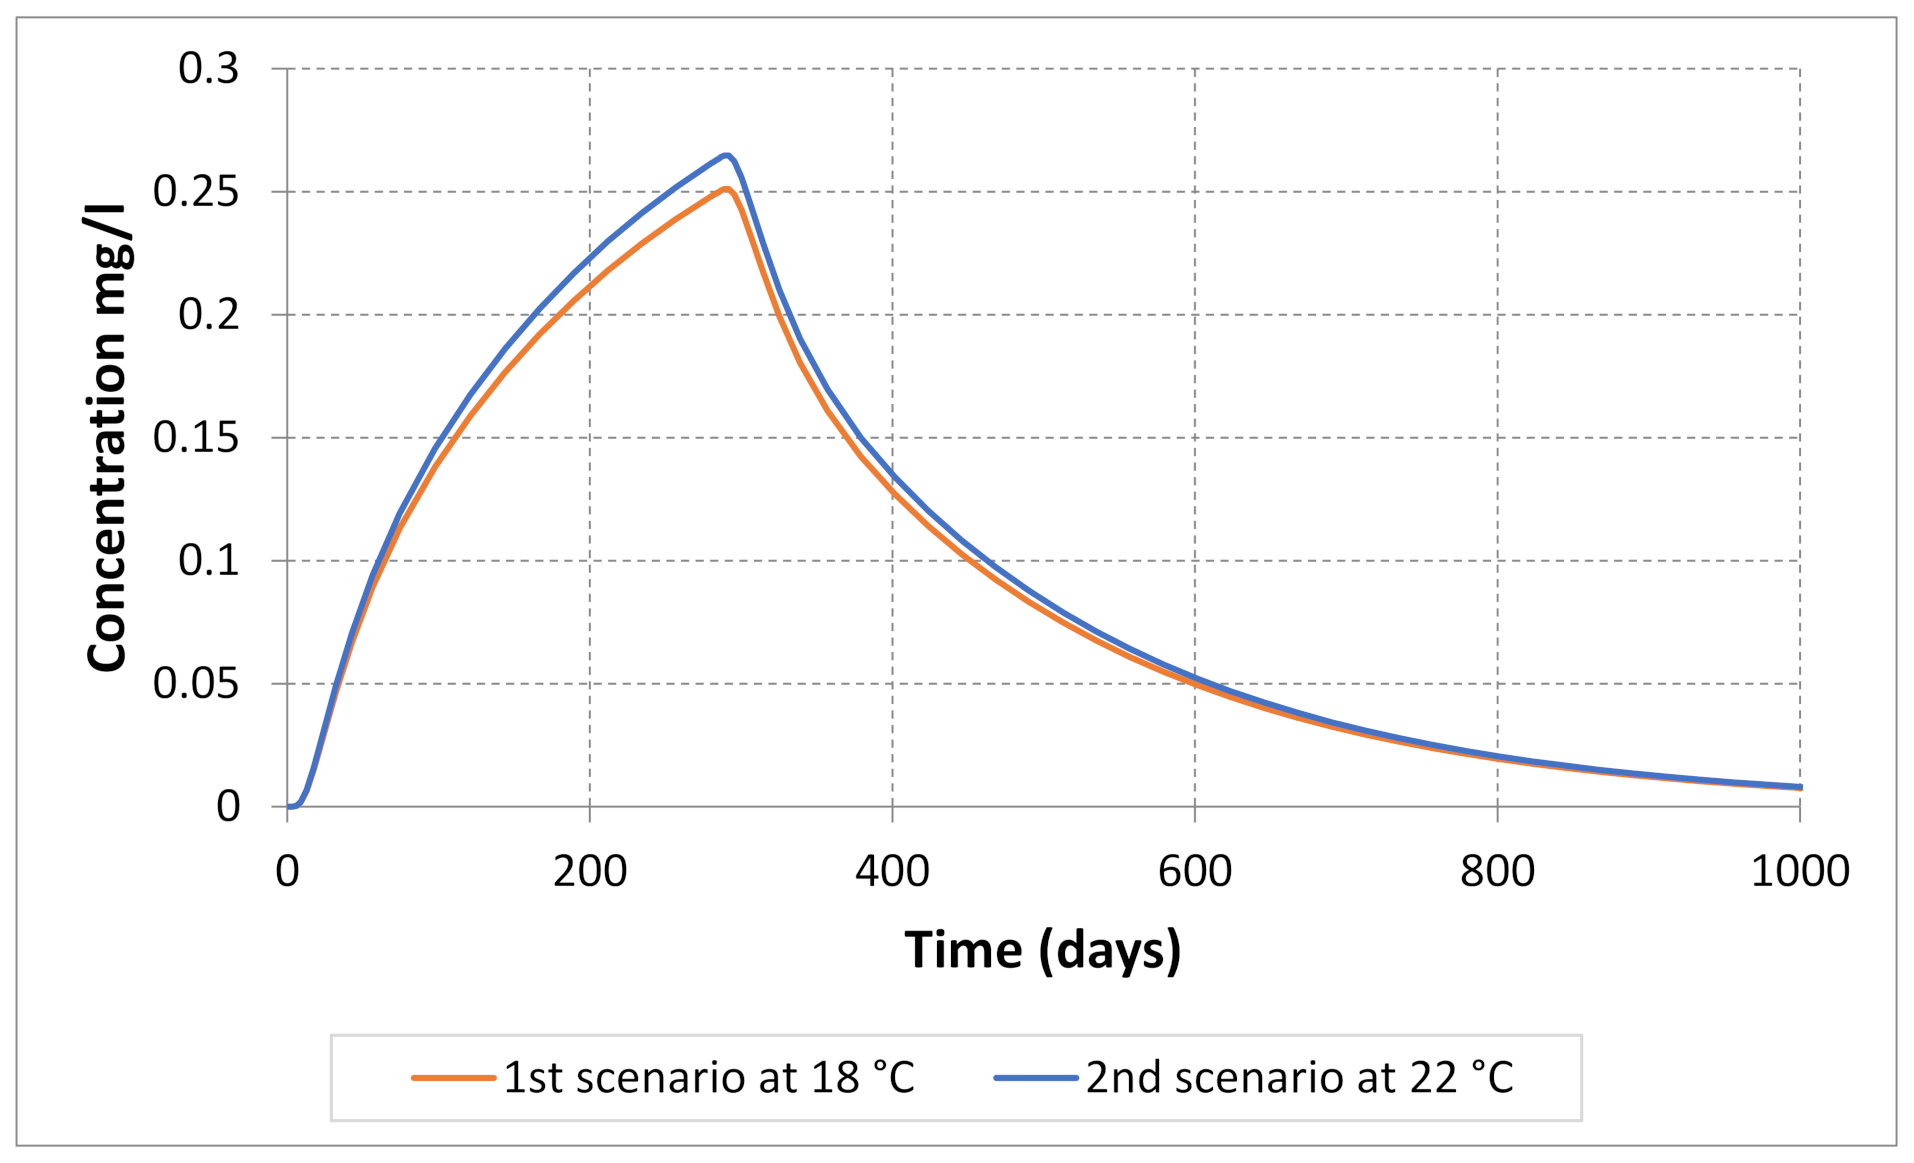
2.2.2. Model Validation
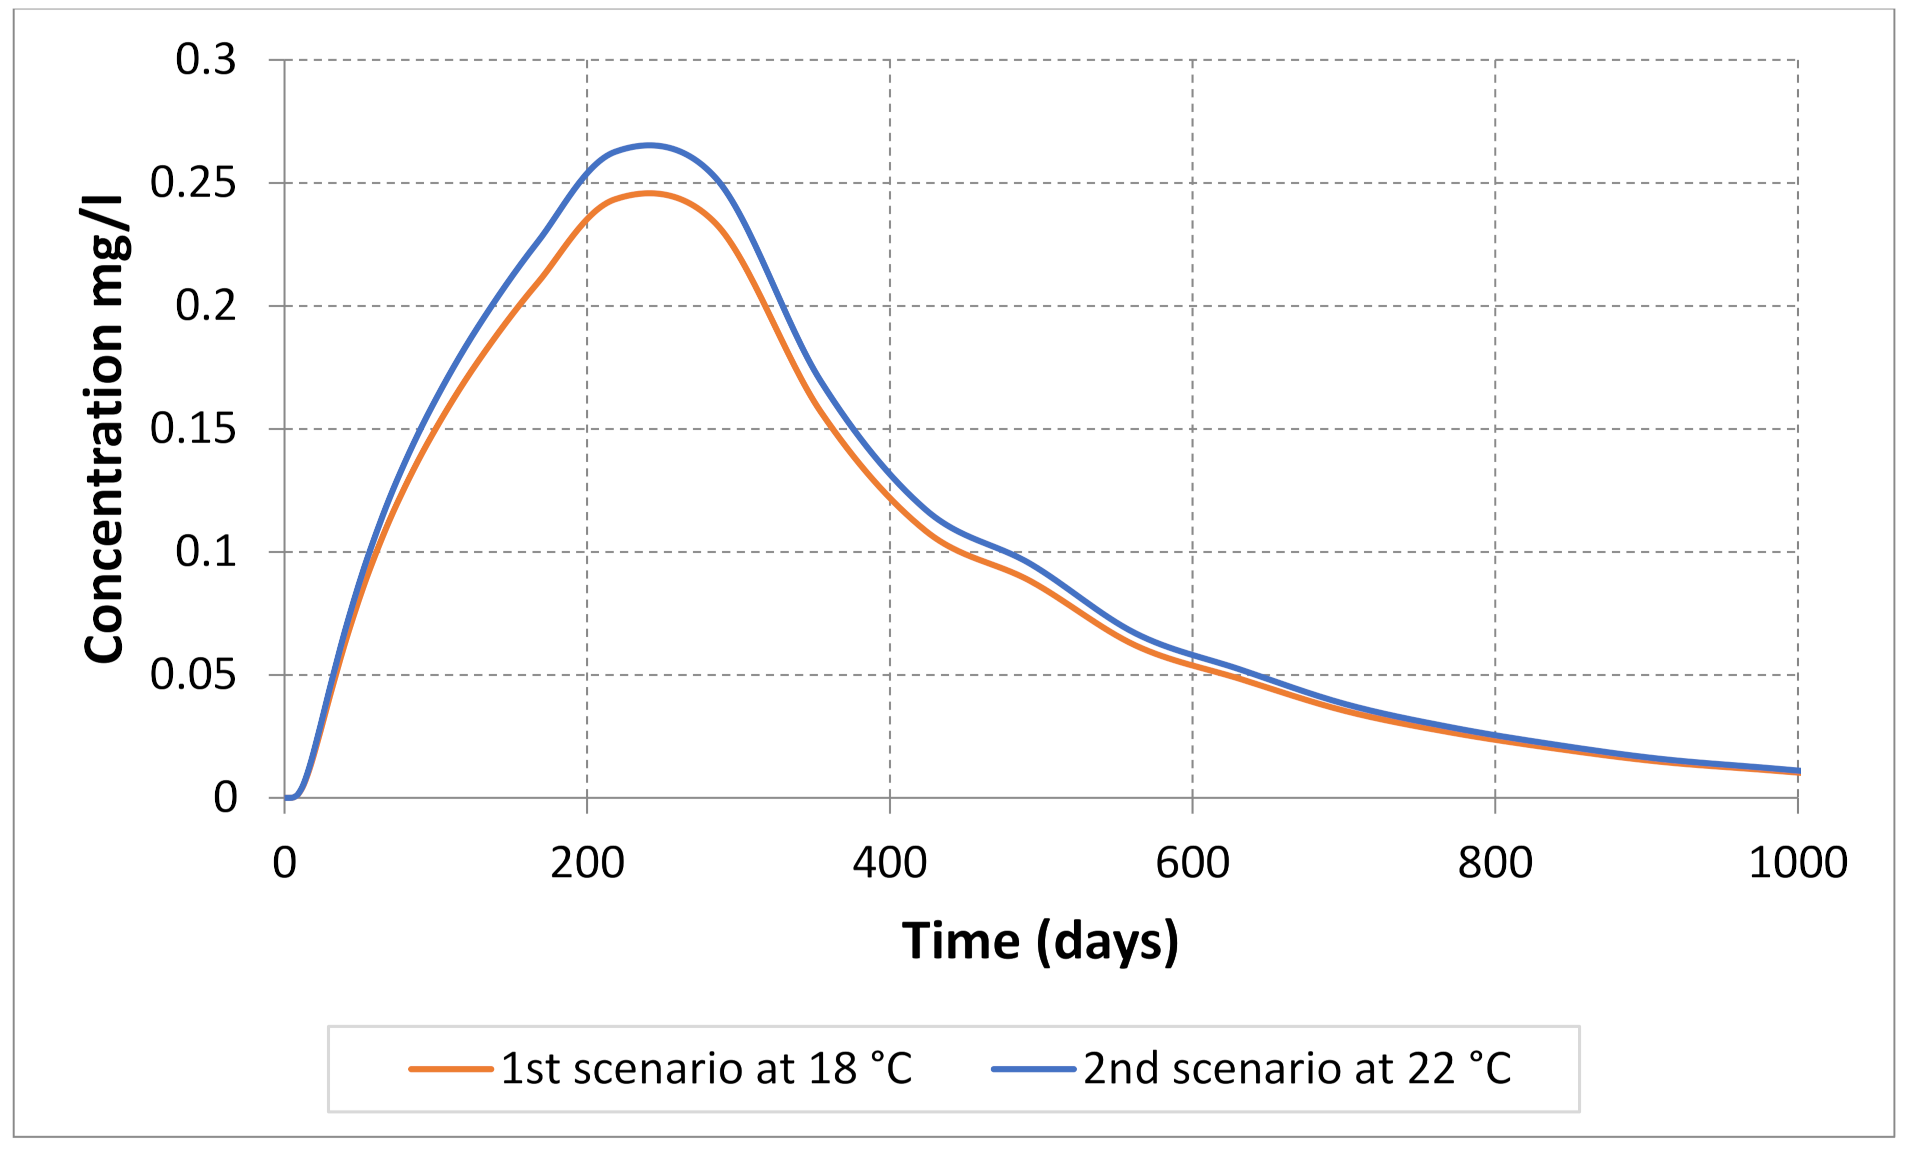
3. Results and Discussions
3.1. The Effect of Soil Properties and Solute Characteristics on Contaminant Transport
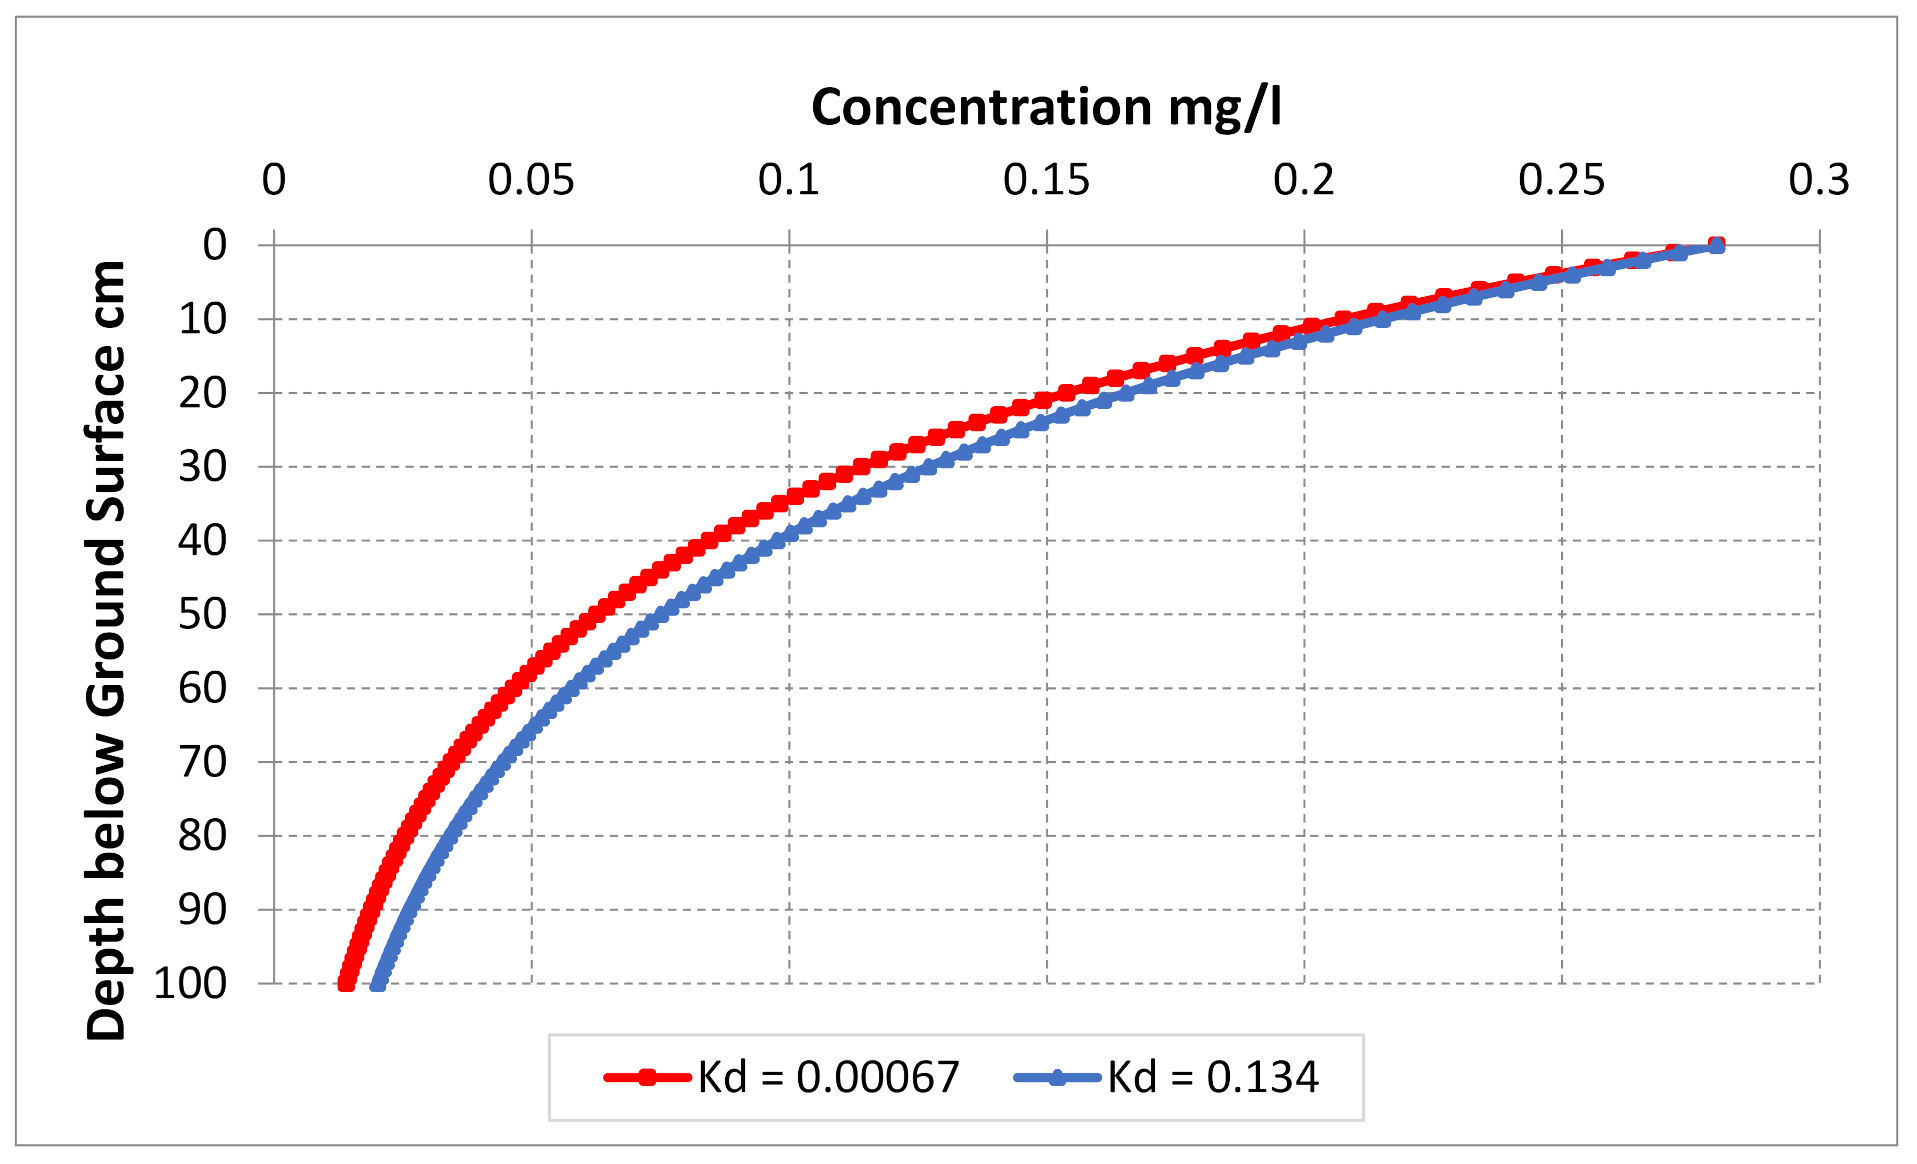
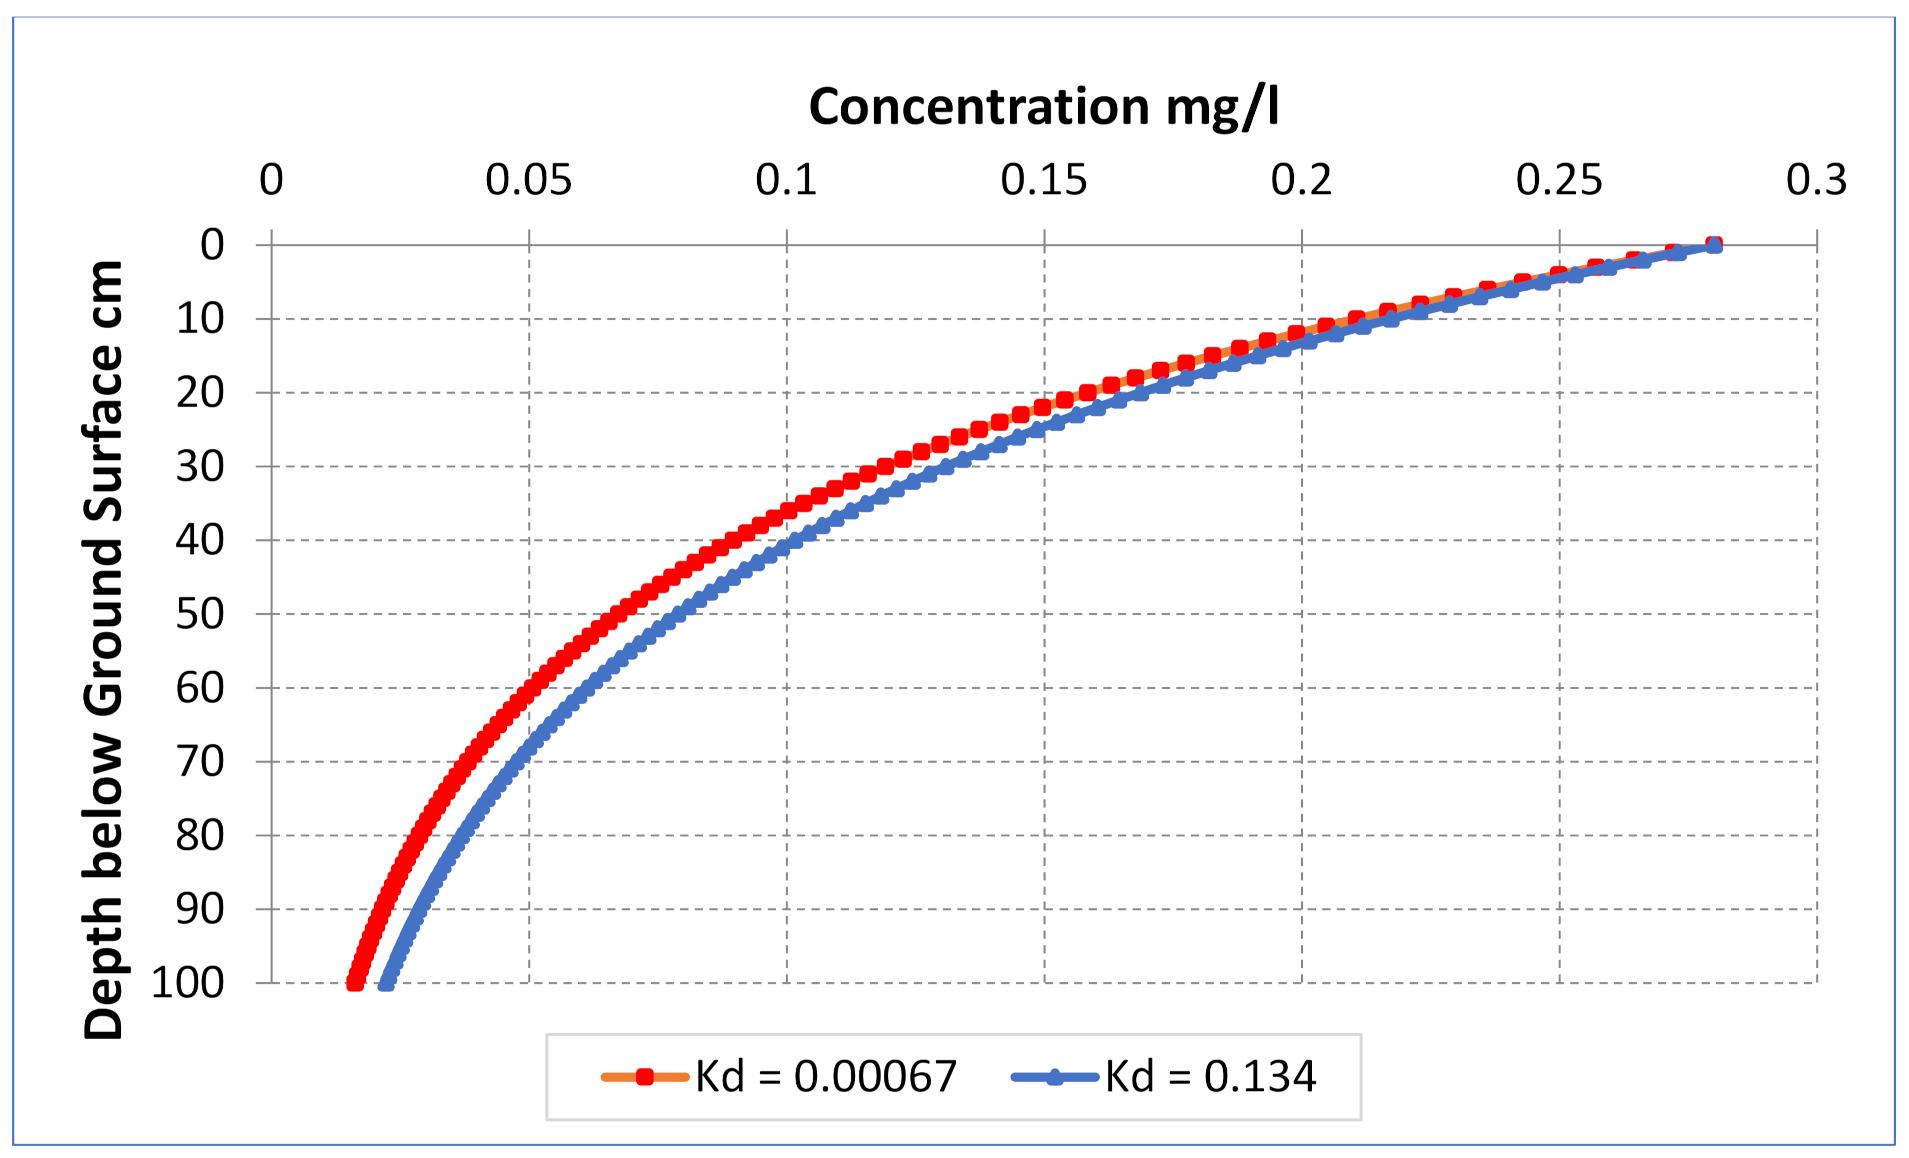
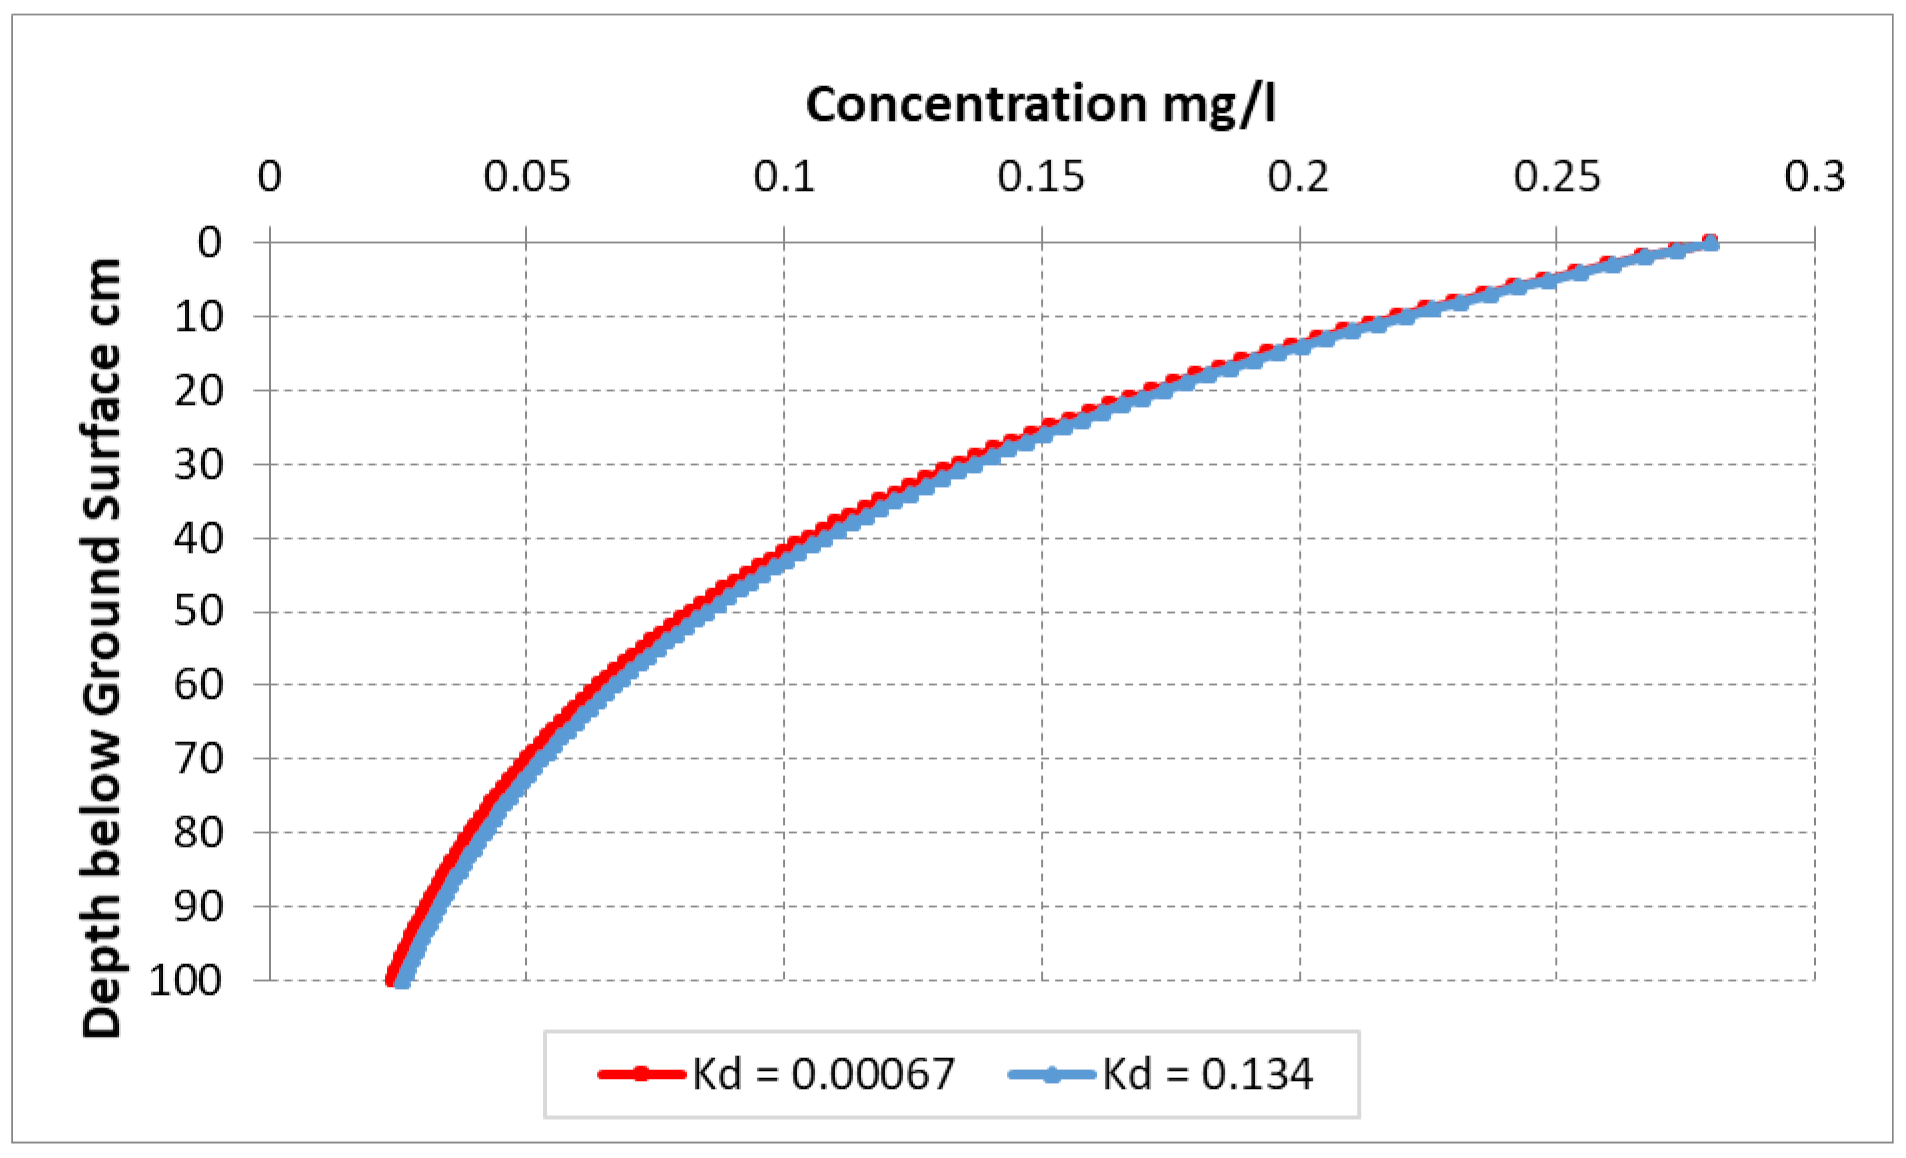
3.2. The Distribution Coefficient Role in Controlling Contaminant Transport
4. Conclusions
- The expected rise in temperature due to climate change can appreciably affect the soil moisture, which considers the first barrier to protect the groundwater from surface sources of contaminants.
- Diffusion coefficient of benzene in the soil is an important characteristic that is directly proportional to the temperature; therefore, it is a factor that led to increasing groundwater contamination.
- Sorption processes cause a delay in the benzene movement concerning water velocity, which is generally quantified by the coefficient of partition (or distribution), especially in loamy and sandy clay loam soils.
- An anticipated increase in earth’s average surface temperature by 4 °C due to climate change could lead to a rise in the level of groundwater pollution in the study area by 0.017 mg/L in loamy soil, 0.00046 mg/L in sandy clay loam soil, and 0.00023 mg/L in silt loam soil.
- Climate change may reduce the amount of benzene absorbed from (10 to 0.07)% in loamy soil, from (14 to 0.07)% in sandy clay loam soil, and from (60 to 53)% in silt loam soil.
- The impact of benzene in shallow groundwater aquifers is slight, demonstrating that any impact would take more than 200 days to be considerable.
- Groundwater aquifers that are only 100 cm away from the spill source are more threatened by contamination. As the depth of the groundwater increases, it is safe from surface sources pollutants.
- Construction of the well pad can substantially reduce the organic carbon in the soils, therefore, reducing its role in controlling the movement of pollutants.
Author Contributions
Funding
Institutional Review Board Statement
Informed Consent Statement
Data Availability Statement
Conflicts of Interest
References
- U.S. Energy Information Administration. Proved Reserves of Crude Oil and Natural Gas in the United States, Year-End 2019; U.S. Energy Information Administration: Washington, DC, USA, 2021.
- Mojid, M.R.; Negash, B.M.; Abdulelah, H.; Jufar, S.R.; Adewumi, B.K. A state–of–art review on waterless gas shale fracturing technologies. J. Pet. Sci. Eng. 2021, 196, 108048. [Google Scholar] [CrossRef]
- U.S. Department of Energy. Economic and National Security Impacts under a Hydraulic Fracturing Ban; U.S. Department of Energy: Washington, DC, USA, 2021.
- De Voogt, P. Reviews of Environmental Contamination and Toxicology; Springer: Berlin/Heidelberg, Germany, 2015; Volume 236. [Google Scholar]
- Almaliki, A.J.D.; Bashir, M.J.K.; Borrajo, J.F.L. Appraisal of groundwater contamination from surface spills of fluids associated with hydraulic fracturing operations. Sci. Total Environ. 2022, 815, 152949. [Google Scholar] [CrossRef] [PubMed]
- Fayemiwo, O.M.; Daramola, M.O.; Moothi, K. BTEX compounds in water–future trends and directions for water treatment. Water SA 2017, 43, 602. [Google Scholar] [CrossRef] [Green Version]
- Rosecrans, C.Z.; Landon, M.K.; McMahon, P.B.; Gillespie, J.M.; Kulongoski, J.T.; Stephens, M.J.; Hunt, A.G.; Shimabukuro, D.H.; Davis, T.A. Groundwater Quality of Aquifers Overlying the Oxnard Oil Field, Ventura County, California. Sci. Total Environ. 2021, 771, 144822. [Google Scholar] [CrossRef] [PubMed]
- Clancy, S.A.; Worrall, F.; Davies, R.J.; Gluyas, J.G. The potential for spills and leaks of contaminated liquids from shale gas developments. Sci. Total Environ. 2018, 626, 1463–1473. [Google Scholar] [CrossRef] [PubMed]
- USDA_NASS. California Agricultural Overview; USDA_NASS: Athens, GA, USA, 2016.
- Kiparsky, M.; Miller, K.; Goulden, P.; Milman, A.; Owen, D. Groundwater Recharge for a Regional Water Bank. Case Stud. Environ. 2021, 5, 1223400. [Google Scholar] [CrossRef]
- On, R.; Conditions, W. Improvement District No. 4 Report on Water Conditions 2020; Kern County Water Agency: Bakersfield, CA, USA, 2020. [Google Scholar]
- Ajami, H. Geohydrology: Groundwater, 2nd ed.; Elsevier Inc.: Amsterdam, The Netherlands, 2012; Available online: https://www.elsevier.com/books/groundwater-science/fitts/978-0-12-384705-8/ (accessed on 8 March 2022).
- Ajami, H. Geohydrology: Groundwater. Encycl. Geol. 2021, 408–415. [Google Scholar] [CrossRef]
- Yazdan, M.M.S.; Ahad, M.T.; Jahan, I.; Mazumder, M. Review on the Evaluation of the Impacts of Wastewater Disposal in Hydraulic Fracturing Industry in the United States. Technologies 2020, 8, 67. [Google Scholar] [CrossRef]
- Rodriguez, J.; Heo, J.; Kim, K.H. The impact of hydraulic fracturing on groundwater quality in the permian Basin, West Texas, USA. Water 2020, 12, 796. [Google Scholar] [CrossRef] [Green Version]
- Taylor, R.G.; Scanlon, B.; Döll, P.; Rodell, M.; Van Beek, R.; Wada, Y.; Longuevergne, L.; Leblanc, M.; Famiglietti, J.S.; Edmunds, M.; et al. Ground water and climate change. Nat. Clim. Chang. 2013, 3, 322–329. [Google Scholar] [CrossRef] [Green Version]
- Cuthbert, M.O.; Gleeson, T.; Moosdorf, N.; Befus, K.M.; Schneider, A.; Hartmann, J.; Lehner, B. Global patterns and dynamics of climate–groundwater interactions. Nat. Clim. Chang. 2019, 9, 137–141. [Google Scholar] [CrossRef]
- Olabisi, O. Integrated Reservoir Characterization of a Miocene Submarine Fan System, Midway-Sunset Oil Field, San Joaquin Basin, California, USA. In Proceedings of the 2018 AAPG Pacific Section Meeting, Bakersfield, CA, USA, 22–25 April 2018; Volume 20431. [Google Scholar]
- Natural Resources Conservation Service; United States Department of Agriculture. Soil Survey of Kern County, California, Southwest Part. California. 2009. Available online: http://soils.usda.gov/survey/printed_surveys/ (accessed on 24 March 2022).
- Šimůnek, J.; Genuchten, M.T. Modeling Nonequilibrium Flow and Transport Processes Using HYDRUS. Vadose Zone J. 2008, 7, 782–797. [Google Scholar] [CrossRef] [Green Version]
- Rassam, D.; Šimůnek, J.; Mallants, D.; van Genuchten, M.T. The HYDRUS-1D Software Package for Simulating the Movement of Water, Heat, and Multiple Solutes in Variably-Saturated Media: Tutorial, version 1.00; No. July. 2018: CSIRO Land and Water University of California Riverside, Riverside, CA, USA. Available online: https://www.pc-progress.com/Downloads/Public_Lib_H1D/HYDRUS-1D_Tutorial_V1.00_2018.pdf (accessed on 2 January 2022).
- Šimůnek, J.; Šejna, M.; Saito, H.; Sakai, M.; van Genuchten, M.T. Version 4.08 January 2009. Department of Environmental Sciences/University of California Riverside, Riverside, CA, USA. Available online: https://www.pc-progress.com/Downloads/Pgm_hydrus1D/HYDRUS1D-4.08.pdf (accessed on 2 January 2022).
- Parrish, C. Developing joint probability distributions of soil water retention characteristics. Water Resour. Res. 1988, 24, 755–769. [Google Scholar]
- Cheng, L.; Hoerling, M.; Aghakouchak, A.; Livneh, B.; Quan, X.W.; Eischeid, J. How has human-induced climate change affected California drought risk? J. Clim. 2016, 29, 111–120. [Google Scholar] [CrossRef]
- Goertler, P.; Mahardja, B.; Sommer, T. Striped bass (Morone saxatilis) migration timing driven by estuary outflow and sea surface temperature in the San Francisco Bay-Delta, California. Sci. Rep. 2021, 11, 1510. [Google Scholar] [CrossRef] [PubMed]
- Harter, T. Basic Concepts of Groundwater Hydrology; UCANR Publications: Davis, CA, USA, 2003; Volume 8083, pp. 1–6. [Google Scholar] [CrossRef] [Green Version]
- US Environmental Protection Agency. Evaluation of Impacts to Underground Sources of Drinking Water by Hydraulic Fracturing of Coalbed Methane Reservoirs Final. In Ground Water; US Environmental Protection Agency: Washington, DC, USA, 2004; p. 463. [Google Scholar] [CrossRef]
- Kanno, C.M.; McCray, J.E. Evaluating potential for groundwater contamination from surface spills associated with unconventional oil and gas production: Methodology and application to the south platte alluvial aquifer. Water 2021, 13, 353. [Google Scholar] [CrossRef]
- EPA. EPA On-line Tools for Site Assessment Calculation | Ecosystems Research | US EPA. 2022. Available online: https://www3.epa.gov/ceampubl/learn2model/part-two/onsite/estdiffusion.html (accessed on 2 January 2022).
- Jha, R.K.; Bryant, S.L.; Lake, L.W. Effect of diffusion on dispersion. SPE J. 2011, 16, 65–77. [Google Scholar] [CrossRef]
- Troldborg, M.; Binning, P.J.; Nielsen, S.; Kjeldsen, P.; Christensen, A.G. Unsaturated zone leaching models for assessing risk to groundwater of contaminated sites. J. Contam. Hydrol. 2009, 105, 28–37. [Google Scholar] [CrossRef] [PubMed]
- Ahn, J.; Rao, G.; Mamun, M.; Vejerano, E.P. Soil–air partitioning of volatile organic compounds into soils with high water content. Environ. Chem. 2020, 17, 545. [Google Scholar] [CrossRef]
- Thomas, H. Sampling and Analysis of Water Streams Associated with the Development of Marcellus Shale Gas; Final Report; Marcellus Shale Coalition: Pittsburgh, PA, USA, 2009. [Google Scholar]
- Bear, S.J.; Prince, F.E.; Toth, A.L. Effect of Increasing Fertilizer Concentration on Exchangeable Cation Status of Soi. Soil Sci. Soc. Am. J. 1973, 37. [Google Scholar] [CrossRef]
- COGCC. COGCC Data. 2022. Available online: https://cogcc.state.co.us/documents/data/downloads/environmental/WaterWellDownload.html (accessed on 2 January 2022).
- USEPA. Understanding variation in partition coefficient, Kd, values. Volume I: The Kd Model, Methods of Measurement, and Application of Chemical Reaction Codes. Environ. Prot. Agency 1999, 1, 212. [Google Scholar]


| Parameter | Description | Unit | Value |
|---|---|---|---|
| Koc | Liquid–solid partitioning coefficient for soil [32] | mL/g | 67 |
| foc max | Fraction organic content [28] | − | 0.0001 |
| Co | Initial concentration [33] | mg/L | 0.28 |
| Kh | Henry’s constant at 18 °C [29] | − | 0.167 |
| Kh | Henry’s constant at 22 °C [29] | − | 0.23 |
| Qr | Residual water content loamy soil 1st scenario [23] | − | 0.078 |
| Qr | Residual water content loamy soil 2nd scenario [23] | − | 0.0702 |
| Qr | Residual water content sandy clay loam soil 1st scenario [23] | − | 0.1 |
| Qr | Residual water content sandy clay loam soil 2nd scenario [23] | − | 0.09 |
| Qr | Residual water content silt loam soil 1st scenario [23] | − | 0.067 |
| Qr | Residual water content silt loam soil 2nd scenario [23] | − | 0.0603 |
| i | Hydraulic gradient [19] | cm/cm | 0.001 |
| ax | Longitudinal dispersivity [34] | cm | 10 |
| Dw | Diffusion coefficient in free water at 18 °C [29] | cm2/day | 0.747 |
| Dw | Diffusion coefficient in free water at 22 °C [29] | cm2/day | 0.847 |
| Da | Diffusion coefficient in soil air at 18 °C [29] | cm2/day | 7439 |
| Da | Diffusion coefficient in soil air at 22 °C [29] | cm2/day | 7629 |
| ρ | Bulk density [19] | g/cm3 | 1.6 |
| Type of Soil | Cmax of Benzene at 18 °C | Cmax of Benzene at 22 °C |
|---|---|---|
| Loam | 0.25108 | 0.26469 |
| Sandy clay loam | 0.24335 | 0.26265 |
| Silt loam | 0.11666 | 0.13243 |
Publisher’s Note: MDPI stays neutral with regard to jurisdictional claims in published maps and institutional affiliations. |
© 2022 by the authors. Licensee MDPI, Basel, Switzerland. This article is an open access article distributed under the terms and conditions of the Creative Commons Attribution (CC BY) license (https://creativecommons.org/licenses/by/4.0/).
Share and Cite
Almaliki, A.J.D.; Bashir, M.J.K.; Llamas Borrajo, J.F. The Impact of Climate Change and Soil Classification on Benzene Concentration in Groundwater Due to Surface Spills of Hydraulic Fracturing Fluids. Water 2022, 14, 1202. https://doi.org/10.3390/w14081202
Almaliki AJD, Bashir MJK, Llamas Borrajo JF. The Impact of Climate Change and Soil Classification on Benzene Concentration in Groundwater Due to Surface Spills of Hydraulic Fracturing Fluids. Water. 2022; 14(8):1202. https://doi.org/10.3390/w14081202
Chicago/Turabian StyleAlmaliki, Alaa Jasim Dakheel, Mohammed J. K. Bashir, and Juan F. Llamas Borrajo. 2022. "The Impact of Climate Change and Soil Classification on Benzene Concentration in Groundwater Due to Surface Spills of Hydraulic Fracturing Fluids" Water 14, no. 8: 1202. https://doi.org/10.3390/w14081202