
Remote Sensing-Based Agricultural Water Accounting for the North Jordan Valley
by
 , ,
, ,
Jawad T. Al-Bakri
1,* ,
,
Guido D’Urso
2 ,
,
Charles Batchelor
3,
Motasem Abukhalaf
3,
Adel Alobeiaat
4,
Areej Al-Khreisat
1 and
Domitille Vallee
3 1
Department of Land, Water and Environment, School of Agriculture, The University of Jordan, Amman 11942, Jordan
2
Department of Agricultural Sciences, University of Naples Federico II, 80055 Portici, Italy
3
Food and Agriculture Organization of the United Nations (FAO), FAO Regional Office for Near East and North Africa, 00153 Rome, Italy
4
Ministry of Water and Irrigation, Amman 11183, Jordan
*
Author to whom correspondence should be addressed.
Water 2022, 14(8), 1198; https://doi.org/10.3390/w14081198
Submission received: 16 March 2022
/
Revised: 1 April 2022
/
Accepted: 6 April 2022
/
Published: 8 April 2022
(This article belongs to the Section New Sensors, New Technologies and Machine Learning in Water Sciences)
Abstract
:Remote sensing can provide important and updated information for agricultural water accounting (AWA). In this study, data from the open-access portal (WaPOR) of the Food and Agricultural Organization was used in AWA to assess levels of agricultural water consumption and to provide possible solutions for water deficiency in the North Jordan Valley (NJV). Consolidated procedures have been applied to complement and validate the WaPOR products. These included the use of climatic and ground data, the multispectral remote-sensing data of Sentinel-2 and Landsat 8 to derive land use/cover maps, GIS layers, and calibrated evapotranspiration (ET) estimates using the surface energy balance algorithm for land (SEBAL). The data of water inflows and outflows were analyzed using the water accounting plus (WA+) system. Results showed that the WaPOR data of actual ET and interception (AETI) were highly correlated with SEBAL-ET, with WaPOR data overestimating ET for irrigated areas. Precipitation data from WaPOR, on the other hand, were underestimating inflow from rainfall, although significant correlations were observed between these data and rainfall records. As a result, the quality of WaPOR data affected the outputs from agricultural water accounting. The main impact on water accounting outputs was the underestimation of percolated water that could be utilized as a possible solution to water deficiency in the NJV. In addition, the water accounting performance indicators were relatively affected, although they reflected the nature of the study area where water deficiency predominated as a result of inter-basin transfer. The study compared outputs from water accounting in terms of the possible solutions to water deficiency in the NJV and concluded that considerable amounts of recoverable water could be developed when compared with the option of developing surface water from the side wadis. Also, it emphasized the important role of remote-sensing sources for providing information for AWA needed for improved water management and governance.
1. Introduction
Remote-sensing data provides important information for water resources management, particularly in Mediterranean countries where water resources are scarce. The progressive improvements in spatial, temporal, and spectral resolution of remote-sensing data made them invaluable sources of information for managing water resources at different scales [1,2,3]. The integration of remote sensing and geographic information systems (GIS), as geospatial techniques, with ground data has become widely adopted in new tools for water-use assessment and reporting. A good example of these new reporting and full water budgeting tools is the water accounting [4,5,6], which provides detailed information on water inflows and outflows with proportions of beneficially used and recoverable water.
The rationale behind water accounting is the improvement of water-related sectoral and intersectoral decision-making methods at local, regional, and national levels. Improvements can often be initiated by basing decisions on ‘best-available’ information, evidence and analysis—rather than intuition, assumptions, and guesswork [4]. As such, applying water accounting for agricultural areas requires an accurate information on water use, flows and fluxes. This can be achieved by integrating geospatial techniques of both remote sensing and GIS within water accounting systems. The use of remote sensing (RS) in agricultural water accounting (AWA), specifically in the irrigation sector, includes mapping of irrigated crops and their evapotranspiration (ET) [7]. Analysis of remotely sensed data is carried out within GIS environment that integrates different spatial, climatic and management data to derive information and indicators used in AWA.
During the last three decades, data from different sensors of earth observation systems (EOS) had been widely used in mapping irrigated crops, agricultural areas and land use (LU). This could be attributed to the fact that remotely sensed imagery, acquired by EOS, provided cost-effective and accurate means by which to derive these spatial maps [5,6,7]. The advantages of using remote sensing to map irrigated areas is their ability to provide spatial information on cropping patterns and their intra- and inter-seasonal dynamics and the large capacity for data acquisition over large areas [5,7,8]. The progressive development and improvements of digital image processing techniques and software has encouraged researchers and professionals to use RS data to derive LU and agricultural maps of crops and irrigated areas with minimum cost and limited fieldwork [9,10]. The nominal spatial resolution for crop type mapping is usually 10–30 m [10]. At present, many sources of EOS provide medium-level spatial resolution data, which is needed for different agricultural applications, including crop mapping. The most commonly used RS satellite data for these applications are the Landsat 8 and Sentinel-2, which are accessible free of charge. Landsat 8 provides multispectral images with 30 m spatial resolution, every 16 days. These can be compared with historical data of previous generations of Landsat satellites, launched from the early 1970s [10,11]. Sentinel-2 has been providing multispectral data since 2015. The data has a spatial resolution of 10–60 m and a temporal resolution of 5 days [12].
In AWA, ET is the most important water flux for assessing water balance, water-use efficiency, and fractions of beneficially used water [8,13]. Depending on the context, it is important to identify and quantify other components of water balance and outflows. In addition, detailed maps of land use, including water-related infrastructure and urban areas, are needed [4]. The influence of land use and landscape ET on the water cycle is obtained by recoding LU maps, derived from RS data, to water-use groups [13]. As yet, there are no reliable sensors that directly measure ET rates from land surfaces at a range of scales relevant to water balance analysis [13]. Therefore, different methods are proposed to estimate evapotranspiration using empirical equations and/or energy balance approaches. So far, the FAO56 Penman–Monteith method has provided the best estimate of ET under various climatic conditions [14]. The method is based on deriving the theoretical crop evapotranspiration (ETc) through the product of grass reference evapotranspiration (ETo) and a dimensionless crop coefficient (Kc) that expresses the evapotranspiration difference between the crop and the reference surfaces. The level of accuracy in ETc estimates depends mainly on the value of Kc, which changes depending on crop and irrigation management [1,14]. Therefore, different RS methods have been developed to map actual evapotranspiration (ETa) with minimum ground data inputs. The RS methods for mapping ETa include surface energy balance models [15,16,17], reflectance-based basal crop coefficients methods [8], and RS-based FAO-56 Penman–Monteith (FAO56PM) direct approaches [18].
Among the remote-sensing-based ET models are METRIC (mapping evapotranspiration with internalized calibration) [16] and SEBAL (surface energy balance algorithm for land) [17]. Both models, which are widely used for irrigation and hydrological applications using the medium resolution data of Landsat, require ground data to reduce biasness in ET estimates. In the context of water accounting, the RS-based FAO56PM is preferred over other methods as it has the ability to separate ET components into evaporation and transpiration, and therefore it provides data needed for evaluating the beneficially used fraction of irrigation water. A good example of these models is the ET Look, which uses the FAO56PM method separately to estimate evaporation and transpiration with a daily time step [18]. The method was developed to provide free data of ET and water productivity through an open access portal supported through the Food and Agricultural Organization of the United Nations (FAO). The FAO portal, known as WaPOR [19], provides the 10-day, monthly, and annual ET data for Africa and the Near East at 100–250 m spatial resolution [20].
The use of WaPOR datasets for monitoring and developing water resources is very important, particularly in countries suffering from water scarcity, such as Jordan. Considering the internal per capita share from renewable freshwater resources and the gross domestic product (GDP0, Jordan is ranked the second country worldwide in terms of water scarcity [21]. The problem of water scarcity in Jordan and the gap between demand and supply is expected to increase in the future due to the increased demand and decreased supply under the adverse climatic trends [22,23,24]. Therefore, this study performs an AWA that includes a full water budget for the agricultural area of the North Jordan Valley (NJV). The AWA aims to assess the levels of agricultural water consumption and deficiency in the NJV so that sustainable solutions to water deficiency can be provided. The novelty of the work stems from the fact that water deficiency solutions within AWA are based on a detailed water budgeting that utilizes remote-sensing data with WaPOR, SEBAL, and climate and ground surveys. The study integrates the work of water accounting supported by the FAO Regional Office for Near East and North Africa (FAO-RNE) with the research activities of Euro-Mediterranean Cooperation through ERANET joint activities (ERANETMED). The work and datasets generated from the FAO-RNE project includes detailed land use/cover mapping, WaPOR-ET data and water accounting for the NJV, while calibration of SEBAL-ET has been carried out within the ERANETMED EO-TIME project [25].
The major components of water accounting systems are the water inflows and outflows data that must be filled into the resource base and the ET sheets of the water accounting system. Performance indicators can be then calculated based on the data outputs from the water accounting sheets [13,26,27]. In this study, the open-source sheets of the Water Accounting Plus (WA+) system [28] were used to assess the water fluxes and the proportions of recoverable and beneficially used water and to perform the AWA for the NJV. The data of inflows and outflows were based on integration of remote-sensing and ground data. Bearing in mind that the intended outcome from the work of water accounting, within the context of FAO-RNE project, was the institutionalizing of this water reporting and analysis system at the MWI, so it was important to assess the level of accuracy of remotely sensed data, as these would control the outputs and results of water accounting [29]. The need to calibrate and assess WaPOR data has been emphasized by the results of a previous work of water accounting, carried out using WaPOR data for the whole Jordan River Basin [30]. Therefore, this study contributes to the water management in the Jordan River Basin area by applying an AWA with more detailed and calibrated remote-sensing and ground data. The work presents results for the year 2019, which has complete water datasets at farm unit level, provided by the Jordan Valley Authority (JVA) and Jordan’s Ministry of Water and Irrigation (MWI).
2. Materials and Methods
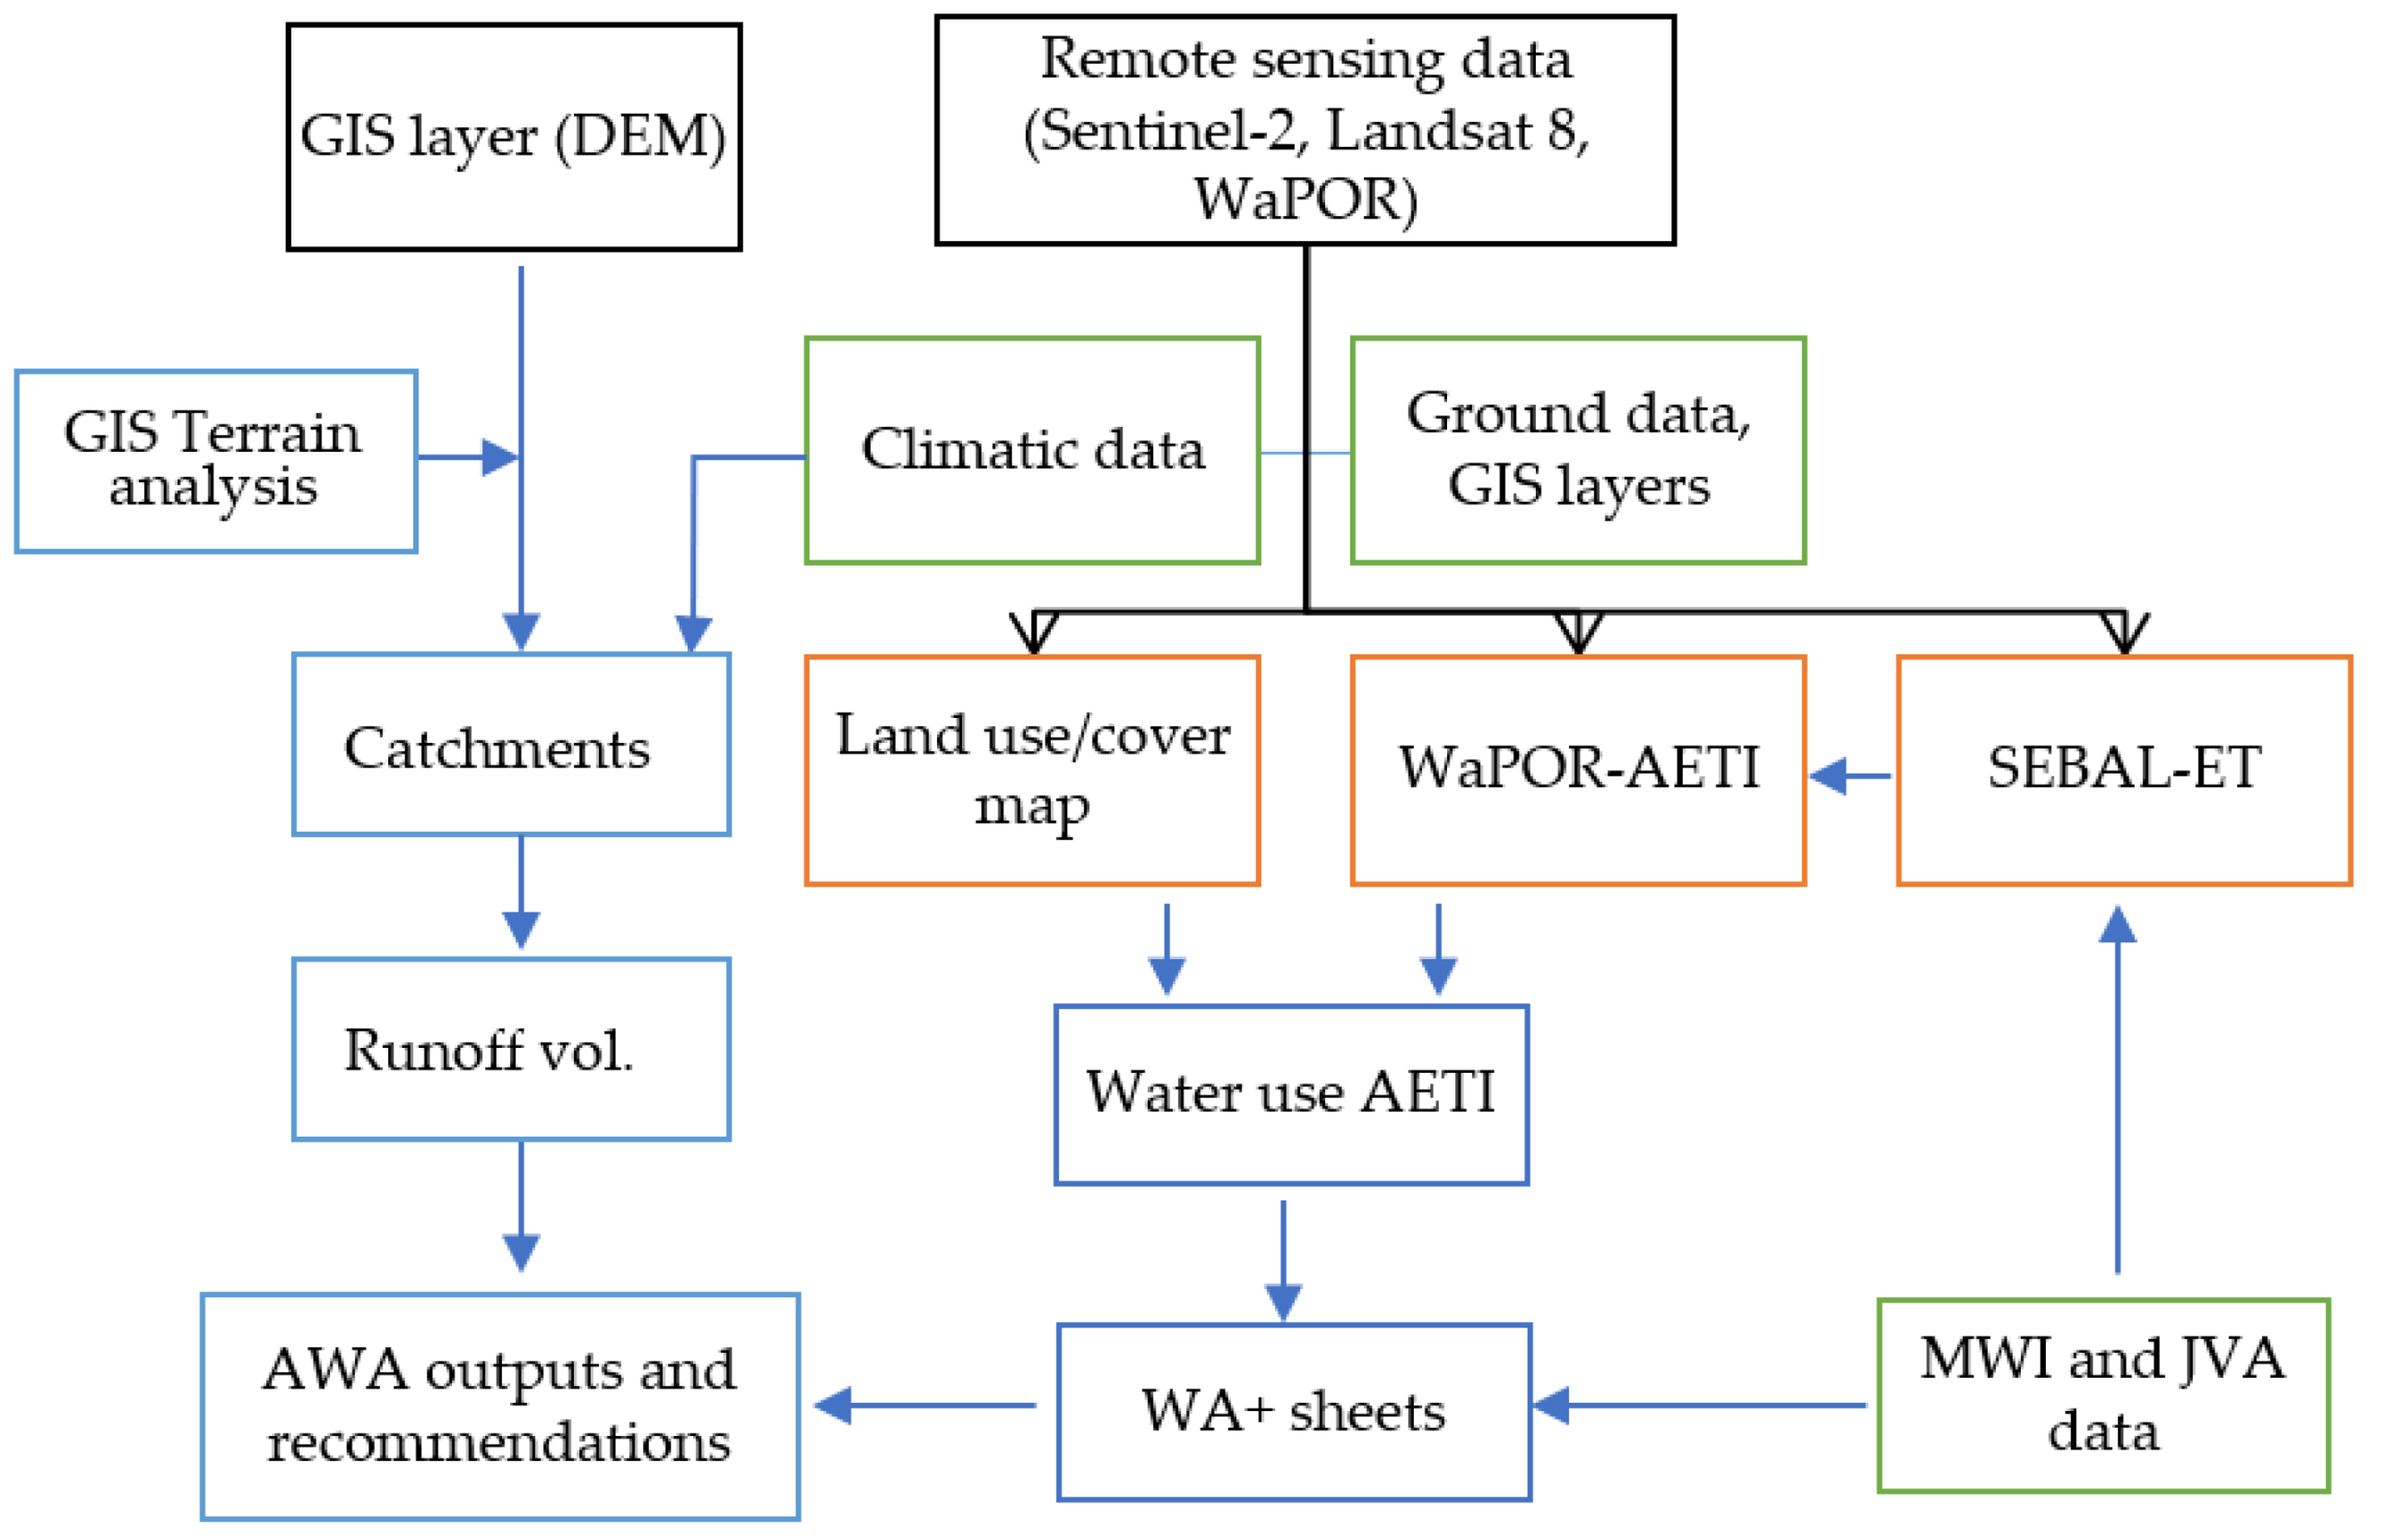
The study methodology was based on collection and integration of climatic data, remote sensing images, ground surveys, GIS layers, volumes of water inflows and interbasin transfer, data of cropping patterns, and water pumped to farmers. Cropping patterns and water-use categories were obtained from a detailed land-use/cover map derived from Landsat 8 and Sentinel-2 images. Weather records and Landsat 8 images were used in SEBAL to derive ET maps at a resolution of 30 m. The data of SEBAL-ET were calibrated to provide gross irrigation water depth using ground data of water delivered to farm units (FU) in the NJV. Daily weather records and ground data were used to calculate the net irrigation depth and to assess the level of water deficiency in the NJV. Both climatic data and the calibrated SEBAL-ET were used to assess WaPOR data precipitation and ET, respectively. The data of water supply and interbasin transfer, obtained from the JVA and MWI, and the WaPOR data of actual ET and interception (AETI) were filled in WA+ sheets to derive information needed for assessing irrigation water supply and water deficiency levels in the NJV. A summary for the methodology is shown in Figure 1, while detailed descriptions of the methodology are included in the following subsections.
2.1. Study Area
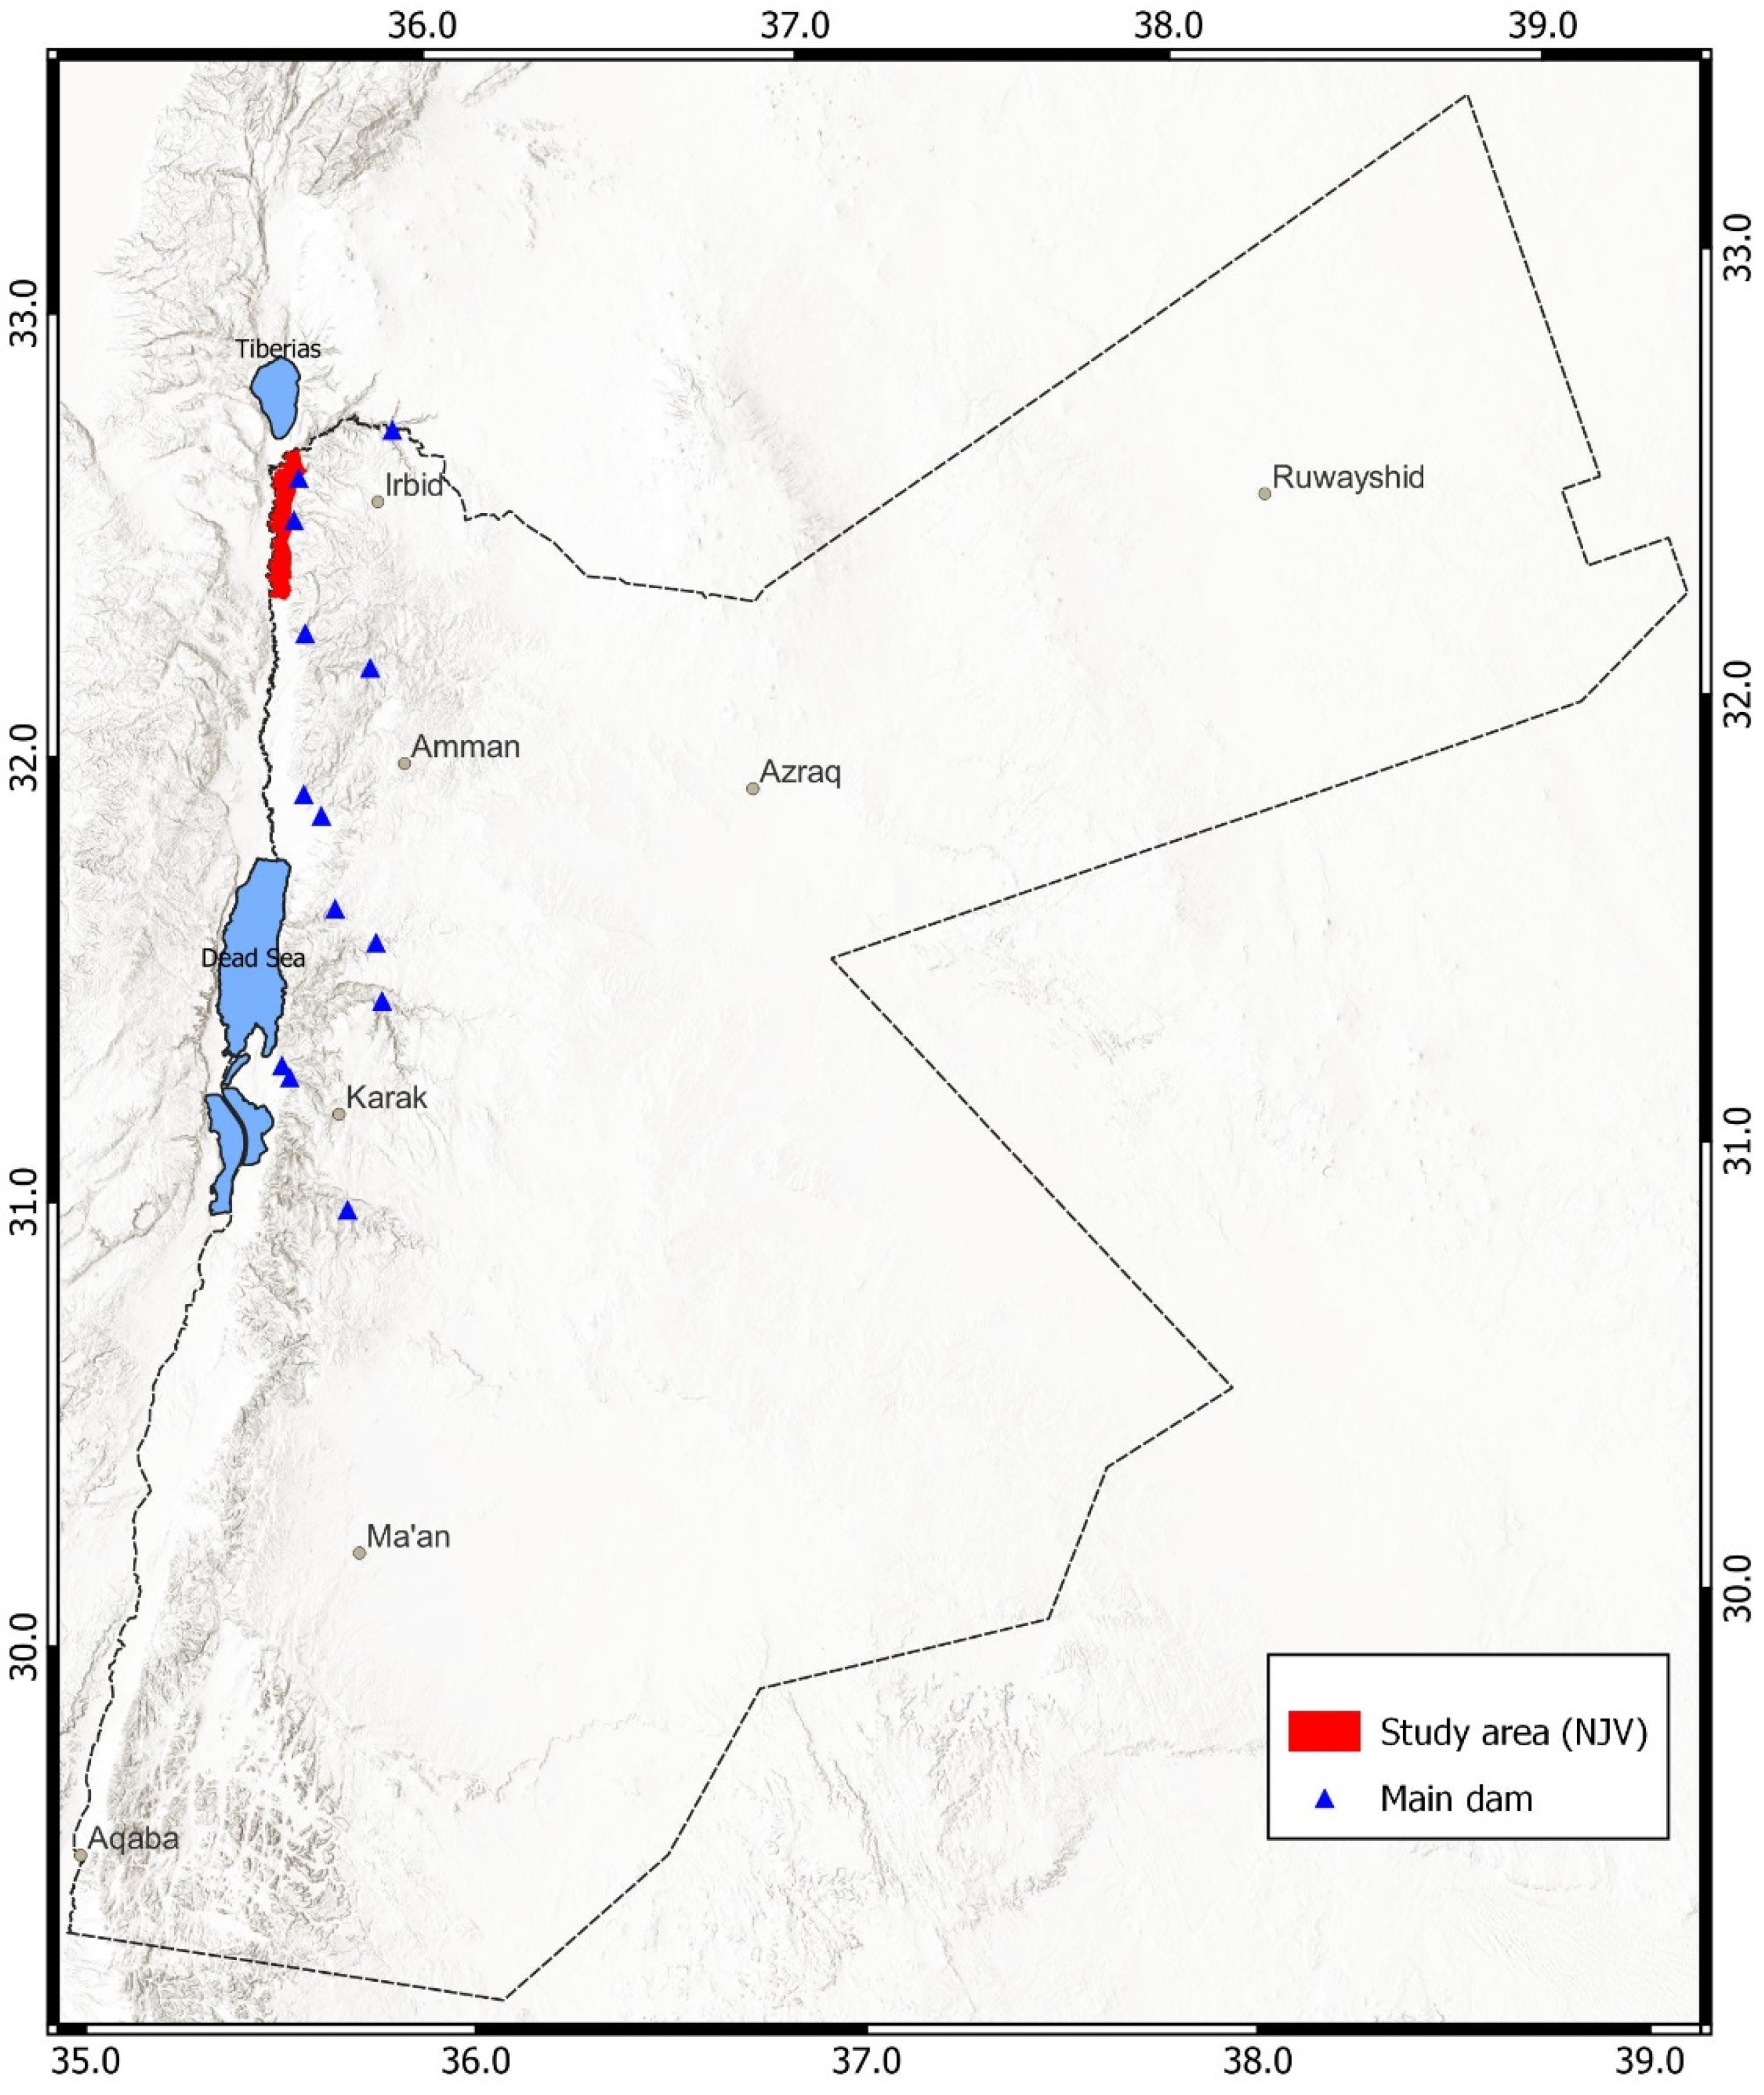
The NJV study area is located in the northwest of Jordan between 32.35 to 32.68° N and between 35.55 to 35.62° E (Figure 2), with a total area of 182 km2 and a total population of 142 thousand. The study area is located below the mean sea level (bmsl) with altitudes ranging from −200 to −300 m. Therefore, the NJV has a subtropical climate that is warm in winter and hot in summer. The average monthly minimum and maximum temperatures are 13 °C (January) and 32 °C (August), respectively. The mean annual rainfall during 1980–2019 was 391 mm. Soils in the NJV are deep and characterized by silty clay and silty clay loam textures, that originated from alluvial and colluvial parent materials that covered the layer of marl or Lisan [31]. Soil data from the JVA showed low levels of soil salinity in the NJV, where the average salinity, expressed in electrical conductivity (ECe) units, was less than 1.5 dS/m. The warm climate and the good soils have made the NJV an important agricultural area that contains most of the citrus crops grown in Jordan. In addition to citrus, irrigated farms grow crops of vegetables (tomato, okra and others), vineyards, and date palm. Rainfed cultivation of cereals and olives is practiced in the eastern parts of the NJV.
In addition to its importance as a productive agricultural zone, the NJV is located in an area that receives transboundary surface water from the upper Jordan River Basin and groundwater from Mukheiba wells in the north. Due to the problem of water scarcity in Jordan, part of this water is transferred for domestic uses in the Capital Amman and for irrigating parts of the South JV. Subsequently, the JVA adopted reduced quotas of water distribution to farmers in the NJV. The present quotas are 360, 765, and 1255 mm for vegetables, citrus, and bananas, respectively [32]. These quotas correspond to 75–80% of the gross irrigation depth needed by the different crops. Irrigation water is transferred from north to south via King Abdulla Canal (KAC), which has a total length of 110 km, with 42.3 km located in the NJV. The irrigation scheme in JV consists of 53 development zones that are divided into farm units, each with an average size of 3.5 ha. The study area of the NJV includes 24 development zones (DZ) that have 3202 farm units. Water is delivered to these farm units by pumping stations and a network of pipes and canals.
At present, the JV irrigation scheme and network has considerable water losses, which exacerbate the problem of water deficiency in the NJV. The main water losses from KAC are seepage (11%), unmetered/illegal uses (14%), and evaporation (1%) [33,34]. The average losses from KAC in the NJV are 19% of the total annual inflow [34]. Within the context of AWA these losses are recoverable and can be used after recharging groundwater [4]. The AWA applied in this study, therefore, is important as it provides estimates of recovered amounts of water that percolate from the irrigation network in the NJV. Also, it compares these volumes with amounts that can be developed from the surface water of the eastern side wadis so that informed decisions for supply augmentation can be taken by both of the JVA and MWI.
2.2. Data Collection and Processing
2.2.1. Climatic Data
Daily and hourly climatic data were obtained from the MWI and Jordan Meteorological Department (JMD) for the weather stations of Baqoura (North), Wadi El-Rayyan (South), Wadi Al-Yabis (Southeast), Dair Alla (20 km south of the NJV), and Kufr Awan and Dair Abi Said (6 km east of the NJV). The daily and hourly data included air temperature, wind speed, relative humidity, sunshine hours, and precipitation. Climatic data were used to run SEBAL-ET for the NJV and to derive FAO56PM-ETc and rainfall inflow needed to fill the resource base sheet of WA+. The FAO56PM-ETc method was used to provide an overall assessment of ET data of SEBAL and WaPOR and to calculate the monthly and annual water demand and deficit in NJV. Calculations of ETc were made as described by Allen et al. [14], with modifications for Kc values based on previous research results carried out in JV [35]. Crop calendar for irrigated crops was obtained from the JVA and field visits to different farms in the NJV.
2.2.2. Land-Use/Cover Mapping
An updated land-use/cover map was not available for the NJV. The map of land cover at the WaPOR portal, available at a spatial resolution of 100 m, underestimated the irrigated area in the NJV and included some mixing between irrigated citrus and other land-use categories. The maps available at the JVA only included the GIS layers of irrigated farm units west of KAC with types and areas of crops inside each farm unit. Therefore, cloud-free high-resolution images of Sentinel-2 and medium resolution images of Landsat 8 were used to map the land use/cover of the NJV. Landsat 8 images, for path 174 and row 37, included level-1 data from the operational land imager (OLI) and thermal infrared sensor (TIRS). These were also used to derive SEBAL-ET for the year 2019 (Table 1). For Sentinel-2 data, three images were used for mapping land use/cover. These were level-1C data acquired in March, August, and November. The 10-m resolution data of bands 2 (blue), 3 (green), 4 (red), and 8 (near infrared) were used in this study.
Mapping of land use/cover was carried out using a combination of methods that included digital and visual interpretation, aided by GIS layers of farm units and ground surveys. The OLI and Sentinel-2 images were transferred into layers of the normalized difference vegetation index (NDVI). The OLI data were stacked in one file and were transformed into 12 spectral classes using the unsupervised classification with the iterative self-organizing data analysis technique (ISODATA) algorithm [9]. The NDVI layers derived from Sentinel-2 were used to decide on the types of crops and land cover based on temporal changes in NDVI values. The image of March showed the peak NDVI values for rainfed cereals and vegetables and high values of NDVI for citrus and fruit trees. Therefore, this NDVI layer was used to delineate all areas of irrigated and rainfed crops in the NJV. The NDVI layer of November image, on the other hand, showed the areas of irrigated vegetables and citrus, when field crops had not emerged yet. Using GIS, this NDVI layer was intersected with the NDVI layer of March to delineate the borders of citrus and vegetables. Finally, the NDVI layer derived from the image of August was used to separate the area of citrus from other crops as it showed the peak values of NDVI for citrus and fruit trees, as no vegetables or cereals were grown during this time of year. Differentiation of irrigated fodders, fruit trees, and mixed crops was based on JVA data for the irrigated farm units and ground observations. The map of land use/cover was verified using the GIS layer of farm units, provided by the JVA, and the ground observations collected during field visits to the NJV. In order to derive the water-use categories needed for applying water accounting, the map of land use/cover was reclassified into the water-use categories used in WA+ system.
2.2.3. Water Inflows to the NJV
Water inflows to the NJV included the amounts of surface and groundwater diverted to KAC and the surface water flow from rainfall. The data of water inflows to KAC were obtained from the annual water budget report of 2019, prepared by the MWI [36]. It included the inflows from the transboundary water resources of Yarmouk River and the Peace Water stored in Tiberias (Sea of Galilee). It also included the water delivered from Al-Wehdah Dam, Mukheiba wells and the dams on the eastern side wadis. Water inflows from streams included the amounts measured by the JVA for wadis El-Yabis, El-Arab, Zeglab, Waqqas, and Rajib. The amounts of inflow from rainfall for the NJV was calculated using rainfall data and runoff coefficients reported in previous studies for the NJV and the side wadis [37,38,39]. The volume of rainfall inflow was calculated for both of recorded rainfall and WaPOR precipitation, which represented the Climate Hazards Group InfraRed Precipitation with Station (CHIRPS) quasi-global rainfall dataset [40]. The annual precipitation (PCP) data of WaPOR (5-km resolution) was converted to a vector shape file representing polygons or parcels with different rainfall depths. The layer was then clipped to the borders of the NJV and GIS functions were applied to derive the weighted average of rainfall volume for the NJV. For MWI and JMD data, the volume of rainfall was calculated by multiplying the rainfall record of each station by the area represented by that station, derived using the nearest neighbor interpolator of Thiessen polygons [10].
2.2.4. Water Outflows from the NJV
In AWA, the major part of water outflow is the actual ET. For irrigated areas, this is usually the net irrigation depth under nonsaline soil and water conditions. The amount of water applied to an irrigated crop is known as the gross irrigation depth. Under no water and soil salinity conditions, the net irrigation water requirements (NIWR) equal the ETc, while the gross irrigation depth equals the gross irrigation water requirements (GIWR), which is obtained by dividing NIWR by the irrigation efficiency. The amounts of water provided to farmers from KAC during 2019 were obtained from the JVA, while amounts pumped from groundwater were obtained from the MWI. The data of other outflows included the volumes of water transferred to the Capital Amman, Wadi Al-Arab dam (Temporary storage), and the southern parts of the JV. The outflows of ET were obtained from remote-sensing data of WaPOR and SEBAL. The data of WaPOR included the fluxes of evaporation (E), transpiration (T), and interception (I). These were downloaded for the NJV and were summarized for each water-use category derived from the land-use/cover map (Table 2). The data of ET from SEBAL was mainly to calibrate the data of WaPOR, as a previous study showed that WaPOR data was overestimating ETa at the basin level [29]. The use of SEBAL to calibrate WaPOR could be justified by the fact that SEBAL-ET was calibrated using ground data of gross irrigation depth and farm irrigation efficiency during the implementation of a rapid water accounting cycle for the NJV [41] and through the activities of the ERANETMED project.
2.2.5. WA+ Sheets and Performance Indicators
Data of inflows and outflows were filled in WA+ sheets. The first sheet, known as the resource base, was used to analyze inflows and outflows, while the second sheet (evapotranspiration) was used to partition ET for the different water-use categories into beneficial and nonbeneficial proportions. Outputs from both sheets were used to calculate the performance indicators of water accounting needed for assessing water resources and uses [5,13,30]. The purpose of these numeric indicators was to provide a clear overview of water resources issues in the NJV and the proportions of water that were beneficially used. The ET indicators included the beneficial, the agricultural, and nonagricultural fractions of ET, in addition to the transpiration fraction (T/ET). The water resources indicators included the available water, the managed fraction of water, the basin closure (utilized flow/available water), and the stationary index (change in water storage/ET). Considering the problem of water deficiency in the NJV, outputs from WA+ and performance indicators would provide figures on volumes of water that could be developed from recoverable water, as a possible solution for water deficiency in this area.
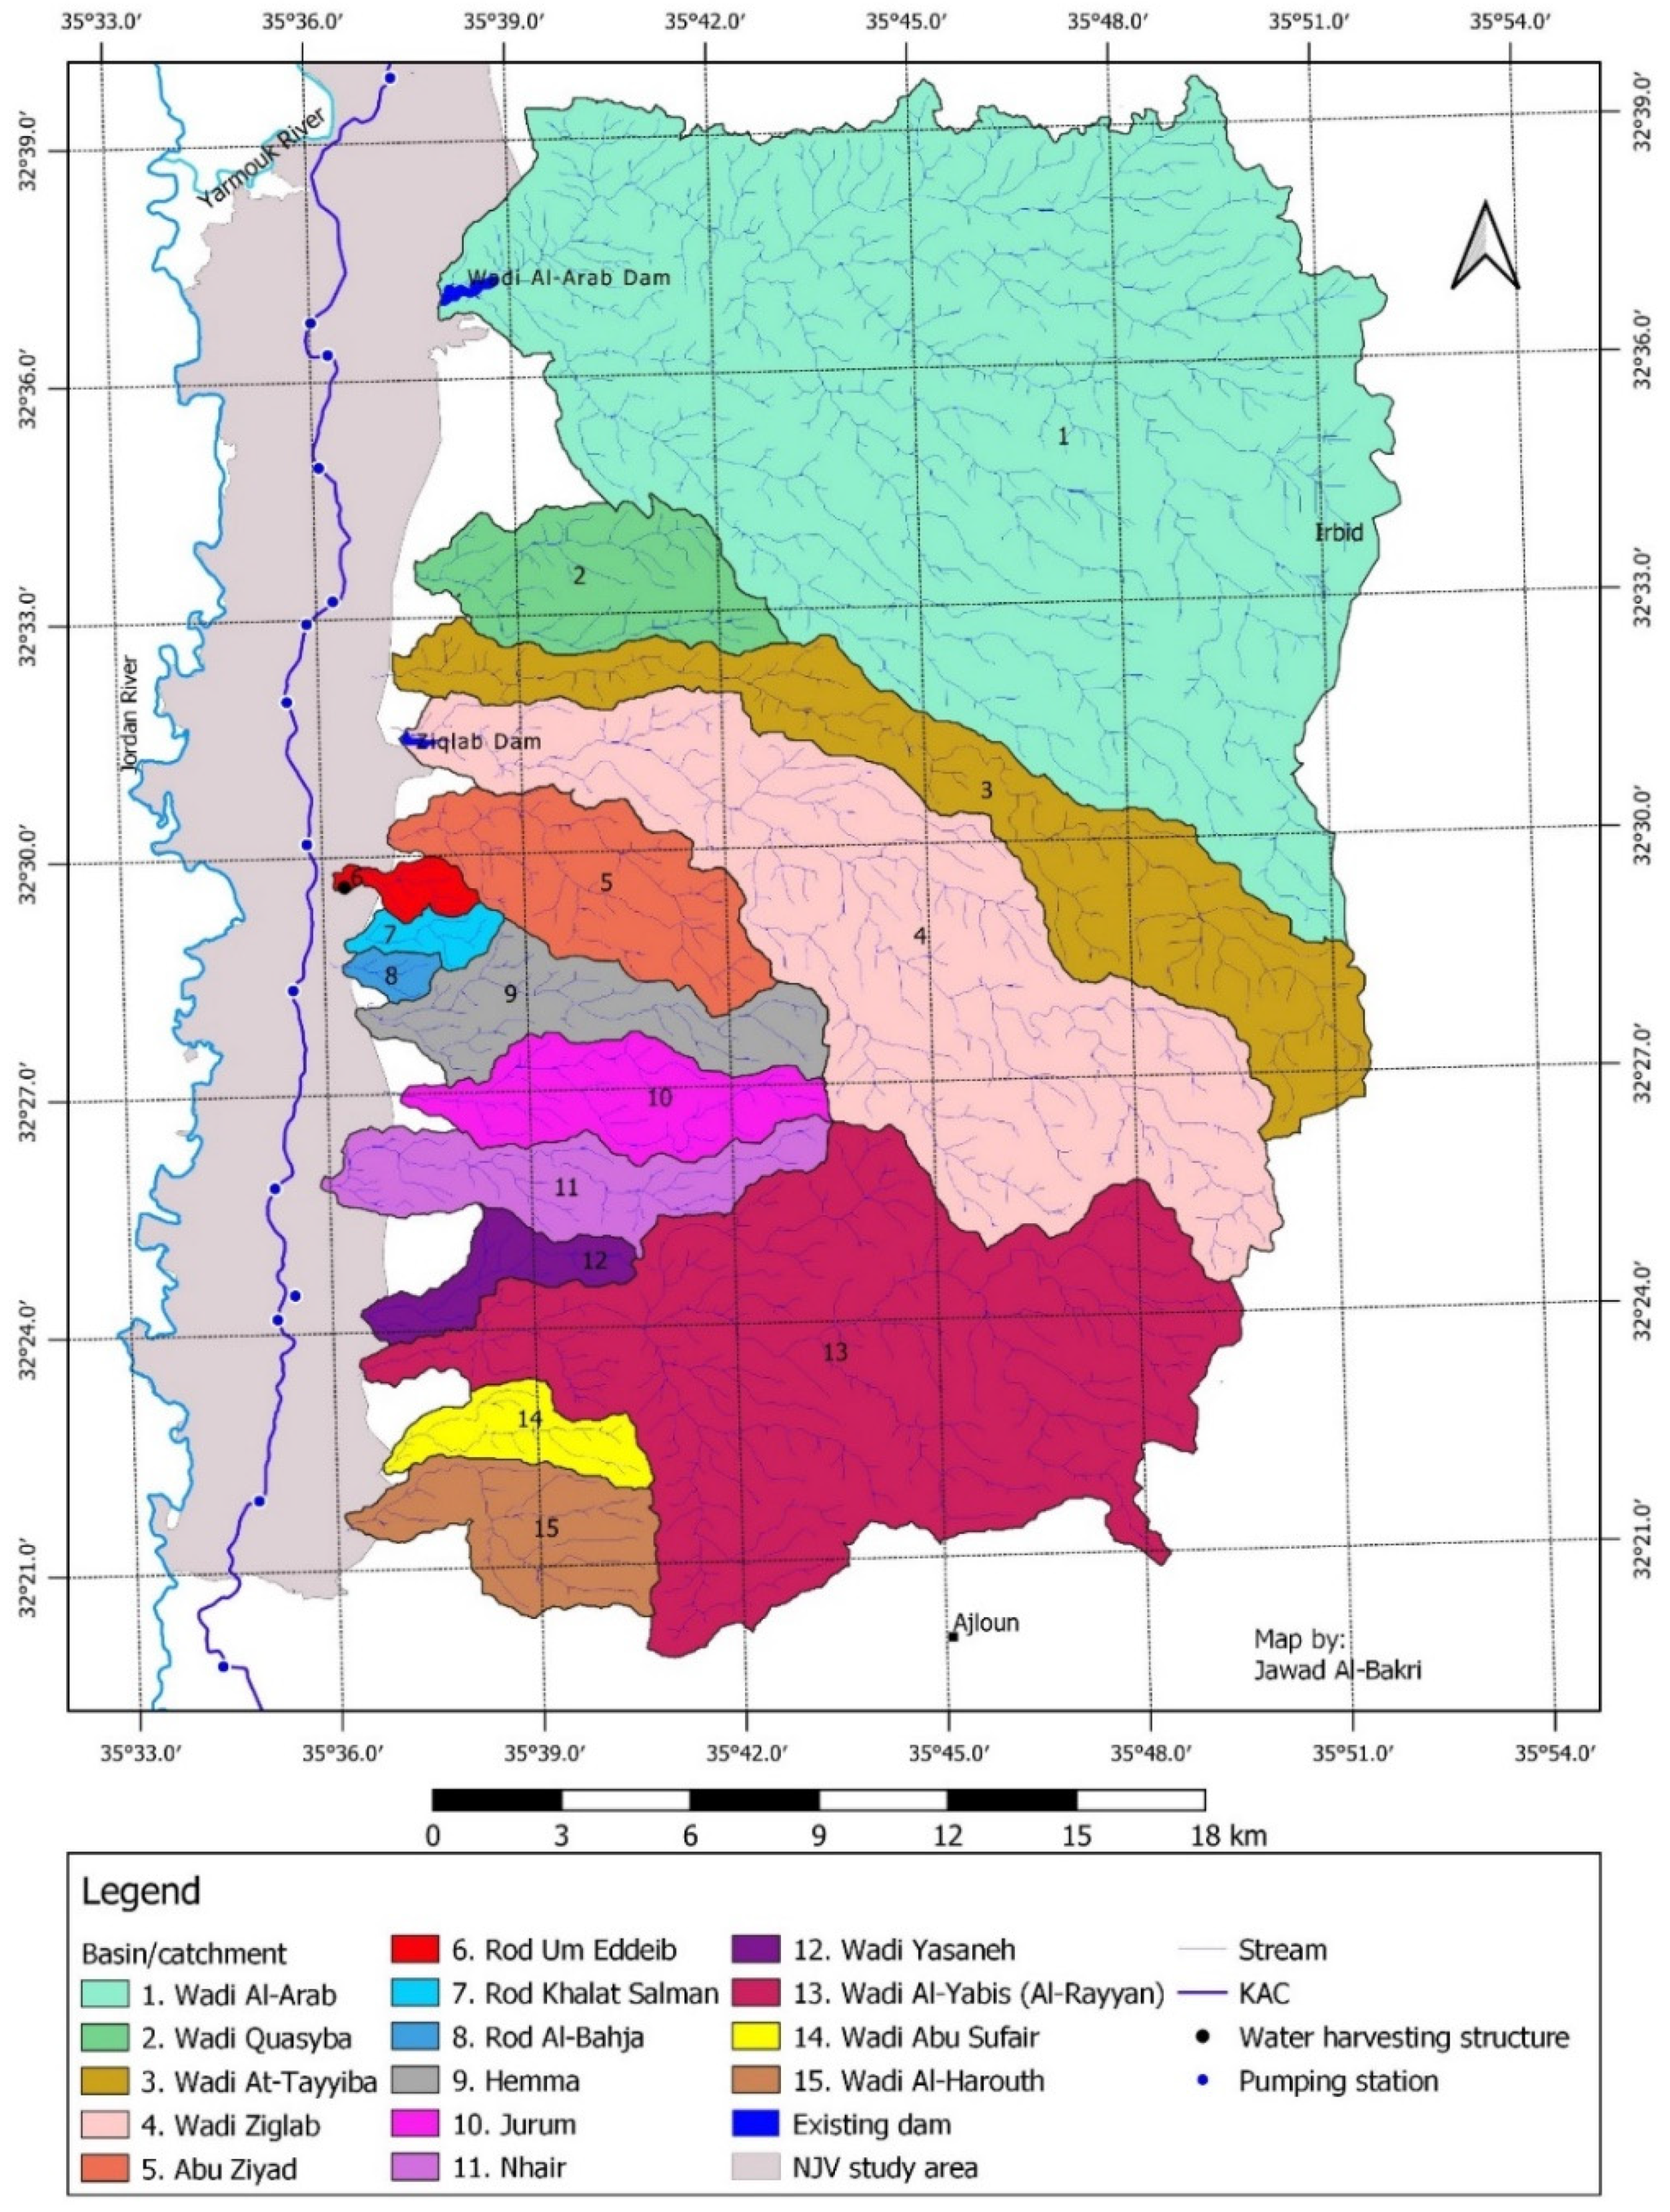
2.2.6. Mapping Surface Water from the Side Wadis
Two dams were constructed on the eastern side wadis of the NJV, while the Al-Wehdah dam was constructed in the upstream area. Therefore, development of surface water resources for solving water deficiency in the NJV could be made possible by constructing other dams on the eastern side wadis. The volumes of water that could be harvested were calculated using GIS tools, climatic data, and outputs from previous studies on surface water hydrology of the side wadis. In this study, catchments of the side wadis were precisely delineated using the functions of terrain analysis included in GIS. The delineation was based on a digital elevation model (DEM) that had a resolution of 20 m. Streams networks and borders of catchments were derived by applying different GIS functions of terrain analysis using the 20 m DEM [10]. These included filling of DEM sinks, generation of flow direction and flow accumulation layers, and delineation of catchments. Outputs from this analysis were converted from raster format to vector layers of catchments and stream networks. Rainfall data were obtained from MWI and JMD data for the six weather stations for the period 1984–2019. A runoff coefficient of 5% was adopted by this study to calculate possible volumes of water that could be harvested by constructing new dams. The runoff coefficient, which was adopted by the JVA, was in agreement with findings of previous hydrological studies for the side wadis [37,38,39]. The possible volumes that could be harvested on side wadis were then calculated by multiplying the runoff coefficient with the rainfall depth for each part of catchment.
3. Results
3.1. Land- and Water-Use Categories
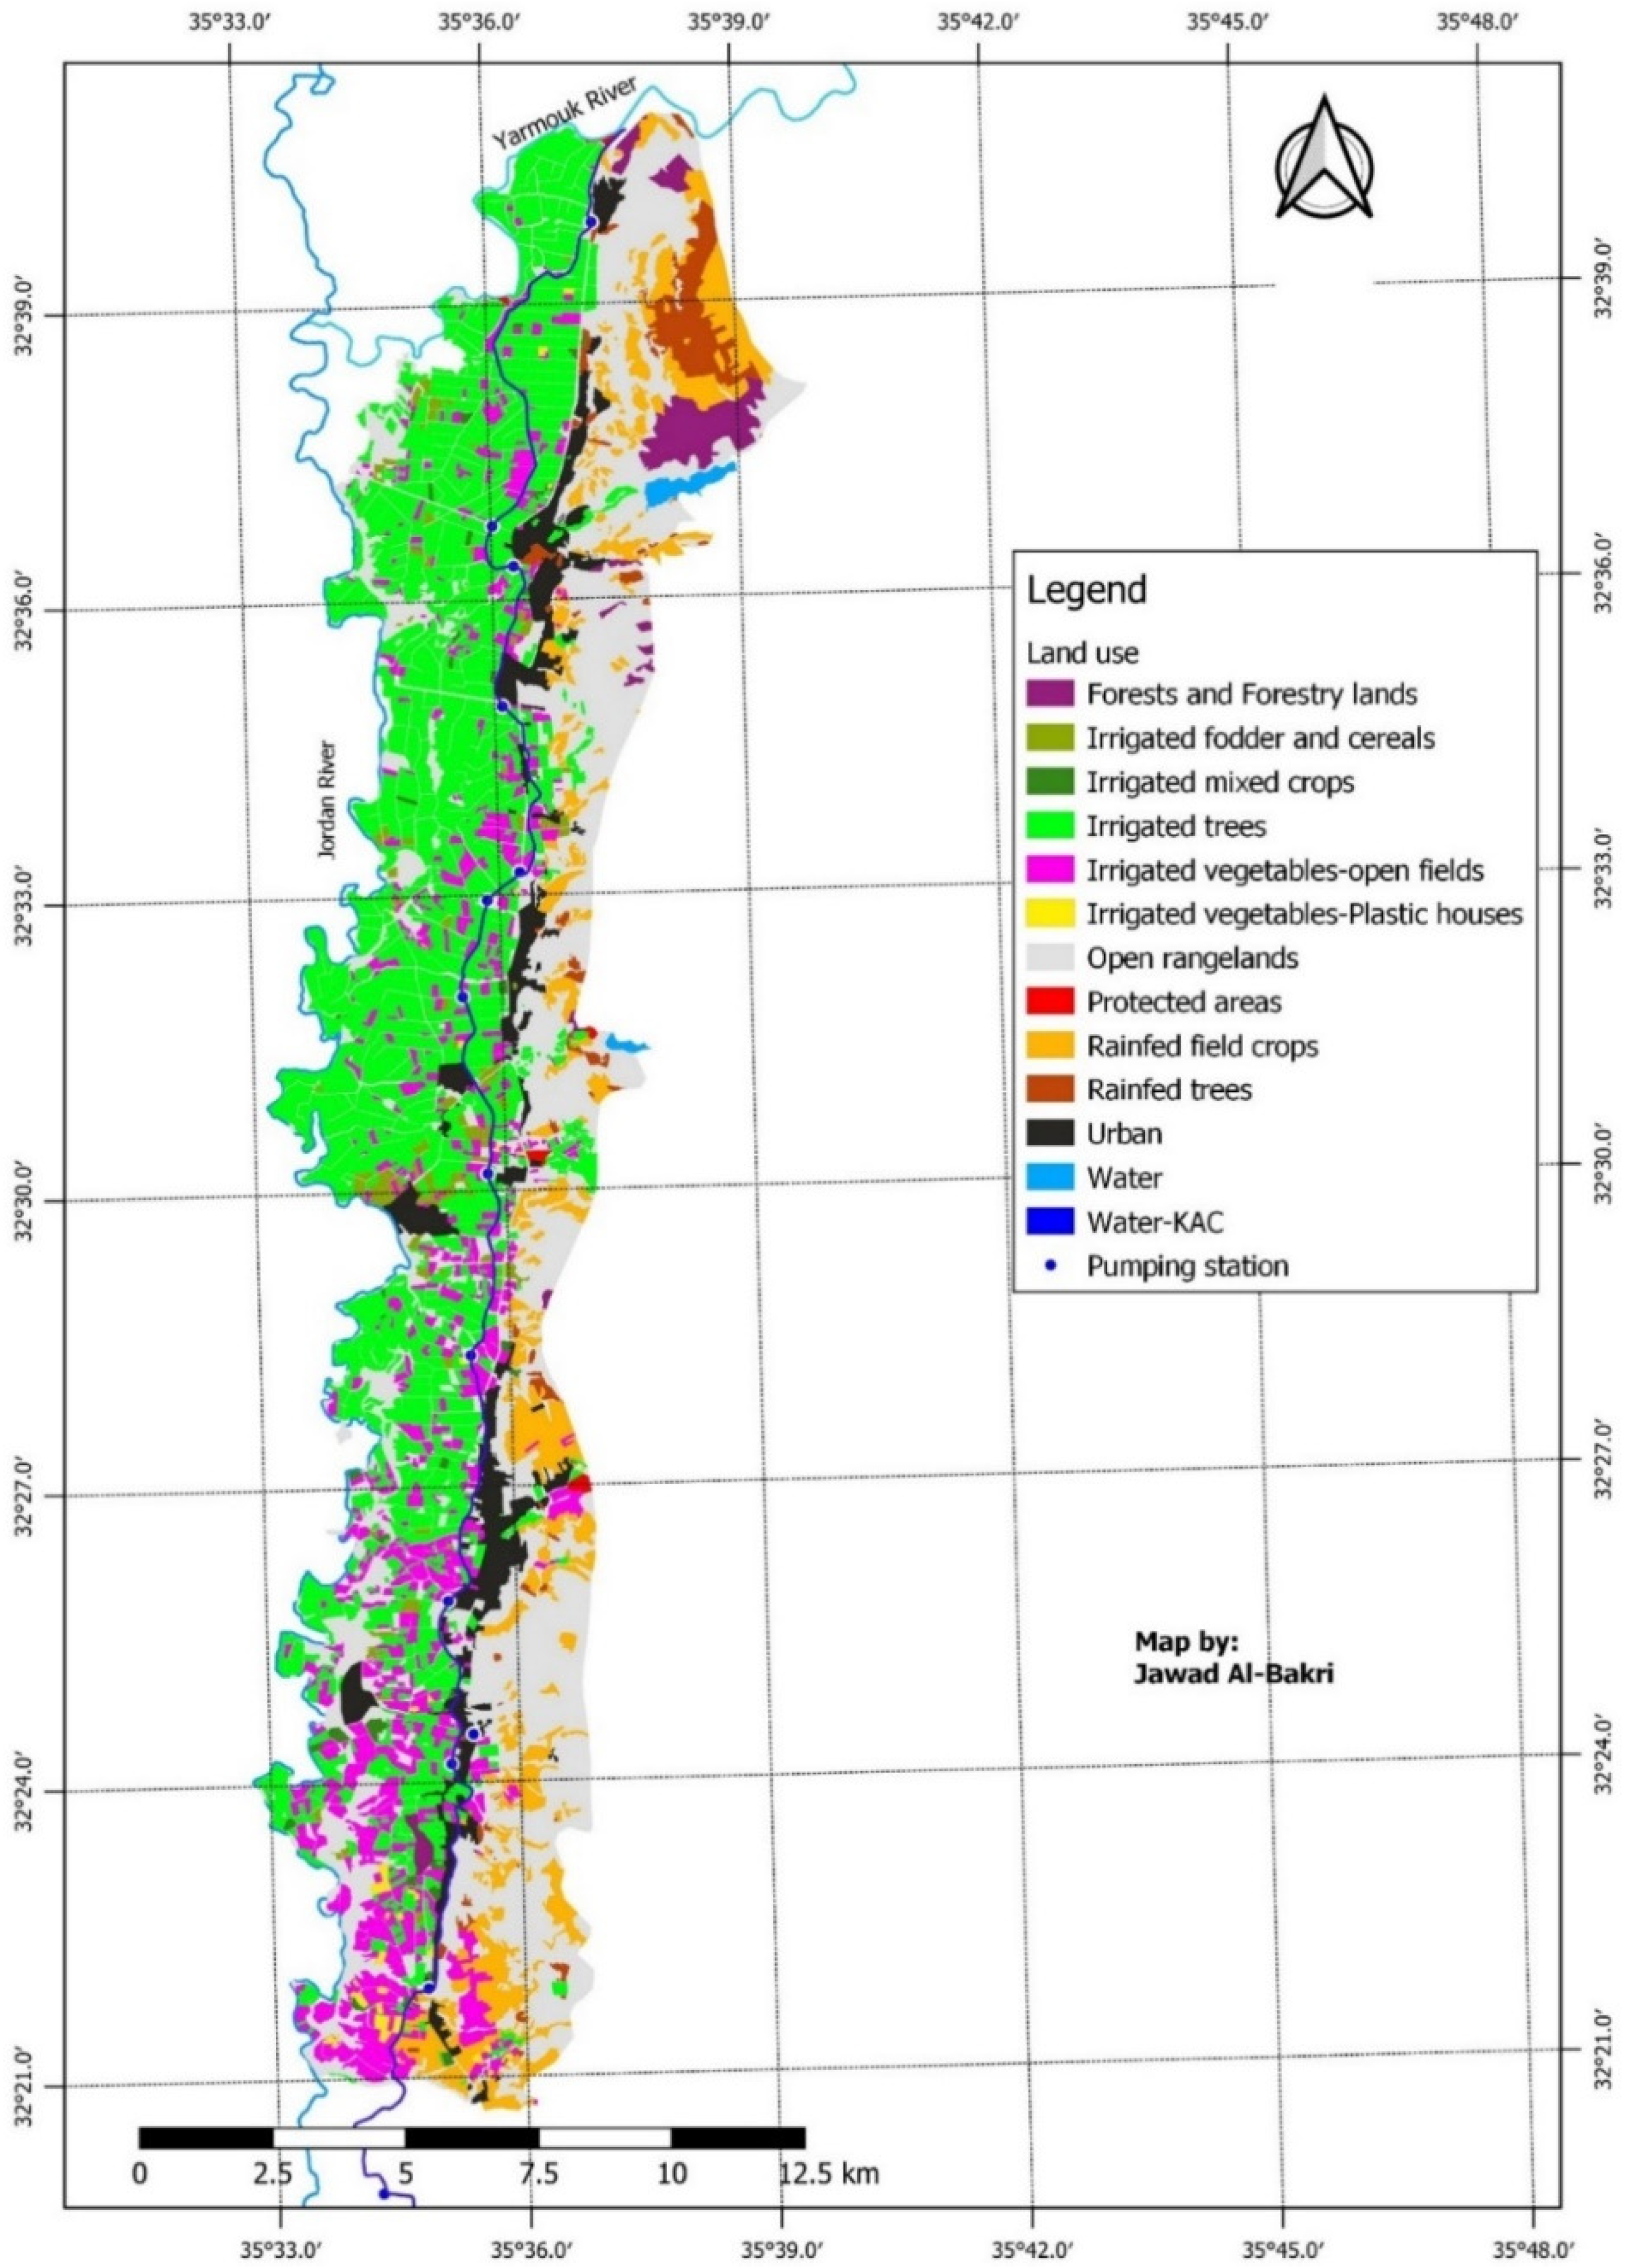
Results of land-use/cover mapping showed that the total irrigated area in the NJV during 2019 was 8.63 thousand ha constituting 47% of the total area of the NJV. About 96% of the irrigated area was located in the farm units distributed and managed by the JVA, while the remaining irrigated areas were to the east of KAC outside the JVA farm units. Other agricultural activities included 2000 ha of rainfed area of cereals and trees. Figure 3 shows the spatial distribution of land use/cover in the NJV during 2019. Detailed analysis of land-use/cover map (Table 2) showed that agricultural areas of both of irrigated and rainfed areas constituted 59% of the total area of the NJV. Citrus was the main irrigated crop and constituted 80% of the total irrigated area. About 33% of the NJV area was used as an open rangeland to support the grazing herds of sheep and goats.
3.2. Water Inflows and Crop Water Requirements
Water inflows to KAC from surface and groundwater resources reached 155 MCM, while calculated rainfall volumes ranged between 67.5 and 85.5 MCM for WaPOR and recorded data, respectively (Table 3). Other sources of water included 0.6 MCM of groundwater pumped by farmers and 4.5 MCM from the flows of the eastern side wadis. Amounts of treated wastewater (TWW) in the NJV were minor (0.15 MCM)/year) and were discharged from the North Shouneh wastewater treatment plant. These were not used by farmers due to their high levels of salinity [42].
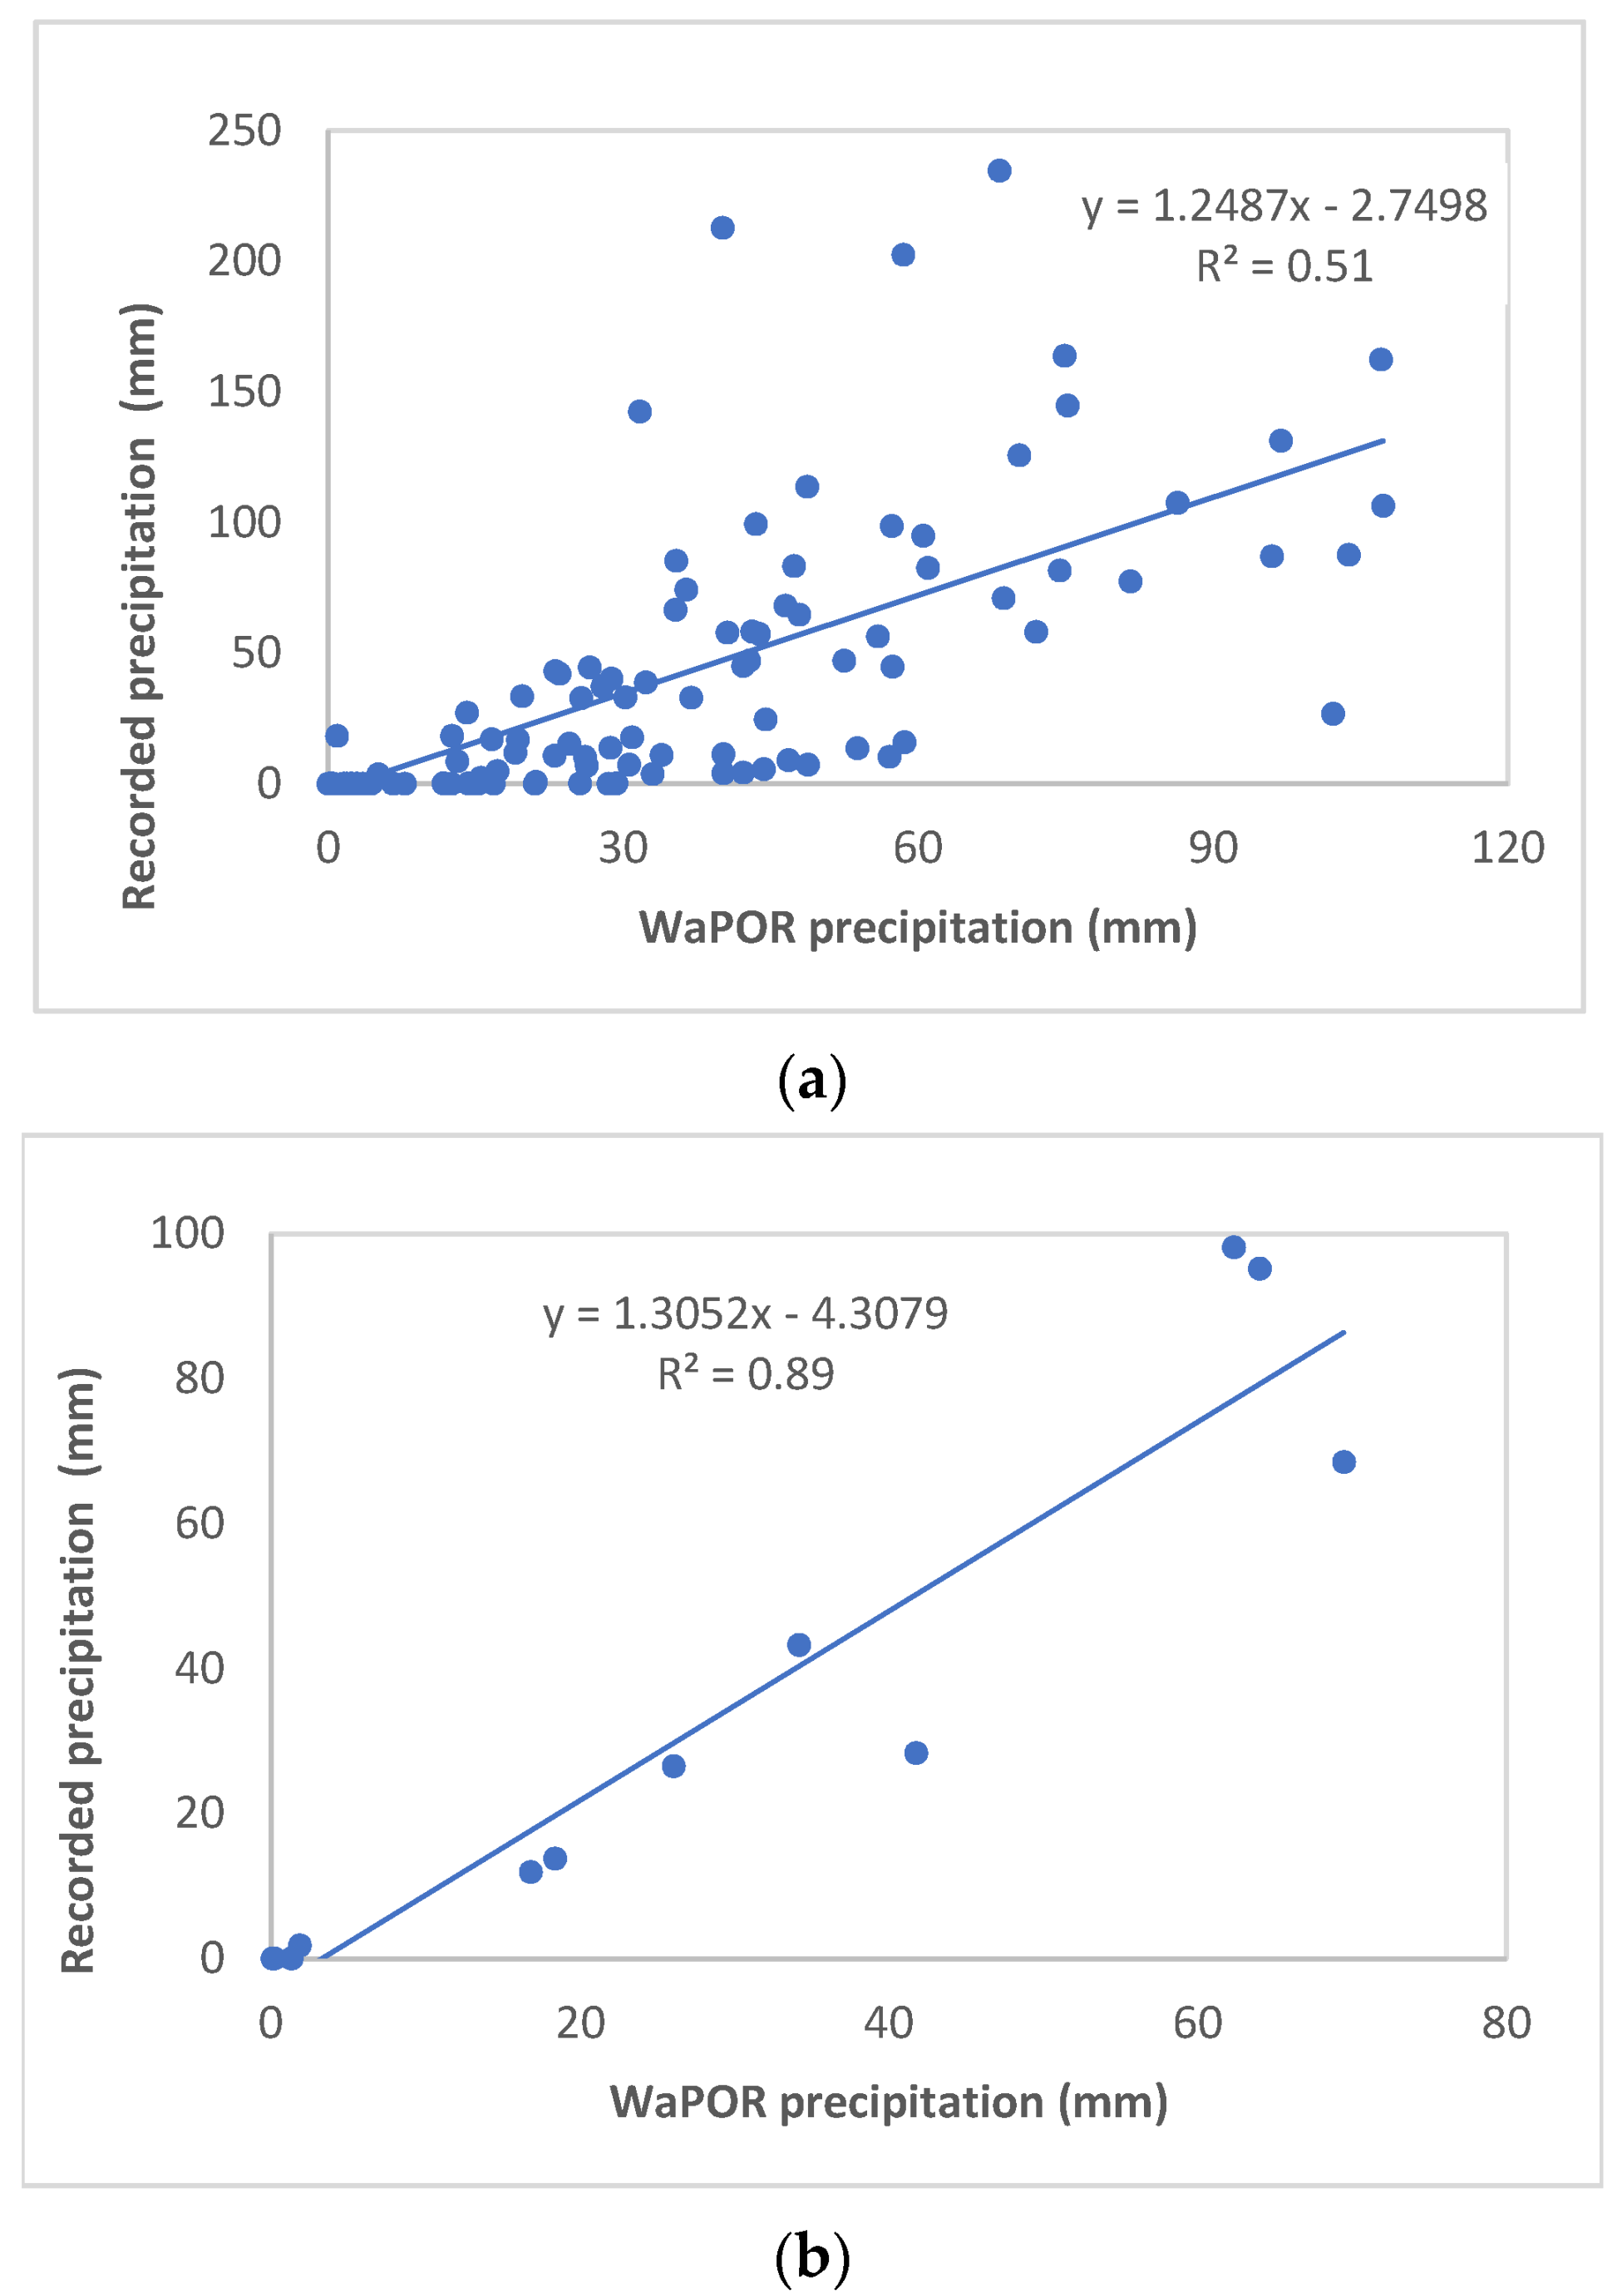
In terms of rainfall, the volume of inflow calculated from WaPOR precipitation data was less than the volume calculated from ground records. For the station of Baqoura, the average annual rainfall calculated from WaPOR precipitation data during 2009–2019 was 338 mm, while the mean annual rainfall recorded in Baqoura station was 389 mm, although significant correlations (p < 0.05) were obtained between both datasets (Figure 4). The correlation between both datasets for the 2009–2019 period showed that WaPOR precipitation data overestimated rainfall during some months and underestimated rainfall in other months (Figure 4). The correlation for the average monthly values during the same period showed that the overall trend is an underestimation of rainfall (Figure 4).
3.3. Water Outflows
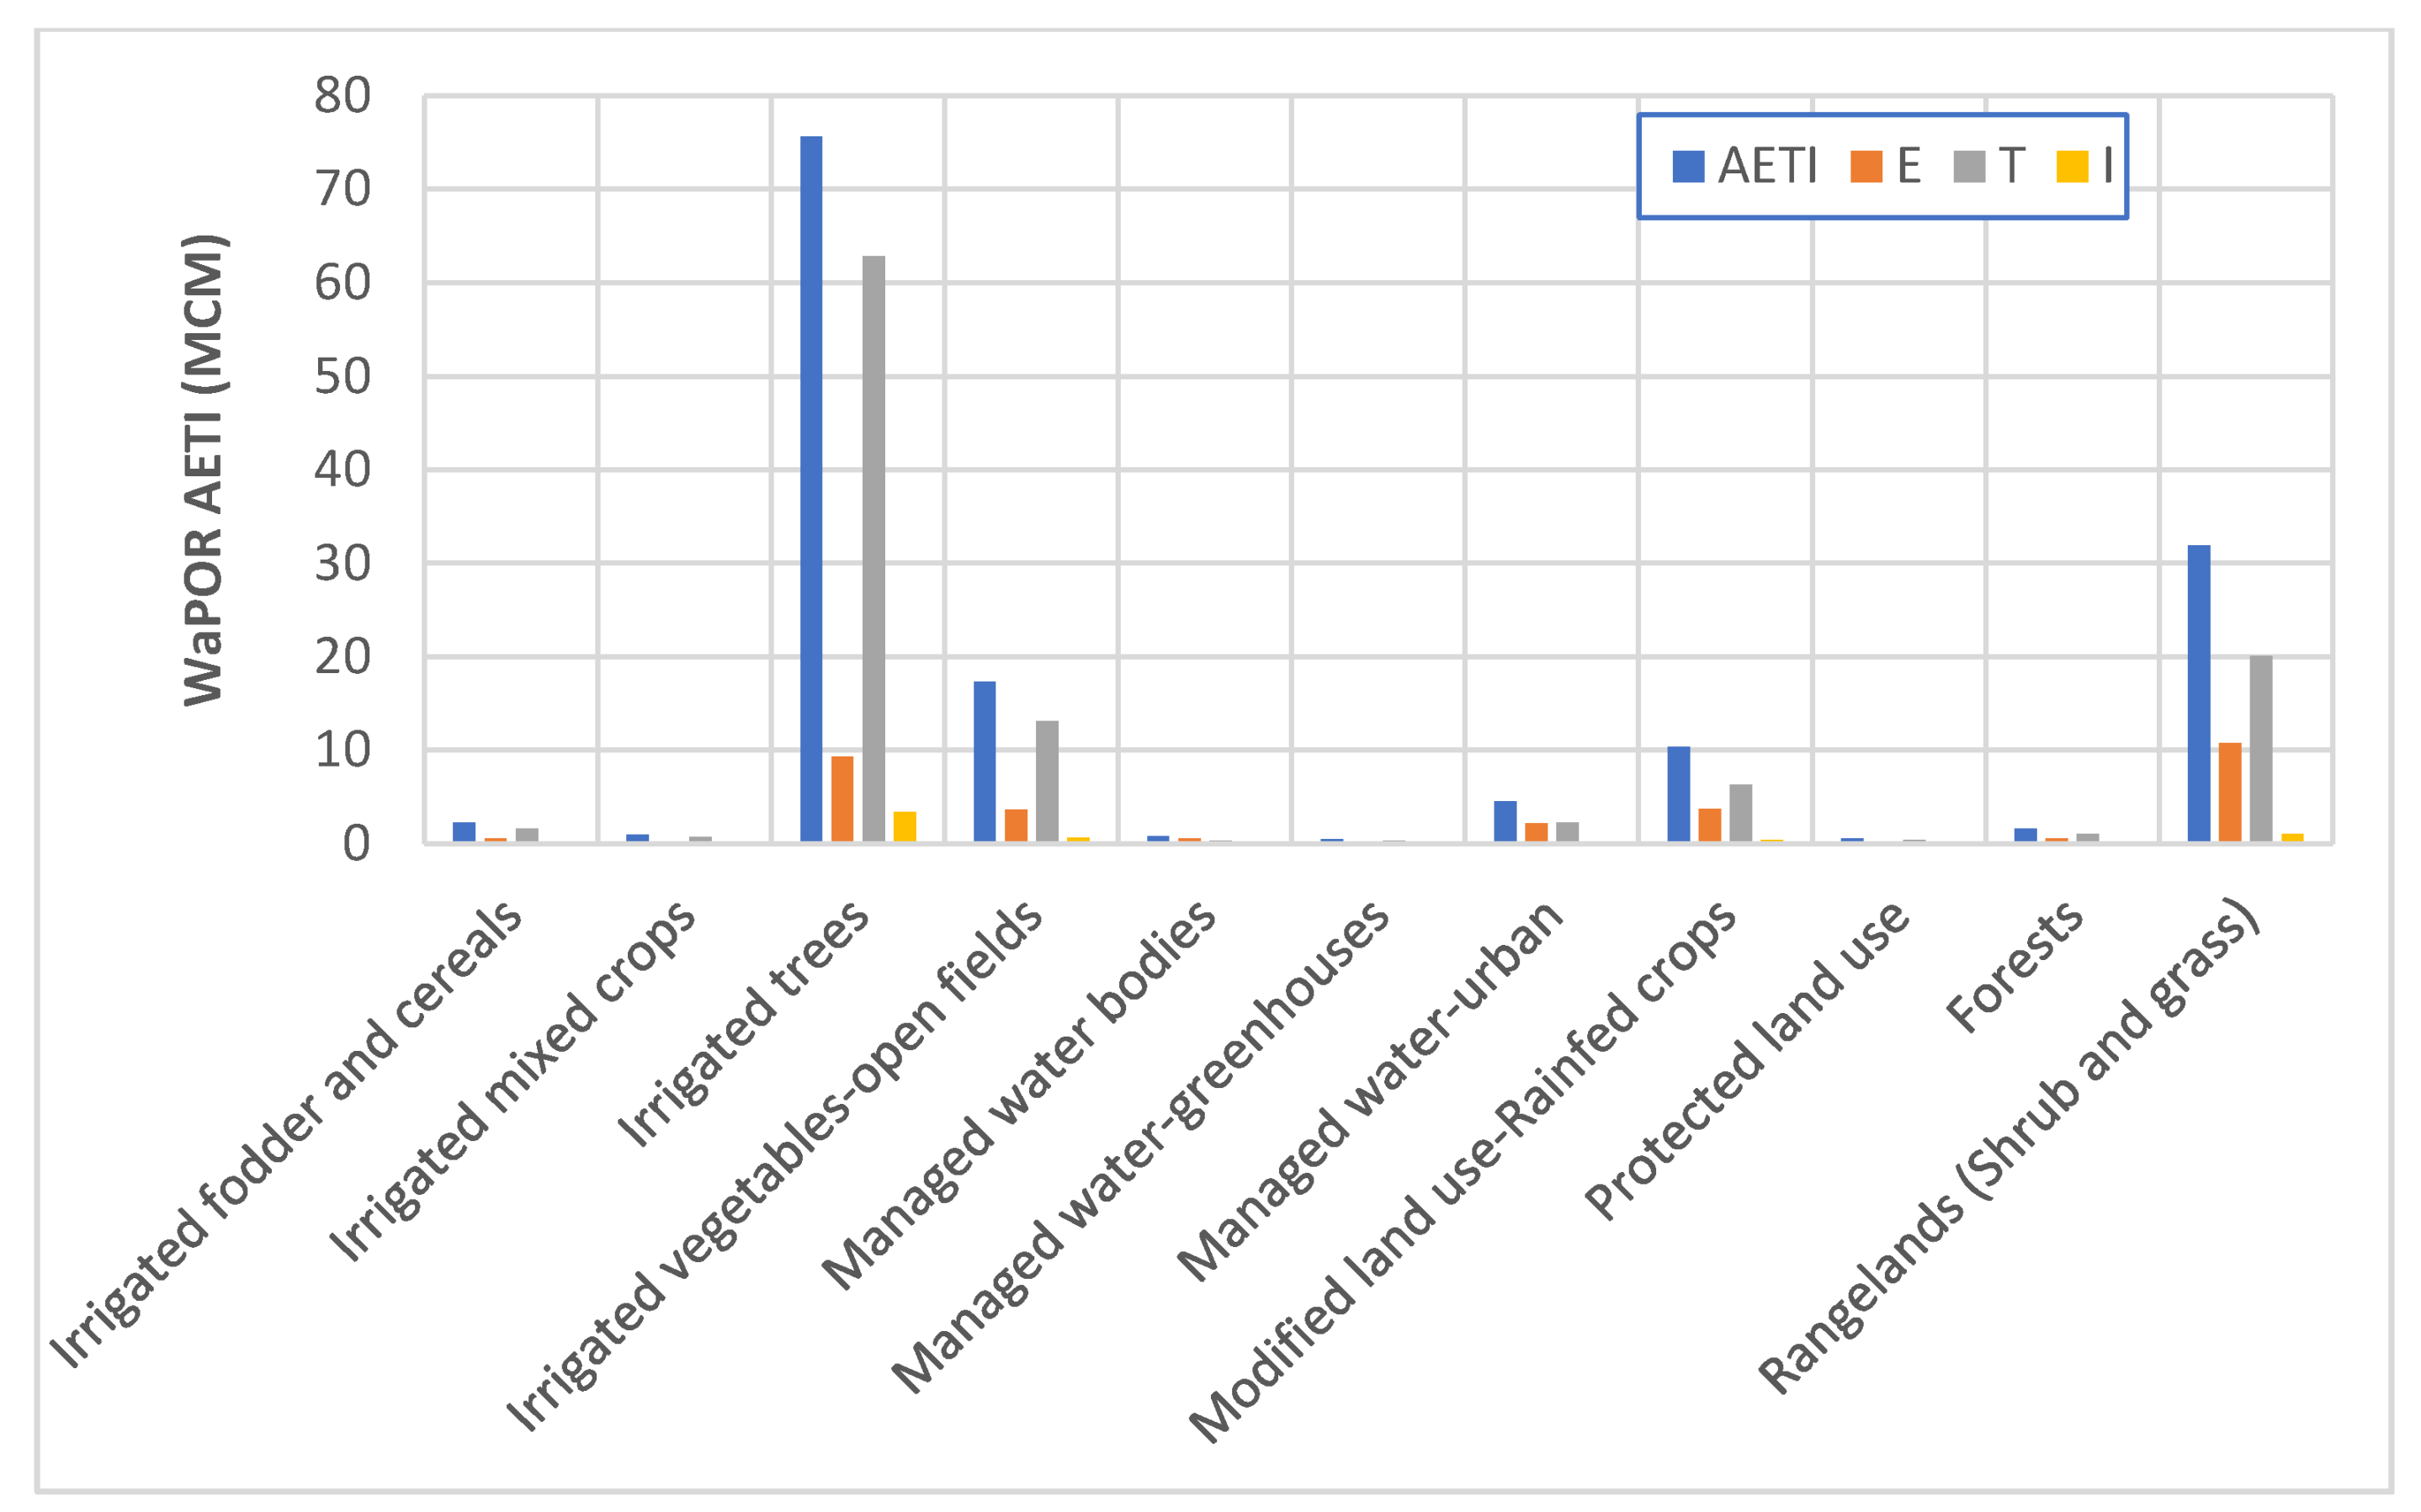
The main outflow in the NJV was the AETI from irrigated and rainfed areas, followed by the interbasin transfer (Table 4). The estimated runoff in this agricultural area was 3.4 MCM, which accounted for 2.3% of the total outflows. Detailed analysis of AETI from WaPOR data showed that managed water use constituted 70% of the AETI outflows, as summarized in Figure 5. The data of WaPOR, which were summarized for each water-use category using different GIS functions, showed that irrigated areas contributed to 66% of the total AETI (96 MCM out of 146 MCM), while rainfed areas and rangelands contributed to 30% of the total AETI.
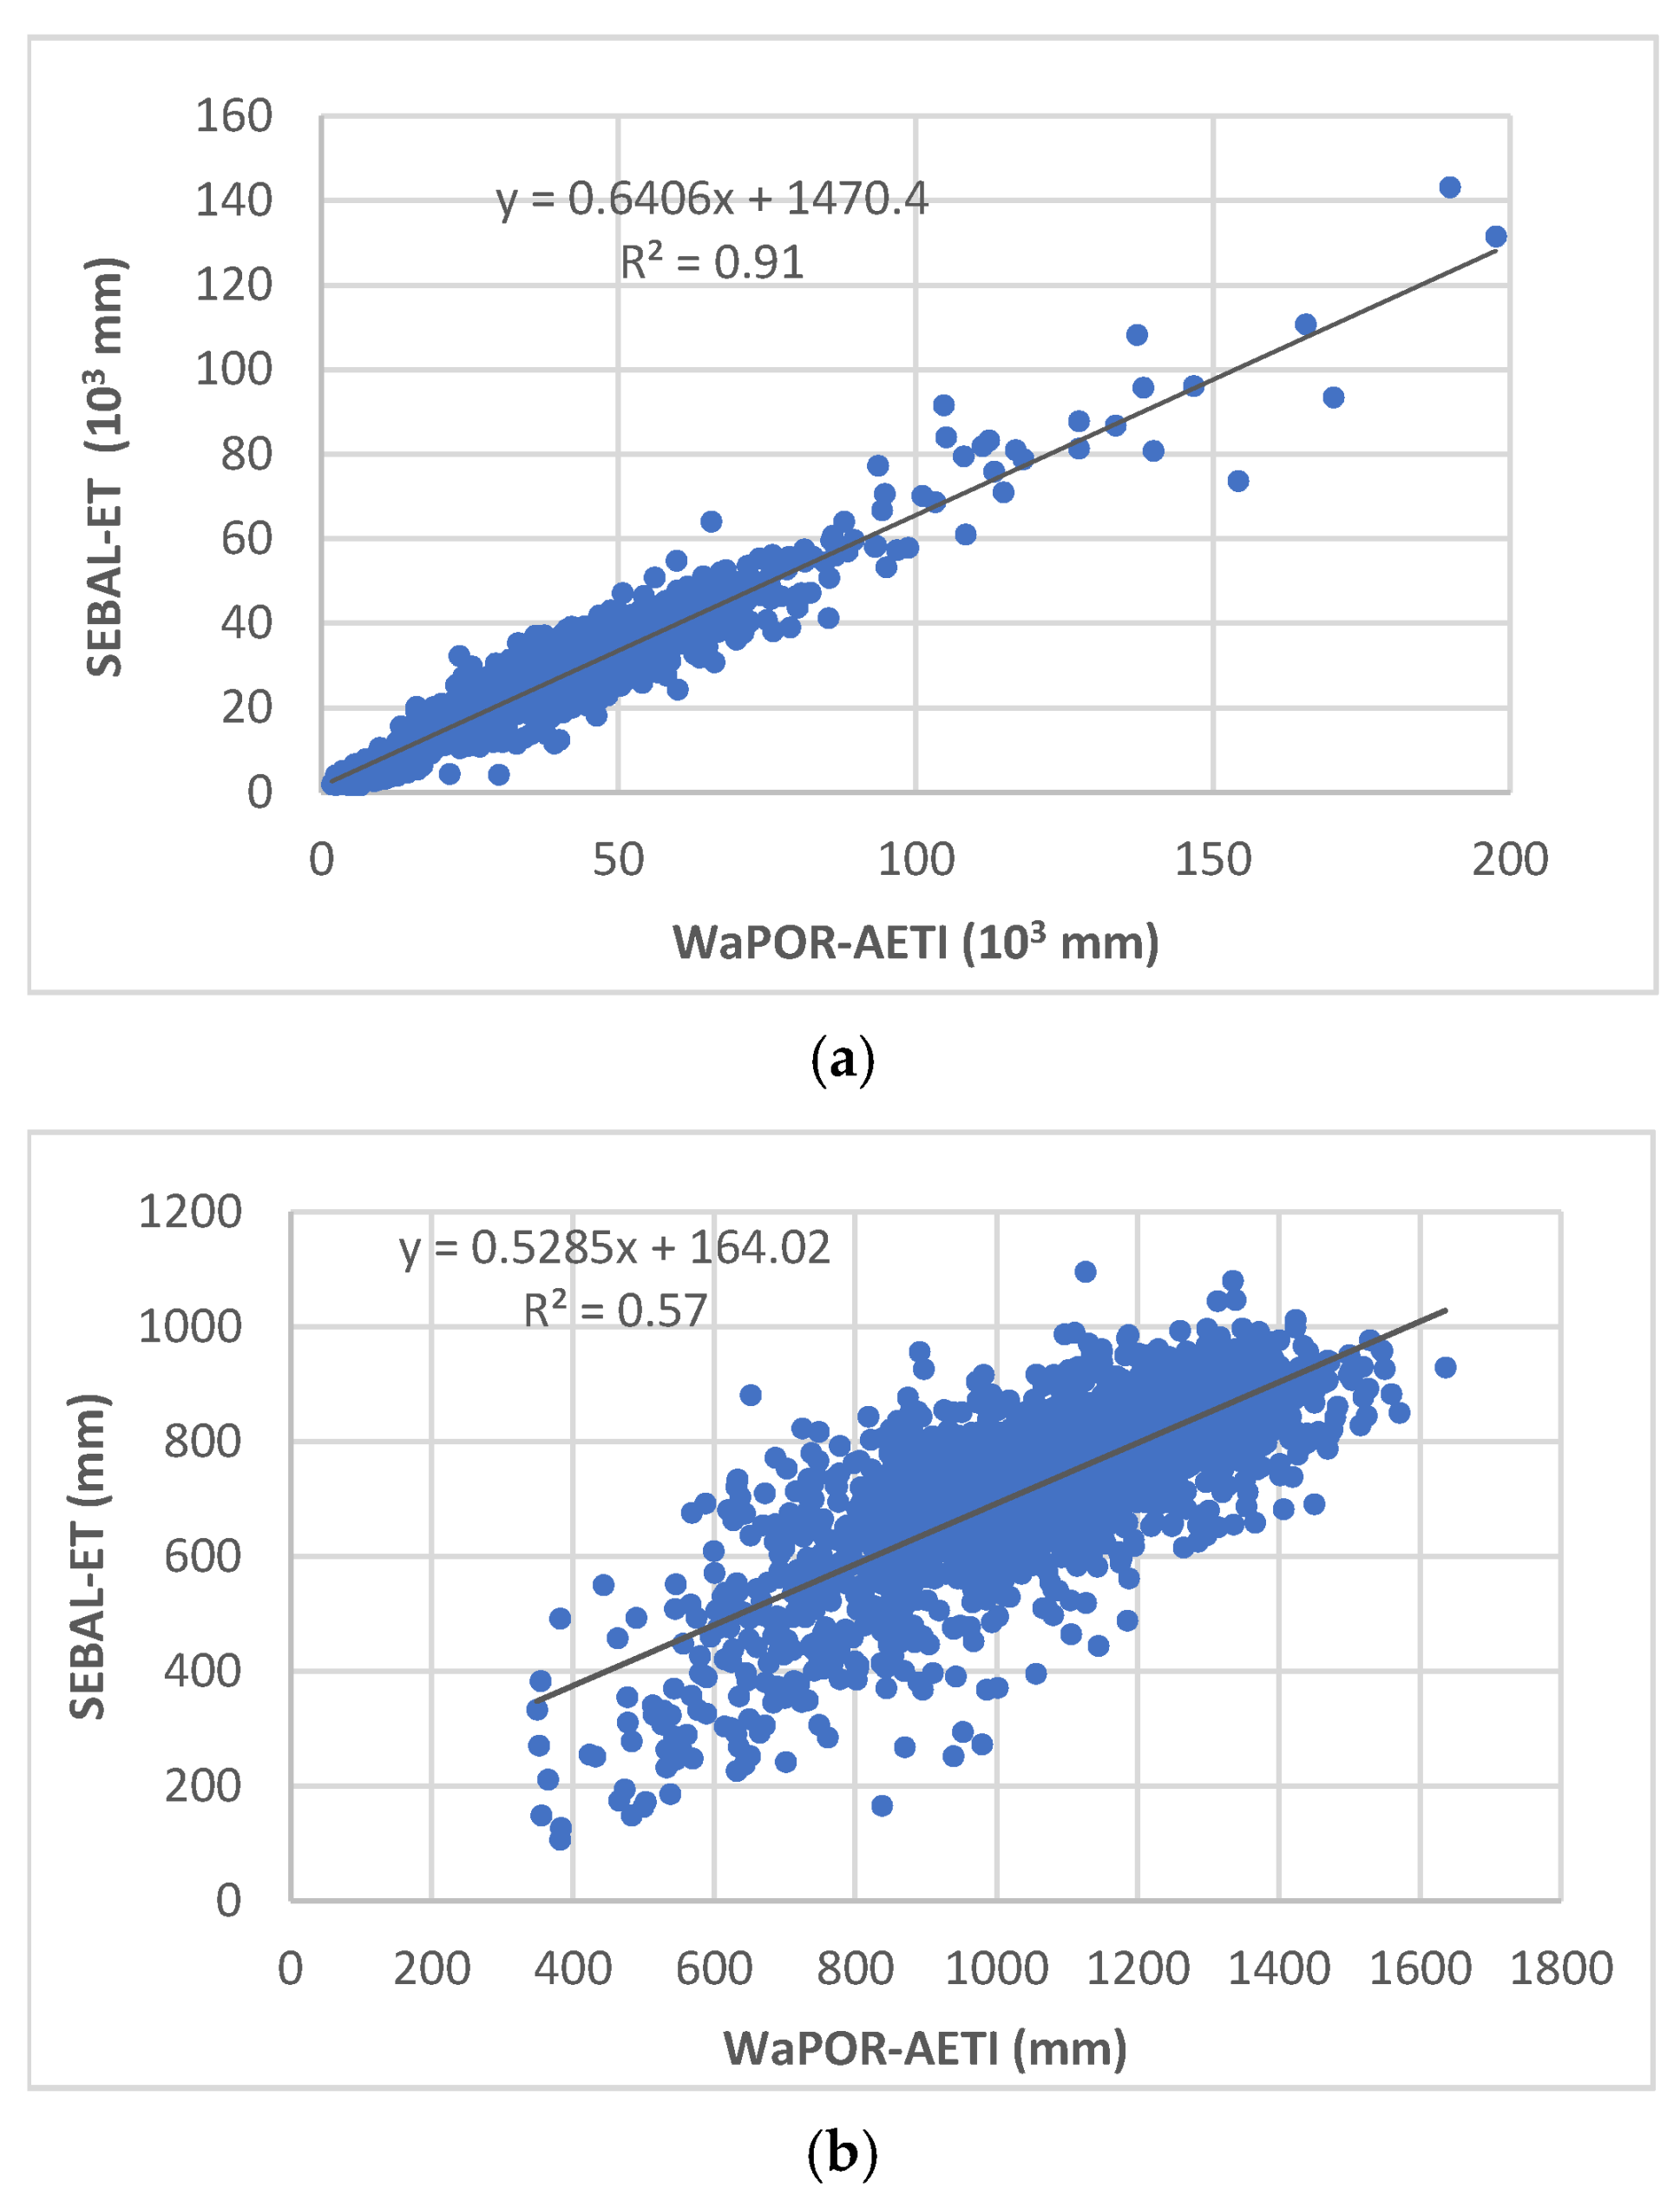
Considering the inflows and outflows data, the water balance for the NJV was in the range of −12.4 MCM (using WaPOR precipitation) to +5.6 MCM (using recorded rainfall). The differences in water balance were investigated by comparing the data of WaPOR-AETI with SEBAL-ET. Results showed that the total WaPOR-ET for irrigated areas was 92.4 MCM while the total ET obtained from SEBAL was only 73.6 MCM. In terms of total ET for farm units, both datasets of WaPOR-AETI and SEBAL-ET were significantly correlated (p < 0.05) with relatively high coefficient of determination (R2). However, WaPOR-ET data were overestimating ET for irrigated areas. The correlation between WaPOR-AETI and SEBAL-ET showed better correlations, with higher value when the correlation was based on the sum of ET for irrigated farm units compared with that based on the ET value at the pixel level of WaPOR-AETI (Figure 6).
3.4. Irrigation Water Demand
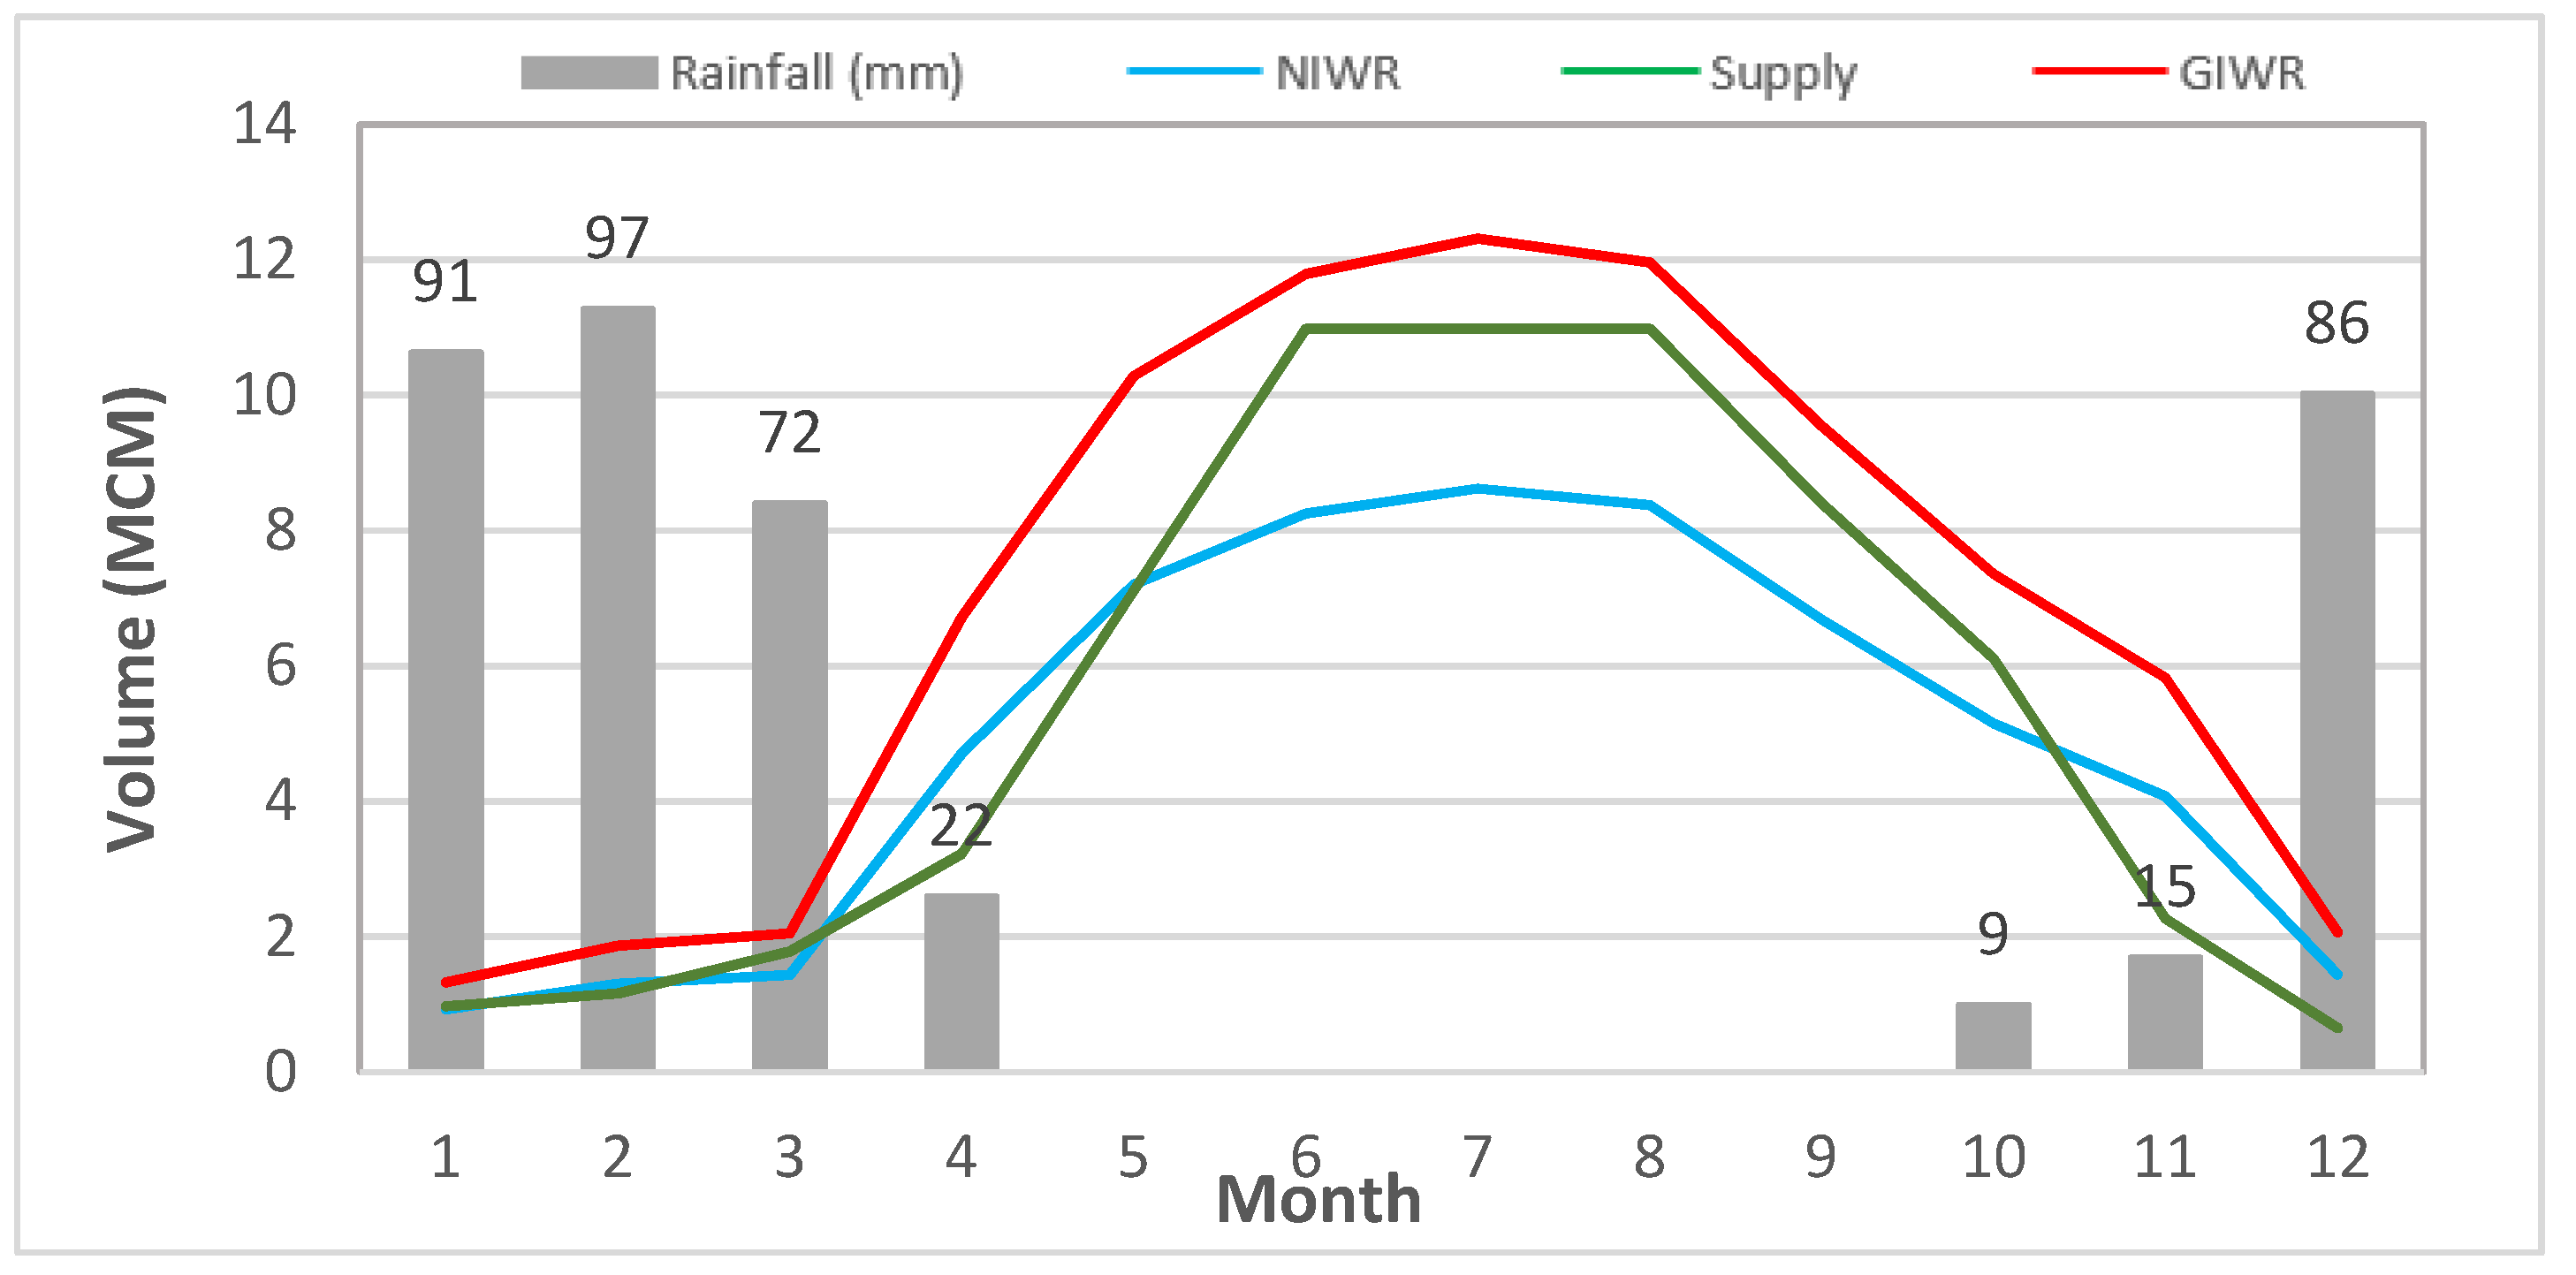
Calculations of ETc for irrigated farms showed that the NIWR and GIWR for irrigated areas in the NJV were 58.2 and 83.1 MCM, respectively. The total amounts delivered to these areas were 69 MCM, with an obvious gap between supply and demand (Figure 7). The calculations of ETc using climatic data and Kc values for the NJV showed that SEBAL provided better estimates of ET than WaPOR. In terms of water deficiency, the gap between supply and demand was observed throughout the year, indicating the problem of water deficiency in the NJV. The deficit in year 2019 was 16%, which was less than the average deficiency of 20–25% adopted by the JVA for water distribution to farmers. This could be attributed to the relatively good rainfall season of 2019, which provided most of GIWR during December–March (Figure 7).
3.5. WA+ Sheets and Performance Indicators
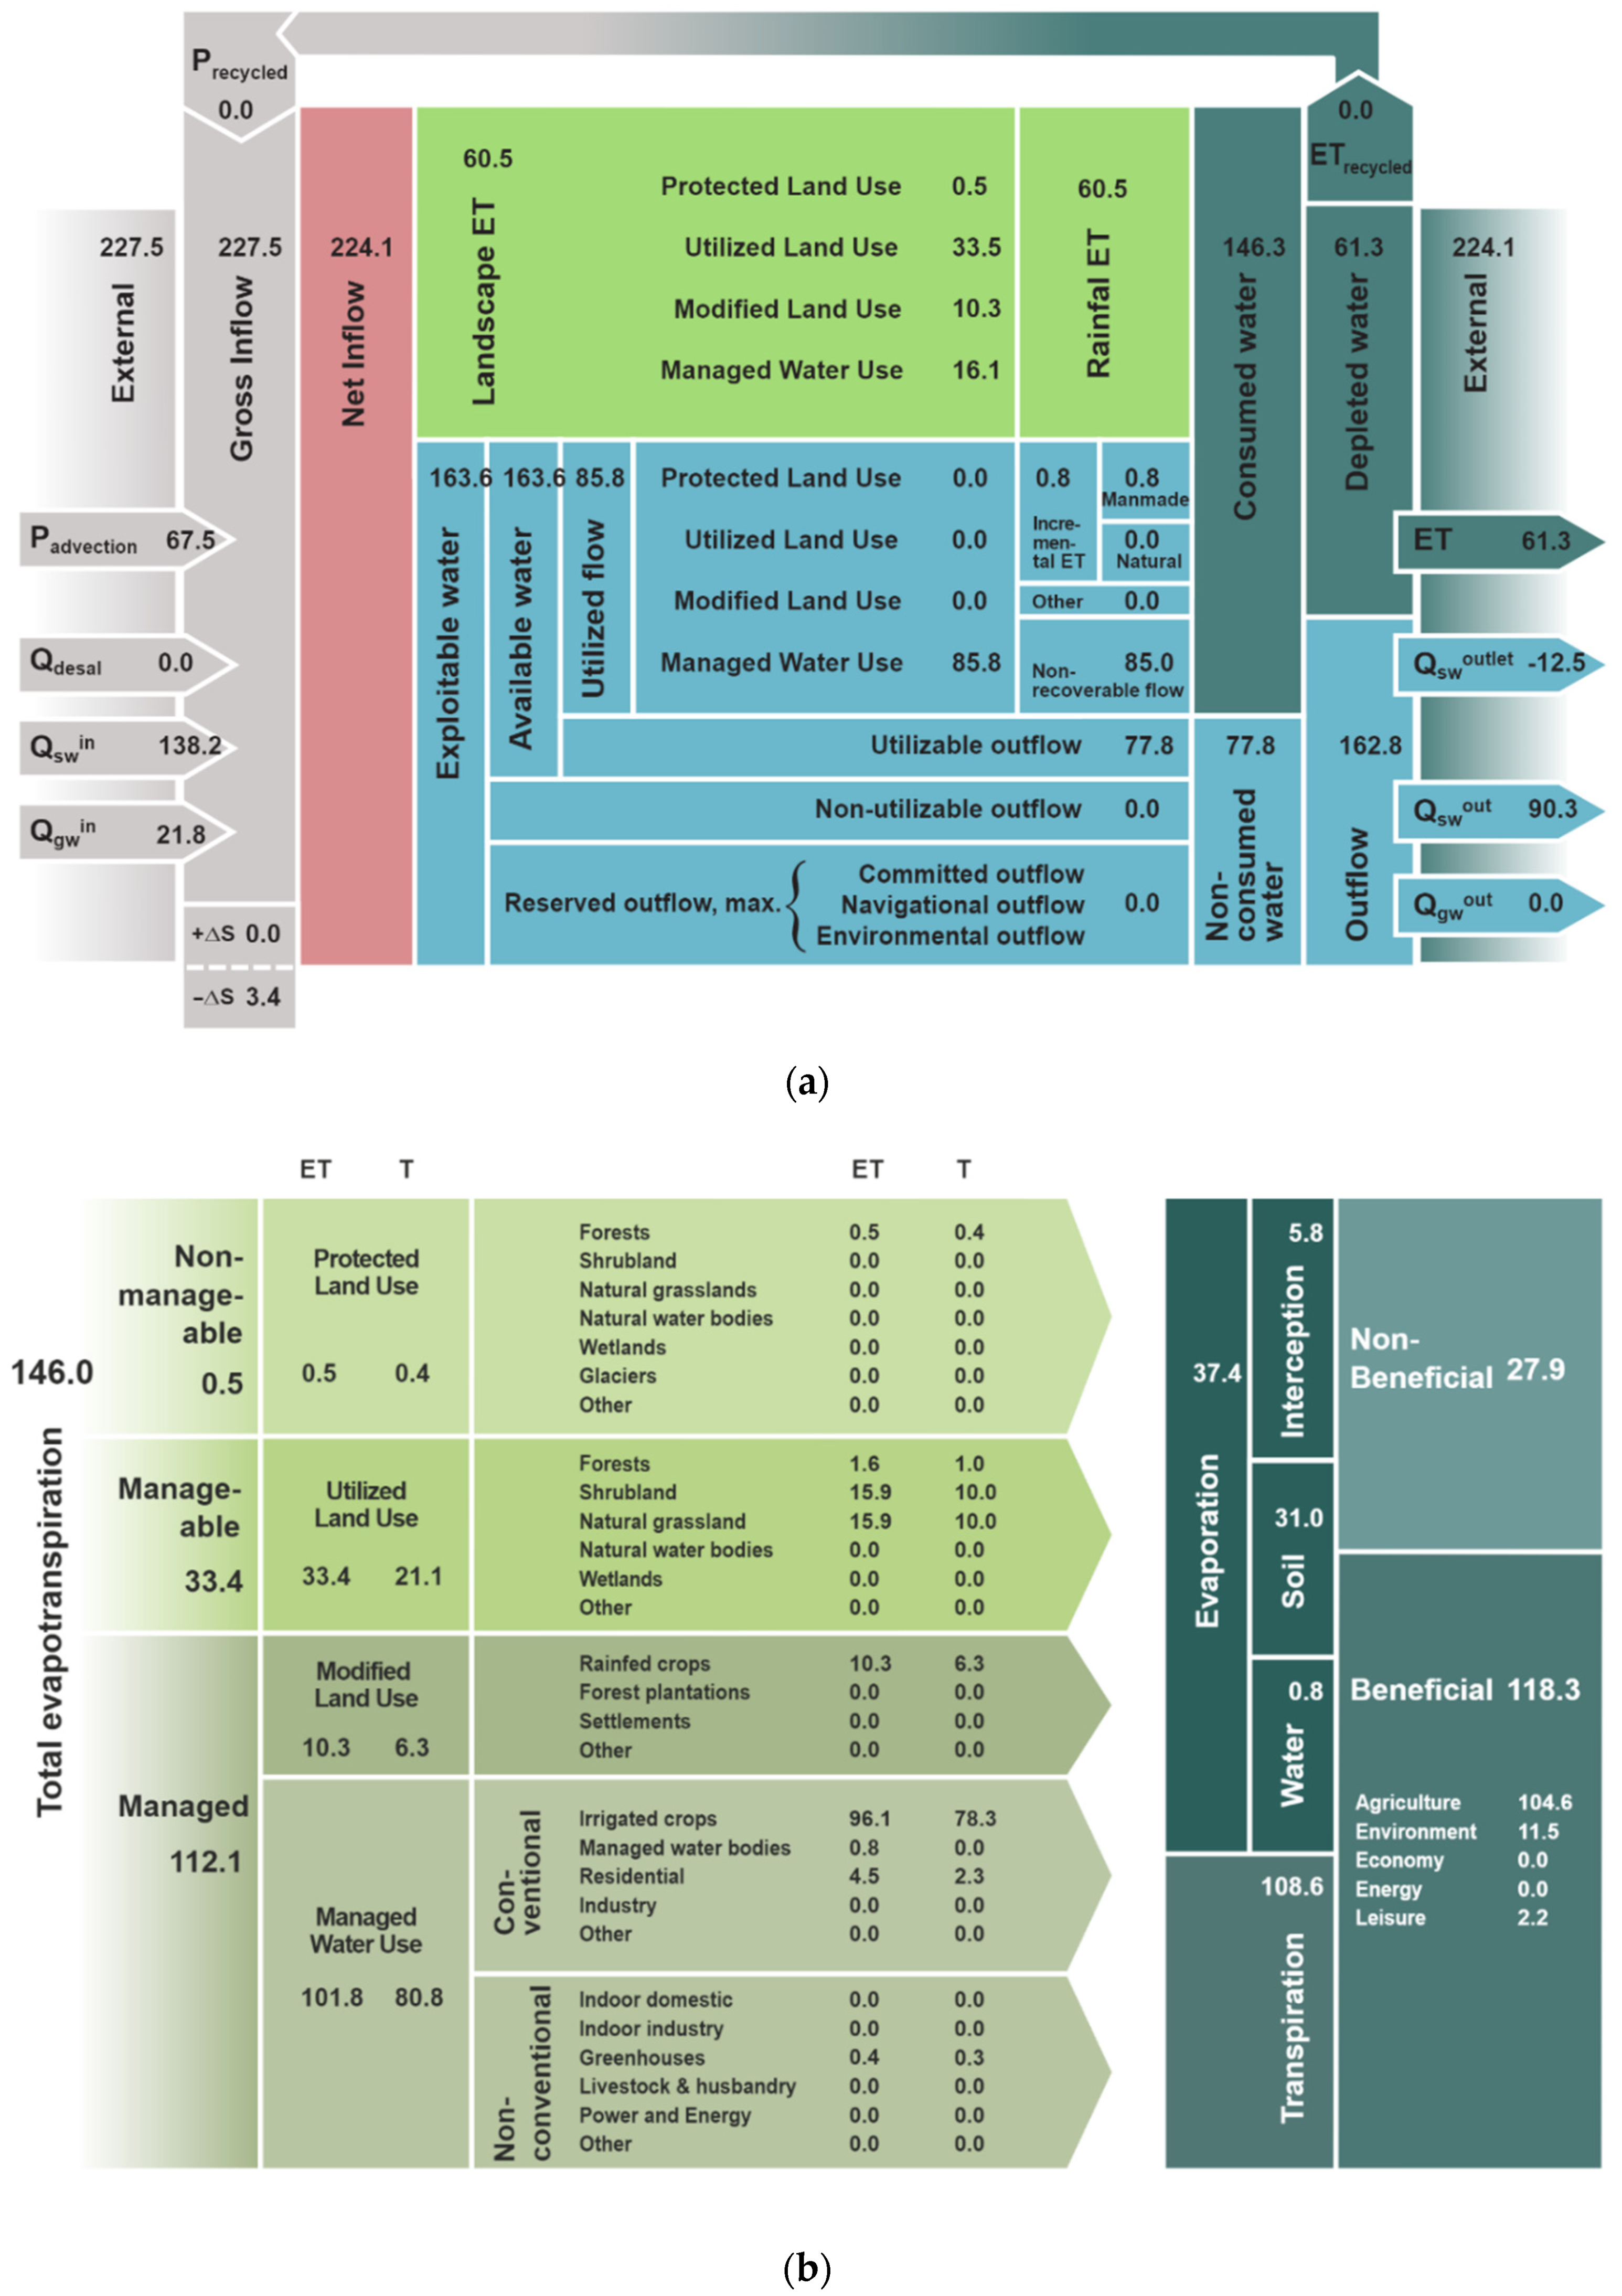
Results of AWA obtained from the resource base and ET sheets (Figure 8) showed that most of water inflows allocated for irrigation were used in the form of ET. In terms of ET fractions, about 66% of this outflow component was from irrigated agriculture and 7% from rainfed areas, indicating that irrigation was the main consumer of water delivered to the NJV. The beneficial fraction of ET was more than 80% showing high, and possibly efficient, utilization of water under the deficit irrigation conditions. The sheets of WA+ showed that 81% of the ET was beneficially used, with 74% of ET being on the form of transpiration (Table 5).
3.6. Mapping Surface Water from Side Wadis
Analysis of GIS layers, derived from the 20 m DEM, showed that the side wadis had 15 catchments with different sizes (Figure 9). Among these catchments, Wadi Al-Arab and Ziglab had two constructed dams, while other catchments were under investigation for constructing water harvesting structures. Table 6 summarizes the possible volumes that could be harvested and the suitability for developing surface water in these catchments. Among the small catchments, a water-harvesting structure was constructed, by the FAO-RNE project, on Rod Um Eddieb to supply DZ14 and DZ15 with 0.1 MCM of water per year during the period of water shortage. The suitability of other catchments for developing surface water was initially based on the volume of water that could be harvested. The data of land tenure was used to exclude catchments that had privately owned lands that could be affected by the structure. The other criterion for exclusion was the location of the outlet and the reservoir, which should be away from urbanized areas and touristic sites.
Results showed that development of surface water resources on the side wadis would decrease water deficiency in the NJV. Among the catchments that could provide considerable amounts of harvested rainfall water were those of Wadi Al-Yabis (Al-Rayyan) and Wadi At-Tayyiba, where a total of 6.4 MCM could be developed (Table 6). Based on the 2019 data, this amount would compensate 46% of the water deficiency (14 MCM). Development of other catchments would provide small volumes of water that could be utilized for agro-pastoral activities or for providing limited volumes of water for certain DZs, depending on location and the possibility of connecting the structure to KAC.
4. Discussions
4.1. WaPOR Data Assessment
In this study, the correlations between monthly data of WaPOR precipitation, i.e., CHIRPS, and rainfall records were significant and were in line with findings reported by previous studies, e.g., [43,44,45,46,47]. Results from this study showed that the use of CHIRPS precipitation data in AWA underestimated the inflows from rainfall, which in turn resulted in decreasing estimated recoverable water. A previous study in Jordan showed that the suitability of remotely sensed precipitation data, including CHIRPS, to fill gaps in monthly rainfall data decreased when the percentage of missing data increased, indicating that the use of CHIRPS to obtain precipitation for larger study areas could increase uncertainty of outputs from hydrological models [48]. The trend of underestimating rainfall amounts was also indicated for other sources of remotely sensed precipitation data [49]. These findings emphasized the need for calibrating these precipitation data to make them satisfactory for different applications, including AWA.
Regarding WaPOR AETI data, results showed that the calibration of the total ET for irrigated parcels (farm units in this study) would provide better corrections of data when compared with the ET values at the pixels level (Figure 6). This would be attributed to the different resolutions of WaPOR and SEBAL that would affect calibration and the types of algorithms and data used in the ET model [50]. The impact of resolution was indicated as an important source of uncertainty in ET mapping that overweighed the accuracy of land cover maps used in remotely sensed ET models [51]. Therefore, it would be important to decide on the scale or level of WaPOR data to be used in AWA, depending on the objective and geographical extent of the study area. From the perspectives of hydrological modeling, the monthly temporal scale of WaPOR data would be suitable for irrigation and water management [52], as indicated by the results and outputs of this study, providing that calibration of data had been carried out. In this study, high-resolution ET estimates from SEBAL served the purpose of calibration, which was also supported by ground data of gross water amounts delivered to farm units in the NJV. This approach could give an insight for data integration to reduce the cost and efforts of WaPOR data calibration.
4.2. Remote-Sensing Data and Water Accounting
Results showed that EOS provided important remote-sensing data needed for AWA. In particular, the data of outflow from WaPOR and SEBAL in the form of ET would save time and efforts of ET calculations from climatic and ground data. The outputs from water accounting, however, would depend on the accuracy level of these data. For the NJV study, WaPOR ET data overestimated ET while precipitation data underestimated rainfall volumes. As a result, return flow that could be used as a possible source of water for farmers in the NJV was underestimated. Nevertheless, remote-sensing data of earth observation systems (EOS) provided important information for AWA. Compared with the classical water budget approach, remote-sensing-based water accounting provided detailed information on fluxes of water for both rainfed and irrigated areas. Also, it reflected the proportions of manageable and nonmanageable water fractions. In terms of water balance analysis, the ET fluxes enabled the estimation of the volume of water percolating through soils, beyond the root zone. This proportion of percolation, rarely measured, was always regarded as a loss rather than a major source of groundwater recharge. Failure to recognize this fact would cause biased estimates of water volumes in water balance analysis at the field and/or irrigation scheme scales [4]. In this study, results showed that the use of calibrated WaPOR-AETI and rainfall data from ground stations would enable the estimation of recoverable water that could be could be utilized by farmers. In the NJV, the volume of this water, calculated after correction of WaPOR data, was 24.3 MCM. This amount was sufficient to overcome water deficiency in the NJV.
The impact of WaPOR data correction on outputs from AWA was indicated by the results of this study. For cases similar to the NJV, outflows and inter-basin transfer will be always needed, and should be measured at all times, to ensure accurate outputs from the AWA. The use of measured data in this study showed that the basin closure, which represented the utilized flow out of the total inflows, was only 65% compared with an average value of 99% obtained from the AWA results that were totally based on WaPOR data [30]. This emphasized the importance of integrating remote-sensing and ground data.
4.3. Implications for Solving Water Deficiency
In terms of water supply and conflicts on transboundary water resources, the basin of the Jordan River could be considered as a complex case where information on water resources were considered confidential and strategic among the countries sharing surface and groundwater resources in this basin. Therefore, remote-sensing data of WaPOR and the high-resolution data from EOS, coupled with remote-sensing-based ET models could help in establishing transparent databases that would contribute to solving water scarcity problems in this basin, including the NJV study area. The role for these geodatabases was emphasized as they would provide data and information needed to guide and enable informed decisions pertinent to water resources management that integrates science with policy [53,54]. There had been advances in real-time ground-based data acquisition, including new sensors and smart meters, which could be also adopted and used in conjunction with remote-sensing data. The use of WaPOR data in water accounting would indicate the levels of water inflows and outflows and the levels of water deficiency. Ground data and measurements of inter-basin transfer and nonagricultural uses, however, would be needed for accurate information on levels of water demand, supply and consumption, as indicated by the results of this study.
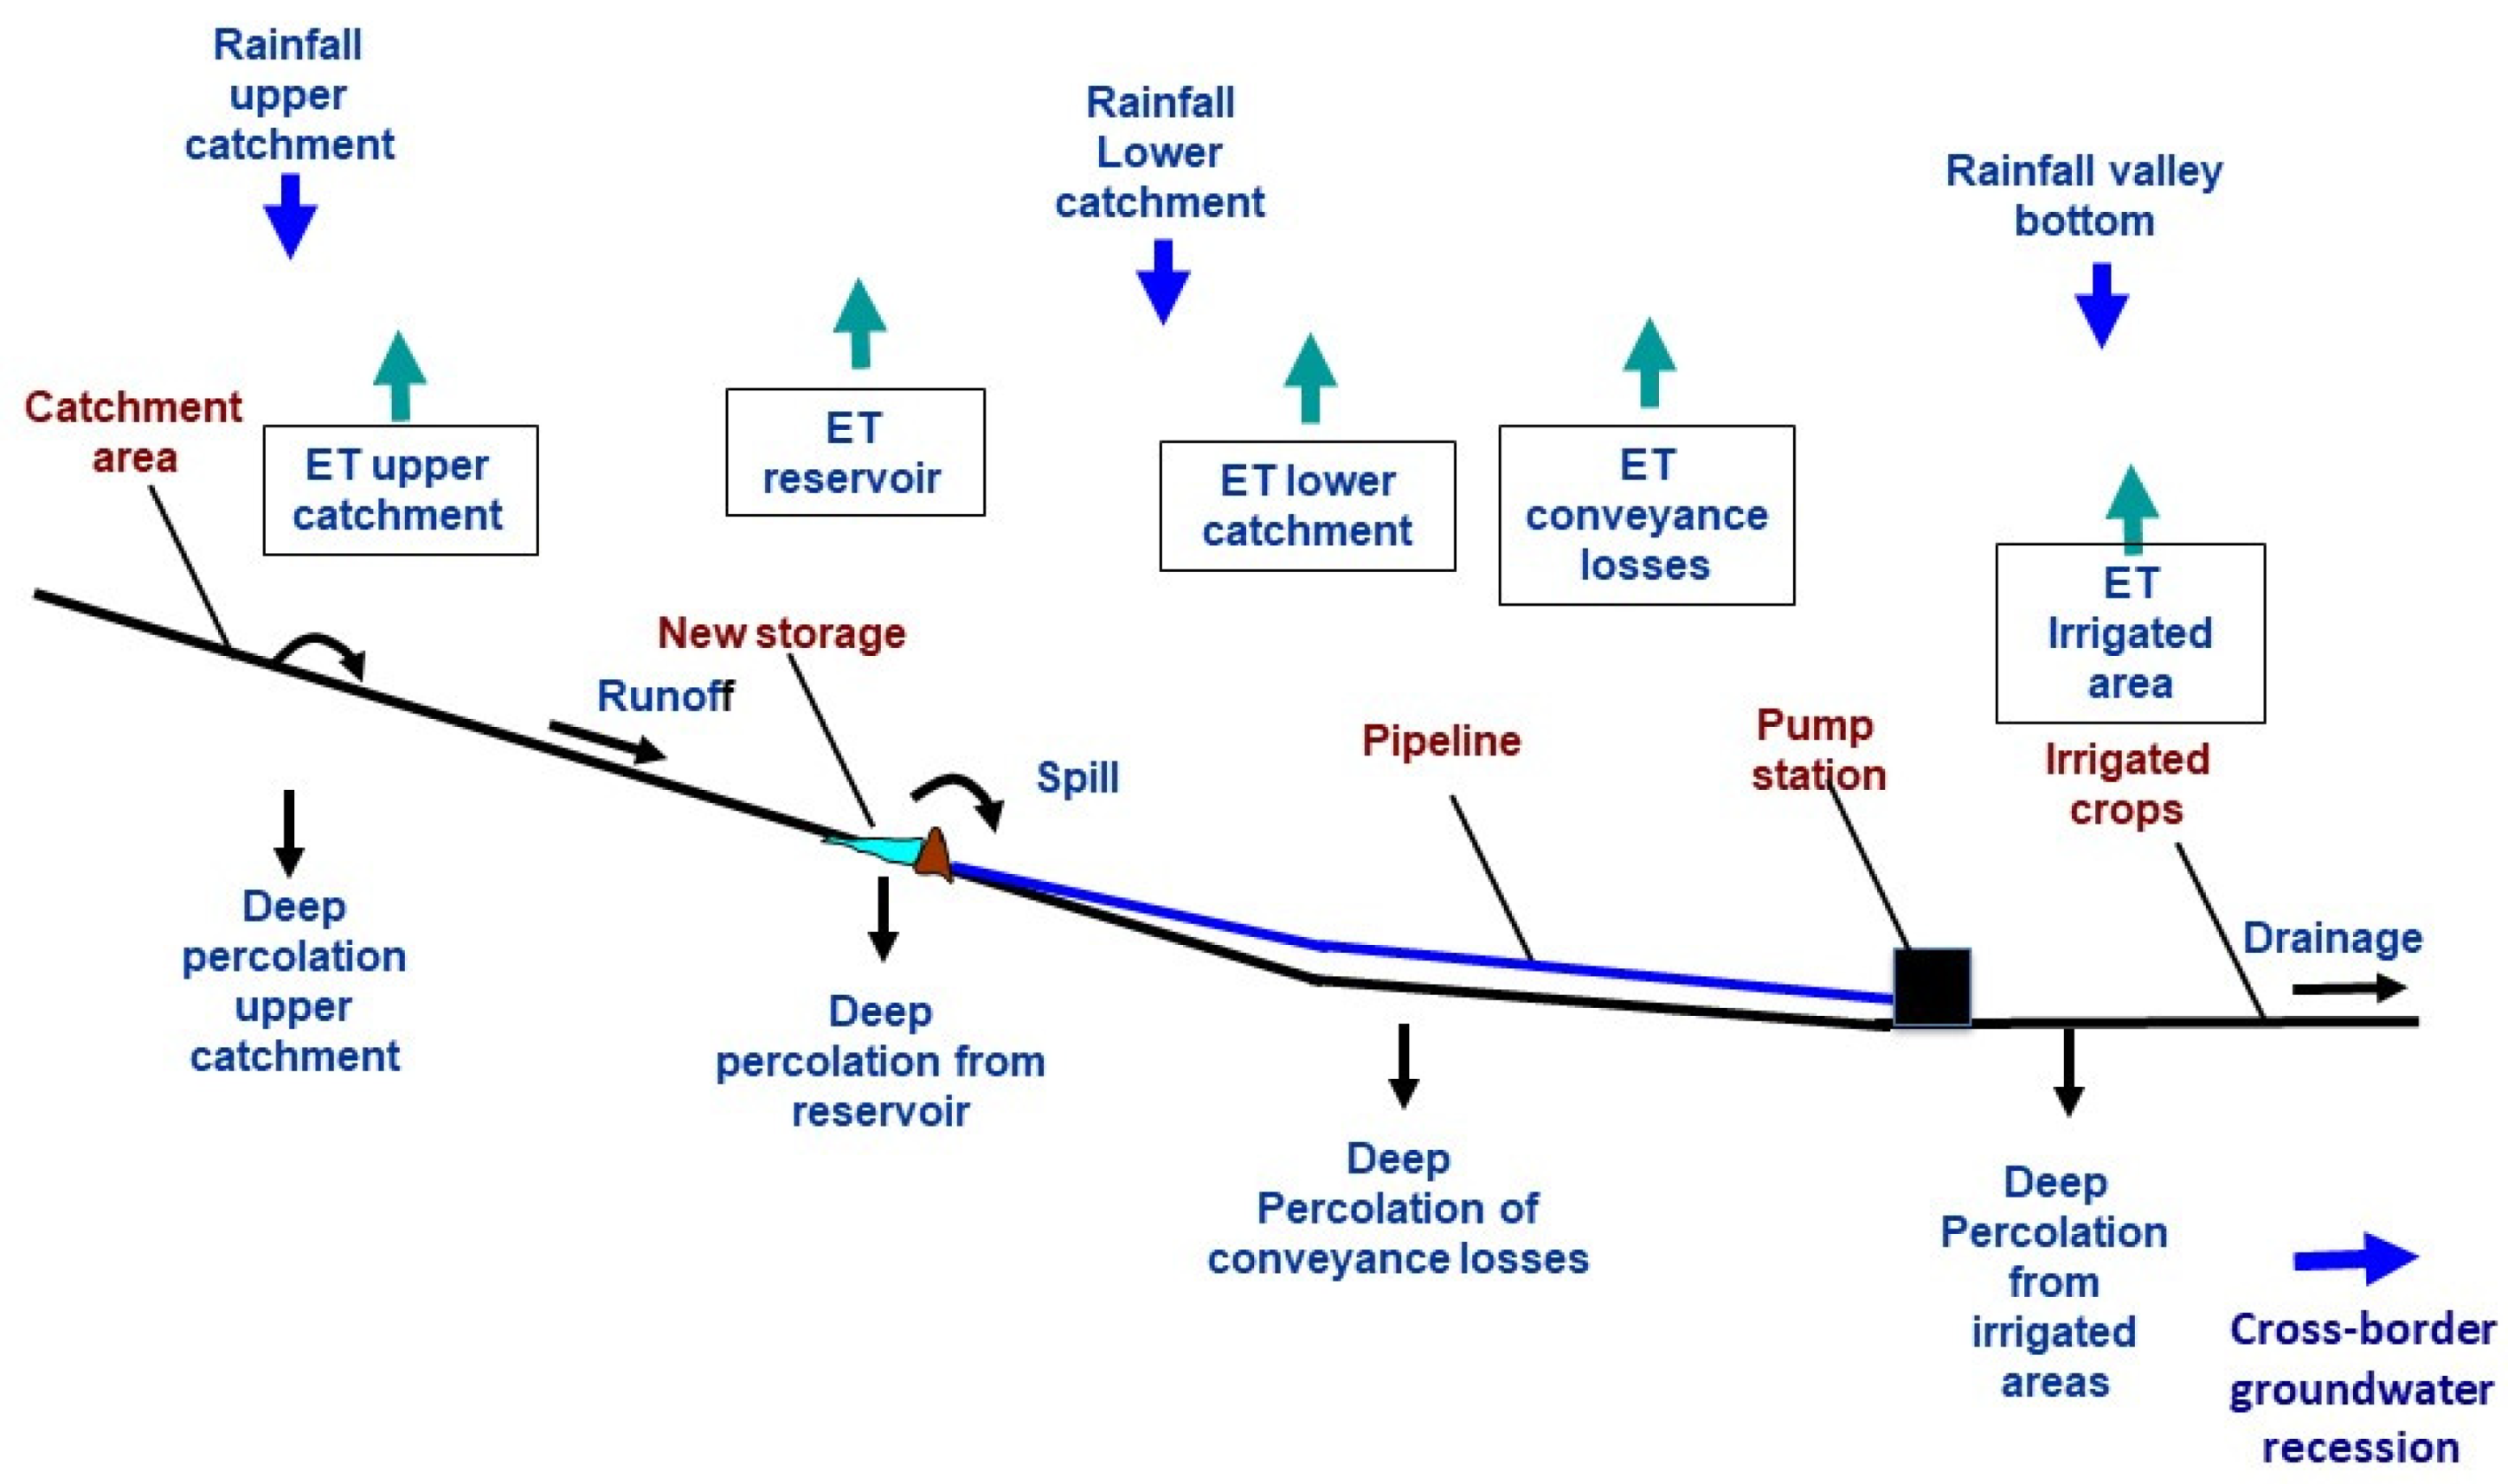
Analysis of outputs from this study provided a base for comparison among the most probable solutions to water deficiency in the NJV. These would include the augmentation of water supply through development of surface water from the side wadis or the use of groundwater volumes originated from percolated water and return flows. The study showed that both options could be adopted to overcome the problem of water deficiency in the NJV. While the emphasis in Jordan was always on developing surface water resources, the results of this study show that the shift to improved water management practices should be encouraged and should depend on outputs from the AWA. In the NJV area, the hydraulic structure of irrigation and the large irrigated area would result in large volumes of recoverable water that could be utilized. In terms of water harvesting structures, the results from the first cycle of water accounting carried out in the NJV through FAO-RNE [41] indicated that losses on the form of deep percolation would occur in all phases of the irrigation process (Figure 10). The sources of losses were mainly the open KAC and the water conveyance network. These off-farm systems’ losses could be employed to supply irrigation water in both developed and developing countries and would provide important source of water that could be reused after carrying what is known as a “hotspot assessment” of spatial water losses [55]. In Jordan, the assessments reported by previous studies [33,34] showed that the average losses from KAC in the NJV were 19% of the total annual inflow, which might emphasize the need for utilizing large part of these losses by either developing recoverable water or by replacing the open channel system with closed pipelines.
The other options that shall be kept in mind as solutions to water deficiency in the NJV would be the improvement of farm irrigation efficiency and the use of treated wastewater. Since most of irrigation systems in the NJV are pressurized, with an average farm irrigation efficiency of 70%, and since the area is under deficit irrigation, the option of improving farm irrigation efficiency will be minor when compared with the option of developing recoverable water coming from deep percolation and return flows. The option of using treated wastewater and utilizing fresh water for domestic uses is already proposed by the JVA and MWI though the extension of the Zarqa carrier from KTD to the NJV. This option is opposed by citrus farmers who are concerned about the adverse impacts of marginal water quality on citrus yield. A previous study supports the farmers’ opinion as it shows that the area has high risks of salinization if marginal water sources are used for irrigation [56]. Therefore, outputs from this study encourage the utilization of recoverable water and the surface water flowing from the side wadis.
5. Conclusions
Results showed that WaPOR-AETI was highly correlated with SEBAL-ET, with WaPOR data overestimating ET for irrigated areas. Precipitation data from WaPOR were also highly correlated with ground records with a trend of underestimation of rainfall. Subsequently, outputs from AWA were affected and the amounts of recoverable water were underestimated. These results could indicate that the limitations of the remote sensing-based AWA methodology in absence of reliable in situ datasets, particularly those related to surface and ground water volumes. Therefore, in order to have reliable outputs from AWA, calibration and integration of different datasets would be needed. This was indicated by the improvement in the estimates of water consumption and volumes of recoverable water after the calibration of WaPOR-AETI with SEBAL-ET. The outputs obtained from this study also showed that remote-sensing-based AWA was valuable in summarizing the complex hydrological processes, water supply, demand, and consumption. Therefore, it could be concluded that the open-source datasets of WaPOR, and other remote-sensing data used in this study, provided important spatial information on water consumption through ET, as well as estimates of recoverable fractions of water that could be developed to overcome water deficiency. This, however, would require reliable calibration and correction for WaPOR data, particularly precipitation and ET. Although emphasis in Jordan was always on water supply augmentation, results from this study showed that the option of developing recoverable water would provide efficient solutions to water deficiency in the NJV, and other irrigated areas of JV. Such results emphasized the important roles of remote-sensing-based AWA in managing the scarce water resources.
6. Recommendations
The study showed that implementing a standardized water accounting system with the support of remote sensing products of WaPOR would be recommended after calibration against ground or high-resolution remote-sensing data. This could decrease the uncertainty of the final results. Therefore, the approach proposed in this study would be highly recommended under the conditions of limited ground data, considering that new space-borne systems and sensors, such as the Sentinel constellation from Copernicus-ESA, will provide more and more accurate products in support to AWA. Within the context of the NJV, calibration of WaPOR-AETI was only possible for irrigated farm units as water amounts delivered to these units were recorded by the JVA. Therefore, the study would highly recommend the use of different options for calibration of WaPOR data, including soil moisture measurements, climatic records, and high-resolution data of ET. Calibration and validation of remotely sensed ET should be also made for all of the land- and water-use categories, including both of irrigated and rainfed crops. As part of the complex Jordan River Basin, the study area of the NJV showed that detailed AWA would require documented data on groundwater abstraction, interbasin transfer, and utilized return flows. All of these data should form part of a geodatabase for this important basin. Within the context of FAO-RNE project, the study would highly encourage the adoption and institutionalizing of water accounting at MWI to enable informed water management and planning. This, however, might require capacity building in the area of remote-sensing-based AWA.
Author Contributions
Conceptualization, J.T.A.-B.; methodology, J.T.A.-B., G.D. and C.B.; software, J.T.A.-B., A.A. and A.A.-K.; validation and field visits, J.T.A.-B. and M.A.; formal analysis, J.T.A.-B., G.D., A.A. and C.B.; resources, A.A., D.V. and M.A.; climatic data curation, A.A. and A.A.-K.; writing—original draft preparation, J.T.A.-B., G.D. and C.B.; writing—review and editing, All authors; visualization, J.T.A.-B. and G.D. All authors have read and agreed to the published version of the manuscript.
Funding
The work of water accounting was carried out through FAO-RNE project (GCP/RNE/009/SWE) “Implementing the Agenda 2030 on water efficiency/productivity and sustainability in the NENA region” within the Water Scarcity Initiative (WSI) lead by FAO-RNE and funded by Sida. The work of ET and land-use/cover mapping was carried out and funded through ERANETMED EO-TIME (Earth Observation Technologies for Irrigation in Mediterranean Environment), Italian Ministry University and Research, Decree no.1768/2019.
Institutional Review Board Statement
Not applicable.
Informed Consent Statement
Not applicable.
Data Availability Statement
The data presented in this study are available in the article.
Acknowledgments
Authors are grateful to the support from FAO-RNE project team in addition to project partners from IWMI, IHE-Delft and the Jordan’ MWI. The cooperation of Amgad Elmahdi and Marwa Ali from IWMI, Lauren Zielinski from IHE-Delft and Hadeel Smadi from the MWI is highly appreciated. Thanks are also extended to the anonymous reviewers of the article for their useful comments.
Conflicts of Interest
The authors declare no conflict of interest.
References
- Al-Bakri, J.T.; Shawash, S.; Ghanim, A.; Abdelkhaleq, R. Geospatial Techniques for Improved Water Management in Jordan. Water 2016, 8, 132. [Google Scholar] [CrossRef] [Green Version]
- Deoli, V.; Kumar, D.; Kumar, M.; Kuriqi, A.; Elbeltagi, A. Water spread mapping of multiple lakes using remote sensing and satellite data. Arab. J. Geosci. 2021, 14, 2213. [Google Scholar] [CrossRef]
- Hysa, A.; Spalevic, V.; Dudic, B.; Roșca, S.; Kuriqi, A.; Bilașco, Ș.; Sestras, P. Utilizing the Available Open-Source Remotely Sensed Data in Assessing the Wildfire Ignition and Spread Capacities of Vegetated Surfaces in Romania. Remote Sens. 2021, 13, 2737. [Google Scholar] [CrossRef]
- Batchelor, C.; Hoogeveen, J.; Faurès, J.M.; Peiser, L. Water Accounting and Auditing: A Sourcebook (Revised Edition), Land and Water Division; FAO Water Reports-43; FAO: Rome, Italy, 2017; p. 232. [Google Scholar]
- Dost, R.; Obando, E.B.; Bastiaanssen, W.; Hoogeveen, J. Water Accounting through Remote Sensing. A Background Report on Water Accounting Plus (WA+) in the Awash River Basin, Land and Water Division; FAO: Rome, Italy, 2013; p. 56. [Google Scholar]
- Molden, D.; Sakthivadivel, R. Water accounting to assess use and productivity of water. Int. J. Water Res. Dev. 1999, 15, 55–71. [Google Scholar] [CrossRef]
- Basukala, A.K.; Oldenburg, C.; Schellberg, J.; Sultanov, M.; Dubovyk, O. Towards improved land use mapping of irrigated croplands: Performance assessment of different image classification algorithms and approaches. Eur. J. Remote Sens. 2017, 50, 187–201. [Google Scholar] [CrossRef] [Green Version]
- Garrido-Rubio, J.; Calera, A.; Arellano, I.; Belmonte, M.; Fraile, L.; Ortega, T.; Bravo, R.; González-Piqueras, J. Evaluation of Remote Sensing-Based Irrigation Water Accounting at River Basin District Management Scale. Remote Sens. 2020, 12, 3187. [Google Scholar] [CrossRef]
- Jensen, J.R. Introductory Digital Image Processing: A Remote Sensing Perspective, 4th ed.; Prentice Hall: Upper Saddle River, NJ, USA, 2015; p. 658. [Google Scholar]
- Bolstad, P. GIS Fundamentals: A First Text on Geographic Information Systems, 6th ed.; Eider Press: White Bear Lake, MN, USA, 2019; p. 764. [Google Scholar]
- Serbina, L.; Miller, H.M. Landsat and Water—Case Studies of the Uses and Benefits of Landsat Imagery in Water Resources; U.S. Geological Survey Open-File Report. 2014–1108; U.S. Geological Survey: Reston, VA, USA, 2014; p. 61.
- ESA (European Space Agency). Sentinel-2 Mission, ESA. Available online: https://sentinel.esa.int/web/sentinel/missions/sentinel-2 (accessed on 2 March 2022).
- Karimi, P.; Bastiaanssen, W.G.M.; Molden, D. Water accounting plus (WA+)—A water accounting procedure for complex river basins based on satellite measurements. Hydrol. Earth Syst. Sci. 2013, 17, 2459–2472. [Google Scholar] [CrossRef] [Green Version]
- Allen, R.G.; Pereira, L.A.; Raes, D.; Smith, M. Crop Evapotranspiration—Guidelines for Computing Crop Water Requirements; FAO Irrigation and Drainage Paper 56; Food and Agriculture Organization of the United Nations (FAO): Rome, Italy, 1998; Available online: http://www.fao.org/3/X0490E/x0490e00.htm (accessed on 10 March 2022).
- Anderson, M.C.; Kustas, W.P.; Norman, J.M.; Hain, C.R.; Mecikalski, J.R.; Schultz, L.; González-Dugo, M.P.; Cammalleri, C.; D’urso, G.; Pimstein, A.; et al. Mapping daily evapotranspiration at field to continental scales using geostationary and polar orbiting satellite imagery. Hydrol. Earth Syst. Sci. 2011, 15, 223–239. [Google Scholar] [CrossRef] [Green Version]
- Allen, R.G.; Tasumi, M.; Trezza, R. Satellite-based energy balance for Mapping Evapotranspiration with Internalized Calibration (METRIC)—Model. J. Irrig. Drain. Eng. 2007, 133, 380–394. [Google Scholar] [CrossRef]
- Bastiaanssen, W.G.M.; Menenti, M.; Feddes, R.A.; Holtslag, A.A.M. A remote sensing surface energy balance algorithm for land (SEBAL). 1. Formulation. J. Hydrol. 1998, 212–213, 198–212. [Google Scholar] [CrossRef]
- Bastiaanssen, W.G.M.; Cheema, M.J.M.; Immerzeel, W.W.; Miltenburg, I.J.; Pelgrum, H. Surface energy balance and actual evapotranspiration of the transboundary Indus Basin estimated from satellite measurements and the ETLook model. Water Resour. Res. 2012, 48, W11512. [Google Scholar] [CrossRef] [Green Version]
- The FAO Portal to Monitor Water Productivity through Open Access of Remotely Sensed Derived Data. Available online: https://wapor.apps.fao.org/catalog/WAPOR_2/2 (accessed on 30 January 2022).
- FAO. WaPOR Database Methodology: Version 2 Release; FAO: Rome, Italy, 2020; p. 90. [Google Scholar] [CrossRef]
- Hlavaty, H. Water Management Initiative: Review of Water Scarcity Ranking Methodologies. A Report Prepared for Tetra Tech; USAID Water Management Initiative (WMI): Amman, Jordan, 2018. [Google Scholar]
- Al-Bakri, J.T.; Salahat, M.; Suleiman, A.; Suifan, M.; Hamdan, M.R.; Khresat, S.; Kandakji, T. Impact of Climate and Land Use Changes on Water and Food Security in Jordan: Implications for Transcending “The Tragedy of the Commons”. Sustainability 2013, 5, 724–748. [Google Scholar] [CrossRef] [Green Version]
- Al-Bakri, J.; Farhan, I.; Al-Qinna, M.; Al-Karablieh, E.; Bergouli, K.; McDonnell, R. Assessment of Climate Changes and Their Impact on Barley Yield in Mediterranean Environment Using NEX-GDDP Downscaled GCMs and DSSAT. Earth Syst. Environ. 2021, 5, 751–766. [Google Scholar] [CrossRef]
- Rajsekhar, D.; Gorelick, S. Increasing drought in Jordan: Climate change and cascading Syrian land-use impacts on reducing transboundary flow. Sci. Adv. 2017, 3, e1700581. [Google Scholar] [CrossRef] [PubMed] [Green Version]
- Earth Observation Technologies for Irrigation in Mediterranean Environments (EO-TIME). Available online: https://eotime.it/ (accessed on 12 February 2022).
- Karimi, P.; Bastiaanssen, W.G.M.; Molden, D.; Cheema, M. Basin-wide water accounting based on remote sensing data: An application for the Indus Basin. Hydrol. Earth Syst. Sci. 2013, 17, 2473–2486. [Google Scholar] [CrossRef] [Green Version]
- Karimi, P.; Bastiaanssen, W.G.M.; Sood, A.; Hoogeveen, J.; Peiser, L.; Bastidas-Obando, E.; Dost, R.J. Spatial evapotranspiration, rainfall and land use data in water accounting—Part 2: Reliability of water accounting results for policy decisions in the Awash basin. Hydrol. Earth Syst. Sci. 2015, 19, 533–550. [Google Scholar] [CrossRef] [Green Version]
- Sheets Generator. Available online: https://www.wateraccounting.org/sheets.html (accessed on 2 April 2022).
- FAO. WaPOR V2 Quality Assessment—Technical Report on the Data Quality of the WaPOR FAO Database Version 2; FAO: Rome, Italy, 2020; p. 89. [Google Scholar] [CrossRef]
- FAO and IHE Delft. Water Accounting in the Jordan River Basin; FAO WaPOR Water Accounting Reports; FAO: Rome, Italy, 2020. [Google Scholar] [CrossRef]
- Al-Bakri, J.T. Soils of Jordan. In Proceedings of the Status of Mediterranean Soil Resources: Actions Needed to Support Their Sustainable Use, Mediterranean Conference Proceedings, Tunis, Tunisia, 26–31 May 2007; MEDCOASTLAND Publication: Bari, Italy, 2008. ISBN 2-85352-371-3. [Google Scholar]
- Tabieh, M.; Al-Karablieh, E.; Salman, A.; Al-Qudah, H.; Al-Rimawi, A.; Qtaishat, T. Farmers’ Ability to Pay for Irrigation Water in the Jordan Valley. J. Water Resour. Prot. 2015, 7, 1157–1173. [Google Scholar] [CrossRef] [Green Version]
- WMI (Water Management Initiative). Report on the Determination of KAC Water Losses and Recommended Solutions for Improvements; Situational Assessment; Water Management Initiative: Amman, Jordan, 2018. Available online: https://pdf.usaid.gov/pdf_docs/PA00X7SP.pdf (accessed on 10 March 2022).
- GIZ (German Society for International Cooperation). Assessment of Surface Water Production, Conveyance and Use in All Sectors in Jordan, Final Report; Third National Water Master Plan (NWMP-3); Volume B—Water Resources, ANNEX B.1.; GIZ: Amman, Jordan, 2021. [Google Scholar]
- Bani Hani, N.M.; Shatanawi, M.R. Effect of Sustained Deficit Irrigation on Evapotranspiration and Stem Water Potential of Navel Oranges in Jordan Valley. Dirasat Agric. Sci. 2013, 39, 38–50. [Google Scholar]
- MWI (Ministry of Water and Irrigation, Jordan). Water Budget for Year 2019; Department of Policies and Strategic Planning, Ministry of Water and Irrigation: Amman, Jordan, 2019.
- Taani, R. Development of a National Water Information System-Jordan, A Data Management Report on Development, Installation, Testing and Commissioning of the MWI-WIS; EU-ENPI Project 2015/366-808; MWI: Amman, Jordan, 2017. [Google Scholar]
- Abu Rumman, G. Characterization of the Hydrological Changes of Jordan River Side Wadis Tributaries Using Remote Sensing and GIS. Ph.D. Thesis, The University of Jordan, Amman, Jordan, 2007. [Google Scholar]
- Assaf, A.S. Hydrological and Hydrochemical Study of Wadi El-Arab Catchment Area/Yarmouk Basin. Unpublished Ph.D. Thesis, The University of Jordan, Amman, Jordan, 2004. [Google Scholar]
- Funk, C.; Peterson, P.; Landsfeld, M.; Pedreros, D.; Verdin, J.; Shukla, S.; Husak, G.; Rowland, J.; Harrison, L.; Hoell, A.; et al. The climate hazards infrared precipitation with stations—A new environmental record for monitoring extremes. Sci. Data 2015, 2, 1–21. [Google Scholar] [CrossRef] [Green Version]
- FAO. Rapid Water Accounting: Jordan. Food and Agriculture Organization-UN. 2021. Available online: https://www.fao.org/publications/card/en/c/CB2436EN (accessed on 5 April 2022).
- Saidan, M.N.; Al-Addous, M.; Al-Weshah, R.A.; Obada, I.; Alkasrawi, M.; Barbana, N. Wastewater Reclamation in Major Jordanian Industries: A Viable Component of a Circular Economy. Water 2020, 12, 1276. [Google Scholar] [CrossRef]
- Dinku, T.; Funk, C.; Peterson, P.; Maidment, R.; Tadesse, T.; Gadain, H.; Ceccato, P. Validation of the CHIRPS satellite rainfall estimates over eastern Africa. Q. J. R. Meteorol. Soc. 2018, 144, 292–312. [Google Scholar] [CrossRef] [Green Version]
- Hsu, J.; Huang, W.-R.; Liu, P.-Y.; Li, X. Validation of CHIRPS Precipitation Estimates over Taiwan at Multiple Timescales. Remote Sens. 2021, 13, 254. [Google Scholar] [CrossRef]
- Trejo, F.J.P.; Barbosa, H.A.; Peñaloza-Murillo, M.A.; Moreno, M.A.; Farías, A. Intercomparison of improved satellite rainfall estimation with CHIRPS gridded product and rain gauge data over Venezuela. Atmósfera 2016, 29, 323–342. [Google Scholar] [CrossRef] [Green Version]
- Wahyuni, S.; Sisinggih, D.; Dewi, I.A.G. Validation of Climate Hazard Group InfraRed Precipitation with Station (CHIRPS) Data in Wonorejo Reservoir, Indonesia. In Proceedings of the 4th International Conference of Water Resources Development and Environmental Protection (ICWRDEP 2021), Malang, Indonesia, 7 August 2021. [Google Scholar] [CrossRef]
- Mokhtari, S.; Sharafati, A.; Raziei, T. Validation of CHIRPS satellite-based precipitation data against the in situ observations using the Copula method: A case study of Kosar Dam basin, Iran. Acta Geophys. 2021, 70, 465–484. [Google Scholar] [CrossRef]
- Abo Romman, Z.; Al-Bakri, J.; Al Kuisi, M. Comparison of methods for filling in gaps in monthly rainfall series in arid regions. Int. J. Climatol. 2021, 41, 6674–6689. [Google Scholar] [CrossRef]
- Al-Kilani, M.R.; Rahbeh, M.; Al-Bakri, J.; Tadesse, T.; Knutson, C. Evaluation of Remotely Sensed Precipitation Estimates from the NASA POWER Project for Drought Detection over Jordan. Earth Syst. Environ. 2021, 5, 561–573. [Google Scholar] [CrossRef]
- Salehi, H.; Shamsoddini, A.; Mirlatifi, S.M.; Mirgol, B.; Nazari, M. Spatial and temporal resolution improvement of actual evapotranspiration maps using Landsat and MODIS data fusion. Front. Environ. Sci. 2021, 9, 795287. [Google Scholar] [CrossRef]
- Li, X.; Xu, X.; Wang, X.; Xu, S.; Tian, W.; Tian, J.; He, C. Assessing the Effects of Spatial Scales on Regional Evapotranspiration Estimation by the SEBAL Model and Multiple Satellite Datasets: A Case Study in the Agro-Pastoral Ecotone, Northwestern China. Remote Sens. 2021, 13, 1524. [Google Scholar] [CrossRef]
- Blöschl, G.; Sivapalan, M. Scale issues in hydrological modelling: A review. Hydrol. Processes 1995, 9, 251–290. [Google Scholar] [CrossRef]
- Comair, G.F.; McKinney, D.C.; Maidment, D.R.; Espinoza, G.; Sangiredy, H.; Fayad, A.; Salas, F.R. Hydrology of the Jordan River Basin: A GIS-based system to better guide water resources management and decision making. Water Resour. Manag. 2014, 28, 933–946. [Google Scholar] [CrossRef]
- Comair, G.F.; McKinney, D.C.; Siegel, D. Hydrology of the Jordan River Basin: Watershed delineation, precipitation and evapotranspiration. Water Resour. Manag. 2012, 26, 4281–4293. [Google Scholar] [CrossRef]
- Asghar, M.N.; Khan, M.A.; Lashbrook, B.; Zumkley, T.; Lawson, S. Hotspots Assessment of Spatial Water Losses in the Off-Farm Open Channels Irrigation Supply System. Water Resour. Manag. 2011, 25, 1281–1297. [Google Scholar] [CrossRef]
- Schacht, K.; Gönster, S.; Jüschke, E.; Chen, Y.; Tarchitzky, J.; Al-Bakri, J.; Al-Karablieh, E.; Marschner, B. Evaluation of Soil Sensitivity towards the Irrigation with Treated Wastewater in the Jordan River Region. Water 2011, 3, 1092–1111. [Google Scholar] [CrossRef]
Figure 1.
Flowchart of the study methodology.

Figure 2.
Location of the study area.

Figure 3.
Land use/cover of the North Jordan Valley during 2019.

Figure 4.
Relationships between WaPOR precipitation and rainfall records for Baqoura Station. (a) Monthly data of 2009–2019; (b) average value during 2009–2019.
Figure 4.
Relationships between WaPOR precipitation and rainfall records for Baqoura Station. (a) Monthly data of 2009–2019; (b) average value during 2009–2019.

Figure 5.
WaPOR-AETI and its components for the different land- and water-use categories in the NJV during 2019.
Figure 5.
WaPOR-AETI and its components for the different land- and water-use categories in the NJV during 2019.

Figure 6.
Relationships between WaPOR and SEBAL annual ET in the NJV using the sum of ET for farm units (a) and ET at the level of WaPOR’s pixel (b).
Figure 6.
Relationships between WaPOR and SEBAL annual ET in the NJV using the sum of ET for farm units (a) and ET at the level of WaPOR’s pixel (b).

Figure 7.
Monthly NIWR, GIWR, and water supply for irrigated farms in the NJV during 2019.

Figure 8.
Resource base sheet (a) and ET sheet (b) for the NJV data of 2019.

Figure 9.
Catchments of the side wadis facing the NJV.

Figure 10.
Schematic diagram of water flow and fate in water harvesting structures in the NJV.


Table 1.
Summary of Landsat 8 acquisition dates and some climatic parameters for the NJV during 2019.
Table 1.
Summary of Landsat 8 acquisition dates and some climatic parameters for the NJV during 2019.
| Month | Images (DD/MM) | ETo (mm) | Rainfall (mm) | Max. Temp. (°C) | Min. Temp. (°C) |
|---|---|---|---|---|---|
| January | 10/01 *, 26/01 | 52 | 91 | 19.8 | 9.2 |
| February | 11/02, 27/02 * | 65 | 97 | 21.2 | 10.5 |
| March | 15/03, 31/03 * | 70 | 72 | 22.4 | 10.5 |
| April | 16/04 | 109 | 22 | 27.5 | 13.3 |
| May | 02/05, 18/05 | 163 | 0 | 37.2 | 18.0 |
| June | 03/06 *, 19/06 | 163 | 0 | 38.0 | 23.1 |
| July | 05/07, 21/07 | 186 | 0 | 38.8 | 24.2 |
| August | 06/08, 22/08 | 212 | 0 | 39.2 | 23.9 |
| September | 07/09, 23/09 | 167 | 0 | 37.3 | 22.5 |
| October | 09/10, 25/10 | 130 | 9 | 33.8 | 20.9 |
| November | 10/11, 26/11 | 101 | 15 | 28.9 | 16.0 |
| December | 12/12 *, 28/12 | 58 | 86 | 22.1 | 11.0 |
* Cloudy or partially cloudy.
Table 2.
Summary land- and water-use categories in the NJV during 2019.
| Land- and Water-Use Category | Area (ha) | % |
|---|---|---|
| 1. Protected (conserved) land use | 25.4 | 0.2 |
| 2. Utilized land use | 6305.4 | 34.7 |
| 2.1. Open forests | 331.3 | 1.8 |
| 2.2. Open rangelands (shrub and grasslands, noncultivated farm units, bare soils and rocks) | 5988.9 | 32.9 |
| 3. Modified land use | 2041.0 | 11.2 |
| 3.1. Rainfed trees | 414.3 | 2.3 |
| 3.2. Rainfed field crops | 1626.7 | 8.9 |
| 4. Managed water land use | 9816.3 | 54.0 |
| 4.1. Irrigated trees (citrus, dates, fruit trees) | 6185.7 | 34.0 |
| 4.2. Irrigated vegetables—open fields | 1985.3 | 10.9 |
| 4.3. Irrigated vegetables—plastic houses | 60.8 | 0.3 |
| 4.4. Irrigated fodders and cereals | 282.4 | 1.6 |
| 4.5. Irrigated—mixed cropping | 113.1 | 0.6 |
| 4.6. Urban | 1093.2 | 6.0 |
| 4.7. Managed water bodies (dams and KAC) | 97.5 | 0.6 |
| Total | 18,222.5 | 100.0 |
Table 3.
Water inflow volumes in the NJV during 2019.
| Water Inflow Source | Volume (MCM) |
|---|---|
| 1. Precipitation inside the NJV calculated from: | |
| WaPOR data (CHIRPS) | 67.5 |
| Meteorological data (JMD and MWI) | 85.5 |
| 2. Surface–main riverstem inflow (Yarmouk River and Al-Wehdah Dam) to KAC | 124.0 |
| 3. Surface–tributaries inflow to KAC | 14.2 |
| 4. Groundwater inflow (Mukheiba wells) | 16.7 |
| Total inflows to KAC from surface and groundwater | 154.9 |
| 5. Groundwater pumped by farmers | 0.6 |
| 6. Tributaries or springs inflow (directly used in irrigation) | 4.5 |
| Total inflows | |
| Using WaPOR precipitation data | 227.5 |
| Using JMD and MWI precipitation data | 245.5 |
Table 4.
A summary of water outflows in the NJV during 2019.
| Water Outflow | Volume (MCM) |
|---|---|
| 1. Evapotranspiration and interception (AETI) | 146.2 |
| 2. Interbasin transfer | 90.3 |
| KAC—water transferred to Amman | 78.4 |
| KAC—water pumped back to Wadi Al-Arab | 6.1 |
| KAC—water delivered to south JV | 5.8 |
| 3. Runoff from rainfall inside the NJV | 3.4 |
| Total outflows | 239.9 |
Table 5.
Performance indicators for the NJV in 2019.
| Indicator | Formula and Value | Implication |
|---|---|---|
| Resource Base | ||
| 1. ET fraction | = 146/(64.1 + 155) = 67% | Under exploitation of water resources (assuming water inflows are dedicated to the NJV) |
| 2. Stationarity index | = = −12.5/146 = −8.5% | Depletion of soil moisture and groundwater (implications: illegal access to water, uncertainty of data accuracy) |
| 3. Available water | = 85.8/163.6 = 52% | Water deficiency and transfer outside the NJV |
| 4. Basin closure | = = 146/224 = 65% | Water shortage and transfer outside the NJV |
| 5. Managed fraction | = = 112.1/224.1 = 50% | Further development of water resources is needed |
| Evapotranspiration | ||
| 6. Transpiration fraction | = = 108.6/146 = 74% Rainfed = 6.3/10.3 = 61%, Irrigated = 80.8/101.8 = 79% | Low evaporation from irrigated areas, possibly due to partial wetting of soil under the pressurized systems used. |
| 7. Beneficial fraction | = 118.3/146 = 81% | Good utilization of ET amounts |
| 8. Agricultural ET fraction | = 106.4/146 = 73% | Area dominated by agricultural activities |
| 9. Irrigated ET fraction | 96.1/146 = 66% | Considerable proportion of ET came from irrigated areas |
Table 6.
Summary of catchment areas and estimated annual amounts of water that can be harvested from the side wadis.
Table 6.
Summary of catchment areas and estimated annual amounts of water that can be harvested from the side wadis.
| Catchment | Area (km2) | Minimum Capacity (MCM) | Suitability for Further Investigation/Constraints |
|---|---|---|---|
| Wadi Al-Arab | 258.8 | 9.44 | Developed (18 MCM capacity) |
| Wadi Quasyba | 21.4 | 0.78 | Suitable |
| Wadi At-Tayyiba | 55.4 | 2.02 | Suitable |
| Wadi Ziglab | 103.7 | 3.78 | Developed (4.0 MCM capacity) |
| Abu Ziyad | 24.6 | 0.90 | Not suitable/land ownership |
| Rod Um Eddeib | 3.0 | 0.11 | Developed through FAO-RNE |
| Rod Khalat Salman | 3.2 | 0.12 | Not suitable/touristic sites |
| Rod Al-Bahja | 1.9 | 0.07 | Not suitable/urban |
| Hemma | 19.7 | 0.72 | Suitable |
| Jurum | 18.3 | 0.67 | Suitable |
| Nhair | 19.3 | 0.70 | Suitable |
| Wadi Yasaneh | 7.7 | 0.28 | Not suitable/urban |
| Wadi Al-Yabis | 121.7 | 4.44 | Suitable |
| Wadi Abu Sufair | 8.4 | 0.31 | Not suitable/urban |
| Wadi Al-Harouth | 17.2 | 0.63 | Suitable |
Publisher’s Note: MDPI stays neutral with regard to jurisdictional claims in published maps and institutional affiliations. |
© 2022 by the authors. Licensee MDPI, Basel, Switzerland. This article is an open access article distributed under the terms and conditions of the Creative Commons Attribution (CC BY) license (https://creativecommons.org/licenses/by/4.0/).
Share and Cite
MDPI and ACS Style
Al-Bakri, J.T.; D’Urso, G.; Batchelor, C.; Abukhalaf, M.; Alobeiaat, A.; Al-Khreisat, A.; Vallee, D. Remote Sensing-Based Agricultural Water Accounting for the North Jordan Valley. Water 2022, 14, 1198. https://doi.org/10.3390/w14081198
AMA Style
Al-Bakri JT, D’Urso G, Batchelor C, Abukhalaf M, Alobeiaat A, Al-Khreisat A, Vallee D. Remote Sensing-Based Agricultural Water Accounting for the North Jordan Valley. Water. 2022; 14(8):1198. https://doi.org/10.3390/w14081198
Chicago/Turabian StyleAl-Bakri, Jawad T., Guido D’Urso, Charles Batchelor, Motasem Abukhalaf, Adel Alobeiaat, Areej Al-Khreisat, and Domitille Vallee. 2022. "Remote Sensing-Based Agricultural Water Accounting for the North Jordan Valley" Water 14, no. 8: 1198. https://doi.org/10.3390/w14081198
Note that from the first issue of 2016, this journal uses article numbers instead of page numbers. See further details here.