Article

Inventory of Water–Energy–Waste Resources in Rural Houses in Gran Canaria Island: Application and Potential of Renewable Resources and Mitigation of Carbon Footprint and GHG

by
Melania L. Rodríguez-Pérez
1,
Carlos A. Mendieta-Pino
1,2,
Alejandro Ramos-Martín
1,
Federico A. León-Zerpa
1,2,* and
Fabián A. Déniz-Quintana
3
1
Department of Process Engineering, University of Las Palmas de Gran Canaria (ULPGC), 35214 Las Palmas de Gran Canaria, Spain
2
Institute for Environmental Studies and Natural Resources (i-UNAT), University of Las Palmas de Gran Canaria (ULPGC), 35214 Las Palmas de Gran Canaria, Spain
3
Department of Electrics Engineering, University of Las Palmas de Gran Canaria (ULPGC), 35214 Las Palmas de Gran Canaria, Spain
*
Author to whom correspondence should be addressed.
Water 2022, 14(8), 1197; https://doi.org/10.3390/w14081197
Submission received: 8 March 2022 / Revised: 1 April 2022 / Accepted: 7 April 2022 / Published: 8 April 2022
(This article belongs to the Section Wastewater Treatment and Reuse)

Abstract

:
The potential application of renewable energies is diverse, and they have demonstrated their suitability in their application to the size and operation of activities. Rural tourism is one of the products with the greatest potential for growth within the tourist offer of the island of Gran Canaria, as it combines sustainable development and respect for the natural environment. Among the renewable energies with high applicability in rural environments, we highlight photovoltaic solar, low-temperature solar thermal and the methanation of waste and wastewater generated in tourism. This article shows a methodology adapted and developed for the study of the water-energy-waste nexus, considering parameters of waste generation, water and energy consumption, the occupied area and potential renewable energy generation in rural houses in Gran Canaria and evaluates their environmental profitability. It has been concluded that applying these renewable technologies can significantly reduce the carbon and ecological footprint of the activity of rural houses based on the available surface. This contributes to achieving the energy and environmental objectives proposed by the EU to achieve decarbonization by 2050.

1. Introduction

Geographic overview. The island of Gran Canaria, with an area of 1560.1 km2, is the third largest island and forms together with the rest of the Canary Islands and the archipelagos of the Azores, Madeira, Cape Verde and Salvajes, called Macaronesian biogeographical region. It is also one of the most densely populated of the Canary Islands with 851,231 inhabitants and a population density of 545.6 inhabitants km−2 (2019), housing 39.53% of the population of the archipelago, in a territory that represents 20.82% of the total. The island has a rugged and complex topography, with the highest point, located in the central area, being 1949 m high.
Gran Canaria possesses variety, richness, and uniqueness, both in ecological terms, i.e., in terms of botanical and faunal species, diversity of climates, habitats and biotypes, and in geographical and geological terms, due to the multitude of existing forms of relief. This fact means that approximately 50% of its territory are protected areas as can be seen in Figure 1. The tourist activity has been organized around two axes, the southeastern coastal strip and the midlands and summits, by means of accommodation apartments-hotels and rural houses, respectively. Different publications have studied the application of renewable energy sources (RES) in isolated areas where the supply of energy from the main grid can be a challenge [1,2,3].
Tourism overview. In 2019, Gran Canaria received 4,267,384 tourists (28.24% of the total of the Canary Islands), with an average stay of 7.34 days, having 29,597,873 overnight stays and the tourism sector representing 35% of the local GDP [5]. Tourism in the Canary Islands develops from the late nineteenth century, having a high growth in the second half of the twentieth century, with the mass tourism of sun and beach and covering the tourist season throughout the year. Since the end of the twentieth century, there has been a change in the demand for tourist services and products and rural tourism have come to signify a return to the land of urban societies and as an alternative to traditional sun and beach tourism [6].
Within tourism, rural tourism is becoming increasingly important. In the last two decades, it has grown in many regions all over the world. The term “rural tourism” has been defined in various ways, it varies from country to country and that is why the European Union (EU) adopted this definition for “tourism in areas with low population density, rural areas and villages” [7,8]. The growth of rural tourism is partly given by a population increasingly concerned about the environment that tries to look for more environmentally friendly alternatives and this type of tourism is presented as an alternative to the current mass tourism [9]. Dogan has studied the influence of the tourism sector on CO2 emissions, GDP, and energy consumption in EU countries [10]. Furthermore, different sources suggested to promote agrotourism as a tool to obtain a sustainable economic and environmental development of rural areas [11,12,13].
Water and wastewater overview. A particular problem of tourism activity is the increase in demand for water and the production of wastewater. Different studies have analysed the water needs linked to the tourism industry and the capacity of natural resources to meet this demand, as well as the implementation of efficient water use practices [14,15]. According to the report [16], the total volume consumed on the island of Gran Canaria is 492 L per capita per day to satisfy the uses corresponding to the development of all socio-economic activities that take place on the island. Each activity is a determining factor that conditions consumption, and that allows to delimit and classify the demands of nominal and unitary form. The factors analyzed are the population with respect to domestic supply, tourist overnight stays, about tourism, employees of the industrial sector in this sector, and hectares of irrigation, as well as the heads of cattle in terms of agricultural consumption. The analysis of these terms returns an average consumption in households of 182 L per inhabitant/day, which represents 38% of total water consumption and 448 L for each place occupied in the tourism sector.
Waste production overview. As for the generation of waste in Gran Canaria, according to the study of composition and characterization of municipal solid waste of the Canary Islands, [17] 532,507 t are produced annually, that is, approximately an annual per capita generation of 615 kg where the organic fraction represents approximately 40% of the total waste generation. With respect to the solid fraction, waste generation in the predominantly rural autonomous communities does not differ significantly from that of the predominantly urban communities; however, the Canary Islands show a higher rate of waste generation mainly due to the impact of the tourist factor [18].
Energetic overview. For the island of Gran Canaria, the electricity coverage was 3,028,054 GWh from non-renewable sources (52.8% combined cycle, 40.7% steam turbines, 5.5% diesel groups and 1.0% gas turbines) and 553.88 GWh from renewable sources (90% wind and 10% photovoltaic). Specifically, the island of Gran Canaria had 1220.53 MW installed in 2019, divided into renewable (196.47 MW) and non-renewable (1024.06 MW) source technologies. Within the non-renewables, we find technologies such as steam turbines, gas turbines, diesel cycles and combined cycles. In the case of renewables, we find mainly wind and photovoltaic. The participation of the different sources and technologies in covering the demand for electrical energy mix in terms of gross energy is 34.4% for groups with steam turbines, 44.6% for combined cycle groups, 4.6% for diesel groups, 0.9% of gas turbine groups and 15.5% of renewable groups [19,20].
Carbon and Ecological Footprint Greenhouse Gas Emissions (GHG) from electricity production overview. It is possible to call the carbon footprint as the totality of greenhouse gases (GHG) emitted by direct or indirect effect of an individual, organization, event or product where greenhouse gas emissions are expressed in kg equivalent of CO2. It is also interesting to use the concept of ecological footprint, since it can give a better notion of the situation, since it indicates the surface of the natural environment necessary to produce the resources that a human population consumes and absorb the waste that it generates, it is measured in hectares per year [21,22,23]. In order to meet the targets set by the European Commission (EC) to achieve a competitive low-carbon economy by 2050 and the reduction of GHG emissions by 55% by 2030 [24], the Regulation (EU) 2020/852 of the Parliament European and Council of June 18, 2020, established a framework to facilitate sustainable investments, whose purpose is to establish the criteria to determine if an economic activity is considered environmentally sustainable [25]. The regulation establishes an emissions threshold of 100 g CO2-eq/kWh for sectors classified as climate change mitigation activities. Although the Platform on Sustainable Finance recommends raising the threshold between 100 g and 270 g CO2-eq/kWh as a transition to a substantial contribution, this can accelerate investment and improve emissions performance [26].
To meet these objectives and improve the current energy and environmental situation, the Canary Islands have drawn up an energy strategy with specific objectives for 2025 (Canary Islands Energy Strategy, EECan25) where the aim is to increase the share of renewable energies in the final energy consumption of the 2% in 2015 to 15% in 2025 [27]. One of the basic principles of the EECan25 is to achieve the maximum penetration of renewable energy sources to obtain electricity (RES-E) in Canary Islands, as a way that is compatible with the preservation of the natural environment advocating sustainable development, following the example of islands such as Ireland or Greece [28,29,30,31].
The aim of this paper is to define a methodology to inventory in tourism rural environments, including the available water, waste and removable resources and their carbon footprint for the application of RES-E.

2. Materials and Methods

Model. For this article, we have developed a methodology adapted from that indicated by [32] focused on tourist accommodation, in which a comprehensive methodology is developed for the study of the water-energy-waste nexus, considering parameters of waste generation (wastewater and urban solid waste), energy consumption (water, electricity, domestic hot water), occupied area and renewable energy generation. A similar evaluation is carried out by Karagiorgas et al. where a sample of 200 hotels is taken to implement five types of renewable energies (solar thermal, passive solar, solar photovoltaic, biomass and geothermal) in different regions of the EU, evaluating the results obtained in the technical-economic field [33]. Additionally developed by Cadarso et al. is a methodology based on an input–output life cycle assessment model (LCA-IO) applied to the Spanish tourism sector for the period 1995–2007 [34]. Analysed by Filimonau et al. [35] is the potential of Life Cycle Assessment (LCA) used for the environmental assessment of tourist accommodation facilities and its contribution to the global carbon footprint.
A methodology is developed by means of an integral model, Figure 2, for the energetic and environmental evaluation of rural hotel facilities in Gran Canaria, also considering the mitigation parameters of greenhouse gases [13]. With the aim of reducing the energy consumption of the facilities, the carbon footprint and the ecological footprint, from the control of waste management and consumption of electricity, hot water (DHW) and occupied area.
Carbon Footprint and Ecological Footprints Methods.
Electricity generation systems in the Canary Islands in general and specially in Gran Canaria have a high emission of greenhouse gas emissions (GHG) compared to continental systems due to the energy mix used with a high dependence on fossil fuels. In the Canary Islands, the mix of production technologies generated in 2019, 5,454,909 tCO2-eq (2,063,910 tCO2-eq for Gran Canaria), and the average emission is 0.652 tCO2-eq MWh−1, corresponding with the island of Gran Canaria’s of 0.637 tCO2–eq MWh−1 as opposed to continental Spain’s of 0.190 tCO2–eq MWh−1 [20]. The average emission in the Canary Islands in 2009 was 0.802 tCO2–eq MWh−1 and for Gran Canaria it was 0.789 tCO2–eq MWh−1. Tourism contributes significantly to GHG emissions with energy-intensive activities such as accommodation (heating, air conditioning, restaurants, laundries, pools, …) that must be taken into consideration [36,37,38,39,40]. We used Equation (1) to calculate CF takin into account the emission factor and the energy consumed.
EmF   ·   energy   consumed   =   CF
where, EmF (Emission Factor), identifies the CO2 emissions, these are calculated from emission factors expressed in kgCO2 per kWh of electricity produced, grouped according to generation technologies (CF: carbon footprint). These emission factors make it possible to obtain the total tons of CO2 emitted by a generator or group by multiplying the emission factor assigned by the energy produced (kWh) by the generator or group [20]. In this way, we can calculate the total CO2 emissions associated with electricity generation in the electricity system from non-renewable sources as described in the paper by Leon et al. [32] (Equation (2)).
MF   =   MFde   +   MFtg   +   MFgt   +   MFst   +   MFcc
where, MF: emission factor of the electricity mix (kgCO2 kWh−1), MFde: diesel engine mix factor (kgCO2 kWh−1), MFgt: gas turbine mix factor (kgCO2 kWh−1), MFst: steam turbine mix factor (kgCO2 kWh−1), MFcc: combined cycle mix factor (kgCO2 kWh−1).
With Equation (3), it is possible to calculate the carbon footprint of the CFMIX energy mix (kgCO2) as the sum of the energies of each technology by its emission factor:
CFMIX   =   Σ   Ei   MFi
Once the above parameters have been obtained, the calculation of the ecological footprint (EF) is developed from Equation (4):
EF   =   CFa / 2 =   CFd   ·   365   days / 2  
where CFa: carbon footprint (tCO2 year−1); CFd: carbon footprint (tCO2 day−1); EF: ecological footprint (ha year−1).
In this study, the amount of waste generated by the tourist exploitation of rural houses has been analysed. The average consumption of electricity and consumption of domestic hot water for the activity of a rural house and the area available to carry out said activity.
Waste production (USW and wastewater) and water consumption. The amount of waste generated USW (urban solid waste), by each accommodation unit will be obtained because of a study in which the generation of waste per inhabitant in Spain is determined by the autonomous community, also indicating the rurality index that each community represents. With respect to the solid fraction, waste generation in the predominantly rural autonomous communities does not differ significantly from that of the predominantly urban communities. The Canary Islands show a higher rate of waste generation mainly due to the impact of the tourist factor. For this article, we have chosen to take 1.81 kg inhabitant−1 day-1 for the number of available places in each rural house, which is higher than 1.35 kg inhabitant−1 day-1 in predominantly rural environments. It uses the expression in Equation (5) to calculate waste production by kg day-1.
Waste   [ kg   day 1 ] =   bed   [ inhabitant ] · 1.81   [ kg   inhab 1 day ]
The composition of this waste is diverse, so it cannot be used in its entirety for methanization. The amount of organic waste of domestic origin generated by an average citizen varies according to the study, which means that in rural or quasi-rural municipalities, compared to urban municipalities, the percentage can vary considerably. In different studies, it has been determined that this percentage is usually between 40–45% of the total domestic waste generated [18,41,42]. For our study, we have chosen to use the value indicated by the National Integrated Waste Plan of 44%.
Regarding the liquid fraction, in addition to the solid waste generated because of the tourist exploitation of the rural houses, a biodegradable liquid fraction or wastewater will also be generated. The determination of the flows of wastewater to be eliminated from a given population is essential for designing the appropriate facilities for its collection, treatment and disposal. It is thus necessary to know the flows to be treated. Average household water consumption in Spain was 133 L inhabitant−1 day−1 in 2018, which was a reduction of 2.2% with respect to that recorded in 2016 [43]. This average consumption is calculated by the quotient between the total volume of water recorded and distributed to households and the population. However, a higher average water consumption was recorded in the Canary Islands, reaching a value of 150 L inhabitant−1day−1. In this way, it is possible to obtain the flow rate of each accommodation unit (Equation (6)).
Flow   [ L   day 1 ] =   bed   [ inhabitant ]   ·   150   [ L   inhabitant 1 day 1 ]
About the characterization of wastewater, in the Canary Islands, values can be established between 400 to 800 mg L−1 and taking an average value of 500 mg L−1 of Chemical Oxygen Demand (COD) [44]. In addition, one of the most widely used concepts to characterize the pollutant load of wastewater is the term inhabitant equivalent (Inhab.Eq.). In populations where these are mostly made up of domestic wastewater, the number of population-equivalents will be like the number of inhabitants of the population or agglomeration. This concept is very useful because it makes it possible to compare pollutant loads regardless of the origin or nature of their wastewater [45,46]. The expression to calculate the number of inhabitant-equivalents of each accommodation unit is as follows in Equation (7):
inhabitant equivalents   = Flow   [ m 3 day 1 ] ·   COD [ g   O 2   L 1 ]   60   [ g   O 2   inhabitant 1 day 1 ]
Domestic Hot Water consumption (DHW). The amount of energy consumed in extra-hotel accommodation such as rural houses vary depending on the size, location and number of occupants. The excellent climatic conditions of the island mean that energy consumption for heating, air conditioning, etc., is lower than in other geographical areas with a similar standard of living. It is estimated that a single-family dwelling in the Canary Islands has an average consumption of 10.87 kWh day−1 [19] and the average number of inhabitants according to the National Institute of Statistics in the Canary Islands per dwelling is 2.60 inhabitants, which means an average consumption per inhabitant of 4.49 kWh d−1. Regarding DHW demand, and according to the Spanish Technical Building Code (CTE) (Ministry of Development, 2019), it establishes a consumption in liters, at 60 °C person−1 d−1, tabulated according to the type and use of the building, taking 34 L per person−1 d−1 (such as a two-star hotel ). In terms of energy (Equation (8)):
EDHW   [ J   day 1 ] =   DDHW   · ρ water · Cpwater · ( TDHW Tnet )
where: EDHW is the Energy required for DHW (J day−1); DDHW is the DHW Demand (L day−1); ρ water is the density of water = 1 kg m−3. Cpwater: heat capacity of water = 4182 J kg−1 K−1. TDHW: DHW supply temperature, (ref. 60 °C). Tnet: supply water network (°C) (ref. 15 °C).
Waste potential. The potential of organic waste from wastewater and USW will be evaluated (Equation (9)) from the amount of biogas generated from the solid and liquid organic fraction by anaerobic digestion, where we can consider COD is a conservative parameter, i.e., in an anaerobic digester:
COD   influent   =   COD   effluent   +   COD   methane
Therefore, and knowing that the biogas produced consists mainly of methane CH4 (65%) and CO2 (35%) and that the COD of CO2 is zero, it would result that (Equation (10)):
COD   methane   =   COD   removed   = 2.857   [ kg   COD   m 3   CH 4 ]
For every 100 kg of COD that is removed in the digestion process, the following is produced 35 m3 of CH4 is produced under normal conditions of pressure and temperature [47,48]. In this way, it is possible to obtain the number of cubic meters of biogas per day that is produced in each accommodation unit, both from the solid and liquid organic fraction, we have used Equation (11) to calculate it.
Biogas   [ m 3 day 1 ] = COD   [ kg   day 1 ] · 35   m 3   CH 4 100   [ kg   COD ]
Applying the typical lower calorific value (LCV) of biogas of 6 kWh m−3 [49] the amount of energy produced from the organic waste generated from the cottage is calculated (Equation (12)).
Energy   produced   [ kWh   day 1 ] =   biogas   [ m 3 day 1 ] × LCV [ kWh   m 3 ]
Electricity consumption. The total energy consumed in a rural house depends on the renewable and non-renewable energy of the electricity system and the local renewable energy produced by itself, and we will define it as kWh square−2 d−1. The Equation (13) that represents it is the following, which has been expressed by Leon et al. [32]:
E TC = E Rn + E NRn + E LR
where, ETc: total energy consumed from the system (kWh); ERn: renewable energy from the grid (kWh); ENRn: non-renewable energy from the grid (kWh) and ELR: local renewable energy (kWh).
Depending on the origin, the power system energy mix could be non-renewable energy (diesel engine, gas turbine, steam turbine and combined cycle), but also renewable, mainly from wind and photovoltaic energies, where the carbon and ecological footprint vary.
Occupied surface area consumption. The surface area occupied will depend on the urban planning regulations of the area, the distance to protected natural spaces and the availability of land to be used for GHG mitigation facilities. The reduction of the carbon footprint and GHGs is sought by using renewable energies (photovoltaic solar energy, low temperature solar thermal energy, thermal energy/electricity from biogas, and the mix of all energies. Therefore, the use of renewable energies is prioritized for the mitigation of the carbon footprint and GHG.
In this way, considering an average surface for each type of panel and considering that the available surface in each rural house will be a limiting factor when carrying out the installation, the Equation (14) is available:
total   area   to   use ( m 2 ) = surface   PV   panel · number   of   PV   panel + surface   solar   panel · number   of   solar   panel total   area   available
where, the number of photovoltaic panel (PV panel): surface PV panel (electric consumption/sloped surface PV potential efficiency) and the number of solar panel: surface solar panel (DHW consumption/sloped surface mean radiation efficiency). An average area of 1.94 m2 has been considered for photovoltaic panels and 1.2 m2 for solar thermal panels. Efficiency is considered 80%.
With the data collected, the potential available from the waste generated by the tourist exploitation of rural houses is analyzed. In addition, the photovoltaic potential, and the wind potential available according to the geographical location of the houses have been studied.
Solar potential. There are several indicators to measure the energy performance of an installation, the most used are the load factor (LF) and the equivalent hours (EqH):
  • Load factor (LF): The load factor or also called load factor is the ratio between the actual energy produced in each period (preferably annual) and the energy generated if it had worked at full load during the same period. Typical values for the load factor of a photovoltaic system range from 10 to 30%. The load factor is dimensionless and is thus usually expressed as a percentage. This can be calculated by the following expression (Equation (15)).
LF = E P n × 8760 *
where, E: real energy obtained (Wh); Pn: nominal power (W); *8760 h of a calendar year (for photovoltaic solar energy, 4380 h are considered as total hours of reference, equivalent to 12 h a day).
  • Equivalent hours (EqH): The term equivalent hours represent, in this case, the ratio between the energy produced during the whole year and the total installed photovoltaic power of that year. This ratio is a function of the photovoltaic potential of the area where the installation is located and the efficiency of its operation.
Wind potential. As in the case of photovoltaic installations, the most used indicators to measure the performance of wind installations are the equivalent hours (EqH) and the Load Factor (LF). Analyzing in greater detail the characteristics of the wind resource available in each of the locations, the data shown in Table 1 are obtained, speed and Weibull constants C and K. With these data, the Weibull distribution or probability density function of the distribution of wind speed has been calculated to obtain the theoretical power density of each housing unit [50]. A value of K close to 1 corresponds to a highly variable wind regime, when it is around 2 the regime presents moderate changes, while values higher than 3 correspond to more regular winds. On the other hand, a high C value means a longer period of high-speed winds [51].
Statistical analysis
To carry out the proposed calculations taking into account the starting data, different statistical tools have been used. These statistical tools or methods are set out below.
-
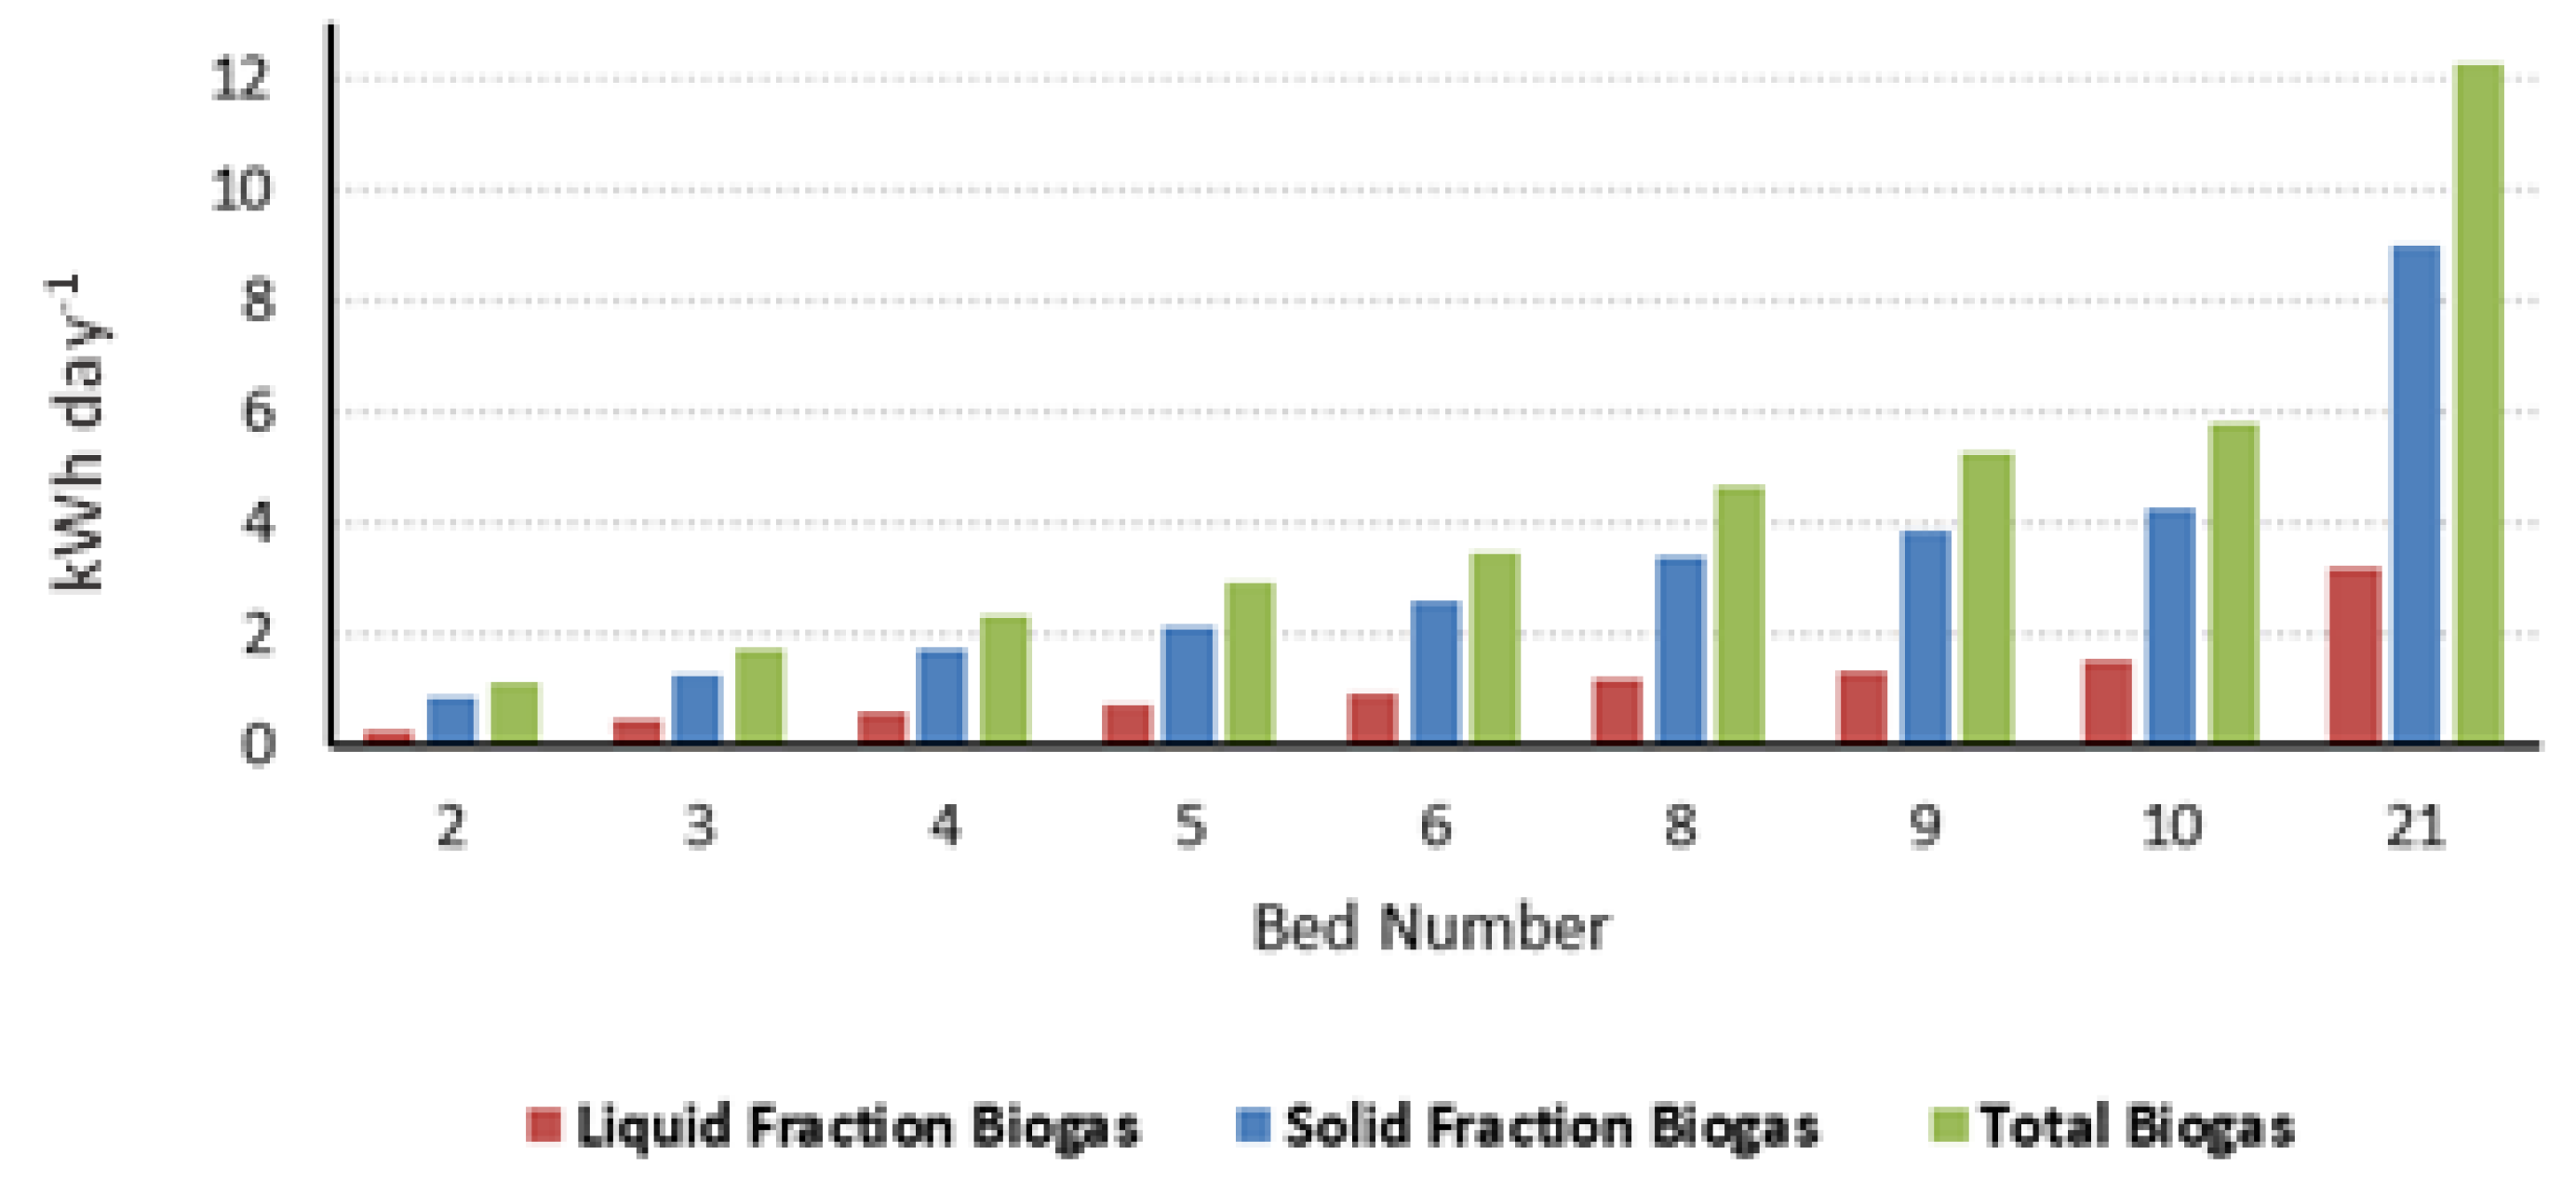
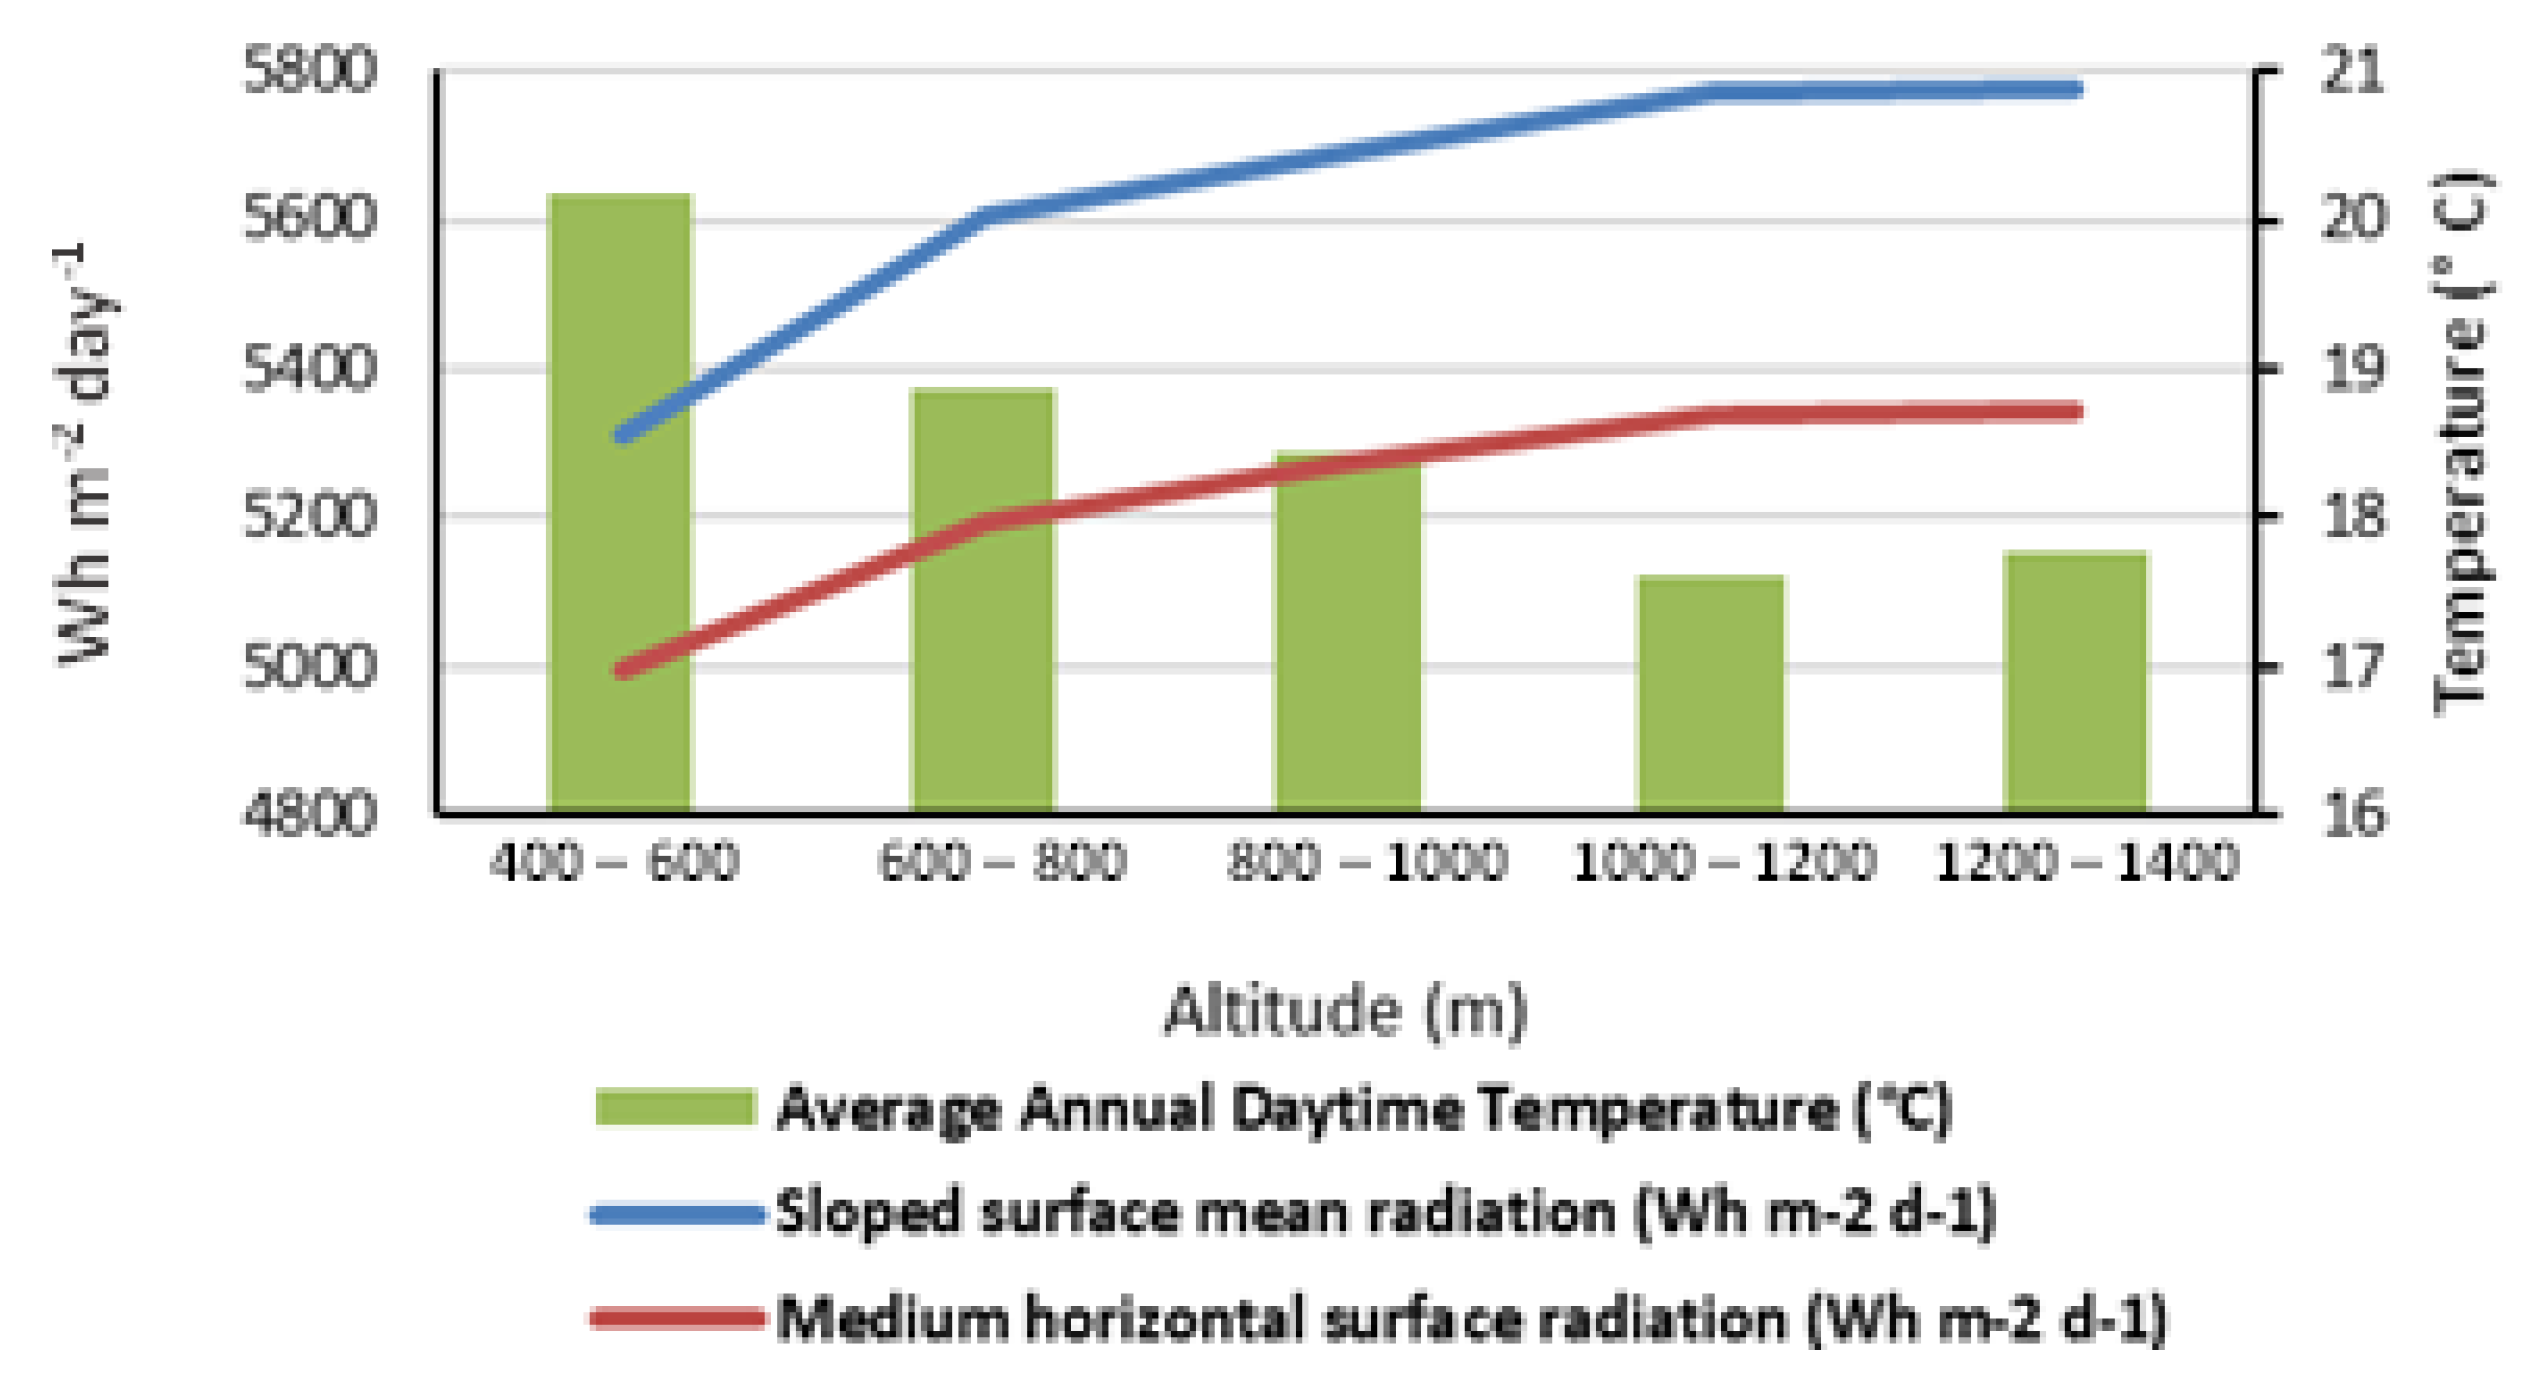
Interval data. For a better treatment of the data, it has been decided to group them by intervals; the calculations made have been obtained as a result of the grouping by number of beds in the rural houses. In addition, the rural houses have been classified according to the altitude at which they were located, creating intervals from 400 m to 1500 m.
-
Arithmetic average, maximum, minimum and standard deviation. Arithmetic mean is the most widely used measure of a mean, or average, in our case study, it has been used to define the average values of beds per rural house, average altitude of the location of the rural houses studied, average consumption of water, DHW, electricity and waste production. It has also been used to calculate the average solar radiation as well as the available wind potential according to altitude. In addition, the maximum and minimum values and the standard deviation of the EqH of operation of the solar photovoltaic and wind installations have been calculated.
-
Relative frequency. When making the calculations based on the grouping by the number of places offered by accommodation, the relative frequency with which each grouping is obtained has been calculated, generating an idea of which are the most representative groups of the total sample.

3. Results and Discussion

This methodology is proposed to be applied to the case of rural houses in Gran Canaria. In 2020, the island has an offer of 183 rural houses with a total capacity of 1071 beds. For this article is the area or region called “Medianías” covers a territory of 537.55 km2 (34.46% of the island’s surface area) and 88.9% of its land is classified as rustic. Seventy-eight rural houses will be analyzed out of 183 lodging units registered as rural houses on the island. This represents 43% of the total number of registered rural houses and they are located between 405.52 and 1530.93 m above sea level. These rural houses have an average capacity of 5.32 beds and can have in their daily activity, an average consumption of 9.46 kWh d−1 for sanitary hot water (DHW) at 60 °C and an electrical consumption of 23.89 kWh d−1, on the other hand, they generate 13.14 kg d−1 of solid urban waste and 798.08 L d−1 of residual water. In absolute values, 78 rural houses represent 14.10 m3 of DHW consumption, 1863 kWh d−1 of electricity consumption, 750 kg d−1 of MSW and 62.25 m3 d−1 of wastewater, as can be seen in Figure 1, and are mostly developed within or bordering spaces with environmental and/or landscape protection characteristics and usually in isolated environments.
Taking into account the previous energy consumptions and applying Equations (3) and (4), for an MF in Gran Canaria of 0.6881 kgCO2 kWh−1, the following results are obtained per rural house:
-
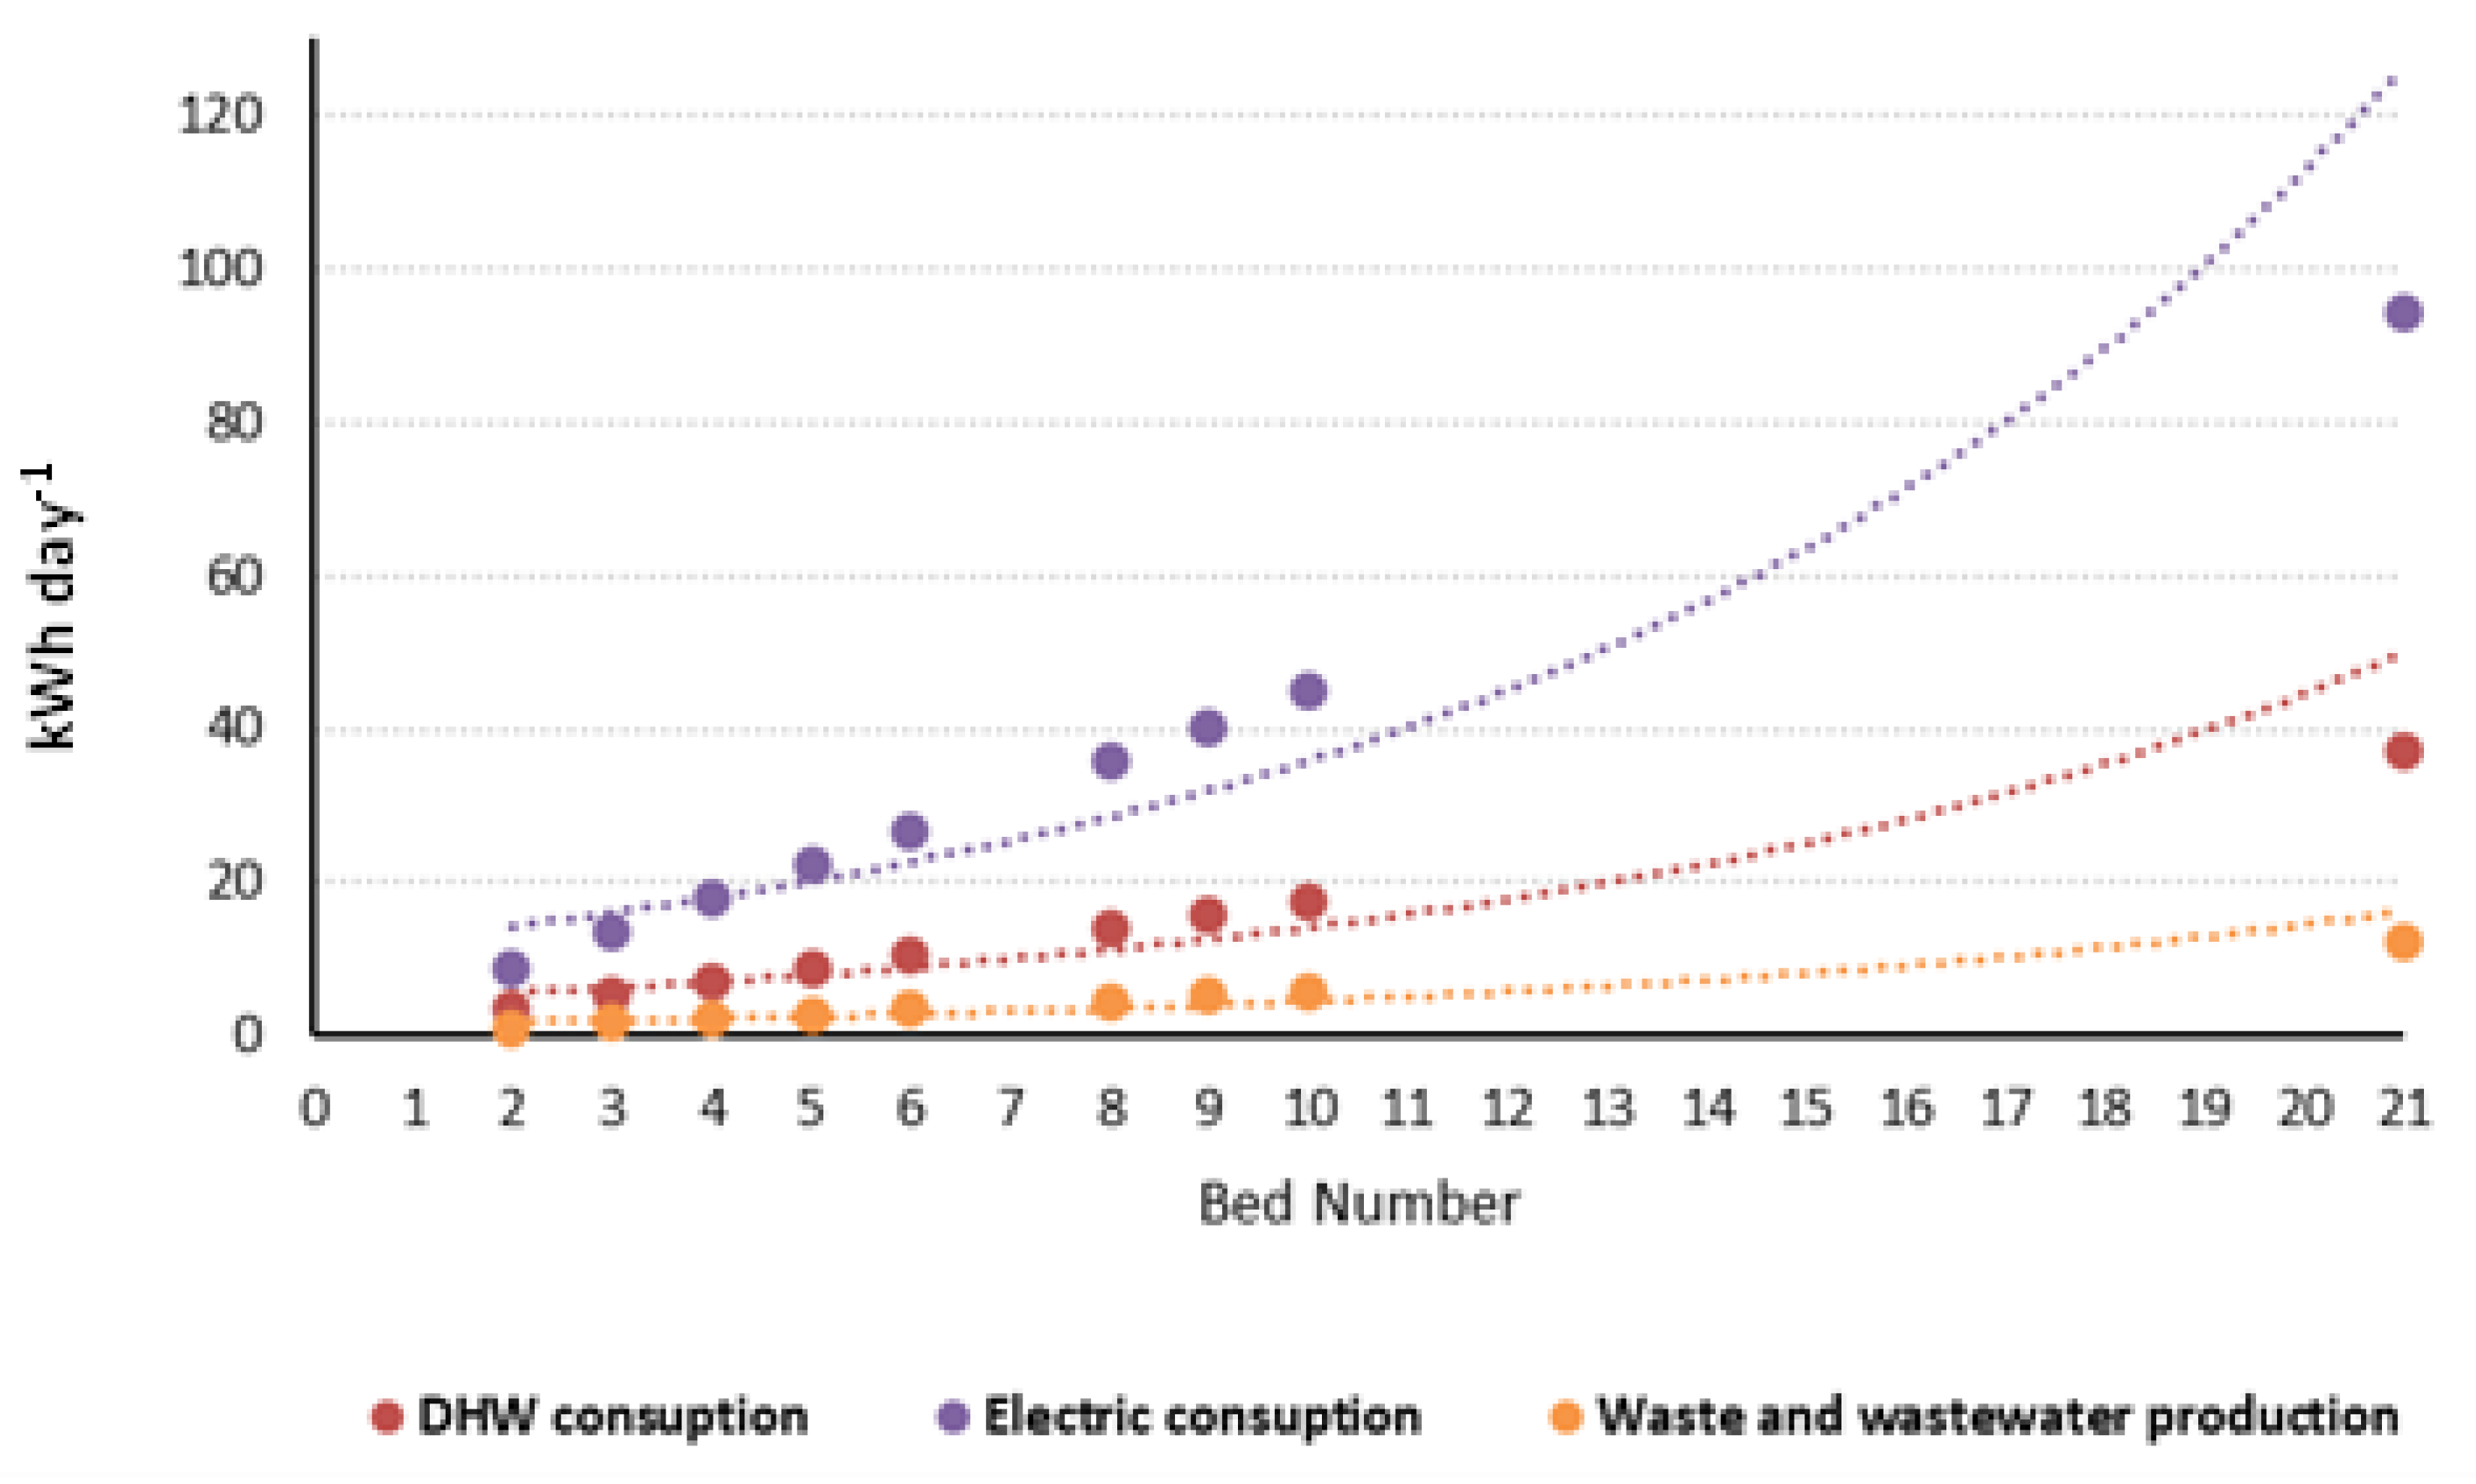
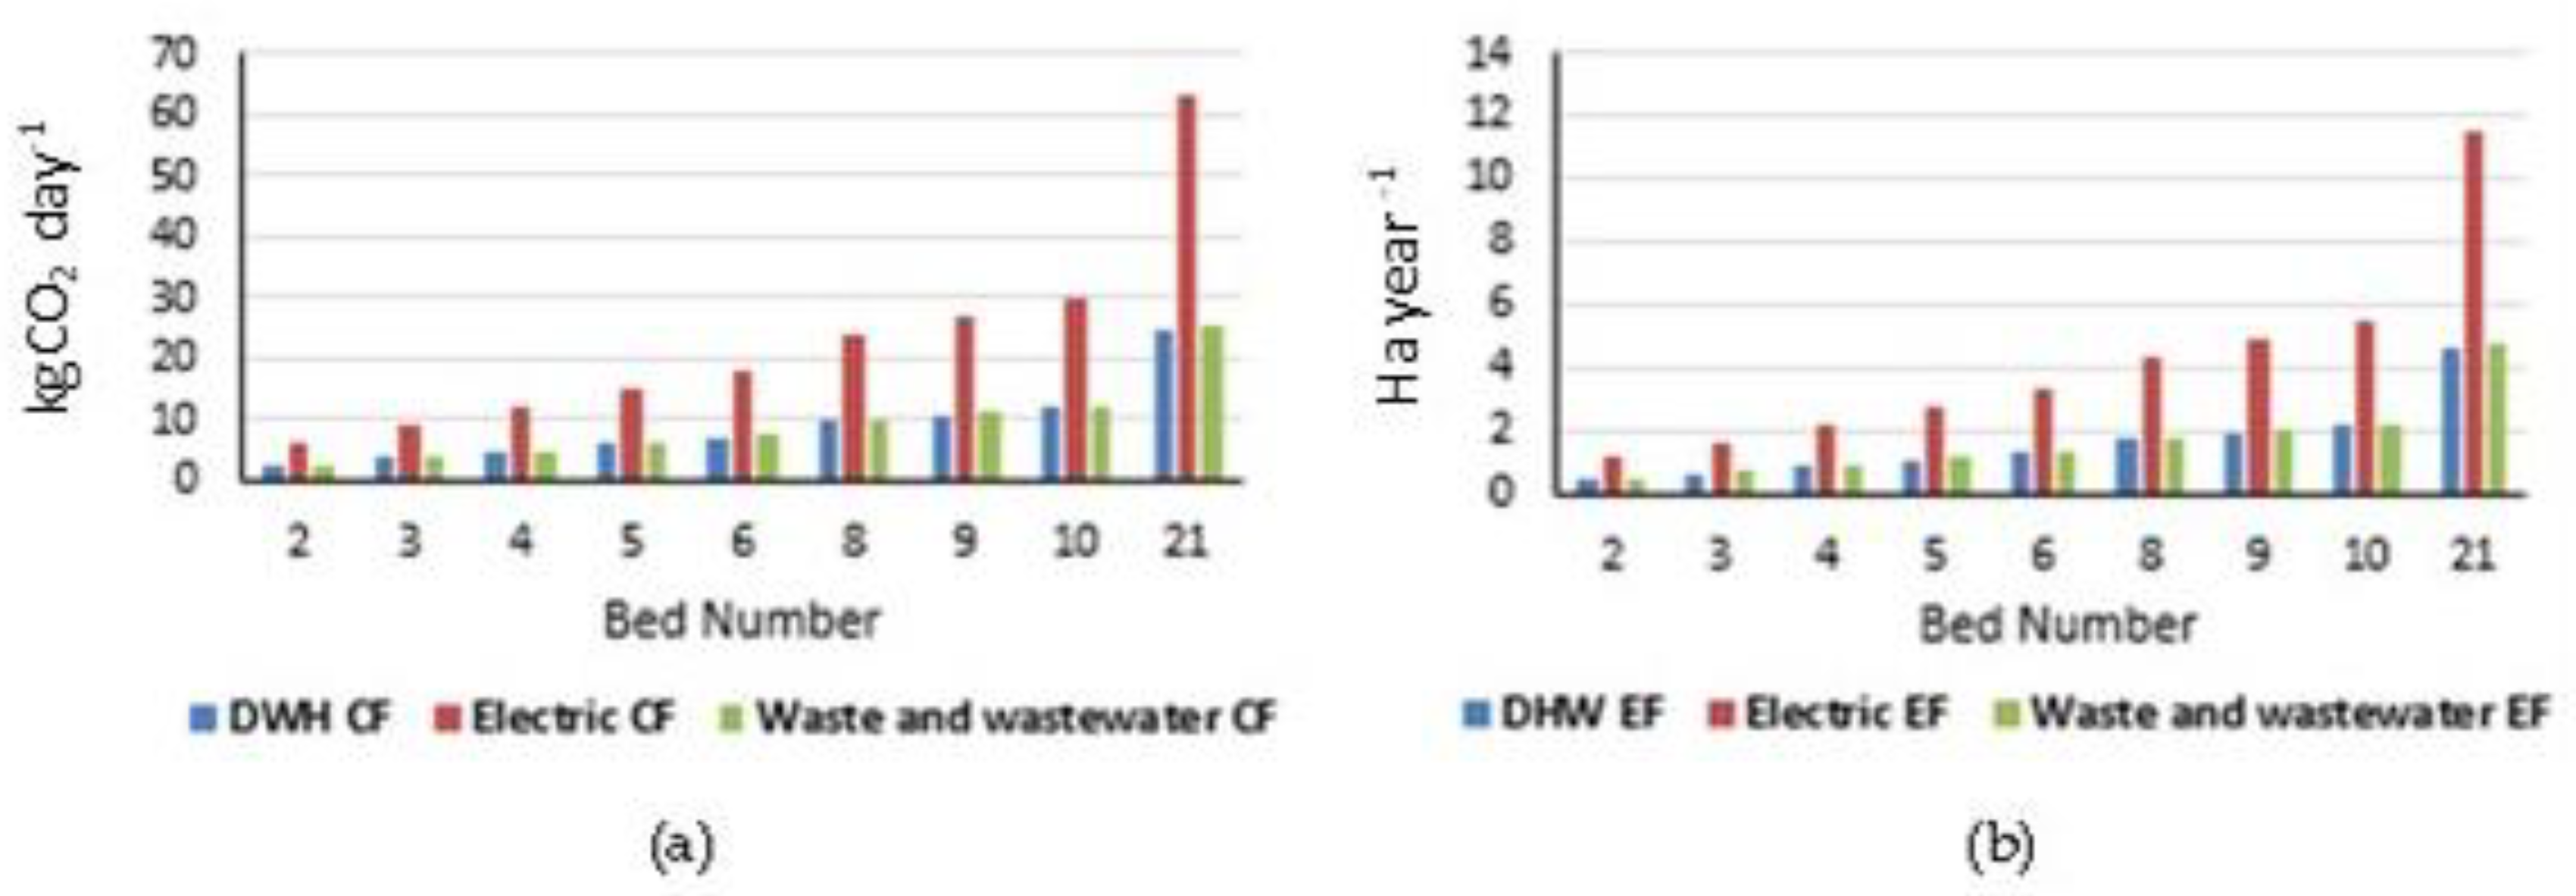
An average consumption of 9.46 kWh d−1 for domestic hot water (DHW) at 60 °C means a CF of 4.465 kgCO2 day−1 and an EF of 0.815 ha year−1;
-
As for the average electricity consumption of 23.89 kWh d−1, this means a CF of 16.439 kgCO2 d−1 and an EF of 3.0 ha year−1;
-
In total, the 78 rural houses account for around 1863 kWh d−1 of electricity consumption, causing a CF of 1281.93 kgCO2 day−1 and an EF of 233.952 ha year−1.
According to this, the energy consumption is calculated for each cottage according to its occupancy (DHW and electricity). The results are shown and compared with the amount of energy available from biogas in Figure 3, Figure 4 and Figure 5.
Waste and wastewater potential (biogas). For our article, we have used the indicated value of 44% [52]. Based on the amount of waste generated per inhabitant per day in the Community of the Canary Islands of 1.81 kg and considering 44% (0.7964 kg) as the organic fraction, the COD value for this amount of waste is 0.264 kg inhab−1d−1, thus obtaining the COD characterization of each accommodation unit shown in Table 1. It is observed that, because of the operation of a rural house, an average of 9.63 kg of waste is generated, of which 4.24 kg are of organic origin and are characterized by a COD of 1.40 kg d−1. The values obtained can change significantly depending on the composition of the organic matter used, i.e., it will vary depending on the percentage of lipids, carbohydrates and proteins contained in the waste.
From the data obtained, it can be concluded that the biogas production from the liquid organic fraction is very small, with an average of 0.14 m3d−1 and would require a very large digester volume to treat all the wastewater. This is because the volume of the digester is equal to the hydraulic retention time which on average will be about 39 days because the average temperature analyzed is 18.5 °C for the total volume of waste to be treated. The production of biogas from solid organic waste is somewhat higher generating an average of half a cubic meter of biogas per day.
Solar potential. The Canary Islands are in the climatic zone with more annual incident radiation, within the five climatic zones in which Spain is divided [53]. The abundant daylight hours of the archipelago allow the production of a solar panel installation in the Canary Islands to be higher than in other areas. In Gran Canaria, in the period (2012 to 2018), the FC has had an average value of 32.49% ± 0.02, with maximum and minimum values of 35.10% and 30.10%, respectively. It can be observed that the load factor of the photovoltaic installations operating in Gran Canaria is higher than the typical values. This makes the island an ideal place for the installation of this type of technology [19]. In the period (2012 to 2018), the EF has had an average value of 1423.00 ± 72.02 h, with maximum and minimum values of 1536.00 and 1320.00 h, respectively [19]. With this, there is a solar resource that allows photovoltaic installations to reach higher values of equivalent operating hours than those registered in the rest of Spain.
For this article, we have used the data of photovoltaic potential, solar radiation and temperature collected in GRAFCAN [4], and the results are shown in Figure 6, according to the altitude of the rural houses.
According to the collected data (Appendix A), the minimum value of radiation on inclined surface and annual photovoltaic potential is recorded in the rural houses (ID. 21–22–23 and at 479.05 m average altitude) with 5037.3 Wh m−2 day−1 and 1278.5 kWh kWp−1, respectively. On the other hand, the maximum value of radiation is recorded in the rural house (ID. 72 and 1530.93 m average altitude) with 6031 Wh m−2 d−1 and 1557 kWh kWp−1 for the annual photovoltaic potential. The average radiation value of the studied rural houses is 5640.08 Wh m−2 d−1 (inclined surface) and 1448.33 kWh kWp−1 for the annual photovoltaic potential. As for the temperature, the minimum value recorded in the rural houses is located in the rural house (ID. 48 and 1260.89 m average altitude), with a value of 15.8 °C, and the maximum value is found in the rural house (ID. 26- and 507.60-m average altitude) with a temperature of 21.7 °C. The average temperature value is 18.5 °C. The rural houses (ID 32–52 and average altitude of 1015.71 m) would be the most favorable for a solar–thermal–photovoltaic installation, since their radiation level is good, while the temperature does not reach too-high values.
This makes the performance of the panels to be appropriate, since there will be no problems of overheating of these, thus impairing the efficiency of the installation. On the contrary, the rural houses (ID 18–31 and average altitude of 430.75 m), as shown in Figure 6, would be the least appropriate because of the areas studied is the one that has less incident radiation and a higher average temperature, which can lead to problems of overheating of the panels, especially in the hottest months.
Wind potential. Wind energy is, of the renewable energies, the one that contributes the most in the Canary Islands. This is thanks to the optimal wind conditions on the islands, especially the trade winds, which are characterized by northeasterly winds, at constant and medium–high speed. In Gran Canaria, the evolution of the load factor (LF) of the wind farms connected to the grid, in the period (2012 to 2018), has had an average value of 32.65% ± 0.03, with maximum and minimum values of 37.33% and 28.50%, respectively. As for the equivalent hours (EqH), there was an average annual value of 2859.57 ± 300.80, with maximum and minimum values of 3270.00 and 2494.00, respectively, of the equivalent hours of operation for the wind farms and wind turbines installed in Gran Canaria. The data show that the municipality with the best wind potential by far would be the rural houses (ID 1–7), with wind speeds of 6–7 m s−1 and a power density of more than 100 W m−2. The other locations show wind speeds between 3 and 5 m s−1.
For this article, the available wind resource has been studied according to the altitude of the rural houses and is shown in Table 1, according to the data provided by GRAFCAN. The locations of the homes under study are in areas of low wind potential and high turbulence. In addition, if the location of the housing units is analyzed, most of them are in protected natural areas, so the application of this type of technology would not be feasible.
Mitigation potential of carbon footprint and GHG in rural houses. In accordance with the procedure followed in the previous section to obtain the carbon footprint and the ecological footprint produced by the activity generated in a rural house, the following results have been obtained in Figure 7.
From the data obtained, CF of rural tourism represent approximately 15 tCO2-eq per year, considering the consumption of DWH, electricity consumption and the generation of waste and wastewater and an EF of approximately 7.5 ha year−1, and considering that rural tourism is expanding, it is important to reduce its carbon and ecological footprint. Furthermore, it has been observed that the generation of biogas would only cover 9% of the total energy demand. If we transfer it to the reduction of the number of photovoltaic panels needed, it is necessary to reduce the number of panels to be installed by 12%, so the weight of this technology in terms of mitigating the carbon footprint and the ecological footprint is not too relevant. Therefore, for the reduction of the carbon footprint and the ecological footprint, only the installation of solar thermal panels to produce domestic hot water and photovoltaic solar panels to produce electrical energy has been considered.
With this, it has been achieved that to fully cover the energy demand from renewable energies and reduce the carbon footprint significantly of the rural houses with more than four places, an available area of more than 30 m2 is needed. Therefore, and in view of the results, it will be necessary to analyse for each rural house with the maximum percentage that can be reduced the carbon footprint according to the available area in said house.
Our results are in line with those obtained by Fortuny et al. [12] where a complete evaluation of the transformation towards sustainable tourism is presented, since in both studies a methodology is presented for the reduction in environmental impacts associated with tourism development in the island territories, focusing especially on areas such as energy consumption, water and waste management. According to our study, it is proposed to use more environmentally sustainable technological alternatives than the current ones that take advantage of available local energy resources. In addition, the application of internal management tools to minimize the resources consumed and the generation of waste. As also mentioned above, the economic feasibility of implementing the selected renewable technologies should also be studied.
The results obtained by Sun et al. [54] where the relationship between the contribution of tourism in the economy and its impact on emissions is manifested, are consistent with those obtained in this study. Taking as reference indicators similar to those used to carry out this analysis, such as gross domestic product, water consumption and waste generation for the calculation of the carbon footprint. Unlike our study, they also consider the GHG emissions produced by tourists outside the accommodation itself (arrivals and departures, meals in restaurants, trips, etc.). Therefore, it would be of interest in the future to make a similar comparison with the insularity conditions given in the present study.
Like our case study, the paper developed by Sun [55] indicates the impact that rural tourism can have on an island territory, pointing out that this type of activity is generally found in an isolated area, with a small scale of industrialization, natural resources limited and a relatively small population. In this article they address the importance of the energy dependency that exists in this type of territory, for which it is proposed to reduce said dependency and thus reduce the carbon footprint of both tourists and energy imports, resorting to more ecological alternatives for balance tourism. Carbon development and mitigation such as the insertion of renewable energy sources.
In the paper by Díaz et al. [39], a comparison is made between the carbon footprint of the hotels in the Canary Islands with respect to mainland Spain, although their results applied to mass tourism located in hotels coincide with ours, showing that the consumption of water and waste is greater in the archipelago than in the peninsula, as well as the GHG emission factor. Therefore, his proposal, similar to the one developed in this work, tries to reduce the carbon footprint to practically zero.

4. Conclusions

The following conclusions can be drawn from this article:
  • The application potential of renewable energies is diverse and has proven the suitability in their application to the size and operation in the activities;
  • According to the results, we must work in the direction of reducing the carbon footprint generated by rural tourism;
  • Among the renewable energies with high applicability in rural environments, we highlight the solar photovoltaic as low temperature thermal and methanization of waste generated in tourism;
  • It has been shown that the biogas obtained from the exploitation of rural houses contributes just over 9% to cover the energy demand. Which makes it unattractive for this type of tourist exploitation energetically speaking. Although other aspects would have to be assessed, such as the lack of sewers that may exist in these locations, which would make it essential to treat the waste generated before dumping it into the environment;
  • Although it has been shown that the available area in rural houses is one of the most determining factors when carrying out an installation that implements renewable energies (solar photovoltaic, solar thermal, biogas), there are other qualitative factors that must be considered such as the location of the building (protected area that hinders the realization of an installation), road access or non-existent sewers are other factors to be considered;
  • This article has discussed the impact that the implementation of renewable energies to meet their energy demand would have on the carbon footprint and ecological footprint of rural accommodation. It has been studied from the energy and environmental point of view. It would be pending to carry out an analysis of the economic-financial profitability for each type of technology.

Author Contributions

Conceptualization, M.L.R.-P., C.A.M.-P. and F.A.D.-Q.; methodology, M.L.R.-P., C.A.M.-P., F.A.L.-Z. and A.R.-M.; software, M.L.R.-P. and C.A.M.-P.; validation, M.L.R.-P., C.A.M.-P., F.A.L.-Z., A.R.-M. and F.A.D.-Q.; formal analysis, M.L.R.-P., C.A.M.-P., F.A.L.-Z., A.R.-M. and F.A.D.-Q.; investigation, M.L.R.-P. and C.A.M.-P.; resources, M.L.R.-P. and C.A.M.-P.; data curation, M.L.R.-P. and C.A.M.-P.; writing—original draft preparation, M.L.R.-P., C.A.M.-P., F.A.L.-Z., A.R.-M. and F.A.D.-Q.; writing—review and editing, M.L.R.-P., C.A.M.-P., F.A.L.-Z. and A.R.-M.; visualization, M.L.R.-P. and C.A.M.-P.; supervision, C.A.M.-P., A.R.-M. and F.A.D.-Q.; project administration, C.A.M.-P., A.R.-M. and F.A.D.-Q.; funding acquisition, C.A.M.-P., A.R.-M. and F.A.L.-Z. All authors have read and agreed to the published version of the manuscript.

Funding

This research has been co-funded by the INTERREG V-A Cooperation Spain–Portugal MAC (Madeira-Azores-Canarias) programme MITIMAC project MAC2/1.1a/263.

Institutional Review Board Statement

Not applicable.

Informed Consent Statement

Not applicable.

Data Availability Statement

Not applicable.

Conflicts of Interest

The authors declare no conflict of interest.

Appendix A

Table A1. General data of the rural houses studied.
Rural HousesConsumptionWaste GenerationSolar Potential AverageAverage Wind Potential (40 m)
ID.X (UTM)Y (UTM)Altitude (m)DHW
(kWh day−1)
Electric
(kWh day−1)
USW Generation (kg day−1)Organic Matter Fraction (kg day−1)Wastewater Generation
(L day−1)
Total Year (kWh/kWp)Daily Annual Average (kWh/kWp)Average Annual Daytime Temperature (°C)Wind Speed
(m s−1)
Constant CConstant KWeibullPower Density
(W m−2)
1436,243.623,100,296.401174.0610.6726.9410.864.78900.001531.304.2018.806.226.762.33000.1354124.13
2436,859.203,099,594.931286.888.8922.459.053.98750.001394.903.8018.707.047.622.29800.1182177.87
3436,609.273,099,484.281222.067.1217.967.243.19600.001504.804.1018.806.587.112.29200.1263144.96
4437,326.853,100,363.211326.597.1217.967.243.19600.001539.504.2018.706.897.492.34800.1231169.96
5437,341.173,100,339.351321.157.1217.967.243.19600.001539.504.2018.706.897.492.34800.1231169.96
6436,861.593,099,746.731270.405.3413.475.432.39450.001407.203.9018.706.627.172.30900.1263148.55
7436,596.743,099,495.831228.348.8922.459.053.98750.001504.804.1018.806.557.092.29200.1267142.89
8444,506.283,084,447.51607.075.3413.475.432.39450.001453.504.0020.504.054.41.99700.179129.51
9442,561.703,089,977.031032.0910.6726.9410.864.78900.001526.304.2018.605,145.532.11700.149864.04
10437,990.163,088,139.82926.107.1217.967.243.19600.001537.304.2019.403.563.831.82600.187118.41
11445,497.203,089,951.30844.4710.6726.9410.864.78900.001392.103.8019.604.755.152.23700.170653.19
12445,497.203,089,951.30844.475.3413.475.432.39450.001392.103.8019.604.755.152.23700.170653.19
13443,893.083,088,881.86827.118.8922.459.053.98750.001500.404.1019.504.534.92.12600.170443.95
14445,047.893,089,115.69732.873.568.983.621.59300.001480.804.1019.804.755.162.18700.166852.00
15444,775.893,088,843.69700.265.3413.475.432.39450.001436.003.9019.804,194.542.16400.187335.36
16444,709.083,084,254.25625.0410.6726.9410.864.78900.001455.304.0020.503.974.322.00900.183627.94
17444,365.503,084,903.23602.7614.2335.9214.486.371200.001436.503.9020.403.964.31.98400.182027.41
18450,912.6431,017,250.61430.7514.2335.9214.486.371200.001344.503.7020.204.305.522.59300.220146.08
19448,679.363,099,912.26659.9210.6726.9410.864.78900.001370.303.8018.204.054.552.61200.227537.49
20448,469.393,099,635.49717.5010.6726.9410.864.78900.001406.803.9018.603.664.132.62500.252227.71
21451,934.143,101,318.95478.5010.6726.9410.864.78900.001278.503.5021.204.314.842.59900.212944.99
22451,934.143,101,318.95478.1610.6726.9410.864.78900.001278.503.5021.204.314.842.59900.212944.99
23451,933.843,101,304.48480.4910.6726.9410.864.78900.001278.503.5021.204.314.842.59900.212944.99
24448,889.333,100,692.48569.5214.2335.9214.486.371200.001372.903.8019.003.083.462.61200.299216.49
25451,466.193,099,463.70673.015.3413.475.432.39450.001367.203.7020.304.474.952.58400.206050.37
26450,884.013,101,057.53507.607.1217.967.243.19600.001314.403.6021.703.754.222.61300.245529.74
27447,810.863,100,892.90722.8817.7944.9018.107.961500.001419.903.9018.803.574.012.60700.257725.64
28452,731.063,102,176.93450.768.8922.459.053.98750.001328.203.6020.004.865.462.59200.188364.33
29448,903.643,100,792.69626.573.568.983.621.59300.001383.503.8019.103.033.42.61500.304715.73
30447,560.333101668.94836.4710.6726.9410.864.78900.001427.903.9018.904.435.012.62200.207849.01
31452,840.513,101,181.60505.3310.6726.9410.864.78900.001344.403.7020.505.015.592.57800.182570.44
32440,924.913,095,672.371131.6010.6726.9410.864.78900.001430.503.9020,406.116.552.27800.1356115.75
33439,370.453,096,349.69974.127.1217.967.243.19600.001481.004.1017.604.514.82.18800.176844.83
34438,791.853,094,499.211161.3616.0140.4116.297.171350.001444.004.0018.005.385.712.16100.146675.23
35439,431.293,096,851.491041.758.8922.459.053.98750.001505.304.1017.505.505.872.20900.146382.00
36439,444.113,096,852.981043.797.1217.967.243.19600.001505.304.1017.505.505.872.20900.146382.00
37439,438.453,096,852.391042.7814.2335.9214.486.371200.001505.304.1017.505.505.872.20900.146382.00
38439,514.803,097,276.941069.4210.6726.9410.864.78900.001507.504.1017.405.485.862.23100.148281.85
39435,165.153,095,918.13644.635.3413.475.432.39450.001502.604.1019.004.504.842.18800.176744.39
40440,656.493,096,932.761325.2637.3594.2938.0116.723150.001521.104.2016.505.405.792.26000.151979.11
41439,391.923,096,282.29968.948.8922.459.053.98750.001484.304.1017.504.284.562.18500.186138.25
42438,980.343,094,377.381255.205.3413.475.432.39450.001440.103.9017.905.475.812.16300.144379.12
43440,915.373,095,591.251140.085.3413.475.432.39450.001464.204.0016.104.154.432.22300.195135.44
44439,037.603,097,386.701025.938.8922.459.053.98750.001489.404.1417.705.716.12.22900.142192.54
45435,243.743,095,802.33651.695.3413.475.432.39450.001487.904.1018.904.244.562.21870.187537.11
46439,546.413,096,825.841055.477.1217.967.243.19600.001496.604.1017.405.505.862.21100.146582.11
47439,561.033,096,853.581055.438.8922.459.053.98750.001496.604.1017.405.505.862.21100.146582.11
48441,106.253,095,347.881260.8910.6726.9410.864.78900.001497.904.1015.804.434.732.23100.183443.26
49439,802.313,098,261.761166.428.8922.459.053.98750.001494.104.1017.305.035.412.29800.165665.03
50440,323.653,095,930.061015.048.8922.459.053.98750.001426.803.9016.803.884.142.20300.206928.71
51435,205.123,095,837.30648.3510.6726.9410.864.78900.001474.904.0019.004.554.892.18800.174845.90
52435,247.773,095,802.93651.695.3413.475.432.39450.001487.904.1018.904.504.842.18800.176744.39
53449,762.603,095,596.02713.247.1217.967.243.19600.001465.204.0018.403.844.182.61000.244432.55
54451,237.133,095,371.74585.4437.3594.2938.0116.723150.001427.003.9019.104.354.742.59400.214447.01
55450,716.993,096,340.44543.548.8922.459.053.98750.001429.703.9018.803.714.052.59800.251529.18
56453,756.733,096,407.25405.5210.6726.9410.864.78900.001428.003.9020.104.615.042.52000.196454.34
57450,836.293,096,349.99580.047.1217.967.243.19600.001438.703.9018.903.774.112.59700.247630.63
58449,633.753,095,538.75725.0010.6726.9410.864.78900.001467.304.0018.403.814.152.61100.246331.79
59450,697.903,095,656.86626.8410.6726.9410.864.78900.001453.104.0018.904.234.612.60000.221243.37
60446,007.063,097,652.731020.1510.6726.9410.864.78900.001493.004.1017.803.754.112.53500.242529.38
61444,823.613,099,415.98857.575.3413.475.432.39450.001498.904.1017.703.684.092.55200.246827.72
62448,612.553,098,697.80724.808.8922.459.053.98750.001385.303.8017.603.573.932.59000.259425.81
63443,382.483,098,079.831158.725.3413.475.432.39450.001509.304.1017.102.943.212.44600.299513.71
64446,035.993,096,909.351049.9510.6726.9410.864.78900.001493.904.1017.303.163.452.55000.290017.71
65447,138.613,100,333.69786.097.1217.967.243.19600.001442.704.0018.603.523.932.58700.260524.50
66448,259.433,099,062.85783.448.8922.459.053.98750.001444.404.0017.703.964.372.58700.233335.13
67449,447.653,098,067.90750.265.3413.475.432.39450.001408.803.9017.703.443.782.60000.270423.20
68441,989.063,097,857.931302.387.1217.967.243.19600.001519.104.2016.404.404.752.35700.194144.55
69447,820.413,098,039.26851.407.1217.967.243.19600.001438.203.9017.002.973.262.58300.311514.85
70446,026.153,097,566.841037.777.1217.967.243.19600.001438.903.9017.403.944.312.54700.232134.26
71447,414.793,098,750.29823.918.8922.459.053.98750.001458.304.0017.803.593.962.57600.256326.08
72442,160.853,098,537.931530.9317.7944.9018.107.961500.001557.004.3016.805.495.972.39600.157687.66
73442,590.333,097,736.241169.353.568.983.621.59300.001492.504.1016.703.413.692.38500.253120.96
74449,442.873,098,144.25771.645.3413.475.432.39450.001412.003.9017.803.473.812.60000.268223.82
75447,787.003,100,702.02731.1910.6726.9410.864.78900.001422.003.9018.803.353.752.60400.275021.21
76445,902.083,099,625.94810.765.3413.475.432.39450.001470.004.0018.102.903.212.55300.314013.60
77447,150.543,100,312.81785.215.3413.475.432.39450.001442.704.0018.633.523.932.58700.260524.50
78444,556.383,097,440.381215.9810.6726.9410.864.78900.001442.503.9017.304.542.972.49800.088623.05
Average876.679.4623.899.634.24798.081448.333.9718.524.494.882.38840.200354.01

References

  1. Woldeyohannes, A.D.; Woldemichael, D.E.; Baheta, A.T. Sustainable renewable energy resources utilization in rural areas. Renew. Sustain. Energy Rev. 2016, 66, 1–9. [Google Scholar] [CrossRef]
  2. Sánchez, A.S.; Torres, E.A.; Kalid, R.A. Renewable energy generation for the rural electrification of isolated communities in the Amazon Region. Renew. Sustain. Energy Rev. 2015, 49, 278–290. [Google Scholar] [CrossRef]
  3. Tsiaras, E.; Papadopoulos, D.N.; Antonopoulos, C.N.; Papadakis, V.G.; Coutelieris, F.A. Planning and assessment of an off-grid power supply system for small settlements. Renew. Energy 2020, 149, 1271–1281. [Google Scholar] [CrossRef]
  4. Inicio|GRAFCAN-Mapas de Canarias. Available online: https://www.grafcan.es/ (accessed on 28 February 2022).
  5. INEbase/Servicios /Hostelería y Turismo. Available online: https://www.ine.es/dyngs/INEbase/categoria.htm?c=Estadistica_P&cid=1254735576863 (accessed on 28 February 2022).
  6. Cabrera, Á.; Castro Sánchez, J. Canarias y el turismo rural: Tendencias, el caso de la isla de Gran Canaria. In Anurio de Filosofía Psicología y Sociología; Las Palmas Gran Canaria Servicio de Publicaciones de Universidad de Las Palmas Gran Canaria; 2000; pp. 197–222. ISSN 1139-8132. Available online: https://accedacris.ulpgc.es/handle/10553/3546 (accessed on 28 February 2022).
  7. Cointat, M. Rural Tourism. Tour. Recreat. Res. 1991, 16, 8–9. [Google Scholar] [CrossRef]
  8. Dashper, K. Rural Tourism: An International Perspective; Cambridge Scholars Publishing: Newcastle upon Tyne, UK, 2014; ISBN 1-4438-6677-6. [Google Scholar]
  9. Eurostat (European Commission). Eurostat Regional Yearbook 2019 Edition; Publications Office of the European Union, Ed.; European Union: Luxembourg, 2019; ISBN 978-92-76-03505-3. [Google Scholar]
  10. Dogan, E.; Aslan, A. Exploring the relationship among CO2 emissions, real GDP, energy consumption and tourism in the EU and candidate countries: Evidence from panel models robust to heterogeneity and cross-sectional dependence. Renew. Sustain. Energy Rev. 2017, 77, 239–245. [Google Scholar] [CrossRef]
  11. Nguyen, H.A.T.; Gheewala, S.H.; Sophea, T.; Areerob, T.; Hashimoto, K.; Pimonsree, S.; Prueksakorn, K. Comparative carbon footprint assessment of agricultural and tourist locations in Thailand. J. Clean. Prod. 2020, 269, 122407. [Google Scholar] [CrossRef]
  12. Fortuny, M.; Soler, R.; Cánovas, C.; Sánchez, A. Technical approach for a sustainable tourism development. Case study in the Balearic Islands. J. Clean. Prod. 2008, 16, 860–869. [Google Scholar] [CrossRef]
  13. Lenzen, M.; Sun, Y.Y.; Faturay, F.; Ting, Y.P.; Geschke, A.; Malik, A. The carbon footprint of global tourism. Nat. Clim. Chang. 2018, 8, 522–528. [Google Scholar] [CrossRef]
  14. Pérez, D.M.G.; Martín, J.M.M.; Martínez, J.M.G.; Sáez-Fernández, F.J. An Analysis of the Cost of Water Supply Linked to the Tourism Industry. An Application to the Case of the Island of Ibiza in Spain. Water 2020, 12, 2006. [Google Scholar] [CrossRef]
  15. Tzanakakis, V.; Angelakis, A.; Paranychianakis, N.; Dialynas, Y.; Tchobanoglous, G. Challenges and Opportunities for Sustainable Management of Water Resources in the Island of Crete, Greece. Water 2020, 12, 1538. [Google Scholar] [CrossRef]
  16. Consejo Insular de Aguas de Canarias. Tercer Ciclo de Planificación Hidrológica 2021–2027 Demarcación Hidrográfica de Gran Canaria; Gobierno de Canarias: Canarias, España, 2020; Available online: http://www.aguasgrancanaria.com/plan_hidro.php (accessed on 15 January 2022).
  17. Gobierno de Canarias. Estudio de Composición y Caracterización de Residuos Sólidos Urbanos de Canarias; Consejería de Política Territorial y Medio Ambiente: Canarias, España, 2010. [Google Scholar]
  18. Galvín, R.M.; Pascual, R.M.; Canal, Í.G.; Pascual, F.R.; Forcada, E.S.; Navarro, J.N. Impactos de la contaminación de origen doméstico y no industrial sobre los SISP. Infoenviro Actual. Tecnol. Ind. Medioambient. 2010, 58, 103–110. Available online: http://www.emacsa.es/download/idi/Vertidos_domesticos-10.pdf (accessed on 15 February 2022).
  19. Gobierno de Canarias Anuario Energético de Canarias 2019; Instituto Canario de Estadística: Canarias, España, 2020. Available online: http://www.gobiernodecanarias.org/istac/jaxi-istac/menu.do?uripub=urn:uuid:131cf873-66a9-408d-8cfa-537d6be05067 (accessed on 10 May 2021).
  20. Red Eléctrica de España (REE). CO2 Emissions of Electricity Generation in Spain; Red Eléctrica de España (REE): Alcobendas, Spain, 2021. [Google Scholar]
  21. Kitzes, J.; Galli, A.; Bagliani, M.; Barrett, J.; Dige, G.; Ede, S.; Erb, K.; Giljum, S.; Haberl, H.; Hails, C.; et al. A research agenda for improving national Ecological Footprint accounts. Ecol. Econ. 2009, 68, 1991–2007. [Google Scholar] [CrossRef]
  22. Cano-Orellana, A.; Delgado-Cabeza, M. Local ecological footprint using Principal Component Analysis: A case study of localities in Andalusia (Spain). Ecol. Indic. 2015, 57, 573–579. [Google Scholar] [CrossRef] [Green Version]
  23. Ministerio de Medio Ambiente Medio Rural y Marino Análisis de la Huella Ecológica de España, Centro de Publicaciones, Secretaría General Técnica, País Vasco, España. 2008. Available online: https://www.footprintnetwork.org/content/images/uploads/Huella%20ecologica%20de%20Espana.pdf (accessed on 7 March 2022).
  24. EC. European Green Deal Investment Plan; European Union, 2021. Available online: https://ec.europa.eu/info/strategy/priorities-2019-2024/european-green-deal_es (accessed on 7 March 2022).
  25. EC. Regulation (Eu) 2020/852 of the European Parliament and of the Council of 18 June 2020 on the Establishment of a Framework to Facilitate Sustainable Investment, and Amending Regulation; Official Journal of the European Union: Louxemburg, 2020; ISSN 1977-0677. Available online: https://eur-lex.europa.eu/legal-content/EN/TXT/?uri=OJ:L:2020:198:TOC (accessed on 2 February 2022).
  26. EU Platform on Sustainable Finance. Response to the Complementary Delegated Act, European Union, Brussels, Belgium. 2022. Available online: https://ec.europa.eu/info/sites/default/files/business_economy_euro/banking_and_finance/documents/220121-sustainable-finance-platform-response-taxonomy-complementary-delegated-act_en.pdf (accessed on 2 February 2022).
  27. Gobierno de Canarias Estrategia Energética de Canarias 2015–2025. Documento Preliminar. 2017, pp. 1–171. Available online: https://www.gobiernodecanarias.org/cmsweb/export/sites/energia/temas/planificacion/EECan25_DocumentoPreliminar_junio2017.pdf (accessed on 5 February 2022).
  28. Huntington, S.C.; Rodilla, P.; Herrero, I.; Batlle, C. Revisiting support policies for RES-E adulthood: Towards market compatible schemes. Energy Policy 2017, 104, 474–483. [Google Scholar] [CrossRef]
  29. Panagiotidou, M.; Xydis, G.; Koroneos, C. Environmental Siting Framework for Wind Farms: A Case Study in the Dodecanese Islands. Resources 2016, 5, 24. [Google Scholar] [CrossRef] [Green Version]
  30. Finn, P.; Fitzpatrick, C.; Connolly, D.; Leahy, M.; Relihan, L. Facilitation of renewable electricity using price based appliance control in Ireland’s electricity market. Energy 2011, 36, 2952–2960. [Google Scholar] [CrossRef]
  31. Hueting, R.; Reijnders, L. Broad sustainability contra sustainability: The proper construction of sustainability indicators. Ecol. Econ. 2004, 50, 249–260. [Google Scholar] [CrossRef]
  32. Leon, F.; Ramos, A.; Vaswani, J.; Mendieta, C.; Brito, S. Climate Change Mitigation Strategy through Membranes Replacement and Determination Methodology of Carbon Footprint in Reverse Osmosis RO Desalination Plants for Islands and Isolated Territories. Water 2021, 13, 293. [Google Scholar] [CrossRef]
  33. Karagiorgas, M.; Tsoutsos, T.; Drosou, V.; Pouffary, S.; Pagano, T.; Lara, G.L.; Melim Mendes, J.M. HOTRES: Renewable energies in the hotels. An extensive technical tool for the hotel industry. Renew. Sustain. Energy Rev. 2006, 10, 198–224. [Google Scholar] [CrossRef]
  34. Cadarso, M.; Gómez, N.; López, L.A.; Tobarra, M. Calculating tourism’s carbon footprint: Measuring the impact of investments. J. Clean. Prod. 2016, 111, 529–537. [Google Scholar] [CrossRef]
  35. Filimonau, V.; Dickinson, J.; Robbins, D.; Huijbregts, M.A.J. Reviewing the carbon footprint analysis of hotels: Life Cycle Energy Analysis (LCEA) as a holistic method for carbon impact appraisal of tourist accommodation. J. Clean. Prod. 2011, 19, 1917–1930. [Google Scholar] [CrossRef]
  36. Gössling, S. National emissions from tourism: An overlooked policy challenge? Energy Policy 2013, 59, 433–442. [Google Scholar] [CrossRef]
  37. Filimonau, V.; Dickinson, J.; Robbins, D. The carbon impact of short-haul tourism: A case study of UK travel to Southern France using life cycle analysis. J. Clean. Prod. 2014, 64, 628–638. [Google Scholar] [CrossRef] [Green Version]
  38. Michailidou, A.V.; Vlachokostas, C.; Moussiopoulos, N.; Maleka, D. Life Cycle Thinking used for assessing the environmental impacts of tourism activity for a Greek tourism destination. J. Clean. Prod. 2016, 111, 499–510. [Google Scholar] [CrossRef]
  39. Díaz Pérez, F.J.; Chinarro, D.; Guardiola Mouhaffel, A.; Díaz Martín, R.; Pino Otín, M. aR Comparative study of carbon footprint of energy and water in hotels of Canary Islands regarding mainland Spain. Environ. Dev. Sustain. 2019, 21, 1763–1780. [Google Scholar] [CrossRef]
  40. Rico, A.; Martínez-Blanco, J.; Montlleó, M.; Rodríguez, G.; Tavares, N.; Arias, A.; Oliver-Solà, J. Carbon footprint of tourism in Barcelona. Tour. Manag. 2019, 70, 491–504. [Google Scholar] [CrossRef]
  41. Ministerio de Medio Ambiente Plan Nacional Integrado de Residuos, 2008–2015 Informe de Sostenibilidad Ambiental (ISA), Plaza de San Juan de la Cruz, Madrid, España 2015, 210. Available online: http://www.cepco.es/Uploads/docs/ISA_PNIR_26_11_2007.pdf (accessed on 12 February 2022).
  42. Conama, F. El Desafío de la Gestión de la Materia Orgánica. Available online: http://www.conama.org/conama/download/files/conama2016/GTs%202016/15_final.pdf (accessed on 5 February 2022).
  43. Instituto Nacional de Estadística. Estadística sobre el Suministro y Saneamiento del Agua 2018; Instituto Nacional de Estadística: Madrid, Spain, 2018. [Google Scholar]
  44. Quintana, F.A.D. Análisis Estadístico de los Parámetros DQO, DBO5 y SS de las Aguas Residuales Urbanas en el Ensuciamiento de las Membranas de Ósmosis Inversa; Universisad de Las Palmas de Gran Canaria: Gran Canaria, España, 2010; Available online: https://accedacris.ulpgc.es/handle/10553/4858 (accessed on 1 June 2021).
  45. Huertas, R.; Marcos, C.; Ibarguren, N.; Ordás, S. Guía Práctica Para la Depuración de Aguas Residuales en Pequeñas Poblaciones; Confederación Hidrográfica del Duero (CHD): Castilla y León, España, 2012; Available online: http://idiaqua.eu/web/wp-content/uploads/2018/07/guiapractica-depuracionaguas-chd.pdf (accessed on 14 June 2021).
  46. Bravo, T.E.L. Caracterización Experimental de la Fracción Orgánica Triturada de Los Rsu Para Valorar su Incorporación al Agua Residual y Tratamiento de Una Edar. Master’s Thesis, Universidad Politécnica de Valencia, Valencia, Spain, 2013. [Google Scholar]
  47. Agencia Andaluza de la Energía Estudio Básico del Biogás. Cons. Econ. Innovación Cien. 2011, 1–166. Available online: https://ingemecanica.com/tutorialsemanal/tutorialn311.html (accessed on 5 February 2022).
  48. Cifuentes, J. Compendio de Artículos Científicos de Maestría en Energía y Ambiente. Artic. Master Energy Environ. Eng. 2016, 1, 21–28. [Google Scholar] [CrossRef]
  49. IEA. Outlook for Biogas and Prospects for Organic Growth World Energy Outlook Special Report Biomethane; IEA: Paris, Franch, 2020. [Google Scholar]
  50. Frasco, A. Procesamiento de Datos de Viento. 1a Parte 2015, 22. Available online: https://slideplayer.es/slide/2971570/pdf (accessed on 5 February 2022).
  51. Herrero Novoa, C. Estudio de la Velocidad del Viento: Análisis Espacial y Ajuste a Una Función de Distribución. Bachelor’s Thesis, Universidad de Valladolid, Valladolid, Spain, 2015. [Google Scholar]
  52. Ministerio de Medio Ambiente y Medio Rural y Marino. España Plan Nacional Integrado de Residuos, 2008–2015 (PNIR) Informe de Sostenibilidad Ambiental (ISA); Ministerio de Medio Ambiente y Medio Rural y Marino: Madrid, España, 2009. [Google Scholar]
  53. Ministerio de Fomento. Documento Básico HE Ahorro de Energía 2019, Madrid, España. 2019. Available online: https://www.codigotecnico.org/DocumentosCTE/AhorroEnergia.html (accessed on 8 February 2022).
  54. Sun, Y.Y.; Cadarso, M.A.; Driml, S. Tourism carbon footprint inventories: A review of the environmentally extended input-output approach. Ann. Tour. Res. 2020, 82, 102928. [Google Scholar] [CrossRef]
  55. Sun, Y.Y. A framework to account for the tourism carbon footprint at island destinations. Tour. Manag. 2014, 45, 16–27. [Google Scholar] [CrossRef]
Figure 1. Location of the rural houses (in red), protected natural areas, and Biosphere Reserve of Gran Canaria [4].
Water 14 01197 g001
Figure 2. General diagram of the model.
Water 14 01197 g002
Figure 3. Consumption and generation of waste by type of rural house.
Water 14 01197 g003
Figure 4. COD values for solid and liquid fraction.
Water 14 01197 g004
Figure 5. Biogas generation per rural house.
Water 14 01197 g005
Figure 6. Solar potential by altitude. (GRAFCAN 2017-own elaboration).
Water 14 01197 g006
Figure 7. (a) Carbon footprint before implementing renewable energy of DHW, electric consumption and organic waste and wastewater production; (b) ecological footprint before implementing renewable energy of DHW and electric consumption and organic waste and wastewater production.
Water 14 01197 g007
Table 1. Data by altitude of solar and wind potential.
Altitude (m)Rural Houses FoundTotal BedsAverage Number of Beds%Wind Speed (m s−1)WeibullPower Density
(W m−2)
400–60013937.1516.67%5.660.15103.12
600–800231014.3929.49%4.390.2048.28
800–100011484.3614.10%5.070.1666.73
1000–120019985.1624.36%3.960.2335.27
1200–150012756.2515.38%3.750.2429.81
Publisher’s Note: MDPI stays neutral with regard to jurisdictional claims in published maps and institutional affiliations.

