
Potentially Toxic Elements and Pb Isotopes in Mine-Draining Meža River Catchment (NE Slovenia)


1
Jožef Stefan International Postgraduate School, 1000 Ljubljana, Slovenia
2
Department of Environmental Sciences, Jožef Stefan Institute, 1000 Ljubljana, Slovenia
3
Office for the State of the Environment, Chemical Analytical Laboratory Sector, Slovenian Environmental Agency, 1000 Ljubljana, Slovenia
*
Author to whom correspondence should be addressed.
Water 2022, 14(7), 998; https://doi.org/10.3390/w14070998
Submission received: 30 January 2022
/
Revised: 10 March 2022
/
Accepted: 19 March 2022
/
Published: 22 March 2022
(This article belongs to the Special Issue Freshwater Ecosystems under Anthropogenic Stress)
Abstract
:In the present study it was observed that Pb, Zn, Cd and As are still present at elevated concentrations in the environment of the upper Meža Valley. In particular, the concentrations of Pb indicate possible new sources have emerged. The main objective of this study was to determine the Pb isotope composition in both the water and the sediments (fractions < 0.150 and <0.063 mm) from the Meža River and its tributaries for the first time and then use them as identifiers of Pb pollution sources. In addition, by calculating the PEC-Q values, the potential hazard of the present concentrations of Pb, Zn, Cd and As to the river environment was evaluated. The results showed elevated Pb and Zn concentrations in the water and sediments at the majority of sampling sites. In general, higher concentrations of Pb, Cd and As were determined in the <0.063 mm fraction, while Zn was higher in the <0.150 mm fraction. The isotope composition of Pb in both fractions differed slightly, indicating an additional Pb source.
1. Introduction
Mining in the Koroška region, particularly in the upper Meža Valley (NE Slovenia), began in Roman times, while the first written source indicating the excavation of Pb ore dates back to the 17th century. Until the latter half of the 20th century, smaller amounts of Pb ore were excavated. The mine in Mežica reached the highest production between 1950 and 1955, when more than 500,000 tons of ore/year were excavated [1]. In the second half of 20th century, all smelting operations were concentrated in the town of Žerjav, which led to more pollution of the environment and also had negative effects on peoples’ health and their quality of life [2]. In all the history of mining in Mežica, 19 million tons of Pb and Zn ore were excavated from which 1 million tons of Pb and 0.5 million tons of Zn were extracted [1]. During processing, a large amount of mine waste, which contained high concentrations of Pb, Zn, As, Cd and other potentially toxic elements (PTE), was produced and deposited in abandoned mine shafts and near small streams at more than 30 locations [2], with a total area spanning over 60 km2, located along the upper Meža Valley [3]. As a consequence, the Meža River and its tributaries were highly contaminated with Pb and other PTE [2]. Between 1914 and 1979, 150,000 tons of floating sludge flowed into the Meža River, killing all living organisms in the river. Lead concentration at that time exceeded 700 mg/L [4]. As mine tailings began to be deposited in abandoned parts of the mine and with the construction of treatment plants, the concentration of Pb and other PTE in the water began to decline [5], but it remained high in sediments, ranging from 100 to 19,000 mg/kg [2,3,6,7]. In addition to mining, industries producing and recycling Pb batteries have operated in the region since 1956.
A similar environmental impact was also observed in some other rivers close to mines [8,9,10,11]. Audry et al. [8] studied the concentration profiles of Cu, Zn, Cd and Pb in the Lot River (France) that was affected by mining and smelting of Zn ore operations for around 150 years. Depth profiles analyzed after the closure of the mine, showed the concentrations of pollutants had decreased but were still higher than in the pristine upper river part. In contrast, in the Odra River and Przemsza watersheds (Poland), the concentrations of PTE are constant over time, mostly due to the still operational mining and smelting [9,10]. The same situation with a heavily contaminated river flowing through a mining area was also observed by Smolders et al. [11] in the South America (Bolivia).
Knowledge about the polluting activities and the assessment of pollutant concentration is not always sufficient for firm conclusions regarding Pb provenance. Therefore, Pb isotopes are used as ‘fingerprints’ as their isotope composition is not significantly affected by physical-chemical fractionation processes [12]. In different environmental compartments such as soil, sediments, water, air particles and vegetation Pb has different isotope compositions that depend on the age and origin of the natural materials [13,14,15,16]. Lead isotopes 206Pb, 207Pb and 208Pb are the final fission products of 238U, 235U and 232Th, respectively, and differences among U, Th and Pb are in their abundance in the earth’s crust, their geochemical behavior and their lifetimes [17]. The Pb isotope composition can be expressed in several ratios. In environmental sciences, the Pb isotope composition is commonly expressed as ratios 206Pb/204Pb, 206Pb/207Pb, 208Pb/206Pb. The ratio 206Pb/207Pb is the most preferred because it can be determined precisely, and the abundance of these two isotopes is fairly high. The largest differences between different sources of Pb can be seen in ratios 206Pb/204Pb and 208Pb/204Pb [18]. Correlations of different Pb isotope pairs are commonly used for determining the sources of Pb in the environment. They were already used in investigating sediment samples from different mining areas [19,20,21,22,23]. Ayrault et al. [22] determined that the Pb present in sediment cores taken from the Seine River (France) was a mixture of recycled Pb extracted from Rio Tinto ore and leaded gasoline. Gao et al. [23] determined the enrichment of PTE in sediments from the Beijang River (South China) and identified pollution sources based on the Pb isotope composition of the samples.
In assessing the quality of river sediments or the degree of anthropogenic influences on PTE pollution, different approaches such as probable effect concentrations (PEC) [24], probable effect concentration quotient (PEC-Q) [25], enrichment factor (EF) [26], and others [27,28] can be used. The PEC for different PTE were determined by MacDonald et al. [24] and are defined as concentrations above which harmful effects are likely to be observed. The PEC-Q approach has been used for evaluating possible risk from simultaneous presence of several PTE [25].
In environmental samples collected from the upper Meža Valley, several studies were performed where the concentration of Pb and other PTE was analyzed [2,6,29,30]. Although the concentration of PTE and especially of Pb in the waters of the Meža River decreased over time, they still persist in quite highly elevated levels in sediments. Higher Pb concentration can be attributed to the weathering of rocks and sediments, but it can also be a result of input from the industries based on the banks of the river. At present there is no data on the isotope composition of Pb in water and sediments from the area. Therefore, the objectives of the present study were: (i) to determine the concentrations of PTE in water and in two fractions (<0.063 mm and <0.150 mm) of sediment samples from the Meža River and its tributaries, (ii) to compare the results with previous studies and see if PTE concentrations decreased or increased as time passed, (iii) to determine the Pb isotope composition in water and sediment samples from the upper Meža Valley, and (iv) on the basis of the Pb isotope fingerprint, determine its sources in the sediment and water samples.
2. Materials and Methods
2.1. Sampling and Sample Preparation
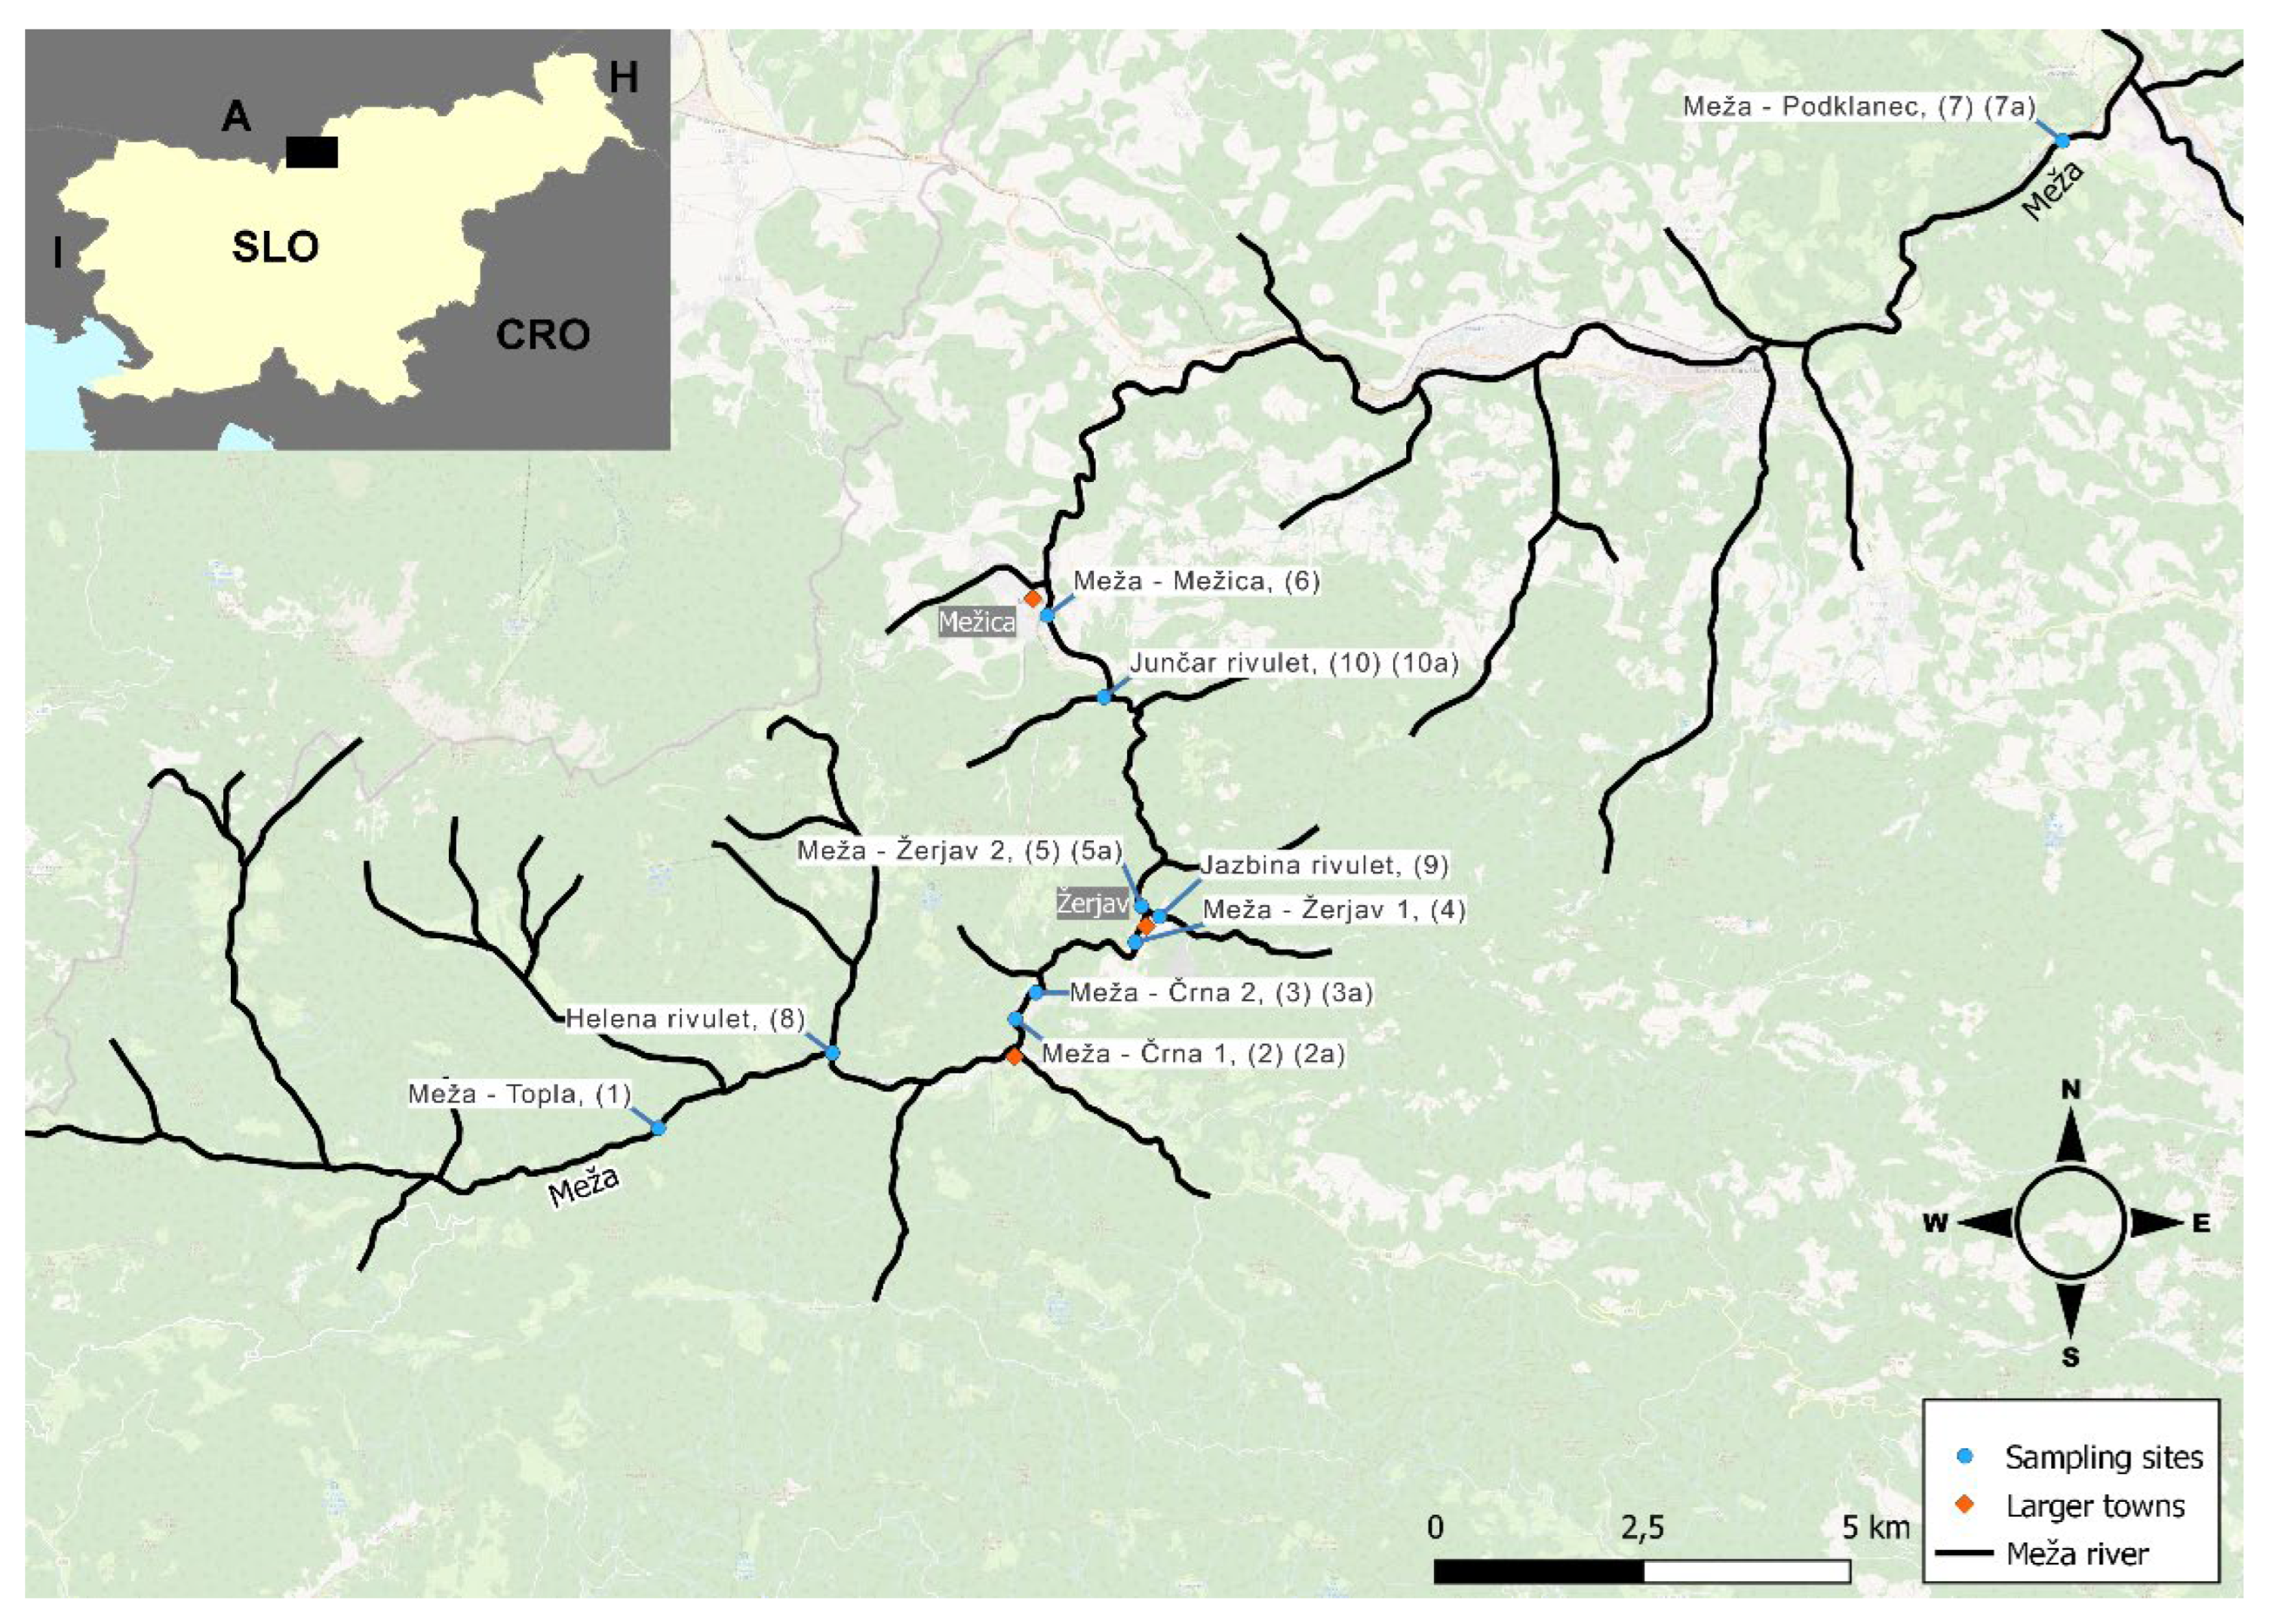
A sampling campaign was carried out in January of 2020. Water samples were collected at 7 locations along the Meža River: (1) Topla, (2) Črna 1, (3) Črna 2, (4) Žerjav 1, (5) Žerjav 2, (6) Mežica and (7) Podklanc, and on 3 tributaries: (8) Helena Rivulet, (9) Jazbina Rivulet and (10) Junčar Rivulet. The Meža River is 43 km long and is a typical Alpine river in its upper part, resulting in fast water flow. In its middle- and lower-parts, water flow decreases due to a smaller slope and wider riverbed. The average water flow of the Meža River is 9.2 m3/s in January (dry season) and 15.4 m3/s in April (wet season). Such a fast water flow results in a lack of fine sediments. Sediment samples were thus collected only at 5 locations: (2a) Črna 1, (3a) Črna 2, (5a) Žerjav 2, (7a) Podklanc and (10a) the Junčar Rivulet. Sampling area and sampling sites are shown in Figure 1, while the exact coordinates of sampling sites are provided in Table S4 (Supplementary).
Water samples were collected in 1 L plastic bottles. They were filtered through a 0.45 µm filter, acidified (1 mL of suprapur HNO3 added to 1 L of sample) and stored at 4 °C until analysis.
Sediment samples weighing at least 200 g were collected with a plastic ladle and stored together with water in 2 L plastic bottles. In the laboratory, they were wet sieved into different fractions (<2, <0.250, <0.150 and <0.063 mm) and then dried to a constant mass at a temperature of 60 °C. For further analysis, two fractions were chosen, <0.150 and <0.063 mm.
2.2. Instrumentation
Sediment samples were digested with the closed vessel microwave digestion system (MARS 6, CEM Corporation, Matthews, NC, USA). Total elemental concentrations were determined by quadrupole-ICP-MS (7700×, Agilent Technologies, Tokyo, Japan). ICP-MS operating parameters were optimised daily for the highest sensitivity and are presented in Table S1 (Supplementary). The Pb isotope ratios were determined by a Nu II Plasma MC ICP-MS from Nu Instruments (Ametek, Berwyn, MD, USA) coupled to a desolvation system (Aridus from Teledyne Cetac, Omaha, NE, USA) with a PFA nebulizer (100 μL/min) and nickel plasma cones for dry plasma. The instrument was optimised daily for the highest sensitivity and stability of the signal. General parameters are presented in Table S1 (Supplementary).
2.3. Reagents and Materials
For preparation of samples and reagents, Ultrapure 18.2 MΩ cm water obtained from a Direct-Q 5 system (Millipore, Watertown, MA, USA) was used. Hydrochloric acid (30% (w/w) HCl, suprapur) and hydrofluoric acid (40% (w/w) HF, suprapur) were obtained from Merck Ltd. (Darmstadt, Germany). Nitric acid (67–69% (w/w) HNO3, suprapur) was obtained from Carlo Erba Reagents Srl (Milan, Italy). Boric acid (H3BO3, ultrapur) was obtained from Sigma-Aldrich (St. Louis, MO, USA). Water samples were filtered with 0.45 μm Minisart cellulose nitrate membrane filters (Sartorius, Goettingen, Germany). For the determination of total elemental concentrations, an external calibration was used, prepared with the dilution of a multielement standard solution Multi VI (ICP Standard Certipur, Merck, Darmstadt, Germany). As an accuracy check, certified reference material of channel sediment BCR 320R (Institute for Reference Materials and Measurements, Geel, Belgium) and certified reference material for trace elements in surface water SPS-SW1 (Spectrapure standards, Oslo, Norway) were used. The determined values for both materials were in good alignment with the certified values (Table S2 (Supplementary)).
2.4. Analytical Procedures
Sediment samples were digested with a closed vessel microwave assisted digestion following the method described by Zuliani et al. [31]. Approximately 0.25 g of the sample was weighed into Teflon vessels, and a mixture of HNO3, HF and HCl was added. The samples were subjected to two cycles of closed vessel microwave digestion at the maximum power of 1600 W. After the first cycle, H3BO3 (4% (w/w)) was added, and the samples were subjected to the second cycle of microwave digestion. Clear solution was quantitatively transferred into 30 mL PP graduated tubes and filled to mark with MilliQ water. The same procedure (acids only) was applied to a blank sample in every cycle.
For Pb isotope ratio determination in digested sediment samples, Pb was isolated from the matrix by using 0.1 g of an ion exchange resin Dowex® 1X8 (100–200 mesh, Acros Organics, Geel, Belgium). An appropriate amount of the sample was evaporated in a sand bath (T = 70–90 °C), then redissolved in 0.6 mL of 0.5 M HBr by sonification for 3 h and finally applied to the resin. Pb was washed out of the resin by 6 M HCl. The samples were then evaporated again to dryness and redissolved in 6 mL of 2% HNO3 by sonification for 5 h. For each sample, new resin was used. The procedure applied is described in more detail in the Supplementary Materials (Table S3). To control Pb recovery after separation, the total Pb concentration was measured by ICP-MS.
Lead isotope ratios were determined by MC ICP-MS. For the correction of instrumental mass bias, a combination of internal and external calibrations was used. An appropriate amount of standard solution of Tl (NIST SRM 3158) was added to the samples before the measurement. The isotope standard reference material NIST SRM 981 was measured as a bracketing standard.
2.5. Pearson Correlation Coefficient
Pearson correlation coefficients and matrixes were calculated to determine possible correlations between Pb, Zn, Cd and As in sediments and water. They were calculated with Excel Microsoft (Office 2019). The correlation was marked significant if the coefficient was above 0.80.
2.6. Probable Effect Concentration Quotient (PEC-Q)
The probable effect concentration quotient (PEC-Q) approach [25] was used to assess the potential toxicity of investigated elements (Pb, Zn, Cd, As, Cr and Ni) in Meža River sediments. It is expressed as:
where [Me]i is the concentration of the ith element measured in the sediment sample, PECi is the corresponding PEC value (they were summarized after MacDonald et al. [24]) and n is the total number of measured elements. Two critical values for PEC-Q were reported by Long et al. [25]. A PEC-Q value of 0.25 represents conditions at which the percentage incidence of toxicity exceeds 20% in laboratory toxicity tests with marine (i.e., Ampelisca abdita and Rhepoxynius abronius) or freshwater (i.e., Hyalella azteca) organisms, while a PEC-Q value of 0.34 indicates at which sites a reduction in the abundances of amphipods, gastropods and capitellid polychaetes is likely to occur.
3. Results and Discussion
3.1. PTE in Water Samples
Lead, Zn, Cd and As concentrations determined in water samples from the Meža River and its tributaries are presented in Table 1, while total concentrations of the elements Li, Al, V, Cr, Mn, Fe, Co, Ni, Cu, Se, Rb, Sr, Mo, Ag, Sb, Ba, Tl and U are shown in Table S4 (Supplementary).
The average concentrations determined in water were ranked as follows: Zn (43.9 µg/L) > Pb (19.1 µg/L) > As (1.62 µg/L) > Cd (0.27 µg/L). Overall Zn and Pb concentrations in the Meža River were lower than in its tributaries, while As concentrations were higher in the tributaries. The highest Zn and Pb concentrations were measured at the Helena Rivulet (8) that runs past abandoned mine shafts and mine waste deposits from where it may leach these elements [2]. The highest concentration of As in water was measured at Meža–Žerjav 2 (5) and of Cd at Meža–Mežica (6). As both sampling sites were in city centres, the elevated concentrations of As and Cd could be a result of urban runoff.
The results of this study confirmed that total concentrations of PTE in water decreased through time [4,5]. In 1979 the average Pb concentration in the Meža River was 700 mg/L [4], while in 2002 it was 75 µg/L [5]. In 2002 the average Zn concentration in the Meža River was 175 µg/L, while in 2015 both Zn and Pb concentrations were close to background concentrations (25 and 5 µg/L, respectively) [5]. However, in the present study, Pb concentrations were elevated at the Helena (8) and Junčar (10) Rivulets, both receiving waters from the closed mines, and Žerjav 1 (4), Žerjav 2 (5) and Mežica (6). Zinc concentrations were elevated at all three investigated tributaries and also at Žerjav 2 (5), Mežica (6) and Podklanc (7). Locations Žerjav 1 (4) and Žerjav 2 (5) are both near an industrial area and under urban influence. In Mežica there are still elevated concentrations of PTE in the area around a former ore processing plant [7]. The results indicate that elevated concentrations of Pb and other PTE in the Meža River tributaries can still be a result of the leaching of material from landfills as it was suggested in the past [2].
Average Pb concentration determined in this study was higher than the threshold values determined with the EU Water Frame Directive (WFD) (7.2 µg/L) [32]. The limits were exceeded at most sampling sites except at Topla (1), Črna 1 (2) and the Jazbina Rivulet (9). In general, Zn concentration exceeded the established limit (50 µg/L) at half of the sampling sites (Mežica (6), Podklanc (7), Helena (8), Jazbina (9) and Junčar (10) Rivulet). Average Cd concentration was below the limit of 0.6 µg/L, and it was exceeded only at Mežica (6). Average concentrations of As, Ni, Cu and Cr at all sampling sites were well below the established limits of 25, 20, 5 and 32 µg/L, respectively [32,33].
3.2. PTE in Sediment Samples
Lead, Zn, Cd and As concentrations determined in the <0.063 mm and <0.150 mm sediment fractions from the Meža River and its tributaries are presented in Table 2, while total concentrations of other elements (Li, Al, V, Cr, Mn, Fe, Co, Ni, Cu, Se, Rb, Sr, Mo, Ag, Sb, Ba, Tl and U) are shown in Table S5 (Supplementary).
The highest determined average concentrations of elements in sediments (fraction <0.063 mm) were those of Pb (6348 mg/kg), followed by Zn (5037 mg/kg) > As (34.7 mg/kg) > Cd (29.8 mg/kg). In fraction <0.150 mm they were ranked Zn (5073 mg/kg) > Pb (3581 mg/kg) > Cd (26.3 mg/kg) > As (23.6 mg/kg). In general, higher concentrations of Pb, Cd and As were determined in the smaller fraction (<0.063 mm), while for Zn they were higher in the larger fraction (<0.150 mm). The results for Pb from the present study have an opposite trend to the results from Fux and Gosar [7], where all four elements were higher in the larger sediment fraction and they were attributed to the mine tailings. Higher concentrations of Pb in fraction <0.063 mm at Meža–Žerjav 2 (5a) could indicate that there could be another anthropogenic source present. The differences in elemental distribution among different particle sizes were observed between natural and anthropogenic sources [34].
Regarding the sampling locations, the highest PTE concentrations were in general present at the Podklanc (7a) sampling location in the <0.150 mm fraction. In the <0.063 mm fraction, the highest Pb and As concentrations were measured at Meža–Žerjav 2 (5a), which is situated a few meters downstream from the industrial area and from the confluence with the Jazbina Rivulet. The lowest concentrations of all four elements in fraction <0.063 mm were measured at Meža–Črna 1 (2a) and in fraction <0.150 mm at Meža–Črna 2 (3a). The Meža River is an Alpine type of river, with high and fast water flow, which leads to the removal of sediment from the beginning of the river and its deposit in the lower, slower parts of the river [2]. That would explain why the lowest elemental concentrations were determined in samples from the higher parts of the river (Meža–Črna 1 (2a) and 2 (3a)), and the highest concentrations were determined at the lower parts (Meža–Podklanc (7a), Žerjav 2 (5a)), especially in the fraction <0.150 mm.
PTE concentrations in sediments from the Meža Valley have been monitored throughout the years. In 1986 average Pb, Zn and Cd concentrations in the Meža River were 970, 2700 and 8.7 mg/kg, respectively. Between 1986 and 1992, their concentrations dropped around 4-, 10- and 8-times, respectively. However, they again increased around 2-, 4- and 7-times, respectively, in between 2004 and 2005 [4]. Between 2007 and 2011 approximately similar concentrations in two fractions of the sediments were reported for Pb, Zn, Cd and As (<0.063 mm and <0.125 mm). However, these concentrations were higher than in the past. Higher concentrations were observed in the larger fraction and also in the tributaries indicating that their primary source was the material from the mines and mine tailings [2,7]. In our study the minimum values for Pb, Zn and As in both fractions were higher than reported by Gosar and Miler [2]. The Zn values in fraction <0.063 mm in particular were almost 10-times higher. This could indicate that leaching of the elements from mines and landfills is still present as well as an industrial and urban influence.
3.3. Correlations between PTE in Water and Sedimets
To determine if a correlation between the elements found in sediments and water exists, Pearson correlation coefficients and matrixes were calculated. They are shown in Table S6 (Supplementary). Correlation coefficients for Pb, Zn and As concentrations in water and sediment fraction <0.063 mm were 0.99, 0.97 and 0.98, respectively, which indicates a significant correlation between elemental concentrations in water and sediment fraction <0.063 mm. The smallest fraction has the highest specific area, and it can therefor adsorb the highest amount of elements [35]. These elements can then be released into the water because of the fast and turbulent water flow of the Meža River. Meanwhile, the Pearson correlation coefficient for Cd was 0.51, and the correlation was not as significant as in the case of the other three elements. The main difference between Cd and other elements is that Cd is the least soluble, and it is mainly bound to immobile fractions. That is why lower concentrations of it can be released into the water [6].
In comparing concentration of Pb, As, Zn and Cd in water among themselves, significant correlation between Pb and As (0.98), Pb and Cd (0.95) and also between As and Cd (0.95) was observed. In sediment fraction <0.063 mm, significant correlation between Pb and As (1.00) and also between Zn and Cd (1.00) was observed. The latter indicates that Zn and Cd come from the natural environment since Cd is present in important concentrations in Zn ore [36,37]. In sediment fraction <0.150 mm all four elements were significantly correlated with each other (Pearson correlation coefficient >0.96). PTE in the larger fraction may be a result of mine tailings being washed into the river, and since mine tailings contain all four elements, that can explain their correlation. On the other hand, the elements, especially Pb and As, present in the fine sediment fraction, indicate an additional input.
3.4. Probable Effect Concentration Quotient (PEC-Q)
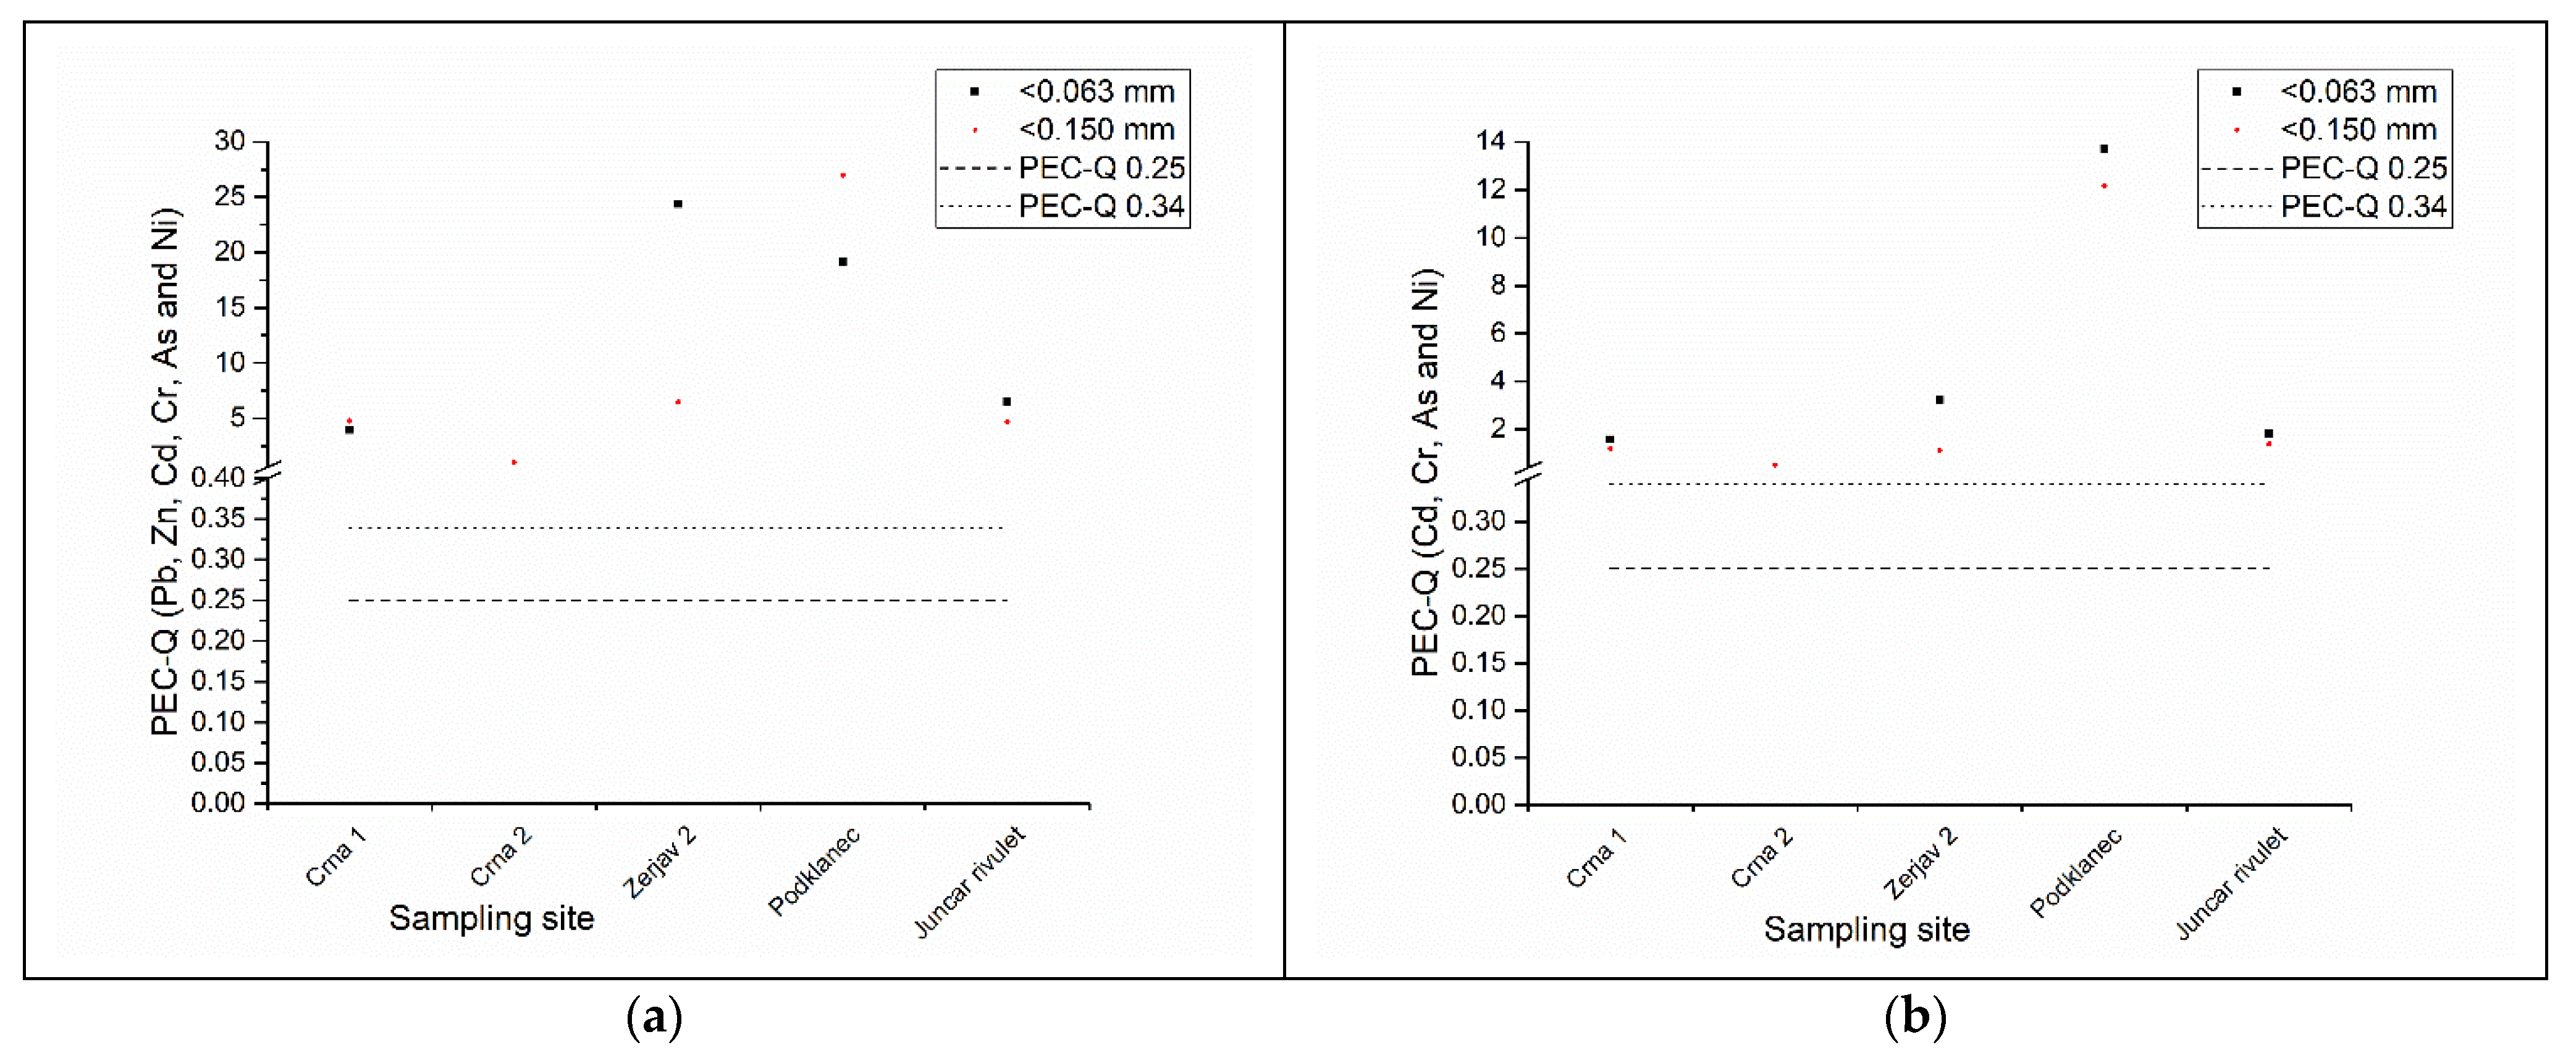
The probable effect concentration quotient (PEC-Q) approach was used to evaluate possible risk from simultaneous presence of several PTE (Pb, Zn, Cd, As, Cr and Ni) in the Meža River sediments. PEC-Q values for sediments collected at the Meža River and its tributaries were calculated according to Formula (1), with data in Table 2 and Table S5. The results presented in Figure 2a show that all collected sediments, regardless of the fraction, had PEC-Q values over the critical value of 0.34. Regarding the very high total elemental concentrations in sediment samples, high PEC-Q values were to be expected. The lowest PEC-Q value was at Črna 2 (3a) in fraction <0.150 mm (0.62), while the highest was at Podklanc (7a) in fraction <0.150 mm (27.0). In sediment samples from Črna 1 (2a), PEC-Q values in both fractions were closer together than in any other location. The biggest difference between fractions was observed at Žerjav 2 (5a), where PEC-Q values in the <0.063 mm fraction were higher than in the <0.150 mm fraction, which may indicate that PTE in the smaller fraction of the sediments at this location pose a higher risk to the river system than those in the larger one. That also coincides with higher PTE concentrations measured in the smaller fraction at the Žerjav 2 (5a) sampling location.
To identify whether other PTE, namely Ni, As, Cr and Cd, may cause potential adverse effects, Pb and Zn, which were present in the highest concentrations, were excluded from the evaluation of PEC-Q. Figure 2b shows that PEC-Q values were lower when calculated without Pb and Zn, in most cases by more than half. The biggest difference in PEC-Q values was in the sediment sample from Žerjav 2 (5a) in the <0.063 mm fraction. However, the differences were not so large that the PEC-Q values would be under the critical value of 0.34, indicating that other PTE also have a big impact on the quality of the river sediments. Despite very high PEC-Q values, the state of the Meža River is not as critical as these values indicated, as Pb, Zn and Cd are mostly bound to more sparingly soluble fractions [6].
3.5. Pb Isotope Composition
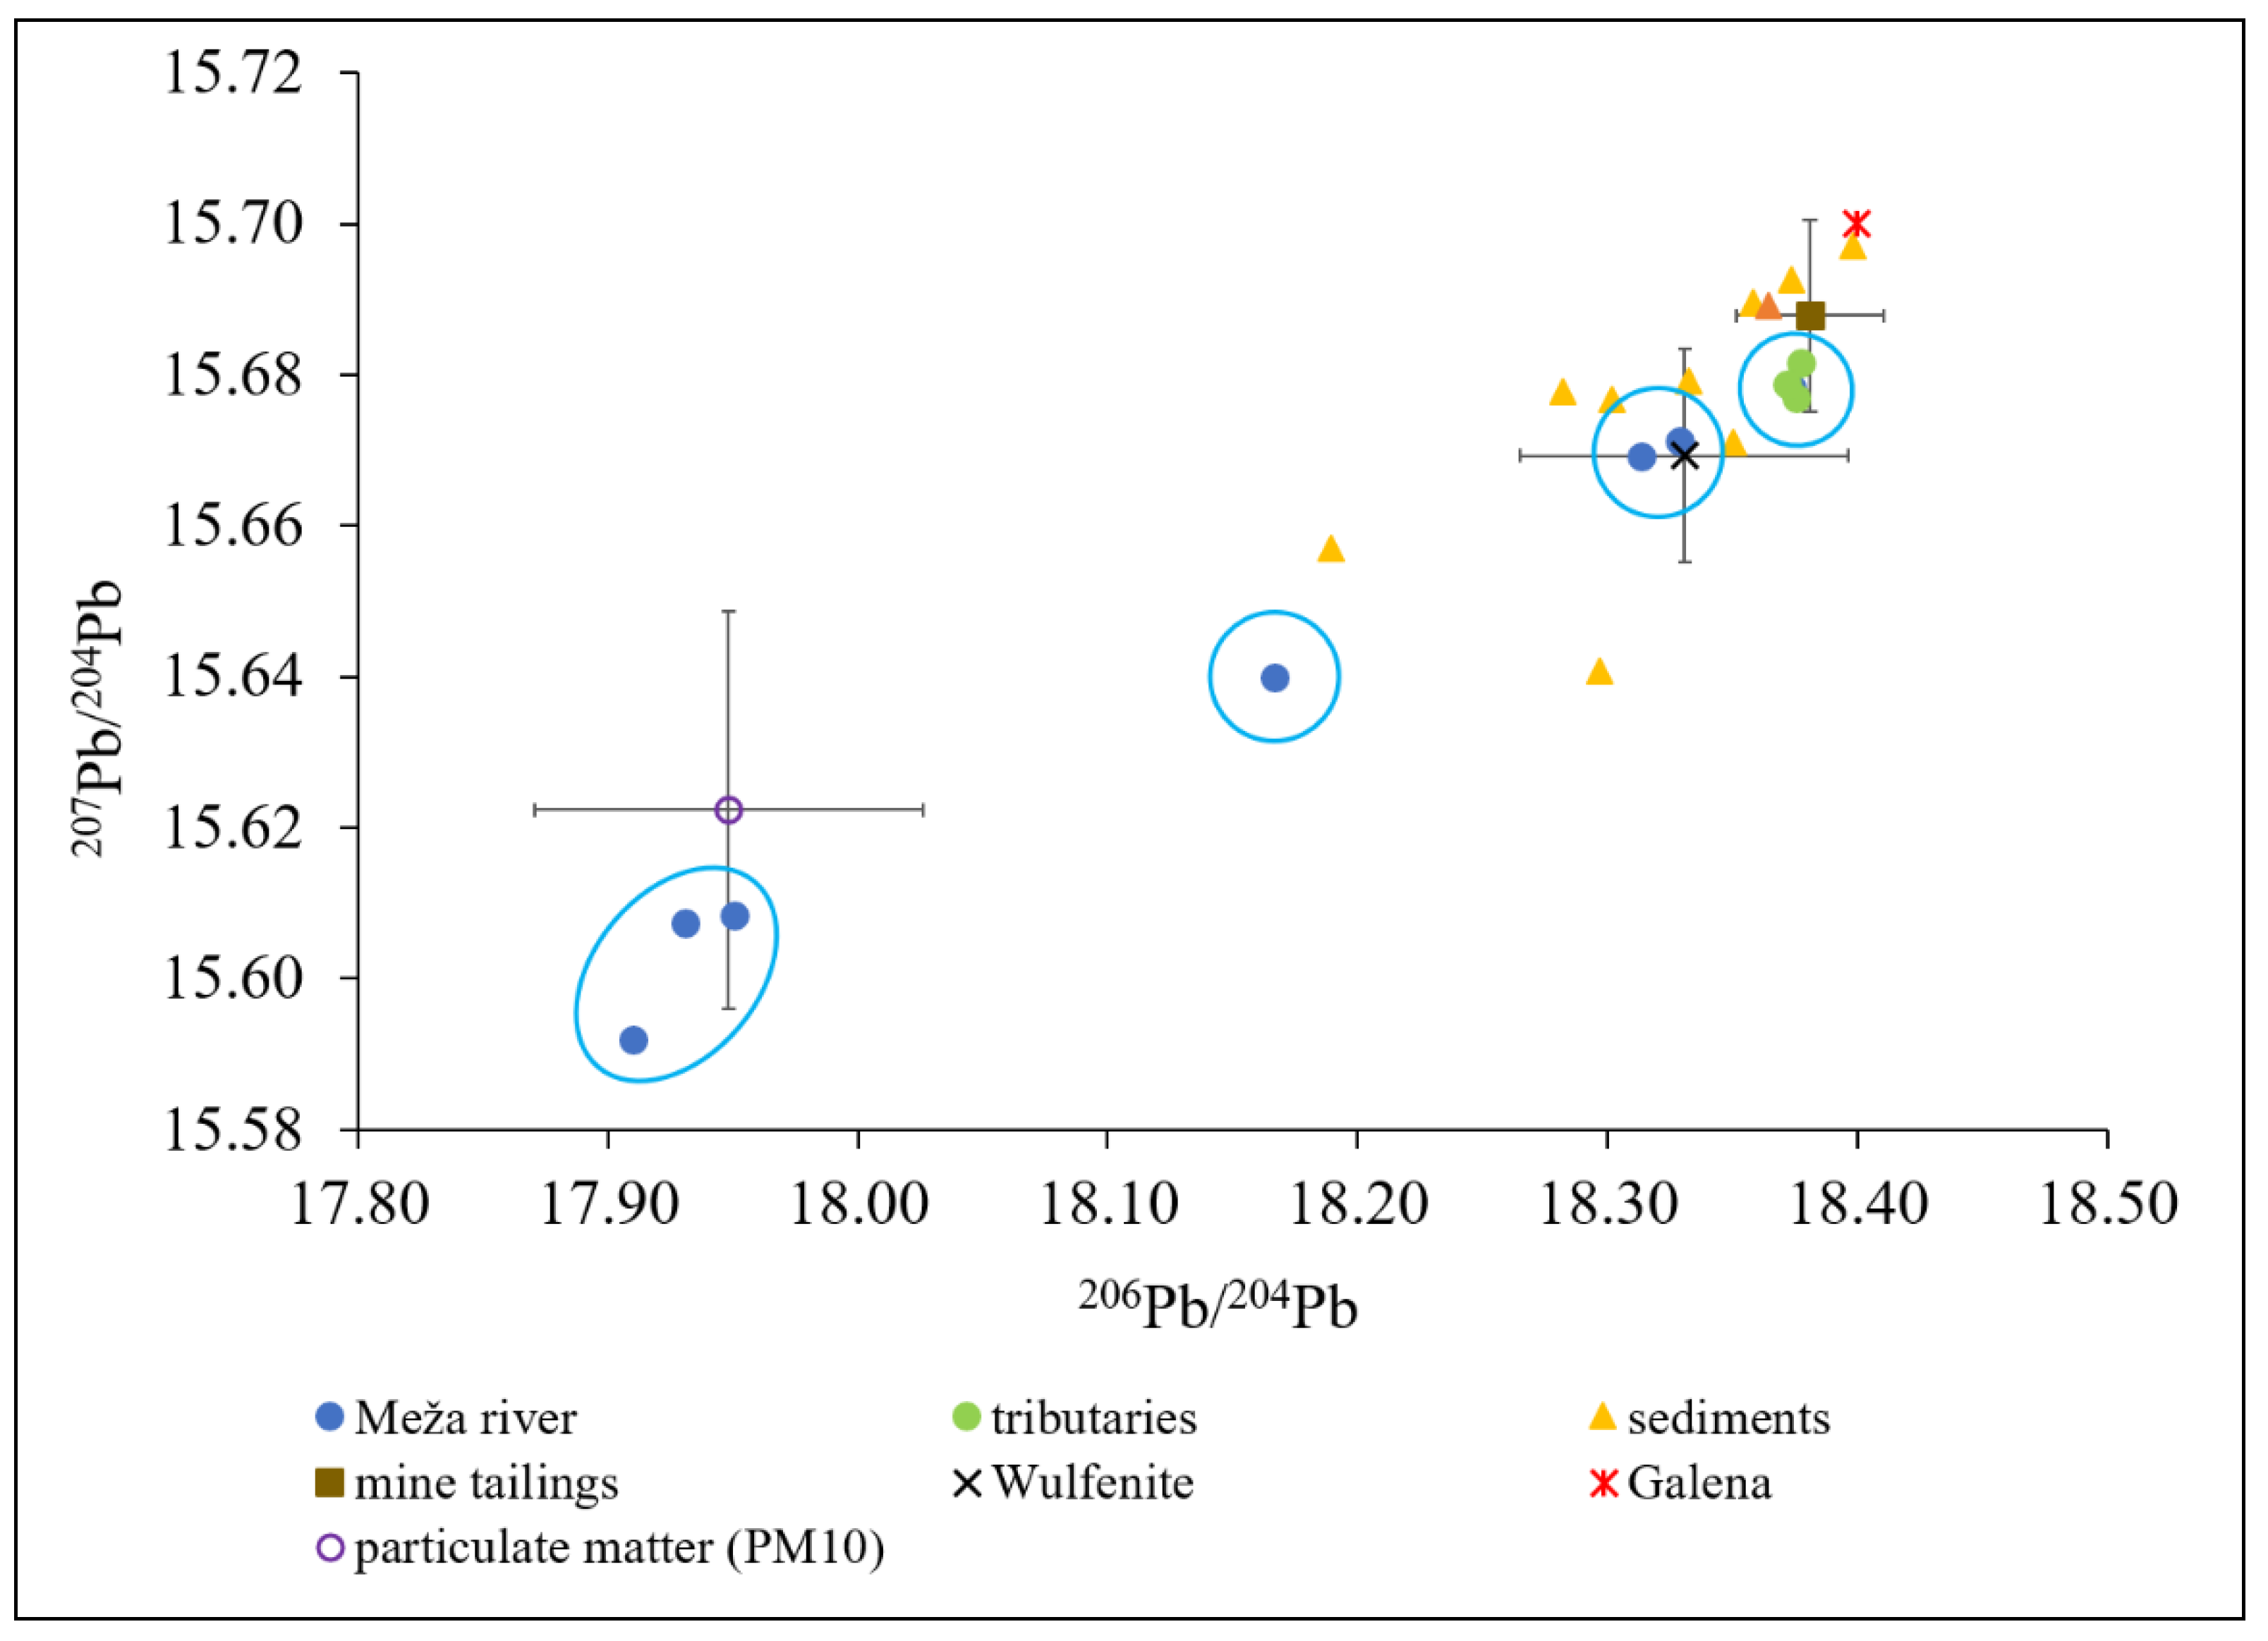
This study was the first to measure and report on the Pb isotope compositions of water and sediments from the Meža River and its tributaries. They were determined in both sediment fractions. The aim was to identify possible anthropogenic sources of Pb, especially regarding elevated Pb concentrations in the smaller fraction (<0.063 mm) of sediments. In Figure 3 the biplot of 207Pb/204Pb and 206Pb/204Pb in water and sediments from the Meža River and its tributaries is presented.
It can be observed from Figure 3 that the values for the Meža River water samples fall into four groups. In the first group are the samples from the locations Črna 2 (3), Žerjav 1 (4) and Žerjav 2 (5), with 207Pb/204Pb and 206Pb/204Pb ratios ranging from 15.592 to 15.608, and from 17.910 to 17.951, respectively. The three sampling locations are in the vicinity of an industrial area. Similar Pb isotope ratios were also measured in PM10 particles from these areas (unpublished data). Lead can be present in river water because of atmospheric Pb being deposited into it, the significance of the input depending on Pb abundance in rain and aerosol solubility [38]. Additionally, Pb could also enter the river with the effluents from the surrounding industries. In the second group are values from sampling site Mežica (6) with 207Pb/204Pb and 206Pb/204Pb ratios of 15.640 and 18.167, respectively. Observation of Pb isotope ratios shows that the mixing of different Pb sources occurs. In the third group are values from sampling sites Črna 1 (2) and Podklanc (7) with higher 207Pb/204Pb and 206Pb/204Pb ratios (from 15.671 to 15.669 and from 18.313 to 18.329, respectively). Similar Pb isotope ratios were also measured in samples of local wulfenite (unpublished data) and attic dust that was attributed to the dust particles from the area [39]. In the fourth group, with the values of 207Pb/204Pb and 206Pb/204Pb ratios in the range 15.677 to 15.682 and 18.372 to 18.377, respectively, are samples collected at sampling sites Topla (1) and the tributaries (Helena Rivulet (8), Jazbina Rivulet (9) and Junčar Rivulet (10)). The Pb isotope ratios coincide with samples of mine tailings (unpublished data). The samples from the fourth group (including the first sampling location on the Meža River) have the highest 207Pb/204Pb and 206Pb/204Pb ratios, while all the other samples that follow down the river have lower ratios. This is to some extent in compliance with findings from Gassama et al. [40]. The same grouping was also observed in biplots of 208Pb/204Pb with 206Pb/204Pb and 208Pb/206Pb with 206Pb/207Pb that are presented in the Supplementary Materials (Figures S1 and S2).
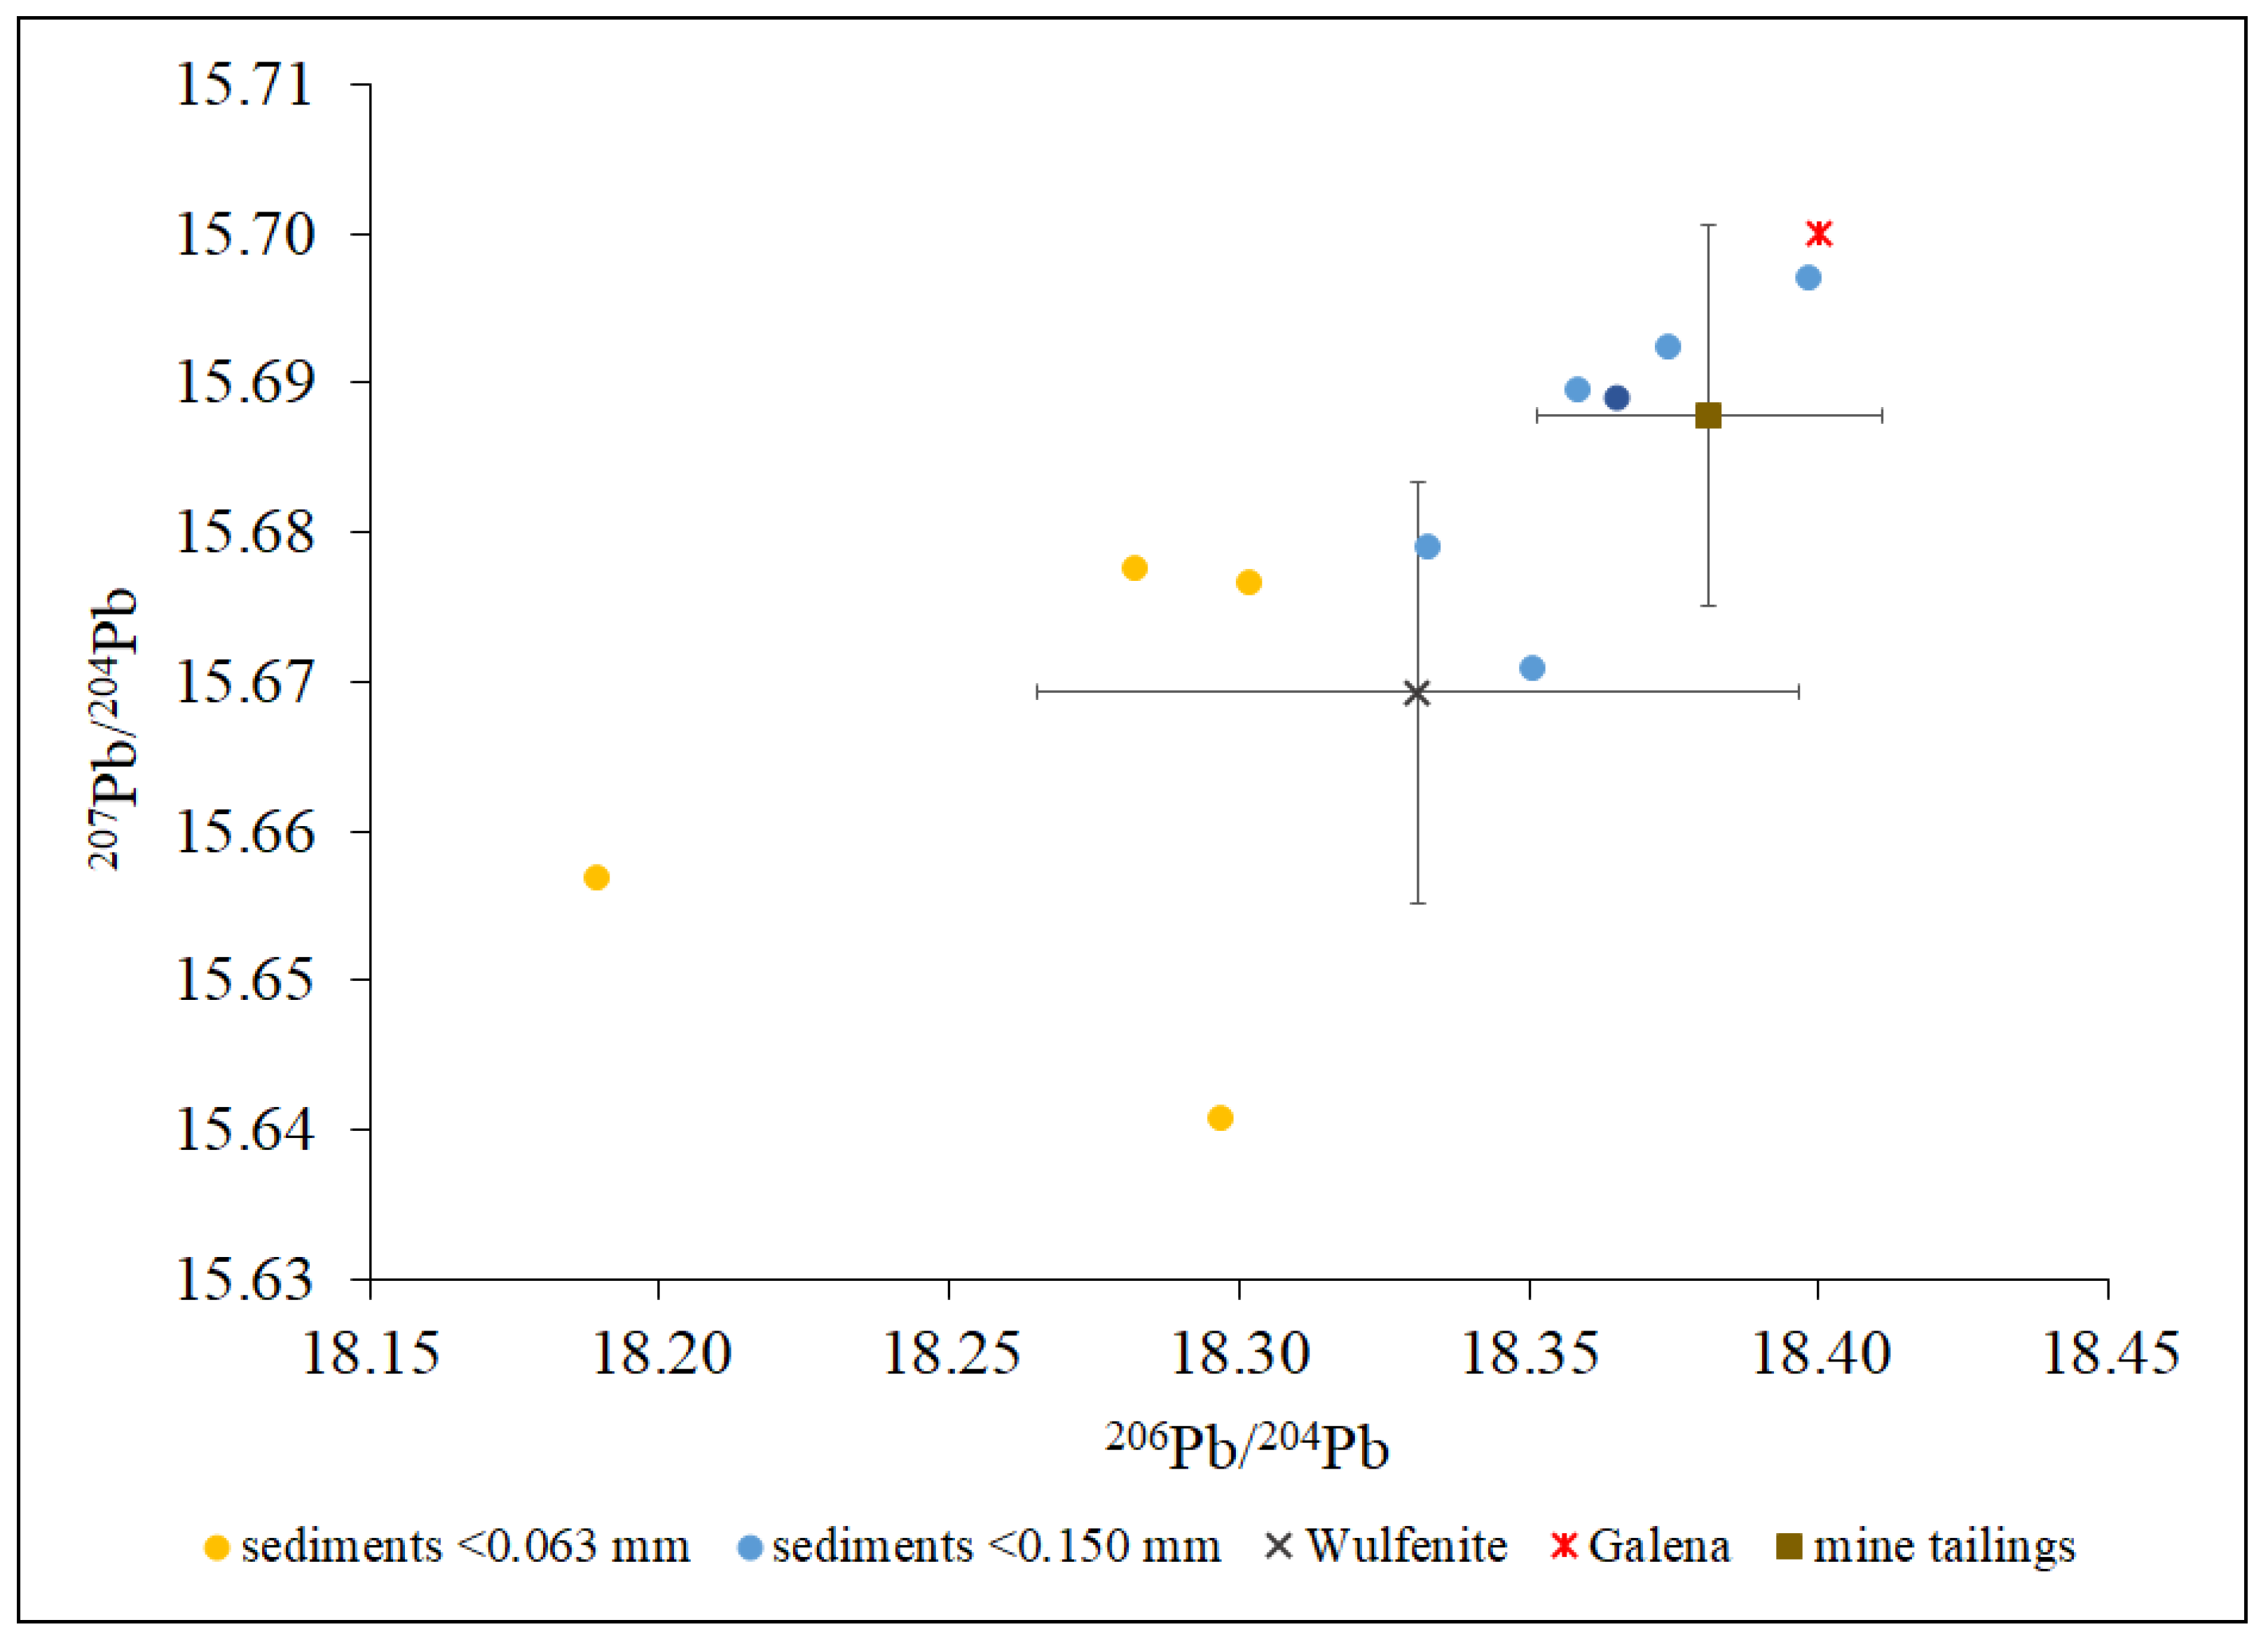
Different Pb concentrations were observed between sediment fractions <0.063 and <0.150 mm. Based on the study of Zhang et al. [34], an assumption was made that if Pb was from the same source, both fractions would have the same Pb isotope composition. As can be seen from the Figure 4, the two sediment fractions had different Pb isotope compositions. The dispersion of Pb isotope ratios indicates that there may be other anthropogenic sources present besides local mining activities. The isotope composition of Pb in the <0.063 mm fraction is slightly shifted in the direction of PM10 particles and water samples from Žerjav 1 and 2 (lower 206Pb/207Pb and 206Pb/204Pb ratios), possibly indicating another source of Pb in the area. The sample with the lowest value of 206Pb/204Pb ratio is from Žerjav 2 (5a) (fraction <0.063 mm) and is close in value to the water sample taken at Mežica (6) sampling site. As particles in the <0.063 mm fraction have a greater surface area, elements from the water tend to adsorb on them, in the case of Pb even 10 times more than on larger fractions [41]. Lead isotope composition of sediments in the <0.150 mm fraction coincides with values of local mine tailings and in some parts also with values of local ores, wulfenite (unpublished data) and galena [39]. A similar grouping was also observed in the biplot of 208Pb/204Pb with 206Pb/204Pb, while in the biplot of 208Pb/206Pb with 206Pb/207Pb, all samples from fraction <0.150 mm and the sample from Junčar Rivulet (10a) (<0.063 mm) coincided with the Pb isotope ratio of local wulfenite. These two biplots are presented in the Supplementary Materials (Figures S3 and S4).
4. Conclusions
The aims of the present study were to determine PTE concentrations as well as the Pb isotope composition in water and sediment samples from the Meža River and its tributaries, to evaluate the hazard they are posing to the river ecosystem. In addition, the Pb isotope composition determined in the water and sediments from the Meža River was used to identify possible new sources of Pb.
PTE were still present in important amounts in the waters of the Meža River and its tributaries. The highest measured average concentrations in water were of Zn followed by Pb, As and Cd. Average Pb concentration was above the threshold value determined with EU WFD. The limit value was exceeded at most sampling locations, as was the Zn concentration. Average concentrations of Cd, As, Ni, Cu and Cr were well below the established limits at all sampling locations. Given that Pb and Zn concentrations in general were higher in its tributaries than in the Meža River, they were most likely leaching from a mine with mine waters.
In sediments the PTE were determined in fractions <0.063 and <0.150 mm. In general, higher concentrations of Pb, Cd and As were determined in the smaller fraction (<0.063 mm), while for Zn they were higher in the larger fraction (<0.150 mm). In Podklanc (7a), in the <0.150 mm fraction, the highest PTE concentrations were determined. As this sampling location is located near the confluence of the Meža and Drava Rivers, where the riverbed is wider and the river flow slows down, it accumulates sediments from the faster and steeper upstream. In fraction <0.063 mm, the highest Pb and As concentrations were measured at Žerjav 2 (5a), which is situated a few meters downstream from an industrial area. Despite very high PEC-Q values, the state of the Meža River was not as critical as these values indicated, as Pb, Zn and Cd were mostly bound to more sparingly soluble fractions.
Besides the concentration difference, the Pb isotope composition also differed between the two sediment fractions. The Pb isotope composition of the <0.150 mm fraction was in the range of values of local galena and wulfenite, while the fine fraction was shifted toward the values of the dust particles coming from the industrial area, indicating a possible new Pb source.
Supplementary Materials
The following supporting information can be downloaded at: https://www.mdpi.com/article/10.3390/w14070998/s1, Table S1: Operating conditions for the 7700× ICP-MS and Nu II MC ICP-MS; Table S2: Concentrations of selected elements determined in certified reference material BCR 320R after microwave digestion and in SPS-SW1 by ICP-MS; Table S3: Procedure for Pb separation from the matrix with Dowex® 1X8 resin; Table S4: Total element concentrations (µg/L) in water samples determined by ICP-MS; Table S5: Total element concentrations (mg/kg) in sediment samples determined by ICP-MS; Table S6: Pearson correlation matrix for metal concentrations in water and sediment samples from the Meža River; Figure S1: Pb isotopic composition of water and sediment samples from the Meža River and its tributaries shown on a biplot of 208Pb/204Pb with 206Pb/204Pb; Figure S2: Pb isotopic composition of water and sediment samples from the Meža River and its tributaries shown on a biplot of 208Pb/206Pb with 206Pb/207Pb; Figure S3: Pb isotopic composition of two different fractions of sediment samples from the Meža River and its tributaries shown on a biplot of 208Pb/204Pb with 206Pb/204Pb; Figure S4: Pb isotopic composition of two different fractions of sediment samples from the Meža River and its tributaries shown on a biplot of 208Pb/206Pb with 206Pb/207Pb.
Author Contributions
Conceptualization, T.G., J.B., I.K., J.T. and T.Z.; methodology, T.G. and T.Z.; validation, T.Z.; formal analysis, T.G.; investigation, T.G. and T.Z.; resources, T.Z.; data curation, T.G. and T.Z.; writing—original draft preparation, T.G.; writing—review and editing, T.Z., J.T., I.K. and J.B.; visualization, T.Z.; supervision, T.Z. and J.T.; project administration, T.Z.; funding acquisition, T.Z. All authors have read and agreed to the published version of the manuscript.
Funding
This research was funded by the Slovenian Research Agency—ARRS Program (P1-0143), Young research program (PR-10487) and CRP Project–Identification of Pb sources in the upper Mežiška Valley based on Pb isotope composition (V1-1939).
Institutional Review Board Statement
Not applicable.
Informed Consent Statement
Not applicable.
Data Availability Statement
Not applicable.
Acknowledgments
Special thanks are due to R. Novak for his valuable help with graphics.
Conflicts of Interest
The authors declare no conflict of interest.
References
- Rečnik, A.; Zavašnik, J.; Štrucl, S.F. The Mežica mine, Koroška (Slovenia). Mineral. Rec. 2014, 45, 507–548. [Google Scholar]
- Gosar, M.; Miler, M. Anthropogenic metal loads and their sources in stream sediments of the Meža River catchment area (NE Slovenia). Appl. Geochem. 2011, 26, 1855–1866. [Google Scholar] [CrossRef]
- Žibret, G.; Gosar, M.; Miler, M.; Alijagić, J. Impacts of mining and smelting activities on environment and landscape degradation—Slovenian case studies. Land Degrad. Dev. 2018, 29, 4457–4470. [Google Scholar] [CrossRef] [Green Version]
- Kladnik, Š. Comparison of the Current State of the Environment in the Upper Meža Valley with the Situation in the Past Decades. Bachelor’s Thesis, University of Ljubljana, Faculty of Arts, Department of Geography, Ljubljana, Slovenia, 2009. [Google Scholar]
- Gošar, D.; Costa, M.R.; Ferreira, A.; Štrucl, S.F. Assessment of past and present water quality in closed Mežica Pb-Zn Mine (Slovenia). Comun. Geol. 2015, 102, 65–69. [Google Scholar]
- Svete, P.; Milačič, R.; Pihlar, B. Partitioning of Zn, Pb and Cd in river sediments from a lead and zinc mining area using the BCR three-step sequential extraction procedure. J. Environ. Monit. 2001, 3, 586–590. [Google Scholar] [CrossRef]
- Fux, J.; Gosar, M. Vsebnosti svinca in drugih težkih kovin v sedimentih na območju Mežiške doline (Lead and other heavy metals in stream sediments in the area of Meža valley). Geologija 2007, 50, 347–360. [Google Scholar] [CrossRef]
- Audry, S.; Schäfer, J.; Blanc, G.; Jouanneau, J.M. Fifty-year sedimentary record of heavy metal pollution (Cd, Zn, Cu, Pb) in the Lot River reservoirs (France). Environ. Pollut. 2004, 132, 413–426. [Google Scholar] [CrossRef]
- Rybicka, E.H.; Adamie, E.; Aleksander-Kwaterczak, U. Distribution of trace metals in the Odra River system: Water–suspended matter–sediments. Limnologica 2005, 35, 185–198. [Google Scholar] [CrossRef] [Green Version]
- Strzebońska, M.; Jarosz-Krzemińska, E.; Adamiec, E. Assessing Historical Mining and Smelting Effects on Heavy Metal Pollution of River Systems over Span of Two Decades. Water Air Soil Pollut. 2017, 228, 141. [Google Scholar] [CrossRef] [Green Version]
- Smolders, A.J.P.; Lock, R.A.C.; Van der Velde, G.; Medina Hoyos, R.I.; Roelofs, J.G.M. Effects of mining activities on heavy metal concentrations in water, sediment, and macroinvertebrates in different reaches of the Pilcomayo river, South America. Arch. Environ. Contam. Toxicol. 2003, 44, 314–323. [Google Scholar] [CrossRef]
- Bollhöfer, A.; Rosman, K.J.R. Isotopic source signatures for atmospheric lead: The Northern Hemisphere. Geochim. Cosmochim. Acta. 2001, 65, 1727–1740. [Google Scholar] [CrossRef]
- Sun, G.X.; Wang, X.J.; Hu, Q.H. Using stable lead isotopes to trace heavy metal contamination sources in sediments of Xiangjiang and Lishui Rivers in China. Environ. Pollut. 2011, 159, 3406–3410. [Google Scholar] [CrossRef] [PubMed]
- Kong, H.; Teng, Y.; Song, L.; Wang, J.; Zhang, L. Lead and strontium isotopes as tracers to investigate the potential sources of lead in soil and groundwater: A case study of the Hun River alluvial fan. Appl. Geochem. 2018, 97, 291–300. [Google Scholar] [CrossRef]
- Schnyder, E.; Štrok, M.; Kosonen, Z.; Skudnik, M.; Mazej, D.; Jeran, Z.; Thöni, L. Lead concentrations and stable lead isotope ratios in moss in Slovenia and Switzerland. Ecol. Indic. 2018, 95, 250–259. [Google Scholar] [CrossRef]
- Rosca, C.; Schoenberg, R.; Tomlinson, E.L.; Kamber, B.S. Combined zinc-lead isotope and trace-metal assessment of recent atmospheric pollution sources recorded in Irish peatlands. Sci. Total Environ. 2019, 658, 234–249. [Google Scholar] [CrossRef]
- Ladonin, D.V.; Plyaskina, O.V. Isotopic composition of lead in soils and street dust in the Southeastern Administrative District of Moscow. Eurasian Soil Sci. 2009, 42, 93–104. [Google Scholar] [CrossRef]
- Komárek, M.; Ettler, V.; Chrastný, V.; Mihaljevič, M. Lead isotopes in environmental sciences: A review. Environ. Int. 2008, 34, 562–577. [Google Scholar] [CrossRef]
- Monna, F.; Hamer, K.; Lévêque, J.; Sauer, M. Pb isotopes as a reliable marker of early mining and smelting in the Northern Harz province (Lower Saxony, Germany). J. Geochem. Explor. 2000, 68, 201–210. [Google Scholar] [CrossRef]
- MacKenzie, A.B.; Pulford, I.D. Investigation of contaminant metal dispersal from a disused mine site at Tyndrum, Scotland, using concentration gradients and stable Pb isotope ratios. Appl. Geochem. 2002, 17, 1093–1103. [Google Scholar] [CrossRef]
- Ettler, V.; Mihaljevič, M.; Šebek, O.; Molek, M.; Grygar, T.; Zeman, J. Geochemical and Pb isotopic evidence for sources and dispersal of metal contamination in stream sediments from the mining and smelting district of Příbram, Czech Republic. Environ. Pollut. 2006, 142, 409–417. [Google Scholar] [CrossRef]
- Ayrault, S.; Roy-Barman, M.; Le Cloarec, M.F.; Priadi, C.R.; Bonté, P.; Göpel, C. Lead contamination of the Seine River, France: Geochemical implications of a historical perspective. Chemosphere 2012, 87, 902–910. [Google Scholar] [CrossRef] [PubMed]
- Gao, B.; Liang, X.; Zhou, H.; Tu, X. Lead isotopes as a tracer of Pb origin in the sediments from Beijiang River, South China. Water Sci. Technol. 2012, 66, 2613–2619. [Google Scholar] [CrossRef] [PubMed]
- MacDonald, D.D.; Ingersoll, C.G.; Berger, T.A. Development and Evaluation of Consensus-Based Sediment Quality Guidelines for Freshwater Ecosystems. Arch. Environ. Contam. Toxicol. 2000, 39, 20–31. [Google Scholar] [CrossRef] [PubMed]
- Long, E.R.; Ingersoll, C.G.; MacDonald, D.D. Calculation and Uses of Mean Sediment Quality Guideline Quotients: A Critical Review. Environ. Sci. Technol. 2006, 40, 1726–1736. [Google Scholar] [CrossRef]
- Larrose, A.; Coynel, A.; Schäfer, J.; Blanc, G.; Massé, L.; Maneux, E. Assessing the current state of the Gironde Estuary by mapping priority contaminant distribution and risk potential in surface sediment. Appl. Geochem. 2010, 25, 1912–1923. [Google Scholar] [CrossRef]
- Essien, J.P.; Antai, S.P.; Olajire, A.A. Distribution, Seasonal Variations and Ecotoxicological Significance of Heavy Metals in Sediments of Cross River Estuary Mangrove Swamp. Water Air Soil Pollut. 2009, 197, 91–105. [Google Scholar] [CrossRef]
- Wang, C.; Liu, S.; Zhao, Q.; Deng, L.; Dong, S. Spatial variation and contamination assessment of heavy metals in sediments in the Manwan Reservoir, Lancang River. Ecotoxicol. Environ. Saf. 2012, 82, 32–39. [Google Scholar] [CrossRef]
- Kugonič, N.; Kopušar, N. Garden Soil and Vegetable Pollution Assessment of the Upper Meza Valley (Slovenia). Phyton 2000, 40, 117–121. [Google Scholar]
- Finzgar, N.; Jez, E.; Voglar, D.; Lestan, D. Spatial distribution of metal contamination before and after remediation in the Meza Valley, Slovenia. Geoderma 2014, 217–218, 135–143. [Google Scholar] [CrossRef]
- Zuliani, T.; Mladenovič, A.; Ščančar, J.; Milačič, R. Chemical characterisation of dredged sediments in relation to their potential use in civil engineering. Environ. Monit. Assess. 2016, 188, 234. [Google Scholar] [CrossRef]
- Official Journal of the European Union. Directive 2008/105/EC of the European Parliament and of the Council on Environmental Quality Standards in the Field of Water Policy, Amending and Subsequently Repealing Council Directives 82/176/EEC, 83/513/EEC, 84/156/EEC, 84/491/EEC, 86/280/EEC and Amending Directive 2000/60/EC of the European Parliament and of the Council. L 348/84. 2008. Available online: https://eur-lex.europa.eu/legal-content/EN/TXT/?uri=celex%3A32008L0105 (accessed on 19 January 2022).
- Statutory Instruments. S.I. No. 272. European Communities Environmental Objectives (Surface Waters) Regulations 2009. Available online: https://www.irishstatutebook.ie/eli/2009/si/272/made/en/print (accessed on 9 January 2022).
- Zhang, S.; Wang, S.; Shan, X. Distribution and speciation of heavy metals in surface sediments from Guanting reservoir, Beijing. J. Environ. Sci. Health 2002, 37, 465–478. [Google Scholar] [CrossRef] [PubMed]
- Wang, S.X.; Zhang, S.Z.; Shan, X.Q. Fractionation of Heavy Metals in Different Particle-Size Sediments and Its Relationship with Heavy Metal Pollution. Bull. Environ. Contam. Toxicol. 2003, 71, 873–880. [Google Scholar] [CrossRef] [PubMed]
- Štrucl, I. Geološke, geokemične in mineraloške značilnosti rude in prikamenine svinčevo-cinkovih orudenj mežiškega rudišča (Geological and geochemical characteristics of ore and host rock of lead–zinc ores of the Mežica ore deposit). Geologija 1984, 27, 215–327. [Google Scholar]
- Miler, M.; Gosar, M. Characteristics and potential environmental influences of mine waste in the area of the closed Mežica Pb–Zn mine (Slovenia). J. Geochem. Explor. 2012, 112, 152–160. [Google Scholar] [CrossRef]
- Gaillardet, J.; Viers, J.; Dupré, B. Trace elements in river waters. In Treatise on Geochemistry; Holland, H.D., Turekian, K.K., Eds.; Elsevier Ltd.: Amsterdam, The Netherlands, 2003; Volume 5, pp. 225–272. [Google Scholar] [CrossRef]
- Miler, M.; Gosar, M. Assessment of contribution of metal pollution sources to attic and household dust in Pb-polluted area. Indoor Air 2019, 29, 487–498. [Google Scholar] [CrossRef]
- Gassama, N.; Curie, F.; Vanhooydonck, P.; Bourrain, X.; Widory, D. Determining the regional geochemical background for dissolved trace metals and metalloids in stream waters: Protocol, results and limitations—The upper Loire River basin (France). Water 2021, 13, 1845. [Google Scholar] [CrossRef]
- Tansel, B.; Rafiuddin, S. Heavy metal content in relation to particle size and organic content of surficial sediments in Miami River and transport potential. Int. J. Sediment Res. 2016, 31, 324–329. [Google Scholar] [CrossRef]
Figure 1.
Sampling area with sampling sites.

Figure 2.
PEC-Q values for sediment samples with (a) and without the inclusion of Pb and Zn (b), collected along the Meža River and its tributaries. Horizontal lines correspond to PEC-Q values of 0.25 and 0.34.
Figure 2.
PEC-Q values for sediment samples with (a) and without the inclusion of Pb and Zn (b), collected along the Meža River and its tributaries. Horizontal lines correspond to PEC-Q values of 0.25 and 0.34.

Figure 3.
Pb isotope compositions of water and sediment samples from the Meža River and its tributaries on a biplot of 207Pb/204Pb with 206Pb/204Pb. The orange triangle marker for sediments represents the sample from Črna 2 with fraction <0.250 mm. Values for mine tailings, particulate matter PM10 and wulfenite are from our unpublished data, and the value for galena is from Miler and Gosar [39].

Figure 4.
Pb isotope compositions of two sediment fractions (<0.063 and <0.150 mm) from the Meža River and its tributaries on a biplot of 207Pb/204Pb with 206Pb/204Pb. The dark blue circle marker for sediments <0.150 mm represents the sample from Črna 2, with fraction <0.250 mm. Values for mine tailings and wulfenite are from our unpublished data, and the value for galena is from Miler and Gosar [39].


Table 1.
Total concentration of Pb, Zn, Cd and As (µg/L) in water samples from the Meža River and its tributaries determined by ICP-MS. Results are expressed with standard deviation.
Table 1.
Total concentration of Pb, Zn, Cd and As (µg/L) in water samples from the Meža River and its tributaries determined by ICP-MS. Results are expressed with standard deviation.
| Sample Number | Sample Location | Pb | Zn | Cd | As |
|---|---|---|---|---|---|
| (1) | Meža–Topla | 2.52 ± 0.09 | 4.33 ± 0.09 | 0.038 ± 0.004 | 1.29 ± 0.02 |
| (2) | Meža–Črna 1 | 1.08 ± 0.03 | 5.70 ± 0.19 | 0.049 ± 0.005 | 0.62 ± 0.01 |
| (3) | Meža–Črna 2 | 9.01 ± 0.27 | 7.39 ± 0.13 | 0.057 ± 0.004 | 0.64 ± 0.01 |
| (4) | Meža–Žerjav 1 | 19.7 ± 0.7 | 11.4 ± 0.4 | 0.11 ± 0.01 | 1.11 ± 0.04 |
| (5) | Meža–Žerjav 2 | 41.9 ± 1.9 | 28.5 ± 0.7 | 0.58 ± 0.01 | 7.28 ± 0.11 |
| (6) | Meža–Mežica | 21.7 ± 0.6 | 63.8 ± 1.1 | 0.63 ± 0.01 | 3.09 ± 0.05 |
| (7) | Meža–Podklanc | 8.08 ± 0.22 | 53.6 ± 1.1 | 0.24 ± 0.01 | 0.87 ± 0.03 |
| (8) | Helena Rivulet | 51.7 ± 0.9 | 107 ± 1 | 0.52 ± 0.01 | 0.41 ± 0.01 |
| (9) | Jazbina Rivulet | 4.37 ± 0.13 | 67.7 ± 1.8 | 0.26 ± 0.01 | 0.37 ± 0.01 |
| (10) | Junčar Rivulet | 31.5 ± 0.7 | 89.5 ± 1.2 | 0.25 ± 0.01 | 0.53 ± 0.01 |
Table 2.
Total concentration of Pb, Zn, Cd and As (mg/kg) in two fractions (<0.063 mm and <0.150 mm) of sediment samples from the Meža River and its tributaries determined by ICP-MS. The results are expressed with standard deviation.
Table 2.
Total concentration of Pb, Zn, Cd and As (mg/kg) in two fractions (<0.063 mm and <0.150 mm) of sediment samples from the Meža River and its tributaries determined by ICP-MS. The results are expressed with standard deviation.
| Sample Number | Sample Location | Fraction (mm) | Pb | Zn | Cd | As |
|---|---|---|---|---|---|---|
| (2a) | Meža–Črna 1 | <0.063 | 1619 ± 1 | 2214 ± 21 | 13.2 ± 0.1 | 22.3 ± 0.3 |
| <0.150 | 2549 ± 277 | 2055 ± 24 | 10.3 ± 0.1 | 14.4 ± 0.3 | ||
| (3a) | Meža–Črna 2 * | <0.150 | 120 ± 1 | 375 ± 6 | 2.45 ± 0.01 | 10.3 ± 0.3 |
| <0.250 | 114 ± 3 | 646 ± 5 | 2.71 ± 0.04 | 11.0 ± 0.2 | ||
| (5a) | Meža–Žerjav 2 | <0.063 | 15,609 ± 16 | 5206 ± 74 | 33.0 ± 0.1 | 56.5 ± 0.6 |
| <0.150 | 3895 ± 275 | 1702 ± 6 | 9.61 ± 0.13 | 20.4 ± 0.3 | ||
| (7a) | Meža–Podklanc | <0.063 | 5814 ± 5 | 6658 ± 69 | 43.8 ± 0.1 | 30.5 ± 0.4 |
| <0.150 | 10,032 ± 192 | 15,956 ± 121 | 88.0 ± 0.7 | 44.3 ± 0.6 | ||
| (10a) | Junčar Rivulet | <0.063 | 2350 ± 1 | 6071 ± 61 | 29.3 ± 0.1 | 29.5 ± 0.7 |
| <0.150 | 1401 ± 26 | 5278 ± 13 | 21.4 ± 0.3 | 28.7 ± 0.1 |
* Meža–Črna 2 no fine sediment present.
Publisher’s Note: MDPI stays neutral with regard to jurisdictional claims in published maps and institutional affiliations. |
© 2022 by the authors. Licensee MDPI, Basel, Switzerland. This article is an open access article distributed under the terms and conditions of the Creative Commons Attribution (CC BY) license (https://creativecommons.org/licenses/by/4.0/).
Share and Cite
MDPI and ACS Style
Goltnik, T.; Burger, J.; Kranjc, I.; Turšič, J.; Zuliani, T. Potentially Toxic Elements and Pb Isotopes in Mine-Draining Meža River Catchment (NE Slovenia). Water 2022, 14, 998. https://doi.org/10.3390/w14070998
AMA Style
Goltnik T, Burger J, Kranjc I, Turšič J, Zuliani T. Potentially Toxic Elements and Pb Isotopes in Mine-Draining Meža River Catchment (NE Slovenia). Water. 2022; 14(7):998. https://doi.org/10.3390/w14070998
Chicago/Turabian StyleGoltnik, Tjaša, Judita Burger, Irena Kranjc, Janja Turšič, and Tea Zuliani. 2022. "Potentially Toxic Elements and Pb Isotopes in Mine-Draining Meža River Catchment (NE Slovenia)" Water 14, no. 7: 998. https://doi.org/10.3390/w14070998
Note that from the first issue of 2016, this journal uses article numbers instead of page numbers. See further details here.