
Regional Assessment of Sub-Hourly Annual Rainfall Maxima


1
Department of Civil Engineering, University of Salerno, 84084 Fisciano, SA, Italy
2
Department of Agricultural Sciences, University of Naples “Federico II”, 80055 Portici, NA, Italy
*
Author to whom correspondence should be addressed.
Water 2022, 14(7), 1179; https://doi.org/10.3390/w14071179
Submission received: 4 March 2022
/
Revised: 3 April 2022
/
Accepted: 5 April 2022
/
Published: 6 April 2022
(This article belongs to the Special Issue Extreme Rainfall and Floods in the Mediterranean Regions)
Abstract
:The assessment of rainfall extremes at sub-hourly scales is generally hindered by a lack of rainfall data at small timescale resolutions. This study proposes a methodology for assessing mean annual maximum rainfall at the sub-hourly scale by blending historical time series of annual maxima recorded by mechanical stations (operating at hourly scales) up to the end of the past century with newer time series of annual maxima at higher time resolutions recorded by automatic stations installed over the past twenty years. A linear correlation was found at the regional scale between the shape parameter controlling the dependency of rainfall maxima with a duration longer than one hour and the shape parameter of the dependency of rainfall maxima with the durations shorter than one hour. Thanks to this correlation, data recorded at the mechanical stations could be exploited to assess sub-hourly mean annual maxima. The proposed hybrid procedure was verified and was found to provide estimates with an accuracy close to those obtained with the high-resolution data, i.e., our best estimates. Moreover, the proposed procedure outperforms what could be achieved by spatially interpolating the best estimates at those locations where only hourly data are available.
1. Introduction
In the Mediterranean area, the hydrological and geological risks associated with rainfall-triggered hazards due to short-duration extreme rainfall events represent a major issue for the safety of both people and construction projects. During the past several decades, many rainfall events with high intensity and short duration have indeed resulted in many human victims and much socio-economic damage in Italy and other neighboring countries as a consequence of floods, landslides, and debris flows [1,2,3,4]. These issues mainly involve small river basins and urban catchments for which the run-off response is maximized during sub-hourly extreme rainfall events [5,6].
Therefore, characterizing the frequency of extreme precipitation at sub-hourly durations becomes particularly relevant for many applications aiming to quantify the related rainfall-triggered hazards, as well as in the design of civil engineering infrastructure and in risk mitigation. The availability of long time series rainfall data is an important requisite for robust extreme rainfall frequency analysis, along with even spatial distribution in rainfall measurements [7]. Moreover, high resolution rainfall time series become a crucial need when the focus of interest is on short-duration extreme events.
Historical rainfall data are generally available only at coarser time resolutions than current data measured by the newest automatic monitoring stations, as there have been many technical advances in sensors and recording systems over time [8]. Nowdays, rainfall data are typically recorded by automatic pluviometers equipped with tipping bucket sensors that produce a digital signal for a certain amount of rainfall (namely, 0.1 or 0.2 mm), which is recordered in a data-logger and then sent at a given fixed aggregation interval of time (generally, from one to fifteen minutes) to a data acquisition and elaboration center. Unfortunately, installation of these automatic stations has been limited both in Italy and in many other countries, and data from them is only available from the beginning of this century [9]. In the previous century, rainfall depths were recorded by mechanical stations on paper strip charts, which were then read either manually or by semi-automatic methods, a circumstance that causes a lack of information regarding extreme events with shorter durations as rainfall variability at time scales shorter than one hour cannot be easily detected from strip charts [10]. As a result, assessed via paper strip charts systematically underestimates rainfall maxima compared to observations made with higher temporal resolutions. Indeed, false positive trends are observed when data recorded by old mechanical stations are combined in series with more recent data recorded by automatic stations, especially at the lowest durations (i.e., from one hour to a maximum of three hours) [11]. The bias between past and more recent rainfall maxima due to changes in monitoring technology can be overcome by increasing the historical data with a muliplicative factor, which has to be calibrated at regional scale [12,13].
This study is therefore motivated by the idea that historical data clearly have added value for robust extreme rainfall frequency analysis under the hypothesis of extreme rainfall stationarity [14]. Indeed, besides the widespread perception of an increase in the severity of extreme rainfall, changes in rainfall extremes have not yet been clearly validated in the scientific literature, at least as concerns Italy, and especially for short-duration extremes. Although no significant trends have been found at the regional scale, certain patterns of change can only be detected within smaller domains due to specific geographical characteristics [11]. Moreover, there are mechanisms in hydrological systems and modeling, such as hydrological long-term probabilistic predictions, which need to be interpreted through data inference that is necessarly based on assumptions that should include stationarity. In these cases, relaxing the hypothesis of stationarity may imply a reduction of predictive capabilities, while following a pragmatic approach based on the exploitation of past experience and data is more effective for setting up practical activities involving management, engineering design, and mitigation policies for environmental risk [14].
In this study, an innovative procedure is proposed for integrating databases with different time resolutions to exploit historical time series in regional frequency analysis of extreme rainfall, thus achieving an extension of the sample size of data at sub-hourly durations both in the temporal domain (when the position of the newest station is unchanged) and in the spatial domain.
The proposed methodology is built within the framework of Italian regional frequency analysis, known as the VAPI (VAlutazione delle PIene, Flood Estimation) project [15], which aims to define a standard regional analysis procedure for assessing rainfall and flood extreme frequency distributions using the index rainfall approach [16,17]. This approach is an efficient method of pooling summary statistics from a data sample in order to estimate the parameters of a frequency distribution. The assumption made by this method is that sites can be grouped into homogeneous regions with constant values of the higher-order parameters for which the point estimators are subjected to large sampling errors that make spatial variability statistically indistinguishable from sampling variability. Given this, the frequency distributions of different sites will be identical except for a site-specific scaling factor, which is called the index value [18].
When higher-order parameters (i.e., the shape and scale parameters) of the parent distribution of the annual rainfall maxima are assumed to be constant with the duration [15,19], it is even possible to decouple the dependence on the return period from the dependence on the duration, thus allowing more robust estimates of the higher-order parameters by pooling observations at different durations, achieving an extension of the sample size. This regional procedure delivers reliable predictions at high return periods [20] beyond the available sample size, which is typically not larger than 50 years at sub-daily durations and 18–20 years at sub-hourly durations. Under this hypothesis, the annual rainfall maxima for a given duration and given return period T can be computed as follows:
where is the mean of the annual maxima rainfall at a given duration and for a specific site and represents the growth curve (equal to a dimensionless quantile) with a return period equal to T, depending on the shape and scale parameters of the distribution maxima. Equation (1) is often referred to as the Depth–Duration-Frequency (DDF) curve, or the Intensity–Duration–Frequency (IDF) curve when the rainfall depth is divided by the duration. A DDF curve describes rainfall depth as a function of duration for given return periods, and its use is essential for the design of hydraulic infrastructure as well as for the management and assessment of rainfall-triggered hazards.
The mean of the annual maximum rainfall is the main part of the regional DDF model, and its assessment through varying durations is therefore a key step in regional frequency analysis. Here, a new regional procedure is proposed for assessing the mean annual maxima at sub-hourly durations at sites where data are only available at hourly resolutions, thus allowing the historical time series observed at mechanical stations to be exploited in regional frequency analysis of extreme rainfall using sub-hourly durations.
2. Materials and Methods
2.1. Study Area and Rainfall Database
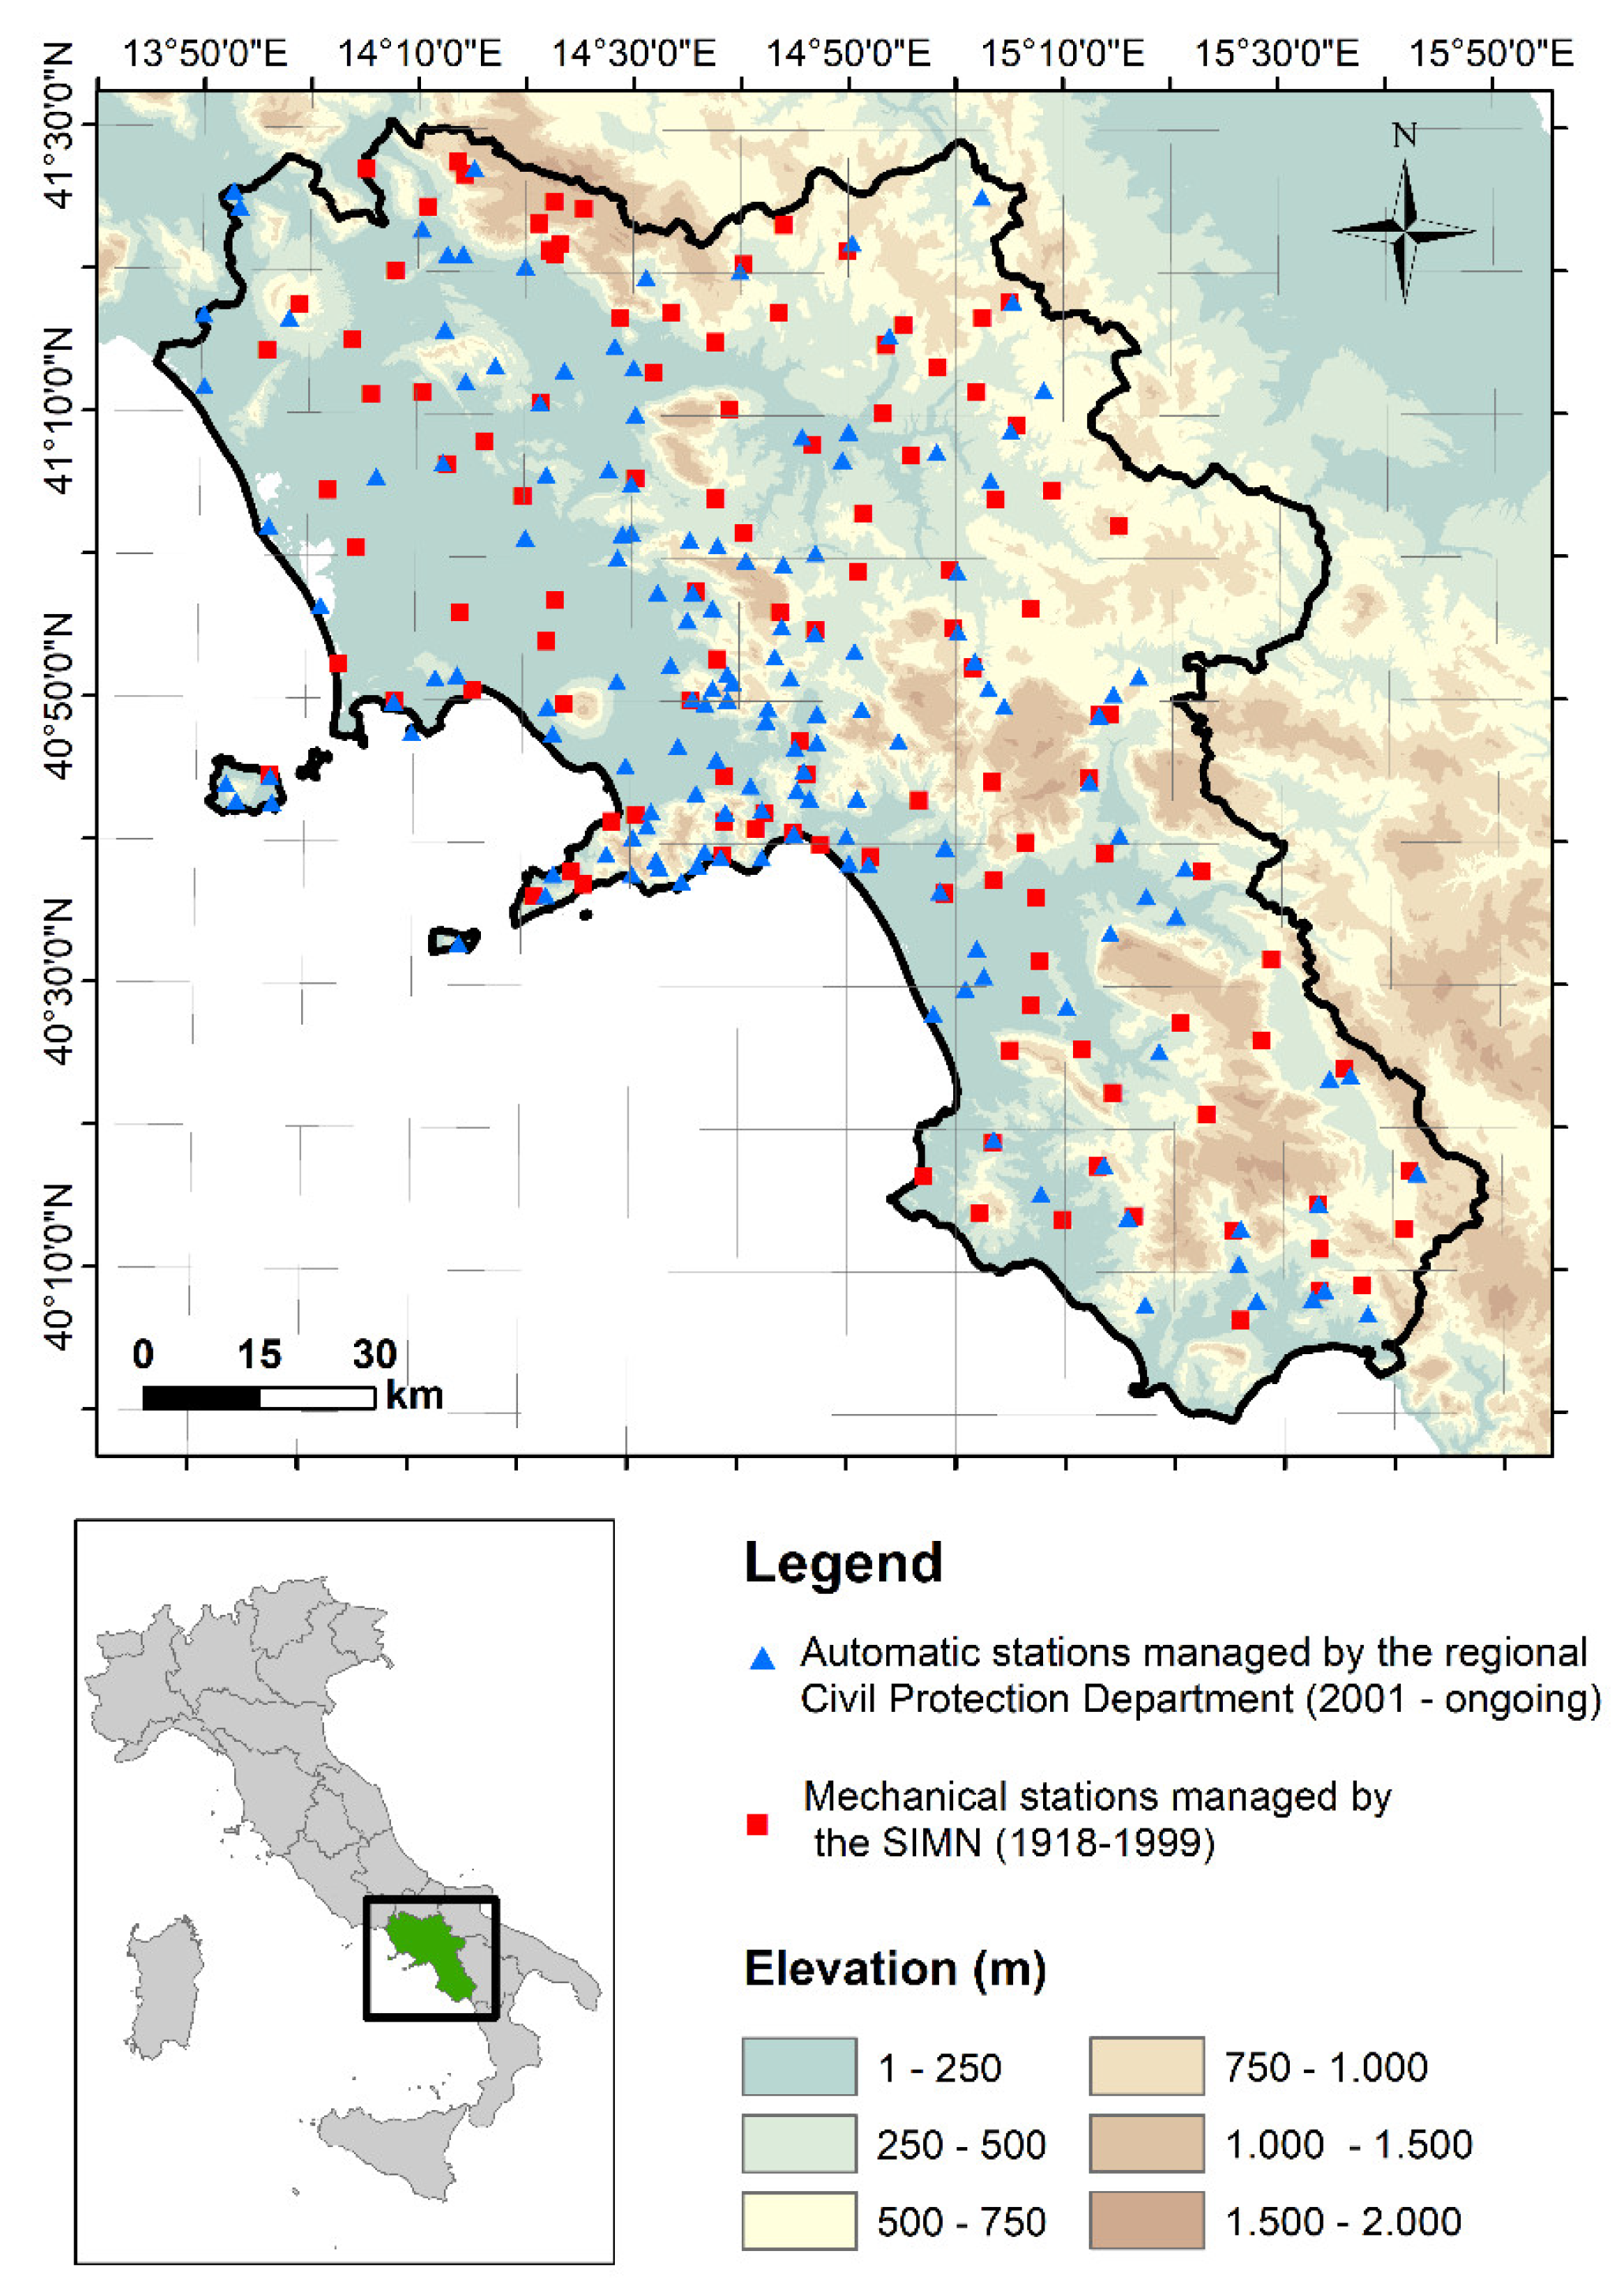
The area of interest for the present study was the Campania region, located in Southern Italy between the Apennines and the Tyrrhenian Sea (Figure 1).
The region is characterized by a Mediterranean climate under the Köppen–Geiger climate classification, with dry summers and wet winters. Precipitation is generated by wet air masses that arrive predominantly from the Tyrrhenian Sea (i.e., in a southwest–northeast direction), and is strongly influenced by the interaction between the complex orography and proximity to the sea [21]. The mean annual precipitation ranges from 800 to 1100 mm/year; the coastal and central mountainous areas show higher precipitation than the north-eastern inner side of the region. The maximum monthly precipitation values are recorded during November and December and the minimum during July and August. Concerning rainfall extremes, 24-h annual maxima occur mainly in November, while one-hour annual maxima are more frequent in September [22].
The extent of the region is of about 14,000 km2; there is considerable variability in population density within the region, from about 2500 people/km2 in the main city to about 900 people/km2 on the coast and about 100 people/km2 in the central and rural zones [23]. Many areas with a medium–high population density are characterized by complex topography and by steep slopes often covered by unsaturated layers of pyroclastic soils, due to the presence of the volcano that strongly erupted over the past year. These conditions have made certain zones of the region prone to rainfall-triggered hazards such as floods and landslides [24,25], especially during extreme events with a characteristic duration from sub-hourly to few hours. During recent decades there have been many human victims as well as economic damage due to short-duration extreme precipitation events.
Figure 1 shows the location of the region and its elevation map along with the position of the stations belonging to the rainfall monitoring network.
The current working rainfall network began operating in 2001 and is managed by the Hydro-Meteorological Service of the regional Civil Protection Department, which guarantees supervision, alert, and mitigation activities against flood and landslide risks generated by hydrometeorological events. Until the late 1990s, the rainfall monitoring network was controlled by the National Hydrographical Service (SIMN) for water management and scientific purposes. In the transition from the management of the SIMN to the regional Civil Protection Department, the historical network was partly abandoned and partly redesigned for new functions, primarily directed towards civil protection purposes [26].
Currently, there are about 160 automatic stations in Campania operated by the regional Civil Protection Department, with a mean coverage of about one station per 90 km2. However, the density of the network is quite uneven over the region (Figure 1). All of the new automatic stations show a record length of at least nine years. The acquisition of the rainfall data is made by automatic pluviometers providing collections of precipitation measures directly in digital format [10], with a time resolution of 10 min.
Figure 1 shows the stations formerly managed by the SIMN that have been either dismantled or replaced. For these historical mechanical stations, rainfall observations were recorded on paper strip charts. Rainfall data were published by the SIMN in hydrological annals containing annual daily rainfall measures along with statistics related to extreme rainfall. As the rainfall data must be manually extracted from the charts, the annual maximum rainfall for each station was evaluated at fixed durations of 1, 3, 6, 12 and 24 h. Thus, the highest temporal resolution was one hour, resulting in a lack of information for extreme events at shorter durations [10]. For certain very intense events, the SIMN provided the rainfall depths for durations shorter than one hour; however, it was not guaranteed that the published values at those sub-hourly durations were annual maxima.
Although the SIMN rainfall network was in place from 1921 to 1999, Figure 1 shows only those stations for which there were at least five years of maxima rainfall data; the size of this database consisted of 116 mechanical stations. For many other SIMN stations that are not included, only daily observations and daily maxima rainfall were available.
The databases from the newest automatic network and from the SIMN mechanical network are available at the website of the Hydro-Meteorological Service of the regional Civil Protection Department, http://centrofunzionale.regione.campania.it (accessed on 2 January 2022). The former database is constantly updated with daily observations, while the sub-daily data have to be requested; the latter are accessible through the SIMN annals. Table 1 reports the main statistics from these two databases, namely, the raw observed mean annual maxima rainfall time series at the automatic and mechanical stations used in this study.
The usefulness of integrating the information of the two networks is clear, considering that at a regional scale the density could increase by up to one station per 50 km2. The convenience becomes even greater considering that some areas, such as the north-western plains, are largely covered by the mechanical network alone.
2.2. Homogenizing Rainfall Maxima with Hershfield Factors
The first step in homogenizing the rainfall maxima recorded at the historical mechanical stations with the data available from the newest automatic stations consisted of applying correction factors, i.e., Hershfield Factors (HFs) [27], in order to consider the different time resolutions of the two datasets. The first application of Hershfield Factors was performed in the context of a large analysis of extreme precipitation in the United States; on that occasion, Hershfield [27] considered a correction factor of 1.13 when homogenizing the daily maximum rainfall computed from fixed daily observations with the 24-h maximum rainfall obtained from sliding windows of the same duration (i.e., daily) in a one-hour resolution database.
A similar correction was needed here, as the time resolution of the database from the historical mechanical stations is coarser (i.e., one hour) than the time resolution of database from the newest automatic stations (i.e., ten minutes). The annual maximum rainfall records in the historical database were then computed with a time interval shifted with a step of one hour, resulting in a systematic underestimation of the annual maximum rainfall in the historical database compared to analogous statistics obtained from data recorded at the 10-min resolution by the automatic stations [8].
The correction factors were computed here by aggregating the rainfall observations recorded by the newest automatic stations at a one-hour time resolution at fixed local times in order to simulate same-time resolution of the historical database. Then, the HFs for the fixed duration of the maximum annual rainfall at the mechanical stations were calculated by averaging the ratios at each automatic station between the annual maxima computed with the ten-minute resolution and the corresponding annual maxima computed with the one-hour resolution. Table 2 shows the average values of the Hershfield Factors (or Sampling Adjustment Factors) for the Campania region, which are in accordance with other studies conducted in other regions of Italy [13,28]. As expected, the HFs are significant only for the annual maxima at the one-hour duration and become smaller at greater durations, for which the different discretization between the two databases becomes negligible.
2.3. Estimation of the Mean Values of the Annual Rainfall Maxima
A key step for the characterization of annual rainfall maxima in regional frequency analyses is the assessment of the behavior and values of their means. For this purpose, the relationship between the mean annual maximum rainfall and the duration was investigated. Below, the mean annual maximum rainfall at a given duration is named .
When only maxima between one hour and 24 h are analyzed, the relation between (mm) and (hour) can be well approximated by a power law with two parameters, as follows:
where (mm) is an estimate of the mean annual maximum rainfall at one hour and is a scale exponent that combines all durations.
The parameters and of the power law in Equation (2) can be assessed by applying the Ordinary Least Squares (OLS) method to the resulting linear regression of the logarithms of the annual maximum rainfall between one hour and 24 h versus the logarithms of the duration.
According to Equation (2), rainfall intensity tends to infinity as duration reduces toward zero; that in many applications where the interest concerns very small durations it tends to overestimate the mean annual maxima rainfall. Thus, another relation for the DDF curves is often used for predicting the rainfall maxima within a wider range of durations [29], as follows:
where is an estimate of the mean annual maximum rainfall intensity as duration approaches to zero and (hour) and are other model parameters.
For a given value of , Equation (3) is a linear equation in the log–log plane; thus, parameters and can be estimated through the OLS method and the optimal triplet can be chosen corresponding to the value of that maximizes the coefficient of determination.
Parameters of Equation (3) can be estimated only if sub-hourly annual maximum rainfall data are available, as they are for the automatic stations of the newest monitoring network in the region. The rainfall maxima estimated with Equation (3), the parameters of which were directly retrieved by fitting the mean annual rainfall maxima observed at automatic weather stations, are referred to below as best estimate(s).
2.4. A New Hybrid Regional Procedure for Estimating Mean Annual Maximum Rainfall
Here, a new regional procedure is proposed for assessing the three parameters in Equation (3) by exploiting only annual rainfall maxima between one hour and 24 h, allowing the estimation of those parameters for sites where only a mechanical station has been present, or when only an hourly time resolution database is available for other reasons.
The annual rainfall maxima observed at the 160 automatic stations of the regional Civil Protection Department are available with 10-min resolution, and were exploited in order to identify the following regression equation between parameters and :
where and are coefficients of the regression model and is an estimation of using the computed value of at the site of interest.
Then, is applied in Equation (3) and parameters and are estimated by fitting the mean annual maxima rainfall between one hour and 24 h.
This procedure is referred to here as the hybrid regional procedure, and the resulting estimate of the mean annual maximum rainfall is referred to as the hybrid regional estimate. The procedure requires both a regional study (in order to determine the parameter , i.e., calibration) and observations of annual maxima rainfall between one hour and 24 h at the site of interest (in order to complete the assessment of the parameters and ). The added value of the proposed procedure is that two databases containing annual maxima recorded via different monitoring technologies are combined, enhancing the reliability of sub-hourly maxima rainfall estimates within a poorly gauged region.
2.5. Performance Estimation
The performance of the proposed hybrid regional procedure was evaluated by recursively applying it at the 160 automatic stations of the regional Civil Protection Department where rainfall maxima from 10 min to 24 h were available. The predicted hybrid regional mean annual maxima (i.e., hybrid regional estimates) were compared with the corresponding best estimates.
The performance of the proposed hybrid methodology was evaluated in comparison with values obtained by spatially interpolating the corresponding best estimates into the surrounding automatic weather stations. The spatial interpolation of the best estimates was taken as a possible alternative to the proposed hybrid regional procedure for estimating the mean annual maximum rainfall at sub-hourly durations at sites where only an hourly time resolution database existed. Among other alternatives, spatial interpolation of rainfall maxima with ordinary kriging [30,31] was chosen as it is a valid technique and widely employed in the literature (i.e., [32,33]); Other geostatistical methods such as co-kriging and universal kriging were tested as well, however, their use was discarded after no significant correlations were found between sub-hourly mean annual rainfall maxima and other auxiliary external topographic variables such as elevation [34]. The performance of the kriging estimator was assessed by means of the cross-validation method [21,31,32]. This method of validation is based on a jackknife kriging estimate of the variable of interest at a sampling site obtained by applying the kriging interpolator to the observations available at the remaining sampling sites (i.e., leave-one-out cross-validation).
Finally, the performances of the different procedures used for estimating the mean values of the annual rainfall maxima were expressed in terms of absolute percentage error (APE %) for each duration at each automatic station site, as follows:
where is the observed mean value of the annual maximum rainfall at a given duration and location compared with , the predicted value of the same quantity.
Then, the performances were averaged along all the sub-hourly durations using the mean absolute percentage error (MAPE %), computed as follows:
where is the number of durations analyzed at each location, is the observed mean value of the annual maximum rainfall at a given duration and location compared with , the predicted value of the same quantity.
MAPE and APE define the prediction errors as a percentage of the observed value (assumed to be true), and their values may vary from 0 to 100%. The use of these statistical indices allows for comparing errors in estimation of mean maxima at different durations (here, from 10 to 50 min), providing insight into both the accuracy and the precision of the estimates.
3. Results
3.1. Calibration of the Hybrid Regional Procedure for Estimating Mean Annual Maximum Rainfall
The proposed regional procedure for estimating the mean annual maximum rainfall at sub-hourly durations while only exploiting rainfall data at hourly resolution requires regional calibration with rainfall observations at a 10-min resolution. This calibration was conducted to determine the regression coefficients of Equation (4) with data from the automatic stations in the region.
The coefficients of Equation (4) were estimated through the OLS method applied to the pairs of parameters and assessed at each automatic station by interpolating, respectively, Equation (3) with annual maximum rainfall data at resolutions from 10 min to 24 h and Equation (2) with annual maximum rainfall data at resolutions from one hour to 24 h.
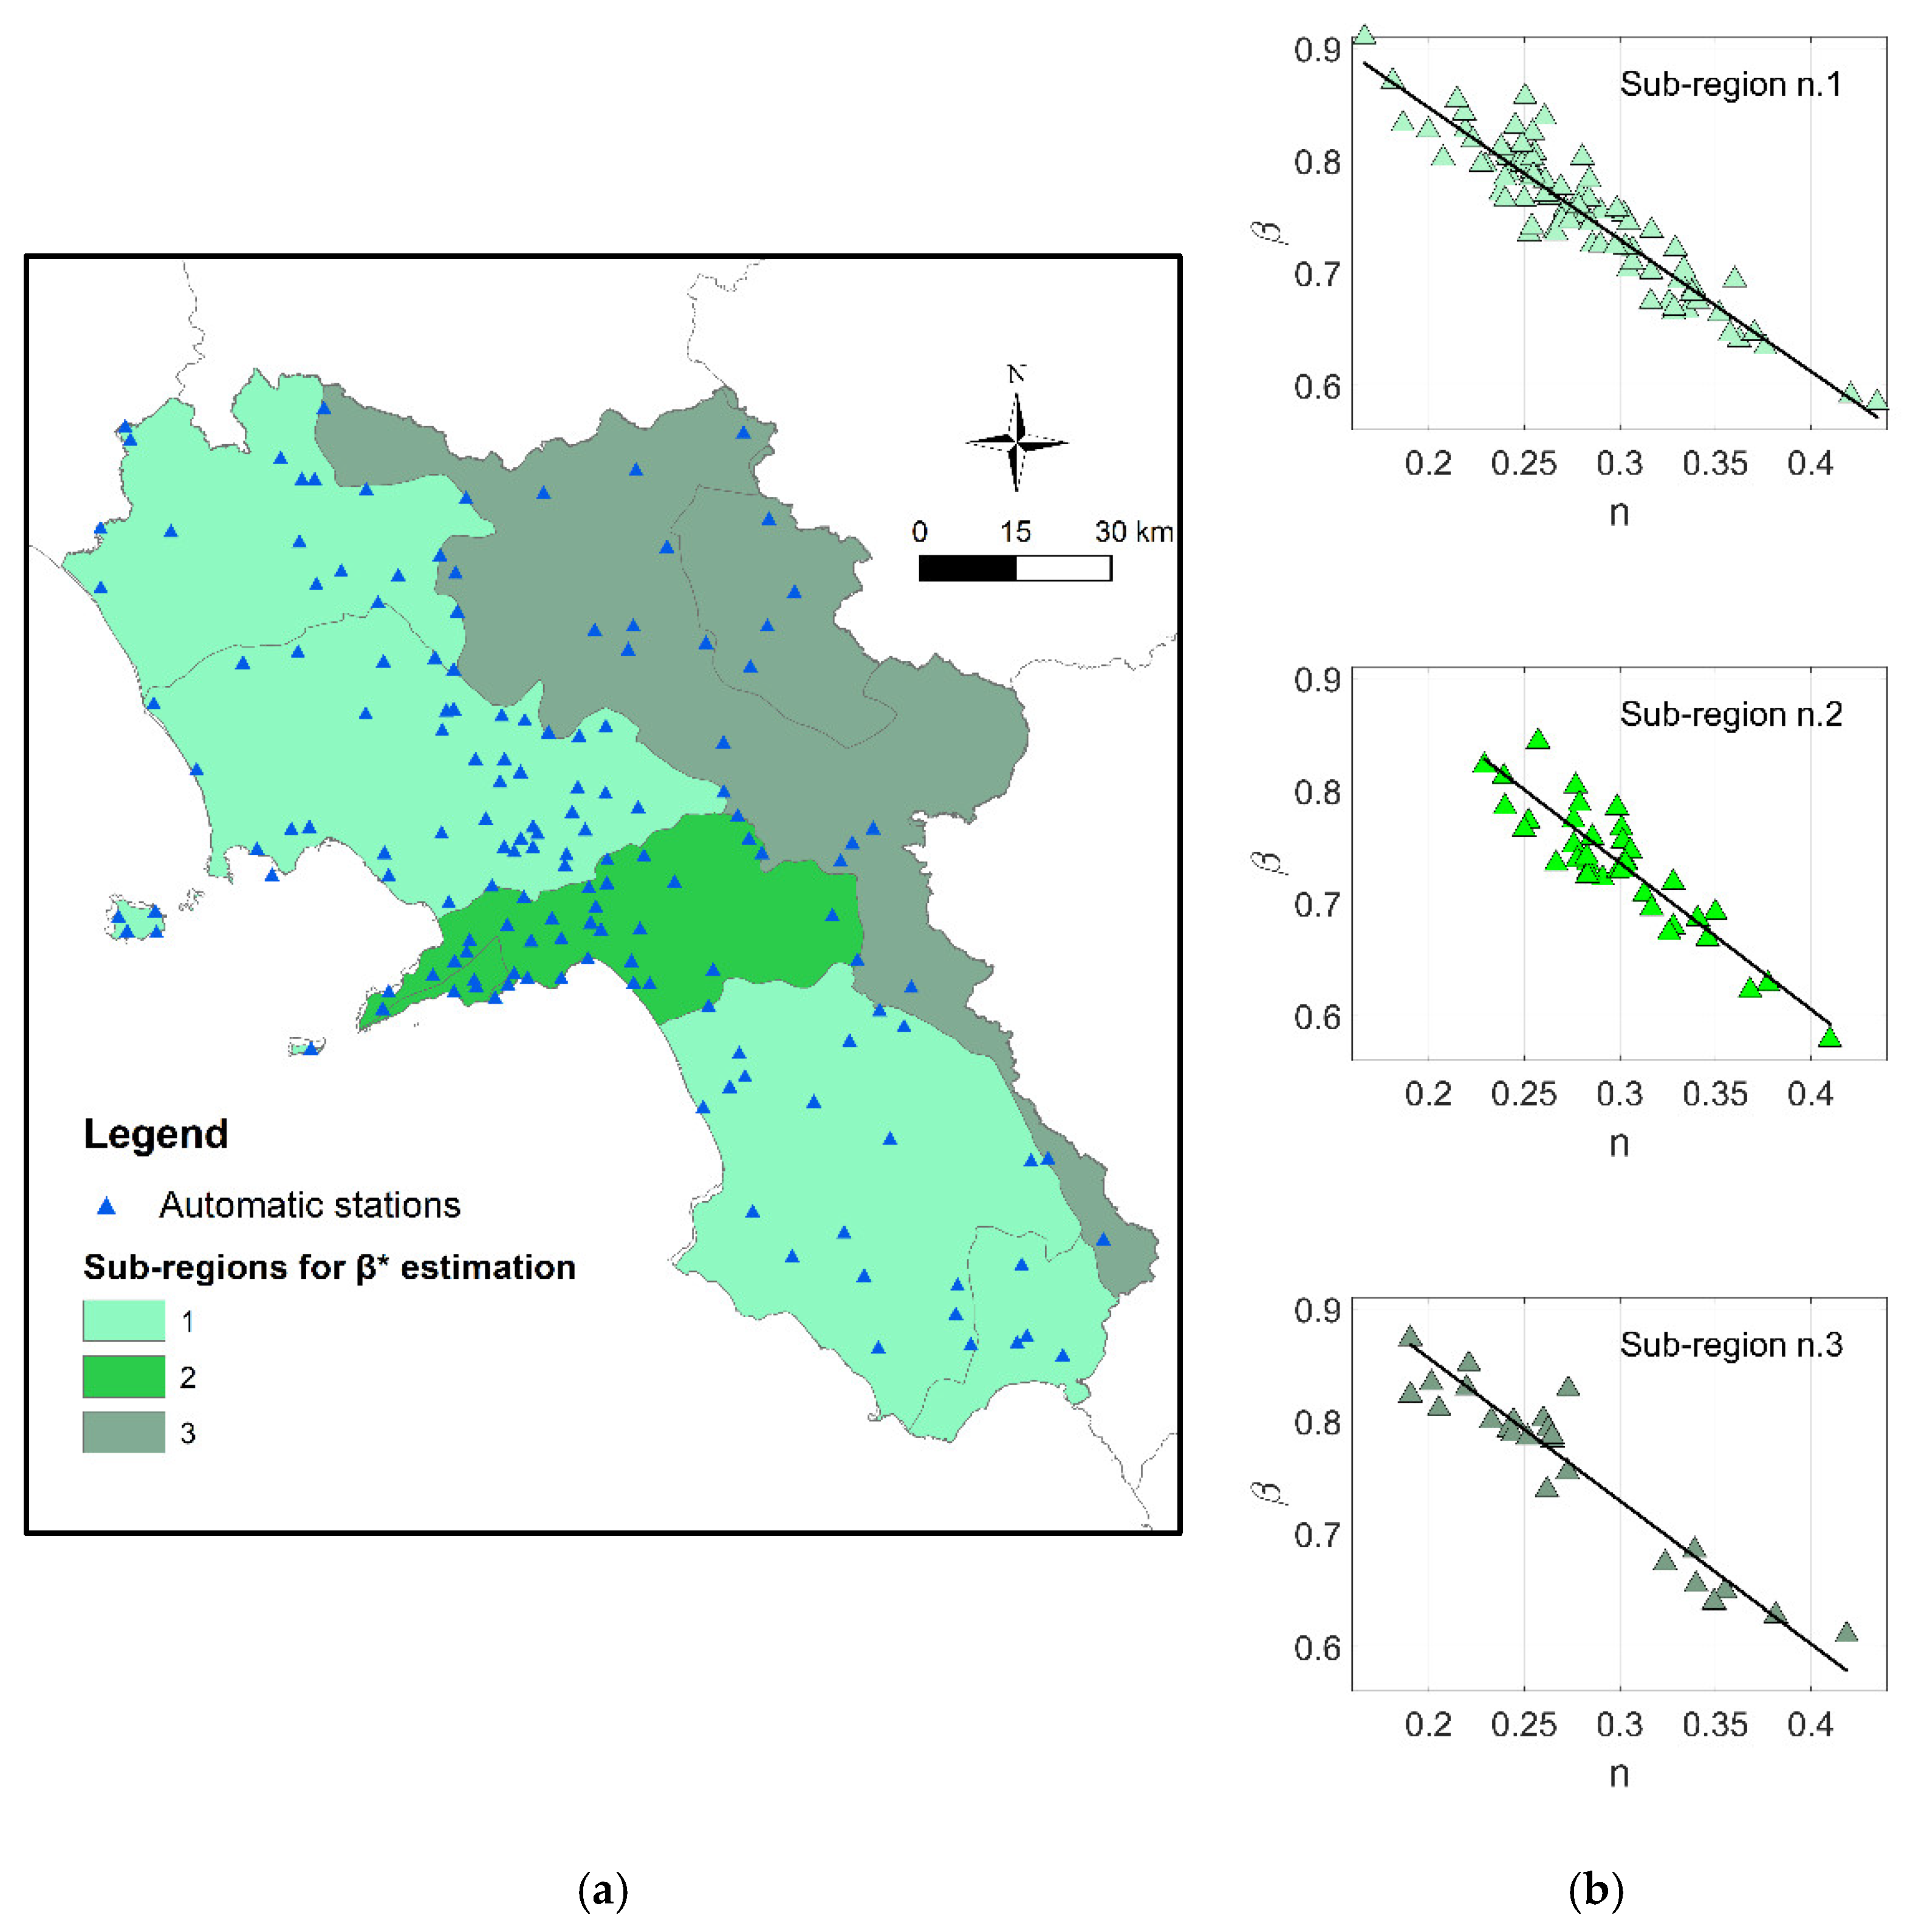
Three main subregions were identified based on a cluster analysis used to optimize the correlation between and . These regions are shown in Figure 2a, along with the automatic stations used for the analysis. The individuation of clusters started from the homogeneous subregions of rainfall extremes as part of the above-mentioned VAPI project [19]. The central part of the Campania region is characterized by the presence of orographic barriers (Figure 1) that divide the two coastal subregions (n.1-2) and the inner subregion (n.3). Subregion n.2, unlike the other coastal sub-region (n.1), is characterized by a complex topography with characteristic exposure to the wet air masses that predominantly arrive from the SW-NE direction (Figure 1) [35].
Figure 2b shows the linear regressions between and for the three subregions. Table 3 reports the coefficients of the regressions along with the coefficients of determination, which demonstrate good correlation between the two variables in all the defined subregions, as the correlation coefficients are close to 1 and always greater than 0.79.
Having defined the coefficients of Equation (4) through a regional analysis, the relation between and allows estimation of parameter while exploiting only local data at hourly resolution.
The empirical coefficients of Table 3, which are close to 1 for g1 and −1 for g2, confirm that can be interpreted as a scaling parameter of the phenomenon in question.
3.2. Performace Evaluation
Here, the performance of the new proposed hybrid regional procedure for estimating the mean annual maxima rainfall at sub-hourly durations is evaluated by means of the absolute percentage error, APE (Equation (5)) and mean absolute percentage error, MAPE (Equation (6)). These performance indicators were compared with those of the best estimates retrieved from the 10-min resolution data. All performances refer to the set of 160 automatic stations operated by the regional Civil Protection Department.
In addition, the performance of the proposed approach was evaluated by comparing its results with those obtained via spatial interpolation of the best estimate at those sites where no sub-hourly observations were available. Spatial interpolation was achieved by ordinary kriging, as the mean annual maxima rainfall at sub-hourly durations, as expected, showed no significant correlation with auxiliary external topographic variables [34,36]. The correlation of mean annual maximum rainfall and elevation is important at daily scales [21,35]; however, it is weak at smaller time scales. A geostatistical cross-validation procedure was designed and applied to evaluate the performance of the kriging estimate according to the leave-one-out technique.
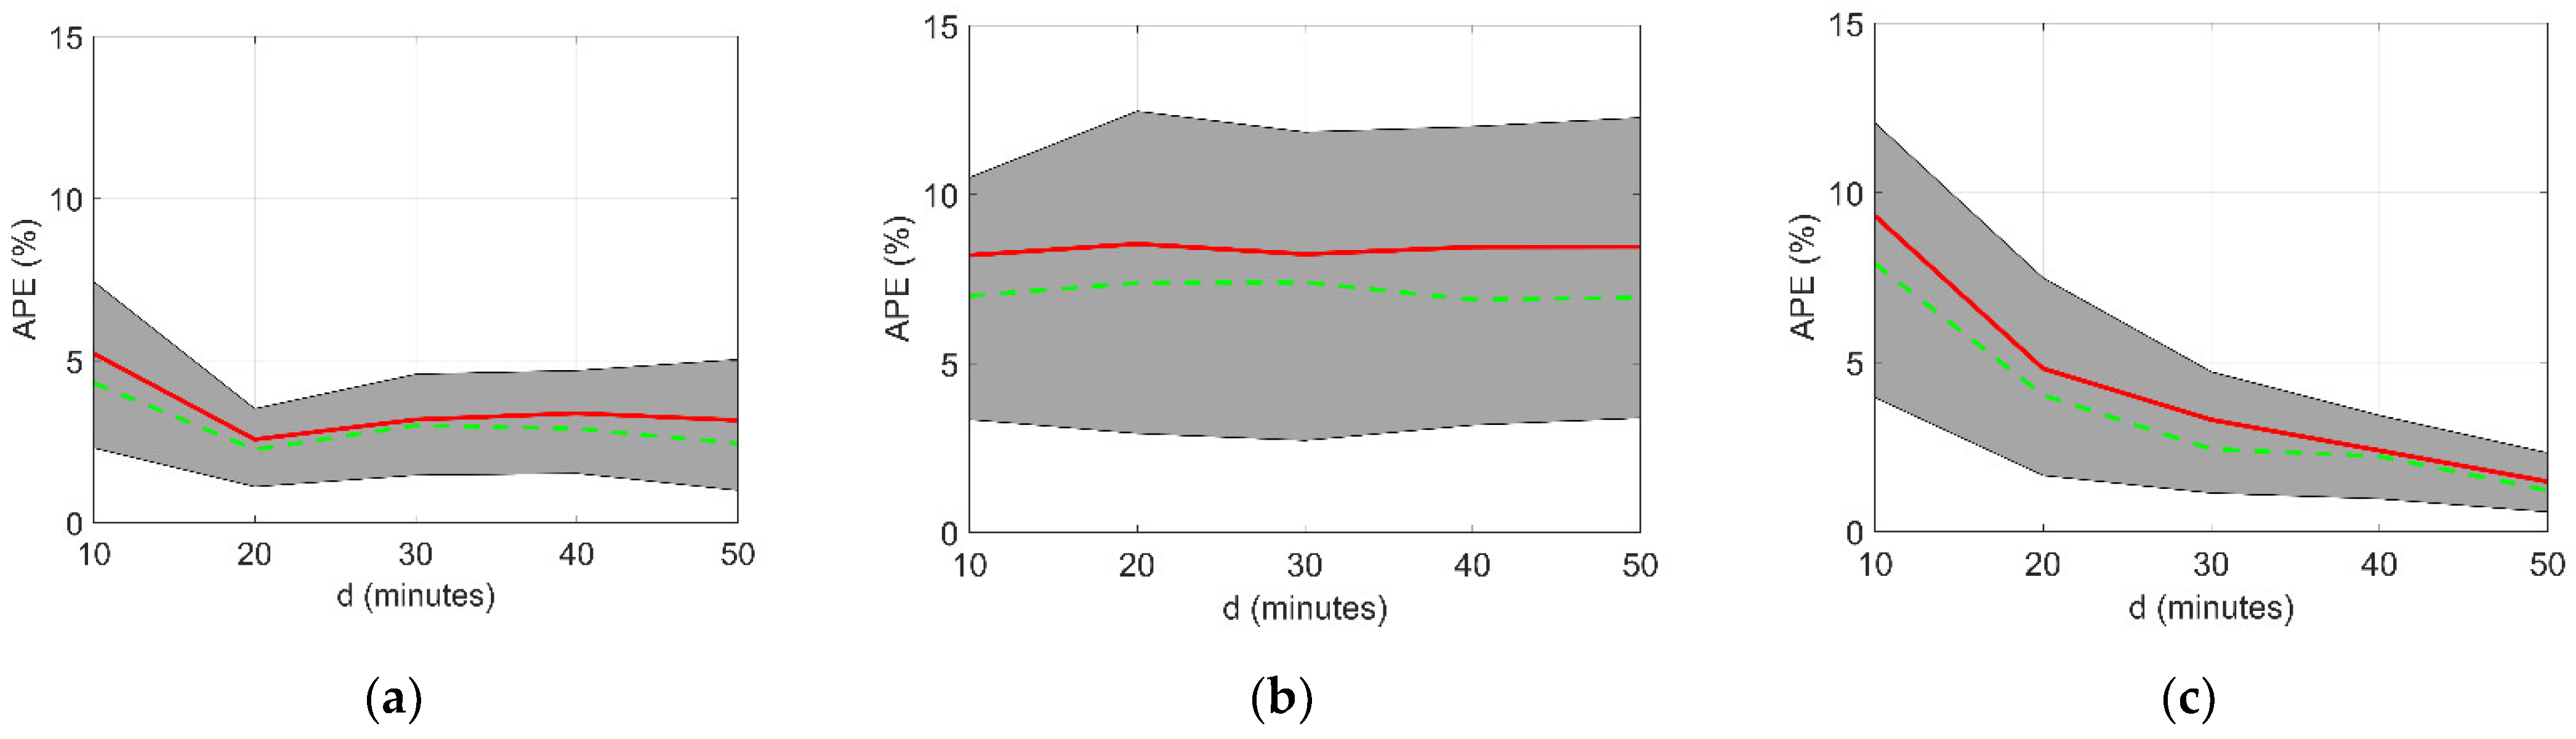
Figure 3 shows the performances of the new hybrid regional procedure (Figure 3c) compared with those of the best approach (Figure 3a) and kriging assessment (Figure 3b) for estimating the mean annual maximum rainfall at sub-hourly durations. The performance variability among the 160 automatic stations available in the region is presented in Figure 3 through the grey area, representing the values between the 25th and 75th percentiles of the absolute percentage errors at each duration. The mean and median absolute percentage errors at each duration are shown with red and green lines, respectively. The 75th percentiles of the APE related to the hybrid regional procedure are always lower than 12%, with a peak reached at 10 min, while the 75th percentiles of the APE of the kriging interpolation present a constant pattern, with a peak value of 12.5% at 20 min. The best estimates corresponding to 10 min show maximum 75th percentiles of APE across the region equal to 7.5%. The mean values of the APE of the hybrid regional estimates across the region range from 9.3% at 10 min to 1.65% at 50 min; the same quantities for the kriging estimates remain essentially constant along the durations and equal to 8.5%. As concerns the best estimates, the mean values along the region of the APE range from 5.2% at 10 min to 2.6% at 20 min.
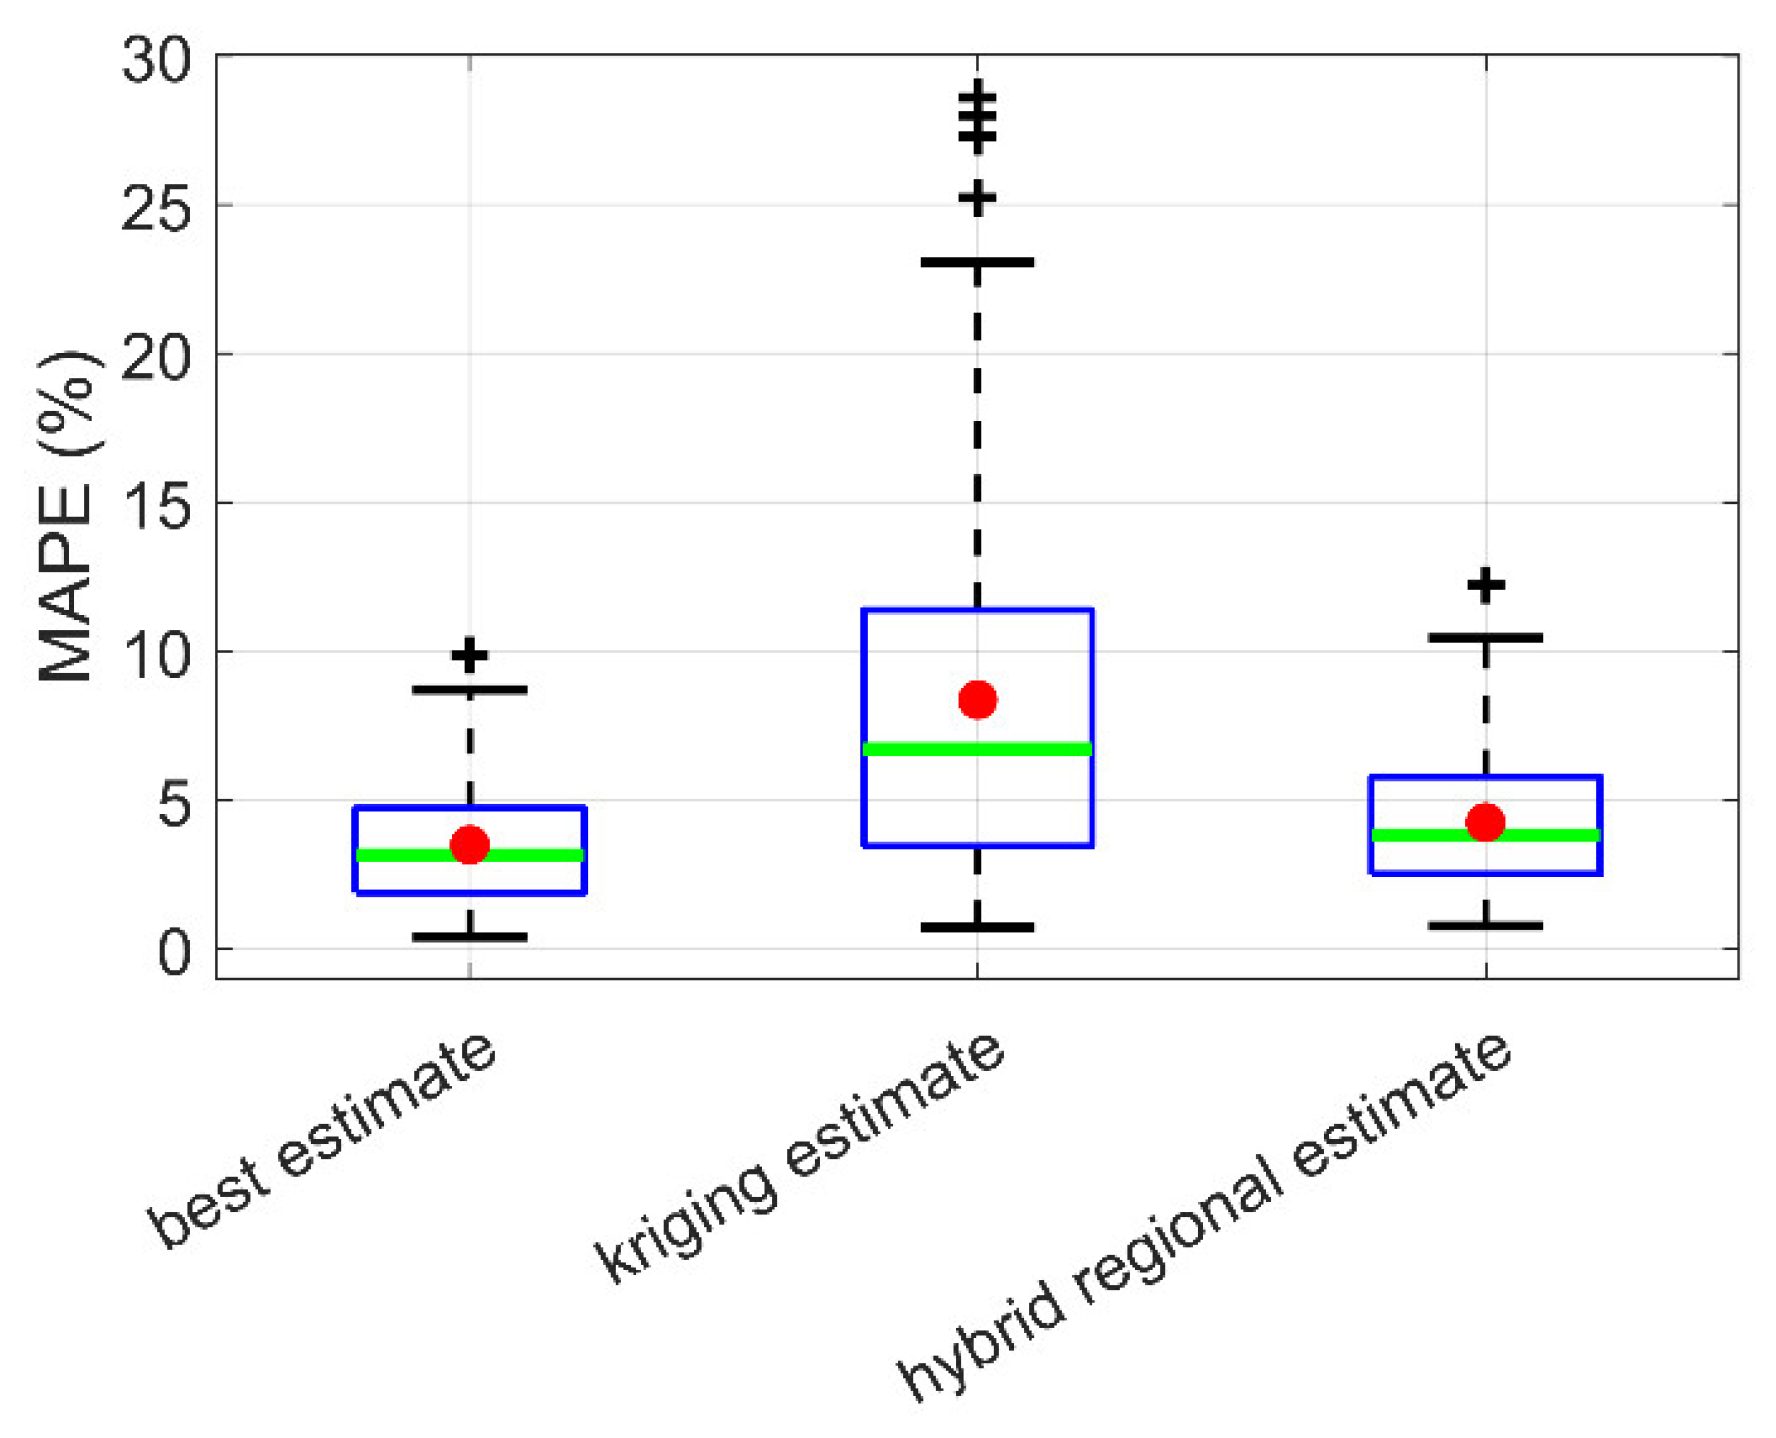
Figure 4 presents a summary of the performances averaged across all durations for the three considered approaches. The mean regional MAPE at sub-hourly durations varies from 3.5% for the best estimate to 8.4% for the kriging estimate. The hybrid regional procedure shows a mean regional MAPE at sub-hourly durations equal to 4.3%, very close to that of the best estimate and almost half that of the alternative approach.
At sub-hourly durations, the only outlier in the best estimate approach is due to the overestimation of the observed mean value of annual maximum at 10 min for an automatic station located in a plane area of the region. The only outlier shown by the new hybrid regional procedure is due to a systematic overestimation of the mean values at all sub-hourly durations in a foothills area. Both outliers refer to overestimation errors that, for the purposes of the current analysis, are conservative; thus, no actions or corrections are needed. The four outliers in the kriging estimate concern sites located in areas characterized by peculiar local topographical conditions that affect the observations. However, in these cases the estimation errors are conservative as well, as the kriging estimator overestimates the observed value.
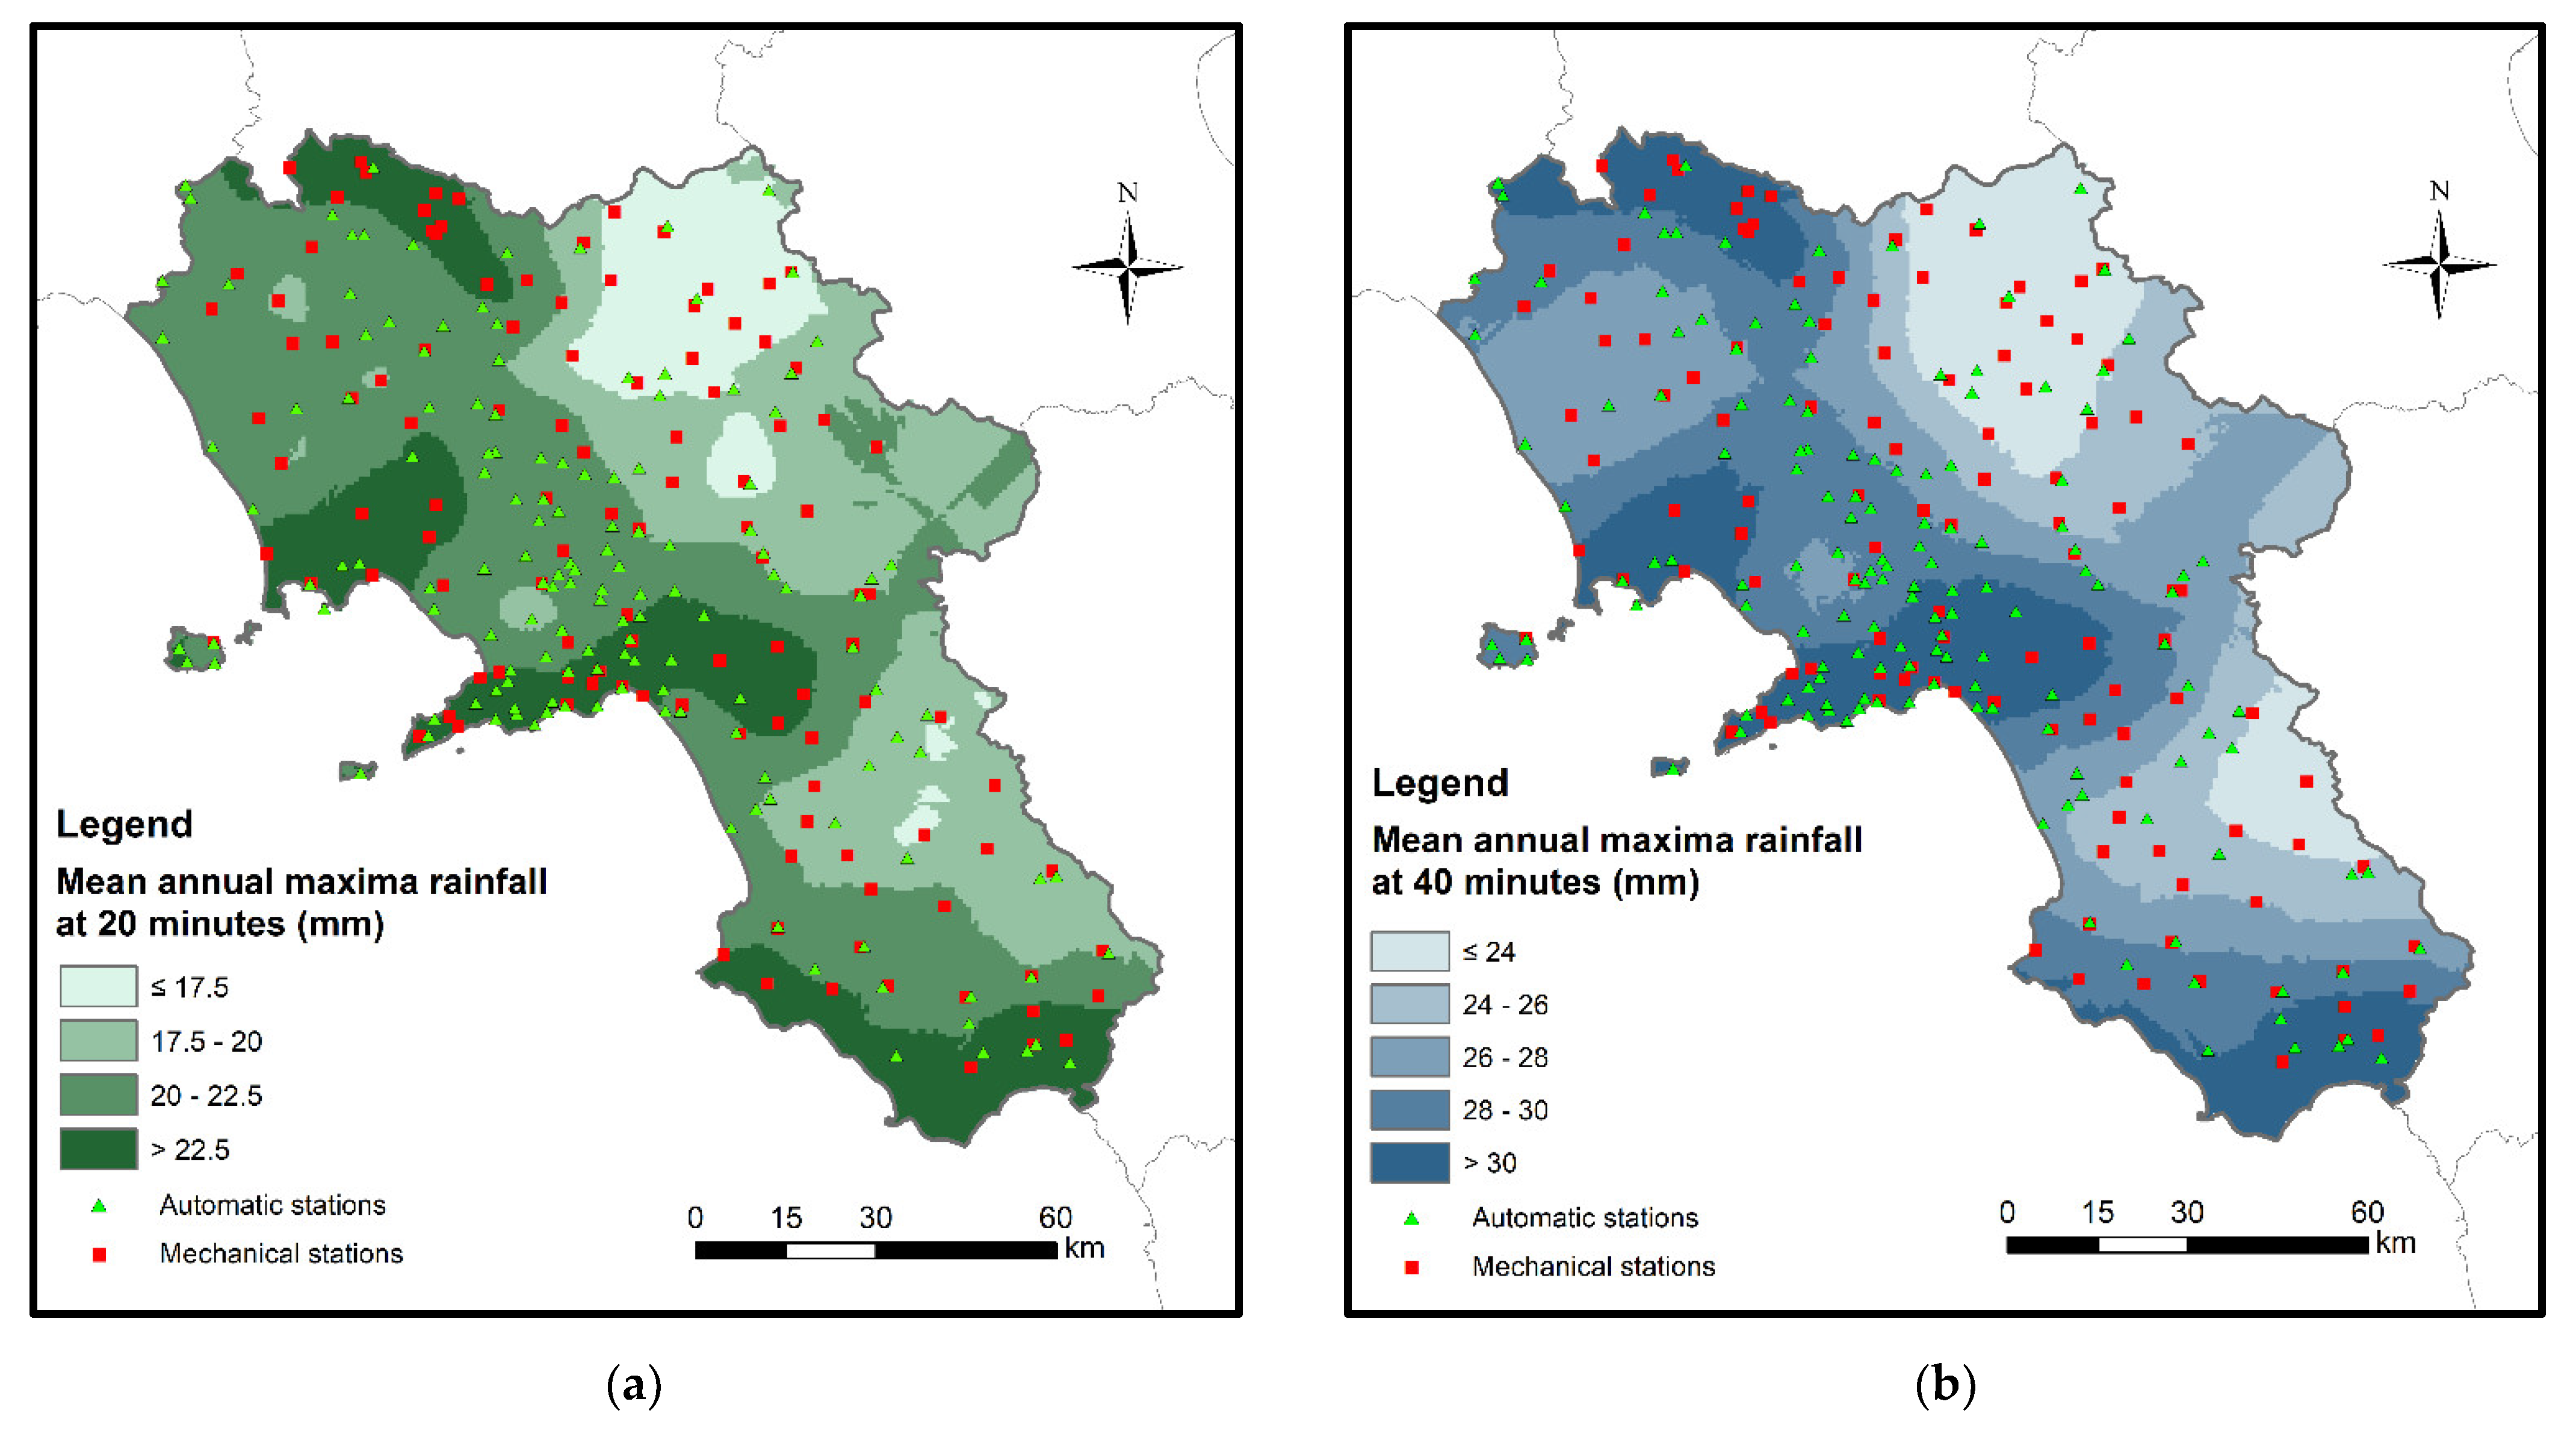
The combination of mechanical and automatic stations in the proposed hybrid approaches allows more reliable maps of mean annual rainfall maxima at sub-hourly scales to be obtained for the study region; an example is shown in Figure 5. The mechanical stations, in fact, provide additional information in those portions of study region where the density of the automatic stations is low. Figure 5 shows examples of maps of mean annual rainfall maxima at two sub-hourly durations, 20 and 40 min, obtained from ordinary kriging applied to the unified database of mechanical and automatic stations.
4. Discussion
Many Mediterranean areas are exposed to risk generated by extreme rainfall events at sub-hourly scales, which can produce devastating flash floods and debris flows. Frequency analysis of these extreme events is fundamental for designing risk mitigation plans. This need is hindered by a lack of rainfall time series at small time scales. Today, the majority of rainfall time series remain composed of data from mechanical stations with a time resolution of one hour. Only in this century have rainfall databases begun to be populated by data at higher resolutions recorded by automatic stations.
Mechanical and automatic stations, from a scientific perspective, have to be considered as different observation systems. Combining the time series recorded by an older mechanical station with the time series recored by a newer automatic station has to be carried out with caution, even if the general location of the two stationsis the same.
Neverthless, the data from mechanical stations represent an important source of information that cannot be simply discarded in favor of the data collected by the automatic stations.
The majority of automatic stations in many Mediterranean areas began operating shortly after the beginning of this century. Thus, the size of this database is too small to support robust statistical inferences at the extremes.
Scientific research should therefore be oriented to identify feasible and reliable methods for retrieving valuable information from the time series of the mechanical stations by leveraging the information provided by the automatic stations.
First, preliminary preprocessing of the data collected by the mechanical rain gauges is required, especially if interest is on the analysis of annual rainfall maxima at short durations. The easiest approach is the application of a simple scaling factor such as the Hershfield Factor (HF), calibrated by analyzing the data collected by the automatic stations at the same time resolution as the mechanical stations. The use of HF factors for correcting rainfall maxima databases originating from observations with a time resolution coarser than the most recent observations is a common practice [8,28] and aids in exploiting past observations for the sake of robusteness while avoiding underestimation biases due to outdated observation systems. Moreover, the application of the HF allows removal of any spurious trends that may be observed when time series of annual maxima from mechanical and automatic stations are combined. In this case study, the estimated HF made it possible to correct a systematic negative bias of 13% for annual maxima at the one-hour scale. Another limitation of the data recorded by mechanical stations is that they do not resolve the temporal patterns in rainfall at time intervals smaller than one hour, hindering the possibility of assessing the statistics regarding rainfall extremes at sub-hourly intervals, which is relevant for studying flash floods and debris flow hazards. Thus, after correction with the HF a specific regional procedure has to be adopted in order to exploit observed rainfall data at a one-hour resolution for extreme rainfall frequency anlysis at shorter durations in those sites where only a mechanical station is available. In the framework of the VAPI project, this was achieved by decoupling the dependence of annual rainfall maxima on duration from the dependency on the return period using the index-rainfall approach; in this way, the mean annual maximum rainfall at different durations became the key variable in the present study. The higher-order parameters of the probability distribution of annual rainfall maxima were then assumed to be constant with the duration. However, in a more general context under the assumption of wide sense simple scaling, it is always possible to link the parameter controlling the scaling exponent to suitable statistics available at partially-gauged sites [28]. Under this assumption, Similar methods were combined with the GEV distribution and applied in Sicily by Bonaccorso et al. [28]; in that study, the authors linked the scaling exponent to the median value of the annual maximum rainfall at the one-hour duration.
5. Concluding Remarks
In this study, an original methodology for exploiting the data from mechanical stations in combination with the data from automatic stations was proposed for improving the capability to predict the first moment of the annual maximum rainfall for a given region at sub-hourly scales. By analysing the annual rainfall maxima recorded by the automatic stations, a correlation between two parameters controlling the shape factor of the law expressing the variation of the mean annual maximum rainfall with the duration was found: parameter “n” controls the shape of the law for durations longer than one hour, and parameter “β” controls the shape of the law for durations both shorter and longer than one hour.
Once the dependencies “n” and “β” are found at regional scale, it is possible to exploit the data from mechanical stations to assess rainfall extremes at sub-hourly scales. We have called this approach the hybrid regional procedure to emphasize that the procedure is based on data from two different observational systems.
The performance of the procedure was evaluated in the Campania region, where the spatial distribution of the automatic stations is uneven and where the former mechanical stations were more uniformly distributed. It was found that the proposed hybrid regional procedure provides estimates with an accuracy similar to that obtained with high resolution data, referred to as “best estimates”. Furthermore, it was found that the proposed hybrid regional procedure outperforms the estimates that could be achieved by spatially interpolating the best estimates at the mechanical stations.
Further studies will be devoted to assessing whether similar approaches can be applied to assess higher-order moment statistics at the regional scale.
Author Contributions
Conceptualization, A.P., G.B.C. and P.V.; methodology, A.P. and G.B.C.; software, A.P.; validation, A.P., G.B.C., P.F. and P.V.; formal analysis, A.P.; investigation, A.P.; resources, A.P.; data curation, A.P.; visualization, A.P.; writing—original draft preparation, A.P.; writing—review and editing, G.B.C., P.F. and P.V.; supervision, G.B.C. and P.V. All authors have read and agreed to the published version of the manuscript.
Funding
This research received no external funding.
Institutional Review Board Statement
Not applicable.
Informed Consent Statement
Not applicable.
Data Availability Statement
The data analyzed during the current study are freely available from the website http://centrofunzionale.regione.campania.it (accessed on 2 January 2022).
Conflicts of Interest
The authors declare no conflict of interest.
References
- Borga, M.; Anagnostou, E.N.; Blöschl, G.; Creutin, J.-D. Flash floods: Observations and analysis of hydro-meteorological controls. J. Hydrol. 2010, 394, 1–3. [Google Scholar] [CrossRef]
- Preti, F.; Forzieri, G.; Chirico, G.B. Forest cover influence on regional flood frequency assessment in Mediterranean catchments. Hydrol. Earth Syst. Sci. 2011, 15, 3077–3090. [Google Scholar] [CrossRef] [Green Version]
- Grodek, T.; Jacoby, Y.; Morin, E.; Katz, O. Effectiveness of exceptional rainstorms on a small Mediterranean basin. Geomorphology 2012, 159–160, 156–168. [Google Scholar] [CrossRef]
- Santangelo, N.; Forte, G.; De Falco, M.; Chirico, G.B.; Santo, A. New insights on rainfall triggering flow-like landslides and flash floods in Campania (Southern Italy). Landslides 2021, 18, 2923–2933. [Google Scholar] [CrossRef]
- Chirico, G.B.; Grayson, R.B.; Western, A.W. A downward approach to identifying the structure and parameters of a process-based model for a small experimental catchment. Hydrol. Process. 2003, 17, 2239–2258. [Google Scholar] [CrossRef]
- Gioia, A.; Lioi, B.; Totaro, V.; Molfetta, M.G.; Apollonio, C.; Bisantino, T.; Iacobellis, V. Estimation of peak discharges under different rainfall depth–duration–frequency formulations. Hydrology 2021, 8, 150. [Google Scholar] [CrossRef]
- Hosking, J.R.M.; Wallis, J.R. The effect of intersite dependence on regional frequency analysis. Water Resour. Res. 1988, 241, 588–600. [Google Scholar] [CrossRef] [Green Version]
- Morbidelli, R.; Saltalippi, C.; Flammini, A.; Cifrodelli, M.; Picciafuoco, T.; Corradini, C.; Casas-Castillo, M.C.; Fowler, H.J.; Wilkinson, S.M. Effect of temporal aggregation on the estimate of annual maximum rainfall depths for the design of hydraulic infrastructure systems. J. Hydrol. 2017, 554, 710–720. [Google Scholar] [CrossRef] [Green Version]
- Morbidelli, R.; García-Marín, A.P.; Al Mamun, A.; Atiqur, R.M.; Ayuso-Muñoz, J.L.; Bachir Taouti, M.; Baranowski, P.; Bellocchi, G.; Sangüesa-Pool, C.; Bennett, B.; et al. The history of rainfall data time-resolution in different geographical areas of the world. J. Hydrol. 2020, 590, 125258. [Google Scholar] [CrossRef]
- Deidda, R.; Mascaro, G.; Piga, E.; Querzoli, G. An automatic system for rainfall signal recognition from tipping bucket gage strip charts. J. Hydrol. 2007, 333, 400–412. [Google Scholar] [CrossRef]
- Libertino, A.; Ganora, D.; Claps, P. Evidence for increasing rainfall extremes remains elusive at large spatial scales: The case of Italy. Geophys. Res. Lett. 2019, 46, 7437–7446. [Google Scholar] [CrossRef]
- Papalexiou, S.M.; Dialynas, Y.G.; Grimaldi, S. Hershfield factor revisited: Correcting annual maximum precipitation. J. Hydrol. 2016, 524, 884–895. [Google Scholar] [CrossRef]
- Morbidelli, R.; Saltalippi, C.; Dari, J.; Flammini, A. Effect of time-resolution of rainfall data on trend estimation for annual maximum depths with a duration of 24 h. Water 2021, 13, 3264. [Google Scholar] [CrossRef]
- Montanari, A.; Koutsoyiannis, D. Modeling and mitigating natural hazards: Stationarity is immortal! Water Resour. Res. 2014, 50, 9748–9756. [Google Scholar] [CrossRef]
- Rossi, F.; Villani, P. A project for regional analysis of flood in Italy. In Coping with Floods; Rossi, G., Harmancioglu, N., Yevjevich, V., Eds.; Kluwer Academic: Dordrecht, The Netherlands, 1994; pp. 227–251. [Google Scholar]
- Dalrymple, T. Flood-Frequency Analyses, Manual of Hydrology: Part 3; Water Supply Paper 1543-A; USGS: Washington, DC, USA, 1960. [Google Scholar]
- Basu, B.; Srinivas, V.V. Evaluation of the index-flood approach related regional frequency analysis procedures. J. Hydrol. Eng. 2015, 21, 4015052. [Google Scholar] [CrossRef]
- Forestieri, A.; Lo Conti, F.; Blenkinsop, S.; Cannarozzo, M.; Fowlerband, H.J.; Noto, L.V. Regional frequency analysis of extreme rainfall in Sicily (Italy). Int. J. Climatol. 2018, 38 (Suppl. 1), e698–e716. [Google Scholar] [CrossRef]
- Rossi, F.; Villani, P. Valutazione delle Piene in Campania; CNRGNDCI, Pubbl. N. 1472; Grafica Metelliana & C.: Cava de’ Tirreni, Italy, 1995. [Google Scholar]
- Pelosi, A.; Furcolo, P.; Rossi, F.; Villani, P. The characterization of extraordinary extreme events (EEEs) for the assessment of design rainfall depths with high return periods. Hydrol. Process. 2020, 34, 2543–2559. [Google Scholar] [CrossRef]
- Furcolo, P.; Pelosi, A.; Rossi, F. Statistical identification of orographic effects in the regional analysis of extreme rainfall. Hydrol. Process. 2016, 30, 1342–1353. [Google Scholar] [CrossRef]
- Diodato, N.; Chirico, G.B.; Romano, N. Monthly Erosive Storm Hazard Within River Basins of the Campania Region, Southern Italy. In Storminess and Environmental Change. Advances in Natural and Technological Hazards Research; Diodato, N., Bellocchi, G., Eds.; Springer: Dordrecht, The Netherlands, 2014; Volume 39. [Google Scholar] [CrossRef] [Green Version]
- ISTAT. Available online: http://dati.istat.it/Index.aspx?QueryId=18563 (accessed on 10 January 2022).
- Ciervo, F.; Papa, M.; Medina, V.; Bateman, A. Simulation of flash floods in ungauged basins. J. Flood Risk Manag. 2015, 8, 343–355. [Google Scholar] [CrossRef]
- Calvello, M.; Papa, M.N.; Pratschke, J.; Nacchia Crescenzo, M. Landslide risk perception: A case study in Southern Italy. Landslides 2016, 13, 349–360. [Google Scholar] [CrossRef]
- Pelosi, A.; Villani, P.; Chirico, G.B. Rainfall Extraordinary Extreme Events (EEEs) Frequency and Magnitude Assessment: The EEE Occurred on 14th–15th October 2015 in Benevento Area (Southern Italy). In Proceedings of the Computational Science and Its Applications—ICCSA 2021, Cagliari, Italy, 13–16 September 2021; Volume 12950, pp. 264–278. [Google Scholar]
- Hershfield, D.M. Technical Paper No. 40: Rainfall Frequency Atlas of the United States; Department of Commerce, Weather Bureau: Washington, DC, USA, 1961.
- Bonaccorso, B.; Brigandì, G.; Aronica, G.T. Regional sub-hourly extreme rainfall estimates in Sicily under a scale invariance framework. Water. Resour. Manag. 2020, 34, 4363–4380. [Google Scholar] [CrossRef]
- Di Baldassarre, G.; Brath, A.; Montanari, A. Reliability of different depth-duration-frequency equations for estimating short duration design storms. Water Resour. Res. 2006, 42, 1–6. [Google Scholar] [CrossRef]
- Journel, A.G.; Huijbregts, C.J. Mining Geostatistics; Academic Press: London, UK, 1978. [Google Scholar]
- Cressie, N. Statistics for Spatial Data; John Wiley and Sons: New York, NY, USA, 1993. [Google Scholar]
- Pelosi, A.; Terribile, F.; D’Urso, G.; Chirico, G.B. Comparison of ERA5-land and UERRA MESCAN-SURFEX reanalysis data with spatially interpolated weather observations for the regional assessment of reference evapotranspiration. Water 2020, 12, 1669. [Google Scholar] [CrossRef]
- Avino, A.; Manfreda, S.; Cimorelli, L.; Pianese, D. Trend of annual maximum rainfall in Campania region (Southern Italy). Hydrol. Process. 2021, 35, e14447. [Google Scholar] [CrossRef]
- Furcolo, P.; Pelosi, A. Orographic Effects on Extreme Rainfall at Different Durations: A Case Study in Campania Region (Southern Italy). GEP 2018, 6, 77–88. [Google Scholar] [CrossRef] [Green Version]
- Pelosi, A.; Furcolo, P. An amplification model for the regional estimation of extreme rainfall within orographic areas in Campania region (Italy). Water 2015, 7, 6877–6891. [Google Scholar] [CrossRef] [Green Version]
- Formetta, G.; Marra, F.; Dallan, E.; Zaramella, M.; Borga, M. Differential orographic impact on sub-hourly, hourly, and daily extreme precipitation. Adv. Water Resour. 2022, 159, 104085. [Google Scholar] [CrossRef]
Figure 1.
Elevation map of the Campania region with locations of rainfall monitoring stations.

Figure 2.
(a) Subregions used to estimate and (b) regression models between and .

Figure 3.
Comparison between absolute percentage errors of the mean maximum rainfall estimates at sub-hourly durations d obtained by: (a) exploiting the 10-min resolution database, i.e., the best estimate approach; (b) kriging interpolation; and (c) using the new proposed hybrid regional approach. The red line shows the mean error over the region, the green dotted line represents the median value, and the grey area is delimited by the 25th and 75th percentiles along the 160 automatic stations in the region.

Figure 4.
Boxplots showing the variability of the MAPE of the three procedures for all the automatic stations in the region for all sub-hourly durations; circles indicate the mean values. The central lines in the box indicate the median, and the box edges are drawn at the 25th (p25) and 75th (p75) percentiles. Values were considered outliers if they were larger than p75 + 1.5(p75 − p25) or smaller than p25 − 1.5(p75 − p25), and the whiskers extend to the most extreme data values after excluding the outliers.

Figure 5.
Maps of the mean annual rainfall maxima at (a) 20 min and (b) 40 min. The maps were obtained by interpolating observed data from both the automatic stations belonging to the newest network and from mechanical stations belonging to the historical network, then computed using the proposed hybrid regional procedure.


Table 1.
Main statistics of mean annual maximum rainfall time series.
| Average Length of Time Series (Years) | Mean at 20 min (mm) | Mean at 40 min (mm) | Mean at 1 h (mm) | Mean at 12 h (mm) | Mean at 24 h (mm) | |
|---|---|---|---|---|---|---|
| Automatic stations | 17.2 | 20.8 (0.13) 1 | 28.5 (0.13) 1 | 32.8 (0.14) 1 | 67.5 (0.19) 1 | 82.2 (0.21) 1 |
| Mechanical stations | 16.6 | N.A. | N.A. | 29.5 (0.19) 1 | 67.0 (0.28) 1 | 82.4 (0.29) 1 |
1 The coefficients of variations of the data are reported in parenthesis.
Table 2.
Hershfield (Sampling Adjustment) Factors for the annual rainfall maxima at the different durations observed by the historical SIMN network.
Table 2.
Hershfield (Sampling Adjustment) Factors for the annual rainfall maxima at the different durations observed by the historical SIMN network.
| Annual Maximum Rainfall at Given Duration of Interest | Hershfield Factor |
|---|---|
| 1 h | 1.124 |
| 3 h | 1.028 |
| 6 h | 1.011 |
| 12 h | 1.005 |
| 24 h | 1.004 |
Table 3.
Coefficients and of the regression model between and and the coefficient of determination, R2.
Table 3.
Coefficients and of the regression model between and and the coefficient of determination, R2.
| R2 | |||
|---|---|---|---|
| Sub-region n.1 | 1.082 | −1.175 | 0.87 |
| Sub-region n.2 | 1.110 | −1.270 | 0.79 |
| Sub-region n.3 | 1.126 | −1.302 | 0.87 |
Publisher’s Note: MDPI stays neutral with regard to jurisdictional claims in published maps and institutional affiliations. |
© 2022 by the authors. Licensee MDPI, Basel, Switzerland. This article is an open access article distributed under the terms and conditions of the Creative Commons Attribution (CC BY) license (https://creativecommons.org/licenses/by/4.0/).
Share and Cite
MDPI and ACS Style
Pelosi, A.; Chirico, G.B.; Furcolo, P.; Villani, P. Regional Assessment of Sub-Hourly Annual Rainfall Maxima. Water 2022, 14, 1179. https://doi.org/10.3390/w14071179
AMA Style
Pelosi A, Chirico GB, Furcolo P, Villani P. Regional Assessment of Sub-Hourly Annual Rainfall Maxima. Water. 2022; 14(7):1179. https://doi.org/10.3390/w14071179
Chicago/Turabian StylePelosi, Anna, Giovanni Battista Chirico, Pierluigi Furcolo, and Paolo Villani. 2022. "Regional Assessment of Sub-Hourly Annual Rainfall Maxima" Water 14, no. 7: 1179. https://doi.org/10.3390/w14071179
Note that from the first issue of 2016, this journal uses article numbers instead of page numbers. See further details here.