
Removal of Disinfection By-Products Precursor (Humic Acid) by Graphene-Silica Composites

School of Environment, Northeast Normal University, Changchun 130117, China
*
Author to whom correspondence should be addressed.
Water 2022, 14(7), 1178; https://doi.org/10.3390/w14071178
Submission received: 7 February 2022
/
Revised: 7 March 2022
/
Accepted: 17 March 2022
/
Published: 6 April 2022
(This article belongs to the Section Wastewater Treatment and Reuse)
Abstract
:Graphene-silica (RGO-SiO2) was successfully synthesized by a simple hydrothermal method. The composites were used to study the adsorption properties of humic acid and disinfection by-product precursors in natural surface water. Compared with reduced graphene oxide (RGO), the specific surface area of the composites doped with silica (SiO2) increased by 31.2% to 259.43 m2/g. RGO-SiO2 could achieve 66.91% adsorption of humic acid (HA), while the maximum adsorption of HA on RGO-SiO2 reached 925.91 mg/g. The adsorption and removal rates of HA by RGO-SiO2 were significantly higher than those of RGO. The whole adsorption process was in accordance with the quasi-secondary kinetic model, the Langmuir isothermal adsorption model. RGO-SiO2 has good adsorption performance for organic matter of different water qualities. RGO-SiO2 has a better removal ability for hydrophobic organics than hydrophilic and nitrogenous organics. The adsorbent was reusable, and the organic removal efficiency of RGO-SiO2 decreased insignificantly after four cycles.
1. Introduction
Drinking water disinfection is an indispensable process that improves water quality and prevents water-borne diseases. However, the resulting harmful disinfection byproducts (DBPs) are increasingly becoming a focus of hot issues. Certain DBPs have been proven to have very severe carcinogenic, teratogenic, and mutagenic effects on laboratory animals in toxicological investigations. Individuals who are exposed to chlorinated surface waters for a long time have a slightly elevated risk of bladder, colon, and rectal cancers, according to epidemiological studies, and will also affect reproduction and development [1].
In view of DBPs, there exist potential health risks, and controlling DBPs has become imperative. Controlling DBPs’ precursors is considered to be the most effective DBPs control measure because this method will not only not produce other DBPs in the treatment process but can also make use of the existing treatment facilities [2]. Natural organic matter (NOM) can be found in large quantities in both surface and shallow groundwater. Humic substances are the main component of NOM and account for 50–90 percent [3]. Humic compounds are mostly made up of humic acid (HA), and too much of it in drinking water can cause major environmental and health issues, especially in the process of disinfection, where HA can react with disinfectant to generate carcinogenic DBPs [4]. At present, the main control methods of these DBPs precursors are enhanced coagulation [5], membrane filtration [6], advanced oxidation [7], magnetic ion exchange resin [8], and adsorption [9]. Due to its economic efficiency, simple operation, and environment-friendly process, adsorption has been thought of as the frequent method for removing NOM [10].
Graphene (GO) is the first actual 2D carbon material, as well as artificial, and is known as the world’s thinnest material [11]. Graphene has piqued the scientific community’s curiosity since it was discovered in 2004. In the field of water environment research, GO is commonly utilized to adsorb heavy metal ions, inorganic anions, dyes, endocrine disruptors, medicines, personal care items, and natural organic matter, among other things [12]. In this study, silica (SiO2) was combined with graphene to weaken mutual aggregation between graphene sheets, resulting in a graphene-silica (RGO-SiO2) composite material with a high specific surface area and outstanding adsorption capacity. The goals of this study are to investigate the adsorption properties of composites for NOM and perform thermodynamic and kinetic fitting, as well as to apply the composites to NOM adsorption in real water bodies and to explore its reusability.
2. Materials and Methods
2.1. Materials and Reagents
Graphite was bought from Qingdao Tianhe Graphite Co., Ltd. (Qingdao, China). Analytical reagent grade of potassium permanganate was obtained from Sinopharm Chemical Reagent Co., Ltd. (Shanghai, China). Analytical reagent grades of sulfuric acid, hydrogen peroxide, anhydrous ethanol, ammonia water, and ethyl orthosilicate (TEOS) were purchased from Beijing Chemical Factory (Beijing, China). Deionized (DI) water was used to produce all the solutions. Dissolving HA was purchased from Chengdu West Asia Chemical Co., Ltd. (Chengdu, China), in DI water, and yielded the initial HA solution.
2.2. Preparation and Characterization of RGO-SiO2
A modified Hummers method of pressurized oxidation was used to synthesize GO from natural graphite (Qingdao Tianhe Graphite Co., Ltd., Qingdao, China) [13]. RGO and RGO-SiO2 were synthesized by a hydrothermal process [14]. GO, DI water, and anhydrous ethanol were mixed in proportion in a 500 mL flask, the pH of the mixture was adjusted to 10.0 ± 0.1 with ammonia solution, and then TEOS was added. The liquid was mixed for 24 h at room temperature before being placed into a Teflon reactor, which was then covered and secured with a stainless steel autoclave. For 24 h, the autoclave was held at 453 K in an oven. After that, the resulting product was washed multiple times with anhydrous ethanol and DI water before being dried at 338 K. To obtain a decreased RGO-SiO2, the dry product was ground into powder.
The surface morphology of RGO and RGO-SiO2 was examined by SEM (FEI, XL30-ESEM). Fourier transform infrared (FT-IR) spectroscopy was used to analyze the surface characteristics and composition of RGO and RGO-SiO2 utilizing KBr pellets in the range 500–4000 cm−1 on a ThermoFisher Nicolet 6700 FT-IR spectrometer. X-ray diffraction (XRD) measurements were obtained with a Bruker, SMART APEXIICCD X-ray diffractometer (Philips) utilizing CuKa radiation and a scanning range of 5–50°. The Brunauer-Emmett-Teller (BET) surface area of RGO and RGO-SiO2 were measured using N2 adsorption and desorption (Micromeritics ASAP 2020) across a relative pressure range of 0.0955 to 0.993 at 77 K.
2.3. Adsorption Tests
Adsorption of HA onto RGO-SiO2
At room temperature (293 K), all the batch adsorption studies were carried out, all the adsorption solutions’ pH were controlled at 7.0 ± 0.1, except especially noted.
Kinetic experiment: HA solutions of different concentrations were prepared, 30 mg RGO-SiO2 was dispersed into the initial concentration of HA solution, and was 100, 300, and 500 mg/L with 0.001 M CaCl2 (100 mL), respectively, and the solution was shaken for 240 min at 300 rpm using a magnetic stirrer. An amount of 4 mL of the mixture was withdrawn and filtrated with a 0.45 μm filter at different time intervals for measuring the residual HA concentration at a wavelength of 254 nm.
Comparison of HA adsorption on RGO-SiO2 and RGO: To compare the adsorption capacity of RGO-SiO2 and RGO, RGO-SiO2 and RGO at an initial concentration of 300 mg/L were put into 300 mg/L of HA solution with 0.001 M of CaCl2 (100 mL), and the mixtures were shaken at 300 rpm with a magnetic stirrer for 240 min and sampled at various time intervals. The HA concentrations were determined at 254 nm using a Universal T6 UV-vis spectrophotometer after the samples were filtered using a 0.45 μm filter membrane.
Effect of adsorbent dosage: 10–40 mg of RGO-SiO2 was added to 100 mL, 300 mg/L of HA solution containing 0.001 M of CaCl2, and the samples were taken at different time intervals from 5 to 240 min. The HA concentrations were determined at 254 nm using a Universal T6 UV-vis spectrophotometer after the samples were filtered using a 0.45 m filter membrane.
Effect of pH: 6 mg RGO-SiO2 was added into the initial concentration of HA, the solution was 300 mg/L with 0.001 M of CaCl2 (20 mL), and 0.1 M of NaOH or HCl solution, which was used to change the pH value from 4.0 ± 0.1 to 10.0 ± 0.1. The mixture was shaken at 300 rpm for 1 h and then the value of UV254 was measured. The experiment was conducted three times.
Effect of water matrix: Three water samples were collected from the Landscape Lake of Northeast Normal University’s Jingyue Campus (denoted as JY), the Yitong River in Changchun City (denoted as YT), and the reclaimed water from Changchun Nanjiao Sewage Treatment Plant (denoted as NJ). The studies were repeated three times with 90 mg RGO-SiO2 added to 150 mL water samples from JY, YT, and NJ, respectively.
Reuse of RGO-SiO2: 90 mg of RGO-SiO2 was added to 150 mL of the YT water sample for adsorption, and after saturation, the material was stirred for 12 h with 150 mL of absolute ethanol, and then washed with pure water multiple times before being dried in a 60 °C oven. For adsorption studies, the dried RGO-SiO2 was used again. The experiments were repeated 3 times.
3. Results
3.1. Characterization of RGO-SiO2
3.1.1. Scanning Electron Microscope Analysis
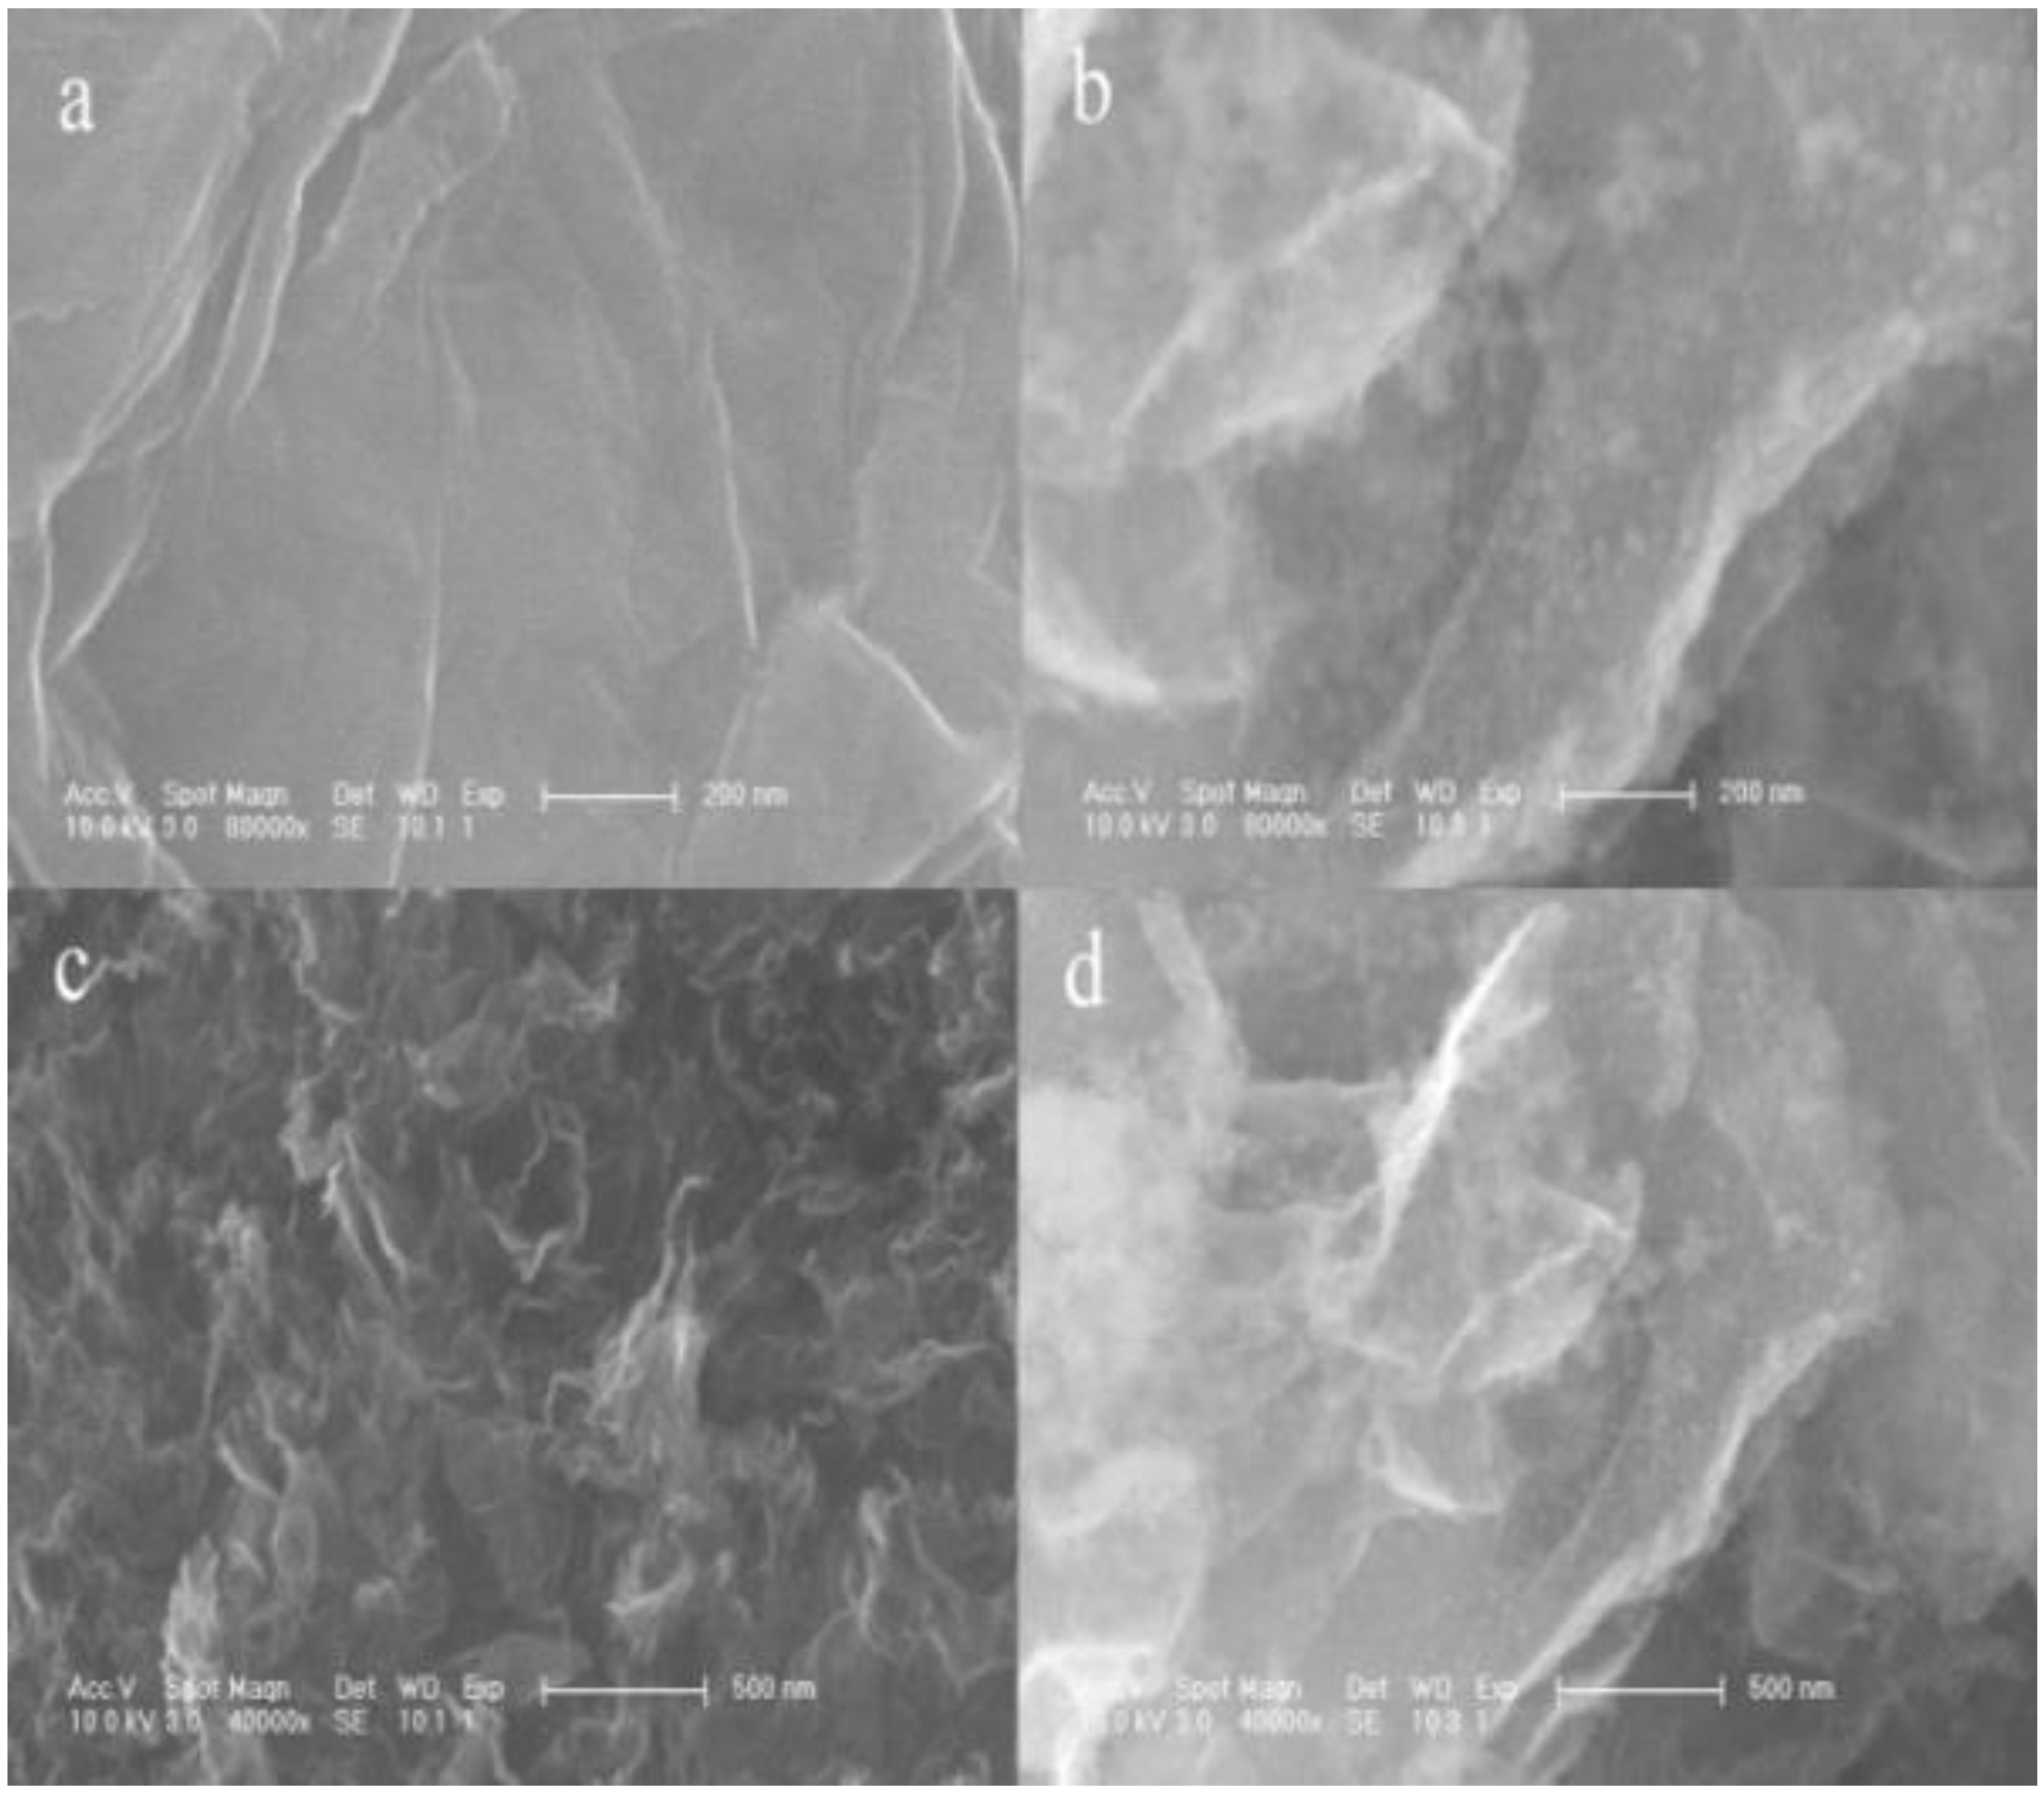
SEM images of RGO (Figure 1a,c) and RGO-SiO2 (Figure 1b,d) under different magnifications are shown in Figure 1. From a and c, we can see that RGO is a petaloid cluster, the surface of RGO exists as a fold and occurs as a stack between graphene layers. It is mainly caused by the inevitable van der Waals force between graphene layers. From b and d, we can observe that RGO-SiO2 presents a layer structure and small SiO2 nanoparticles are homogeneously distributed on graphene sheets, which present as a white spherical shape. The decorated SiO2 nanoparticles could act as a spacer to decrease the interaction between graphene layers, thus increasing the specific surface area of composite [15].
3.1.2. Fourier Transform Infrared Spectroscopy Analysis
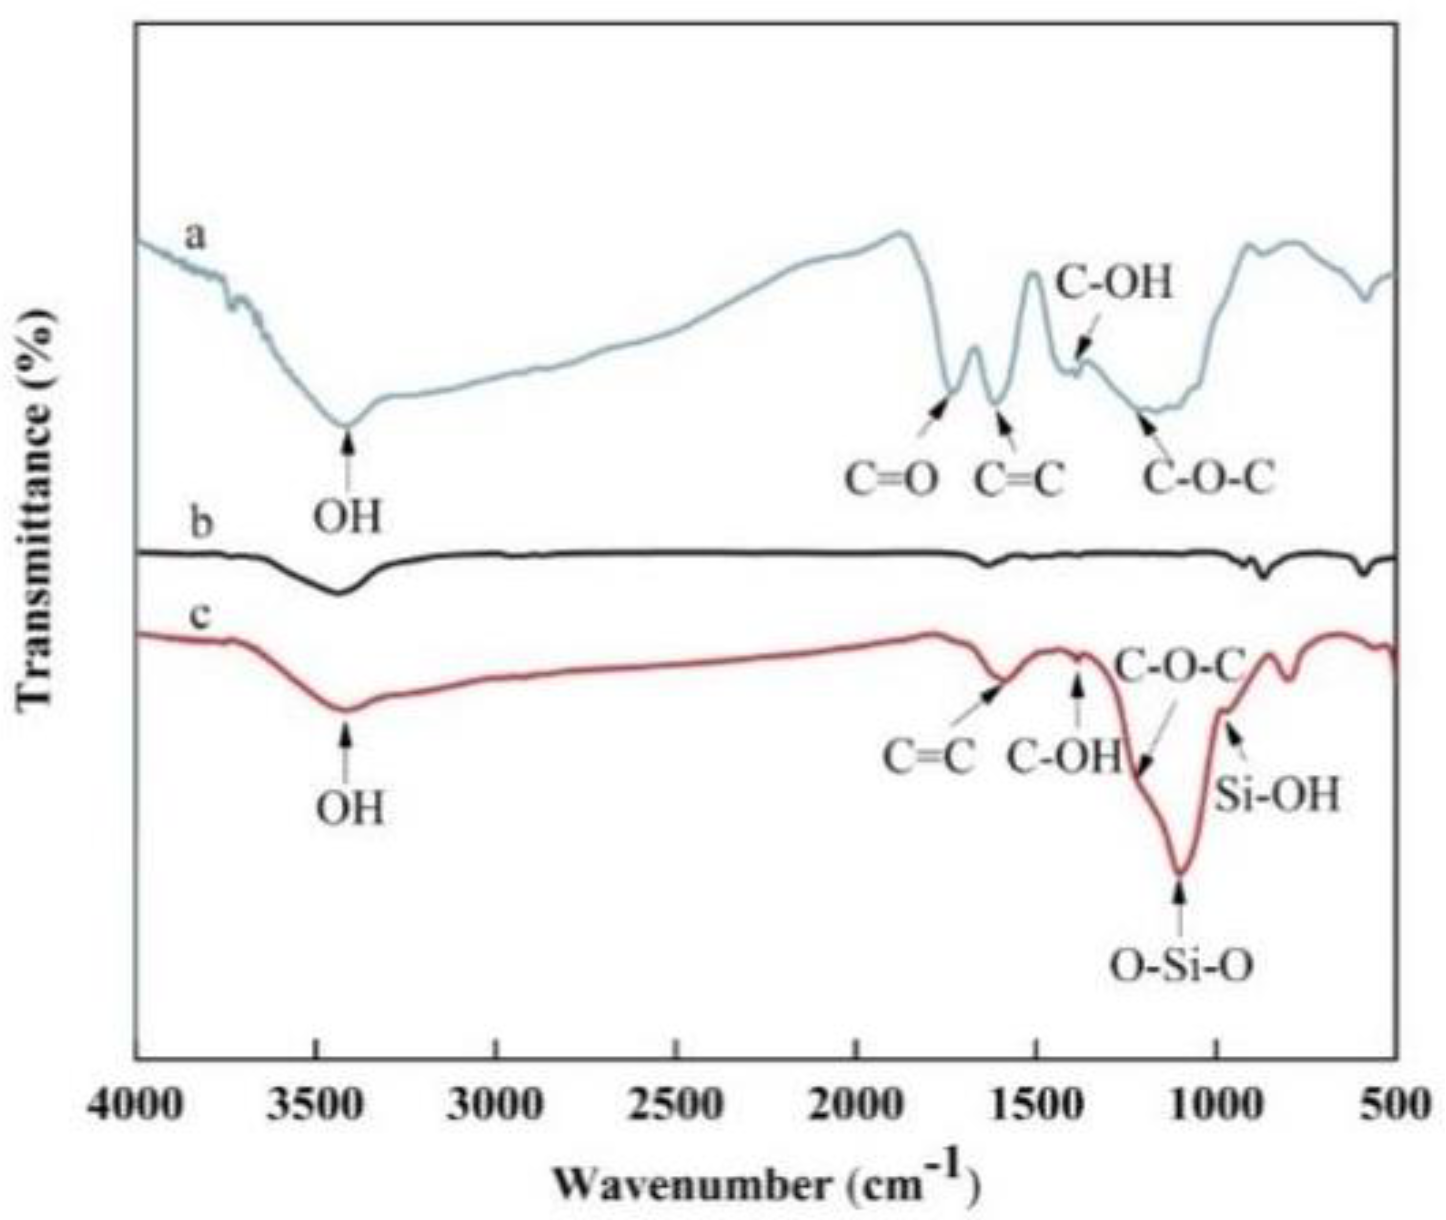
ATR-FTIR spectrum of GO (a), RGO (b), and RGO-SiO2 (c) are shown in Figure 2. Compared with graphite, the ATR-FTIR spectra of GO following oxidation shows multiple distinct peaks of various carbon-oxygen functional groups: C-O, C-O-C, C-OH, C=C, C=O, O-H, which indicates that the graphite was fully oxidized and prepared GO successfully [13]. RGO compares with GO and shows that the functional groups are significantly weakened and even disappeared, showing that RGO prepared by the hydrothermal process has a high degree of reduction. RGO-SiO2 compares with RGO and demonstrates that there are two new absorption peaks at 1101 cm−1 and 955 cm−1 that imply the stretching vibration peak of Si-O-Si and Si-OH, respectively [16,17], demonstrating that SiO2 was successfully coated onto RGO. Moreover, The C=O group has disappeared at 1725 cm−1, showing that the oxygen that contains functional groups of RGO-SiO2 that are prepared by the hydrothermal method are largely removed. There is only a small part of the polar group, thus this increases its hydrophobicity [18].
3.1.3. X-ray Diffraction Analysis
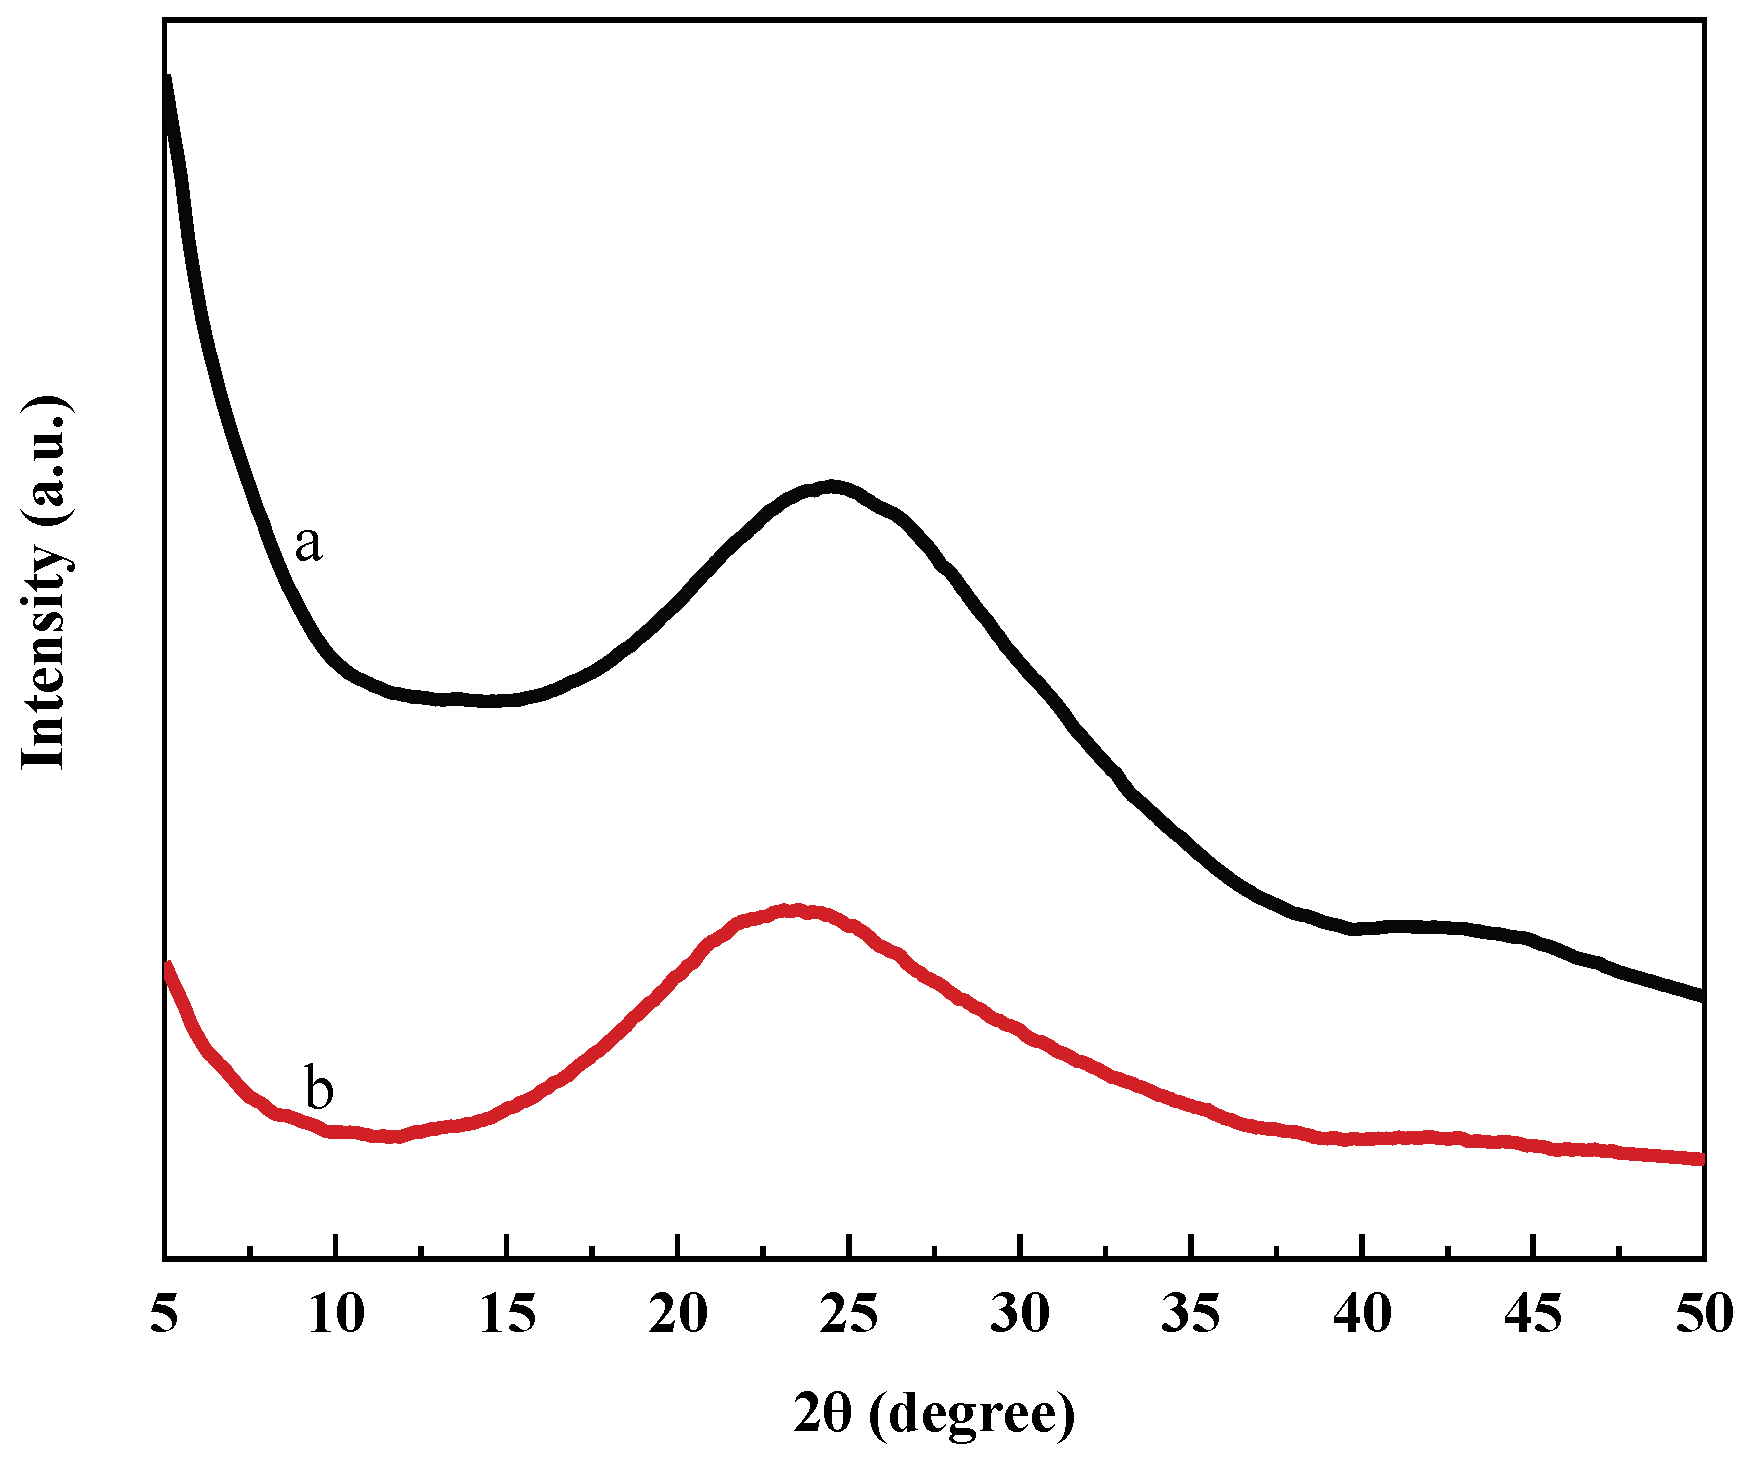
XRD patterns of RGO (a) and RGO-SiO2 (b) are shown in Figure 3. There is a very weak yet broad diffraction peak at 2θ = 20~30°, indicating that graphene occurs as a stack in the drying process [13]. The diffraction peak of RGO-SiO2 occurs at 2θ = 20~30°, which is narrower than RGO, showing that the presence of SiO2 effectively avoids the stack of the bulk of the graphene layers.
3.1.4. BET Specific Surface Area Analysis
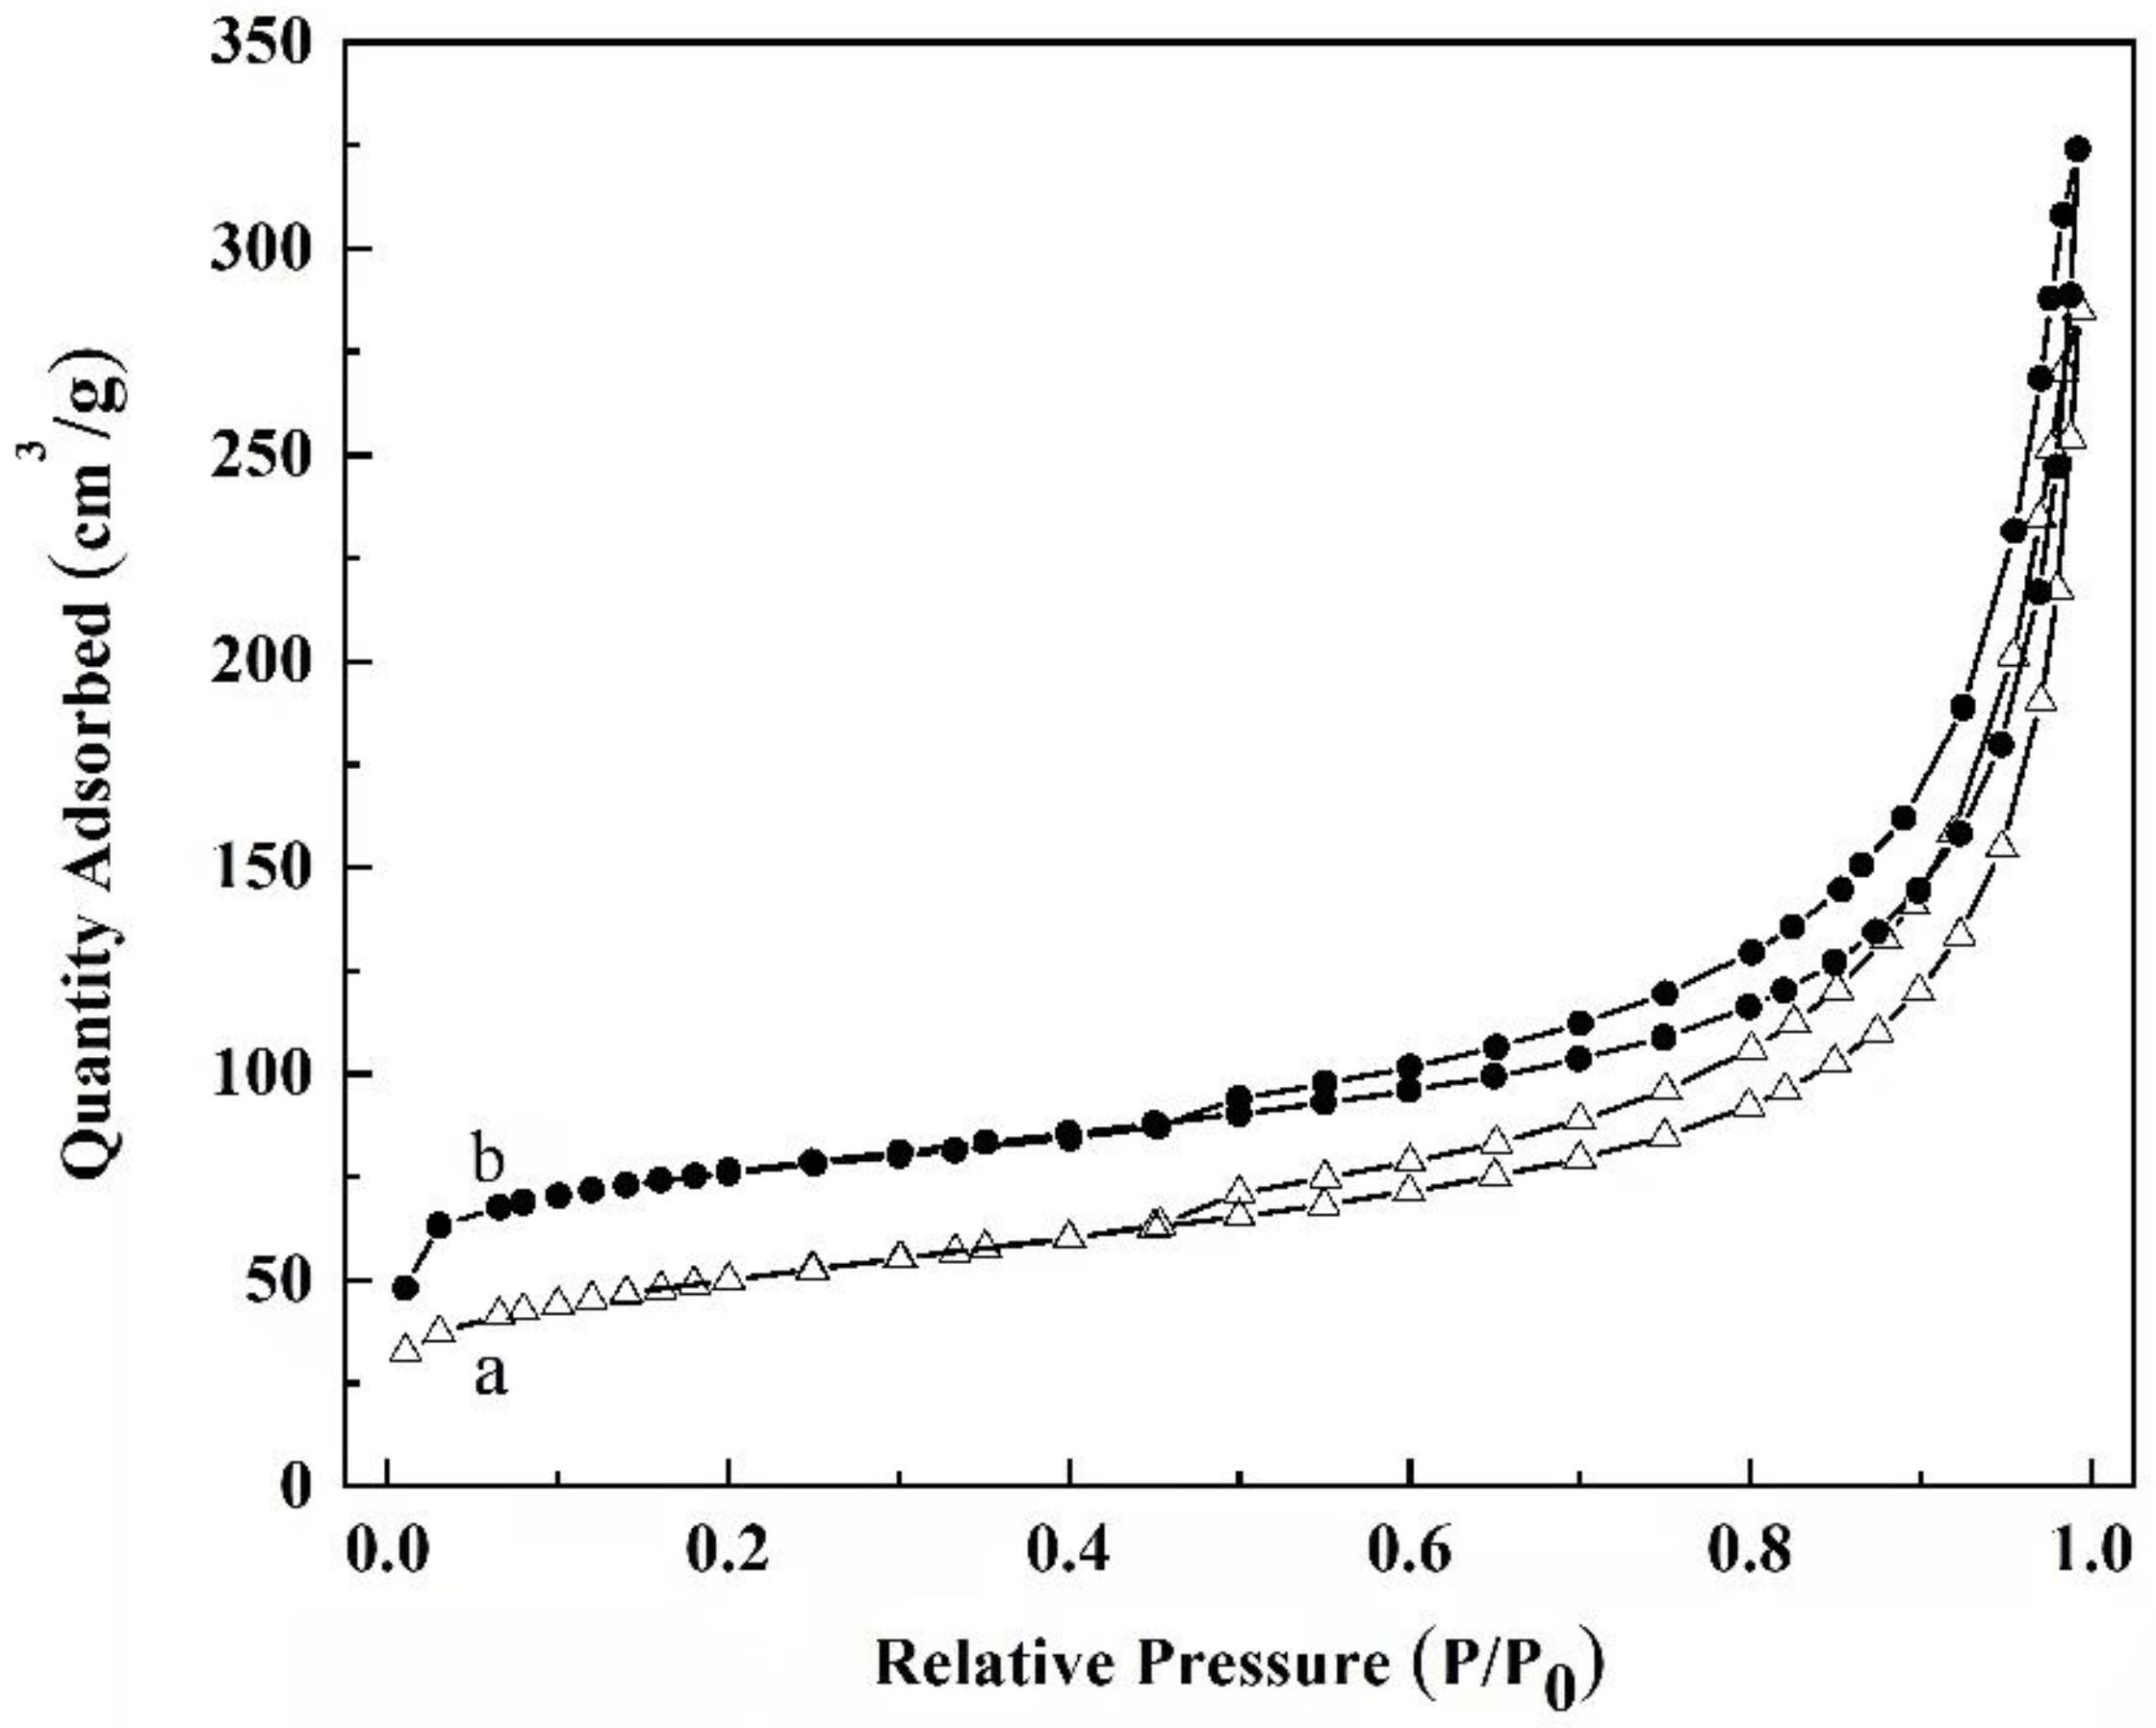
Figure 4 shows the nitrogen adsorption–desorption isotherms for RGO (a) and RGO-SiO2 (b). The particular surface area of RGO computed by the BET model is 177.35 m2/g, a significant difference from the theoretical value of the graphene surface area (2600 m2/g). Because of the unavoidable van der Waals force between single graphene layers, the reason could be related to a partial exfoliation of GO and severe aggregation of graphene layers during the reduction process [19]. The specific surface area of RGO-SiO2 is 256.72 m2/g, larger than RGO, and might be attributed to the presence of SiO2 increasing the spacing between graphene layers, reducing the interactions between graphene layers, and increasing the specific surface area.
3.2. Adsorption of HA onto RGO-SiO2
3.2.1. Effect of Initial Concentration of HA Solutions
The effect of the initial concentration of HA on the adsorption of HA onto RGO-SiO2 is illustrated in Figure 5. Adsorption can rapidly occur within the first of 10 min and reach adsorption equilibrium at around 60 min. The adsorption amounts of HA onto RGO-SiO2 increase from 331.3 mg/g to 493.2 mg/g as the initial concentration increases. When the initial concentration of HA is higher than 300 mg/L, the adsorption amounts reach the maximum, nevertheless, as the initial concentration is increased further, the adsorption amounts do not change much.
3.2.2. Comparison of HA Adsorption on RGO-SiO2 and RGO
Figure 6 shows the comparison of RGO and RGO-SiO2. The adsorption and removal of HA by RGO-SiO2 is higher than that by RGO, which is mainly due to the unavoidable force of RGO in the preparation process and the occurrence of serious agglomeration, which makes its specific surface area lower and leads to low adsorption efficiency; while the presence of SiO2 increases the spacing of graphene sheets and reduces the aggregation between graphene, which makes the specific surface area increase and provides more adsorption sites and higher adsorption efficiency.
3.2.3. Effect of Adsorbent Dosage
Figure 7 illustrates the influence of adsorbent dose on the adsorption of HA by composites. The removal of HA by RGO-SiO2 increased from 27.31% to 66.91% with increasing the amount of adsorbent (100–400 mg/L). The increase in adsorption efficiency is due to an increase in the amount of adsorbent employed and the number of accessible adsorption sites, which results in an increase in the adsorption surface area. For the following studies, an adsorbent dosage of 300 mg/L was used due to the dual consideration of the adsorption removal rate and adsorption capacity.
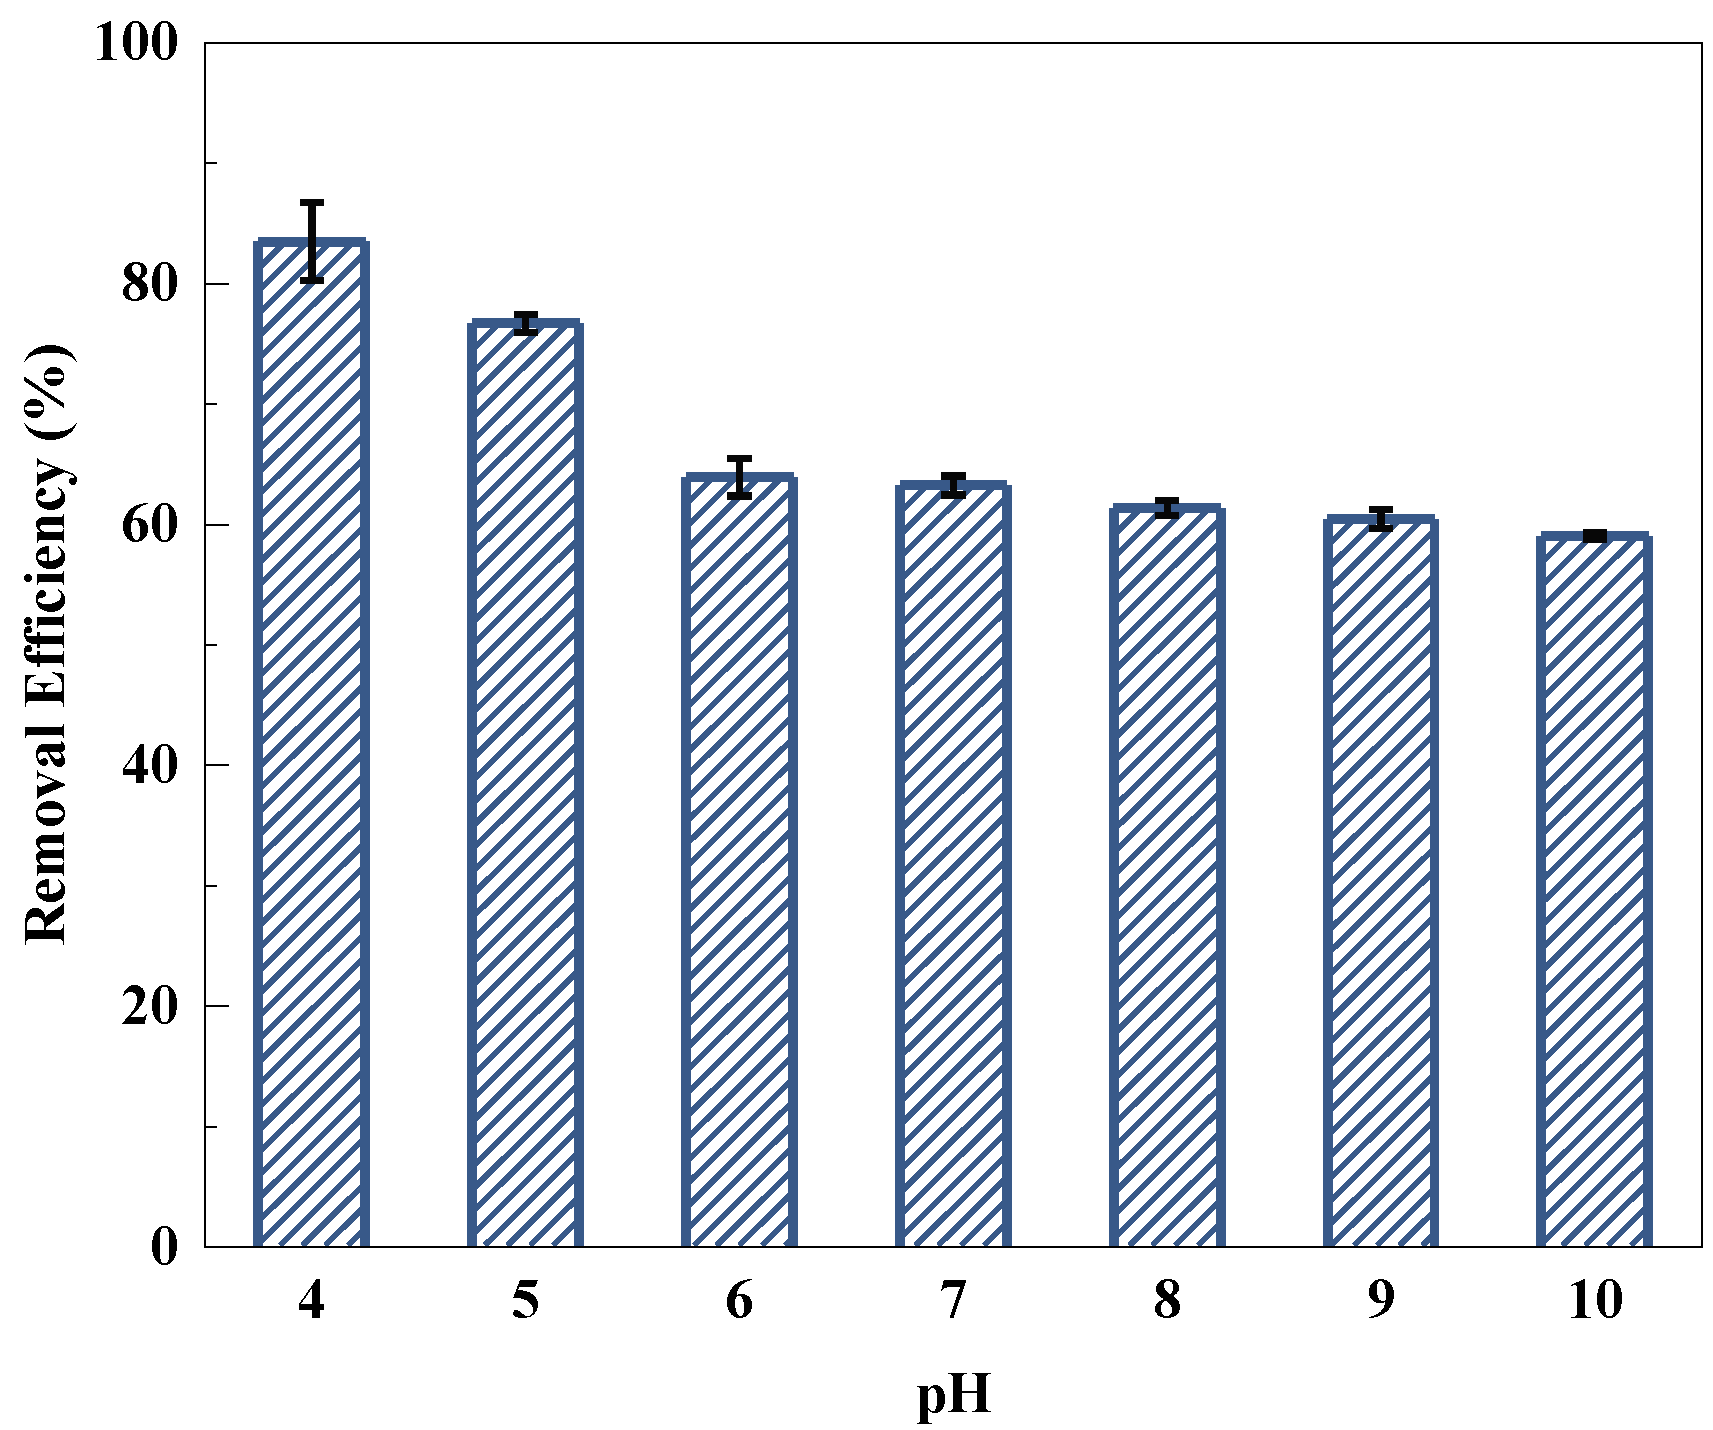
3.2.4. Effect of pH
The effect of pH on the adsorption of HA onto RGO-SiO2 can be seen in Figure 8. With the increase in pH, the adsorption removal efficiencies of HA onto RGO-SiO2 decrease from 83.5% to 59.0%. The main reasons are as follows: The lower pH, the higher the surface positive charge density of RGO-SiO2 and it might make it easier for negatively charged HA to stick to the surface, thus increasing the adsorption efficiency. As pH increased, the dissociation of the functional groups -COOH and -COH to -COO- and -CO- increased, resulting in RGO-SiO2 being negatively charged. The adsorption capacity was reduced due to the electrostatic repulsion interaction between the negative charges on RGO-SiO2 and HA [17]. At lower pH, HA can be found in a spherical shape, but at higher pH, it can be found in a linear or stretched structure. The smaller the molecule volume, the easier it is to adsorb [20].
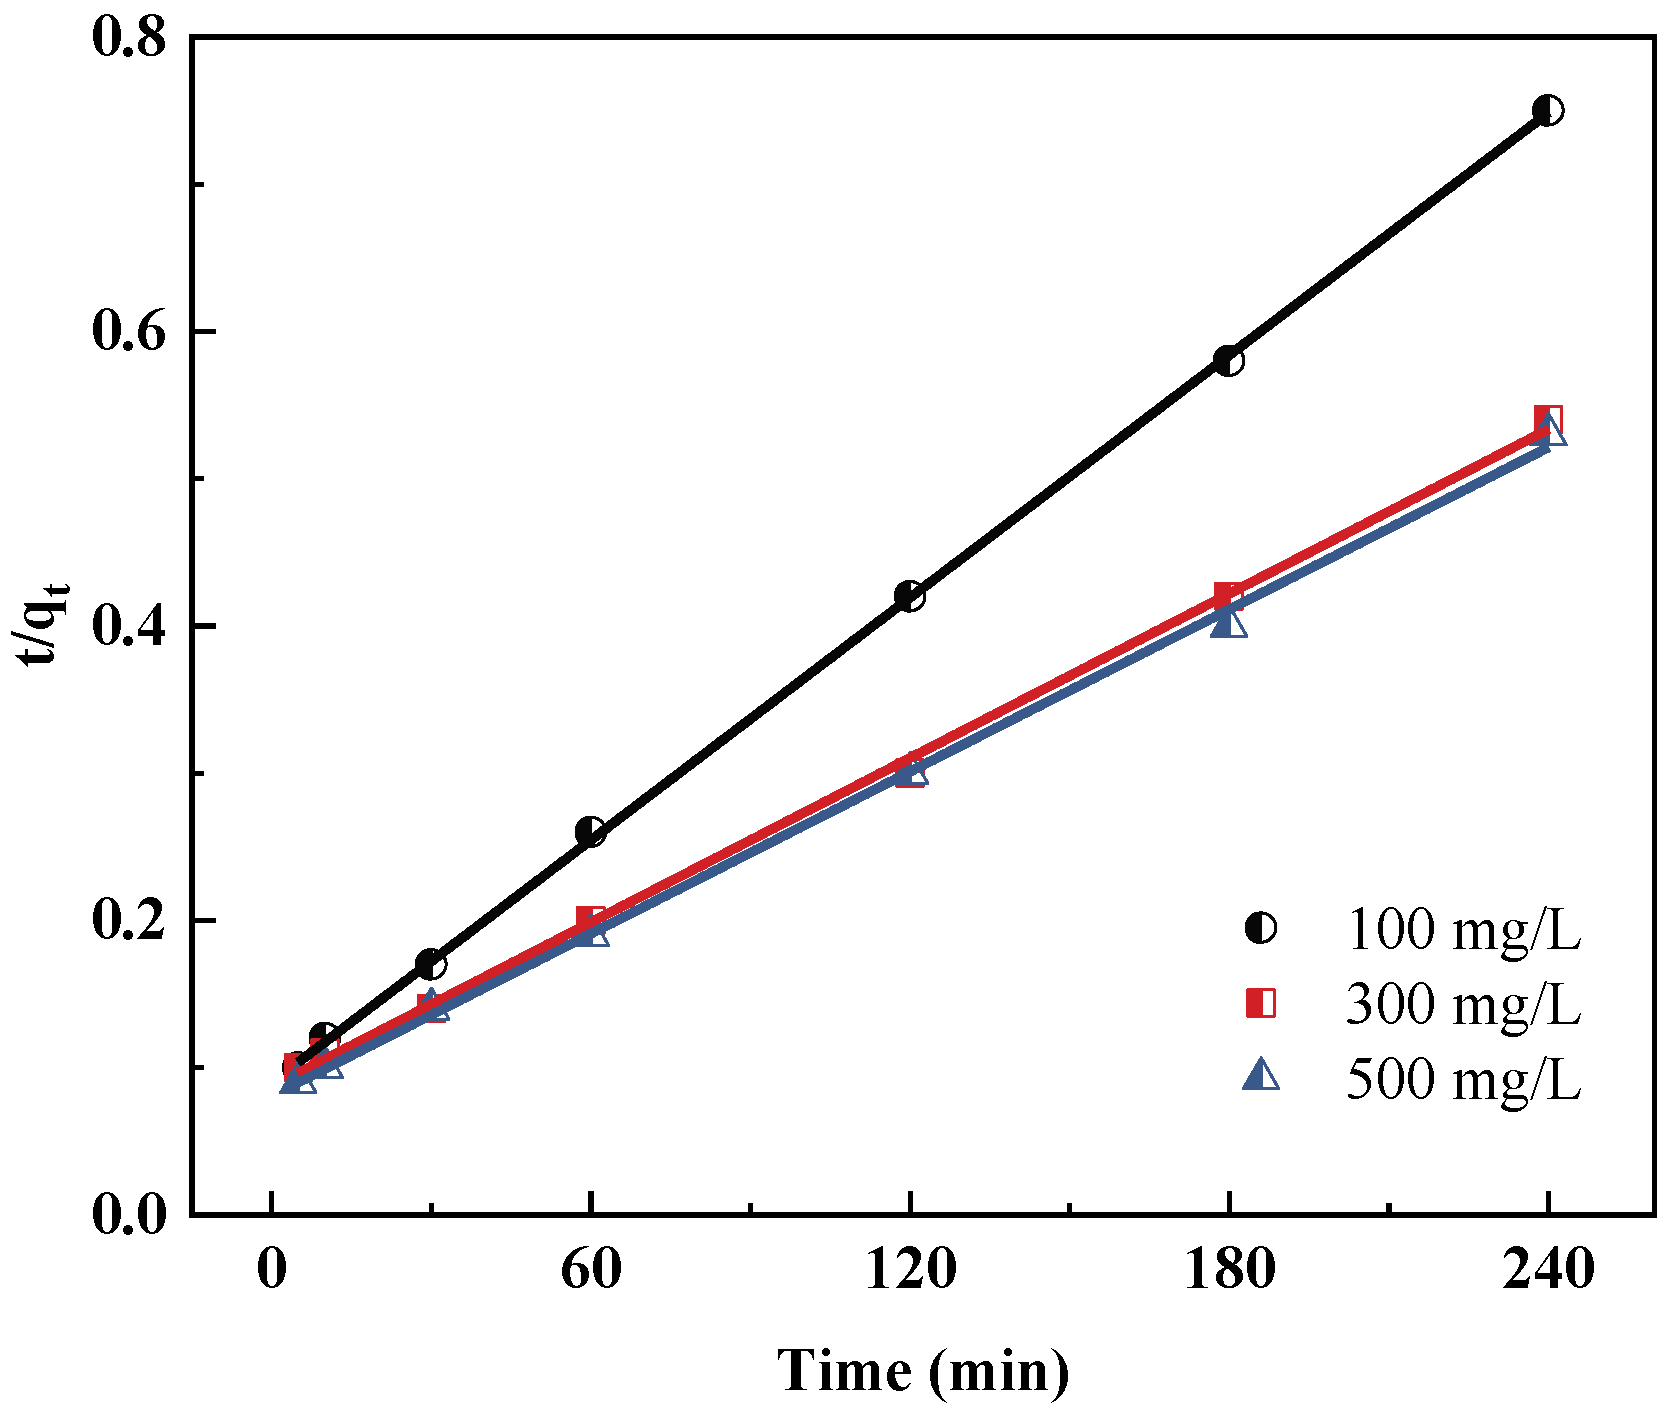
3.2.5. Adsorption Kinetics
Many different kinetic models have been proposed to explore the adsorption mechanism. In this study, two different kinetic models are applied to obtain the most matched one with the experimental data: pseudo-first-order kinetic models and pseudo-second-order kinetic models [4]. The linear forms of the pseudo-first-order and pseudo-second-order kinetic models are expressed as Equations (1) and (2), respectively:
where qe and qt are the equilibrium and time t adsorption capacities (mg·g−1), respectively, k1 is the pseudo-first-order rate constant (min−1), k2 (g/mg·min) is the pseudo-second-order rate constant.
Adsorption kinetic parameters of the adsorption of HA onto RGO-SiO2 at different initial concentrations are shown in Table 1. Under different experimental conditions, HA adsorbed on RGO-SiO2 and the quasi-secondary kinetic fits on RGO-SiO2, as shown in Figure 9. As can be seen from Table 1, the value of correlation coefficient (R2) of pseudo-first-order kinetic models is smaller than pseudo-second-order kinetic models’ which are close to 1. Additionally, the theoretical values of qe are close to the value of qe obtained at experimental conditions, indicating that pseudo-second-order kinetic models have a good agreement with the experimental data; the adsorption of HA onto RGO-SiO2 follows pseudo-second-order kinetic models in the whole adsorption time, and adsorption is mainly chemisorption [4].
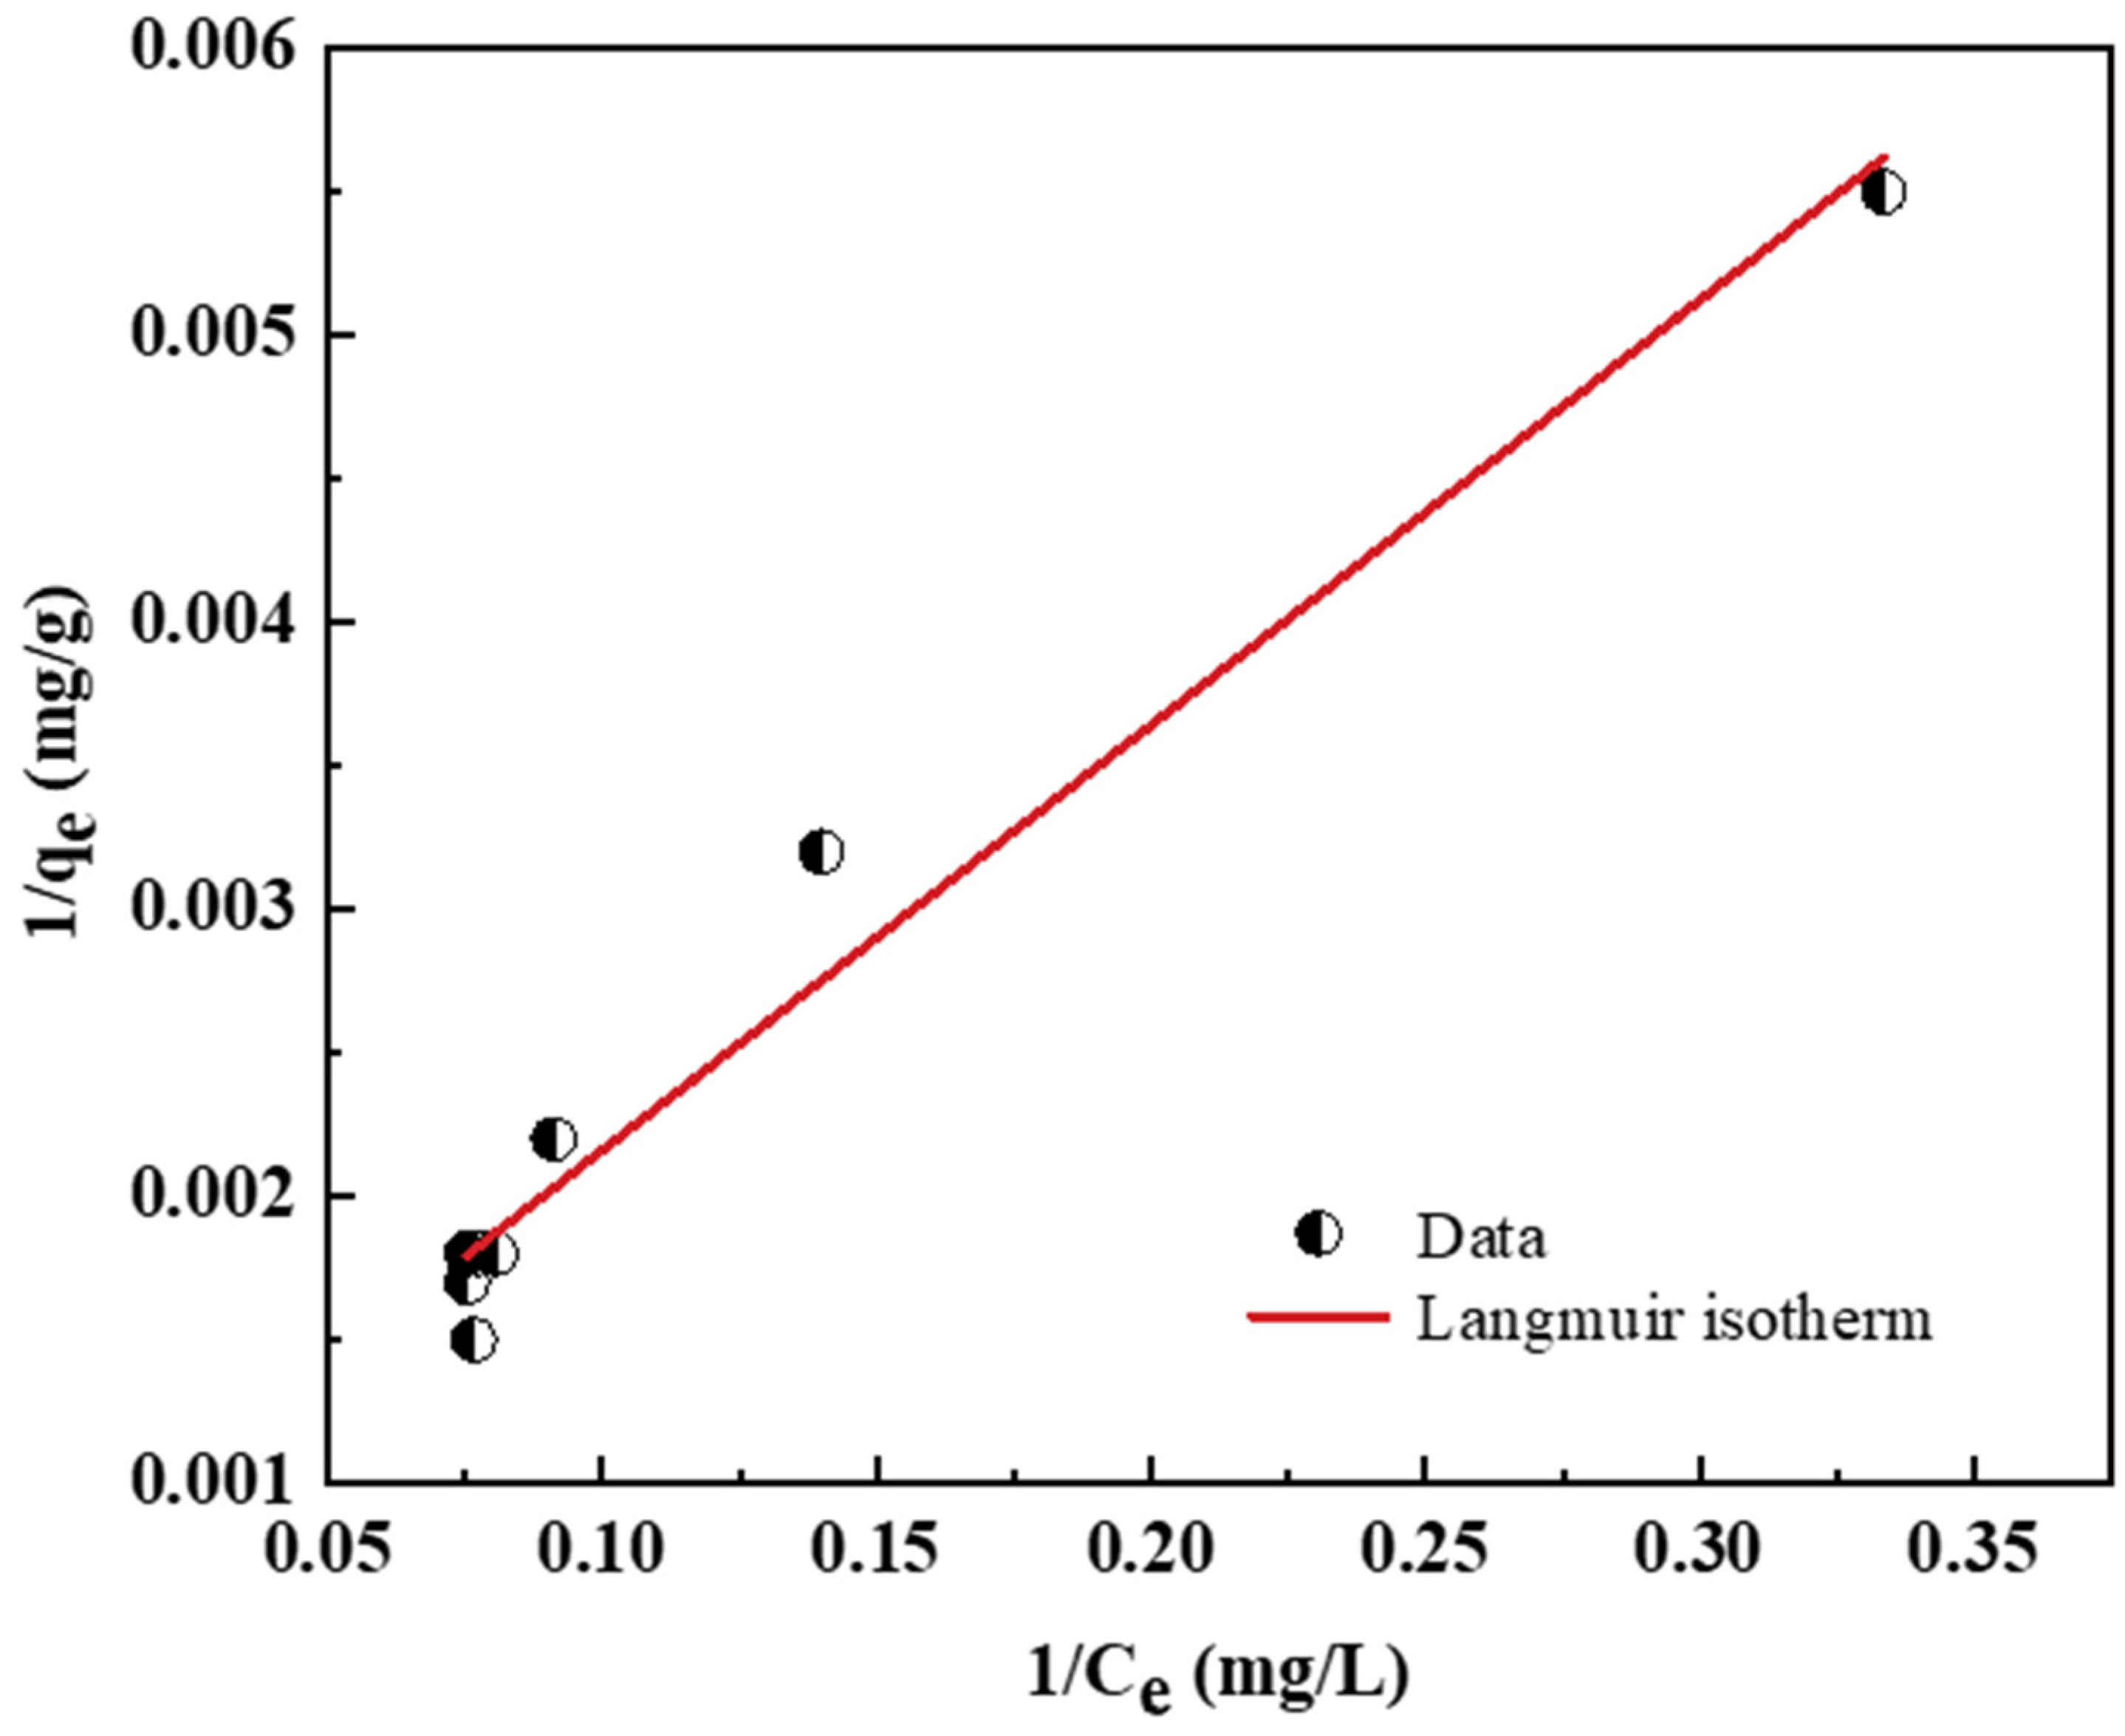
3.2.6. Adsorption Isotherm
Two of the most often used models, Langmuir and Freundlich [20], were chosen to match the experimental data in this work. The linear form of Langmuir and Freundlich is as follows:
where Ce is the equilibrium concentration of adsorbate (mg/L), qe is the adsorption amount at equilibrium (mg/g), aL (L/mg), kL (L/g), kF ((mg/g) (mg/L)−1/n) and n are constants.
HA adsorbed in RGO-SiO2 on the Langmuir isotherm fitting line is shown in Figure 10. Table 2 shows the Langmuir and Freundlich isotherm constants for the adsorption of HA onto RGO-SiO2, from which we can deduce that the Langmuir model’s R2 value is higher than the Freundlich model’s, implying that the Langmuir model fits better and that the adsorption process is monolayer [21].
3.3. Adsorption of Organic Matter in Surface Water onto RGO-SiO2
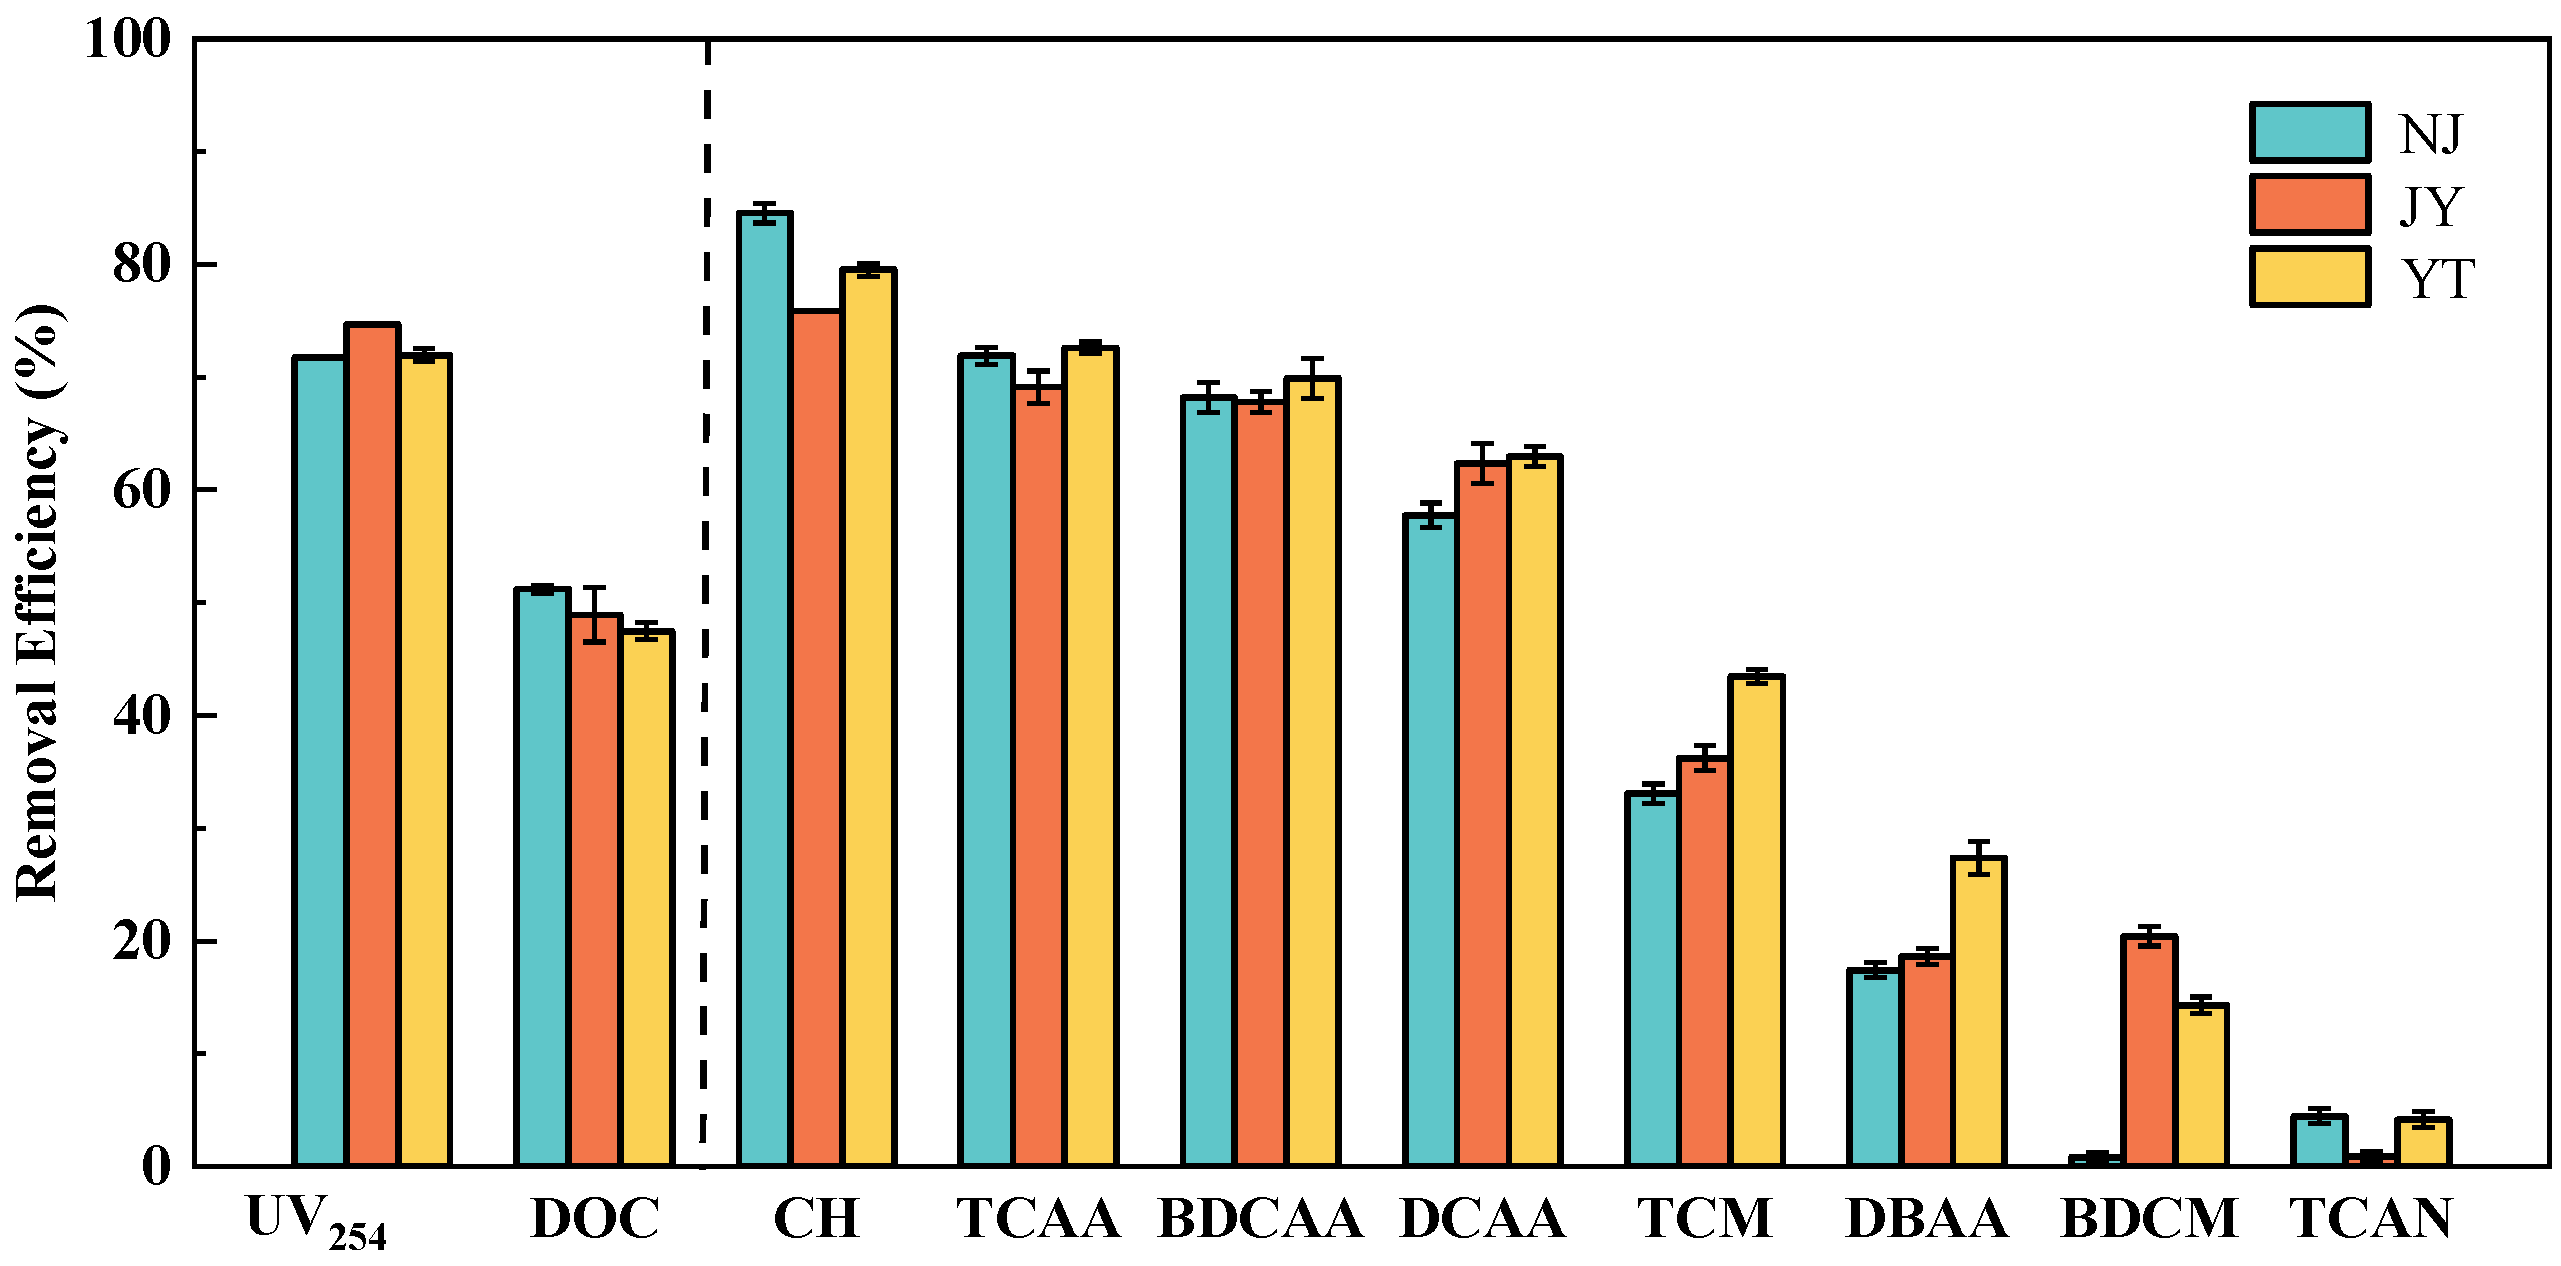
3.3.1. Effect of Water Matrix
Table 3 lists the basic water quality parameters of three kinds of raw water. The adsorption of NOM onto RGO-SiO2 under different water qualities is shown in Figure 11. After disinfection, three raw water samples detected eight kinds of DBPs: Trichloromethane (TCM), trichloroacetonitrile (TCAN), bromodichloromethane (BDCM), halo acetaldehydes (CH), trichloroacetic acid (TCAA), dichloroacetic acid (DCAA), bromo dichloroacetic acid (BDCAA) and dibromoacetic acid (DBAA). RGO-SiO2 has a good adsorption capability for three kinds of water samples. The UV254 removal efficiency is 71.8~75.7%, dissolved organic carbon (DOC) removal efficiency is 47.5~51.2%, TCMFP, TCANFP, BDCMFP, and CHFP are 33.1~43.7%, 0.9~4.5%, 0.8~20.4%, and 75.9~84.6%, respectively, and DCAAFP, TCAAFP, BDCAAFP, and DBAAFP is 57.7~63.0%, 69.1~71.9%, 67.8~69.9%, and 17.4~27.4%, respectively.
The removal capacity of RGO-SiO2 on haloacetic acid (HAAsFP) is higher than trihalomethane (THMsFP), which is owing to the precursor of HAAs being mainly hydrophobic organic compounds [22]. The adsorption capacity of RGO-SiO2 on hydrophobic organic compounds in water is stronger.
3.3.2. Reuse of RGO-SiO2
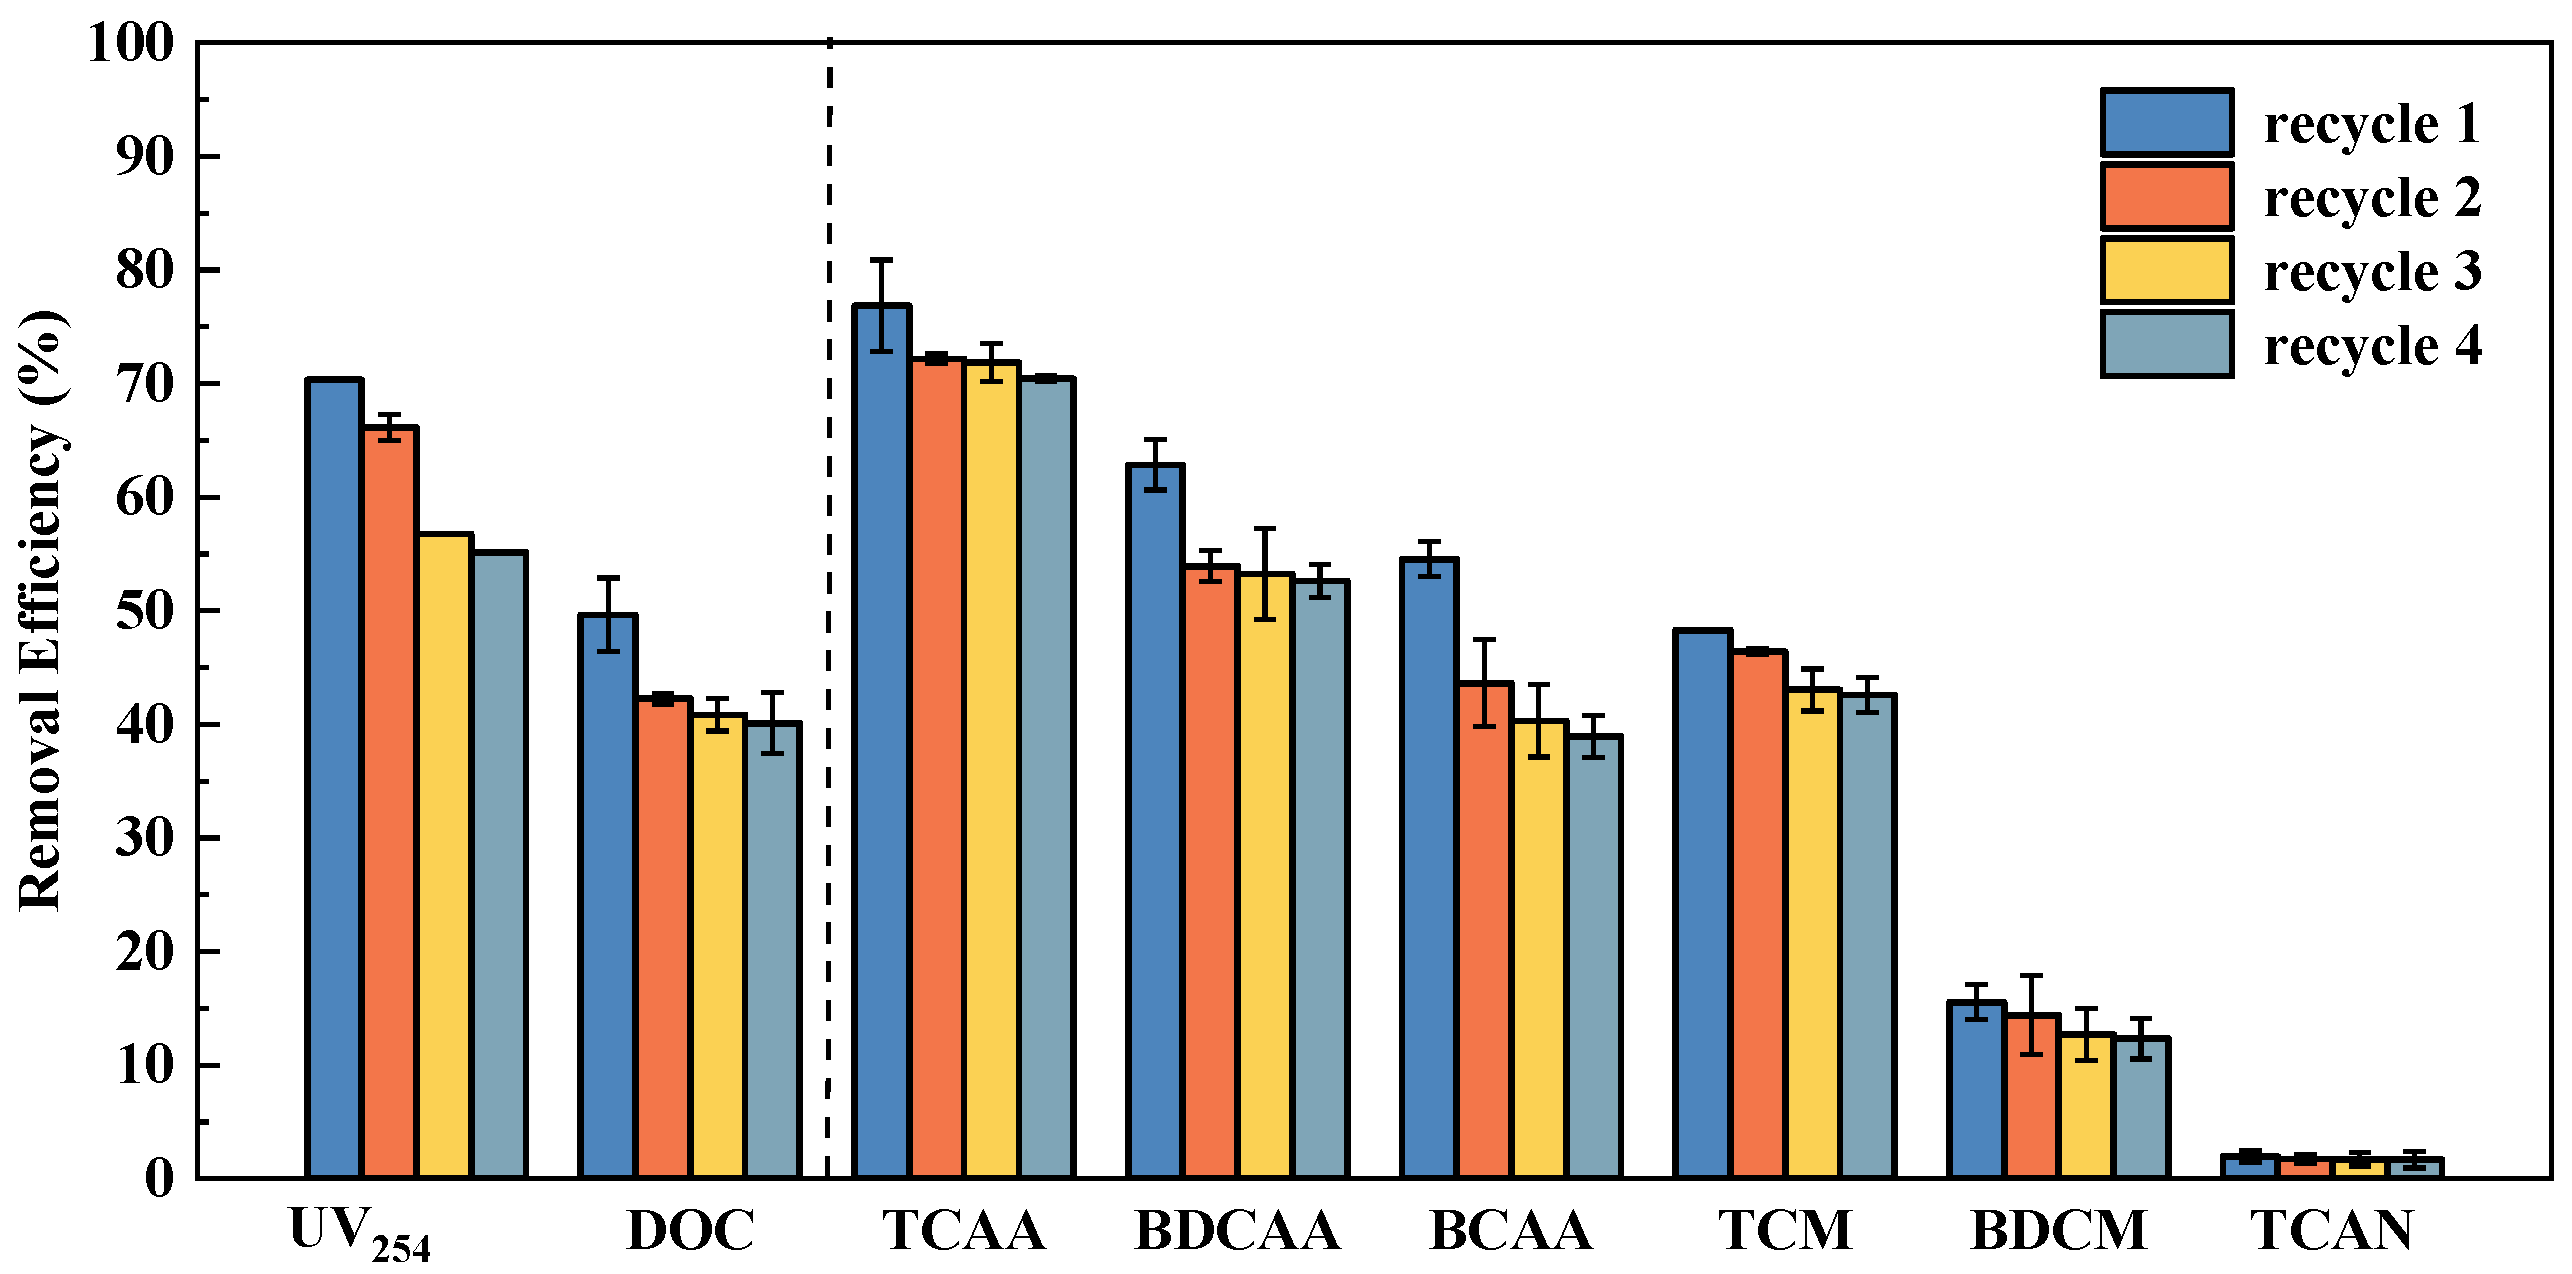
In this study, absolute ethyl alcohol was used as a desorbing agent. The RGO-SiO2, after desorption, was repeatedly used for the adsorption experiments of organic matter in surface water. The removal efficiency of NOM in the surface water of regenerated adsorbent is given in Figure 12. The adsorption removal effectiveness of NOM onto RGO-SiO2 is observed to be slightly reduced after three cycles, and no obvious decrease after the next cycle, which indicates that the regenerated RGO-SiO2 retains its outstanding NOM adsorption removal effectiveness in surface water, and the adsorbent can be reused [10].
4. Conclusions
The SiO2 coating on the RGO surface lowers graphene layer interactions while increasing specific surface area and adsorption capacity. Throughout the process of HA adsorption, adsorption can occur rapidly in the first 10 min and reach equilibrium in around 60 min. As the initial concentration of HA decreases and the pH value increases, the adsorption removal of HA on RGO-SiO2 increases, and the adsorption performance of RGO-SiO2 is higher than that of a single RGO for the whole adsorption time. The adsorption behavior of HA on RGO-SiO2 may be effectively described by the pseudo-second-order kinetic model and the Langmuir model, and the adsorption of HA on RGO-SiO2 belongs to monolayer adsorption and chemisorption. In the adsorption process of natural organic matter on RGO-SiO2 in surface water, RGO-SiO2 has good adsorption performance of UV254, DOC, and DBPsFP on water samples with different water qualities, and the removal ability of HAAsFP is stronger than that of THMsFP. The adsorption and removal ability of RGO-SiO2 does not decrease significantly after several cycles, and the adsorbent RGO-SiO2 can quickly adsorb NOM in water, and its preparation method is simple and low cost with a high removal efficiency.
Author Contributions
Conceptualization, S.C. and W.Y.; methodology, S.C. and W.Y.; formal analysis, S.S.; resources, Q.Z. and S.Z.; data curation, S.C. and S.S.; writing—original draft preparation, S.C.; writing—review and editing, W.Y.; supervision, W.Y.; funding acquisition, W.Y. All authors have read and agreed to the published version of the manuscript.
Funding
This research was funded by [the Fundamental Research Funds for the Central Universities] grant number [2412019FZ020] and [the National Key Research and Development Program of China] grant number [2019YFE0117900].
Institutional Review Board Statement
Not applicable.
Informed Consent Statement
Not applicable.
Data Availability Statement
Not applicable.
Acknowledgments
The authors wish to thank Huan Zhou for supporting the real water sample.
Conflicts of Interest
The authors declare no conflict of interest.
References
- Boorman, G.A.; Dellarco, V.; Dunnick, J.K.; Chapin, R.E.; Hunter, S.; Hauchman, F.; Gardner, H.; Cox, M.; Sills, R.C. Drinking water disinfection byproducs: Review and approach to toxicity evaluation. Environ. Health Perspect. 1999, 107, 207–217. [Google Scholar] [PubMed]
- Bond, T.; Goslan, E.H.; Parsons, S.A.; Jefferson, B. Treatment of disinfection by-product precursors. Environ. Technol. 2011, 32, 1–25. [Google Scholar] [CrossRef] [PubMed]
- Bhatnagar, A.; Sillanpaa, M. Removal of natural organic matter (NOM) and its constituents from water by adsorption—A review. Chemosphere 2017, 166, 497–510. [Google Scholar] [CrossRef] [PubMed]
- Doulia, D.; Leodopoulos, C.; Gimouhopoulos, K.; Rigas, F. Adsorption of humic acid on acid-activated Greek bentonite. J. Colloid Interface Sci. 2009, 340, 131–141. [Google Scholar] [CrossRef]
- Wang, P.; Ding, S.K.; Xiao, R.; An, G.Y.; Fang, C.; Chu, W.H. Enhanced coagulation for mitigation of disinfection by-product precursors: A review. Adv. Colloid Interface Sci. 2021, 296, 19. [Google Scholar] [CrossRef]
- Siddiqui, M.; Amy, G.; Ryan, J.; Odem, W. Membranes for the control of natural organic matter from surface waters. Water Res. 2000, 34, 3355–3370. [Google Scholar] [CrossRef]
- Toor, R.; Mohseni, M. UV-H2O2 based AOP and its integration with biological activated carbon treatment for DBP reduction in drinking water. Chemosphere 2007, 66, 2087–2095. [Google Scholar] [CrossRef]
- Mergen, M.R.D.; Jefferson, B.; Parsons, S.A.; Jarvis, P. Magnetic ion-exchange resin treatment: Impact of water type and resin use. Water Res. 2008, 42, 1977–1988. [Google Scholar] [CrossRef] [Green Version]
- Kim, J.K.; Kang, B.S. DBPs removal in GAC filter-adsorber. Water Res. 2008, 42, 145–152. [Google Scholar] [CrossRef]
- Wang, J.; Han, X.; Ma, H.; Ji, Y.; Bi, L. Adsorptive removal of humic acid from aqueous solution on polyaniline/attapulgite composite. Chem. Eng. J. 2011, 173, 171–177. [Google Scholar] [CrossRef]
- Novoselov, K.S.; Geim, A.K.; Morozov, S.V.; Jiang, D.; Zhang, Y.; Dubonos, S.V.; Grigorieva, I.V.; Firsov, A.A. Electric field effect in atomically thin carbon films. Science 2004, 306, 666–669. [Google Scholar] [CrossRef] [PubMed] [Green Version]
- Meng, L.; Sun, Y.; Gong, H.; Wang, P.; Qiao, W.C.; Gan, L.; Xu, L.J. Research progress of the application of graphene-based materials in the treatment of water pollutants. New Carbon Mater. 2019, 34, 220–237. [Google Scholar] [CrossRef]
- Bao, C.L.; Song, L.; Xing, W.Y.; Yuan, B.; Wilkie, C.A.; Huang, J.; Guo, Y.; Hu, Y. Preparation of graphene by pressurized oxidation and multiplex reduction and its polymer nanocomposites by masterbatch-based melt blending. J. Mater. Chem. 2012, 22, 6088. [Google Scholar] [CrossRef]
- Zhou, X.; Shi, T. One-pot hydrothermal synthesis of a mesoporous SiO2–graphene hybrid with tunable surface area and pore size. Appl. Surf. Sci. 2012, 259, 566–573. [Google Scholar] [CrossRef]
- Wu, Y.; Luo, H.; Wang, H.; Wang, C.; Zhang, J.; Zhang, Z. Adsorption of hexavalent chromium from aqueous solutions by graphene modified with cetyltrimethylammonium bromide. J. Colloid Interface Sci. 2013, 394, 183–191. [Google Scholar] [CrossRef] [PubMed]
- Liu, Q.; Shi, J.B.; Sun, J.T.; Wang, T.; Zeng, L.; Jiang, G. Graphene and graphene oxide sheets supported on silica as versatile and high-performance adsorbents for solid-phase extraction. Angew. Chem. 2011, 50, 6035–6039. [Google Scholar] [CrossRef]
- Hao, L.Y.; Song, H.J.; Zhang, L.C.; Wan, X.; Tang, Y.; Lv, Y. SiO2/graphene composite for highly selective adsorption of Pb(II) ion. J. Colloid Interface Sci. 2012, 369, 381–387. [Google Scholar] [CrossRef]
- Wang, J.; Chen, Z.; Chen, B. Adsorption of polycyclic aromatic hydrocarbons by graphene and graphene oxide nanosheets. Environ. Sci. Technol. 2014, 48, 4817–4825. [Google Scholar] [CrossRef]
- Xu, J.; Wang, L.; Zhu, Y. Decontamination of Bisphenol A from Aqueous Solution by Graphene Adsorption. Langmuir ACS J. Surf. Colloids 2012, 28, 8418–8425. [Google Scholar] [CrossRef]
- Jones, M.N.; Bryan, N.D. Colloidal properties of humic substances. Adv. Colloid Interface Sci. 1998, 78, 1–48. [Google Scholar] [CrossRef]
- Shaker, A.M.; Komy, Z.R.; Heggy, S.E.; El-Sayed, M.E. Kinetic study for adsorption humic acid on soil minerals. J. Phys. Chem. A 2012, 116, 10889–10896. [Google Scholar] [CrossRef] [PubMed]
- Wang, J.; Ding, S.; Zheng, C.; Ma, H.; Ji, Y. Efficient removal of humic acid in aqueous solution using polyaniline adsorbent. Desalination Water Treat. 2012, 40, 92–99. [Google Scholar] [CrossRef]
Figure 1.
SEM images of graphene oxide (RGO) (a,c) and graphene-silica (RGO-SiO2) (b,d) under different magnifications.
Figure 1.
SEM images of graphene oxide (RGO) (a,c) and graphene-silica (RGO-SiO2) (b,d) under different magnifications.

Figure 2.
FT-IR spectrum of graphene GO (a), RGO (b), and RGO-SiO2 (c).

Figure 3.
XRD patterns of RGO (a) and RGO-SiO2 (b).

Figure 4.
Nitrogen adsorption–desorption isotherm for RGO (a) and RGO-SiO2 (b).

Figure 5.
Effect of initial humic acid (HA) concentration on the adsorption of HA onto RGO-SiO2.

Figure 6.
Adsorption of RGO and RGO-SiO2 on HA.

Figure 7.
Effect of adsorbent dosage on HA adsorption by RGO-SiO2.

Figure 8.
Effect of pH on the adsorption of HA onto RGO-SiO2.

Figure 9.
Linear plots of a pseudo-second-order kinetic model for the adsorption of HA onto RGO-SiO2.
Figure 9.
Linear plots of a pseudo-second-order kinetic model for the adsorption of HA onto RGO-SiO2.

Figure 10.
Isotherm data and modeling for the adsorption of HA on RGO-SiO2.

Figure 11.
Effect of different water qualities on the adsorption of natural organic matter (NOM) onto RGO-SiO2.
Figure 11.
Effect of different water qualities on the adsorption of natural organic matter (NOM) onto RGO-SiO2.

Figure 12.
Reuse of RGO-SiO2.


Table 1.
Comparison of the pseudo-first-order and pseudo-second-order kinetic models for the adsorption of HA onto RGO-SiO2.
Table 1.
Comparison of the pseudo-first-order and pseudo-second-order kinetic models for the adsorption of HA onto RGO-SiO2.
| Pseudo-First-Order | Pseudo-Second-Order | |||||
|---|---|---|---|---|---|---|
| CHA (mg/L) | R2 | qe (mg/g) | K1 (min−1) | R2 | qe (mg/g) | K2 (g/(mg·min)) |
| 100 | 0.9567 | 85.71 | 0.028 | 0.9969 | 335.97 (331.27) | 0.0029 |
| 300 | 0.3176 | 71.51 | 0.0077 | 0.9994 | 490.20 (483.65) | 0.0016 |
| 500 | 0.5266 | 82.92 | 0.0083 | 0.9992 | 502.51 (493.17) | 0.0015 |
Table 2.
Langmuir and Freundlich isotherm constants for the adsorption of HA onto RGO-SiO2.
| Langmuir | Freundlich | ||||
|---|---|---|---|---|---|
| R2 | kL (L/g) | aL (L/mg) | R2 | kF ((mg/g)(g/L)−1/n) | n |
| 0.9712 | 95.24 | 0.13 | 0.8766 | 174.58 | 3.89 |
Table 3.
Basic water quality parameters of experiment water.
| Water Sample | pH | Turbidity (NTU) | UV254 (cm−1) | DOC (mg/L) | SUVA (L/mg/m) |
|---|---|---|---|---|---|
| YT | 7.94 | 19.7 | 0.123 | 7.416 | 1.66 |
| NJ | 7.71 | 4.6 | 0.131 | 8.203 | 1.60 |
| JY | 7.40 | 21.4 | 0.079 | 5.337 | 1.48 |
Publisher’s Note: MDPI stays neutral with regard to jurisdictional claims in published maps and institutional affiliations. |
© 2022 by the authors. Licensee MDPI, Basel, Switzerland. This article is an open access article distributed under the terms and conditions of the Creative Commons Attribution (CC BY) license (https://creativecommons.org/licenses/by/4.0/).
Share and Cite
MDPI and ACS Style
Chen, S.; Shang, S.; Zhao, Q.; Zhang, S.; Yang, W. Removal of Disinfection By-Products Precursor (Humic Acid) by Graphene-Silica Composites. Water 2022, 14, 1178. https://doi.org/10.3390/w14071178
AMA Style
Chen S, Shang S, Zhao Q, Zhang S, Yang W. Removal of Disinfection By-Products Precursor (Humic Acid) by Graphene-Silica Composites. Water. 2022; 14(7):1178. https://doi.org/10.3390/w14071178
Chicago/Turabian StyleChen, Siqi, Shanze Shang, Qi Zhao, Shaojie Zhang, and Wu Yang. 2022. "Removal of Disinfection By-Products Precursor (Humic Acid) by Graphene-Silica Composites" Water 14, no. 7: 1178. https://doi.org/10.3390/w14071178
Note that from the first issue of 2016, this journal uses article numbers instead of page numbers. See further details here.