Article

Vulnerability of a Tunisian Coastal Aquifer to Seawater Intrusion: Insights from the GALDIT Model

1
LR01ES06 Laboratory of Geological Resources and Environment, Department of Geology, Faculty of Sciences of Tunis, University of Tunis El Manar, Tunis 2092, Tunisia
2
National Institute of Agronomy, University of Carthage, Tunis 1082, Tunisia
3
Oklahoma Water Resources Center, Division of Agricultural Sconce and Natural Resources, Oklahoma State University, Stillwater, OK 74078, USA
4
Department of Biosystems and Agricultural Engineering, Oklahoma State University, 111 Agricultural Hall, Stillwater, OK 74078, USA
5
AGHYLE, SFR Condorcet FR CNRS 3417, Polytechnic Institute UniLaSalle Beauvais, 19 Pierre Waguet Street, 60026 Beauvais, France
6
Laboratory of Sedimentary Basins and Petroleum Geology, Department of Geology, Faculty of Sciences of Tunis, University of Tunis El Manar, Tunis 2092, Tunisia
7
Department of Geology Geo-Environment Laboratory, Faculty of Earth Sciences and Country Planning, University of Sciences and Technology Houari Boumediene, Algiers 09000, Algeria
*
Author to whom correspondence should be addressed.
Water 2022, 14(7), 1177; https://doi.org/10.3390/w14071177
Submission received: 20 February 2022 / Revised: 28 March 2022 / Accepted: 3 April 2022 / Published: 6 April 2022
(This article belongs to the Special Issue Methods and Tools for Assessment of Groundwater)

Abstract

:
The Korba region in northwestern Tunisia has a coastal aquifer that is impacted by intensive irrigation, urban expansion, and sensitivity to SWI. We assessed the vulnerability extent of Korba’s GW to SWI. We utilized a parametric model for GW vulnerability assessment, the GALDIT, which considers six parameters to determine SWI effects. The GALDIT map has four rating categories (≥7.5, 7.5–5, 5–2.5, and <2.5), representing very high, high, moderate, and low vulnerability, respectively. Most of the region was found to be highly vulnerable (44.2% of the surface area), followed by areas characterized by very high (20.3%) and moderate (19.3%) vulnerability. Only 16.2% was found to have low vulnerability. A parameter sensitivity analysis showed that distance from shore and depth of GW represent the determining factors for SWI with variation index values of 24.12 and 18.02%, respectively. Inland advancement of seawater is causing GW salinity to rise, as indicated by a strong Pearson correlation coefficient of 0.75 between SWI indices and the electrical conductivity. Suitable areas for artificial recharge were mainly distributed in the alluvial plains, with a total area of 32.85 km2. Inhibiting SWI requires about 11.31 MCM of artificial recharge in the two most suitable recharge zones in the region.

1. Introduction

Many coastal cities around the world have limited access to freshwater. Thus, freshwater aquifers have significant value to those cities particularly in drought-prone areas. A major threat to water supply from coastal aquifers is seawater intrusion (SWI) [1,2,3,4]. Under normal circumstances, the seawater level will have a lower elevation than the groundwater (GW) table, thereby allowing seaward GW flow. In the face of GW overexploitation or rising sea levels, this flow direction may change, rendering coastal aquifers vulnerable to salinization [1,3,5,6,7]. GW salinization has a negative impact on fresh water supply, environmental health, coastal infrastructure, and tourism.
While GW pumping may be regulated to minimize the likelihood of SWI, delineating and quantifying the factors that may trigger such intrusion is a crucial step in the process. Moreover, climate change is projected to result in rising sea levels and exacerbate the vulnerability of coastal aquifers to SWI [8,9,10,11,12]. A GW vulnerability assessment can be an effective step towards protecting GW resources [4,9], land use planning, and sustainable use of the GW resource [13].
The concept of GW vulnerability was first introduced in the late 1960s and has been defined by many authors. For example, Margat [14] introduced the term GW vulnerability to comprehend the pollution potential of an area based on its GW hydrogeological settings. This concept has become one of the most widely used bases for GW vulnerability assessment. Aquifer vulnerability has been defined as the tendency of contaminants to enter the GW system, subject to a given pollution on the land’s surface [14,15]. Lobo-Ferreira and Cabral [16] describe GW vulnerability as the sensitivity of GW quality to an imposed pollutant load, which is determined by the intrinsic characteristics of the aquifer. Harter and Walker [17] define GW vulnerability as an indicator of how hard or easily surface contamination can access a productive aquifer.
GW vulnerability is considered one of the key components in the decision making process and used in multi-criteria decision making tools [18,19]. Determining GW vulnerability also includes studying the characteristics of each aquifer parameter with respect to the threat of contaminated water intrusion [3,8,11]. In addition, GW vulnerability assessment techniques are useful to implement specific management strategies to mitigate the GW pollution and to suggest necessary guidelines for using GW resources. GW vulnerability can be determined by three methods: (1) index/overlay methods, (2) statistical techniques, and (3) process based modeling simulations. These methods can be applied with a wide range of tools including DRASTIC [20,21,22,23,24], GOD [25], EPIK [26], COP [27], SINTACS [28], CRIPTAS [29], and GALDIT [30,31,32,33,34,35,36].
Numerical models are typically used to address the SWI problem. However, application of these technique poses various challenges such as limited process understanding, limited availability of data, and conceptual limitations [37,38,39]. The widely used techniques are index/overlay models [40], which involve four main features: the type, weight, rank, and class range, which are extracted based on overlaying of the final map for computing vulnerability [15,41]. These techniques have been developed based on the hydrological characteristics of GW reservoirs that are subject to GW vulnerability to pollution [42]. Many index/overlay methods have been performed so far to assess intrinsic GW vulnerability.
GALDIT is one of the most widely used techniques that can be applied to evaluate the vulnerability of coastal aquifers to SWI in data scarce Mediterranean regions. Proposed by Lobo-Ferreira et al. [30], GALDIT is a structured approach that uses overlay/index techniques to combine six mappable factors: GW occurrence/aquifer type (G), Aquifer hydraulic conductivity (A), Depth of the GW (L), Distance from shore (D), Impact of existing status of SWI (I), and Aquifer thickness (T). It calculates each index and arranges the indices through a decision-making method, and then estimates the probability of SWI potential for various hydrogeological settings by numerical modeling [30]. These parameters are based on the physical properties that can directly influence SWI [31,43]. Once the distribution of vulnerability to SWI is computed using the GALDIT index score, the next step is to determine the spatial extent of GW vulnerability to SWI in the areas of concern. This guides delineation of priority areas and selection of best management practices (BMPs) that are appropriate for minimizing the likelihood of SWI in each area [25,44,45,46].
A typical BMP is artificial recharge, a useful method of controlling SWI by way of maintaining a downward slope towards the sea [47,48]. The technique involves locating and selecting suitable sites for recharge, as well as constructing a hydraulic barrier to prevent seawater flow towards freshwater aquifers. Identifying appropriate zones for GW artificial recharge is typically done by combining different thematic maps with assigned ranking values, such as geology, geomorphology, hydrological soil, runoff, surface slope, and land use [43,48].
Our study covers an area where SWI is progressively invading a coastal aquifer that is the primary water supply source for industrial, agricultural, and domestic uses [49,50,51,52,53,54,55]. Increasing demands for water in the region continue to put pressure on the GW resources. There is a need to develop an affordable method that provides data on GW vulnerability to SWI, and to guide identification of susceptible areas. The objectives of this research were to map the vulnerability of the Korba GW systems in north-eastern Tunisia to SWI using the GALDIT model, and then utilize the maps to identify suitable areas for artificial GW recharge and simulate the impacts of GW recharge on SWI. The scientific benefit of this study is the availability of new datasets on the application of the GALDIT model in a data-scarce Mediterranean context. The societal benefit is the ability to guide selection of BMPs, which will minimize the likelihood of SWI in the region and, subsequently, promote sustainable GW supply. Furthermore, the results of this study constitute a technical support document that can spotlight the impacts of anthropogenic activities on the Korba aquifer and similar coastal areas.

2. Materials and Methods

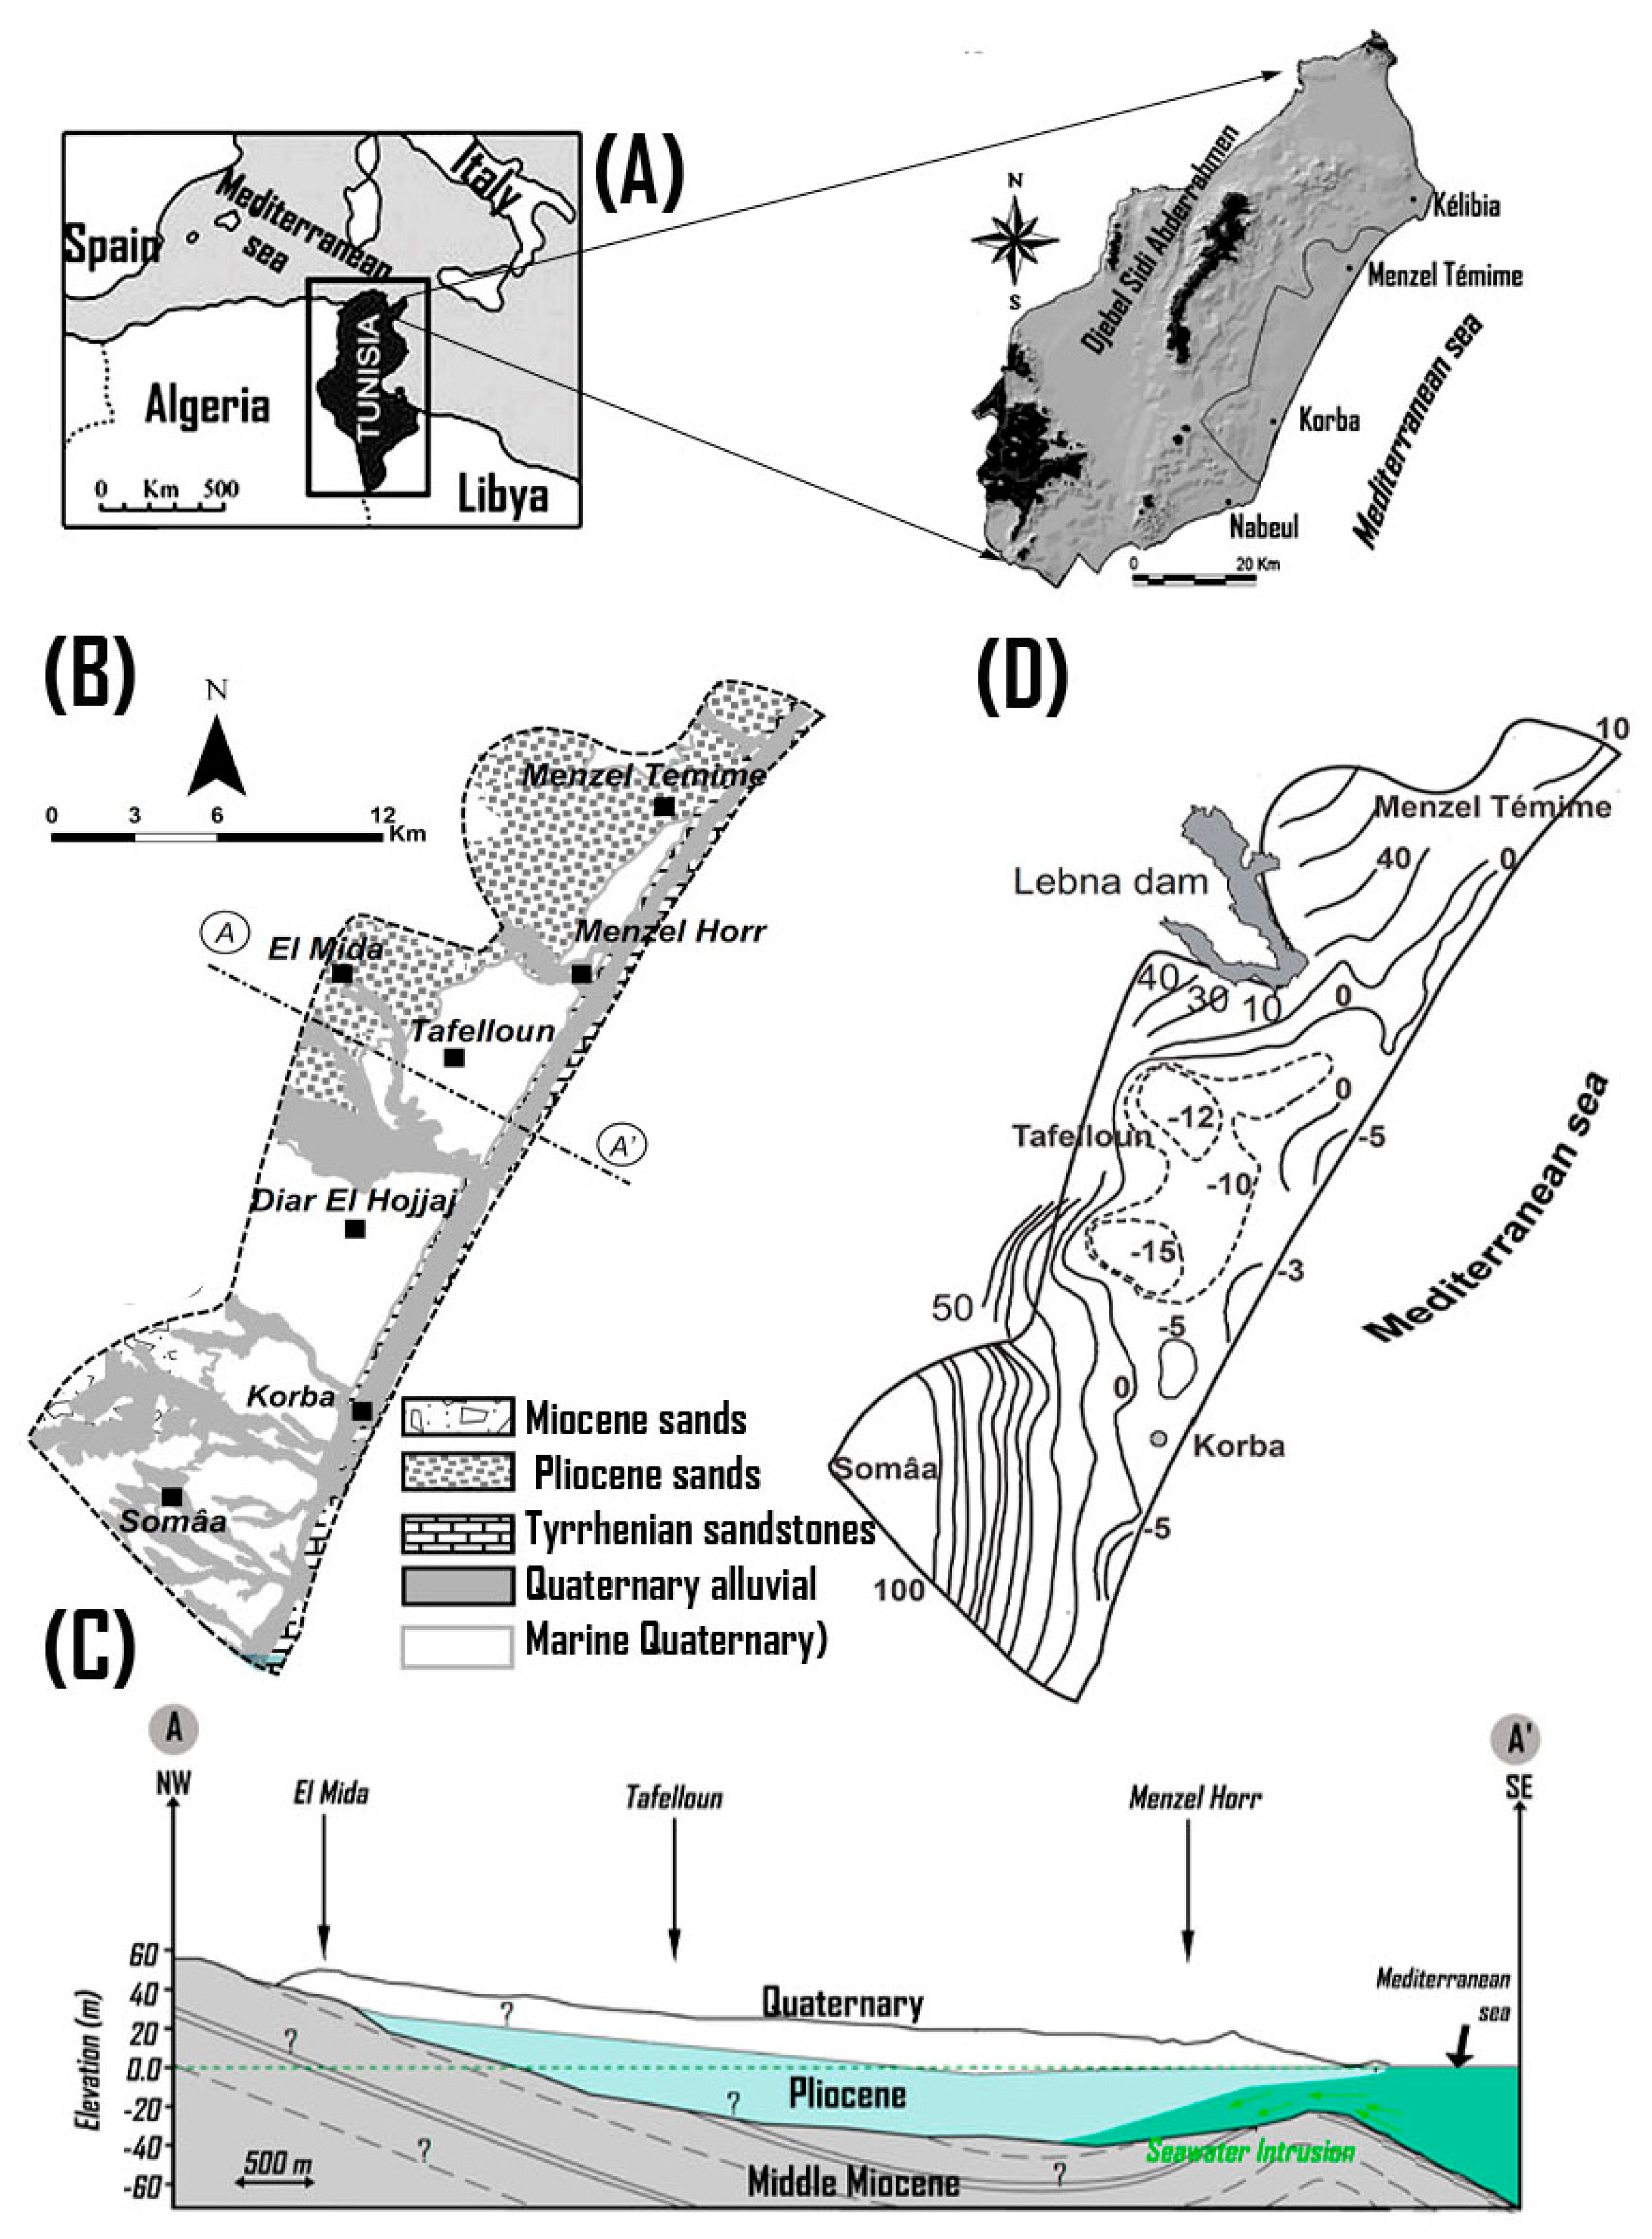
2.1. The Korba Study Site
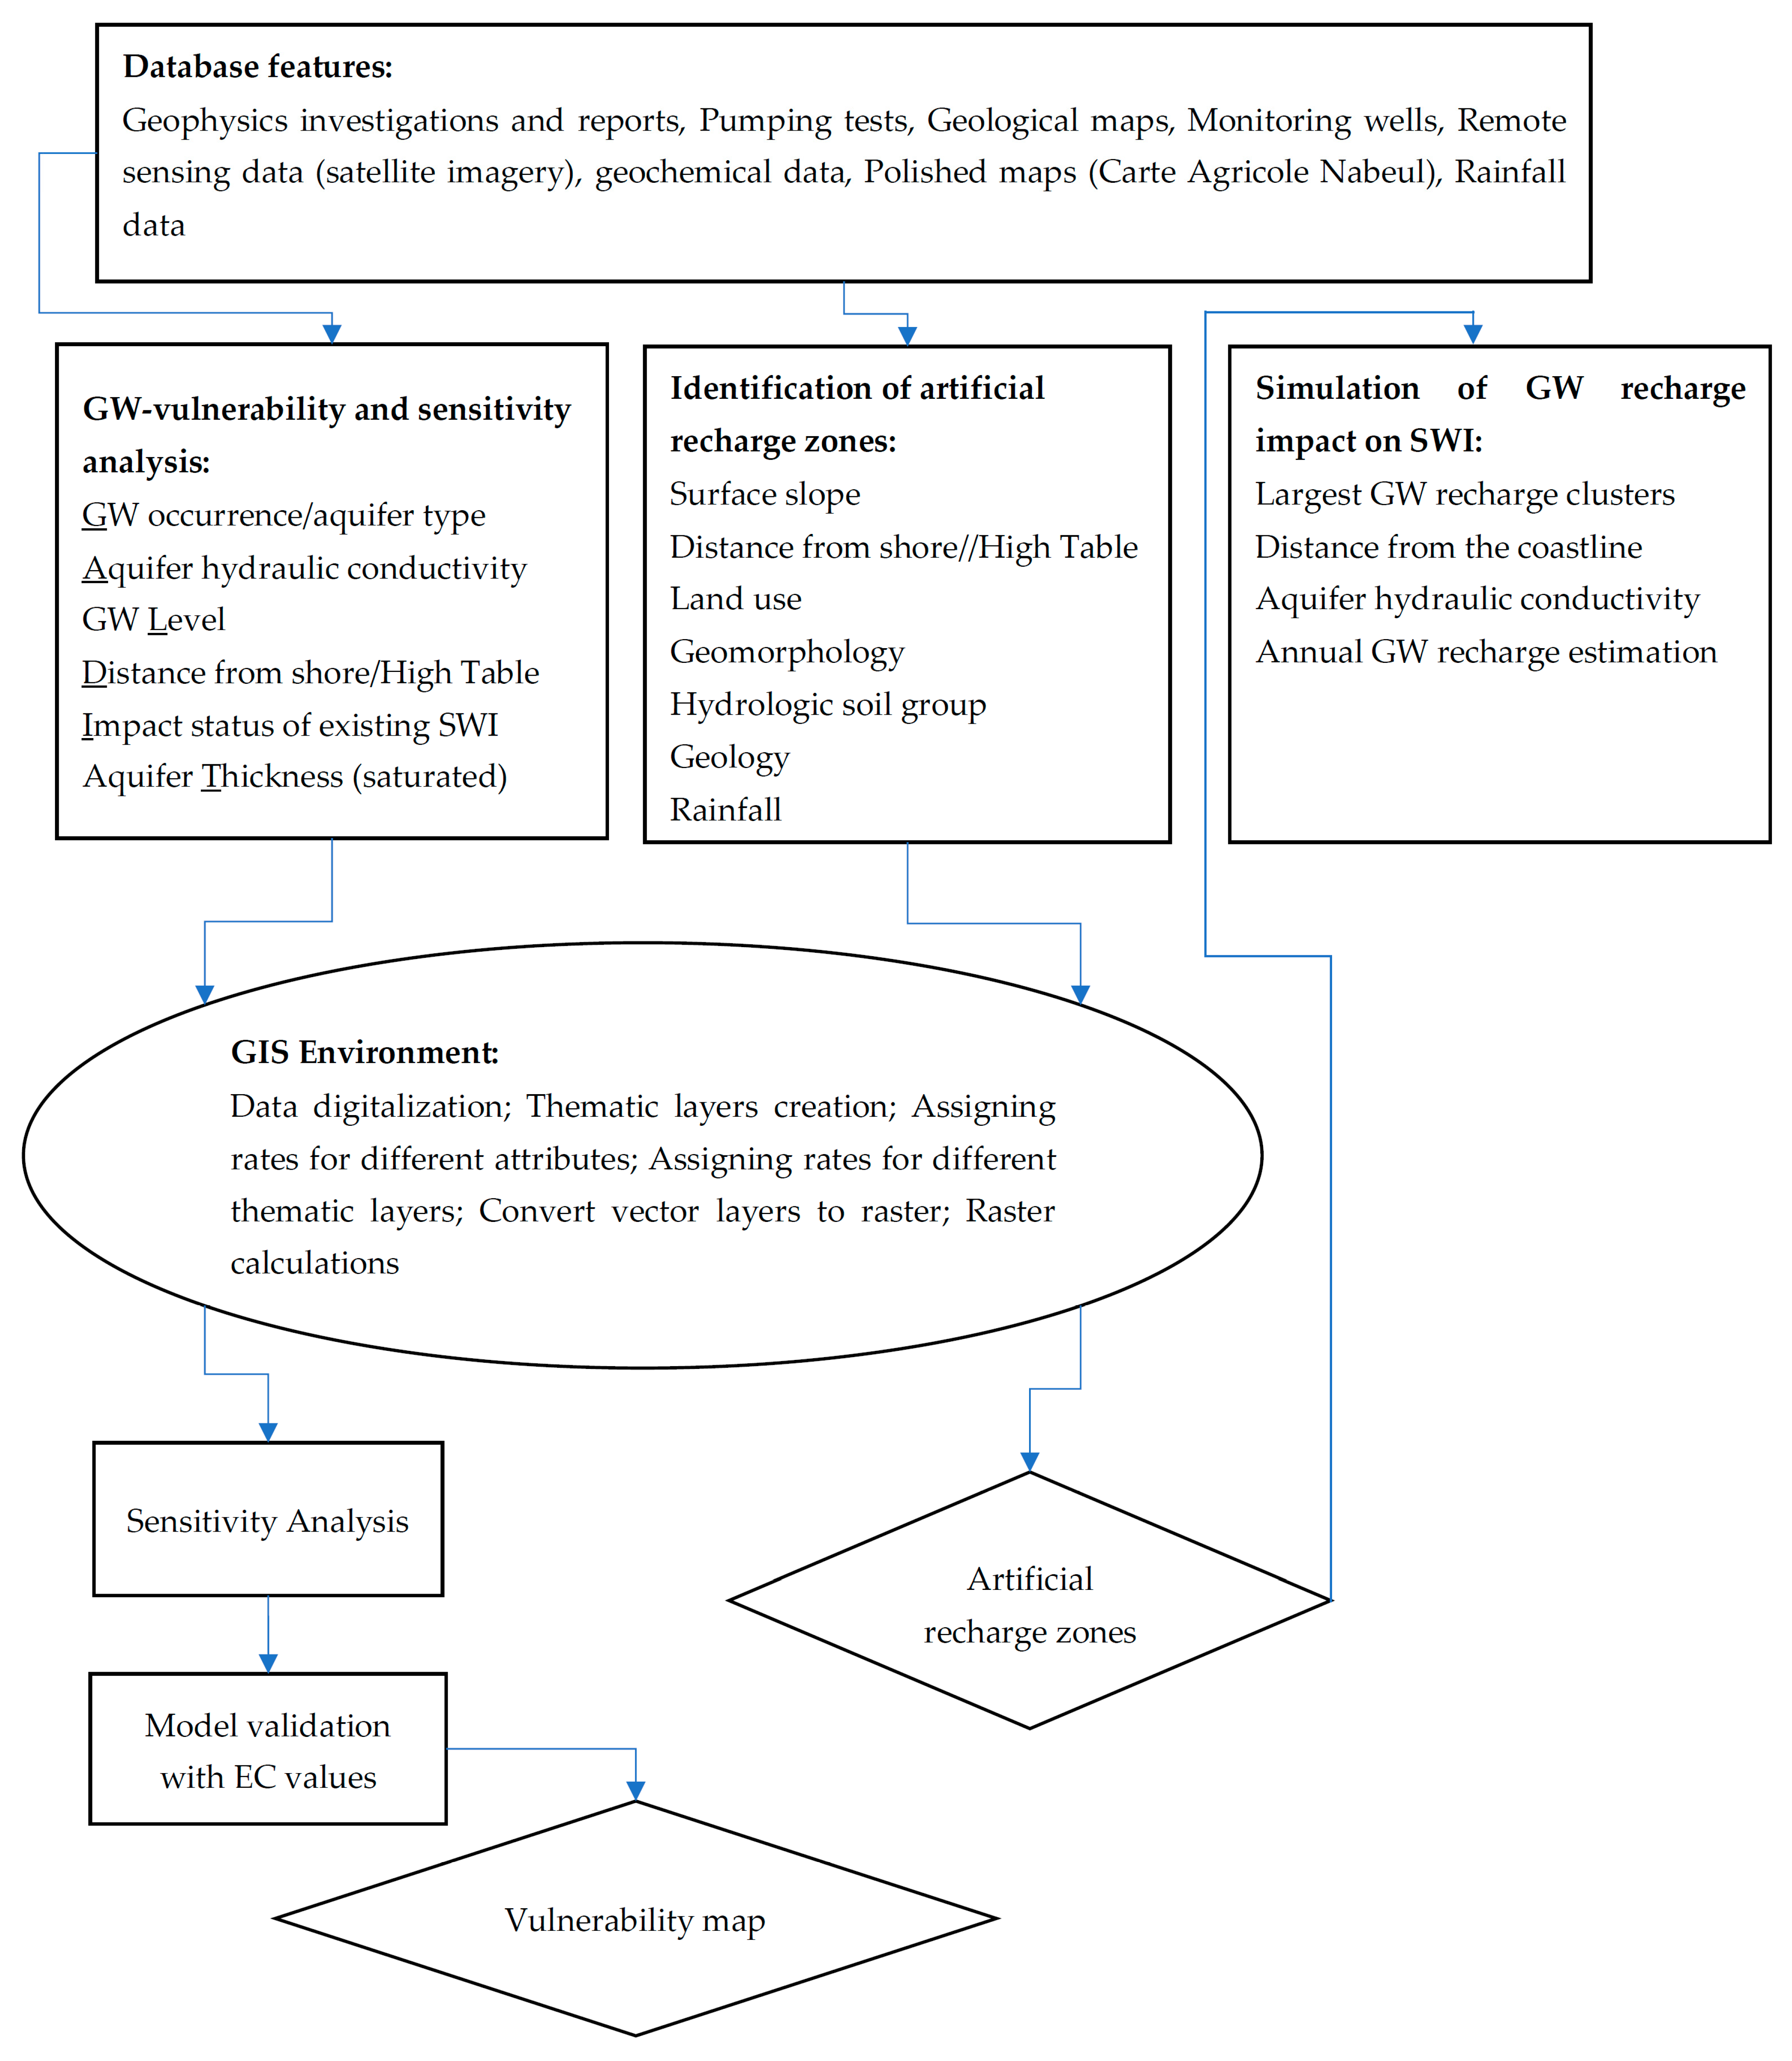
The Korba GW system is situated in the northeast of the Cap-Bon peninsula of NE Tunisia, covering 438 km2 (Figure 1A). The study region is limited to the west by Jebel Sidi Abderrahmane, to the east by the Mediterranean Sea and by Kélibia and Nabeul cities, respectively, in the north and the south. The region has a semi-arid Mediterranean climate, with a large fluctuation of temperature and rainfall. According to the Thiessen method for regional interpolation, the average temperature and rainfall are about 19.54 °C and 524.61 mm/year, respectively (1988–2019, Korba hydrometric station), which corresponds to 230 MCM of mean annual rainfall water volume. Elevations in the Korba system range from 2 to 430 m above sea level (a.s.l.). Surface water drainage is essentially from N-W to S-E, and directly discharges into the sea. The drainage network within the alluvial plain is dense due to semi-permeable formations, while the active and intense tectonics have also generated an intensive sparse hydrographic network in the broken rocky zones.
The aquifer system is made of three major geological formations (Figure 1B) [49,56,57,58]. The first one is from the Quaternary Tyrrhenian age, creating a 1.2 km wide band parallel to the coastline. This is mostly arenitic limestone with a conglomeratic layer on top [58]. The second formation of Pliocene age is represented by marine sediments deposited in the Dakhla syncline. The Pliocene lithologies are sands with alternating clay and sandstone bands. The third unit of late Miocene age, named “the sands of Somâa”, is found in the south of the aquifer system. This structure holds thick fine sand deposits of continental source, with conglomeratic strata [53,59,60]. The natural outlets of the Tyrrhenian are the coastal depressions (Korba’s Sebkhas) located at the end of the drainage network, which collect discharges of treated wastewater and irregular water exchanges with the sea. The clay existing at the bottom of Sabkhas prohibits their interaction with GW.
Two major aquifers are present in the study area, the Plio-Quaternary shallow aquifer and the Miocene entity (called sand of Somâa). The Plio-Quaternary shallow aquifer represents an unconfined system with an average thickness of 20–250 m, with high permeability values varying from 10−6 to 10−3 m/s [54,56,58]. This aquifer is considered the most productive, with a configuration that develops in the thin beds of limestone, sand, sandstones, and conglomerates interbedded within the marl formation.
The Miocene entity (the sand of Somâa) is in the southern part of the system. It is composed of principally fine sand stratums coming from a continental origin including conglomeratic level and clay lenses. It is considered an unconfined aquifer in the upstream zone but becomes confined near the coast where artesian boreholes existed from 1960 to the mid-1990s. The bedrock of the shallow system is formed by Miocene marls that underline the aquifer layers [49,56,59]. These two aquifers are divided by a thick layer of impervious marls (Figure 1C).
The Korba region is a predominantly agricultural area (61.9%), and the farmers cultivate a wide range of crops including vineyards, citrus fruits, cereals, vegetables, olives, and groves. Agricultural productivity in the area has been ongoing since the early 1960s, increasing from a cultivated area of 89 ha in 1965 [61] to 9200 ha in 2018. The irrigated perimeter is situated between Korba, Diarr El Hojjaj, El Mida, and Menzel Horr. GW pumping represents a significant source of irrigated water in the Korba zone. Extraction of GW for irrigation started in the 1960s with a withdrawal rate of 4 million cubic meters per year (MCM/year). This rate has increased to 72 MCM/year. in 2018, with more than 14,000 active wells [62].
GW pumping of 51.5 MCM in the 1980s, especially close to the sea, led to the apparition in 1996 of a piezometric cone of 5 m below sea level (b.s.l.) in the locality of Diarr El-Hojjej [49,55,56,57]. This has caused a gradual rise in seawater levels and an acceleration of the lateral SWI. The aquifer has been more extremely exploited, especially for agricultural purposes, since the 2000s.
This situation has caused GW levels to decrease steadily, leading to the apparition of a wide piezometric depression between Diar El Hojjej and Tafelloun villages, where the hydraulic head reached 15 m b.s.l. in 2018 (Figure 1D) [55]. Nearer to the Mediterranean coastline, the hydraulic gradient towards the inland is totally reversed, accelerating SWI. Besides piezometric depression, GW salinity has been increasing, reaching 15 g/L in some regions.

2.2. Workflow

The assessment of GW vulnerability to SWI involved three key steps: (i) mapping of GW vulnerability and parameter sensitivity analysis using the GALDIT model, (ii) identification of appropriate zones for GW recharge, and (iii) simulation of GW recharge impact on SWI using the hydrological parameter of “runoff fraction” (Figure 2).

2.2.1. GALDIT GW vulnerability Assessment

Preparation of Input Database

Vulnerability assessment and classification of potential SWI were carried out using the six elements of the GALDIT model [31,34]. These elements were derived from diverse databases from various government agencies to map GW vulnerability to SWI (Table 1). The digital elevation model (DEM) was accessed from the Shuttle Radar Topography Mission (SRTM) with 30 m of resolution. The aquifer type (G) map was derived from subsurface geology map of Nabeul (1:50,000 scale for the year 2005) and numerous well-log profiles of the Cap-Bon region. The Aquifer hydraulic conductivity (A) map area was prepared from several pumping test reports (transmissivity data and the aquifer saturated thickness). The depth of the GW (L) map of the Korba coastal aquifer was obtained from the static GW level and topographic altitude measured in 2018 on 136 monitoring wells and piezometers, and was produced by smooth interpolating the average GW level data. The data relative to distance from shore (D) were calculated by using the US European Space Agency’s Level 2 Bottom of Atmosphere Sentinel-2A satellite images for the coastal line of Cap-Bon peninsula. To investigate the impact of existing status of SWI (I), 56 GW borehole and well samples were collected. Finally, to validate GW GALDIT vulnerability model, the electrical conductivity (EC) obtained from the 27 collected samples was used. The data on thickness (T) were obtained from several well log reports and geophysics field investigation.
The systematic geo-processing functionalities of the GIS software, ArcGIS 10.1, were used to prepare the different thematic layers. The spatial data coverages were geo-localized on to WGS 1984, zone: 32 datum, UTM projection. The attributes of each parameter (rates and weights) were assigned in relation to their importance to SWI [47,63,64]. Depending on the importance of each factor, the GALDIT index evaluated and assigned a different rating and weight in accordance with Chachadi and Lobo-Ferreira [32], based on the consideration of the different factors influencing the local hydrogeological system.
Rating and weights were assigned to the GALIDIT parameters based on their relative significance in terms of common hydrogeological boundary conditions across the aquifer. The rating covered values ranging from 2 (low vulnerability) to 10 (high vulnerability), which were assigned to each factor based on its attributes; the higher the value the greater the vulnerability (Table 2). Weightings were also assigned to each of the six factors in consideration of their importance to SWI, which range from 1 (low influence) to 5 (high influence) (Table 2). Additionally, classification of the potential to SWI was determined by mapping the vulnerability index, which corresponds to the weighted and normalized sum of ranked scores assigned to the six factors of GALDIT.

The Korba GALDIT Index Parameters

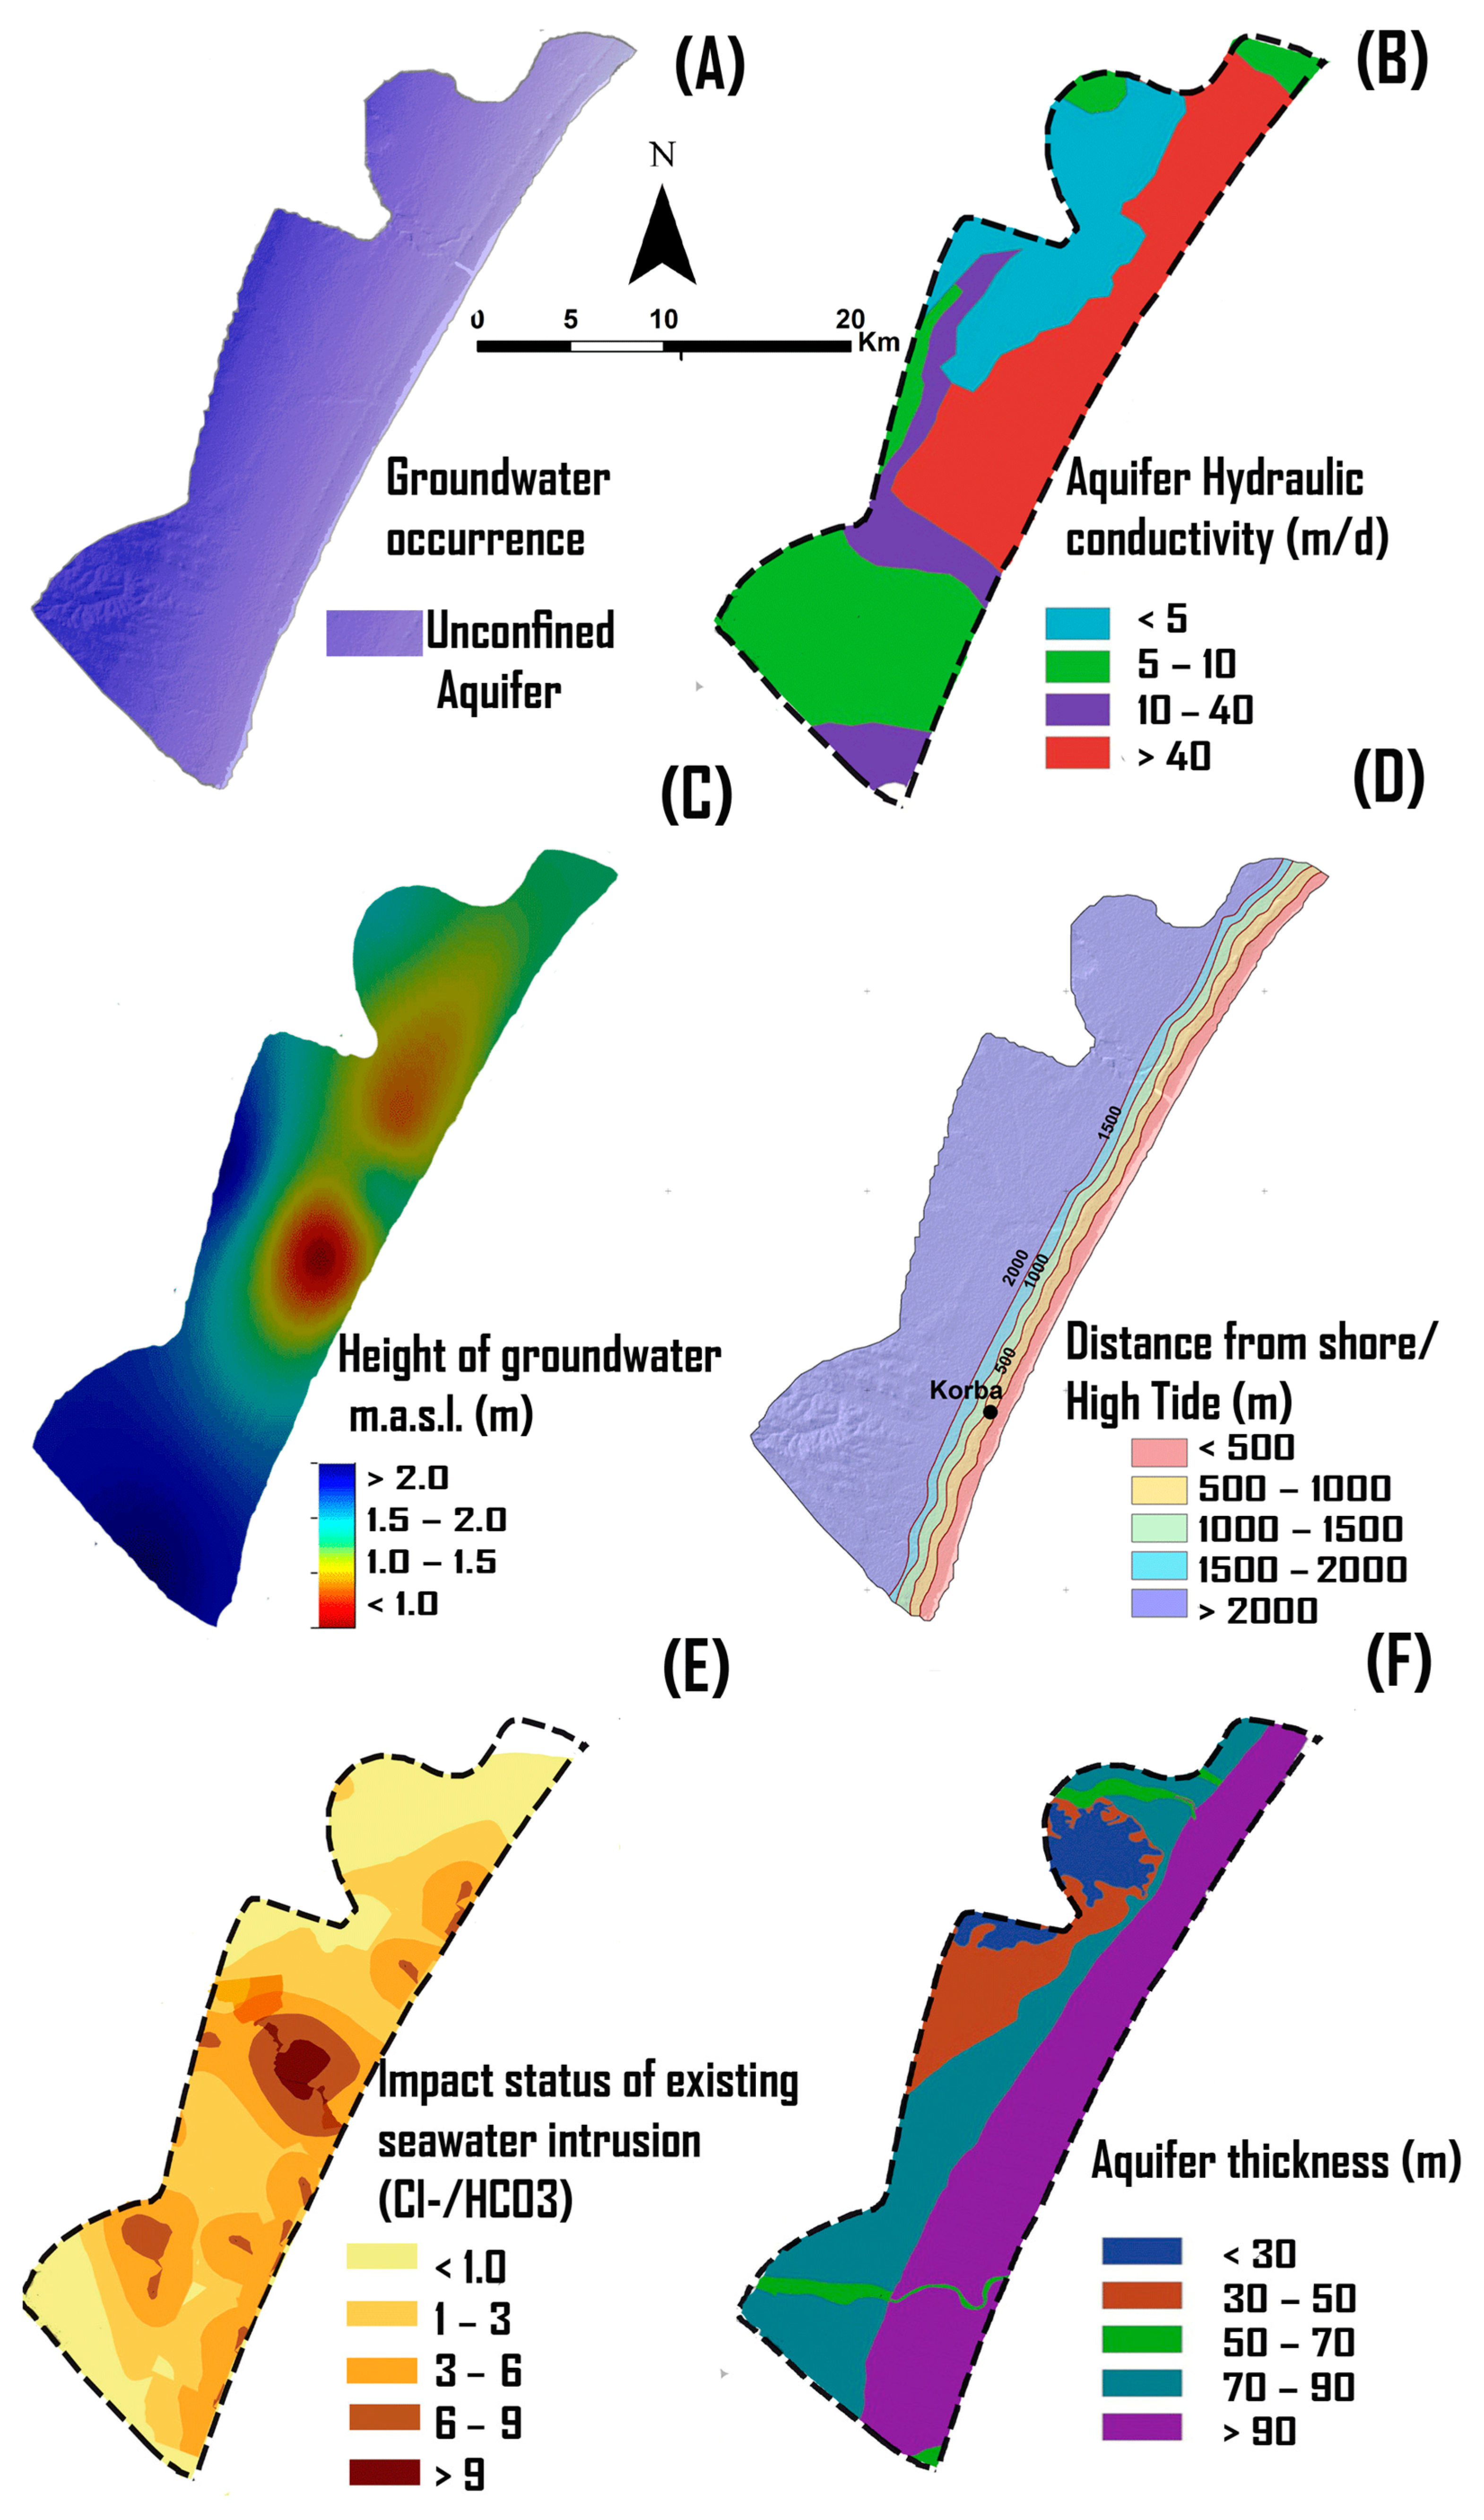
  • (G)—GW occurrence/aquifer type
The aquifer type influences the degree of SWI into freshwater, which can be categorized into bounded, leaky confined, unconfined, and confined [11,15,24]. A confined aquifer with a large piezometric cone of depression caused by GW over-pumping is more affected by SWI than other types of aquifers [24,55]. In GALDIT indexing, the highest rating (r) value of 10 corresponds to confined aquifers, the most affected, followed by unconfined aquifers (r = 8), leaky confined aquifers (r = 6), and boundary aquifers (r = 2) (Table 2).
  • (A)—Aquifer hydraulic conductivity
The aquifer hydraulic conductivity is the hydraulic conductivity (velocity) of a geological material. It is used to determine the GW flow rate within the aquifer under a given hydraulic gradient, or the capacity of the subsurface to allow infiltration from the land surface [34,39,40] permeability of the GW system [44,48]. Thus, this parameter has significant weight (3) and rating values ranging from 4 to 10 for low and high vulnerability effects, respectively. The areas with high conductivity values (e.g., over 40 m/d) are designated as highly vulnerable to SWI, whereas areas with hydraulic permeability less than 5 m/d are assigned the lowest vulnerability score in the GALDIT index (Table 2).
The hydraulic conductivity is estimated from pumping tests data by Equation (1):
K = T   b  
where K is the hydraulic permeability (m/d), T is the hydraulic transmissivity (m2/d), and b is the aquifer saturated thickness (m). The hydraulic conductivity layer is transformed to a raster grid and multiplied by the appropriate weighting factor.
  • (L)—Depth of the GW
Parameter (L)—The depth of the GW refers to the piezometric conditions and plays an important hydrodynamic function in sustaining the head pressure along the shoreline that can stop SWI movement by pushing back the saline intrusion front. The lower the depth of the GW, the lower the hydrodynamic pressure and hence, the higher risk of SWI inland. However, increasing the water table level decreases the risk of penetration of the SWI front, which protects the GW resource from salinization. GW level depth values from the mean sea level are divided into 4 categories (Table 2): <1.0, 1.0~1.5, 1.5~2, and >2 m [4,8,30,65]. The level depth less than 1 m is designed as the maximum importance rating of 10, representing the area of high vulnerability to SWI. Depth of the GW greater than 2 m is the least vulnerable to SWI, with a rating of 4. The L parameter in the Korba aquifer was produced using Surfer platform by interpolating the GW depth data measured.
  • (D)—Distance from shore
Parameter (D)—SWI impact—is directly linked to the perpendicular distance from the sea-line. Thus, the magnitude of SWI, evaluated according to meaningful distances (D), decreases significantly when displacing to the shore toward the inland, and reaches its highest amount when the aquifer is close to the coast. For the Korba study area, the map of the D-parameter was classified into five distance classes ranging from 2 (low) to 10 (high) for each distance from shore (Table 2).
  • (I)— Impact of existing status of SWI (Cl/HCO3)
Parameter (I)—The natural fresh/salt water hydraulic balance in the transition zone—will be disturbed if the region remains more unstable and anthropogenically stressed. Hence, GW over-pumping in the littoral zones may be considered to cause SWI into the land. The parameter (I) refers to the present status of GW chemistry with reference to contamination from SWI in coastal aquifer.
An important parameter to consider for SWI into GW is chloride concentration, the most dominant ion in seawater [40,53]. In addition, the chloride ion frequently forms a much larger percentage of the anionic composition of GW especially close to the shore. Carbonate is considered one of the most representative components of freshwater relative to chloride ion levels and is normally low. Therefore, the ionic ratio Cl/HCO3 was used to define the impact of existing SWI on aquifer freshwater. The aquifer is contaminated by the SWI if the Cl/HCO3 ratio is more than 3 and the SWI vulnerability is considered to be moderate to high [31,34,40].
The parameter (I) was ranked using values of 2 for locations where Cl/HCO3 ratios were very low with no impact, and 10 for locations where Cl/HCO3 ratios were computed to be above 9 (Table 2), with very high SWI vulnerability. In this study, several geochemical field surveys were carried out during 6 months between July 2019 and December 2020 from 56 GW boreholes and wells evenly distributed within the study area. The major ion concentrations were analyzed in the “Water Analysis Laboratory of the Water Research and Technologies Center (CERTE—Borj-Cédria—Tunisia)”.
  • (T)—Aquifer thickness
Parameter (T)—this parameter represents the thickness of the saturated zone and plays a significant role in defining the extension of SWI in coastal aquifers. This parameter was established from the difference between the GW level and the bottom of the aquifer and interpolated using Arc GIS10.1.

Mapping of the GALDIT Index Vulnerability

The GALDIT indicator model consists of a numerical ranking system to evaluate SWI potential in hydrogeological settings for each of the six factors (G, A, L, D, I, and T) with a raster cell size of 100 × 100 m. Each factor has a pre-determined fixed weight that reflects its relative importance to SWI. The GALDIT index is computed through the multiplication of the rating attributed to each factor by its relative weight and adding up all six products using the Map Algebra function in ArcGIS 10.1, according to Equation (2):
GI = i = 1 6 ( W i × R i ) i = 1 6 W i
where W is the weight, and R is the weight of the ith inspected parameter.
From the overlay analysis and reclassification, using geometrical interval classification, the SWI vulnerability map has a range of four categories of vulnerability (low, <2.5; moderate, 2.5–5; high, 5–7.5; and very high, ≥7.5).

Sensitivity Analysis of the GALDIT Vulnerability Index
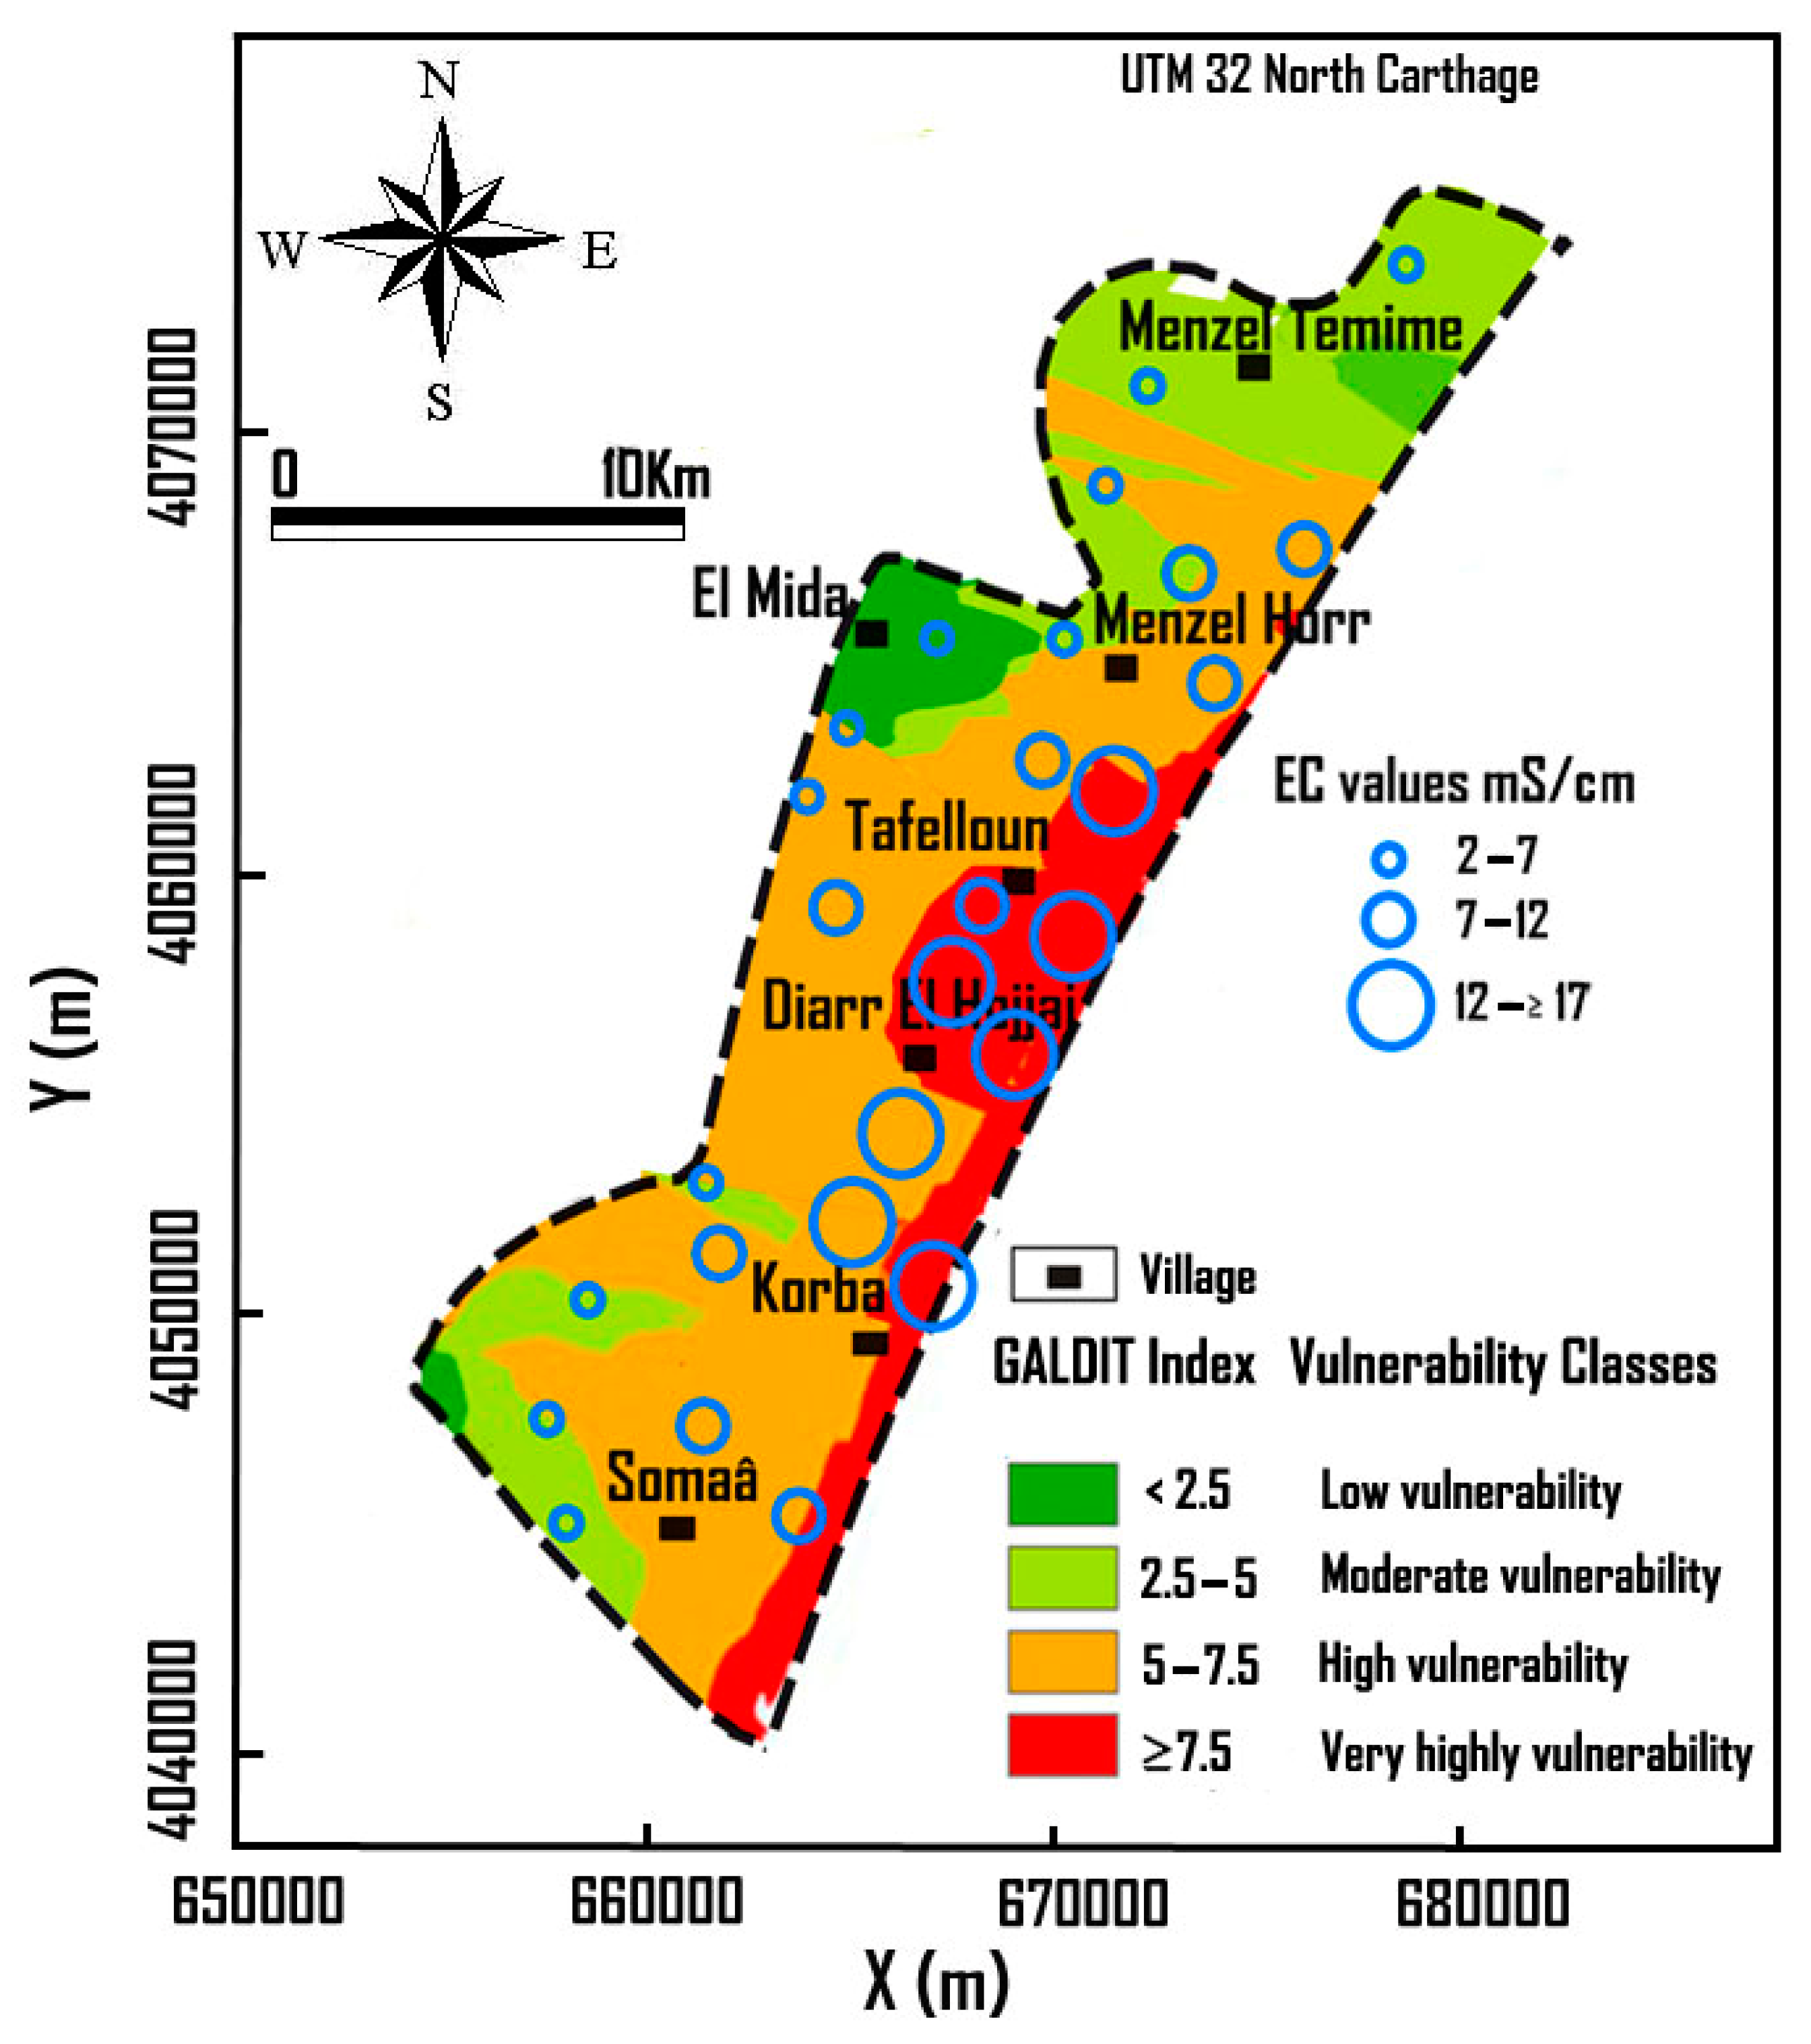
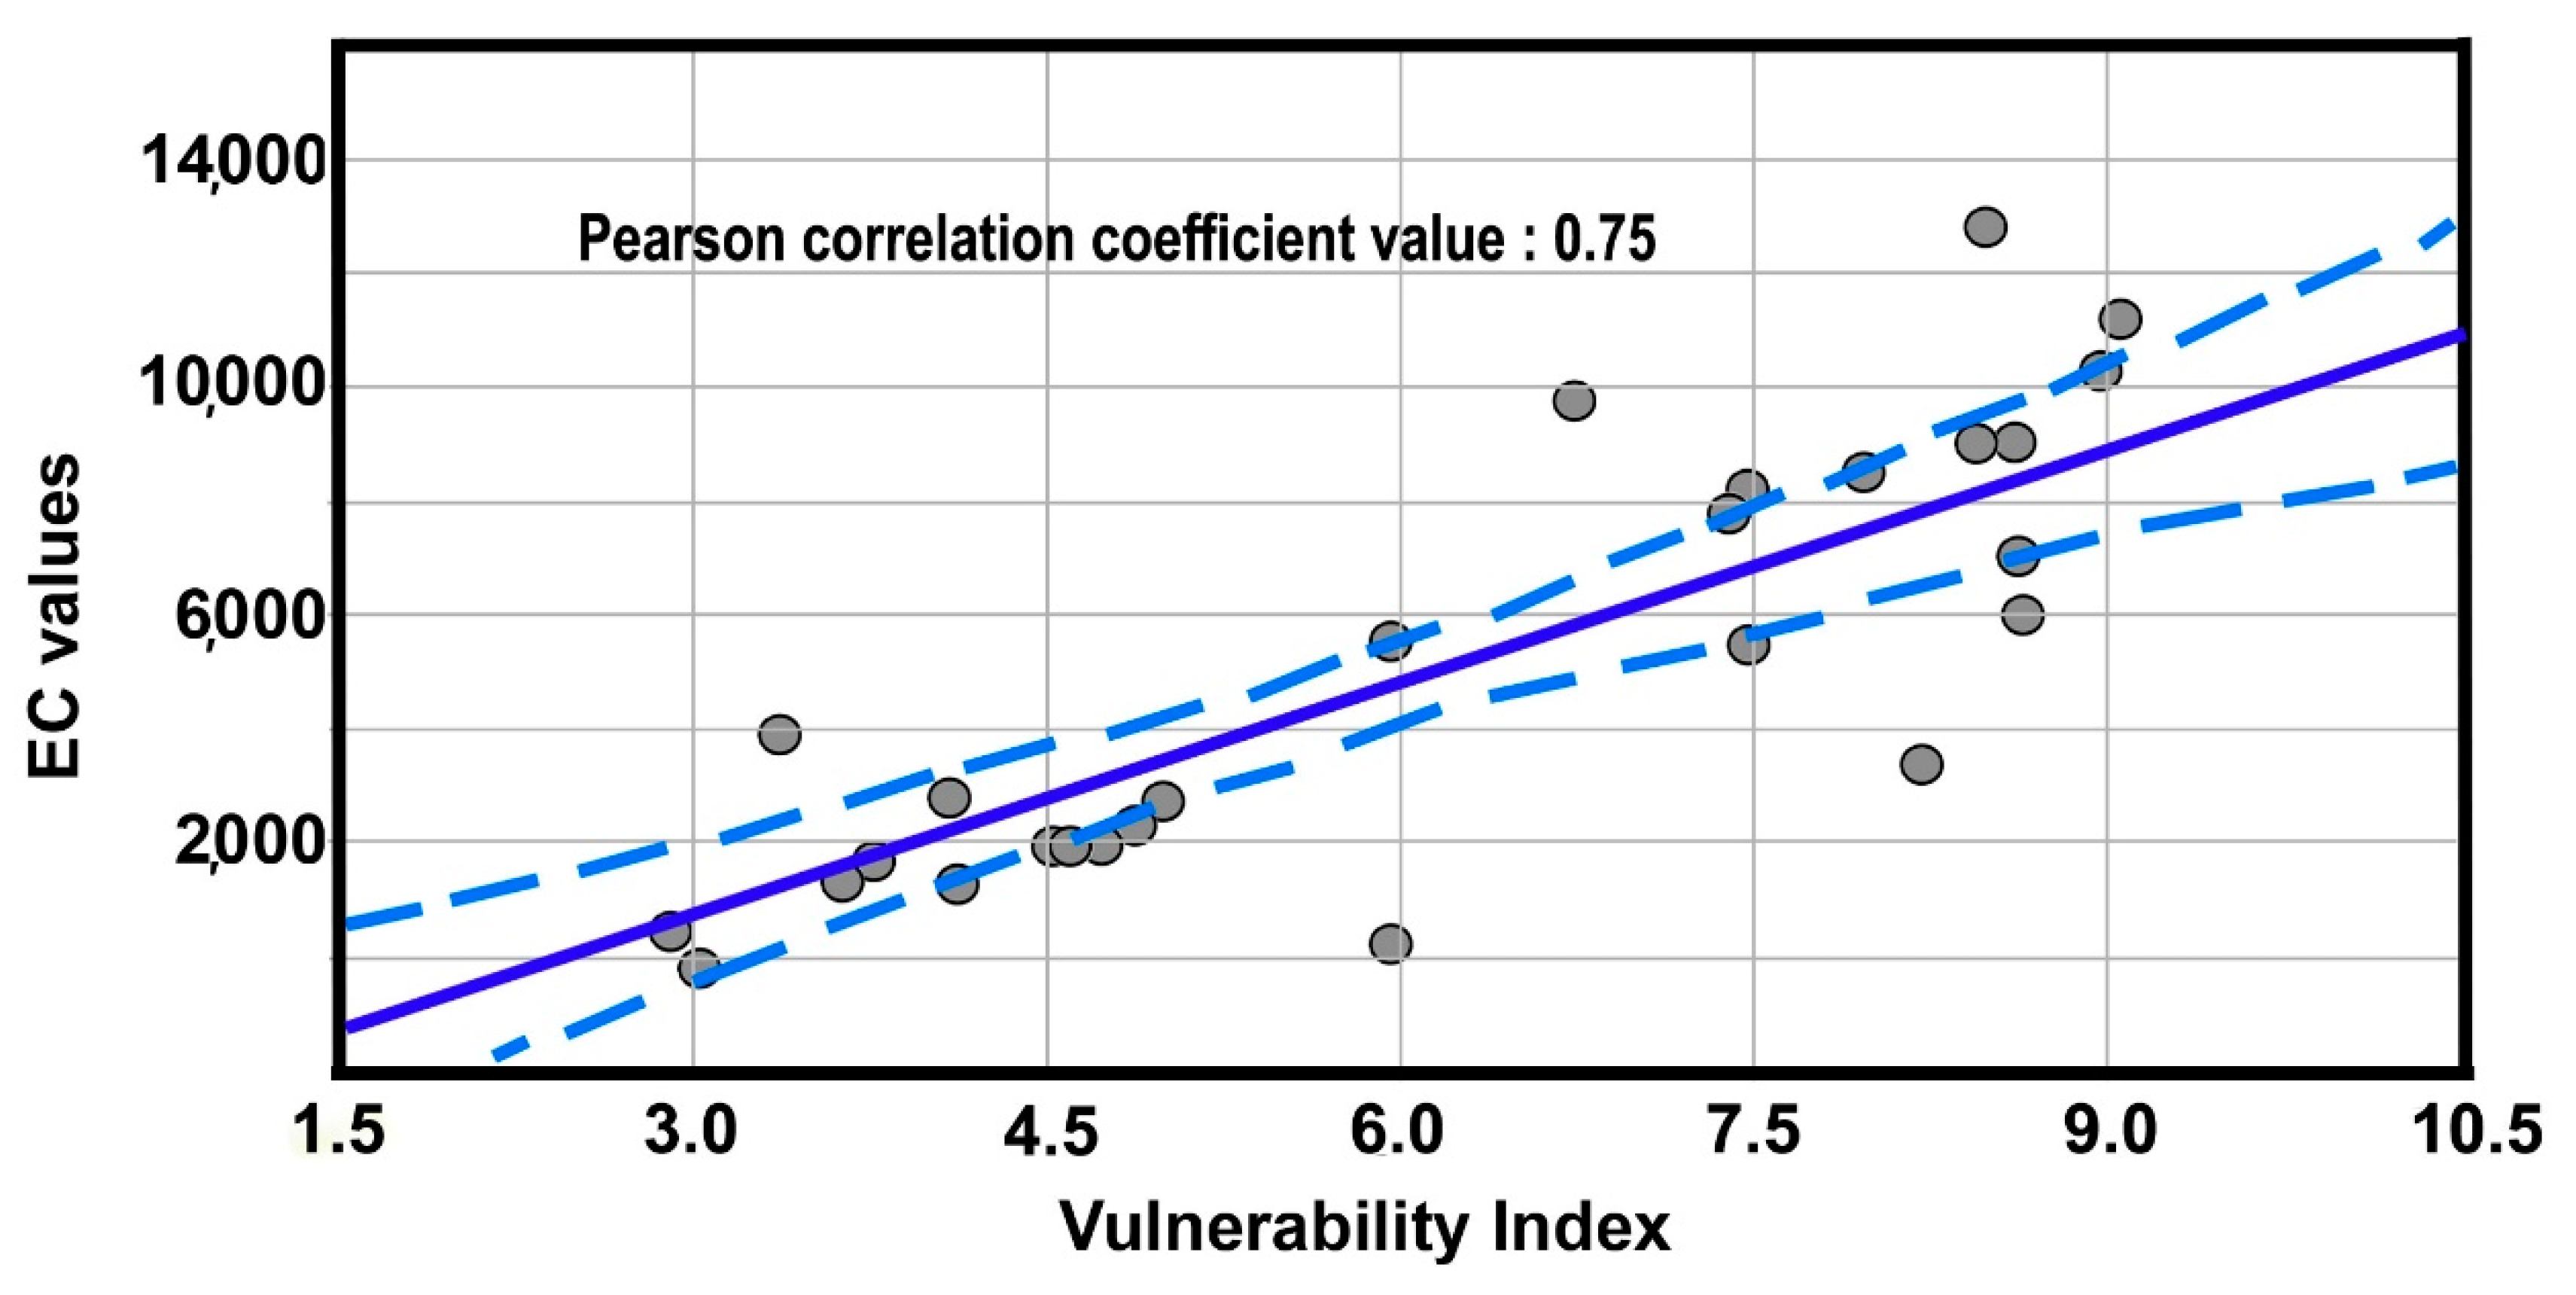
A sensitivity analysis was performed to assess consistency of the parameters of the GALDIT model in the selection of rating and weighting values assigned to the corresponding parameter. Sensitivity analysis, widely used to validate the index method, supports the analyst to judge the significance of subjectivity components, which can significantly affect the final SWI vulnerability map. The main advantage of the sensitivity analysis is in identifying the influence of a particular factor on the vulnerability of the coastal aquifer to SWI.
Two types of sensitivity analysis are widely used: the single-parameter sensitivity analysis (SPSA) and the map removal sensitivity analysis (MRSA), presented by Napolitano and Fabbri [66] and Lodwick et al. [67], respectively. The use of SPSA can decrease the uncertainty of the GALDIT model precision and help to identify the effect of each factor on aquifer vulnerability. Furthermore, SPSA provides useful information on the influence of weighting values on the vulnerability index assigned to the corresponding factor. The SPSA was estimated by Equation (3):
W i = [ P ri × P wi     V   ni ] 100
where PRi and PWi are the ratings and the weights, respectively, of the parameter P assigned to the subarea i, and Vni is the vulnerability index as computed in Equation (2).
The SPSA is calculated within the range of 1 ≤ i ≤ 10. In order to recognize the sensitivity of each factor to SWI susceptibility, a cross correlation of weighted and ratings values of thematic coverage was implemented.
The MRSA is used to evaluate the sensitivity of one or more factors by removing them one at a time [34]. The MRSA computes and measures the statistical variations of each factor though comparing with others using Equation (4):
S = [ ( V N   V n )     V   ] × 100
where S refers to the measure of sensitivity expressed in terms of variation index of a particular parameter; V and V′ refer to unperturbed vulnerability indices, calculated from the GALDIT model, and the perturbed vulnerability indices of a particular parameter, respectively. N and n are the numbers of thematic layers used to determine V and V′, respectively.

Model Validation

The results were tested and validated for determining their reliability and consistency [68]. The Pearson correlation coefficient (r) was used to evaluate the relationship between the different factors and to quantify the comparison of the vulnerability results. The r value was used to measure the linear correlation between the GALDIT vulnerability index and the electrical conductivity (EC) values. EC is a common physical parameter that can identify SWI in coastal aquifers. EC values were measured in 27 monitoring wells and the data were used in the correlation analysis. In this study, we overlayed the EC point coordinates on the GALDIT vulnerability map and used the “Extract value from point” tool in ArcGIS software to obtain corresponding GALDIT point values. The value of r is obtained using Equation (5):
r = i = 1 n ( X X a ) ( Y Y a ) i = 1 n ( X X a ) 2 i = 1 n ( Y Y a ) 2
where Xa and Ya represent the average value of vectors X and Y, respectively. The value of n corresponds to the length of the vectors X and Y.

2.2.2. Delineation of Favorable Artificial Recharge Zones

Preparation of Input Database

Integrated GIS techniques and remote sensing analysis were used for the delineation of favorable artificial recharge zones in the study area. We considered a multi-parametric data set involving six thematic layers [47,48,55], namely, geology (GE), geomorphology (GM), hydrological soil type (HS), runoff potential (RN), surface slope (S), land use pattern (LU), and distance from the shore.
The data were used to produce a wide catchment of 250 × 250 m size by applying GIS interpolation methods. The geology (G) and geomorphological (GM) maps were extracted from the soil map of La Carte Agricole of Nabeul governorate (scale: 1:50,000; year 2005), which is an official spatial data source.
This study utilized the Soil-Conservation-Service (SCS) technique for the available runoff potential component. The SCS is also widely known as the hydrologic soil cover complex method developed by the USDA and is available in the National Engineering Handbook [69]. The main inputs were the runoff curve number (CN) and rainfall amount (RA). Runoff CNs ranging from 30 to 100 were computed from the relationship between land use pattern and hydrologic soil group in the region [70,71,72,73,74]. Higher CN values indicate large potential runoff, while lower CNs indicate low potential runoff. The soil type was derived from the CN table [69] and was classified according to their infiltration rate values into four hydrologic soil groups: A, B, C, and D. The runoff CN is a function of the potential maximum soil moisture retention after runoff begins (S) as follows:
S = 1000 CN 100
The relationship between runoff (Q), the rainfall (P) and the maximum soil moisture retention potential after runoff starts (S) is obtained with Equation (7):
Q = ( P 0.2 × S ) ( P + 0.8 × S ) 100   for   P > I a
The initial abstraction (Ia) is designated as Ia = 0.2 × S.
The hydrological soil (HS) and runoff (RN) classes were interpolated using inverse distance weighted methods (IDW) [72] as the GSI mode of processing, and their values were assigned to every single grid cell (250 × 250) of the aquifer in ArcGIS 10.1. The slope map was extracted from the DEM of SRTM data, processed in ArcGIS 10.1. Finally, the land use map (with resolution of 30 m) was extracted to relevant LU classes by analyzing surface reflectance satellite images from Landsat 8 (scale: 1/500,000) using the supervised classification tool of the ENVI software. Table 3 summarizes the data sources, scale, and format.
The favorable aquifer recharge zones were delineated by integrating these thematic maps with their corresponding-weighted indices. Identifying these zones was carried out using the weighted overlay analysis technique in the Spatial Analyst tool of ArcGIS 10.1 with a grid spacing of 250 m. The overlay method requires the assignment of weights and suitable ranks to each map depending on their relative significance to each other, as indicated in Table 4. The corresponding weights and ranks were multiplied to obtain the combined value for each polygon. Afterwards, they were reclassified into groups such as low, moderate and high.

Index Parameters

  • Parameter (GE)—Geology
The favorable site for GW recharge is mainly influenced by the geological parameter. Thus, parameter GE was considered an essential factor in GW recharge, and it controls the water flow direction from the vadose to the saturated zone, making this parameter essential in selecting the suitable site for recharge. Information about geological characteristics, such as thickness of formation, grain size, type and degree of grain cementation, and rock units are the most important dynamic criteria, which define the areas into low, moderate, or high GW recharge susceptibility.
  • Parameter (GM)—Geomorphology
Parameter (GM)—geomorphology—shows a major influence on infiltration of water into the subsurface, which plays a main role in assessing the GW resources potential and prospect as it controls the underground water movement. Therefore, parameter (GM) is taken as a principal factor for the determination of artificial GW recharge sites in coastal aquifers with a high weight of 30 (Table 4).
  • Parameter (HS)—Hydrological soil
The Parameter (HS)—hydrological soil—was ordered into four hydrological groups (A, B, C, and D) based on CN table and hydrologic soil group (HSG) (Table 4). Each group of HS has a specific effect on water in terms of runoff, soil moisture conditions, and velocity of water transmission to underground, which allow estimating infiltration rate occurring after runoff has started.
  • Parameter (RN)—Runoff
Parameter (RN)—runoff—has a major contribution to the volume of rainwater that may be available for infiltration at the surface into the GW storage system. Therefore, RN availability was considered as a major source of recharge through infiltration into the subsurface and an important factor for identification of locations for artificial GW recharge. The effect of parameter (RN) varies depending on soil type, geomorphology classes, and a slightly sloping surface, which has a positive impact on the amount of surface water infiltration and increases GW accumulation, while an increasing topographic slope, on the contrary, decreases the possibilities of GW accumulation.
  • Parameter (S)—Surface slope
Parameter (S)—surface slope—is an important parameter needed to identify the suitable GW recharge sites because it directly influences the infiltration of rainfall and its intensity, surface water retention and GW movement. In addition, a slightly slopy topography impedes runoff by retaining surface water and permitting maximum water percolation into GW. These flat areas are considered as the most suitable zones for artificial GW recharge implementation (Table 4).
  • Parameter (LU)—Land use
Parameter (LU)—land use—is a very significant parameter for vulnerability assessment and an important indicator for identifying water areas that are suitable sites for artificial GW recharge. The weights of the LU classes were associated with the respective soil types, their respective features influencing the GW recharge, and their occurrence (Table 4).

2.2.3. Simulation of the Impact of Artificial GW Recharge on SWI

Under natural freshwater–seawater conditions, the seaward movement of freshwater prevents saltwater from encroaching on coastal aquifers. This hydraulic interface is known as the diffuse zone where freshwater and saltwater mix, which can be retained close to the shore or far below the land surface. This zone is denoted as the Ghyben–Herzberg zone of transition or the zone of dispersion [75,76].
When the Ghyben–Herzberg zone increases, the piezometric level of water table will drop due to unsustainable exploitation of GW. Consequently, the hydraulic gradient between the seawater hydrostatic pressure and the freshwater flux landside decreases, inducing a landward movement of the saltwater interface. Therefore, control over SWI is realized by the conservation of an appropriate hydraulic balance between water being recharged into GW system and water pumping from it. In addition, any level increase (a.s.l.) of the water table, through artificial GW recharge, will rise the depth of freshwater at that position and will move forward the Ghyben–Herzberg interface towards the sea and will retrieve the dispersion zone [75].
Based on the delineation of favorable aquifer recharge zones, we computed estimates of the volume of water discharge (Q0) necessary to conserve the hydraulic balance between the fresh/saline water heads to inhibit the inversion gradient of seawater in the aquifer by pushing the Ghyben–Herzberg interface seaward (Equation (8)) [77,78,79]. The model accounts for parameters such as freshwater–seawater density, amount of recharge water, length of SWI, permeability of the GW system, and piezometric level of seawater.
Q 0 L + PL 2 2 = K f 2 × ( Δ γ γ f ) × ( γ s γ f ) × Z 0 2
where, Q0 is the water discharge required to safeguard the seawater against imposing beyond a specified border (m3/s/m), L is the SWI length (m), P is the recharge (m/s), Kf the hydraulic permeability (m/s), γs and γf are the weight density of seawater and freshwater (N/m3), respectively, Δγ = γs − γf (N/m3) and Zo are the seawater potentiometric head (m).

3. Results and Discussion

3.1. GALDIT GW Vulnerability Assessment

3.1.1. GALDIT Parameter Ratings

Figure 3 shows the six thematic maps used to obtain the GALDIT SWI vulnerability index.
G—GW occurrence: The Korba aquifer is unconfined, with an average thickness of 20–250 m, and composed of sand, sandstones, and conglomerates interbedded within the marl formation (Figure 3A).
A—Aquifer hydraulic conductivity: In the Korba region, there are some zones of high hydraulic conductivity along the littoral band of the aquifer, and near Chiba and Tafelloun villages, with hydraulic conductivity values exceeding 40 m/d (Figure 3B). These areas, described by Quaternary alluvium plains with high contents of sand or fine sandstone, were found to be highly vulnerable to contamination brought in by SWI. The southern part of the studied zone has permeability values ranging between 5 m/d and 10 m/d, which suggest low SWI vulnerability. This zone is characterized by lithological formations of impervious marl [24,54,60].
L—GW level: Nearly 33% of the aquifer extent has a water level below sea level (Figure 3C); therefore, the GALDIT rating values for this factor fluctuated from 8 to 10. The lowest levels were observed along the coast-band and at 3000 m, far from the sea, showing several cones of depression reaching 15 m b.s.l. These regions are extremely vulnerable to the SWI caused by extensive GW uses for agricultural purposes. The hydraulic gradients, with an average magnitude ranging between 0.8 and 2.7%, were inverted toward the coastal part of the GW system, leading to an acceleration of SWI. However, moving away from the shore by about 1 km, the GW level is around 2 m and the ranking assigned was between four and six.
D—Distance from shore: The zones close to the seacoast (D < 500 m) have the highest vulnerability to SWI (rating value of 10), while for offshore distances of more than 2000 m, a low rating of two was assigned (Figure 3D). As the most important SWI parameter, this factor was multiplied by a weight of five when computing the GALDIT GW index.
I—Impact status of existing SWI: The chloride and bicarbonate concentrations varied from 300 to 13,470 mg/L, and 106 to 1120.81 mg/L, respectively. The area near the shoreline and in the central zone at 2.50 km inland has the highest vulnerability to SWI, with high chloride concentrations varying from 6000 to 13,000 mg/L. The lowest concentration of bicarbonate was observed in the northern and western areas, and it is high in the southern parts.
The Cl/HCO3 ratio (Figure 3E) indicated a very good spatial correlation with the decreasing GW water levels near to the coast and in the central part, which can be attributed to GW overdraft and/or a natural decline in GW recharge. We constate that the areas of south and north of Korba area have moderate concentrations of Cl (347–721 mg/L), HCO3 (102.05–106.02 mg/L), and Cl/HCO3 (3.40–6.80), reflecting moderate to low SWI vulnerability.
T—Aquifer thickness: For aquifer thickness, the GALDIT index varied from a low value of 2 to a high value of 10, with five vulnerability classes, extending from very low for very small thickness (<30 m) to very high vulnerability for very large thickness (>90 m) [73,80]. The Korba aquifer thickness, about 90 m, was observed along the coast, where the vulnerability to SWI intrusion ranking was the highest (value of 10 for maximum vulnerability impact). However, the interior part is under 70 m of aquifer thickness, and the lowest vulnerability ranking of two was attributed to the areas where the aquifer thickness is less than 30 m (Figure 3F).

3.1.2. GALDIT GW vulnerability Map

The Korba GALDIT index map (Figure 4) showed a very high vulnerability index (≥7.5), ranging between 7.5–9.83, mainly located parallel to the coast of the study area (discharge areas), as well as the areas at a 3000 m inland band between Diarr El Hojjaj and Tafelloun villages, extending in an east–west direction. These areas, covered by sandy sandstone formations and characterized by intensive vegetable farmland, fall under very high vulnerability to SWI, representing nearly 20.3% of the study area. This is linked to the parameter (D)—distance from shore being <0.5 km, parameter (I)—impact of existing status of SWI ranging between 26 and 34, parameter (A)—hydraulic conductivity of mostly >40 m/day, and an important GW level b.s.l. (−10 to 2 m).
Moreover, the GALDIT index map revealed a high vulnerability with index values ranging from 5 to 7.5, which accounted for 44.2% of the study area; this area is mostly linked to the distance from the sea, being 2.5–5 km, and the GW aquifer thickness is <50 m. The moderate and low vulnerability zones (index values ranging from 2.5 to 5 and <2.5, respectively) were in the western part of the Korba aquifer far along the Mediterranean coast, with a distribution percentage of about 19.3 and 16.2% respectively. The piezometric drawdown of the aquifer was not obvious in these regions. Consequently, these areas were not prone to SWI.
Based on Zghibi et al. [24], the vulnerability map established with their DRASTIC model is in strong agreement with our SWI GALDIT map, showing the same spatial vulnerability. The outputs of both the GALDIT and DRASTIC models introduce depth to GW and hydraulic conductivity as the most significant parameters. Depth to GW has the most effective weight in both models, with 31.18% in GALDIT and 25.15% in DRASTIC [24], followed by hydraulic conductivity, with 19.5 and 20.59% [24], respectively.
The high hydraulic conductivity of the geological features, as well as the increased over-exploitation of the GW resources for various industrial purposes and irrigation water supply, are the main parameters directly connected to pollution control, particularly when the depth to GW table is shallow. The results show that the mapping GALDIT index clearly explains the vulnerability of GW to pollution from SWI. These results confirm the dominant SWI into aquifer anomaly highlighted with the spatial distribution of piezometric head.

3.1.3. GALDIT GW Sensitivity Analysis

Table 5 shows statistical summaries of the six rated factors regarding the range of sensitivities of each parameter. The statistical results show that the SWI vulnerability is controlled by two key parameters, parameter (D)—distance from the shore, and parameter (L)—depth of the GW level; the estimated mean values are 30.3 and 24.8, respectively. This may be due to the high theoretical weights assigned to these factors (five and four, respectively) and the associated implication for contaminant transport in the coastal aquifer.
It appears that the areas along the sea’s eastern border are more exposed to SWI than the interior part due to the saltwater discharge [32,33,34,35,36,37,38,39,40,41,42,43,44,45,46,47,48,49,50,51,52,53,54,55,56,57,58,59,60,61,62,63,64,65]. Thus, the coastal aquifers always show higher piezometric oscillations in facing SWI. Over-pumping of GW is probably leading to a drop in the freshwater hydraulic head at the transition interface [66,67].
Other GALDIT factors such as parameter (A)—hydraulic conductivity, and parameter (I)—impact existing status of SWI were also observed to be greatly sensitive to SWI, with an estimated sensitivity value of 19.5 and 18.6, respectively. The rest of the other GALDIT parameters represented by parameter (T)—aquifer thickness and parameter (G)—aquifer type layers, with a sensitivity value of 13.1 and 6.2, respectively, might also accelerate SWI vulnerability, but to a narrow extent and when hydrogeological settings favor.
The SPSA results show that parameter (D) is the most sensitive factor to SWI, with an estimated mean effective weighted value of 5.98% (Table 6). This sensitivity could be attributed to the relatively high theoretical weight assigned to the D coverage (27.78%) and the position of the aquifer being very close to the coast reciprocal motion of SWI landward [70,71]. Following, the parameter (L)—depth of GW level—already inflexed with seawater processes is also a main influencing parameter for salinization of GW reserves by SWI, especially in areas near to the coastline; this gives parameter (D) an effective weighted mean value of 3.85%. Other parameters such as impact status of existing seawater (I), aquifer hydraulic conductivity (A), thickness of the aquifer (T), and aquifer type (G) are also influencing parameters for SWI, with estimated mean values of 3.58, 3.60, 2.95, and 1.98, respectively. All weighted parameters result in a higher value for parameter (D), wherein the theoretical weighting value increases from 27.78 to 29.96% of the effective weighting rate. Additionally, some factors such as the impact of existing status of SWI (I), the thickness of saturated zone (T), and depth of GW (L) increased from 16.66 to 17.87%, from 11.11 to 13.40%, and from 22.23 to 23.73%, respectively, in their theoretical to effective weights, respectively. This growing of effective weight confirms that saline water bodies exert an important hydraulic pressure toward SWI vulnerability distribution, especially in the coastal areas [63,72]. The rest of the factors, such as parameters (G) and (A), were calculated to have a significant diminution in their theoretical to effective weights, from 5.56 to 2.73% and from 16.66 to 12.31%, respectively, displaying minor sensitivity to the SWI vulnerability of the aquifer.
Table 7 shows the statistical summaries of MRSA of GALDIT factors. The highest sensitivity index was observed upon removal of the parameter (D)—distance from shore and parameter (L)—depth of GW level layers from the calculation, with variation index values of 24.12 and 18.02%, respectively. This could be due to the high theoretical weights assigned to theses layers, 27.78 and 22.23%, respectively (Table 6). Moreover, these results can be attributed to the high coefficient of standard deviation of D and L layers (27.15 and 19.20, respectively, Table 7), revealing the extent of the vulnerability variability in relation to the mean value.
The MRSA of the rest of the parameters showed a similar effect. The vulnerability index looks to be sensitive to the removal of parameters (A) (7.92%) and (I) (5.12%) layers despite these factors being theoretically less important (weights of three). However, less variability was expected with the exclusion of parameters (T) and (G) layers, with mean variation indices of 2.92 and 2.03%, respectively, because T and G layers had the lowest theoretical weights of one and two, respectively (Table 7). The variation index of 11.12 was observed when parameters (D) and (I) were removed, making these factors the most sensitive to SWI [63,70]. The removal of parameters (D) and (I), followed by parameter (T), seemed significantly sensitive to SWI vulnerability at the index variability of 8.13. Finally, the removal of the most parameters (i.e., G, A, L, D, I, and T) had a moderate variation index value of 4.88 (Table 7).
The decrease in variation index with the addition of layers was expected due to the redundancy of certain factors having minimal sensitivity to SWI in the coastal GW systems. The results of the MRSA indicate that the removal of each factor will influence GW vulnerability to SWI, and it is necessary to use all the six factors to work out the vulnerability index in the Korba aquifer.

3.1.4. GALDIT GW Model

The validation results showed a strong Pearson correlation coefficient value of 0.75 (Figure 5) and revealed a high similarity between EC and SWI vulnerability distributions, confirming the SWI contamination of freshwater in Korba aquifer. The EC values varied from 1.83 to 21 mS/cm. The highest value was observed in the eastern shallow areas of the aquifer and along the shoreline, exceeding 19 mS/cm. The lowest EC value was detected in the Korba area’s western and northern parts. The existence of high EC values far to the sea coupled with the low SWI vulnerability degree can be explained by GW salinization, linked to geochemical processes of evaporitic dissolution and cation exchange [55,56,57,58,59]. These results demonstrate that the GALDIT model can be successfully applied and validated in this context; we also confirmed that the Korba coastal aquifer is threatened by SWI into the GW system. The use of the GALDIT technique to assess GW vulnerability to SWI is a viable approach for GW security planning and land use, as proven in this research as well as previous findings elsewhere [81,82,83].

3.2. Mapping of Artificial Recharge Zones

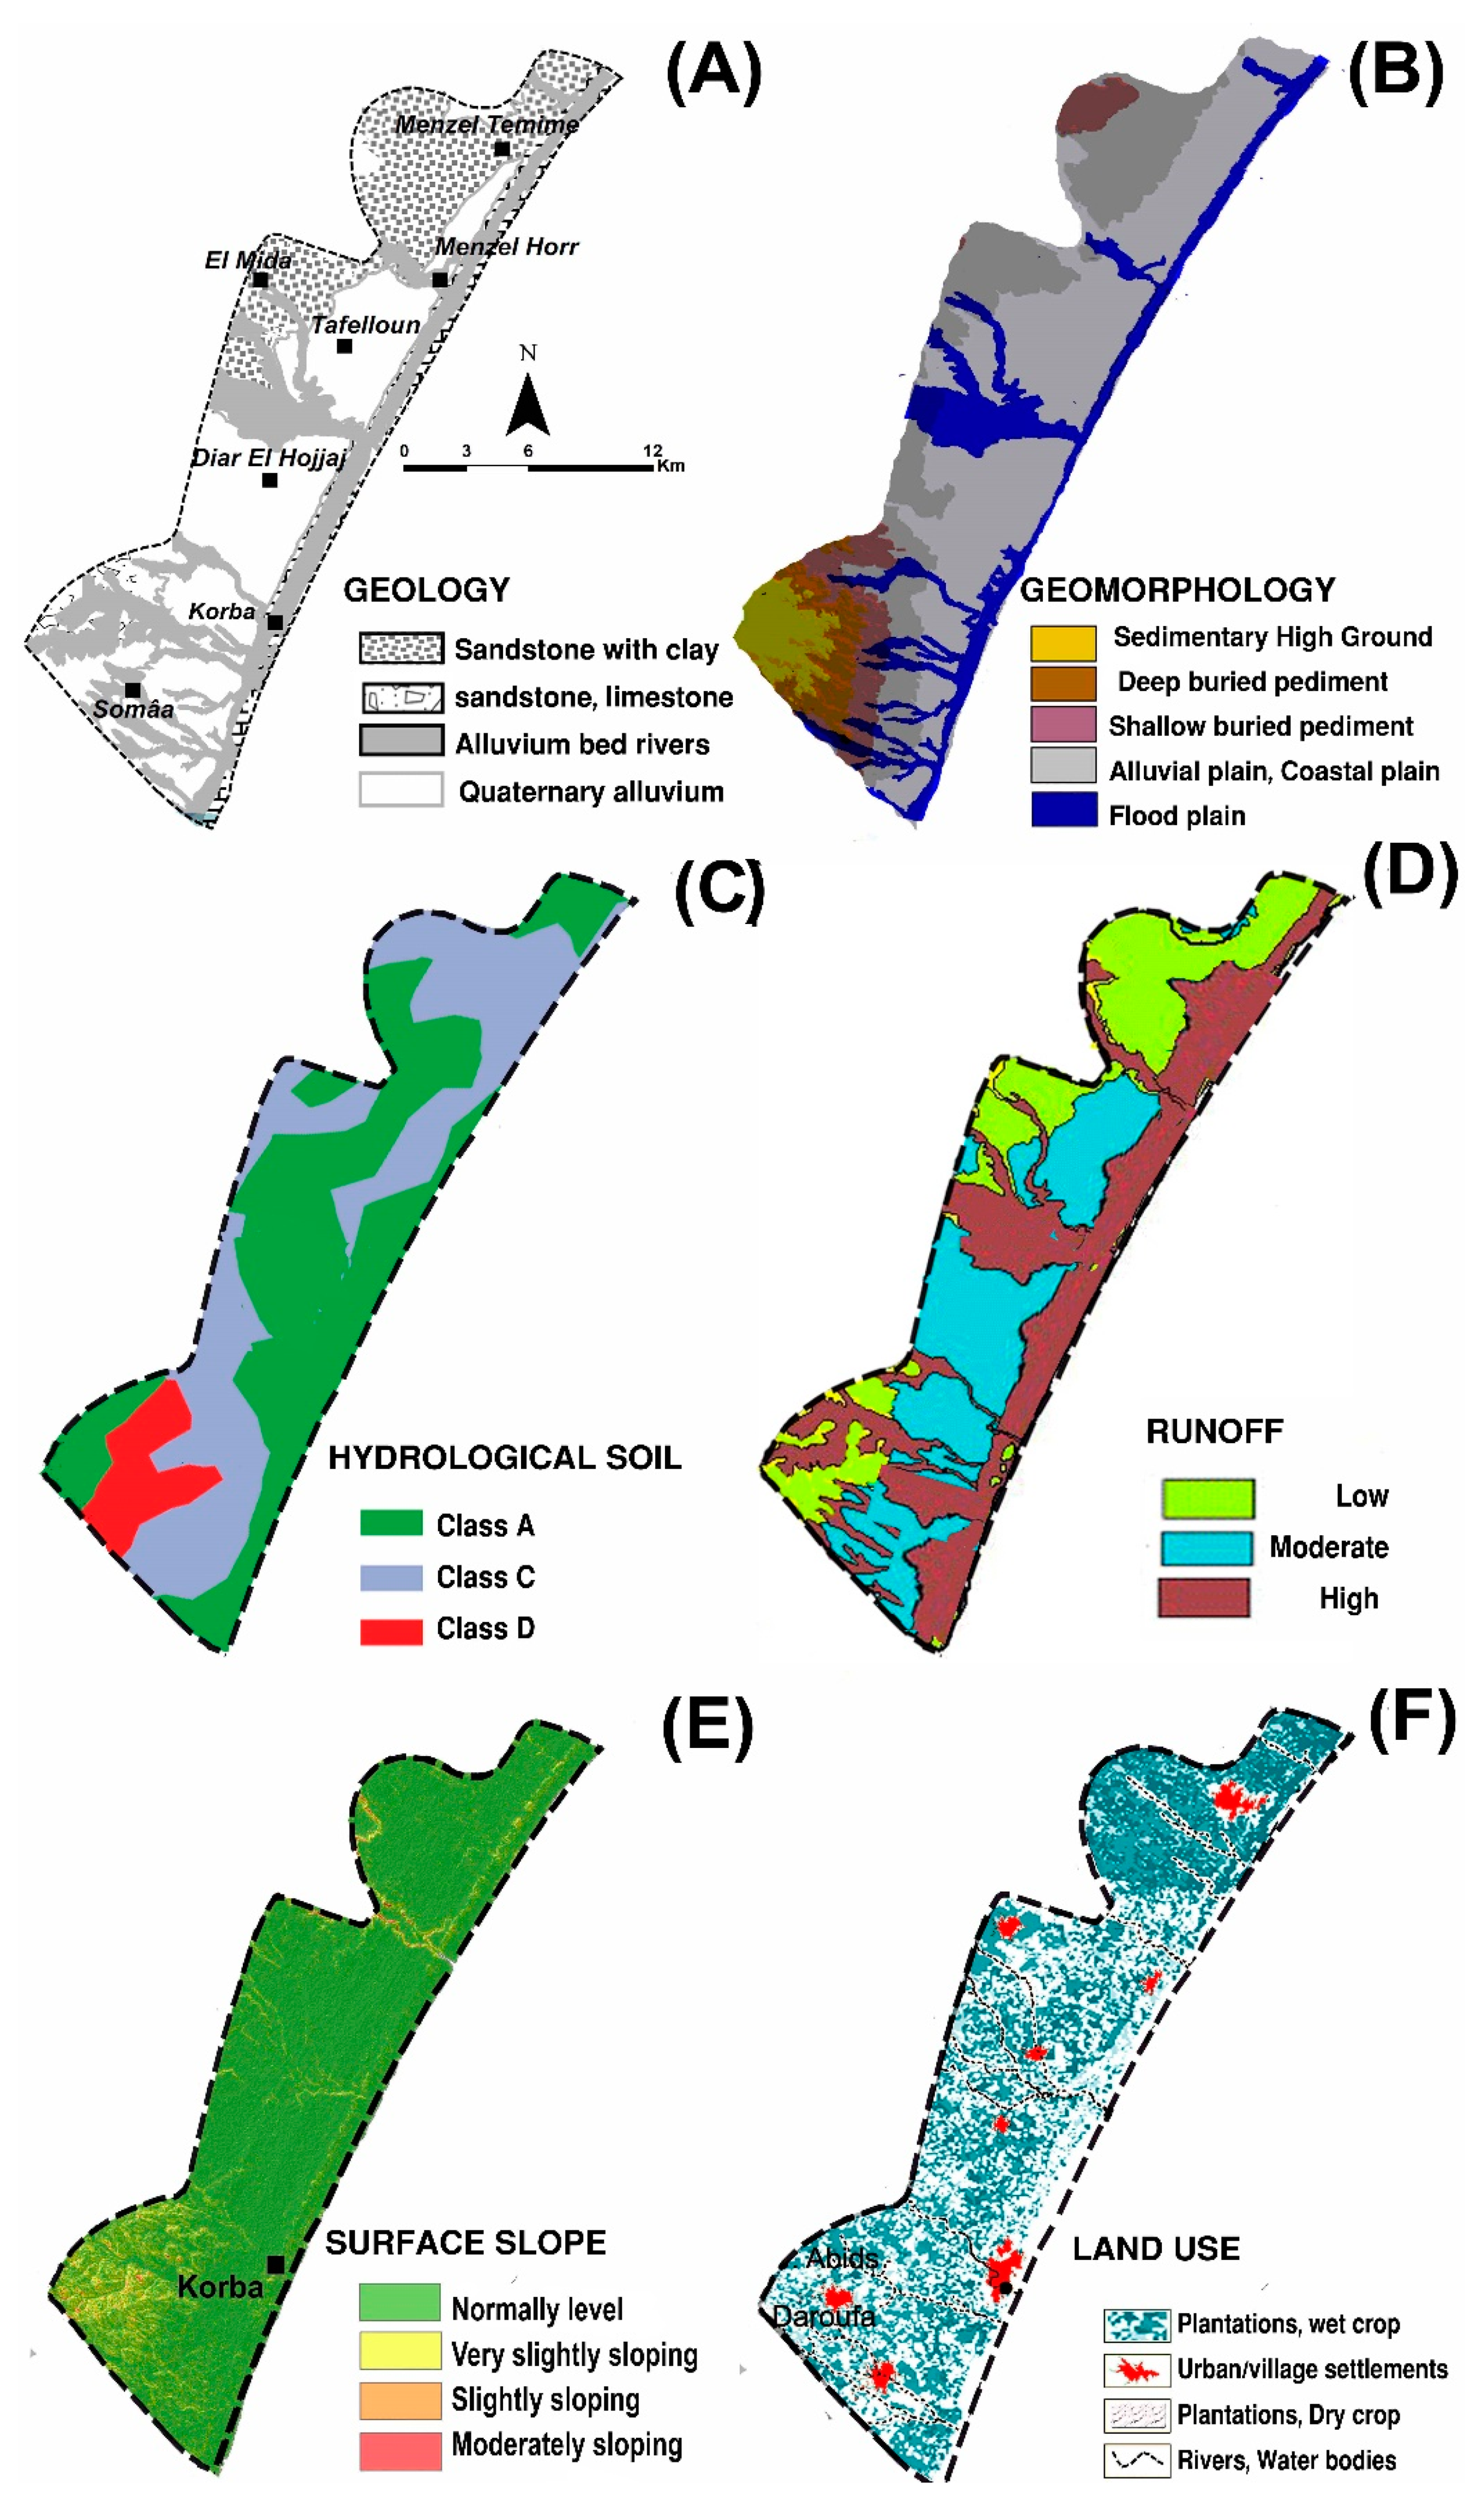
3.2.1. Index Parameters for Delineating Favorable Artificial Recharge Zones

Figure 6 shows the six parameter maps used to delineate favorable GW artificial recharge zones in the study area.
  • Parameter (GE)—Geology
Four types of geology, namely quaternary alluvium, alluvium bed rivers, sandstone–limestone, and sandstone with clay, were found in the study area (Figure 6A). Quaternary alluvium generally occupies the large part of flood plains of Korba. The impact of these flood valleys on the GW recharge rate is that water is high if composed of a permeable material. In addition, the higher raking value of 60 in Table 4 is assigned to the quaternary alluvium sediments, named Sable of the Somâa, and located in the center of the aquifer between Chiba and Somâa villages (43%; 188.34 km2), and to the alluvium bed river areas with a high recharge rate (21%; 91.98 km2). However, the south-western (2.1%; 9.20 km2) and northern parts (33.9%; 148.50 km2) of the study area are generally considered as a poor zone for GW recharge, with a lower ranking value of 15, corresponding to sandstone–limestone and sandstone with clay of Pliocene formation, respectively.
  • Parameter (GM)—Geomorphology
In the Korba study area, there are five major GM sub-classes identified, which include flood plain and beach, alluvial plain of coastal plain, shallow buried pedi-plain, deep buried pedi-plain, and sedimentary high ground (Figure 6B). Flood plain form is scaled by a ranking value of 120 (Table 4). It is occupied by upland and pediment zones and occupies 9.01% (39.5 km2) of the surface area with continental sandy layers and clayey lenses, considered as moderate GW prospect recharge zones. The deep buried pedi-plain and highly sedimentary ground, observed at the southern and eastern ends of the study area, occupies 4.32% (18.92 km2) and 7.59% (33.24 km2) of the area, respectively; they are described by high sloping, smaller amounts of surface water infiltration and high surface runoff, characteristic of a poor artificial recharge site.
  • Parameter (HS)—Hydrologic soil group
The study area comprises three major soil types, A, C, and D, which cover areas of 175.2 (40%), 138.96 (42%), and 78.84 (18%) km2, respectively (Figure 6C). Rank and weight have been subjective to each hydrological soil unit after considering the types of soil and their correspondent infiltration rate, indicating that soil types predominantly used for intensive cultivation such us vineyards, citrus, fruit trees, cereals, and vegetables are the most suitable for artificial recharge planning.
  • Parameter (RN)—Runoff
Most of the study area, mostly flat to gentle slope (56.8%; 248.78 km2), falls under high runoff potentiality because of the highly favorable infiltration ability of topsoil, with respect to time of percolation of runoff water on the other side (Figure 6D). However, the north-western part (23%; 100.74 km2) of high runoff and the mostly moderately sloping land area with low surface soil infiltration has capacity to recharge GW and influences GW potential.
  • Parameter (S)—Surface slope
Slope maps included four slope classes, namely very low or normal level (0–5%), low or very slightly sloping (5–10%), moderate or slightly sloping (10–15%), and moderate to high sloping (15–20%) areas. In the study area, 87% (381.06 km2) fall in the slope category of <5%. Therefore, most of the study area has a favorable slope for water retention, which has been assigned a rank of 40 with high potential for GW recharge (Figure 6E). The second and third slope classes lowest slope, with ranges of 5–10% and 10–15% cover 11% (48.18 km2) of the zone and were rated 30 and 20, respectively (Table 4). Moderately sloping zones comprise about 8.76 km2 (2%) of the Korba zone; these steep sloping areas have the least contaminant potential due their inability to maintain surface water for a long period. The lowest rank was assigned to steep slopes as shown in Table 4.
  • Parameter (LU)—Land use
Four LU classes were identified such as urban/village settlements (6%; 26.28 km2), scaled by a low ranking value of 15, agriculture/dry crop (25%; 109.5 km2), agriculture/wet crop (66%; 289.08 km2), and water bodies (3%; 109.5 km2), scaled by a high ranking value of 60 (Table 4), which were assigned to “poor”, “good”, and “very good” categories for GW prospect recharge zones, respectively (Figure 6F). We can remark that the dominant LU classes are the cultivated lands (wet and dry crop), comprising an area of about 91% over the entire zone.

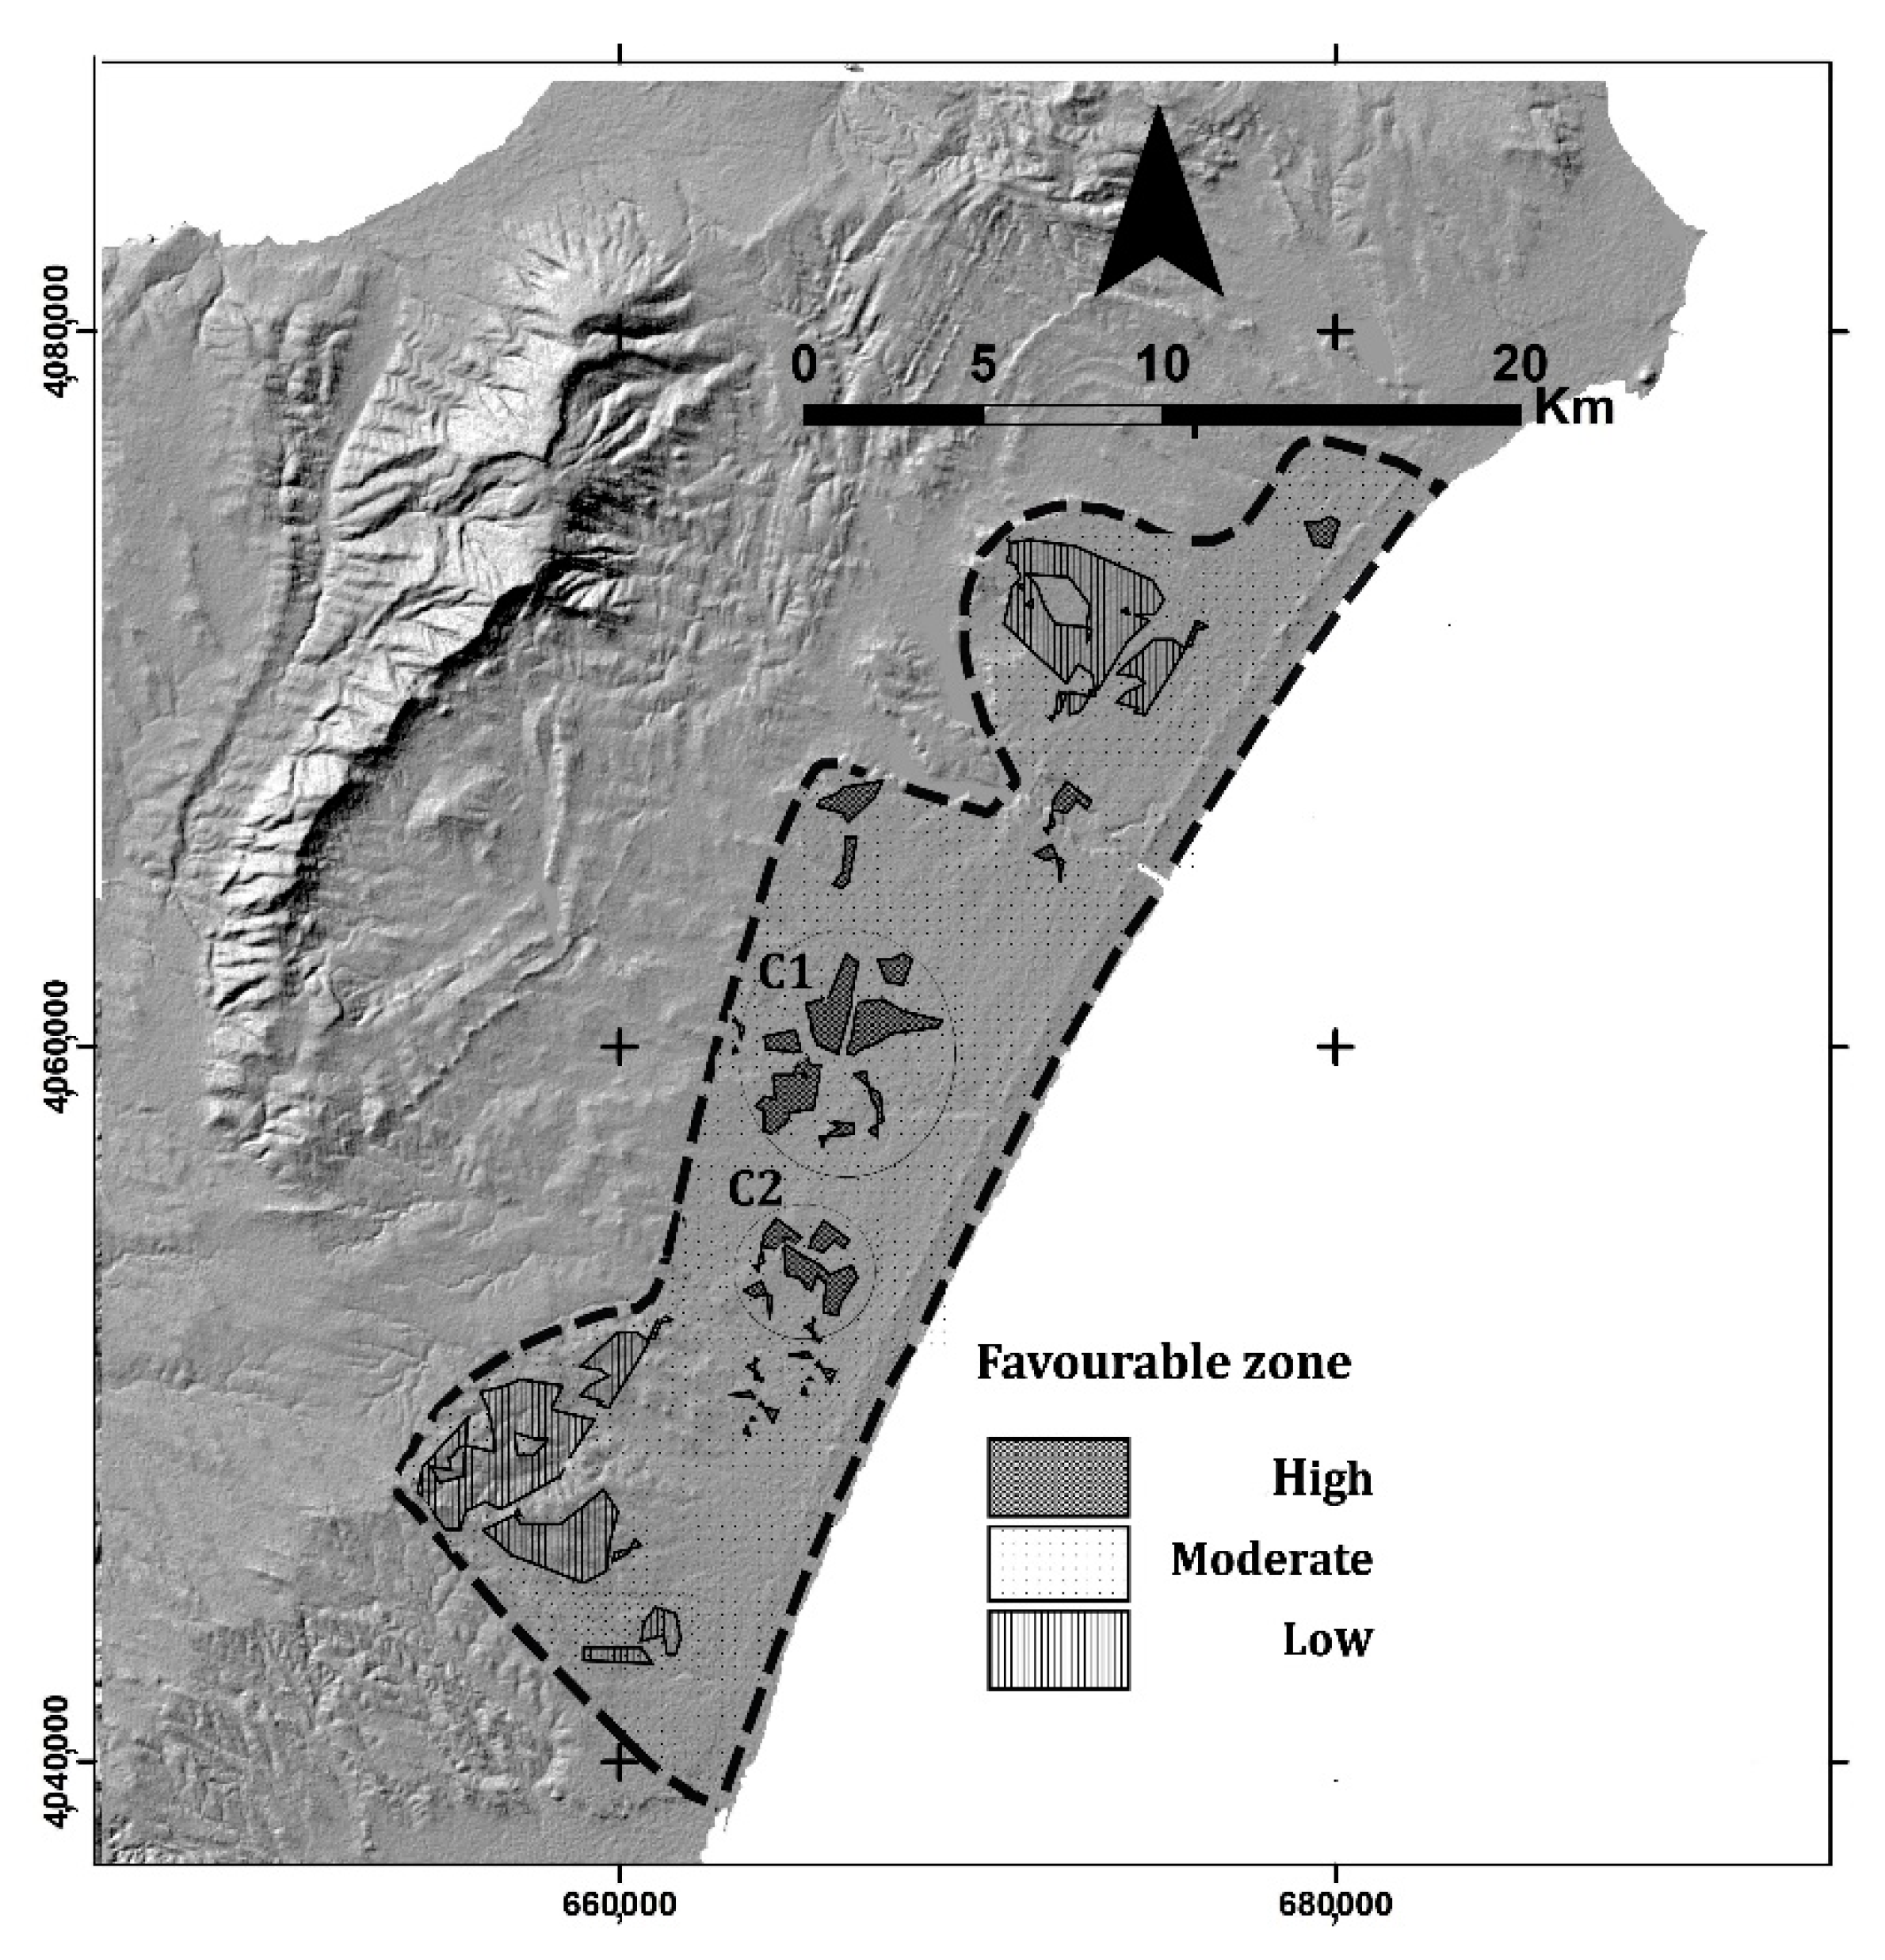
3.2.2. GW Artificial Recharge Map

Based on the six factors considered for selecting recharge zones, the most suitable GW recharge sites in the studied area were rainwater infiltration basins or percolation ponds, which are the most frequently used systems for control and prevention of the advancement of SWI. The resulting map index values were classified into three grades: 180–240, 240–300, and 300–360, representing low, moderate, and high, respectively. The percentage distribution of surface areas for each class is 7.5, 82, and 10.5% for good, moderate, and poor, respectively (Figure 7).
The most suitable GW recharge sites were found to be distributed mainly in the alluvial plains, especially over the central parts, on both sides of the Chiba wadi, with a surface area of 32.85 km2 (7.5%). This area was considered to have the lowest runoff with the high drainage density, and was topographically classified as flat. Most of the other areas covering about 359.16.6 km2 (82%) of the total surface have moderately suitable zones for recharge. The least suitable sites for GW recharge were identified in areas of buried pedi-plain and sedimentary high ground lands (45.99 km2, 10.5%), with hardy rocks, high or moderate sloping, and low drainage density.
Rainwater harvesting and artificial recharge in these sites offer a promising approach to help reverse the trend of water resource exploitation and groundwater depletion. Surface spreading techniques are common because there is enough space for such systems and the quantity of recharged water is also large. Several techniques may be adopted to save water that may be lost through slopes, rivers, rivulets, and nalas (such as gully plug, contour bund, gabion structure, check dams, and sub-surface dikes). Furthermore, infiltration basins can be used to leverage treated wastewater in the region for aquifer recharge. Prohibiting pumping close to the seawater affected areas and optimizing pumping rates to increase water use efficiency will help mitigate the saltwater intrusion in the Korba region. Figure 7 shows a map of the Korba artificial recharge areas, showing two clusters (C1 and C2) of highly favorable zones.

3.3. Simulation of Artificial Recharge Impact on SWI

From the most suitable recharge sites identified and delineated, we designated the largest clusters denoted as C1 and C2, for the calculation of required GW recharge volume (Figure 7). Based on Equation (8), the length of SWI (L) is defined as the distance from the coastline for each of the favorable recharge sites and estimated based on the distance to the central site. The favorable sites C1 and C2 are situated at 3.75 and 2.1 km from the sea, respectively.
The Korba GW system is principally recharged by rainfall. The recharge was estimated by Zghibi et al. [57] to be up to 27.73% of the 524.61 mm/year (63.8 MCM) mean average precipitation estimated by the Thiessen method. Moreover, the study area is directly connected by percolation from ephemeral wadis of Lebna and Chiba across the plain from south-east to north-west with 5.3 MCM (12 × 10−3 mm/year) [54,55,56,58]. Additional surface water sources increase the amount of aquifer recharge in the coastal plain of Cap-Bon by damming wadis (Chiba (1963), Lebna (1964), and M’laabi (1984)), irrigation return flow, and the artificial recharge plan Korba-El-Mida, with approximately 1 (2.2 × 10⁻³ mm), 8 (18.2 × 10⁻³ mm/year), and 1.7 MCM (3.9 × 10⁻³ mm/year), respectively [56,57,60].
The previously estimated average annual recharge with a total of 145.50 mm/year was used as an initial guess to account for the volume of water that must be recharged to the aquifer. Based on the numerical GW model developed by Zghibi et al. [55], the Korba aquifer was divided into seven areas in which hydraulic permeability varies between 0.01 × 10⁻³ and 4.2 × 10⁻³ m/s.
The C1 and C2 sites are in different zones with hydraulic conductivities of 0.01 × 10⁻³ and 4.2 × 10⁻³ m/s, respectively. C2 areas with higher aquifer hydraulic conductivity than C1 areas are considered more suitable for GW recharge [57], leading to a rapid increase of piezometer levels after recharge solicitation. The depth of the sharp interface between freshwater/saltwater under natural conditions (Z0), as shown in Equation (8), can be estimated based on measurements of potentiometric levels at a piezometer (or monitoring wells), tapping at a point in the saltwater zone below the Ghyben–Herzberg transition interface.
The potentiometric level of saline water in each monitoring piezometer is estimated by the Ghyben–Herzberg formula [75,76], and ranges from 30 (for C1) to 70 m (for C2) below sea level. The density weight values of the fresh (γf) and saline water (γs) are taken as 9.81 and 10.25 kN/m3, respectively. Using all these influencing parameters, the total quantity of water to be recharged artificially to control SWI caused by declining GW levels in the selected site clusters are 7.49 MCM for the 3.75 km distance from C1, and 3.82 MCM for the 2.1 km distance from C2.
The C2 zone is best suitable in recharge areas when compared to C1 in terms of the volume of water and distance from shore. This illustrates the effectiveness of mitigation measures to sustainably supply water and to protect the coastal aquifer from SWI. The analytic techniques considered in this study can be applied to other critical coastal aquifers in Tunisia and around Mediterranean countries with similar GW management challenges.

4. Conclusions

The GALDIT is one of the models utilized to determine GW vulnerability and sensitivity to SWI. This study evaluated the potential of SWI in the Korba aquifer using the GALDIT model in a GIS environment. We also examined the potential for artificial recharge for the development of GW resources. Six indicators were selected and overlaid in the mapping software to identify the SWI vulnerability map.
About 20.3% of the aquifer regions are in very high SWI vulnerability zones, 44.2% lie in high vulnerability zones, 19.3% lie in moderate vulnerability zones, and 16.2% lie in low zones. The results reveal that the area near to the seacoast and the central part is currently undergoing SWI with high to very high vulnerability. It is due to the high permeability, the shallow depth of GW level, combined with GW over-pumping that the saltwater contaminates the freshwater quickly. The lowest vulnerability area (71 km2) in the western part of Korba aquifer, far from sea coastline, was not prone to SWI.
Based on the parameter sensitivities, the results from both SPSA and MRSA revealed that parameter (D)—distance from shore, and parameter (L)—depth of GW level layers, are the two highly influencing factors accounting for SWI. As a result, GW management actions are critical to control and reduce SWI risks in the Korba aquifer and to assess the quantity of artificial recharge required.
Identification of suitable artificial recharge zones was done using six thematic layers. According to the classification of favorable artificial recharge zone results, the most suitable areas are mainly dispersed in the center portions within the alluvial deposits. Furthermore, geomorphology and runoff parameters gained large significance toward the delineation of favorable sites, since the study area is moderately sloping with high drainage density. The simulation of artificial recharge impact on SWI helped estimate the volume of recharge required to control SWI interface for two clusters (C1 and C2). The two most favorable zones were estimated to require a recharge of 7.49 and 3.82 MCM, respectively.
The findings of our study can be used to guide management of GW resources. The input data are widely available, and the tool is easy to use to derive a geographically based map of vulnerability. This can help inform regulations to effectively manage abstraction in the most sensitive locations, and remediation in affected areas. The rates and weightings determined in this study can be applied in areas around the world that have similar hydrogeological contexts to our study area. Thus, our study approach can be scaled to a wider group of end-users, including countries that have settlements in the coast of the Mediterranean Sea and other coastal areas that face groundwater depletion and SWI. However, determination of the weights and ratings require delineation of the unique characteristics of each study area. Additionally, this study was limited to coastal aquifers in northeastern Tunisia. Application of the tool in areas with a different geography and climate may require additional scrutiny of the weights and ratings, although the underlying principles that guide the delineation of weights and ratings are universal.
Furthermore, even though our study delineated suitable areas for artificial recharge based on the assigned weights and ranks, the practical implications, cost-effectiveness, and logistical aspects of such recharge exercise should be analyzed in detail. Artificial recharge techniques are widely used in Mediterranean arid areas such as the Cap-bon peninsula of Tunisia. Examples include the use of infiltration basins for treated wastewater and rainwater harvesting and recharge. The key advantage of our study approach is the quantified justification for prioritizing areas for action within a management plan and an audit trail for decision making based on readily available data. These data requirements mean that the approach can be applied in many situations where alternative approaches are impractical.

Author Contributions

All authors collaborated in the research presented in this publication by making the following contributions: research conceptualization, A.Z., A.M. (Amira Merzougui), M.H.M. and D.S.; methodology, A.Z., A.M. (Ali Mirchi) and A.S.M.; formal analysis, A.Z.; data curation, A.Z. and A.M. (Amira Merzougui); writing—original draft preparation, A.Z.; writing—review and editing, A.Z., A.M. (Ali Mirchi), A.S.M., L.Z., A.C., A.B. and A.M.-E.-A.; supervision, A.M. (Ali Mirchi), A.S.M., L.Z., A.C., A.B. and A.M.-E.-A. All authors have read and agreed to the published version of the manuscript.

Funding

This research was funded by the United States Agency for International Development (USAID) through Partnerships for Enhanced Engagement in Research (PEER; Grant number 7-444).

Informed Consent Statement

Not applicable.

Acknowledgments

The authors would like to thank the staff of the Regional Commissariat for Agricultural Development of Nabeul, its local representatives and the Tunisian Union of Agriculture and Fisheries for their support and interest in this work. We appreciate logistical support from the National Academies of Sciences, Engineering and Medicine (NASEM).

Conflicts of Interest

The authors declare no conflict of interest.

References

  1. Zeynolabedin, A.; Ghiassi, R. The SIVI index: A comprehensive approach for investigating seawater intrusion vulnerability for island and coastal aquifers. Environ. Earth Sci. 2019, 78, 666. [Google Scholar] [CrossRef]
  2. Wei, A.; Li, D.; Dai, F.; Lang, X.; Ma, B.; Wang, Y. An optimization method coupled the index-overlay method with entropy weighting model to assess seawater intrusion vulnerability. Environ. Sci. Pollut. Res. 2021, 28, 36142–36156. [Google Scholar] [CrossRef] [PubMed]
  3. Sujitha, V.; Purandara, B.K.; Shivapur, A.V.; Davithuraj, J. Assessment of Aquifer Vulnerability Using GALDIT Model—A Case Study. J. Geol. Soc. India 2020, 95, 507–512. [Google Scholar] [CrossRef]
  4. Seenipandi, K.; Nainarpandian, C.; Kandathil, R.K.; Sellamuthu, S. Seawater intrusion vulnerability in the coastal aquifers of southern India—An appraisal of the GALDIT model, parameters’ sensitivity, and hydrochemical indicators. Environ. Sci. Pollut. Res. 2019, 26, 9755–9784. [Google Scholar] [CrossRef] [PubMed]
  5. Yeh, H.-F.; Cheng, Y.-S.; Lin, H.-I.; Lee, C.-H. Mapping groundwater recharge potential zone using a GIS approach in Hualian River, Taiwan. Sustain. Environ. Res. 2016, 26, 33–43. [Google Scholar] [CrossRef] [Green Version]
  6. Valverde, J.P.B.; Blank, C.; Roidt, M.; Schneider, L.; Stefan, C. Application of a GIS Multi-Criteria Decision Analysis for the Identification of Intrinsic Suitable Sites in Costa Rica for the Application of Managed Aquifer Recharge (MAR) through Spreading Methods. Water 2016, 8, 391. [Google Scholar] [CrossRef]
  7. Senanayake, I.P.; Dissanayake, D.; Mayadunna, B.; Weerasekera, W. An approach to delineate groundwater recharge potential sites in Ambalantota, Sri Lanka using GIS techniques. Geosci. Front. 2016, 7, 115–124. [Google Scholar] [CrossRef] [Green Version]
  8. Tasnim, Z.; Tahsin, S. Application of the method of GALDIT for groundwater vulnerability assessment: A case of South Florida. Asian J. Appl. Sci. Eng. 2016, 5, 27–40. [Google Scholar]
  9. Agoubi, B.; Dabbaghi, R.; Kharroubi, A.A. Mamdani adaptive neural fuzzy inference system for improvement of groundwater vulnerability. Ground Water 2018, 56, 978–985. [Google Scholar] [CrossRef]
  10. Walther, M.; Delfs, J.O.; Grundmann, J.; Kolditz, O.; Liedl, R. Saltwater intrusion modeling: Verification and application to an agricultural coastal arid region in Oman. J. Comput. Appl. Math. 2012, 18, 4798–4809. [Google Scholar] [CrossRef] [Green Version]
  11. Parizi, E.; Hosseini, S.M.; Ataie-Ashtiani, B.; Simmons, C.T. Vulnerability mapping of coastal aquifers to seawater intrusion: Review, development and application. J. Hydrol. 2019, 570, 555–573. [Google Scholar] [CrossRef]
  12. Barzegar, R.; Asghari Moghaddam, A.; Adamowski, J.; Nazemi, A.H. Delimitation of groundwater zones under contamination risk using a bagged ensemble of optimized DRASTIC frameworks. Environ. Sci. Pollut. Res. Int. 2019, 1968, 8325–8339. [Google Scholar] [CrossRef]
  13. Mfumu Kihumba, A.; Vanclooster, M.; Ndembo Longo, J. Assessing groundwater vulnerability in the Kinshasa region, DR Congo, using a calibrated DRASTIC model. J. Afr. Earth Sci. 2017, 126, 13–22. [Google Scholar] [CrossRef]
  14. Margat, J. Vulnerability of Groundwater to Pollution: Database Mapping; 68-SGL 198; BRGM Publication: Orleans, France, 1968. [Google Scholar]
  15. Huan, H.; Wang, J.; Teng, Y. Assessment and validation of groundwater vulnerability to nitrate based on a modified DRASTIC model: A case study in Jilin City of northeast China. Sci. Total Environ. 2012, 440, 14–23. [Google Scholar] [CrossRef] [PubMed]
  16. Lobo-Ferreira, J.P.; Cabral, M. Proposal for an Operational Definition of Vulnerability for the European Community’s Atlas of Groundwater Resources. In Proceedings of the Meeting of the European Institute for Water; Groundwater Work Group Brussels: Brussels, Belgium, 1991. [Google Scholar]
  17. Harter, T.; Walker, L.G. Assessing Vulnerability of Groundwater; Report 1–11; California Department of Health Services: Sacramento, CA, USA, 2001.
  18. Gogu, R.C.; Dassargues, A. Current trends and future challenges in groundwater vulnerability assessment using overlay and index methods. Environ. Geol. 2000, 39, 549–558. [Google Scholar] [CrossRef]
  19. Kholghi, M. Multi-criterion decision making tools for wastewater planning management. J. Agric. Sci. Technol. 2001, 3, 281–286. [Google Scholar]
  20. Aller, L.; Bennet, T.; Leher, J.H.; Petty, R.J.; Hackett, G. DRASTIC. A Standardized System for Evaluating Groundwater Pollution Potential Using Hydro-Geological Settings; EPA 600/2-87-035; USEPA: Washington, DC, USA, 1987; 622p.
  21. Saidi, S.; Bouri, S.; Dhia, H.B. Sensitivity analysis in groundwater vulnerability assessment based on GIS in the Mahdia-KsourEssaf aquifer, Tunisia: A validation study. Hydrol. Sci. J. 2011, 56, 288–304. [Google Scholar] [CrossRef]
  22. Anane, M.; Abidi, B.; Lachaal, F.; Limam, A.; Jellali, S. GIS-based DRASTIC, Pesticide DRASTIC and the Susceptibility Index (SI): Comparative study for evaluation of pollution potential in the Nabeul-Hammamet shallow aquifer, Tunisia. Hydrogeol. J. 2013, 21, 715–731. [Google Scholar] [CrossRef]
  23. Chenini, I.; Zghibi, A.; Kouzana, L. Hydrogeological investigations and groundwater vulnerability assessment and mapping for groundwater resource protection and management: State of the art and a case study. J. Afr. Earth Sci. 2015, 109, 11–26. [Google Scholar] [CrossRef]
  24. Zghibi, A.; Merzougui, A.; Chenini, I.; Ergaieg, K.; Zouhri, L.; Tarhouni, J. Groundwater vulnerability analysis of Tunisian coastal aquifer: An application of DRASTIC index method in GIS environment. Groundw. Sustain. Dev. 2016, 2, 169–181. [Google Scholar] [CrossRef]
  25. Foster, S.D. Fundamental concepts in aquifer vulnerability, pollution risk and protection strategy. In Vulnerability of Soil and Groundwater to Pollution; Waegeningh, H.G., van Waegeningh, V., Eds.; Committee on Hydrological Research: Hague, The Netherlands, 1987; Volume 38, pp. 69–86. [Google Scholar]
  26. Doerfliger, N.; Jeannin, P.Y.; Zwahlen, F. Water vulnerability assessment in karst environments: A new method of defining protection areas using a multi-attribute approach and GIS tools (EPIK method). Environ. Geol. 1999, 39, 165–176. [Google Scholar] [CrossRef] [Green Version]
  27. Vias, J.M.; Andreo, B.; Perles, M.J.; Carrasco, F.; Vadillo, I.; Jimenez, P. Proposed method for groundwater vulnerability mapping in carbonate (karstic) aquifers: The COP method. Hydrogeol. J. 2006, 14, 912–925. [Google Scholar] [CrossRef]
  28. Civita, M.; de Maio, M. SINTACS Un sistema parametrico per la valutazione e la cartografia della vulnerabilità degli acquiferi all’inquinamento. In Quaderni di Tecniche di Protezione Ambientale; Pitagora: Bologna, Italy, 1997; Volume 60. (In Italian) [Google Scholar]
  29. Instituto Tecnologico y Geominero de Espana. Evaluación de la Vulnerabilidad de los Acuíferos a la Contaminación Porplaguicidas. Ejemplo Aplicación en Provincia de Castellón. Guía Metodológica para la Elaboración de Perímetros de Protección de Captaciones de Agua Subterráneas; Instituto Tecnológico y Geominero de España: Madrid, Spain, 1991; p. 290. ISBN 84-7840-091-5. [Google Scholar]
  30. Lobo-Ferreira, J.P.; Chachadi, A.G.; Catarina, D.; Diamantino, C.; Henriques, M.J. Assessing aquifer vulnerability to seawater intrusion using GALDIT method: Part 1. Assessing aquifer vulnerability to seawater intrusion using GALDIT method: Part 1—Application to the Portuguese Aquifer of Monte Gordo. In Proceedings of the Fourth Inter-Celtic Colloquium on Hydrology and Management of Water Resources, Gimaràes, Portugal, 11–14 July 2005. [Google Scholar]
  31. Recinos, N.; Kallioras, A.; Pliakas, F.; Schuth, C. Application of GALDIT index to assess the intrinsic vulnerability to seawater intrusion of coastal granular aquifers. Environ. Earth Sci. 2015, 73, 1017–1032. [Google Scholar] [CrossRef]
  32. Chachadi, A.G.; Lobo-Ferreira, J.P. Sea water intrusion vulnerability mapping of aquifers isung GALDIT method. In Proceedings of the Workshop on Modeling in Hydrogeology; COASTIN A Coastal Policy Research Newsletter; Number 4; TERI: New Delhi, India, 2001; pp. 7–9. Available online: https://www.teriin.org/teri-wr/coastin/newslett/coastin4.pdf (accessed on 24 March 2018).
  33. Ayed, B.; Jmal, I.; Sahal, S.; Bouri, S. The seawater intrusion assessment in coastal aquifers using GALDIT method and groundwater quality index: The Djeffara of Medenine coastal aquifer (Southeastern Tunisia). Arabian J. Geosci. 2018, 11, 609. [Google Scholar] [CrossRef]
  34. Gontara, M.; Allouche, N.; Jmal, I.; Bouri, S. Sensitivity analysis for the GALDIT method based on the assessment of vulnerability to pollution in the northern Sfax coastal aquifer, Tunisia. Arab. J. Geosci. 2016, 9, 416. [Google Scholar] [CrossRef]
  35. Kazakis, N.; Spiliotis, M.; Voudouris, K.; Pliakas, F.K.; Papadopoulos, B. A fuzzy multicriteria categorization of the GALDIT method to assess seawater intrusion vulnerability of coastal aquifers. Sci. Total Environ. 2018, 621, 524–534. [Google Scholar] [CrossRef] [PubMed]
  36. Kouz, T.; Cherkaoui Dekkaki, H.; Mansour, S.; Hassani Zerrouk, M.; Mourabit, T. Application of GALDIT Index to Assess the Intrinsic Vulnerability of Coastal Aquifer to Seawater Intrusion Case of the Ghiss-Nekor Aquifer (North East of Morocco). In Groundwater and Global Change in the Western Mediterranean Area; Calvache., M.L., Ed.; Springer: Berlin/Heidelberg, Germany, 2018. [Google Scholar]
  37. Carrera, J.; Hidalgo, J.J.; Slooten, L.J.; Vázquez-Suñé, E. Computational and conceptual issues in the calibration of seawater intrusion models. Hydrogeol. J. 2010, 18, 131–145. [Google Scholar] [CrossRef]
  38. Werner, A.D.; Bakker, M.; Post, V.E.A.; Vandenbohede, A.; Lu, C.; Ataie-Ashtiani, B.; Simmons, C.T.; Barry, D.A. Seawater intrusion processes, investigation and management: Recent advances and future challenges. Adv. Water Resour. 2013, 51, 3–26. [Google Scholar] [CrossRef]
  39. Walther, M.; Graf, T.; Kolditz, O.; Liedl, R.; Post, V. How significant is the slope of the sea-side boundary for modelling seawater intrusion in coastal aquifers? J. Hydrol. 2017, 551, 648–659. [Google Scholar] [CrossRef]
  40. Barzegar, R.; Moghaddam, A.A.; Deo, R.; Fijani, E.; Tziritis, E. Mapping groundwater contamination risk of multiple aquifers using multi-model ensemble of machine learning algorithms. Sci. Total Environ. 2018, 621, 697–712. [Google Scholar] [CrossRef]
  41. Jafari, S.M.; Nikoo, M.R. Groundwater risk assessment based on optimization framework using DRASTIC method. Arabian J. Geosci. 2016, 9, 742. [Google Scholar] [CrossRef]
  42. Asadi, P.; Hosseini, S.M.; Ataie-Ashtiani, B.; Simmons, C.T. Fuzzy vulnerability mapping of urban groundwater systems to nitrate contamination. Environ. Modell. Software. 2017, 96, 146–157. [Google Scholar] [CrossRef]
  43. Nasri, G.; Hajji, S.; Aydi, W.; Boughariou, E.; Allouche, N.; Bouri, S. Water vulnerability of coastal aquifers using AHP and parametric models: Methodological overview and a case study assessment. Arabian J. Geosci. 2021, 14, 59. [Google Scholar] [CrossRef]
  44. Oikonomidis, D.; Dimogianni, S.; Kazakis, N.; Voudouris, K. A GIS/Remote Sensing-based methodology for groundwater potentiality assessment in Tirnavos area, Greece. J. Hydrol. 2015, 525, 197–208. [Google Scholar] [CrossRef]
  45. Agoubi, B. A review: Saltwater intrusion in North Africa’s coastal areas—Current state and future challenges. Environ. Sci. Pollut. Res. 2021, 28, 17029–17043. [Google Scholar] [CrossRef] [PubMed]
  46. Abijith, D.; Saravanan, S.; Singh, L.; Jennifer, J.J.; Saranya, T.; Parthasarathy, K. GIS-based multi-criteria analysis for identification of potential groundwater recharge zones—A case study from Ponnaniyaru watershed, Tamil Nadu, India. Hydro. Res. 2020, 3, 1–14. [Google Scholar] [CrossRef]
  47. Sophiya, M.S.; Syed, T.H. Assessment of vulnerability to seawater intrusion and potential remediation measures for coastal aquifers: A case study from eastern India. Environ. Earth Sci. 2013, 70, 1197–1209. [Google Scholar] [CrossRef]
  48. Kura, N.U.; Ramli, M.F.; Ibrahim, S.; Sulaiman, W.N.A.; Aris, A.Z.; Tanko, A.I.; Zaudi, M.A. Assessment of groundwater vulnerability to anthropogenic pollution and seawater intrusion in a small tropical island using index-based methods. Environ. Sci. Pollut. Res. 2015, 22, 1512–1533. [Google Scholar] [CrossRef]
  49. Chekirbane, A.; Tsujimura, M.; Lachaal, F.; Khadhar, S.; Mlayah, A.; Kawachi, A.; Isoda, H.; Tarhouni, J.; Benalaya, A. Quantification of Groundwater—Saline Surface Water Interaction in a Small Coastal Plain in North-East Tunisia using Multivariate Statistical Analysis and Geophysical Method. Water Environ. Res. 2016, 88, 2292–2308. [Google Scholar] [CrossRef]
  50. Kouzana, L.; Mammou, A.B.; Felfoul, M.S. Seawater intrusion and associated processes: Case of the Korba aquifer (Cap-Bon, Tunisia). C. R. Geosci. 2009, 341, 21–35. [Google Scholar] [CrossRef]
  51. Sendrós, A.; Urruela, A.; Himi, M.; Alonso, C.; Lovera, R.; Tapias, J.C.; Rivero, L.; Garcia-Artigas, R.; Casas, A. Characterization of a shallow coastal aquifer in the framework of a subsurface storage and soil aquifer treatment project using electrical resistivity tomography (Port de la Selva, Spain). Appl. Sci. 2021, 11, 2448. [Google Scholar] [CrossRef]
  52. Trabelsi, N.; Triki, I.; Hentati, I.; Zairi, M. Aquifer vulnerability and seawater intrusion risk using GALDIT, GQISWI and GIS: Case of a coastal aquifer in Tunisia. Environ. Earth Sci. 2016, 75, 669. [Google Scholar] [CrossRef]
  53. Kouzana, L.; Benassi, R. Geophysical and geochemical study of the seawater intrusion in Mediterranean semi-arid zones. Case of the Korba coastal aquifer (Cap-Bon, Tunisia). J. Afr. Earth Sci. 2010, 58, 242–254. [Google Scholar]
  54. Paniconi, C.; Khlaifi, I.; Lecca, G.; Giacomelli, A.; Tarhouni, J. A modeling study of seawater intrusion in the Korba coastal plain, Tunisia. Phys. Chem. Earth 2001, 26, 345–351. [Google Scholar] [CrossRef]
  55. Zghibi, A.; Mirchi, A.; Zouhri, L.; Taupin, J.-D.; Chekirbane, A.; Tarhouni, J. Implications of groundwater development and seawater intrusion for sustainability of a Mediterranean coastal aquifer in Tunisia. Environ. Monit. Assess. 2019, 191, 696. [Google Scholar] [CrossRef]
  56. Horriche, F.J.; Benabdallah, S. Assessing Aquifer Water Level and Salinity for a Managed Artificial Recharge Site Using Reclaimed Water. Water 2020, 12, 341. [Google Scholar] [CrossRef] [Green Version]
  57. Zghibi, A.; Mirchi, A.; Msaddek, M.H.; Merzougui, A.; Zouhri, L.; Taupin, J.D.; Chekirbane, A.; Chenini, I.; Tarhouni, J. Using Analytical Hierarchy Process and Multi-Influencing Factors to Map Groundwater Recharge Zones in a Semi-Arid Mediterranean Coastal Aquifer. Water 2020, 12, 2525. [Google Scholar] [CrossRef]
  58. Ennabli, M. Etude Hydrogélogique des Aquifères du Nord-Est de la Tunisie Pour Une Gestion Intégrée des Ressources en Eau. Ph.D. Thesis, Nice University, Nice, France, 1980. [Google Scholar]
  59. Oueslati, A. Les Côtes de la Tunisie. Recherche sur Leur Evolution au Quaternaire; Imprimerie Officielle de la République Tunisienne: Tunis, Tunisia, 1994. [Google Scholar]
  60. Kerrou, J.; Renard, P.; Tarhouni, J. Status of the Korba groundwater resources (Tunisia): Observations and three-dimensional modelling of seawater intrusion. Hydrogeol. J. 2010, 18, 1173–1190. [Google Scholar] [CrossRef]
  61. CCI Cap-Bon. Chambre de Commerce et d’Industrie Cap-Bon. Tunisia. Available online: http://www.ccicapbon.org.tn (accessed on 24 March 2018).
  62. Direction Générale des Ressources en Eau (DGRE). Annuaires Pluviométriques (1998–20119); DGRE: Tunis, Tunisia, 2019. [Google Scholar]
  63. Singh, L.K.; Jha, M.K.; Chowdary, V.M. Multi-criteria analysis and GIS modeling for identifying prospective water harvesting and artificial recharge sites for sustainable water supply. J. Clean. Prod. 2017, 142, 1436–1456. [Google Scholar] [CrossRef]
  64. Chenini, I.; Msaddek, M.H.; Dlala, M. Hydrogeological characterization and aquifer recharge mapping for groundwater resources management using multicriteria analysis and numerical modeling: A case study from Tunisia. J. Afr. Earth. Sci. 2019, 154, 59–69. [Google Scholar] [CrossRef]
  65. Satishkumar, V.; Sankaran, S.; Taufiquewarsi; Amarender, B.; Dhakate, R. Mapping of salinity ingress using Galdit model for Sirkali coastal region: A case study. J. Geogr. Inf. Syst. 2016, 8, 526–536. [Google Scholar] [CrossRef] [Green Version]
  66. Napolitano, P.; Fabbri, A.G. Single-parameter sensitivity analysis for aquifer vulnerability assessment using and SINTACS. In HydroGIS 96: Application of Geographical Information Systems in Hydrology and Water Resources Management, Proceedings of the Vienna Conference, Vienna, Austria, April 1996; I.A.H.S. Publications: Oxford, UK, 1996; Volume 235, pp. 559–566. [Google Scholar]
  67. Lodwick, W.A.; Monson, W.; Svoboda, L. Attribute error and sensitivity analysis of map operations in geographical information systems: Suitability analysis. Int. J. Geogr. Inf. Syst. 1990, 4, 413–428. [Google Scholar] [CrossRef]
  68. Huisman, B.; Olsthroon, T.N. Artificial Groundwater Recharge; Pitman Books Ltd.: London, UK, 1983. [Google Scholar]
  69. Mockus, V. Estimation of direct runoff from storm rainfall. In National Engineering Handbook; N.E.H. Notice: Washington, DC, USA, 1972; Volume 4, p. 102. [Google Scholar]
  70. Das, S.N.; Narula, K.K.; Laurin, R. Run-off potential indices of watersheds of Tilaiya catchment, Bihar (India) through use of remote sensing and implementation of GIS. J. Indian Soc. Remote Sens. 1992, 20, 207–222. [Google Scholar] [CrossRef]
  71. Mirza, M.N.; Al-Ghamdi, K.A. GIS-based spatial mapping of flash flood hazard in Makkah City, Saudi Arabia. J. Geogr. Inf. Syst. 2011, 3, 225–231. [Google Scholar] [CrossRef] [Green Version]
  72. Reshma, T.; Kumar, S.P.; Babu, R.K.; Babu, R.K.M.J.; Kumar, K.S. Simulation of runoff in watersheds using SCS-CN and Muskingum-Cunge methods using remote sensing and Geographical Information Systems. Int. J. Adv. Sci. Technol. 2010, 25, 31–42. [Google Scholar]
  73. Pradhan, R.; Pradhan, M.P.; Ghose, M.K.; Agarwal, V.S.; Agarwal, S. Estimation of rainfall runoff using remote sensing and GIS in and around Singtam, East Sikkim. Int. J. Geomat. Geosci. 2010, 1, 467–476. [Google Scholar]
  74. Sundaram, L.K.V.; Dinesh, V.; Ravikumar, G. Vulnerability assessment of seawater intrusion and effect of artificial recharge in Pondicherry coastal region using GIS. Indian J. Sci. Technol. 2008, 1, 1–7. [Google Scholar] [CrossRef]
  75. Ghyben, W.B. Nota in verband met de voorgenomenputboringnabij Amsterdam. Inst. Ing. Tijdschr. 1888, 21, 8–22. [Google Scholar]
  76. Herzberg, A. Die WasserversorgungeinigerNordseebader. J. Gasbeleucht. Wasserversorg. 1901, 44, 815–819. [Google Scholar]
  77. Bear, J. Dynamics of Fluids in Porous Materials; Elsevier: New York, NY, USA, 1972. [Google Scholar]
  78. Raudkivi, A.J.; Callander, R.A. Analysis of Ground Water Flow; Edward Arnold (Publishers) Ltd.: London, UK, 1976. [Google Scholar]
  79. Bear, J. Hydraulics of Groundwater; McGraw-Hill Inc.: London, UK, 1979. [Google Scholar]
  80. Pal, S.; Kundu, S.; Mahato, S. Groundwater potential zones for sustainable management plans in a river basin of India and Bangladesh. J. Clean. Prod. 2020, 257, 120311. [Google Scholar] [CrossRef]
  81. Najib, S.; Grozavu, A.; Mehdi, K.; Breaban, I.G.; Guessir, H.; Boutayab, K. Application of the method GALDIT for the cartography of groundwaters vulnerability: Aquifer of Chaouia coast (Morocco). In Scientific Annals of “Alexandru Ioan Cuza” University of Iaşi; “Alexandru Ioan Cuza” University of Iasi: Iasi, Romania, 2012; pp. 2284–6379. [Google Scholar]
  82. Salem, E.Z.; Hasan, S.S. Use of GALDIT model and HFE-Diagram to assess seawater intrusion vulnerability in West Nile Delta, Egypt. Arabian J. Geosci. 2021, 14, 1318. [Google Scholar] [CrossRef]
  83. Chang, S.C.; Chung, I.-M.; Kim, M.-G.; Tolera, M.; Koh, G.-W. Application of GALDIT in Assessing the Seawater Intrusion Vulnerability of Jeju Island, South Korea. Water 2019, 11, 1824. [Google Scholar] [CrossRef] [Green Version]
Figure 1. (A) Location of Tunisia and Cap−Bon peninsula; (B) Geological setting of the study area [41], (C) synthetic geological cross−section, and (D) piezometric map of the aquifer in 2018 [55].
Water 14 01177 g001
Figure 2. Methodological flowchart.
Water 14 01177 g002
Figure 3. The six layers of GALDIT parameters of Korba aquifer.
Water 14 01177 g003
Figure 4. Resultant SWI vulnerability maps of Korba shallow aquifer.
Water 14 01177 g004
Figure 5. Correlation between the GALDIT vulnerability index and EC values for the study area.
Water 14 01177 g005
Figure 6. The six parameters used to identify suitable locations for GW artificial recharge.
Water 14 01177 g006
Figure 7. Map of Korba artificial recharge areas showing two clusters (C1 and C2) of highly favorable zones.
Water 14 01177 g007
Table 1. Data sources used.
GALDIT ParametersRaw Data SourcesFormat Type
DEMSRTM data with 30 m of resolutionDigital
GW occurrence/aquifer type Carte Agricole of Nabeul governorate and well logsDigitalG
Aquifer hydraulic conductivity (m/day)Pumping tests reportsTableA
Depth of the GW (m.a.s.l.)Monitoring well and piezometersTableL
Distance from shore (m)Sentinel-2A image from USGS Earth ExplorerRasterD
Impact of existing status of SWI (Cl/HCO3) (mg/L)GW sample results of HCO3 and Cl were collected from the identified 56 GW wells using the GSP techniqueTableI
Aquifer thickness (m)Well logs and hydrogeological sections DigitalT
Table 2. Parameters of the GALDIT index used for Korba SWI vulnerability assessment [32].
FactorWeighting (w)GW VariablesRating (r)Weighting of Feature Pixel
(i = w × r)
ClassRange
G1Confined 1010
Unconfined 88
Leaky confined 66
Bounded Aquifer 22
A3High>401030
Medium10–40824
Low5–10618
Very low<5412
L4High<1.01040
Medium1.0–1.5832
Low1.5–2.0624
Very low>2.0416
D5Very small<5001050
Small500–1000840
Medium1000–1500630
Far1500–2000420
Very Far>2000210
I3Very high>91030
High6–9824
Moderate3–6618
Low1–3412
Very low/no impact zone<1.026
T 2Very larger thickness >901020
Larger thickness 30–50816
Moderate thikness 50–70612
Small thichness30–5048
Very small thickness <3024
Total18
Table 3. Data sources used.
Data TypeData SourceScale/Spatial ResolutionsFormat
GECarte Agricole of Nabeul governorate and well logs1/500,000 scaleDigital
GMCarte Agricole of Nabeul governorate and well logs1/500,000 scaleDigital
HSDerived from the CN table Table
RNAnnual climatic data (1980–2017) from National Meteorological Institute of Tunisia Station data Monthly and daily resolutionTable
SExtracted from SRTM data with 30 m of resolution30 × 30 mDigital
LUPrepared from Landsat 8 using NIR Band with 30 m of resolution30 × 30 mDigital
Table 4. Criterion table for identifying suitable artificial recharge sites [48,74].
ThemeRank1234Weight Age (wi)
4 × wi3 × wi2 × wi1 × wi
GEAlluviumShaly sandstone, shell limestone-Shale and calcareous Sandstone with clay15
GMFlood plain, Alluvial plain, Coastal plain, Beach sandShallow buried pediment, PedimentDeep buried pedimentSedimentary High Ground, High Ground30
HS groupClass20
ABCD
RNLowLess moderateModerateHigh10
SNormally Very slightly Slightly Moderately 10
LUSandy, mud flat, Water bodiesFallow, Land with or without scrub, wet crop, Village settlementsAgricultural plantations, Dry cropUrban settlements, Gullied ravine, salt affected15
Table 5. Statistical summaries of GALDIT six parameters.
FactorMinimumMaximumMeanStandard Deviation (SD)Coefficient of Variation (CV) (%)
G2106.23.556.45
A123019.59.2847.58
L164024.812.2349.31
D105030.315.2550.33
I63018.69.4352.1
T42013.16.6150.46
Table 6. Statistical summaries of SPSA of GALDIT parameters.
FactorTheoretical Weighting (Wt)Theoretical Weighting (%)Effective Weight (%)Effective Weighting (%)
MeanMinimumMaximumSandard Deviation (SD)
G15.562.731.980.53.691.63
A316.6612.313.601.056.013.33
L422.2323.733.851.026.323.14
D527. 7829.965.984.257.212.12
I316.6617.873.581.127.063.95
T211.1113.402.950.376.043.14
Total18100100
Table 7. Statistics summaries of MRSA of GALDIT parameters.
Parameters (Removal of One or More at a Time)Variation Index (VI)
MeanMinimumMaximumSD
G2.031.723.124.43
A7.922.2613.958.75
L18.0210.0227.4019.20
D24.122.8045.5627.15
I5.123.1210.015.03
T2.921.038.324.21
D and I11.124.8119.7511.72
D, I, and T8.132.5312.716.77
L, D, I, and T4.921.298.854.58
A, L, D, I, and T5.861.919.845.82
G, A, L, D, I, and T4.881.556.814.01
Publisher’s Note: MDPI stays neutral with regard to jurisdictional claims in published maps and institutional affiliations.

