Article

Flood Exposure and Social Vulnerability Analysis in Rural Areas of Developing Countries: An Empirical Study of Charsadda District, Pakistan

1
College of Public Administration, Huazhong University of Science and Technology, Wuhan 430074, China
2
Institute for Environment and Human Security, United Nations University, 53113 Bonn, Germany
3
Department of Geography, University of Bonn, 53113 Bonn, Germany
4
Department of Management Sciences, University of Haripur, Khyber Pakhtunkhwa 22620, Pakistan
5
College of Engineering and Science, Victoria University, Melbourne, VIC 8001, Australia
6
Institute for Sustainable Industries & Liveable Cities, Victoria University, P.O. Box 14428, Melbourne, VIC 8001, Australia
7
College of Engineering, IT & Environment, Charles Darwin University, Darwin, NT 0810, Australia
8
Energy and Resources Institute, Charles Darwin University, Darwin, Ellengowan Dr, Brinkin, NT 0810, Australia
*
Author to whom correspondence should be addressed.
Water 2022, 14(7), 1176; https://doi.org/10.3390/w14071176
Submission received: 3 March 2022 / Revised: 30 March 2022 / Accepted: 1 April 2022 / Published: 6 April 2022

Abstract

:
In recent years, social vulnerability has gained much importance in academic studies. However, social indices are rarely combined and validated with exposure and resilience components. This study provides an integrated analysis of the flood exposure and social vulnerability of rural households in a case area of Charsadda District, Khyber Pakhtunkhwa, Pakistan. A conceptual framework was designed (based on the MOVE framework) as a guideline and key indicators were identified. For the exposure component, parameters such as elevation, flooded locations, and distance from the river were endorsed to understand flood mechanisms. For populating socioeconomic variables, questionnaire-based interviews were conducted with 210 households. The results were presented through ArcGIS-generated maps. The most significant indicators interplaying with high vulnerability were exposure-related indicators. The findings showed that the southern areas, including Agra, Daulat Pura, and Hisar Yasinzai were highly vulnerable due to having the highest number of flood locations, lowest elevations, and shortest distances from rivers, as well as larger household sizes, more elderly, children and women, illiteracy rates, and weak financial capacity. Understanding such dominant indicators and areas where high social vulnerability and high exposure converge can inform the authorities in mitigating both social and physical flood vulnerability.

1. Introduction

Over the last few decades, climate change has increased the frequency and severity of hydro-meteorological disasters in many regions of the world [1]. Among them, floods are the most recurring and catastrophic hazards, and can cause severe physical, social, and economic damage and loss. The leading measures of flood impact tend to focus on direct damage to physical assets, painting a picture of what is exposed and to what degree. Much less is understood about who is exposed to floods and where, which could increase the likelihood of a natural hazard turning into a social disaster. In this context, it is vital to have a clear understanding of who is vulnerable to flood impacts and where, which can help support the planning and targeting of interventions [2].
In Pakistan, flood is the most frequent and costly natural disaster, which is likely to increase due to climate change [3,4]. While planning is unlikely to fully prevent floods and their consequent impacts, it is possible to quantify flood risk and mitigate these impacts. Flood impacts are not equally distributed among different groups of people, due to their differential exposure and socioeconomic characteristics. Flood exposure is often higher for the socially vulnerable population, due to their poor socio-economic conditions (e.g., financial issues, substandard housing, socially isolated), and thus they are more likely to experience heightened impacts and losses. For example, not everybody residing in flood-prone areas is physically capable of hearing, seeing, and moving, comprehending the danger, and carrying out what they must do to plan for or escape the flood. Consequently, some people have higher exposure and vulnerability to floods, and are less capable of preparing for, dealing with, and recovering from floods [5,6,7,8,9]. There is a clear interconnection between exposure to threats and vulnerability: high exposure can increase vulnerability and vice versa. For example, residing in unsafe locations or proximity to hazards can illustrate low socio-economic status (as addressed by the PAR model of vulnerability) [10].
Social vulnerability is a socially constructed phenomenon attributed to changes in the biophysical and built environment. It depends on the susceptibility or fragilities of society to external threats. Such susceptible conditions are attributed to demographic and socio-economic inequalities among social groups within societies. Social vulnerability analysis has been broadly used as a tool to evaluate the pre-existing conditions or characteristics of individuals or a society that affect their ability to prepare for, respond to, and recover from natural hazards [11]. It entails identifying the susceptibility or fragilities of the exposed people, understanding where the greatest need may be—before, during, and after a disaster—and is deemed a crucial step towards reducing the consequences of natural hazards [
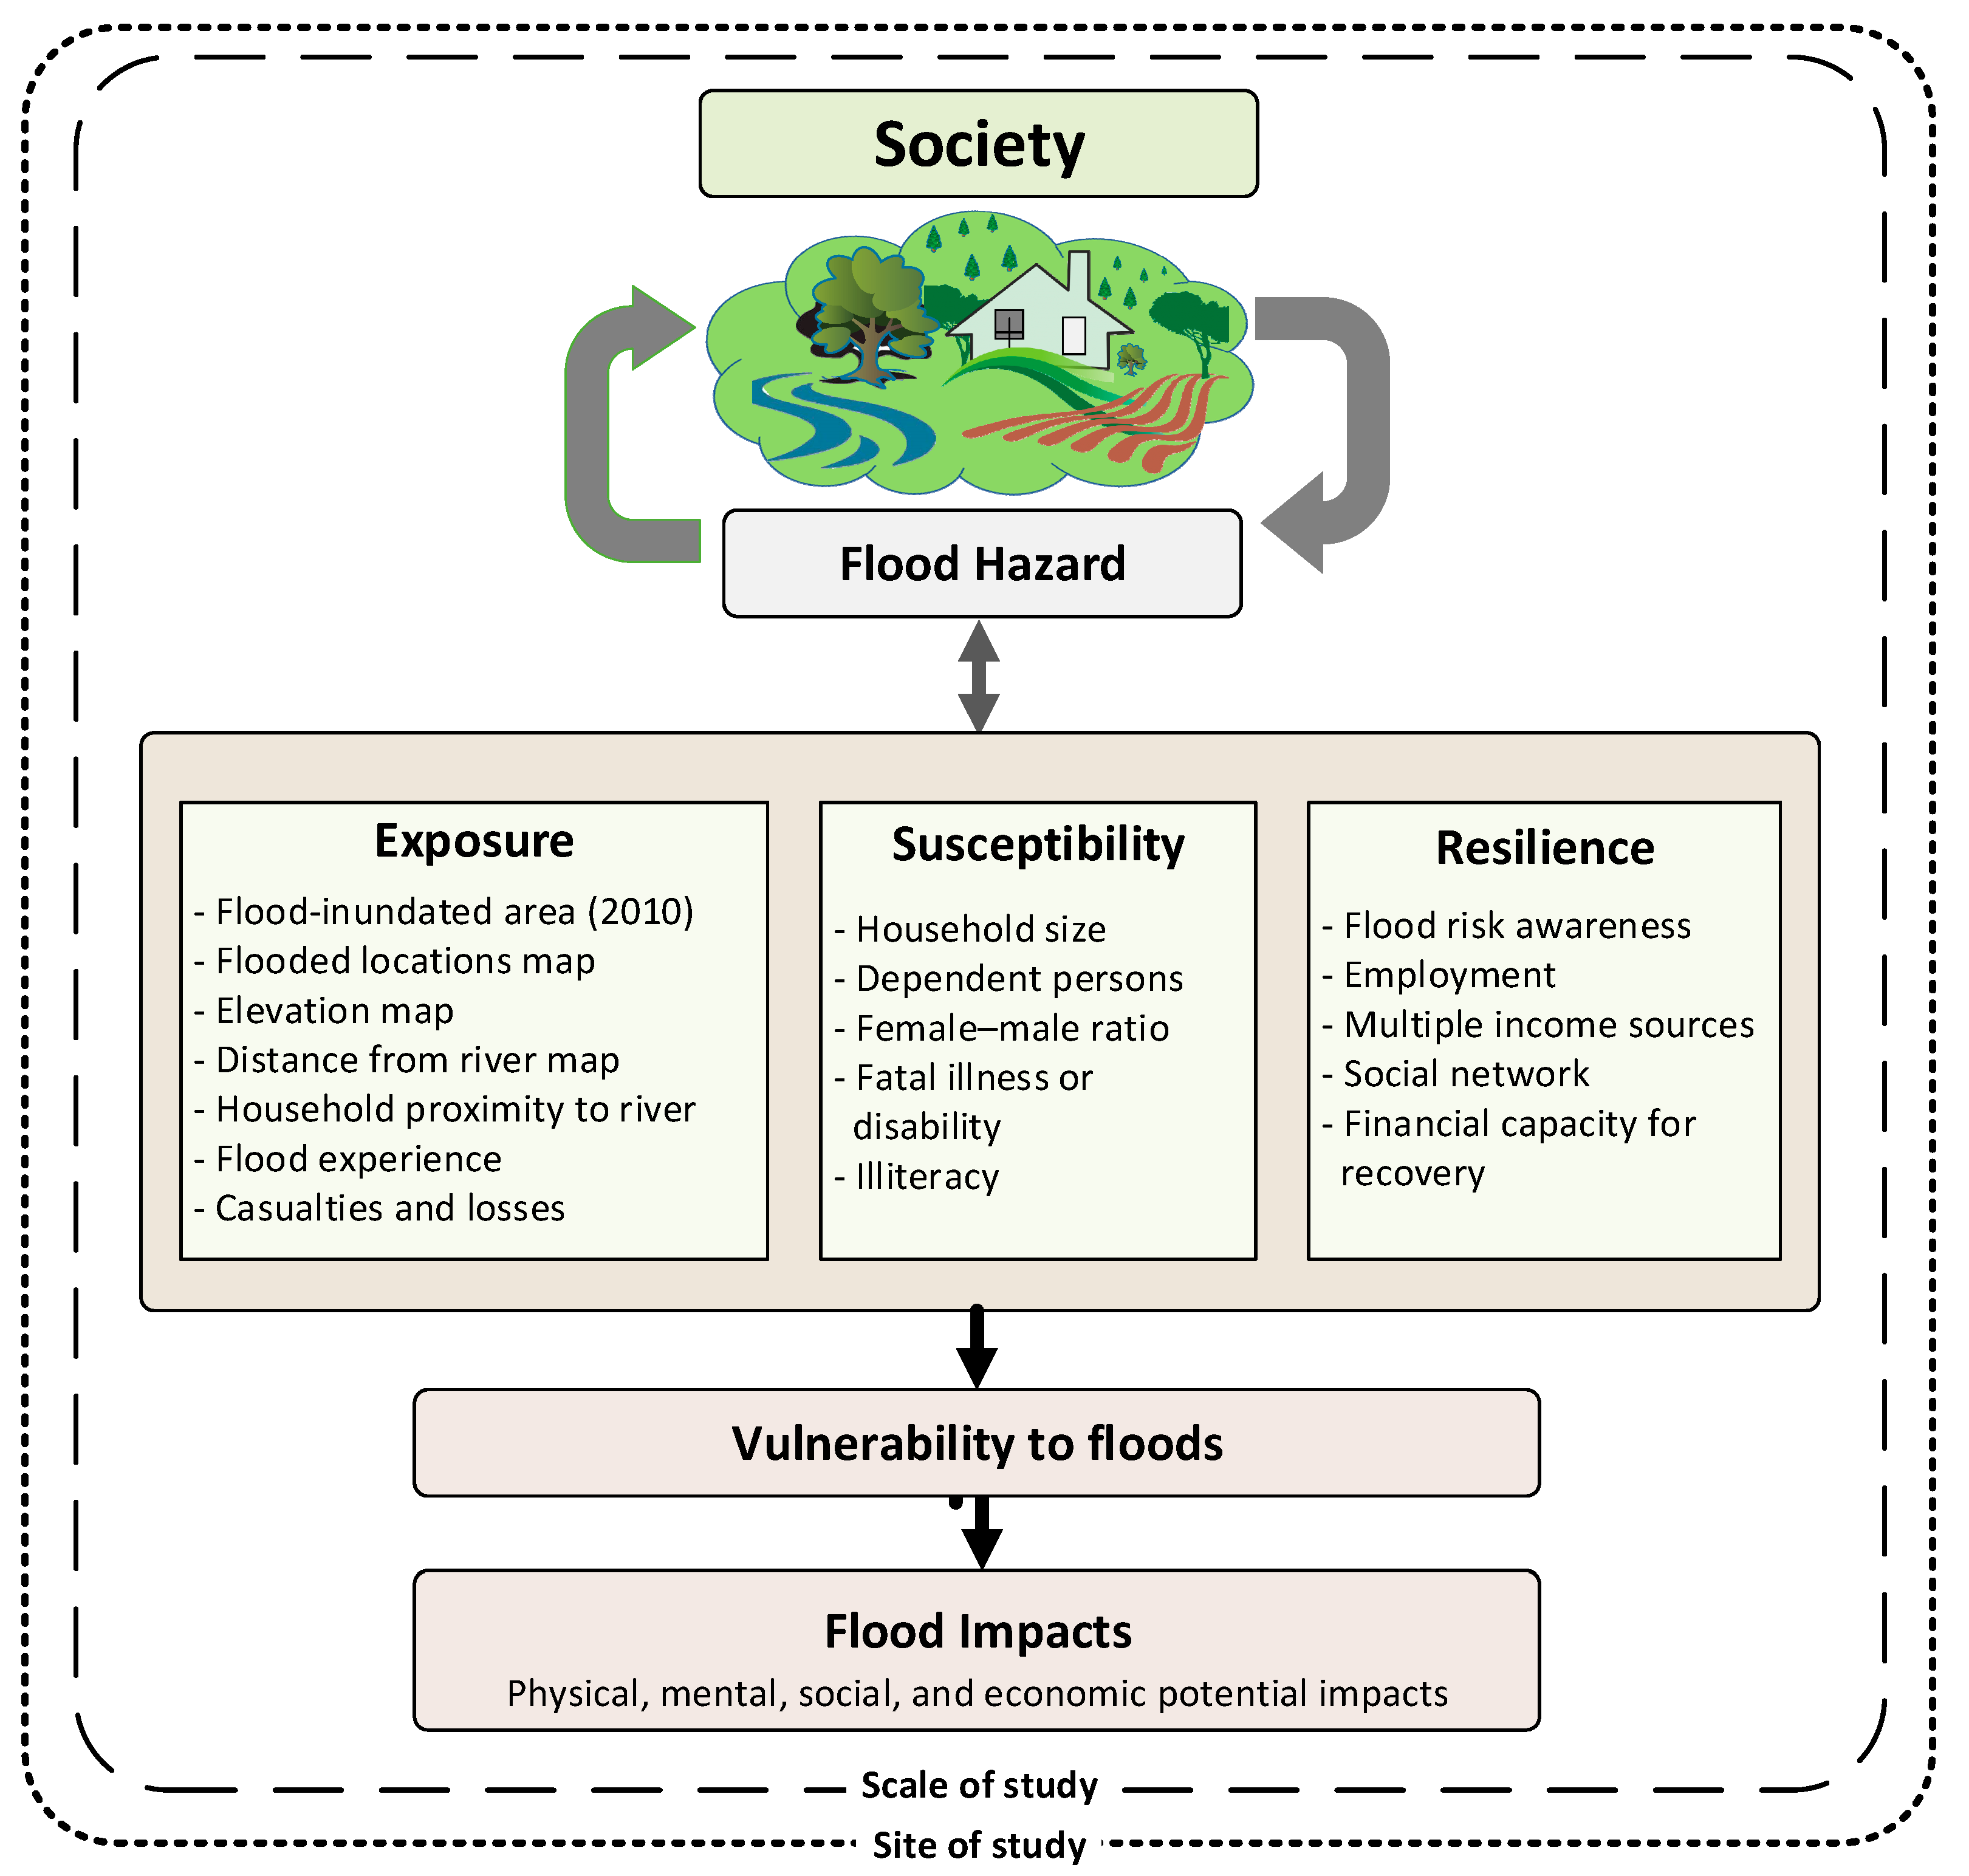
12]. Similarly, flood exposure maps with spatial variability can help inform community planners to effectively allocate resources and provide emergency management agencies with a better understanding and background before taking action, setting priorities, and developing long-term risk reduction strategies. Social vulnerability can have multiple forms: it can be the state of a system before the event, the likelihood of outcomes in terms of economic losses and lives lost, and it can also be the lack of capacity to face and recover quickly when disaster strikes. The latter deals with ‘resilience’, which refers to the ability of people or a society to respond effectively to hazards; resist, absorb, and minimize the adverse impacts; recover functionality; and adapt in a way that allows for learning and thriving. Information on social vulnerability not only depends on susceptibility to the exposed elements, but also on the resilience to resist or return to an acceptable structural or functional level [13,14,15]. However, in social vulnerability studies, resilience and vulnerability are often separately examined. Less attention has been paid to the varied influence of exposure and resilience components of social vulnerability [16,17,18]. In this study, therefore, we conducted an integrated analysis, combining social vulnerability and geospatial analysis, to evaluate the extent to which a system (a household, in this case) is exposed to floods, and its susceptibility (predisposition of at-risk elements associated with households) in conjunction with its ability (or inability) to cope, recover, or basically adapt.
Different methods to assess or determine hazards and vulnerability to flooding have evolved through ongoing research and practice in recent decades [12,19,20,21]. Among them, two distinct method types are deterministic modelling and parametric approaches. Deterministic modelling approaches use physically based modelling approaches (e.g., hydraulic modelling, flood inundation modelling, etc.) to estimate flood hazard/probability of particular event. They are coupled with damage assessment models which estimate economic consequence to provide an assessment of flood risk in an area. Parametric approaches, such as the Flood Vulnerability Index (FVI) [22], aim to use readily available data to build a picture of the vulnerability of an area. This approach has evolved from several concerns, such as the internal characteristics of a system, and global climate change and the political and institutional characteristics of a system. The parametric approach comprises vulnerability assessments in order to minimize the impact of flooding, and also to increase resilience in the affected system [22]. In recent years, decision-making approaches have also been used in research for flood vulnerability analysis [23]. Examples of decision-making approaches are the analytical hierarchy process [24], Delphi [25], and TOPSIS [23,26], among others. However, the major limitation of these methods is determining the interdependency among factors [27].
Parametric approaches have been widely used by researchers to measure multiple dimensions of vulnerability [13,19,23], For example: the Environmental Vulnerability Index (EVI) [28]; the Composite Vulnerability Index for Small Island States (CVISIS) [29]; the Global Risk and Vulnerability Index (GRVI) [30]; the Climate Vulnerability Index (CVI) [31]; the Social Vulnerability Index (SoVI) [11], FVI [13], etc. Balica et al. [22] identified that deterministic approaches have considerable limitations over parametric methods (e.g., FVI) in flood vulnerability assessments. Deterministic approaches have a better scientific base, but limited evaluation ability of vulnerability [22]. FVI gives a wider evaluation, but is less rigorous, and could be used to decide where a deterministic model is necessary. In this study, we conducted an integrated analysis, by combining an index-based system and geospatial analysis to identify areas with high flood exposure, social vulnerability, and their leading drivers. Integrated studies are well suited for analyzing and visualizing spatially varying linkages among physical and social dimensions of vulnerability to hazards. Integrated analysis can perform better in identifying biophysical and socioeconomic inequalities, and in predicting likely impacts and losses [5,32]. It can provide a more holistic view of the flooding problem, and can help advance our understanding of vulnerability science [33,34].
Numerous sets of social vulnerability indicators for natural hazards exist, such as the Social Vulnerability Index for Disaster Management [35], Social Determinants of Vulnerability Framework [36], and Social Vulnerability Index (SoVI) [11]. Additionally, flood-specific social vulnerability indicator sets include the Cologne flood indicators based on the MOVE (Methods for the Improvement of Vulnerability Assessment in Europe) framework in Germany [37], the Social Flood Vulnerability Index in England and Wales [38], and the Urban Municipality Flood Vulnerability Index in Brazil [39]. However, despite numerous pieces of work on indicators of social vulnerability and resilience, there is no definitive and conclusive set of indicators, or a methodology for developing indicators. Indicators are context-specific, and often vary from one region to another depending on human systems and local environment. Additionally, some statistical methods (such as principal components analysis) used to develop indices and/or indicator sets, which can be influenced by data availability, are challenging for policymakers to understand, and problematic to replicate, as the outputs are only pertinent to the time period and geographical area covered by the analysis. However, summarizing indicators into a single index value can provide simplicity of interpretation.
In Pakistan, researchers have assessed vulnerability in various contexts (i.e., natural hazards and environmental change). However, research on social vulnerability and integrated analysis in the context of flooding hazards is still lacking. Although emergency management agencies are aware of the factors that drive social vulnerability, there is limited information on how socio-economic inequalities and exposure factors play a role in flood disaster impacts, and how their interaction can increase vulnerability. This study attempted to conduct an integrated analysis of flood exposure and social vulnerability in Charsadda District, Khyber Pakhtunkhwa, Pakistan.
Our study has unique academic value in the field of social vulnerability assessment:
i.
First, we emphasize the importance of integrating the exposure component into social vulnerability assessments. For example, exposure indicators, such as elevation and distance to the river, can be the highest contributing factors linked with high vulnerability. Many previous studies on social vulnerability assessments only use socio-demographic indicators, which may only reflect the susceptibility of local communities [40,41,42,43];
ii.
Second, we use the household survey data as input for extracting and calculating indicators for local communities. Most previous index studies mainly use census data for data input, which does not necessarily reflect the ground truth of local communities. Current empirical validation studies have shown that existing census-based social vulnerability and community resilience indicators cannot sufficiently explain the disaster impacts of local communities [44,45]. By using household survey data, we can integrate more meaningful exposure, susceptibility, and resilience indicators into social vulnerability assessments;
iii.
Third, we discover some unique social vulnerability indicators specific for rural communities in the face of flood disasters. For example, rural households with weak economic capacity are more likely to reside nearby flood-prone areas with cheaper land prices, and rural households with larger household sizes are more likely to have a higher proportion of highly susceptible family members such as the elderly, children, and the disabled.
The remainder of this paper is organized as follows: Section 2 briefly describes the background of the study area. Section 3 presents the conceptual framework. Section 4 states the materials and methods. Section 5 present and evaluates the results of flood exposure and social vulnerability analysis, followed by a discussion in Section 6. Finally, Section 7 concludes the obtained findings, contributions, and limitations of this study.

2. Study Area

Pakistan is a highly flood-prone country. The country faces the impacts of frequent and severe seasonal floods, mainly in the monsoon period. The 2010 flood event was considered the century’s worst disaster [46], causing 1985 fatalities, affecting 515 health facilities, 2.1 million houses, 20.2 million people, and damaging agricultural land of approximately 2.4 million hectares [47,48]. Pakistan, being an agricultural country, has a widespread canal and river system which, due to poor management, often results in flooding and causes damages to the people and communities residing in the floodplains and canal/river catchments. Land-use change, socio-economic development, inadequate (poor maintenance) or insufficient drainage systems, and human encroachments over the channels further intensify water runoff, worsening flooding hazards and their impacts on local inhabitants [49]. According to the National Disaster Management Authority of Pakistan, out of 145 districts in the country (as of the administrative boundaries of 2010), 113 were classified as located in medium to very high flood-risk zones [50]. Over the last two decades, Khyber Pakhtunkhwa (KP) province has experienced many catastrophic floods [51]. Most of the districts in KP province are facing frequent and devastating floods, mainly due to the Swat and Kabul Rivers [
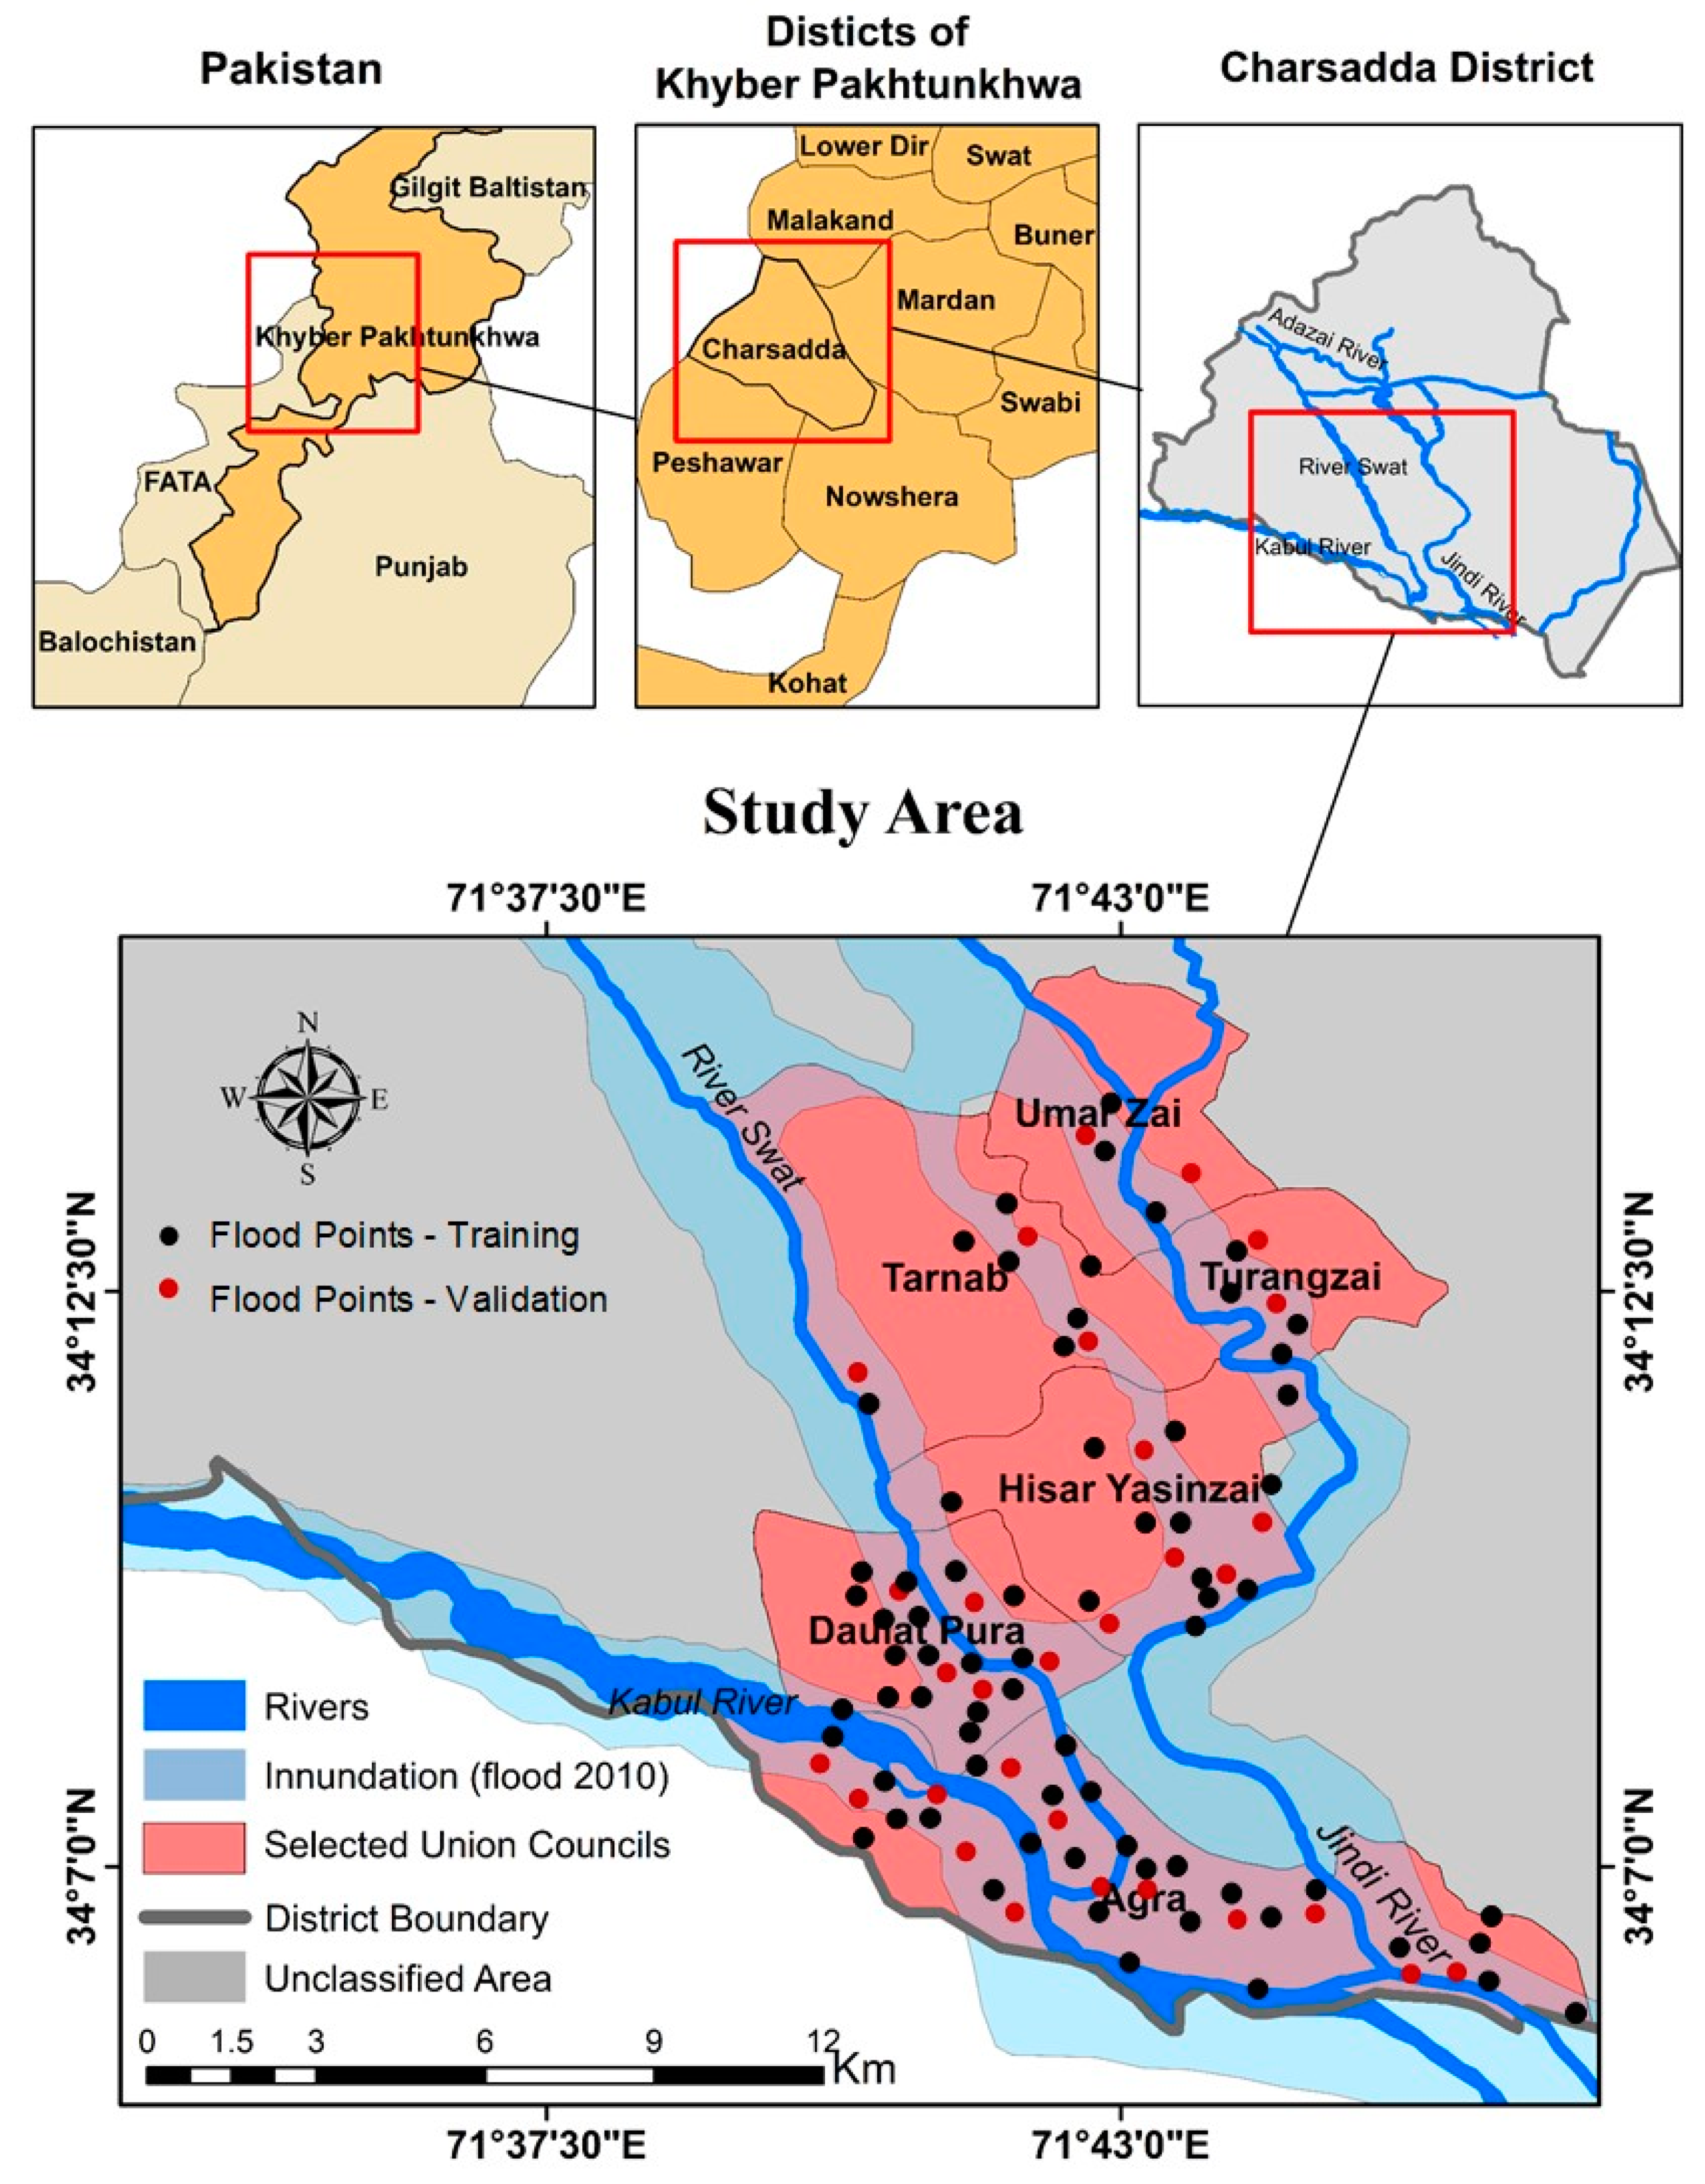
52]. The reference map of the study area is shown in Figure 1.
Charsadda District, which is the focal point of this study, is one of the most severely flood-affected districts in the country, with relatively widespread casualties and losses. The district is located between 71°53′ to 71°28′ east longitudes and 34°03′ to 34°38′ north latitudes. Geographically, the district covers an area of 996 km2 and is home to several rivers and streams, including the Swat and Kabul Rivers, where flooding is a frequent phenomenon during the monsoon season. There are many reasons behind recurrent flooding in Charsadda District, including climate change, heavy rainfall, and human interventions in flood plain areas. In the flooding events of 2010, it was the Swat and Kabul Rivers that devastated and inundated a large part of the study area. As depicted in Figure 2, in the 2010 flooding event, the discharge of Swat River reached 8495 cubic meters per second. Heavy rainfall occurred (27–30 July 2010) which exceeded the capacity of the river channels, and they were unable accommodate the discharge water.
Most of the people in the district are engaged in agriculture and horticulture activities for purposes related to their livelihoods. Those practices are generally observed around main rivers, streams, and branches in the basin. Intensive agriculture activities have resulted in massive deposits in the riverbeds, causing rainwater to exceed the rivers’ capacities and overflow to the floodplains. Most of the villages near these rivers have been severely affected by floods, giving us a suitable study area for the conducted assessment. Six union councils (UCs) were selected for the present study based on the assessment reports of the Provincial Disaster Management Authority of Khyber Pakhtunkhwa (PDMA-KP). The total population of Charsadda District is about 1,616,198 (1.6 million), with 36,240 in UC Umar Zai, 15,263 in UC Hisar Yasinzai, 14,426 in UC Turangzai, 11,719 in UC Agra, 9737 in UC Tarnab, and 9681 in UC Daulat Pura [53], representing the surveyed sites.

3. Conceptual Framework

A standardized index-creation procedure includes: (1) the choice of theoretical framework; (2) indicator selection; (3) data transformation and aggregation; (4) visualization; and (5) validation [54]. Therefore, the preliminary step is to define the conceptual framework. We chose the MOVE framework [55] as the basis for our conceptual framework and for developing indicators. According to the MOVE framework, hazards (natural events or socio-natural events) interact with society (including vulnerability) to produce a risk (economic, social, or environmental potential impact). Given its holistic and generic nature, this framework is applicable to both climate change and natural hazards, and can be used as a guideline for selecting indicators. In the MOVE framework, vulnerability has three key components: resilience, susceptibility, and exposure. Our conceptual model incorporated these elements of (i) exposure, (ii) susceptibility, and (iii) resilience from the MOVE framework (see Figure 3).
The domains are defined in the following manner: (1) exposure is the proximity of people and/or physical items to an external threat; (2) susceptibility refers to a system or setup (households in this case) having at-risk elements (the social fabric—demographic, socioeconomic, and housing characteristics) which increase the likelihood of being harmed by threats or experiencing losses; and (3) resilience is related to the existing capacities to anticipate, cope with, and recover the losses. Traditionally, vulnerability is a negative phenomenon or variable where exposure and susceptibility are considered its negative complementary components, which implies that vulnerability increases when the value of these components increases. Resilience is its reciprocal component, which implies that vulnerability decreases when the value of resilience increases [16,43]. Thus, in this context, vulnerability = exposure + susceptibility—resilience (see Figure 4) [35,39]. In this regard, indicators representing each component have varied impacts on total vulnerability across the regions and communities [56]. Evaluating this varying impact helps to provide information on indicators that are more prevalent and need the earliest attention in devising flood risk reduction strategies [57].

4. Materials and Methods

This study used an indicator-based approach for conducting spatial analysis, estimating population flood exposure, and constructing a Social Vulnerability Index, using the example of flooding in Charsadda District. The Flood Exposure Index was assessed and combined with the distribution of the socioeconomic indicators to understand the flood vulnerability. The relative social vulnerability levels of the households were assessed, and the spatial distributions of highly exposed and vulnerable populations were determined.

4.1. Development of Composite Indices

Conceptual framework was used as a guide to identify potential indicators, and validity interviews were conducted with local experts. For exposure parameters such as elevation, flooded locations, distance from the river, and flood-inundated area, the data were derived from the USGS website (available at https://earthexplorer.usgs.gov/ (accessed on 14 June 2021)) and documentary sources of PDMA-KP, followed by validation assessments through field surveys. The data for populating socioeconomic and resilience indicators were collected from a well-sampled household survey using questionnaire-based face-to-face interviews. Indices for different components, including exposure, susceptibility, resilience, and overall social vulnerability were then calculated, transformed, and aggregated using SPSS-21, MS-Excel, and geospatial tools, and later visualized using ArcGIS tools. The methodological process is illustrated in Figure 5.

4.1.1. Indicator Selection and Validation

There are two methods for the selection of indicators: one is the deductive approach (physical relationship or theoretical based), and the other is the inductive approach (statistical data based) [58]. In this study, we used a deductive approach to identify relevant and significant indicators. Initially, 23 proxy indicators were identified (grouped into three main components of vulnerability), and for their face validity, interviews were conducted with local experts. Interviews were carried out with the key informants at PDMA-KP and Centre for Disaster Preparedness and Management, University of Peshawar (CDPM-UOP), to identify the flood-prone areas and shortlist the most relevant and significant indicators. These line agencies were requested to nominate experts from their departments for interviews. Three experts were selected from PDMA-KP and two from CDPM-UOP. A meeting was then arranged, and the experts were provided with research briefings and the relevant literature. They were asked to evaluate the indicators and condition of a system and shortlist the most relevant and significant indicators in their opinion. Based on their opinion, indicators ‘age’, ‘children’, and ‘elderly’ were combined together as ‘dependent persons’, whereas the indicators ‘fatal illness’, ‘visually impaired’, and ‘hearing and motor disability’ were combined together as ‘fatal illness or disability’. This is because all these indicators were meant to identify the groups that need special care and support during emergencies to move to safer locations. Similarly, since both the ‘inundated areas’ and ‘flooded locations’ indicators indicated the extent of the flood hazard event, they were combined as ‘flooded locations’. Based on the opinion of experts, a total of 16 indicators were shortlisted and considered for practical investigation (see Table 1).

4.1.2. Data Collection, Transformation, and Aggregation

The data for populating socio-demographic indicators were collected from a well-sampled household survey. A detailed questionnaire was constructed for the household surveys, and a pilot study was conducted to streamline and refine the questionnaire. The cumulative population of the shortlisted UCs for the household survey was about 97,066. We employed the formula of Israel [59], giving us a sample size of 204 with a 7% level of precision and a 95% level of confidence. However, for ease of analysis, we took a sample of 210 households for interviews. A sample of 40 households was taken from UC Umar Zai, 40 from UC Hisar Yazinzai, and 40 from UC Turangzai, because comparatively these UCs have a larger population and had faced more impacts from floods in the past. However, from UCs Daulat Pura, Tarnab, and Agra, 30 households from each were taken as a sample. Face-to-face interviews were carried out with the head of the households to fill the questionnaires. All the respondents interviewed were men because of the local norms, traditions, and strong cultural values, which inhibit women from coming to the forefront. Values of indicators were taken in percentages to overcome difficulties in the analysis.
For the exposure component, to understand the flooding situation and identify places exposed to flooding, we adopted geospatial methods such as elevation, flooded locations, distance from the river, and flood-inundated area, followed by validation assessments through field surveys. The inundation map of the 2010 flooding event was digitized from the assessment reports of PDMA-KP.
Delineating flooded areas is considered the most crucial part of flood exposure mapping. Researchers widely use LANDSAT scenes to get information on flooding situations and to establish or predict the flood-risk areas in future flooding events. Therefore, based on the LANDSAT ETM 7 and band 5 images (with a spatial resolution of 15 m pan-sharpen), we randomly extracted 70 flooded locations. To confirm and validate the extracted flood points, we further identified a total of 30 flooded locations in the study area, based on the perception of local residents and field survey data, along with handheld GPS. We divided the flood points into two categories, 70% representing the flood training points and 30% representing the flood validation points. The flood points extracted from the remote sensing were grouped as training points, and those extracted through field surveys were grouped as validation points. All the flood points (training and validation) were labeled on a study area map by geo-visualized tools (Figure 1), and the final score for each UC was calculated based on the total flood points in each UC. The results are shown in Table 2.
The elevation and distance from a river are important flood-related factors that intensify floods [60]. They are considered crucial for flood exposure mapping. The elevation map was processed from the DEM (Digital Elevation Model), with 30 m spatial resolution downloaded from the USGS website (available at https://earthexplorer.usgs.gov/ (accessed on 14 June 2021)). Elevation values were divided into six categories: (1) 274–308 m; (2) 309–350 m; (3) 351–390 m; (4) 391–458 m; (5) 459–611 m; and (6) 612–964 m (Figure 6). The distance from the river map for the study area was produced using the buffer tool in ArcGIS 10.2 and classified into six categories using the natural breaks (Jenks) classification method: (1) 0–400 m; (2) 401–800 m; (3) 801–1200 m; (4) 1201–1600 m; (5) 1601–2000 m; and (6) > 2000 m (Figure 7). The GIS-based frequency ratio method and Equation (1) were used then used to calculate the FR values for elevation and distance from rivers. The FR approach is used to determine the level of correlation between flood locations and their triggering factors (elevation and distance from the river), and the results are shown in Table 3. FR is one of the simplest and most authentic methods frequently applied for flood vulnerability mapping. In general, an FR value of 1 indicates an average correlation. If the FR value is greater than 1, it means the parameter strongly influences flooding, and if it is below 1 it shows a negative relationship between flood occurrence and the controlling variable [61].
FR = F / TF     N / TP  
where F is the number of pixels with floods in each factor sub-class; TF is the number of total pixels within each factor; N is the number of pixels in the class area of the factor; and TP is the number of total pixels in Charsadda District. The final FR values for elevation and distance from rivers are presented in Table 3.
Finally, all the data from household surveys, FR analysis (elevation and distance from rivers), and flooding locations were normalized in MS Excel, using linear Min ( ) and Max ( ) normalization method Equation (2) to achieve final values between 0 and 1:
N ij = X ij Min   ( X ij )   Max   ( X ij ) Min   ( X ij )
where Nij denotes the normalized value of each indicator of the components (E, S, R) for a union council j; Xij denotes the actual value of the indicator for the respective components; Min (Xij) and Max (Xij) are the minimum and maximum values of the indicators for the union council j; and Nij lies between 0 and 1. The value 0 represents the indicators with the minimum value and 1 corresponds to indicators with the maximum value.
Construction of the composite indicator requires a meaningful weighting system for the components. Thus, before aggregation (developing indices for exposure, susceptibility, and resilience), an equal weighting system was adopted to assign weights to the indicators, as this was agreed among the informants in group interviews. All the indicators were considered to have equal significance in influencing exposure (E), susceptibility (S), resilience (R), and overall vulnerability of the study area. Cutter et al. [62] also argue for equally weighted indices for two reasons: (1) this method provides transparency and is intuitive to a range of end-users; and (2) they were unable to determine a justification for favoring one indicator over another. Therefore, after normalization, a simple average scoring method was used to give equal weights to all indicators [11,62]. For each vulnerability component (E; S; R), average indices were individually calculated using Equation (3):
A I = i = 1 n N ij   n  
where AI is the average index of the social vulnerability component; Nij is the normalized value of the indicator for union council j; and n is the number of indicators. For each social vulnerability component (E; S; R) average indices were individually calculated.
Finally, each union council’s social vulnerability was computed by inserting the averaged indices of each social vulnerability component (E; S; R) into Equation (4):
SFVI = E AI +   S AI R AI
where SFVI represents the union council’s social Flood Vulnerability Index; EAI is the index value for the exposure component; SAI is the index value for the susceptibility component; and RAI is the index value for the resilience component. The results of each vulnerability component and overall social vulnerability were presented as having low, moderate, or high levels. Finally, the index values were inserted in ArcGIS tools to produce maps representing resilience, susceptibility, exposure, and social vulnerability of the study area.

5. Results

The Social Vulnerability Index analysis evaluated the flood exposure and vulnerability of the households, and the results were presented through generated maps. The maps were classified with color ranges from low to high to represent the relative spatial distribution of indicators and highly vulnerable populations. Scores of individual indicators were presented with color ranges from light to dark red (with a light color showing a low score and a dark color showing a high score). Final scores of social vulnerability and its components were presented with green (low), yellow (moderate), and red (high) colors. The identification of low, moderate, and high groups was conducted by K-means clustering analysis, which aimed to partition six UCs into three clusters in which each UC belonged to the cluster with the nearest mean (cluster centers) (Appendix A Table A1).

5.1. Exposure

Overall exposure of the surveyed sites was evaluated by these indicators: household proximity to rivers, past flood experience, casualties and losses, flood locations, elevation, and maps showing distance from the river.
Flooding is assumed to occur in the future under the same conditions as the past and present flooding disasters. The results showed that about 80% of all the flood points were located in the UCs of Agra, Daulat Pura, and Hisar Yasinzai (see Figure 1 and Table 2). The generated map showing the spatial distribution of flood points revealed that areas with the highest exposure to floods were located in the southwest part of the study area, near the river boundaries where the Jindai and Swat Rivers converge into the Kabul River. Consequently, these locations receive more floods due to the resulting influx of floodwater from other converging rivers (Jindai and Swat) towards the Kabul River.
Elevation is an important factor controlling the geographical extent of flooding areas. It influences the intensity of runoff. Generally, water flows downward due to the force of gravity; rainfall accumulates in low-lying areas and thus lower elevations are more prone to flooding. The analysis of FR for the relationship between flood locations and elevation indicated that the elevation class of 274–308 m had the highest FR value (1.62), and thus had the most probability for flooding (see Table 3 and Figure 6). The results also revealed that the UCs (Agra, Daulat Pura, and Hisar Yasinzai) located in this class were highly inundated in the 2010 flooding event (see Figure 1), and thus the area has been considered as a potential highly exposed zone. As depicted in Figure 1, the major rivers that flow through the district are the Jindai and Swat Rivers, which converge into the Kabul River. The resulting influx of floodwater from those converging rivers (Jindai and Swat) towards the Kabul River often exceeds the river capacity and overflows to the floodplains, causing floods in the surrounding areas.
Distance from the river is one of the main factors affecting flood spread and magnitude. Following precipitation events, sediment accumulation occurs when discharge increases, with possible flooding of the surrounding areas. The distance from the river in the range 0–400 m showed the highest FR value (1.89) and thus has a high probability of flooding (see Table 3 and Figure 7). These results demonstrate that flooding mostly occurs near the riverbank and rarely far from the rivers. Thus, the closer the area, people, or settlements to the river, the more vulnerable they are to experiencing floods. The analysis revealed that the UCs (Agra, Daulat Pura, and Hisar Yasinzai) which had the lowest distance from rivers overlapped with the historical highly inundated areas and flood locations (see Figure 1), and thus they are considered as potential highly exposed areas.
Finally, the normalized values of flood locations (shown in Table 2) and the normalized FR values of elevation and distance from rivers (shown in Table 3) were combined with the normalized values of the household survey data, and the results are presented in Table 4 and Figure 8. The results demonstrated that the UCs of Agra, Daulat Pura, and Hisar Yasinzai had the highest exposure to floods. The average index scores for indicators in these UCs were between 0.77 and 0.94 (Table 4). This can be explained by the fact that these UCs are located in low-elevated areas (Figure 6) and, therefore, have faced more floods and for a longer duration with high inundation (Figure 1). Most of the households were observed close to rivers, or in flood-prone areas near rivers where flooding is a frequent phenomenon. In contrast, Tarnab and Umar Zai were found to have low exposure to floods, with index scores of 0.31 and 0.35. This is because, comparatively, these UCs are located in high-elevated areas (Figure 6) and, therefore, have faced floods for a short duration with less inundation (Figure 1). Additionally, most of the households in these UCs were also observed in low proximity to rivers, and therefore are less likely to be affected by floods. Turangzai indicated a moderate level of exposure to floods with an index score of 0.45. Overall, the average score for indicators E1–E6, reflecting the exposure of the six UCs, was between 0.35 and 0.76 points, respectively (Table 4).

5.2. Susceptibility

Susceptibility was computed as the average of five indicators (S1 to S5), and the results were presented through generated maps (Figure 9). The results showed that out of all the surveyed sites, Agra, Turangzai, and Tarnab were found to have a high level of susceptibility to floods. Most of the households in these UCs had higher scoring indicators than the other areas, especially for S1, S3, and S5 (Table 5). In contrast, Umar Zai and Hisar Yasinzai indicated the lowest levels of susceptibility with average index scores of 0.39 and 0.42, respectively. Umar Zai had the lowest scores for indicators S1, S2, and S3, whereas in Hisar Yasinzai S3 showed the lowest score. Such low scores make households in these UCs less susceptible to the impacts of flooding hazards. The remaining UC Daulat Pura indicated a moderate level of susceptibility to floods, with an average index score of 0.54.
Household size (S1) and illiteracy (S5), with average scores of 0.68 and 0.87, were found to be the major indicators influencing the susceptibility of the households to flooding hazards. Larger families are generally assumed to have more manpower, and thus are anticipated to reduce susceptibility through education and financial assistance [63]. However, in this study, a high percentage of households were observed with large families consisting of mostly elderly people and children; during disaster events these groups are the most vulnerable, as they need special care and support during emergencies to move to safer locations. Additionally, larger households had a higher number of children under the age of 15 and, therefore, had more school-dropout children. Similarly, a high percentage of household heads were either illiterate or had a low level of education. This affects their ability to seek flood risk awareness, understand precautionary measures, and adopt preventive and mitigative measures, eventually making them more susceptible to the impacts of flooding hazards [64].

5.3. Resilience

Resilience levels of the surveyed sites were measured as the average of five indicators from R1 to R5, and the results are presented through the generated map (Figure 10). The findings show that, except in Agra (with the highest average index score of 0.60), most of the households in the study area had a low level of resilience (with average index scores of less than 0.48). The highest resilience level of Agra can be explained by the fact that, comparatively, it has experienced severe consequences from flooding events in the past and has thus adopted better mitigation measures (e.g., cleaning of streams and waterways, marginal embankments, sandbags, and loudspeaker systems). Additionally, frequent flood experience has also increased people’s ability to understand extreme weather events and their consequences. This explains the comparatively higher scores of R1, R2, R4, and R5 (Table 6). In contrast, Umar Zai, Hisar Yasinzai, and Tarnab had the lowest average index values of 0.40, 0.41, and 0.42, respectively. This is because the majority of the indicators measured for these UCs had low scores, indicating their lack of resilience to withstanding the impact of floods. The remaining UCs, Daulat Pura and Turangzai, indicated moderate levels of resilience.
Resilience indicators were distributed unevenly across the surveyed sites, causing them to have a differing influence on vulnerability. Overall, the results showed that, among all the resilience indicators, flood risk awareness (R1) and social networking (R4) indicated the highest average scores of 0.85 and 0.77, respectively. Hence, these are the leading indicators increasing households’ overall resilience level. Studies have reported that people with flood risk awareness are less susceptible and more resilient to flooding hazard impacts [8,64]. Similarly, social connectedness and cooperation among households represent community help in disasters and shared participation for planning. Communities with strong social networks will have strong coordination with each other, and in cases of emergency, they will help each other and reduce the impact of flooding [65,66]. Indicators R3 and R5 showed the lowest average scores of 0.16. This is because most households in the study areas lacked secondary income sources and savings for flood recovery. Similar studies reported that households with weak economic capacity are less resilient and more vulnerable to flood impacts. In contrast, those with high financial capacity are less vulnerable, because if one source is affected during a flooding event, they will be able to bear the losses with other income sources [5].

5.4. Social Vulnerability

The Social Flood Vulnerability Index of each UC was computed by inserting the averaged indices of exposure, susceptibility, and resilience into Equation (4). The results of SFVI showed that, among the six surveyed sites, Agra, Daulat Pura, and Hisar Yasinzai showed the highest level of social vulnerability (Figure 11), with index scores ranging from 0.78 to 0.98, in which Agra had the highest score (0.98). In contrast, UC Umar Zai indicated the lowest index score of 0.34, and therefore has the lowest social vulnerability to floods. Tarnab and Turangzai showed moderate levels of social vulnerability to floods, with index scores of 0.49 and 0.59 (Table 7).
The results showed that the UCs of Agra, Daulat Pura, and Hisar Yasinzai had high social vulnerability because they had the highest flood exposure (see Figure 8) and comprised historically highly inundated flooded areas (see Figure 1). They have experienced flooding events in the past due to their proximity to the Kabul, Swat, and Jindi Rivers that flow very close to each other and merge in the southern part of the study area (see Figure 1 and Figure 6). These UCs are located in low-lying areas (see Figure 6), and a majority of the households in these UCs were also observed as being close to rivers. Hence, when rainfall occurs, these rivers often overflow due to the high influx of water from upper areas and surrounding streams, resulting in flooding. In contrast, the UC of Umar Zai had the lowest vulnerability, due to its low exposure and low susceptibility to floods.
Overall, the indicators including large household size (with more elderly, children, and women), illiteracy, and weak economic capacity (unemployment and lack of secondary livelihood sources) contributed the most to influencing an area’s social vulnerability. The calculation of exposure components (elevation, distance from river, inundated and flooded locations) provided additional information on the reasons behind the distribution of vulnerability and socio-economic indicators. Those households located close to rivers, in flood-prone locations, and with weak socio-economic conditions, have experienced high flood impacts and losses, and showed low capacity to cope with the negative consequences. Other vulnerability studies, at both regional and household levels, also achieved similar results by incorporating these indicators into their vulnerability assessment models [5,34,67,68].

6. Discussion

This study’s objective was to quantify flood exposure and social vulnerability of households to floods in Charsadda District, using an indicator-based approach. Developing a conceptual framework (based on the core part of the MOVE framework) for understanding social vulnerability was a crucial step in this study. While conceptual frameworks already existed for understanding biophysical and socio-economic vulnerabilities, resilience, and susceptibility, this is the first time—to our knowledge—that these frameworks have been combined to create a practical framework for social vulnerability analysis. In particular, using the MOVE framework means that the conceptualization of social vulnerability used in this study was robust and consistent with previous research. It gives prominence to all aspects of vulnerability and resilience, regardless of data availability; each dimension is still represented as best as possible with the data available. Furthermore, the framework shows how a lack of resilience is not only an important aspect of social vulnerability, but that other components—such as exposure and susceptibility—also influence social vulnerability.
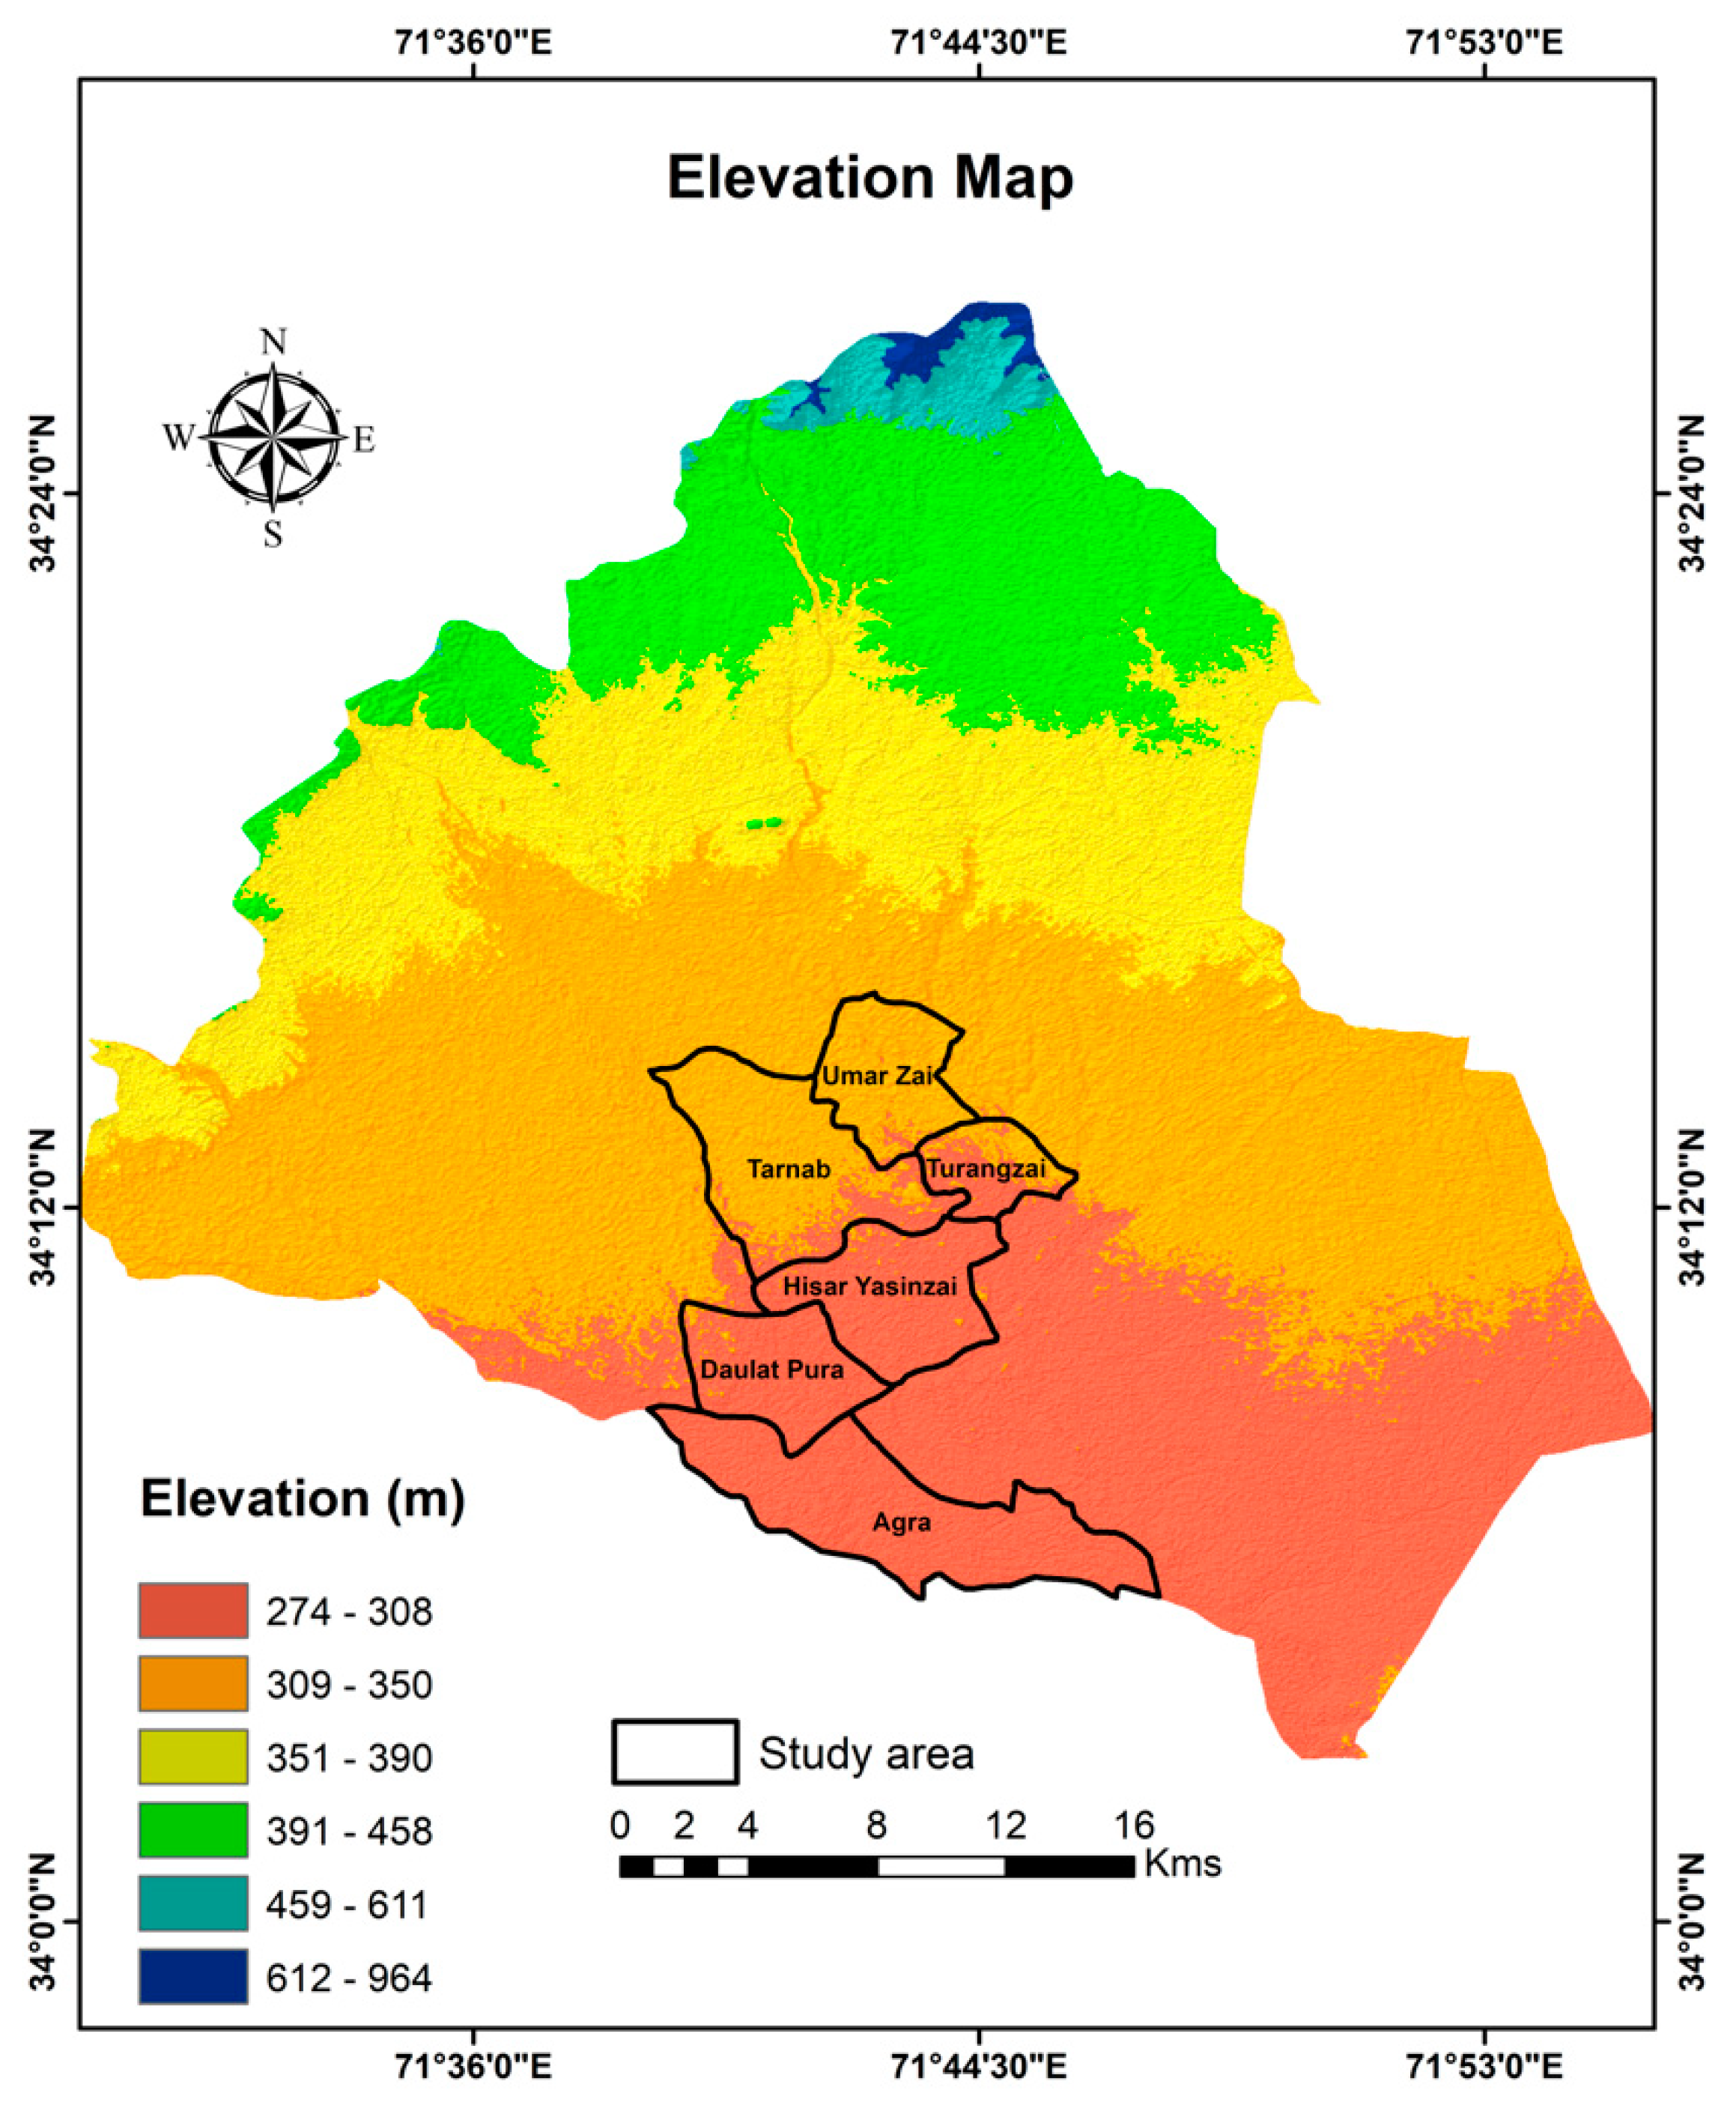
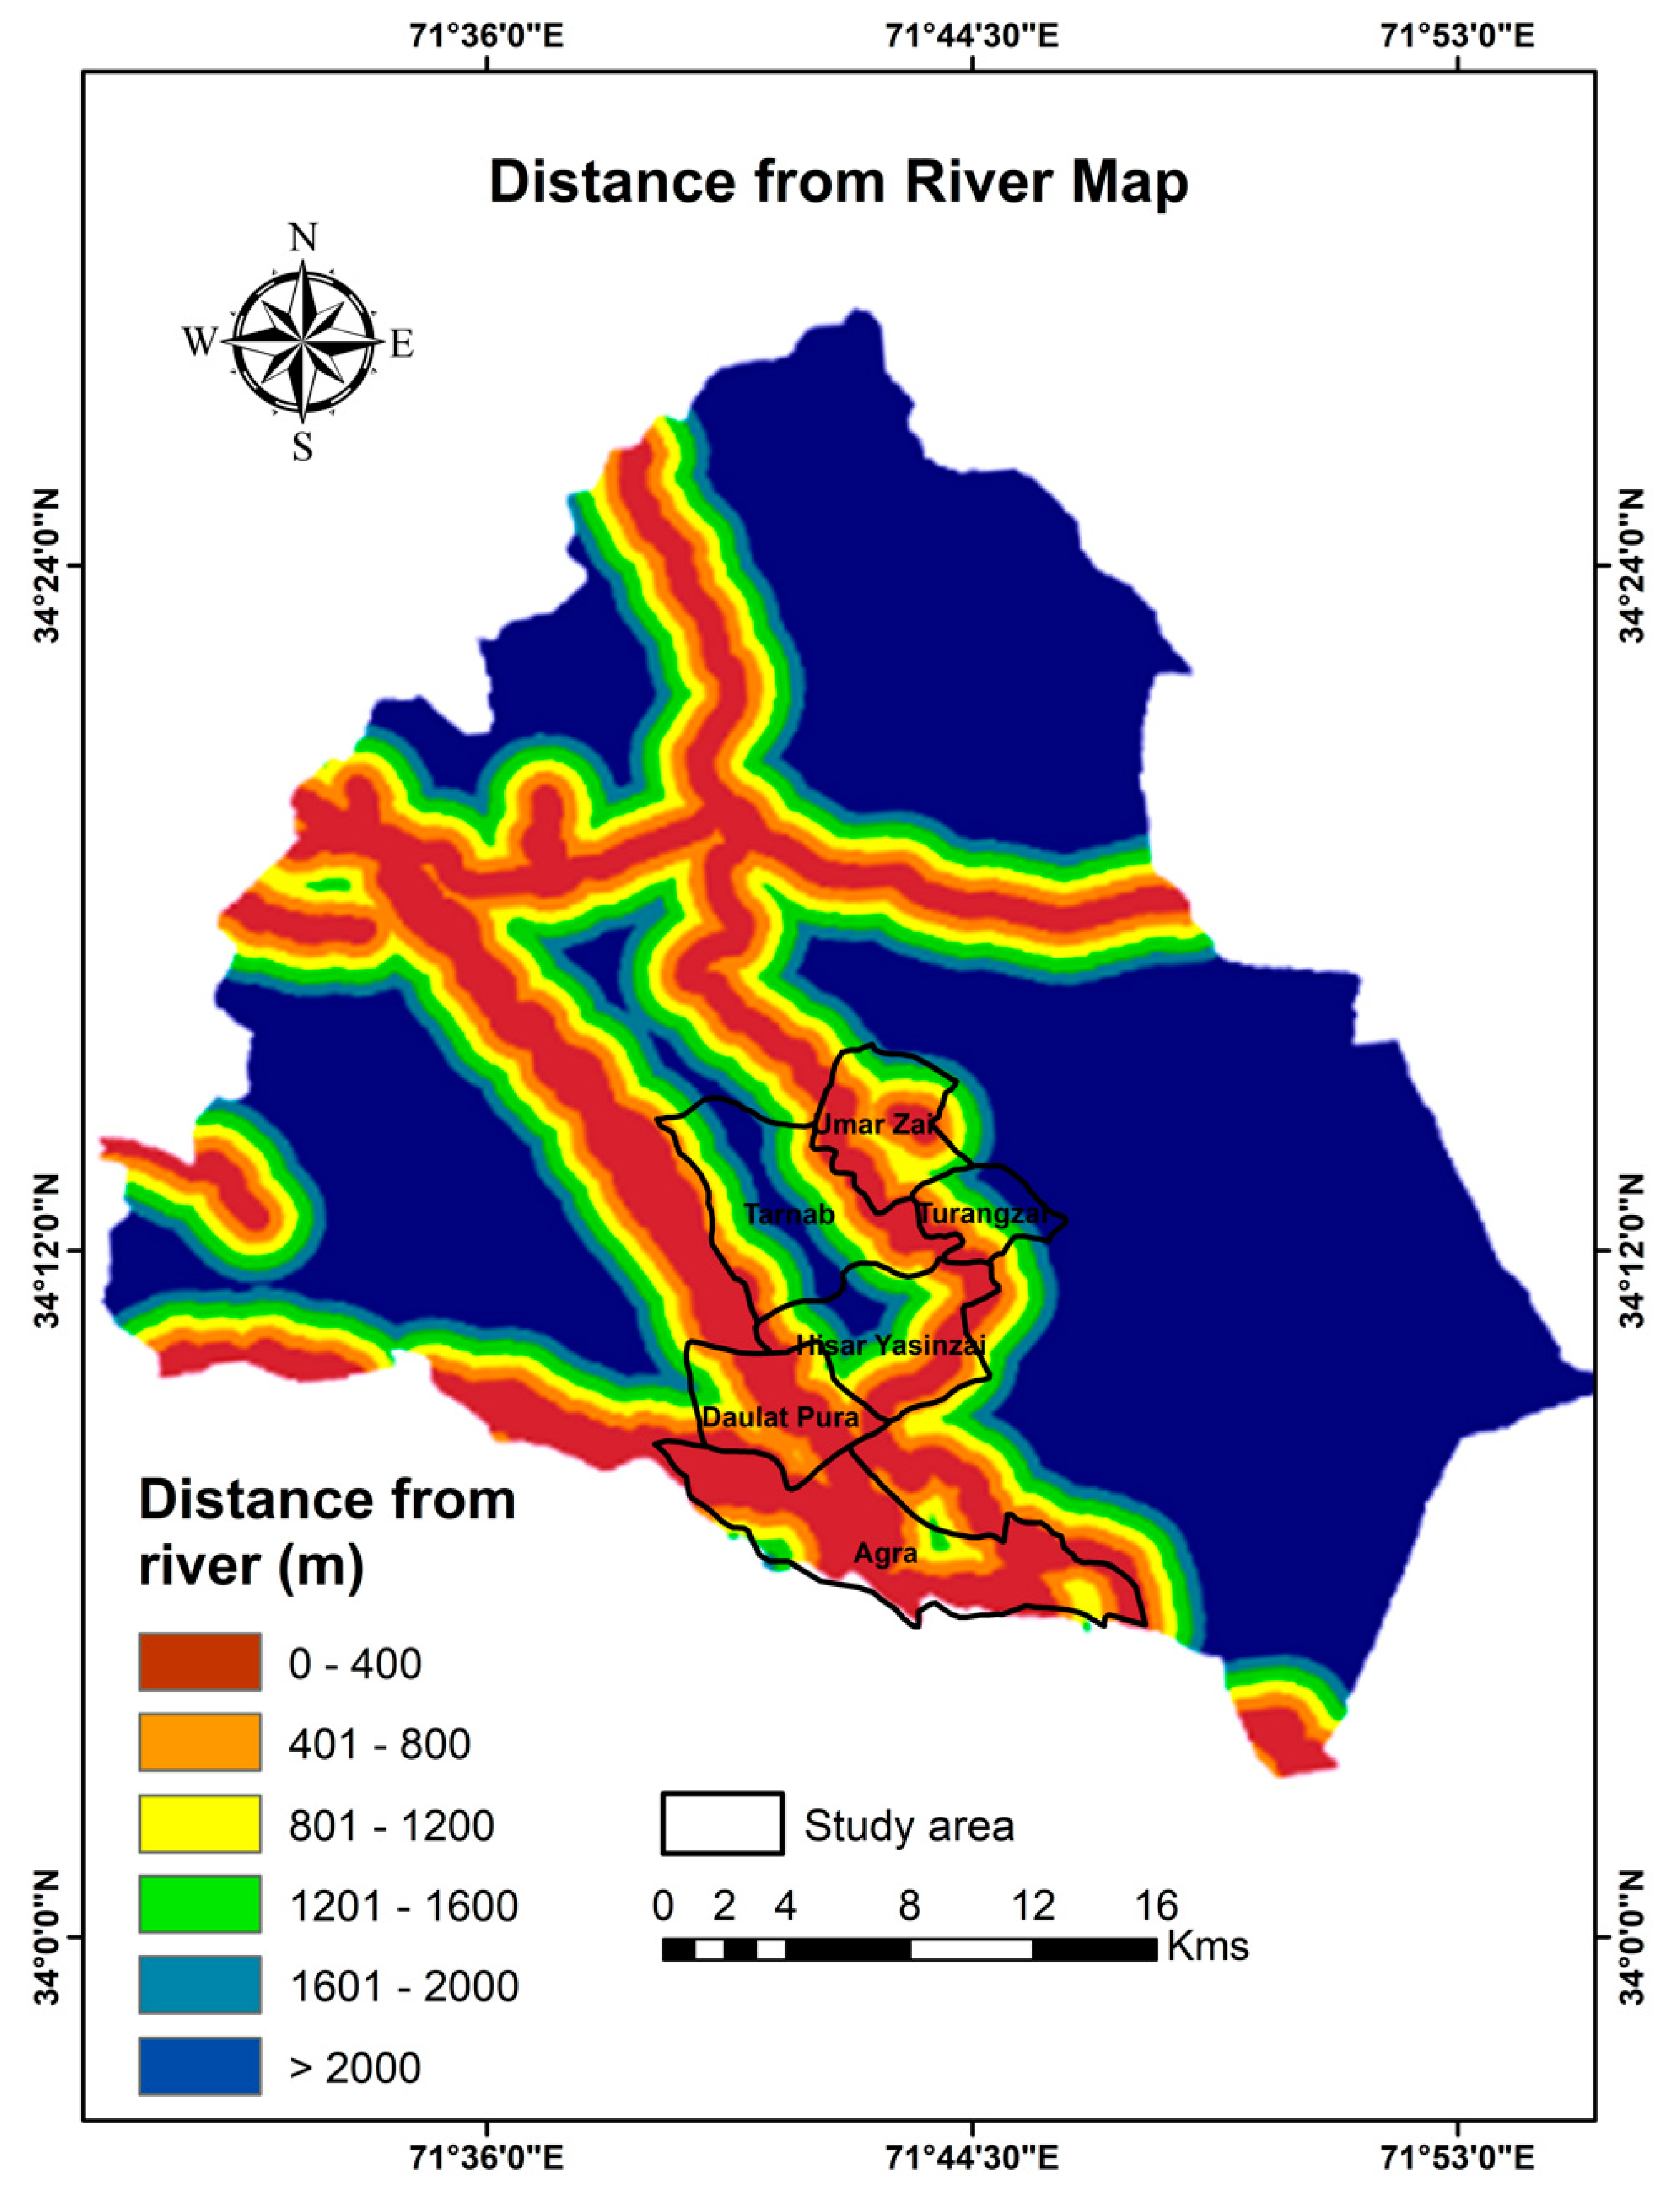
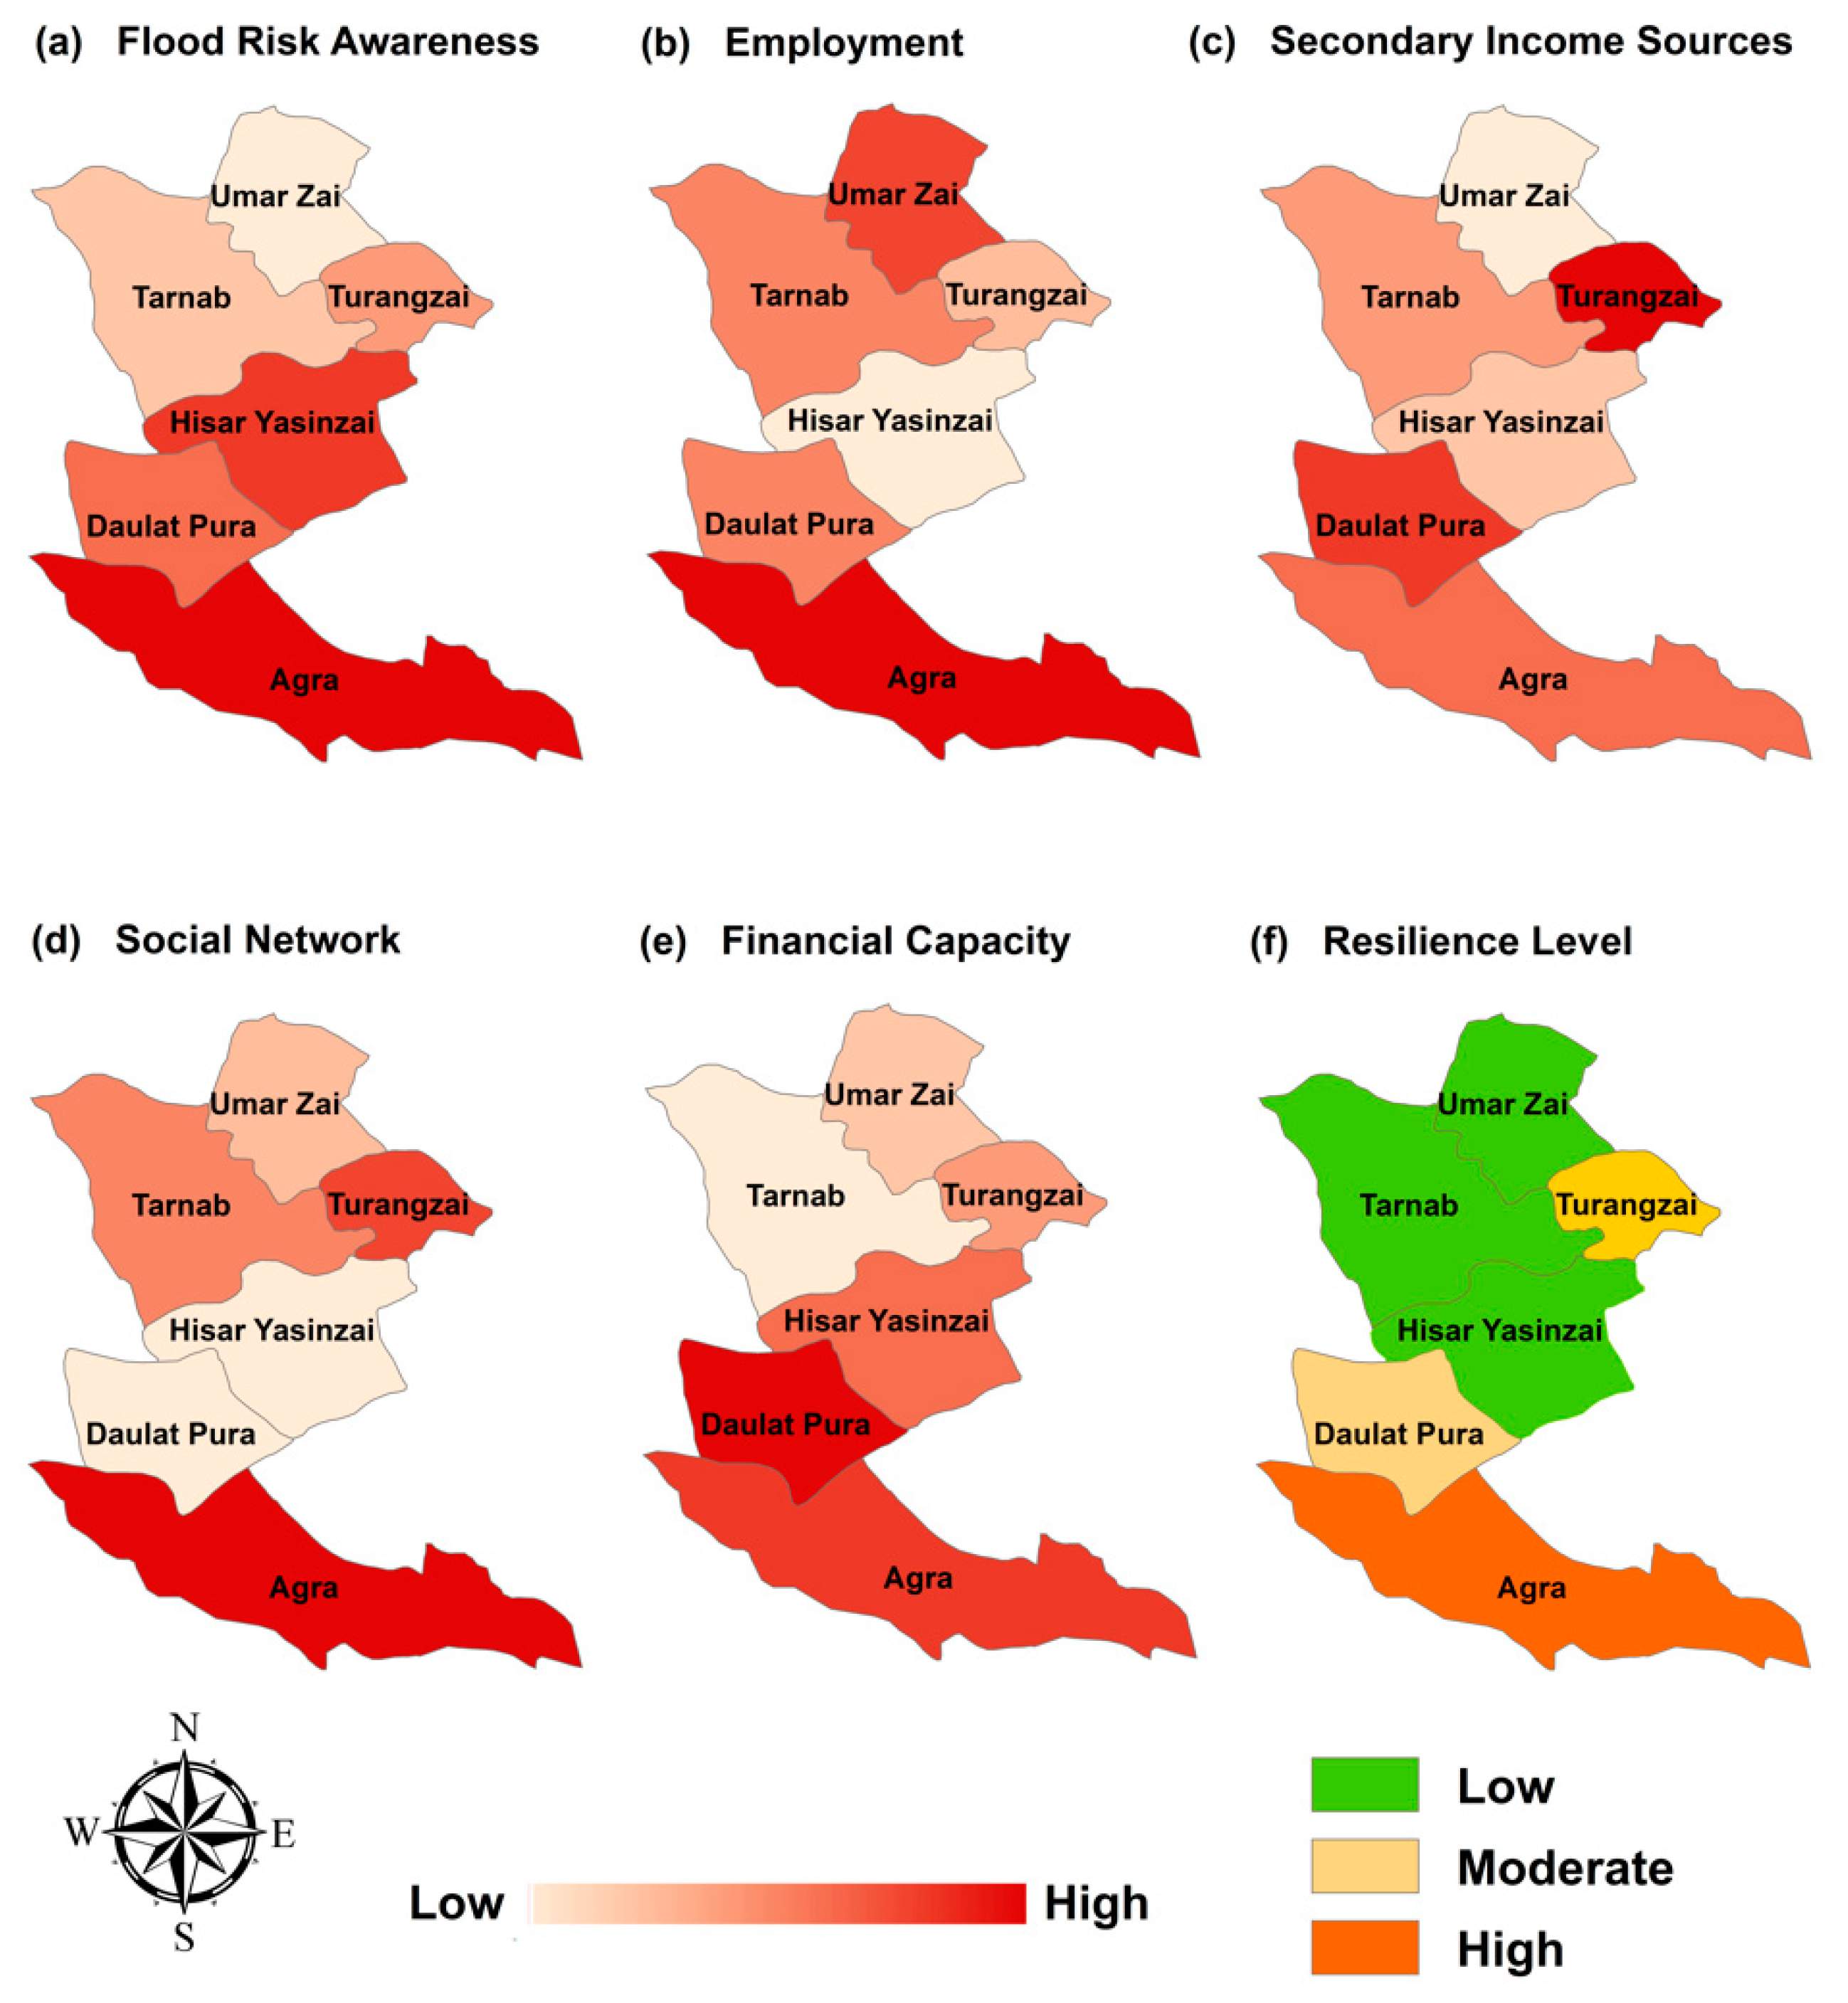
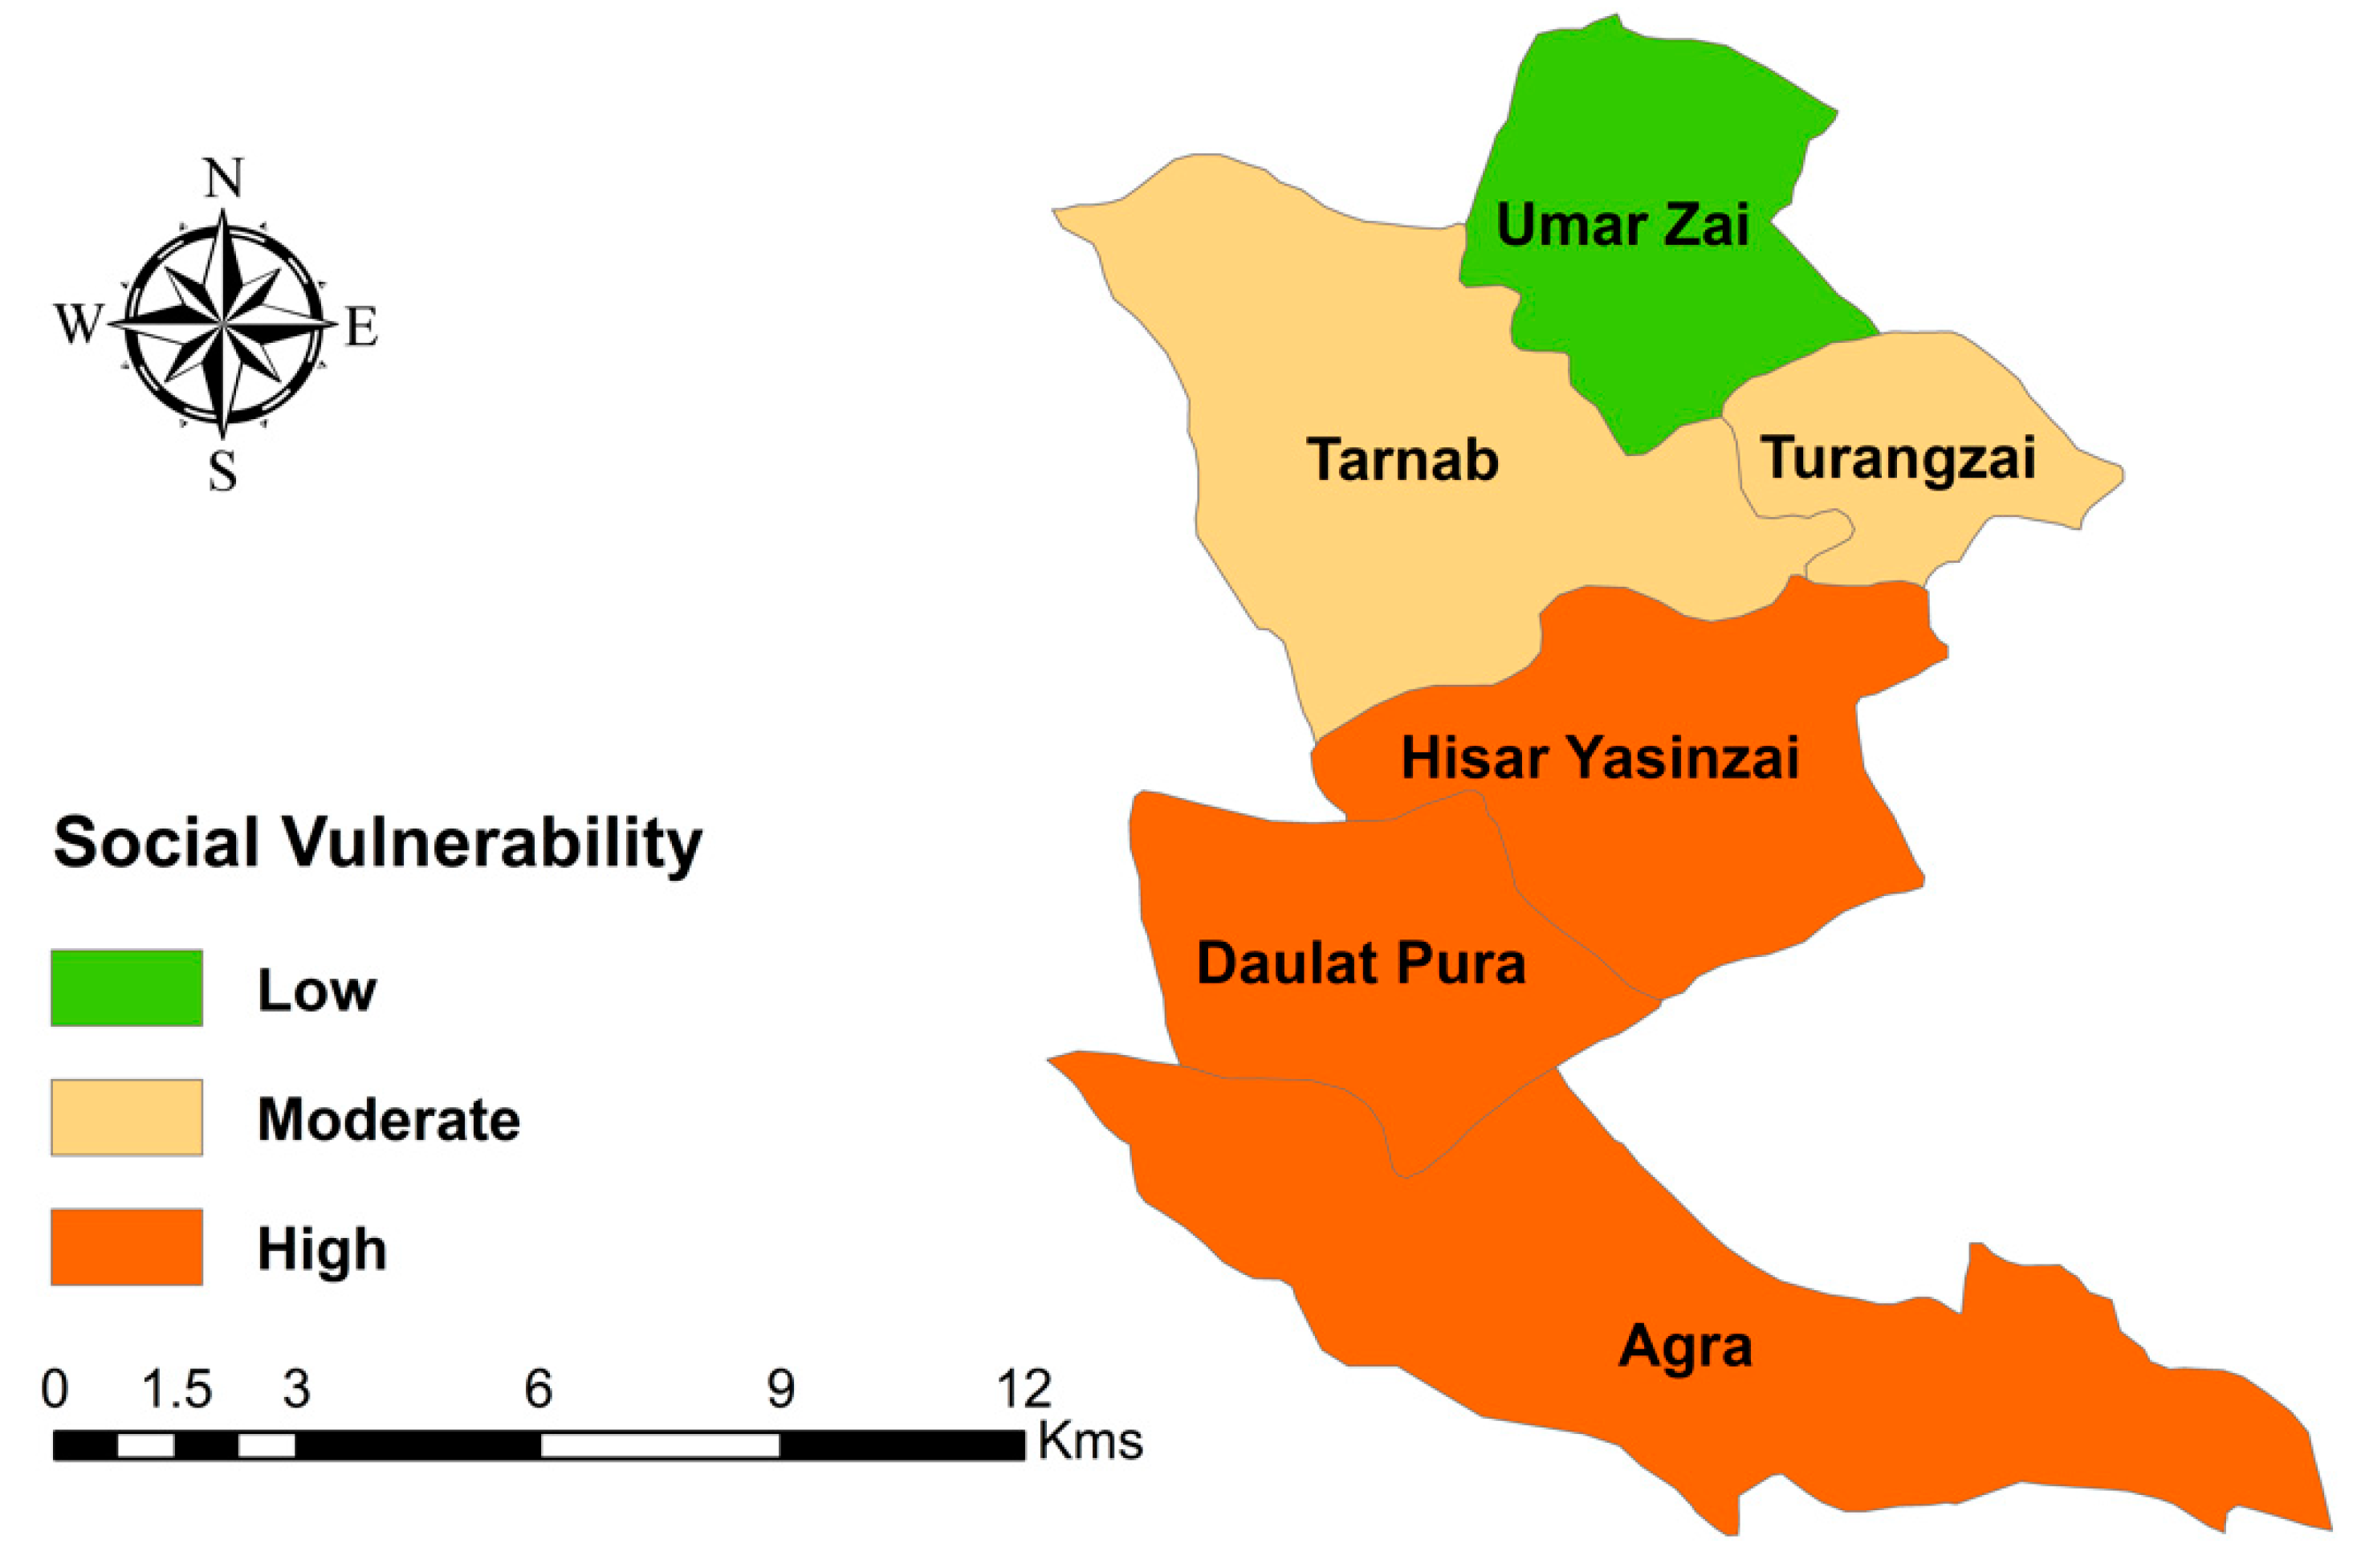
These indicators provide an important tool for managing disaster risk by providing objective data about social vulnerability in the population to inform disaster risk reduction activities. For the case study of Charsadda, 17 indicators were identified and implemented for the practical investigation of social vulnerability. The findings showed that the southern area, including Agra, Daulat Pura, and Hisar Ysinzai, were the most vulnerable communities. This is mainly because these southern UCs have the highest value of exposure and, specifically, have the highest number of flood locations, lowest elevations, and shortest distances from rivers compared with other UCs. Because of their location in low-elevated areas and nearby the rivers, when precipitation events occur in Charsadda District, these southern UCs are more likely to experience flood disasters and suffer casualties and losses.
Another important reason is that the households with high flood exposure also have weak economic capacity, which can be reflected in the fact that most UCs, especially southern UCs, have low values of resilience for indicators R3 (secondary income sources) and R5 (financial capacity for recovery). This is mainly because people with weak economic capacity are often forced to reside close to rivers in flood hazard zones, where the land is comparatively cheaper, and thus could experience more frequent floods. Coupling with high exposure and low economic capacity, the southern areas in Charsadda District are more likely to have high values of social vulnerability. Our findings are in line with previous studies [8,69], which have shown that a household’s location has a positive relationship with vulnerability, and households constructed in proximity to rivers indicate weak socio-economic capacity, and are more likely to be affected by flooding disasters. In order to reduce the social vulnerability of these southern UCs, local governments are suggested to conduct flood risk reduction activities with emphases on reducing flood exposure, for example, by facilitating low-income households’ relocation and enabling them to move their house to higher-elevated areas. For households who are not willing to move, the local government may provide financial assistance to these households enabling them to have a better disaster response capacity and recovery capacity. Similarly, external support is also crucial to the households with high flood exposure and weak economic capacity, especially to strengthen and uplift the economic capacity of the households by the provision of diversified livelihood and employment opportunities, which might reduce the poverty rate and improve the recovery capacity [70].
Because the UCs in the case study area are rural communities, the relationships between indicators are different from previous studies for urban communities. This is reflected in our indicators of susceptibility. For example, Kuhlicke, et al. [63] four case studies across Europe found that larger households generally have more manpower and thus are anticipated to reduce susceptibility through education and financial assistance. However, our findings show that larger households are often highly susceptible groups because most family members are elderly and children. During disaster events, populations with disabilities, children, and the elderly are considered the most vulnerable groups, as they need special care which limits their ability during emergencies to move to safer locations [71,72,73,74]. Additionally, larger households experience more health problems and financial burdens after flooding events [75]. In addition, our findings also showed that a high percentage of household heads were either illiterate or had a low level of education. Illiteracy affects the population’s ability to seek flood risk awareness, understand precautionary measures, and adopt preventive and mitigative measures, which eventually makes them more susceptible to the impacts of flooding hazards [8,11,64,76]. Based on these findings, it is suggested that local governments give more attention to large households’ capacity for flood disaster preparedness, response, and recovery in rural communities.
Our study has unique academic value in the field of social vulnerability assessments. First, we emphasize the importance of integrating the exposure component into social vulnerability assessments. Our analysis results also showed that exposure indicators such as elevation and distance to the river can be the greatest contributing factors linked with high vulnerability. Even for a UC with a moderate value of susceptibility and a high value of resilience (i.e., Daulat Pura), its final score of social vulnerability can be very high—Daulat Pura ranked in second place among six UCs. The survey data also showed that the households living in the UCs with a high value of exposure experienced the highest number of casualties and losses during flooding disasters. Many previous studies on social vulnerability assessments only use socio-demographic indicators, which may only reflect the susceptibility of local communities [40,41,42,43]. Second, we used household survey data as input for extracting and calculating indicators for local communities. Most previous index studies have mainly used census data for data input, which does not necessarily reflect the ground truth of local communities. Current empirical validation studies have shown that existing census-based social vulnerability and community resilience indicators cannot sufficiently explain the disaster impacts of local communities [44,45]. By using the household survey data, we can integrate more meaningful exposure, susceptibility, and resilience indicators into social vulnerability assessments. Third, we discovered some unique social vulnerability indicators specifically for rural communities facing flooding disasters. For example, rural households with weak economic capacity are more likely to reside nearby flood-prone areas with cheaper land prices, and rural households with larger household sizes are more likely to have a higher proportion of highly susceptible family members, such as the elderly, children, and the disabled.
Despite these contributions, this research has some limitations. For example, all the respondents interviewed were men because, according to local norms and strong cultural values, women are inhibited from coming forward. Secondly, this research was carried out in six UCs only, and our household survey data were from a limited number of households in each UC (around 30–40). Although we conducted the stratified sampling to ensure a certain level of precision and confidence, it is unavoidable that the responses from the sampled households cannot reflect the whole population of our case study area. Future studies are encouraged to conduct random sampling techniques (e.g., telephone interviews via a random digital dialing method) to collect household information on social vulnerability factors and disaster risk reduction. Third, for flood exposure analysis, we used limited indicators such as elevation, flooded/inundated area, closeness to the river, and past flood experience. Future studies need to focus on a more in-depth analysis, considering a wide range of physical (e.g., hydraulic modelling, flood damage/inundation modelling, etc.), social and environmental components, in order to design policies and implement them.
This research has paved the way for various future projects, including determining whether these indicators and framework can be applied to other hazards. The framework was designed to be useful for both natural disasters and climate change, and it aligns with existing collections of vulnerability measures reported worldwide. The core elements of susceptibility, resilience, and exposure, which are likely to be applicable to a number of hazards, have been incorporated into a broad notion of vulnerability to natural hazards. Susceptible groups, such as children, the elderly, and those with disabilities (mental and/or physical), would be more vulnerable to the harmful consequences of any catastrophe. Additionally, regardless of the natural hazard, people who are exposed and lack resilience, whether due to a lack of financial capacity, housing, social integration, risk awareness, and preparedness, are expected to be more vulnerable. In this context, the indicators and framework could be applicable to other potential threats such as earthquakes and tsunamis, heatwaves, wildfires, and other severe weather events. More analysis could be undertaken to examine social vulnerability indicators and frameworks objectively, and see how this framework is relevant to other hazards.
The framework and indicators might also be helpful in the event of a health crisis, such as the COVID-19 pandemic. COVID-19′s possible impacts, in the context of Pakistan, include sickness and death, stress and anxiety, lockdowns, border closures, financial challenges, loss of employment, possibly limited access to medicinal and educational facilities, psychological impacts, and household crowdedness. In an influenza pandemic, the factors that influence high-risk populations are close to those that influence floods, such as poverty, overcrowded and substandard housing, children, refugees, the elderly, and those with special healthcare needs or disabilities and compromised immune systems [77]. Furthermore, in countries hit hard by the COVID-19 pandemic, the elderly aged 60 plus tended to be at a greater risk of severe sickness and/or death if COVID-19 was contracted. The resemblance of vulnerability indicators to floods and the influenza pandemic means that social vulnerability indicators may be examined for COVID-19 in Pakistan, with further indicators to be studied, such as the elderly aged 60 plus and individuals in jobs more likely to suffer financially as a result of society’s approach to handling the pandemic. More research should be completed to see if these indicators are useful in the health sector.
More studies should be undertaken to see how well this framework and accompanying indicators work with longer-term climate-related events, such as rising sea levels and drought. Some changes to the framework and further indicators, such as those related to the long-term adaptive capacity of the population to climate change, may be needed. Future vulnerability, such as exposure to predicted future hazardous areas (considering the effects of climate change), demographic patterns of population, and vulnerability trends, may all be addressed. Future drivers of vulnerability, such as the inability to obtain protection in disaster areas in the future, may also be considered.

7. Conclusions and Recommendations

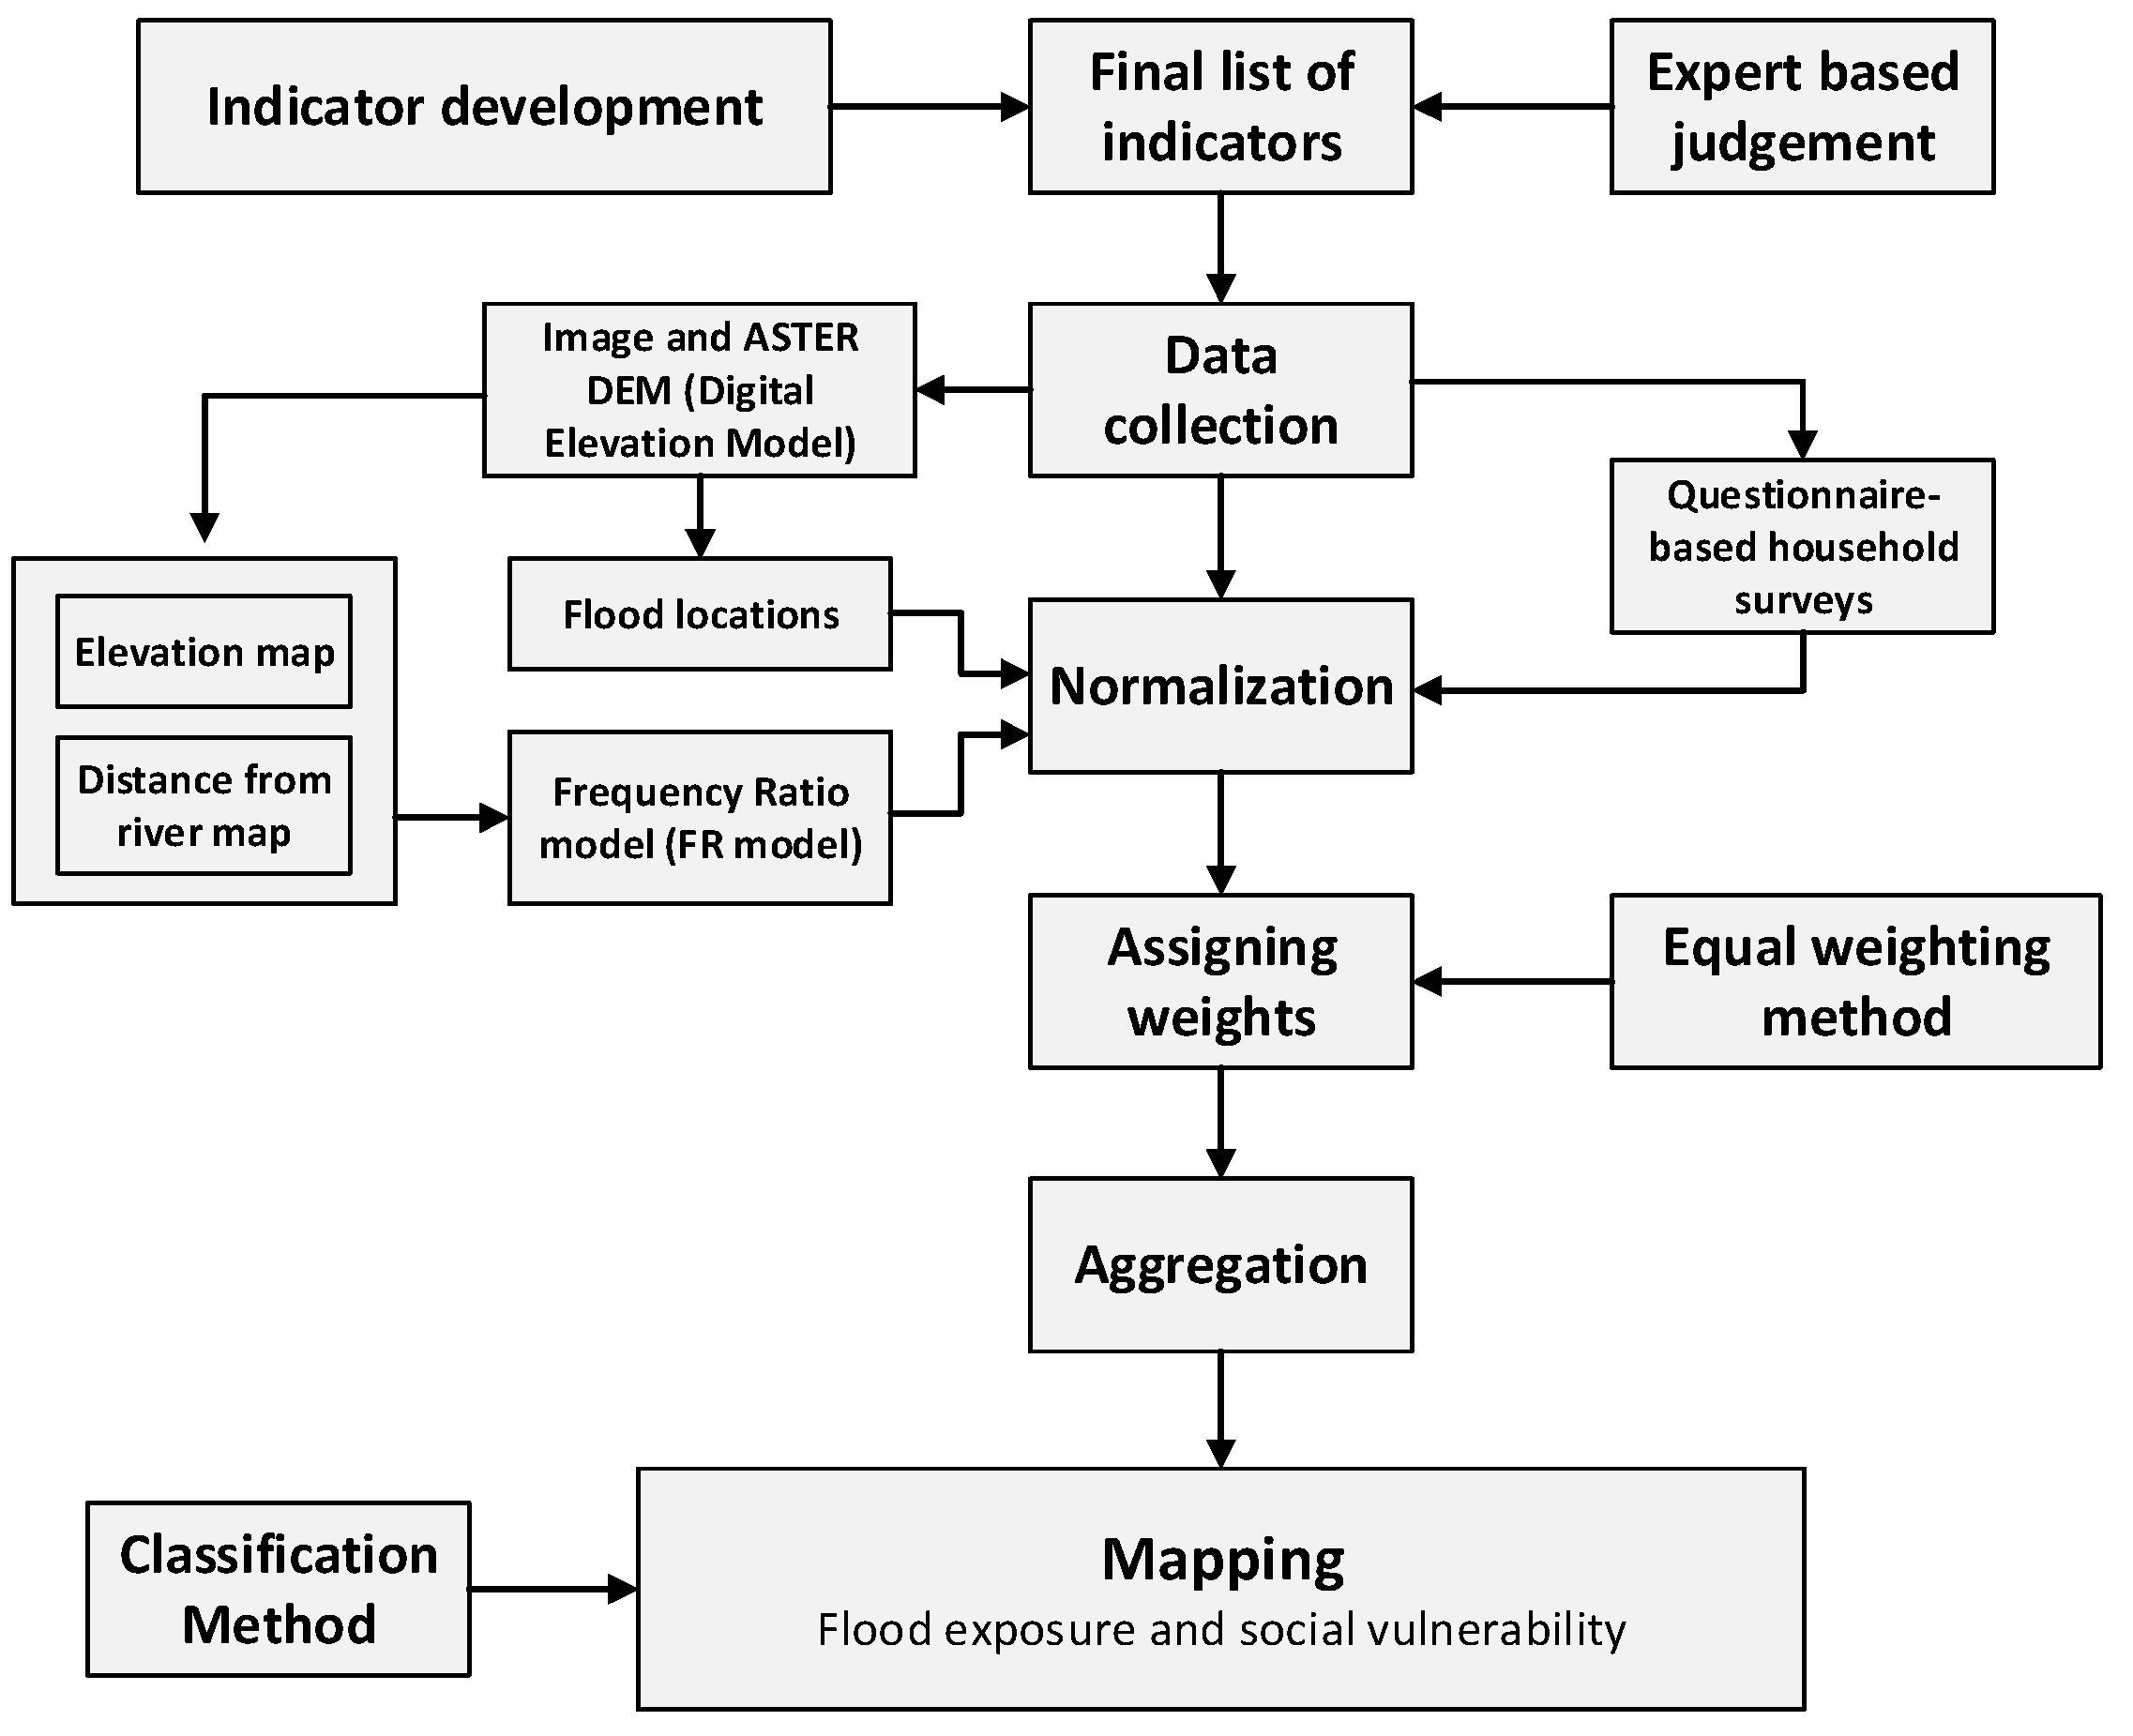
Floods are the most damaging catastrophic phenomena worldwide. Therefore, understanding flood vulnerability is necessary for effective risk management and sustainable development. However, there is a lack of an accurate and reliable approach for identifying rural communities’ social vulnerability to flood hazards. In this study, a Social Vulnerability Index was specifically developed for flood-prone rural communities. An indicator-based approach was used to identify social vulnerability and its key components using the example of flooding in Charsadda District. Compared with earlier collections of social vulnerability indicators, we designed a conceptual framework, integrating the exposure component with social vulnerability to make it more empirically valid in the context of rural areas in Pakistan. A set of theoretically sound indicators relating to flood exposure and social vulnerability were identified, and then the most empirically sound ones were shortlisted in the context of Pakistan, based on local experts’ opinions.
For flood exposure analysis, we adopted geospatial methods such as elevation, flooded locations, distance from the river, and flood-inundated area, followed by validation assessments through field surveys. At the first step, flood inundation and locations maps were prepared using LANDSAT ETM 7 and band 5 images, documentary sources of PDMA-KP, and field surveys. Then, two data layers (distance from rivers and elevation) were derived from the spatial database, maps were produced using the FR method, and the results were plotted in ArcGIS. Finally, the flood exposure data were combined with the flood outcome and socio-economic indicator data, collected from a well-sampled household survey, to produce social vulnerability maps. The most significant indicators linked with high vulnerability were exposure-related indicators. For example, the findings showed that the southern area, including Agra, Daulat Pura, and Hisar Ysinzai were the most vulnerable communities. This is mainly because these southern UCs have the highest number of flood locations, lowest elevations, shortest distances from rivers, larger household sizes including the elderly, children, and women, illiteracy, and weak financial capacity. Our study confirms that vulnerability does not exclusively rely on susceptibility, but instead on multiple components of exposure, resilience, and adaptive capacities that act together and influence the vulnerability of individuals or a society. Based on the overall assessments, the proposed approach in this study was concluded as objective and applicable.
Understanding dominant indicators and areas where high social vulnerability and high exposure converge can inform the authorities, governments, and community planners to perform proper actions in order to prevent and mitigate both social and physical flood vulnerabilities in the future. To strengthen local planning for emergencies, inform response efforts during a disaster, and improve peoples’ resilience, interventions must be applied to the areas and indicators identified, and have a significant influence on household exposure, susceptibility, and resilience levels in the study area. For example, in the study area, most of the houses were located in low-elevated areas and in close proximity to rivers; therefore, effective land-use policies should be formulated and implemented to strictly prohibit new constructions in floodplains and facilitate low-income households’ relocation, enabling them to move to higher-elevated areas. For households who are not willing to move, the local government may provide financial assistance to these households, enabling them to have a better disaster response capacity and recovery capacity. Similarly, guided head spurs and marginal embankments can be constructed along rivers to minimize flood impacts in the future. Furthermore, to increase flood risk awareness, proper training sessions must be conducted with the at-risk communities to improve their flood risk awareness and capacity to understand early warnings and measures to be taken to mitigate, prepare, respond to, and recover from flooding disasters. Most households with high flood exposure areas were also found to have weak economic capacity; therefore, external support is also crucial, especially to strengthen and uplift the economic capacity of households by the provision of diversified livelihood and employment opportunities, which might reduce poverty rates and improve recovery capacity. The proposed measures will effectively reduce household flood exposure and vulnerability, and increase their resilience towards flooding or other hazards in the future.

Author Contributions

Conceptualization, A.R.H., L.J. and K.A.; methodology, A.R.H.; formal analysis, A.R.H.; writing—original draft preparation, A.R.H.; writing—review and editing, A.R.H., L.J. and M.S.; supervision, L.J., K.A., M.A.U.R.T. and A.W.M.N.; funding acquisition, A.W.M.N. All authors have read and agreed to the published version of the manuscript.

Funding

This research received no external funding.

Institutional Review Board Statement

Not applicable.

Informed Consent Statement

Not applicable.

Data Availability Statement

The authors confirm that the data supporting the findings of this study are available within the article.

Acknowledgments

The authors acknowledge the support from the following projects: (1) Issues Dynamics and Implications of Disaster Management in Pakistan (HEC-NRPU-4803); and (2) Multi-Hazards, Vulnerability and Risk Assessment (A Joint Project of Riphah International University, City District Government Peshawar and Disaster Management Program of Alkhidmat Foundation, Pakistan).

Conflicts of Interest

The authors declare no conflict of interest.

Appendix A

Table A1. K-means clustering results for identifying six UCs into three groups.
Daulat PuraHisar YasinzaiTurangzaiTarnabAgraUmar Zai
Exposure
K-means centers: (0.600, 0.480, 0.410)Value0.8400.8300.5100.3400.9400.350
Cluster groupHighHighModerateLowHighLow
Absolute distance to centers0.0300.0400.0000.0050.0700.005
Susceptibility
K-means centers: (0.623, 0.540, 0.405)Value0.540.420.620.60.650.39
Cluster groupModerateLowHighHighHighLow
Absolute distance to centers0.0000.0150.0030.0230.0270.015
Resilience
K-means centers: (0.600, 0.480, 0.410)Value0.4800.4100.4800.4200.6000.400
Cluster groupModerateLowModerateLowHighLow
Absolute distance to centers0.0000.0050.0000.0150.0000.005
SFVI
K-means centers: (0.903, 0.585, 0.330)Value0.8900.8400.6500.5200.9800.330
Cluster groupHighHighModerateModerateHighLow
Absolute distance to centers0.0130.0630.0650.0650.0770.000
Note: K-means centers are in the order of high, moderate, low.

References

  1. Intergovernmental Panel on Climate Change (IPCC). Climate Change 2014–Impacts, Adaptation and Vulnerability: Part A: Global and Sectoral Aspects: Working Group II Contribution to the IPCC Fifth Assessment Report: Volume 1: Global and Sectoral Aspects; Cambridge University Press: Cambridge, UK, 2014. [Google Scholar]
  2. United Nations Development Programme (UNDP). Social Vulnerability Assessment Tools for Climate Change and DRR Programming: A Guide to Practitioners; United Nations Development Programme: Istanbul, Turkey, 2017. [Google Scholar]
  3. Khan, I.; Lei, H.; Shah, A.A.; Khan, I.; Muhammad, I. Climate change impact assessment, flood management, and mitigation strategies in Pakistan for sustainable future. Environ. Sci. Pollut. Res. 2021, 28, 29720–29731. [Google Scholar] [CrossRef] [PubMed]
  4. Shah, A.A.; Shaw, R.; Ye, J.; Abid, M.; Amir, M.S.; Pervez, K.A.; Naz, S. Current capacities, preparedness and needs of local institutions in dealing with disaster risk reduction in Khyber Pakhtunkhwa, Pakistan. Int. J. Disaster Risk Reduct. 2019, 34, 165–172. [Google Scholar] [CrossRef]
  5. Hamidi, A.R.; Zeng, Z.; Khan, M.A. Household vulnerability to floods and cyclones in Khyber Pakhtunkhwa, Pakistan. Int. J. Disaster Risk Reduct. 2020, 46, 101496. [Google Scholar] [CrossRef]
  6. Shah, A.A.; Ye, J.; Abid, M.; Ullah, R. Determinants of flood risk mitigation strategies at household level: A case of Khyber Pakhtunkhwa (KP) province, Pakistan. Nat. Hazards 2017, 88, 415–430. [Google Scholar] [CrossRef]
  7. Shah, A.A.; Ye, J.; Abid, M.; Khan, J.; Amir, S.M. Flood hazards: Household vulnerability and resilience in disaster-prone districts of Khyber Pakhtunkhwa province, Pakistan. Nat. Hazards 2018, 93, 147–165. [Google Scholar] [CrossRef]
  8. Hamidi, A.R.; Wang, J.; Guo, S.; Zeng, Z. Flood vulnerability assessment using MOVE framework: A case study of the northern part of district Peshawar, Pakistan. Nat. Hazards 2020, 101, 358–408. [Google Scholar] [CrossRef]
  9. Shah, A.A.; Gong, Z.; Ali, M.; Jamshed, A.; Naqvi, S.A.A.; Naz, S. Measuring education sector resilience in the face of flood disasters in Pakistan: An index-based approach. Environ. Sci. Pollut. Res. 2020, 27, 44106–44122. [Google Scholar] [CrossRef]
  10. Blaikie, P.; Wisner, B.; Cannon, T.; Davis, I. At Risk: Natural Hazards, People’s Vulnerability and Disasters; Routledge Taylor & Francis Group: London, UK, 2004. [Google Scholar]
  11. Cutter, S.L.; Boruff, B.J.; Shirley, W.L. Social vulnerability to environmental hazards. Soc. Sci. Q. 2003, 84, 242–261. [Google Scholar] [CrossRef]
  12. Fuchs, S.; Birkmann, J.; Glade, T. Vulnerability assessment in natural hazard and risk analysis: Current approaches and future challenges. Nat. Hazards 2012, 64, 1969–1975. [Google Scholar] [CrossRef] [Green Version]
  13. Balica, S.; Douben, N.; Wright, N.G. Flood vulnerability indices at varying spatial scales. Water Sci. Technol. 2009, 60, 2571–2580. [Google Scholar] [CrossRef] [Green Version]
  14. Füssel, H.-M. Vulnerability: A generally applicable conceptual framework for climate change research. Glob. Environ. Chang. 2007, 17, 155–167. [Google Scholar] [CrossRef]
  15. Miller, F.; Osbahr, H.; Boyd, E.; Thomalla, F.; Bharwani, S.; Ziervogel, G.; Walker, B.; Birkmann, J.; van der Leeuw, S.; Rockström, J. Resilience and vulnerability: Complementary or conflicting concepts? Ecol. Soc. 2010, 15, 11. Available online: http://www.ecologyandsociety.org/vol15/iss3/art11/ (accessed on 2 March 2022). [CrossRef]
  16. Frazier, T.G.; Thompson, C.M.; Dezzani, R.J. A framework for the development of the SERV model: A Spatially Explicit Resilience-Vulnerability model. Appl. Geogr. 2014, 51, 158–172. [Google Scholar] [CrossRef]
  17. Pandey, R.; Bardsley, D.K. Social-ecological vulnerability to climate change in the Nepali Himalaya. Appl. Geogr. 2015, 64, 74–86. [Google Scholar] [CrossRef] [Green Version]
  18. Gall, M. Indices of Social Vulnerability to Natural Hazards: A Comparative Evaluation. Ph.D. Thesis, University of South Carolina, Columbia, SC, USA, 2007. [Google Scholar]
  19. Rehman, S.; Sahana, M.; Hong, H.; Sajjad, H.; Ahmed, B.B. A systematic review on approaches and methods used for flood vulnerability assessment: Framework for future research. Nat. Hazards 2019, 96, 975–998. [Google Scholar] [CrossRef]
  20. Müller, A.; Reiter, J.; Weiland, U. Assessment of urban vulnerability towards floods using an indicator-based approach–a case study for Santiago de Chile. Nat. Hazards Earth Syst. Sci. 2011, 11, 2107–2123. [Google Scholar] [CrossRef] [Green Version]
  21. Papathoma-Köhle, M.; Kappes, M.; Keiler, M.; Glade, T. Physical vulnerability assessment for alpine hazards:state of the art and future needs. Nat. Hazards 2011, 58, 645–680. [Google Scholar] [CrossRef]
  22. Balica, S.; Popescu, I.; Beevers, L.; Wright, N. Parametric and physically based modelling techniques for flood risk and vulnerability assessment: A comparison. Environ. Model. Softw. 2013, 41, 84–92. [Google Scholar] [CrossRef]
  23. Lee, G.; Jun, K.S.; Chung, E.S. Integrated multi-criteria flood vulnerability approach using fuzzy TOPSIS and Delphi technique Nat. Hazards Earth Syst. Sci. 2013, 13, 1293–1312. [Google Scholar] [CrossRef] [Green Version]
  24. de Brito, M.M.; Evers, M.; Almoradie, A.D.S. Participatory flood vulnerability assessment: A multi-criteria approach. Hydrol. Earth Syst. Sci. 2018, 22, 373–390. [Google Scholar] [CrossRef] [Green Version]
  25. Boulomytis, V.T.G.o.; Zuffo, A.C.; Imteaz, M.A. Detection of flood influence criteria in ungauged basins on a combined Delphi-AHP approach. Oper. Res. Perspect. 2019, 6, 100116. [Google Scholar] [CrossRef]
  26. Rafiei-Sardooi, E.; Azareh, A.; Choubin, B.; Mosavi, A.H.; Clague, J.J. Evaluating urban flood risk using hybrid method of TOPSIS and machine learning. Int. J. Disaster Risk Reduct. 2021, 66, 102614. [Google Scholar] [CrossRef]
  27. Hosseini, F.S.; Sigaroodi, S.K.; Salajegheh, A.; Moghaddamnia, A.; Choubin, B. Towards a flood vulnerability assessment of watershed using integration of decision-making trial and evaluation laboratory, analytical network process, and fuzzy theories. Environ. Sci. Pollut. Res. 2021, 28, 62487–62498. [Google Scholar] [CrossRef] [PubMed]
  28. Kaly, U.L.; Pratt, C.R.; Mitchell, J. The Environmental Vulnerability Index (EVI) 2004; South Pacific Applied Geoscience Commission: Suva, Fiji, 2004; Volume 384, Available online: https://www.sopac.org/sopac/evi/Files/EVI2004TechnicaReport.pdf (accessed on 2 March 2022).
  29. Briguglio, L. Methodological and Practical Considerations for Constructing Socio-Economic Indicators to Evaluate Disaster Risk. In BID/IDEA Programa de Indicadores Para la Gestión de Riesgos; Universidad Nacional de Colombia: Manizales, Colombia, 2003; Available online: http://idea.unalmzl.edu.co (accessed on 12 April 2021).
  30. United Nations Environment Program. Global Risk and Vulnerability Index–Trends per Year (GRAVITY) Phase II: Development, Analysis and Results; United Nations Environment Program: Geneva, Switzerland, 2002; Available online: https://wedocs.unep.org/20.500.11822/8818 (accessed on 2 March 2022).
  31. Sullivan, C.; Meigh, J. Targeting attention on local vulnerabilities using an integrated index approach: The example of the climate vulnerability index. Water Sci. Technol. 2005, 51, 69–78. [Google Scholar] [CrossRef] [PubMed]
  32. Pompella, M. Measuring vulnerability to natural hazards: Towards disaster resilient societies, by J. Birkmann. J. Risk Insur. 2010, 77, 959–961. [Google Scholar] [CrossRef]
  33. UNESCO-IHE Institute for Water Education. Flood Vulnerability Indices (FVI). Available online: http://unihefvi.free.fr/indicators.php (accessed on 2 March 2022).
  34. Welle, T.; Depietri, Y.; Angignard, M.; Birkmann, J.; Renaud, F.; Greiving, S. Chapter 5-Vulnerability Assessment to Heat Waves, Floods, and Earthquakes Using the MOVE Framework: Test Case Cologne, Germany. In Assessment of Vulnerability to Natural Hazards; Birkmann, J., Kienberger, S., Alexander, D.E., Eds.; Elsevier: Amsterdam, The Netherlands, 2014; pp. 91–124. [Google Scholar]
  35. Flanagan, B.E.; Gregory, E.W.; Hallisey, E.J.; Heitgerd, J.L.; Lewis, B. A social vulnerability index for disaster management. J. Homel. Secur. Emerg. Manag. 2011, 8, 3. [Google Scholar] [CrossRef]
  36. Martin, S.A. A framework to understand the relationship between social factors that reduce resilience in cities: Application to the City of Boston. Int. J. Disaster Risk Reduct. 2015, 12, 53–80. [Google Scholar] [CrossRef] [Green Version]
  37. Depietri, Y.; Welle, T.; Renaud, F.G. Social vulnerability assessment of the Cologne urban area (Germany) to heat waves: Links to ecosystem services. Int. J. Disaster Risk Reduc. 2013, 6, 98–117. [Google Scholar] [CrossRef]
  38. Tapsell, S.M.; Penning-Rowsell, E.C.; Tunstall, S.M.; Wilson, T.L. Vulnerability to flooding: Health and social dimensions. Philos. Trans. R. Soc. London Ser. A Math. Phys. Eng. Sci. 2002, 360, 1511–1525. [Google Scholar] [CrossRef]
  39. Rasch, R. Assessing urban vulnerability to flood hazard in Brazilian municipalities. Environ. Urban. 2016, 28, 145–168. [Google Scholar] [CrossRef] [Green Version]
  40. Chen, W.; Cutter, S.L.; Emrich, C.T.; Shi, P. Measuring social vulnerability to natural hazards in the Yangtze River Delta region, China. Int. J. Disaster Risk Sci. 2013, 4, 169–181. [Google Scholar] [CrossRef] [Green Version]
  41. Hummell, B.M.d.; Cutter, S.L.; Emrich, C.T. Social vulnerability to natural hazards in Brazil. Int. J. Disaster Risk Sci. 2016, 7, 111–122. [Google Scholar] [CrossRef] [Green Version]
  42. Fernandez, P.; Mourato, S.; Moreira, M. Social vulnerability assessment of flood risk using GIS-based multicriteria decision analysis. A case study of Vila Nova de Gaia (Portugal). Geomat. Nat. Hazards Risk 2016, 7, 1367–1389. [Google Scholar] [CrossRef] [Green Version]
  43. Zhang, Y.L.; You, W.J. Social vulnerability to floods: A case study of Huaihe river basin. Nat. Hazards 2014, 71, 2113–2125. [Google Scholar] [CrossRef]
  44. Bakkensen, L.A.; Fox-Lent, C.; Read, L.K.; Linkov, I. Validating resilience and vulnerability indices in the context of natural disasters. Risk Anal. 2017, 37, 982–1004. [Google Scholar] [CrossRef] [Green Version]
  45. Tellman, B.; Schank, C.; Schwarz, B.; Howe, P.D.; de Sherbinin, A. Using disaster outcomes to validate components of social vulnerability to floods: Flood deaths and property damage across the USA. Sustainability 2020, 12, 6006. [Google Scholar] [CrossRef]
  46. Shah, A.A.; Gong, Z.; Ali, M.; Sun, R.; Naqvi, S.A.A.; Arif, M. Looking through the Lens of schools: Children perception, knowledge, and preparedness of flood disaster risk management in Pakistan. Int. J. Disaster Risk Reduct. 2020, 50, 101907. [Google Scholar] [CrossRef]
  47. National Disaster Management Authority Pakistan. National Disaster Management Plan-2012; National Disaster Management Authority Pakistan: Islamabad, Pakistan, 2012. Available online: http://www.ndma.gov.pk/ex/Documents/ndmp.zip (accessed on 17 August 2021).
  48. Azam, K.; Yusoff, R.M.; Khan, A. The Role of Coping Capacities in Disaster Perspective: A Case of Pakistan Flash Floods, 2010. OIDA J. Sustain. Dev. 2012, 4, 109–126. [Google Scholar]
  49. Atta-ur-Rahman; Khan, A.N. Atta-ur-Rahman; Khan, A.N. Analysis of flood causes and associated socio-economic damages in the Hindukush region. Nat. Hazards 2011, 59, 1239–1260. (In English) [Google Scholar] [CrossRef]
  50. Federal Flood Commission. Annual Flood Report 2012; Federal Flood Commission: Islamabad, Pakistan, 2012.
  51. Shah, A.A.; Gong, Z.; Pal, I.; Sun, R.; Ullah, W.; Wani, G.F. Disaster risk management insight on school emergency preparedness—A case study of Khyber Pakhtunkhwa, Pakistan. Int. J. Disaster Risk Reduct. 2020, 51, 101805. [Google Scholar] [CrossRef]
  52. Ahmad, F.; Kazmi, S.F.; Pervez, T. Human response to hydro-meteorological disasters: A case study of the 2010 flash floods in Pakistan. J. Geogr. Reg. Plan. 2011, 4, 518–524. [Google Scholar]
  53. Pakistan Bureau of Statistics. Block-Wise Provisional Summary Results of 6th Population & Housing Census-2017; Pakistan Bureau of Statistics: Islamabad, Pakistan, 2017. Available online: http://www.pbscensus.gov.pk/ (accessed on 29 January 2022).
  54. Asadzadeh, A.; Kötter, T.; Salehi, P.; Birkmann, J. Operationalizing a concept: The systematic review of composite indicator building for measuring community disaster resilience. Int. J. Disaster Risk Reduct. 2017, 25, 147–162. [Google Scholar] [CrossRef]
  55. Birkmann, J.; Cardona, O.D.; Carreño, M.L.; Barbat, A.H.; Pelling, M.; Schneiderbauer, S.; Kienberger, S.; Keiler, M.; Alexander, D.; Zeil, P.; et al. Framing vulnerability, risk and societal responses: The MOVE framework. Nat. Hazards 2013, 67, 193–211. [Google Scholar] [CrossRef]
  56. TFrazier, G.; Thompson, C.M.; Dezzani, R.J.; Butsick, D. Spatial and temporal quantification of resilience at the community scale. Appl. Geogr. 2013, 42, 95–107. [Google Scholar] [CrossRef]
  57. Wood, N.J.; Burton, C.G.; Cutter, S.L. Community variations in social vulnerability to Cascadia-related tsunamis in the U.S. Pacific Northwest. Nat. Hazards 2010, 52, 369–389. [Google Scholar] [CrossRef] [Green Version]
  58. Blackstone, A. Social Research: Qualitative and Quantitative Methods; FlatWorld: Boston, MA, USA, 2019; p. 276. [Google Scholar]
  59. Israel, G.D. Determining Sample Size; Institute of Food and Agricultural Sciences (IFAS) Extensions, University of Florida: Gainesville, FL, USA, 2013; PEOD6; pp. 1–5. Available online: http://www.gjimt.ac.in/web/wp-content/uploads/2017/10/2_Glenn-D.-Israel_Determining-Sample-Size.pdf (accessed on 2 March 2022).
  60. Zeng, Z.; Lan, J.; Hamidi, A.R.; Zou, S. Integrating Internet media into urban flooding susceptibility assessment: A case study in China. Cities 2020, 101, 102697. [Google Scholar] [CrossRef]
  61. Pradhan, B.; Lee, S. Delineation of landslide hazard areas on Penang Island, Malaysia, by using frequency ratio, logistic regression, and artificial neural network models. Environ. Earth Sci. 2010, 60, 1037–1054. [Google Scholar] [CrossRef]
  62. Cutter, S.L.; Burton, C.G.; Emrich, C.T. Disaster resilience indicators for benchmarking baseline conditions. J. Homel. Secur. Emerg. Manag. 2010, 7, 51. [Google Scholar] [CrossRef]
  63. Kuhlicke, C.; Scolobig, A.; Tapsell, S.; Steinführer, A.; de Marchi, B. Contextualizing social vulnerability: Findings from case studies across Europe. Nat. Hazards 2011, 58, 789–810. [Google Scholar] [CrossRef]
  64. Dufty, N. A new approach to community flood education. Aust. J. Emerg. Manag. 2008, 23, 4–8. [Google Scholar]
  65. Adger, W.N. Social Capital, Collective Action, and Adaptation to Climate Change. Econon. Geogr. 2003, 79, 387–404. [Google Scholar] [CrossRef]
  66. Murphy, B.L. Locating social capital in resilient community-level emergency management. Nat. Hazards 2007, 41, 297–315. [Google Scholar] [CrossRef]
  67. Karmaoui, A.; Balica, S.F.; Messouli, M. Analysis of applicability of flood vulnerability index in Pre-Saharan region, a pilot study to assess flood in Southern Morocco. Nat. Hazards Earth Syst. Sci. 2016, 96, 1–24. [Google Scholar] [CrossRef] [Green Version]
  68. Deressa, T.; Hassan, R.M.; Ringler, C. Measuring Ethiopian Farmers’ Vulnerability to Climate Change across Regional States; International Food Policy Research Institute: Washington, DC, USA, 2008; p. 32. [Google Scholar]
  69. Bradford, R.A.; O’Sullivan, J.J.; Van der Craats, I.M.; Krywkow, J.; Rotko, P.; Aaltonen, J.; Bonaiuto, M.; de Dominicis, S.; Waylen, K.; Schelfaut, K. Risk perception–issues for flood management in Europe. Nat. Hazards Earth Syst. Sci. 2012, 12, 2299–2309. [Google Scholar] [CrossRef]
  70. Shah, A.A.; Gong, Z.; Khan, N.A.; Khan, I.; Ali, M.; Naqvi, S.A.A. Livelihood diversification in managing catastrophic risks: Evidence from flood-disaster regions of Khyber Pakhtunkhwa Province of Pakistan. Environ. Sci. Pollut. Res. 2021, 28, 40844–40857. [Google Scholar] [CrossRef]
  71. Lindell, M.K.; Perry, R.W. Community innovation in hazardous materials management: Progress in implementing SARA Title III in the United States. J. Hazard. Mater. 2001, 88, 169–194. [Google Scholar] [CrossRef] [Green Version]
  72. Shah, A.A.; Wu, W.; Gong, Z.; Pal, I.; Khan, J. Multidimensional six-stage model for flood emergency response in schools: A case study of Pakistan. Nat. Hazards 2021, 105, 1977–2005. [Google Scholar] [CrossRef]
  73. Shah, A.A.; Ye, J.; Shaw, R.; Ullah, R.; Ali, M. Factors Affecting Flood-Induced Household Vulnerability And Health Risks In Pakistan: The Case Of Khyber Pakhtunkhwa Province. Int. J. Disaster Risk Reduct. 2020, 42, 101341. [Google Scholar] [CrossRef]
  74. Shah, A.A.; Ajiang, C.; Gong, Z.; Khan, N.A.; Ali, M.; Ahmad, M.; Abbas, A.; Shahid, A. Reconnoitering school children vulnerability and its determinants: Evidence from flood disaster-hit rural communities of Pakistan. Int. J. Disaster Risk Reduct. 2022, 70, 102735. [Google Scholar] [CrossRef]
  75. Botzen, W.J.W.; Aerts, J.C.J.H.; van den Bergh, J.C.J.M. Dependence of flood risk perceptions on socioeconomic and objective risk factors. Water Resour. Res. 2009, 45, 1–15. [Google Scholar] [CrossRef] [Green Version]
  76. Adger, W.N.; Brooks, N.; Bentham, G.; Agnew, M.; Eriksen, S. New Indicators of Vulnerability and Adaptive Capacity; Tyndall Centre for Climate Change Research: Norwich, UK, 2004. [Google Scholar]
  77. O’Sullivan, T.; Bourgoin, M. Vulnerability in an Influenza Pandemic: Looking beyond Medical Risk; Public Health Agency of Canada: Ottawa, ON, Canada, 2010. Available online: https://homelesshub.ca/resource/vulnerability-influenza-pandemic-looking-beyond-medical-risk (accessed on 2 March 2022).
Figure 1. Reference map of the study area.
Water 14 01176 g001
Figure 2. Discharge of River Swat.
Water 14 01176 g002
Figure 3. Conceptual framework for social vulnerability to flood hazards (own figure, based on the conceptual model by [55]).
Water 14 01176 g003
Figure 4. Social vulnerability components.
Water 14 01176 g004
Figure 5. Flow chart and methodological process.
Water 14 01176 g005
Figure 6. Elevation map of the study area.
Water 14 01176 g006
Figure 7. Distance from rivers map of the study area.
Water 14 01176 g007
Figure 8. Geographical distribution of indicators and levels of exposure. (a) represents the geographical distribution of households with past flood experience; (b). represents the geographical distribution of households’ proximity to rivers; (c). represents the geographical distribution of households with casualties and losses in previous floods; (d). represents the geographical distribution of households’ exposure level.
Water 14 01176 g008
Figure 9. Geographical distribution of indicators and levels of susceptibility (a) represents the geographical distribution of household size (>7 persons); (b) represents the geographical distribution of households with dependent persons (<14 years and >60 years); (c) represents the geographical distribution of households’ female–male ratio; (d) represents the geographical distribution of households with illiteracy; and (e) represents the geographical distribution of households’ susceptibility level).
Water 14 01176 g009
Figure 10. Geographical distribution of indicators and levels of resilience (a) represents the geographical distribution of households’ flood risk awareness; (b). represents the geographical distribution of households with employment; (c) represents the geographical distribution of households with secondary income sources; (d) represents the geographical distribution of households with social network; (e) represents the geographical distribution of household with financial capacity for recovery; and (f). represents the geographical distribution of households’ resilience level.
Water 14 01176 g010
Figure 11. Overall social vulnerability map.
Water 14 01176 g011
Table 1. Indicators for measuring vulnerability.
Vulnerability ComponentsIndicatorsI#DescriptionsData Source
ExposurePast experienceE1% of households that have experienced floods in the pastField survey
Proximity to riversE2% of households residing near rivers or in flood-prone areasField survey
Casualties and lossesE3% of households that have experienced casualties or lossesField survey
ElevationE4Elevation map of the study areaUSGS
Distance from the riversE5Distance from the river to the observed pointUSGS
Flood locationsE6Flooded locations in 2010 flooding eventUSGS, PDMA-KP, and field survey
SusceptibilityHousehold sizeS1% of households that have > 7 personsField survey
Dependent personsS2% of households that have members under age 14 and over age 60Field survey
Female–male ratioS3% of households with a high female–male ratioField survey
Fatal illness or disabilityS4% of households with a disability or fatal illnessField survey
IlliteracyS5% of illiterate household headsField survey
ResilienceFlood risk awarenessR1% of households having flood risk awarenessField survey
EmploymentR2% of households with employmentField survey
Multiple income sourcesR3% of households with secondary income sourcesField survey
Social networkR4% of households having societal relations with community membersField survey
Financial capacity for recoveryR5% of households having savings for flood recoveryField survey
Table 2. Flood locations (flood training points and flood validation points).
Union CouncilFlood Training PointsFlood Validation PointsTotal Flood PointsNormalized Values
Agra2813411
Doulat Pura165210.44
Hisar Yasinzai125170.33
Turangzai73100.14
Tarnab4260.03
Umar Zai3250
Table 3. Relation between flood locations and its conditioning factors using the FR method.
FactorsClasses% of Flood Area (F/TF)% of the Class Area (N/TP)Frequency RatioNormalized Values
Elevation274–30852.7132.631.621.00
309–35025.2429.790.850.52
351–39014.2819.440.730.45
391–4582.6713.060.20.13
459–61101.4800
612–96400.3900
Distance from the Rivers0–40066.9635.441.891.00
401–80020.5327.350.750.35
801–12004.4616.620.270.08
1201–16005.3510.380.520.22
1600–20000.896.820.130.00
>20011.783.350.530.23
Table 4. Household exposure to floods.
IndicatorsDaulat PuraHisar YasinzaiTurangzaiTarnabAgraUmar ZaiAverage
E10.771.000.690.551.000.540.76
E20.650.410.520.390.810.470.53
E30.860.850.490.300.830.190.59
E41.001.000.520.521.000.520.76
E51.001.000.350.081.000.350.63
E60.440.330.140.031.0000.35
Average E0.790.770.450.310.940.350.60
E1, Past flood experience; E2, proximity to rivers; E3, casualties and losses in previous floods; E4, Elevation; E5, Distance from the river; and E6, Flood locations.
Table 5. Household susceptibility to floods.
IndicatorsDaulat PuraHisar YasinzaiTurangzaiTarnabAgraUmar ZaiAverage
S10.650.470.860.840.840.440.68
S20.490.490.480.410.610.340.47
S30.550.411.001.000.780.160.65
S51.000.720.750.741.001.000.87
Average S0.540.420.620.600.650.390.53
S1, Household size (>7 persons); S2, dependent persons (<14 years and >60 years); S3, female–male ratio; S4, fatal illness or disability (S4 had null values—that is why the results were not included in the analysis); and S5, illiterate household heads.
Table 6. Household resilience to floods.
IndicatorsDaulat PuraHisar YasinzaiTurangzaiTarnabAgraUmar ZaiAverage
R10.870.900.820.811.000.710.85
R20.390.290.340.390.480.470.39
R30.240.060.320.090.190.030.16
R40.650.650.800.780.960.760.77
R50.270.130.110.010.380.040.16
Average R0.480.410.480.420.600.400.47
R1, flood risk awareness; R2, employment; R3, secondary income sources; R4, social network; and R5, financial capacity for recovery.
Table 7. Overall social vulnerability to floods.
Union CouncilsDaulat PuraHisar YasinzaiTurangzaiTarnabAgraUmar ZaiAverage
Average Exposure0.790.770.450.310.940.350.60
Average Susceptibility0.540.420.620.600.650.390.53
Average Resilience0.480.410.480.420.600.400.47
Overall SFVI0.850.780.590.490.980.340.66
Publisher’s Note: MDPI stays neutral with regard to jurisdictional claims in published maps and institutional affiliations.

