
Rainfall-Induced or Lake-Water-Level-Controlled Landslide? An Example from the Steep Slopes of Lake Balaton, Hungary


Department of Engineering Geology and Geotechnics, Faculty of Civil Engineering, Budapest University of Technology and Economics, Müegyetem rkp. 3, H-1111 Budapest, Hungary
*
Author to whom correspondence should be addressed.
Water 2022, 14(7), 1169; https://doi.org/10.3390/w14071169
Submission received: 25 January 2022
/
Revised: 31 March 2022
/
Accepted: 31 March 2022
/
Published: 6 April 2022
(This article belongs to the Special Issue Landslides Induced by Surface and Groundwater)
Abstract
:The present paper provides a case study and an overview of the stability of high banks bordering the eastern basin of the largest central European lake, Lake Balaton, in Hungary. External factors such as rain, lake-water level, or pore water pressure are considered in the stability analysis. The slope stability was assessed using two software with different approximations and calculation methods. The results of the models using Plaxis and Rocscience Slide2 are compared. One of the major identified failure scenarios is the deep-seating rotational landslides that are triggered by rain and elevated groundwater table. The modeled slip surfaces are in good agreement with the inclinometer monitoring data of the site; meanwhile, the top of the slope failures is not influenced by water level.
1. Introduction
Landslides are becoming more common around the world mainly because of climate change, weather conditions with an increasing number of storms and heavy rainfall events [1,2], and increasing human disturbance [3,4]. A previous study in the Balaton shore region has also shown that most slope movements are related to increased precipitation [5]. The spatiotemporal analysis of a worldwide dataset of fatal non-seismic landslides between 2004 and 2016 reported that nearly 5000 fatal surface movements killed almost 56,000 people, and the property damage caused was also enormous [6].
Coastal slopes and shorelines are often subject to active erosion processes linked to their geology and morphology; thus, their stability is changing rapidly [7]. Several erosion processes may include active toe erosion that initiates other processes such as surface erosion and landslides [8]. Shoreline erosion and cliff recession along most of the shoreline of the Great Lakes in the USA results in losses of millions of dollars annually [9]. Extreme rainfall events often induce deep-seated landslides, for example, in southwestern Taiwan in 2009 [10]. Case studies dealing with coastal zones [8] recognized that water (ground or surface but also sea through wave action) was the main driving agent resulting in erosion (superficial erosion, gully formation, mudflows) and slope instability (translational and rotational slides, topples, and slumps). Other factors such as land-use change during construction and traffic, featured strongly among the factors associated with triggering slope instability [11].
The susceptibility of an area to landslides can be assessed using various methods such as, morphological mapping [12], remote sensing techniques [13,14,15,16,17] or numerical simulations [7,18]. Material properties [1,6,19] and moisture/precipitation [1,2] are key factors in assessing the landslide susceptibility of an area, and the susceptibility can be assessed even at the country scale [20]. Past landslides of Lake Balaton’s shoreline zones are documented in this area [21]. Due to past landslides and documented disasters, information from the area is available from as early as the 19th century. These are known from both published articles mainly from the last century [22,23,24,25,26,27,28,29] and maps, such as the National Surface Movement Cadastre of Hungary [30] or the Online Landslide Hazard Map of Hungary [31].
The aim of this paper is to present a case study in Hungary on the problem of slope movement, which is a growing risk worldwide as well. The problem of the slope chosen for the study is complex: on the one hand, it is a shoreline area, and on the other hand, it is surrounded by populated residential areas. In addition, there is a railway line in the middle of the slope as well as roads at the bottom and top of the slope. In the past, numerous movements have affected and shaped the wider area, causing road closures and train accidents. Thanks to several interventions, there have been no mass movements causing serious damage in recent years, but movements have continued into the 21st century. For example, in 2010, a section of the railway tracks in the immediate vicinity of the study area had to be closed to traffic while the tracks were being restored [32]. In this work, we have now performed deterministic, finite-element (Plaxis [33]) and probabilistic stability analysis (RocScience Slide2 [34]) for different lake-water and groundwater levels in order to model different meteorological and hydrogeological cases. These results were evaluated in combination with the rainfall and lake-water-level data series in 2020. The monitoring system for ground movement, groundwater and pore water pressure, were also recorded to better understand the erosion process and to analyze the effect of rainfall periods and/or changes in lake-water level on slope movement. The most useful outcome of these studies and analyses could be the creation of a landslide-notification system for the area, using the results and observations to predict harmful landslide movements. Warning strategies of landslide risk are evolving and becoming more actively used [35,36]. A great example of this is the Norwegian susceptibility and hazard maps, landslide forecasting, and warning service (using real-time hydro-meteorological measurements) that is available online [37].
2. Geographic Setting and Geology
This study deals with a shoreline area of the largest lake in central Europe. The eastern basin of Lake Balaton is surrounded by special geological formations and high banks that are prone to movement. It is an area where many past examples of slope failure have been documented since the 19th century [29], when roads and railway lines were threatened by landslides [30]. During the construction of the railway in the spring of 1908, the bank, where the railway cut was made, collapsed in the area of Balatonakarattya at a length of about 400 m. A few years later in the spring of 1914, almost half a million cubic meters of earth moved between Balatonfűzfő and Balatonkenese, pushing the railway 40 m towards Lake Balaton and turning the steam locomotive into the lake in a matter of minutes. It was observed that the shear surface of the slides often extends deep below the lake bed, thus causing bed rise [24]. As a result of such an event, two islands could have formed in front of Balatonakarattya in the 18th century.
The shoreline zone of Lake Balaton was either formed by wave erosion or by the deposition of lake sediments. High banks, their collapses, and slumps shaped the shores. The lake dried out several times during its history and was filled with water again, with significant water-level changes. In these days, there is only one draining river of the lake, called the Sió Channel, which allows the lowering of the water table. Before its construction, the water levels were typically much higher than they are today [38].
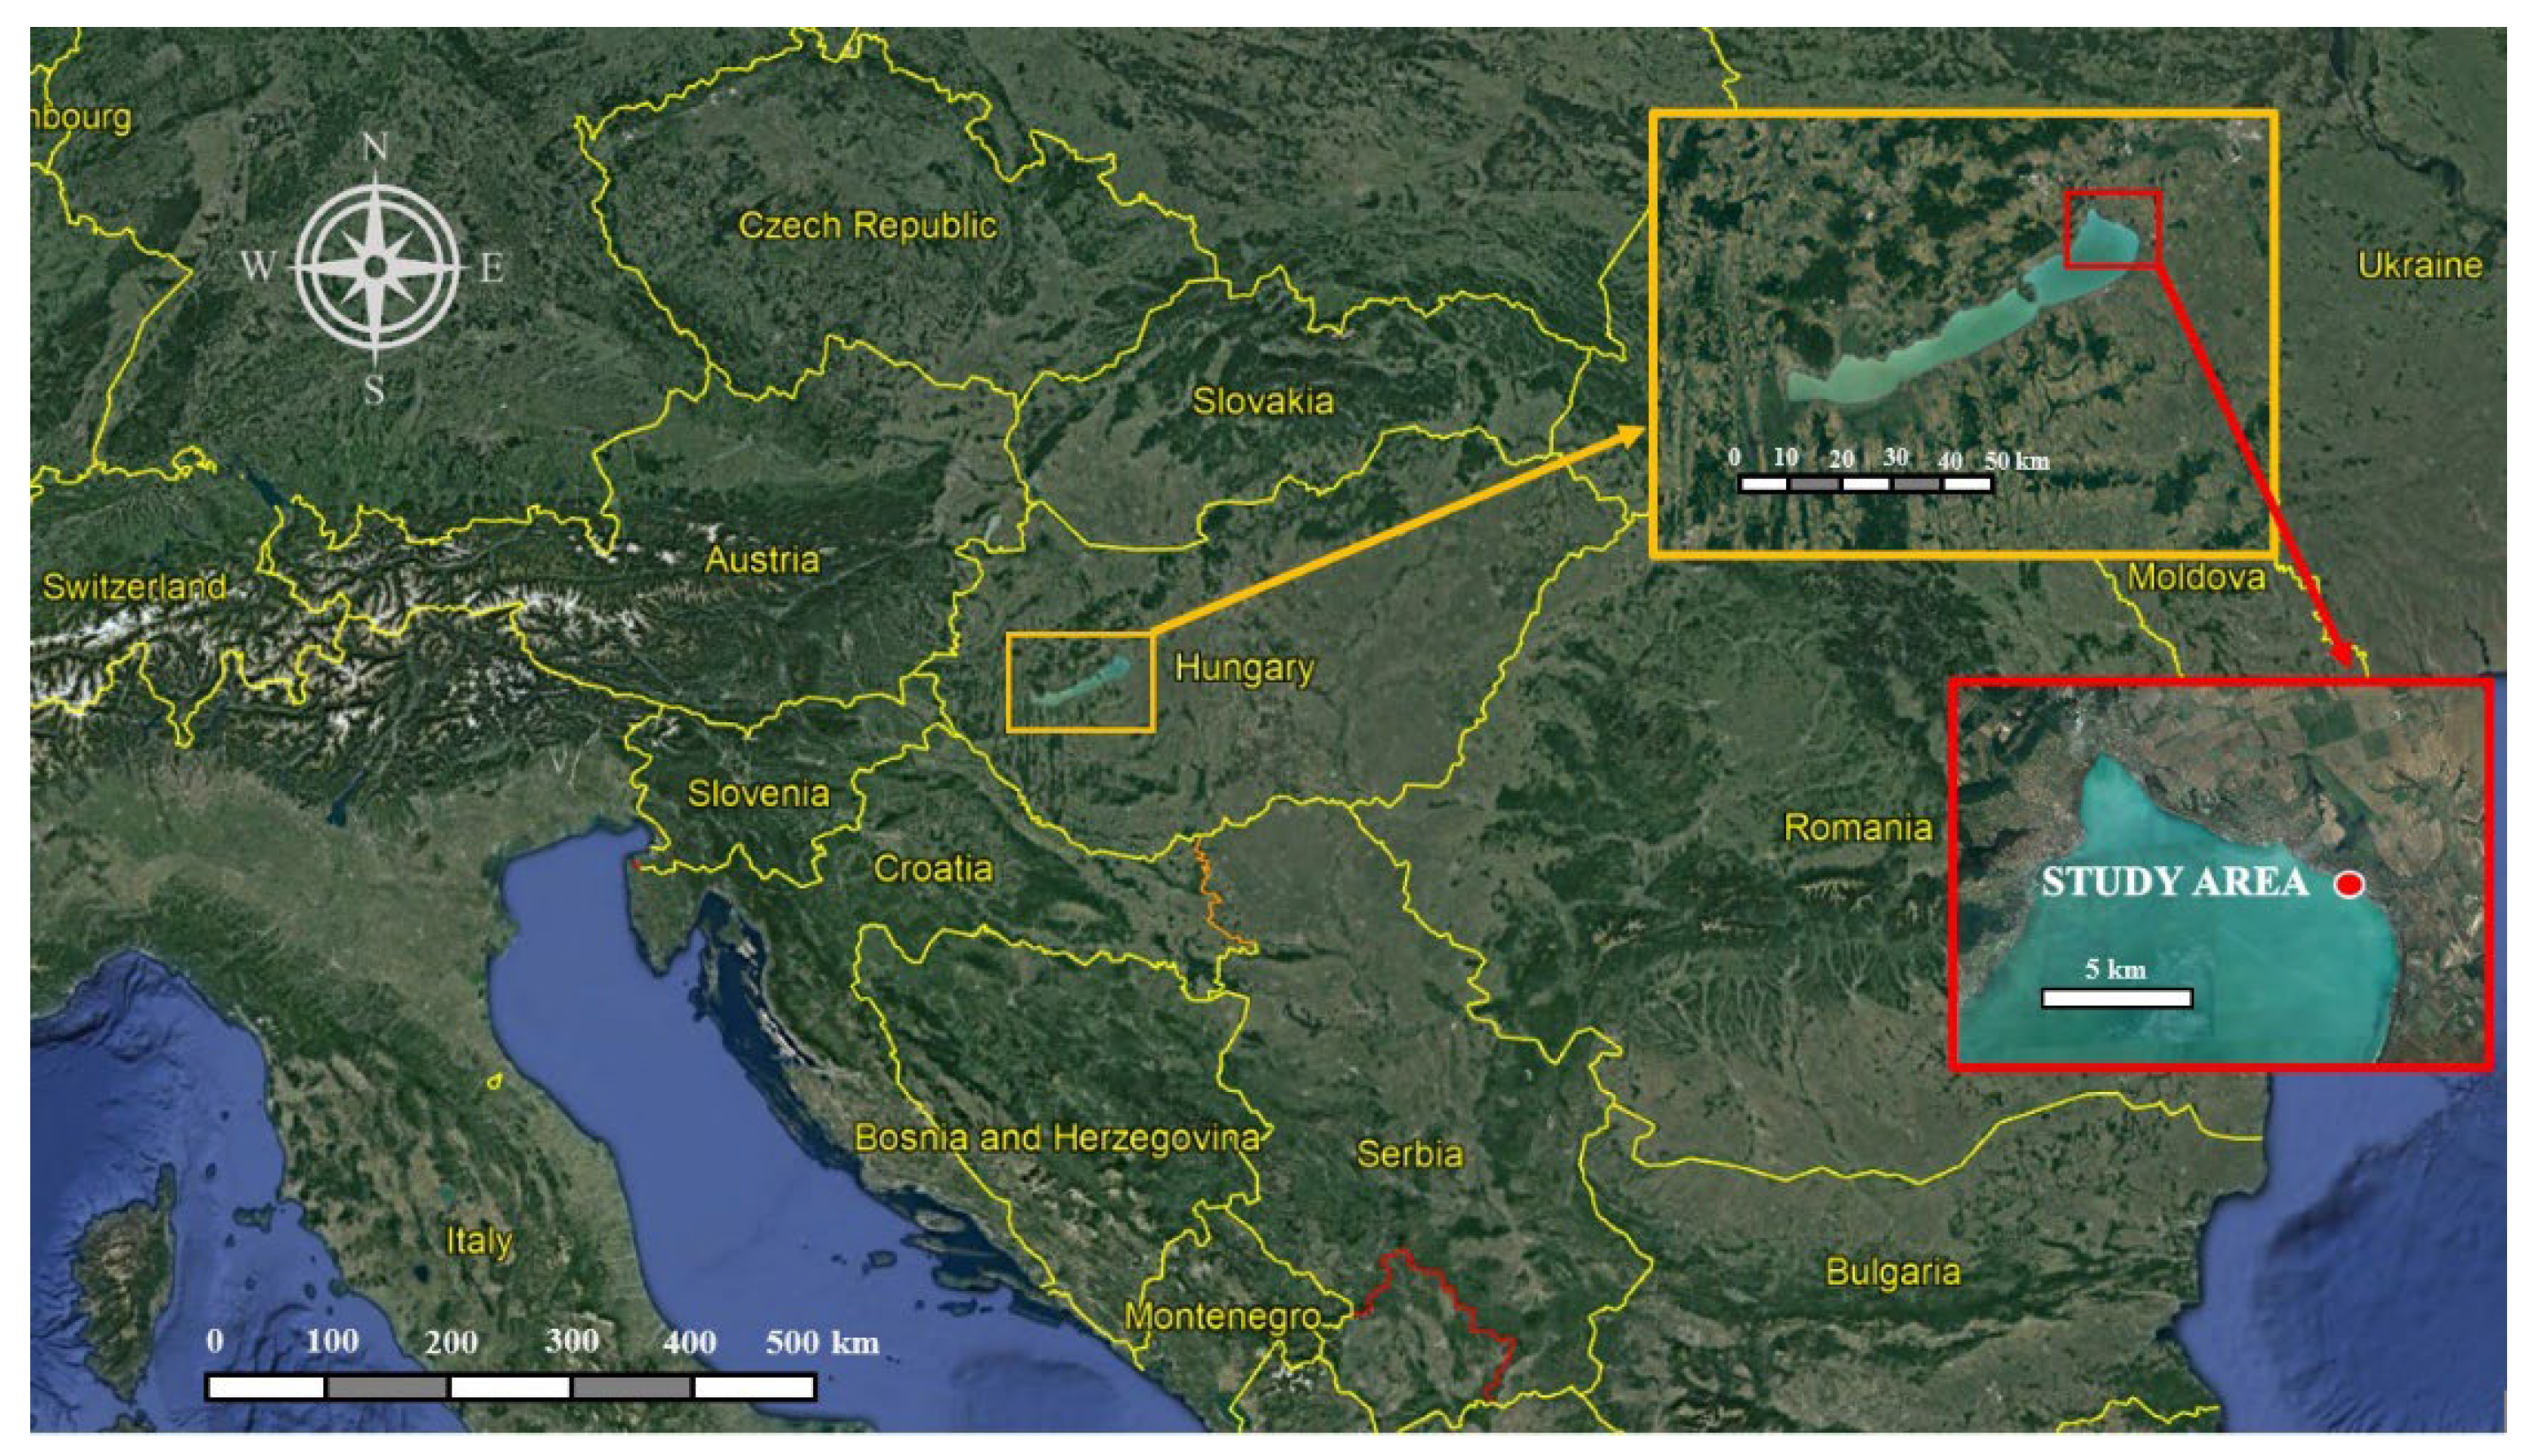
The studied slope is in the eastern basin of the lake, on the border of Balatonakarattya and Balatonkenese (Figure 1). In this area, the slope’s stability has a crucial importance due to rail traffic, since a major railway track is cut into the steep slope. Additionally, the resort area at the bottom and at the top of the slope is endangered by active, periodic landslides.
Triassic to Holocene layers provide the geological environment of the broader area. The differences in the geological and morphological–structural geological settings cause variations in hydrogeological conditions, which can explain the differences in the stabilities of slopes [23], as was discussed in more detail in a previous publication [5]. The eastern basin is dominated by the Miocene formations, prevailingly the Tihany Formation. The sedimentary series of the Tihany Formation (clay, sand, silt) is predominantly involved in constructing the high banks of the eastern basin. These are sediments of the deltas arriving at Lake Pannon. Layers of the Tihany Formation were deposited as a series of sequences in the diverse paleo-environments of the Pannonian sea, forming deltas arriving into the lake. It consists of sediments of different particle sizes but predominantly fine sand and silt [39]. In addition to changes in paleo lake levels, environmental changes and climatic cyclicity also contributed to the non-uniform lithology and stratal patterns of these beds. As a result, 15–30 m changes in water level were detected, indicating the progression and regression of the lake (resulting in the cyclic displacement of its shoreline). These series of events continued until Lake Pannon moved to the south about eight million years ago, and suffusion has become more rare. The deposited sediments have different particle sizes, but fine sand prevails. Calm sedimentation was interrupted by short-term water-agitation events, settling thin, fine sand lenses at the mm-to-cm scale [40]. From a geological-engineering point of view, this sediment pattern is unfavorable. Sand layers between the clay layers behave like thin aquifers and facilitate water movement leading to surface movements, especially when these sand beds are capped by loess. The geology and characteristics of the Pannonian Basin’s sedimentary structures have been described in detail in several studies [39,40,41]. Quaternary formations of different thicknesses cover the layers of the Tihany Formation (Figure 2). The cold winds of the ice age formed a thin loess, which has already been eroded in many places. The uppermost loess and sediment cover is divided by coarse, gravel-debris bed embankments of the Pleistocene stream bed. Beneath the lake bog, terrestrial variegated clays were formed, while deeper layers of sand and clay alternate beneath mud layers with lignite seams, which play a significant role in the horizontal flow of waters. The sliding surfaces of the large slides were formed at the lake-bed level of Lake Balaton; the smaller ones destroy the sandy-clay sedimentary series and shore sections above the railway track [24].
Figure 3 shows a site plan of the area, on which the information from the Hungarian Surface Movement Cadastre [30] is also displayed. There are three landslide-hazard areas overlapping in the study area according to this map [30]. The largest polygon indicates rotational landslide, where collapse occurs as a result of complex natural process. A shoreline-protection system was built to eliminate wave erosion. It has reduced the movements since 1979 and therefore, the area was temporarily stabilzed. The other two polygons both indicate occasionally rotational landslides. One million cubic meters of earthworks have been carried out to eliminate the movements. The railway track has been modified; it was moved 30 m towards the hill, and a 90 m-long tunnel was built for safety reasons. A surface drainage system was also constructed and a stone-paved surface was created. Thus, while the condition of the smaller zone is already settled, the location of the larger polygon is still moving according to measurements. The movements continued into the 21st century: In May 2010, the railway track was affected by a 70 m-wide slip and a collapse occurred. In March 2011, a 100 m-long slump occurred, and the railway section was restored by piles and ground improvement by injection. In 2014, a gabion retaining wall was built to support one of the streets. In 2017, 200–300 m3 of soil slipped due to irregular rainwater drainage. The recent movements signify the vulnerability of the slope. The hydrogeology is unique since the hinterland feeds groundwater; additionally, there is a complex interaction of lower horizons of groundwater with lake water. The lake level has been fluctuating in ten meters of amplitude according to the records of the past 500 years. The groundwater table has an indirect link with precipitation. These conditions lead to the presence of confined aquifers that reduce slope stability. A monitoring system is in operation, including groundwater-monitoring wells (Casagrande piezometers) and inclinometers (Figure 3).
3. Materials and Methods
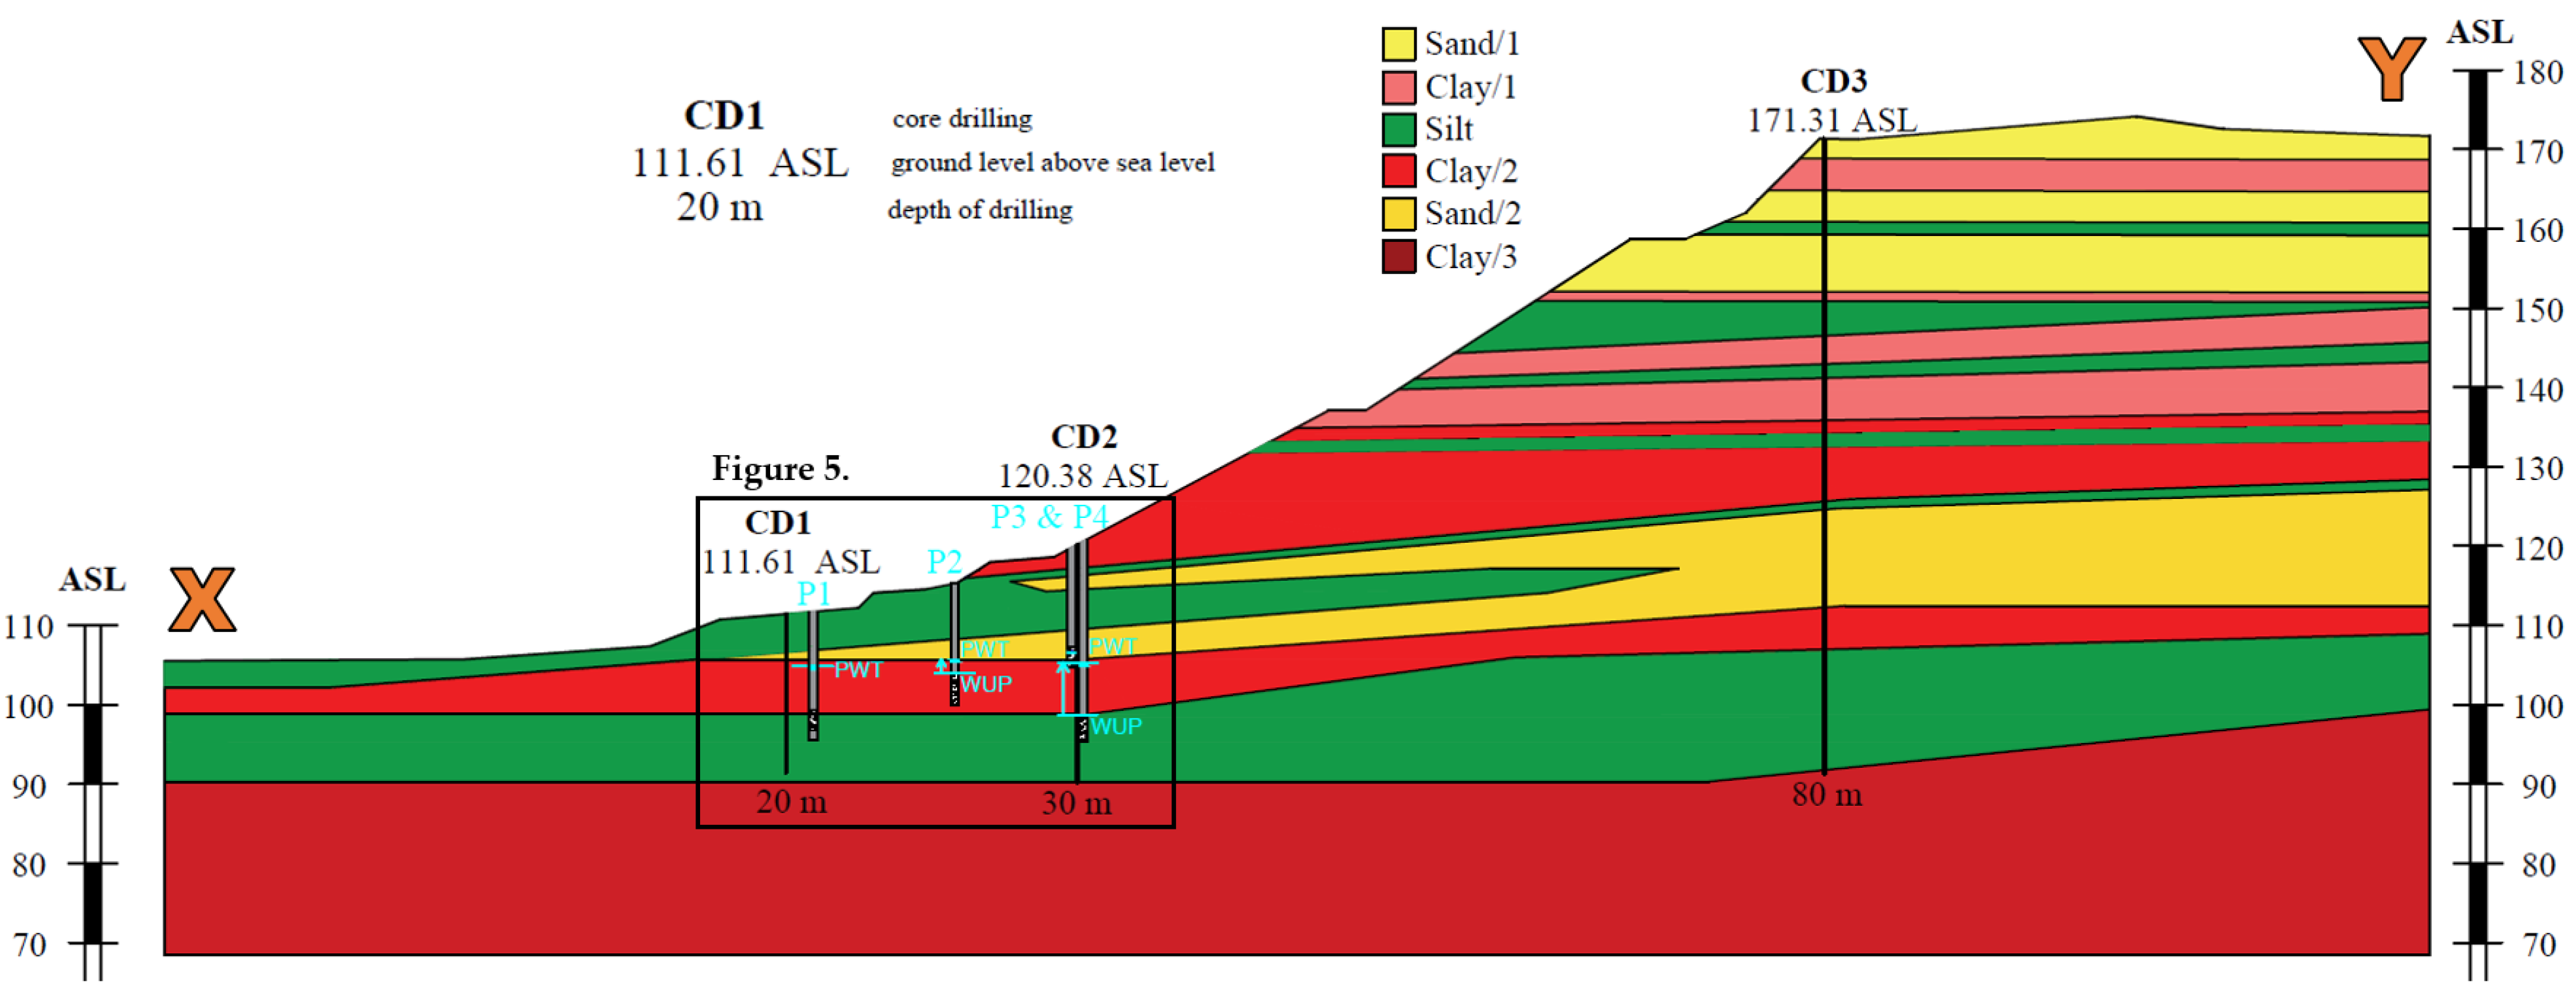
The geometry of the modeled section was constructed from three boreholes, as shown in Figure 4. A borehole was drilled to a depth of 80 m at the top of the bank and at 30 m and 20 m into the slope. Additional data sources were also used: core drillings of the larger area of ~400 m × 800 m were taken into account in the model’s construction. The geomorphological evolution of the site is unique since the lakeside has retreated due to several phases of sliding. The area and section can be morphologically divided into four parts: foot slope, debris slope (formed by previous movements), slope (with a cut-in railway line) and convex slope. There are hardly any parallel layers or uniform layering due to historical and recent slides which have disturbed the original geological structure [22]. This factor complicates the geotechnical–soil-mechanical correlation and the representation of reality in geotechnical software, but this is not the only reason why the model needs to be simplified. The presence of many very thin layers that are difficult to handle in the slope-section modeling is an additional reason for the simplification. Even with these factors, the result was a rather complex section, with nineteen layers instead of the nine used in previous studies [44,45,46].
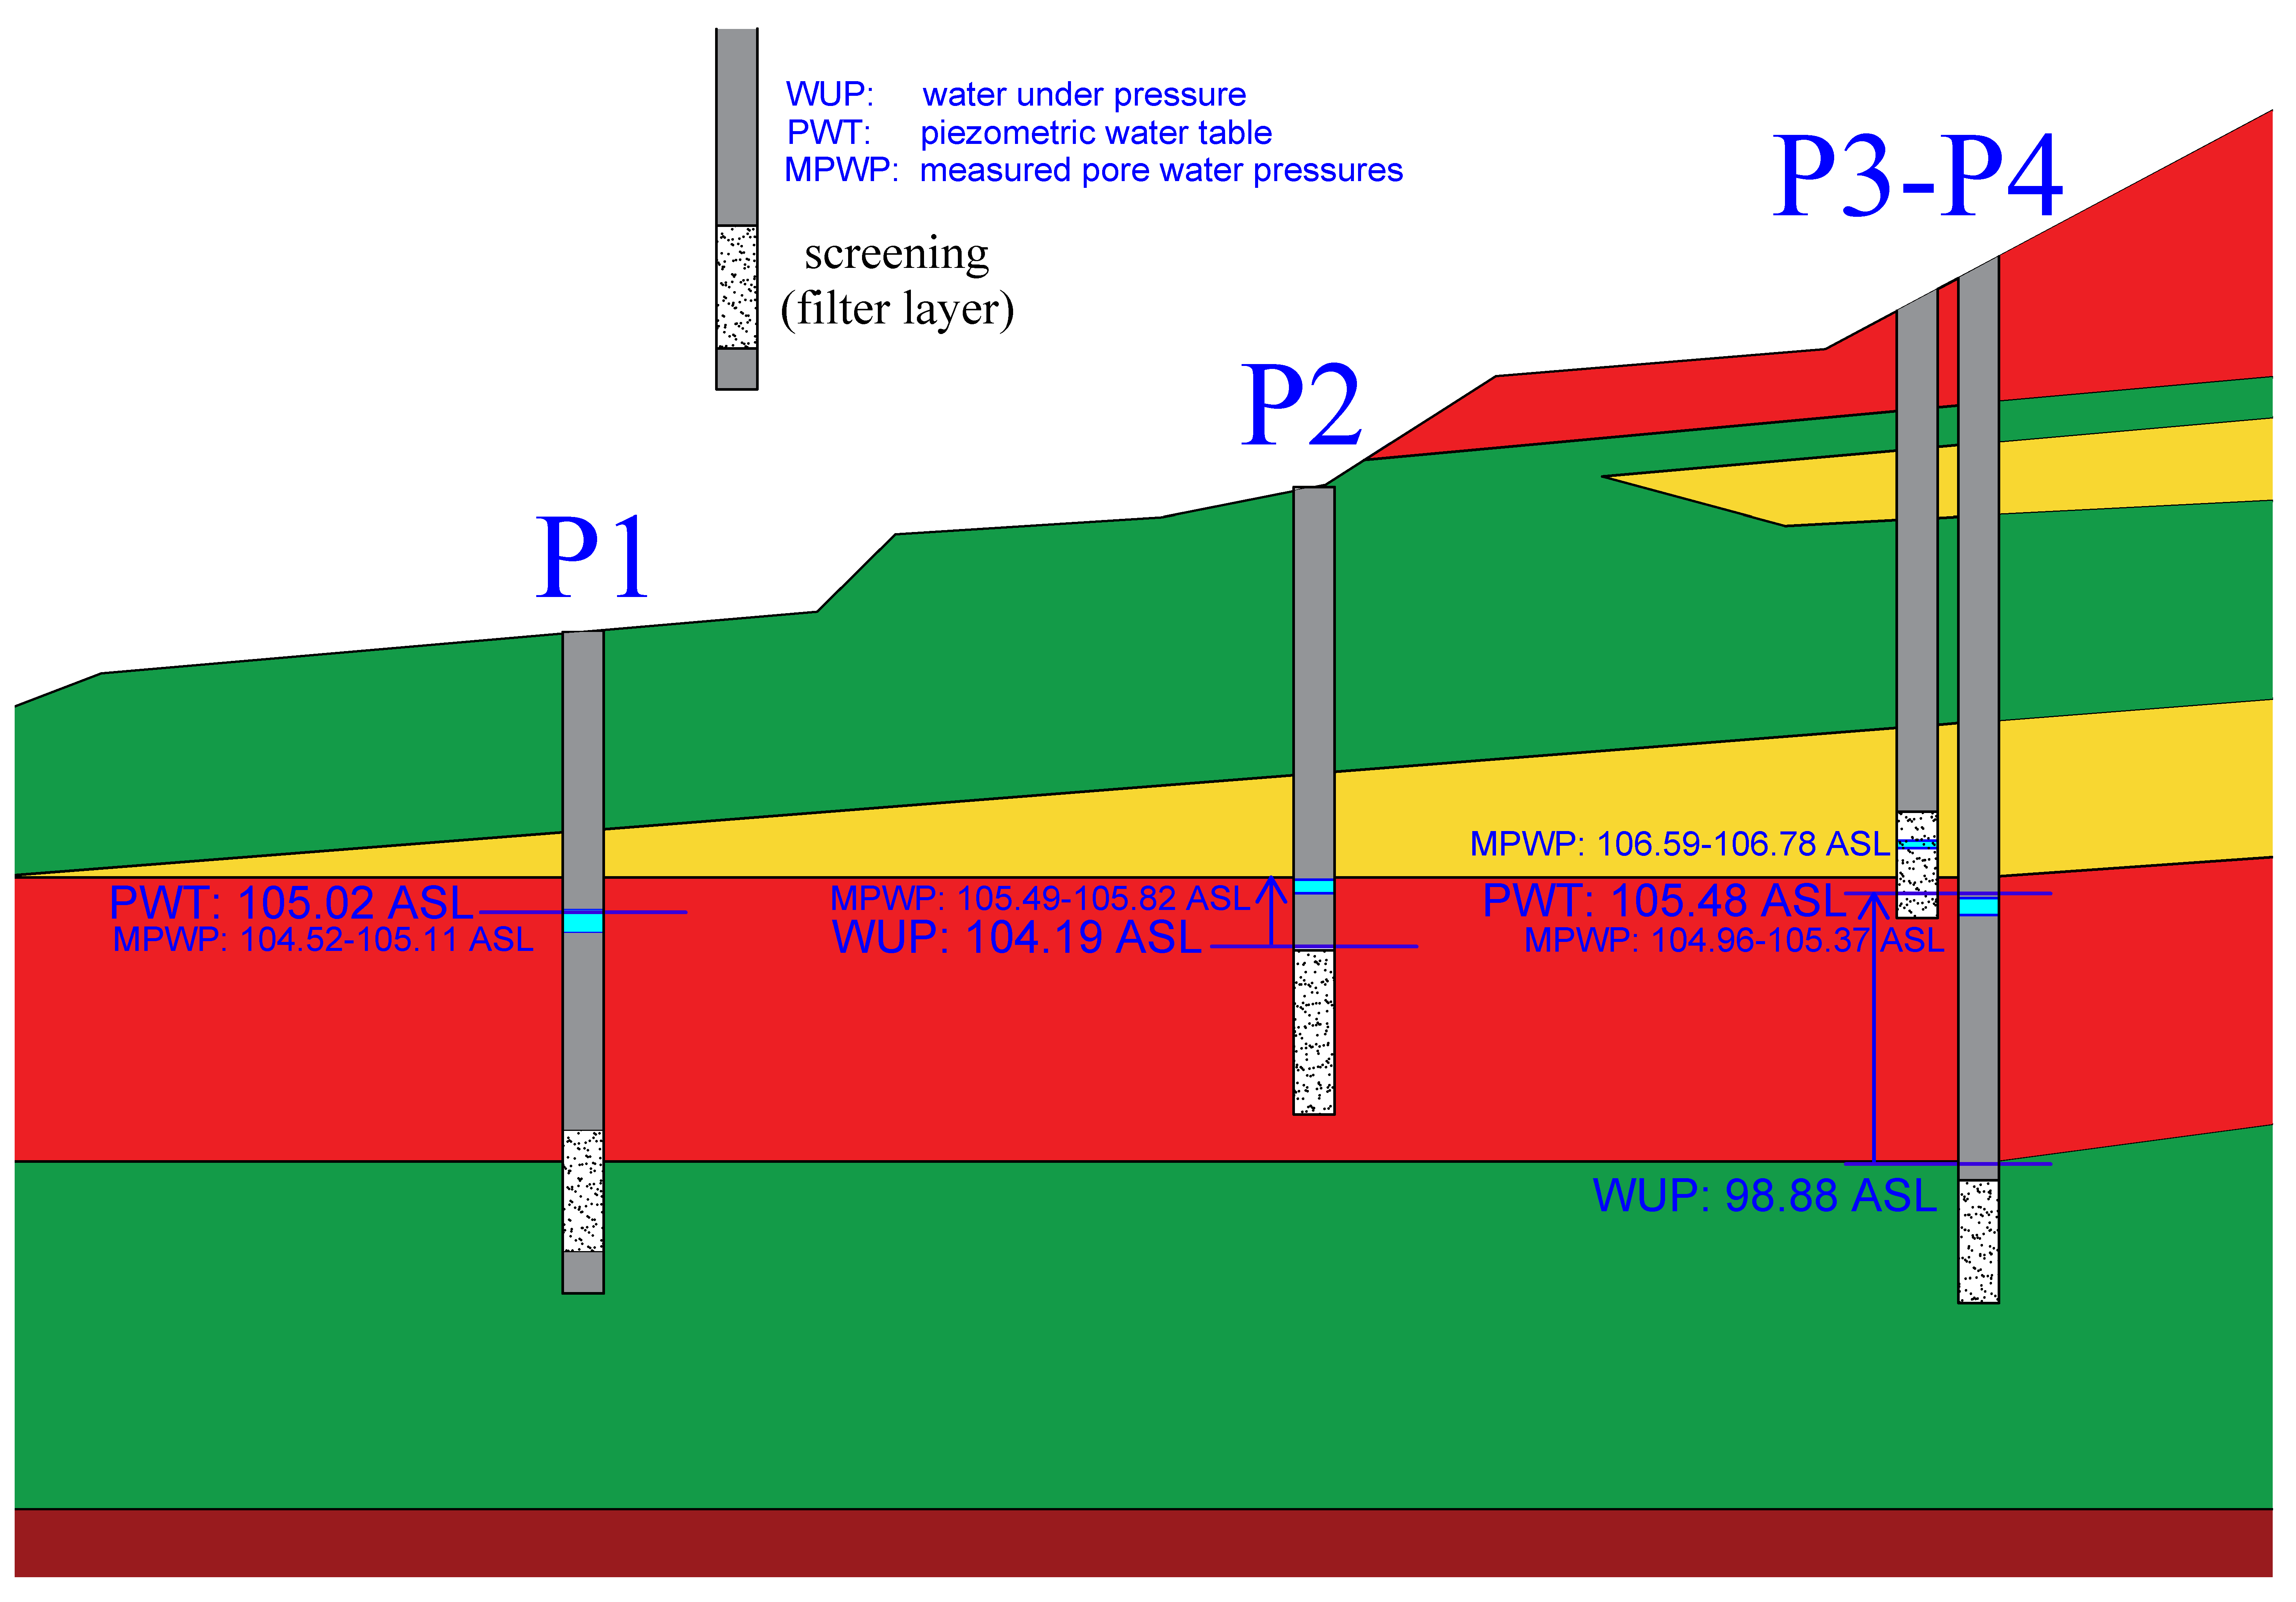
Casagrande piezometers were installed to monitor water levels (Figure 5). Using four piezometers, several water levels were recorded: WUP (water under pressure), the level where water was first detected at the time of drilling; PWT (piezometric water table); and MPWP (measured pore water pressures) are the pore water pressures in the screened section of the piezometer tube. This latter one was recorded at three-day intervals. Figure 3 shows the location of piezometers on the site map. The stratification is slightly different in the piezometers, but the most important hydrological relationships are visible.
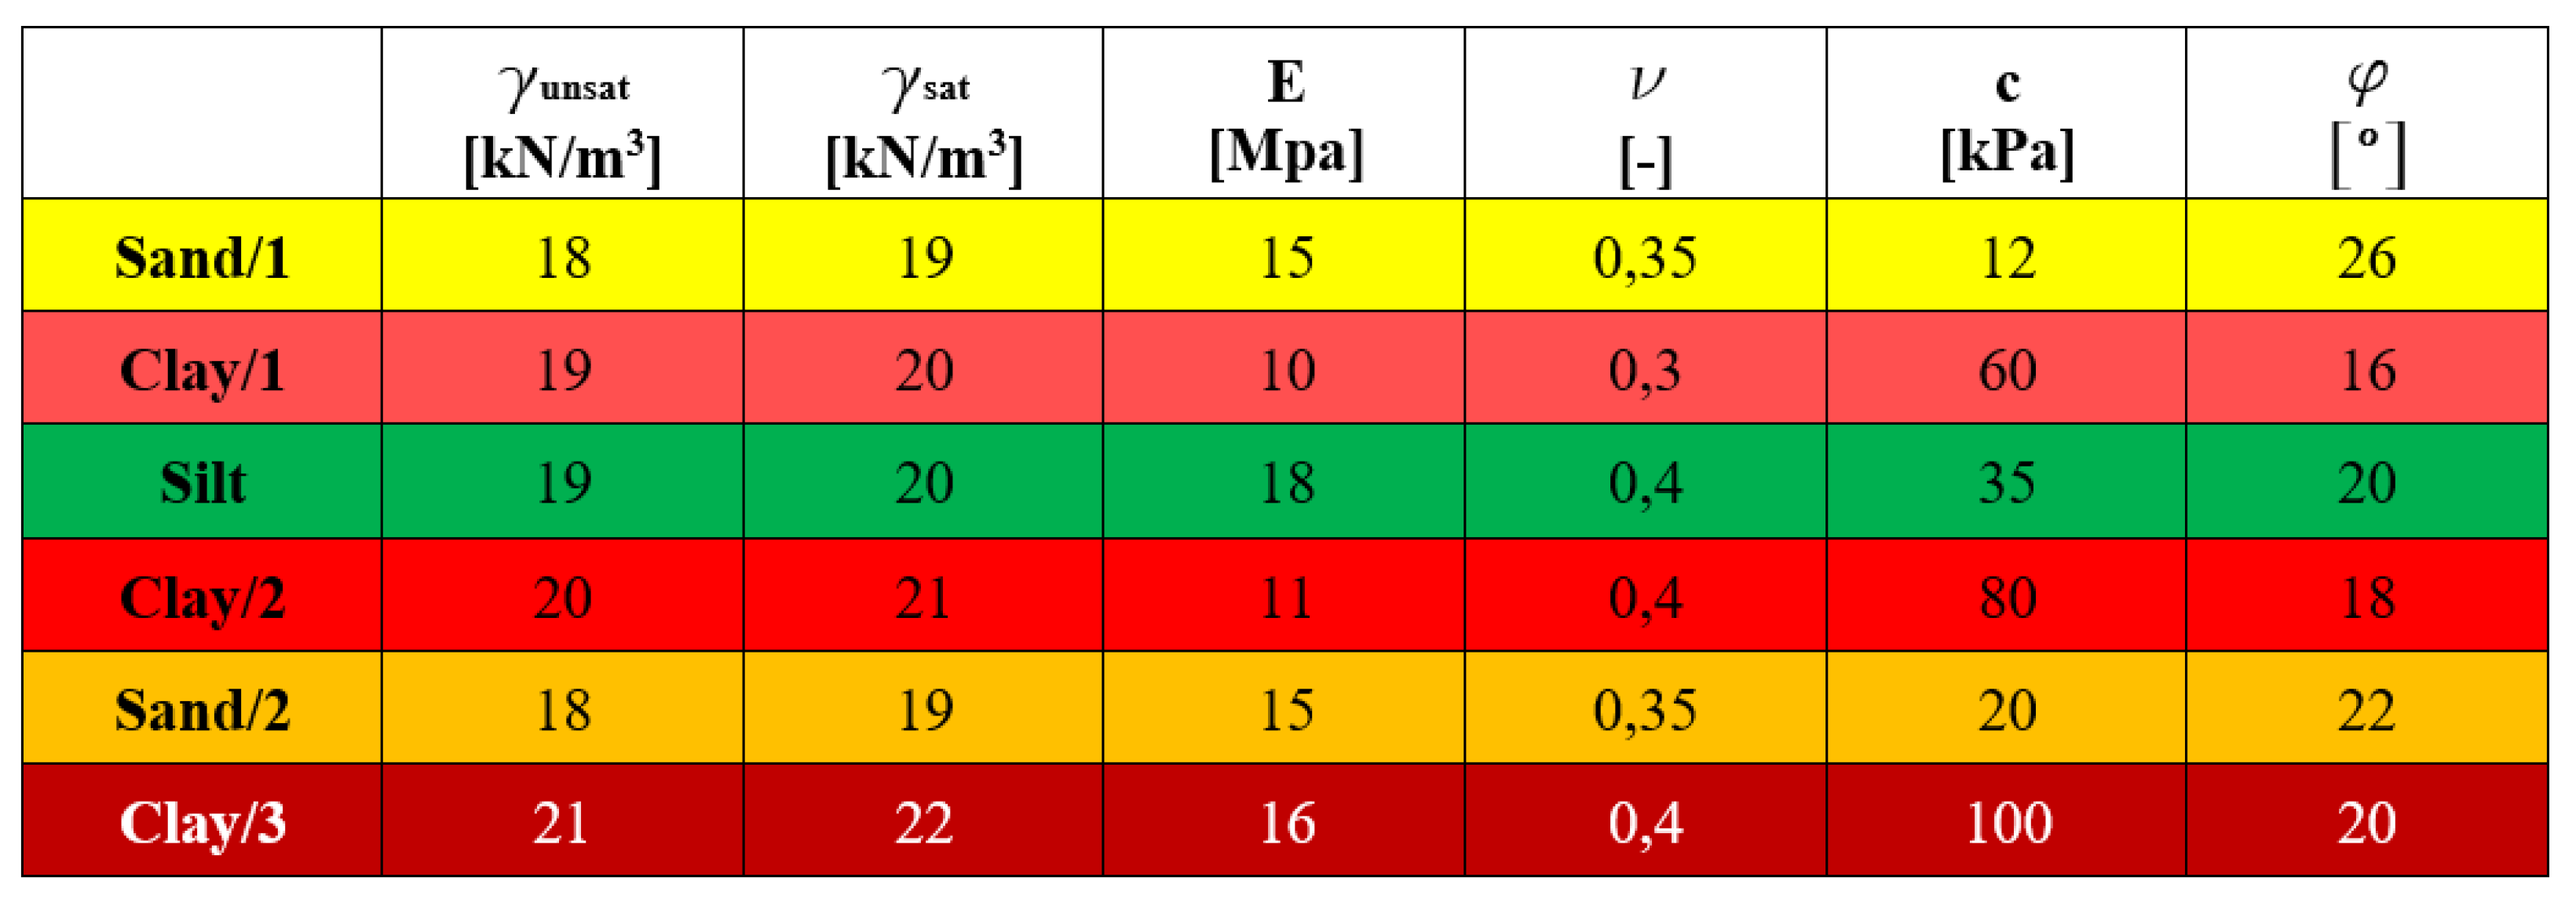
The input parameters of the modeling, i.e., the determinstic soil parameters, were obtained from laboratory analyses and are summarized in Figure 6. The colors in the table are the same as the layers in the section, following the traditional geotechnical notation.
In our previous work [44,45,46], we carried out limit-equilibrium, finite-element and probabilistic stability analyses, which have consistently shown that the most likely and highest risk mode of failure is a slide that is deeply located at the shore. Traces of such events have been observed on the ground. Global failure can occur along a deep, circular base-slip surface or the formation of the complex geometry of toe-slip surface. Signs of slow surface creeping were also observed during field surveys such as curved trunks of trees [47]. Cracks have appeared in the concrete abutment at the foot of the slope, presumably due to an active landslide. In this research, we combined field measurements with data-processing and computer-modeling methods. Field measurements covered the measurement of the geotechnical monitoring system (inclinometers and piezometers) every three days. The data processing entailed the processing of rainfall and lake-level data. The computer modeling was performed using FEM deterministic and LEM probabilistic methods.
Ciampalini et al. [48] studied how to effectively monitor slow-moving landslides and how to identify sudden accelerations, and as a follow-up, how to activate a response plan. They have shown through a case study from Italy that the comparison between deformation data and rainfall data suggests that rainfall is responsible for the identified accelerations in the deformation rate of the landslide. Another Italian case study presented a procedure that would allow a near-real-time and continuous update of the landslide-hazard-assessment forecast, and the self-learning redefinition of the thresholds used to trigger the activation of each different management alert level [49]. A third case study of a debris slide in Italy (estimated volume of about 35,000 m3) was analyzed and stabilized through an underground monitoring system, such as inclinometers and piezometers. Furthermore, LEM and FEM models [50,51] demonstrated through four case studies that active landslides are often controlled by the groundwater-level fluctuations which, in turn, are related to rainfall. These landslides are generally characterized by low velocity with deformations essentially concentrated within a distinct shear zone located at the base of the landslide body [52]. The soil mass above the shear zone is, on the contrary, affected by small deformations and moves like a rigid body (i.e., with a horizontal displacement profile that is essentially constant with depth). Movements are usually generated by a rise in groundwater level owing to rainfall. On the other hand, a decrease in groundwater reduces the landslide velocity until the unstable soil mass comes to rest. Therefore, the mobility of these landslides is marked by alternating phases of rest and motion. These studies have used underground monitoring systems (inclinometer and piezometer data sets) among other instruments. We followed this procedure in our study. Using inclinometers, horizontal displacements are measured in the downward and perpendicular directions. The main purpose of this is to identify sliding surfaces before surface movements occur, in order to avoid damage by timely interventions. These data have been corelated with the rainfall, water-level, pore-water-pressure data series and various modeling results. Our aim is to analyze the effects of rainfall and lake-level changes on the occurrence of landslides and surface movements. A number of studies have also been carried out in recent years on the effect of different water patterns on slope stability [53,54,55,56,57,58,59,60].
Geotechnical modeling was carried out using two software tools. In Plaxis VEM deterministic modeling was used, while in Rocscience Slide2, a probabilistic LEM method was applied. Using these methods and software with parallel calculations helps to better understand the slope stability and sliding mechanisms [61]. Plaxis software is widely used in modeling geotechnical problems, including slope-stability issues [62]. Plaxis can perform slope-stability analysis by reducing the strength parameters of the soil. This process is called c-Phi reduction. The safety factor is given by the ratio of the available strength over the strength at failure [63]. In Rocsience’s Slide2 software, which is also widely used for probabilistic analysis of slope-stability problems [64], we performed a probabilistic analysis using the Latin-Hypercube sampling method and the global-minimum-analysis type. The runs were performed in all programs at 7 different water levels to illustrate different hydrogeological conditions.
4. Results and Discussion
4.1. Rainfall, Lake-Water-Level, Pore-Water-Pressure and Inclinometer-Displacement Data of 2020
The four piezometers were installed in different layers (Figure 5). The monthly minimum and maximum values of the measurements (recordings every three days) for each well are shown in Figure 7. The water level of Lake Balaton is also indicated by monthly minimum and maximum values with a thick blue line, while the blue bars represent the monthly rainfall.
In the wells screened in the covered confined aquifer (P1 and P4), the typical March–September maximum–minimum groundwater-flow pattern is observed as well as the lake-water level. The dry September shows that water levels drop by 20 cm compared to August. This drop is followed by a slower rise in the extremely wet October. Precipitation infiltrated quickly into the layer screened by P2 (which is probably a sand lens or vein), and the effect of the summer rainfall months is also evident in the measurement data. The pore water pressure in this layer reflects the meteorological factors most quickly and accurately. This process may be due to the thick layer of sand that pinches out here. In well P3, which is screened at the level of the groundwater table at rest, a pressure difference of only 20 cm and a drop in pressure were observed throughout the year. So there is no correlation with precipitation conditions or lake levels. This indicates either the presence of a dependent groundwater lens or a remote system, zone, or source feeding the layer with water. Although the wells are located in a common section (the modeled one), the more distant ones are, in reality, more than 100 m apart (as shown in Figure 3). The already mixed and modified geological structure can show significant differences at 100 m. Not all wells were drilled with a detailed borehole description and laboratory analysis, which makes it somewhat difficult to accurately formulate the hydrogeological phenomena. The water seeps towards Lake Balaton in the debris slope following a complex path. According to the piezometers, it flows above clay and in thin sand veins, while elsewhere it is found in the loose, clayey, sandy silt layers. Thus, while in some places the water easily finds its way to Lake Balaton, in others, it is congested behind layers of clay.
The monthly maximum displacements measured by two inclinometers are also visualized (Figure 8). According to these inclinometers, no shear zone is shown and the displacements are largest near the surface and decrease with depth. Therefore, no sliding surface was identified here, but a good correlation with precipitation is shown. The upper layers of the shore edge are predominantly sand and sandy layers into which precipitation infiltrates rapidly, resulting in an increase in displacements of more than 10 mm in August following the summer rainfall of 2020. Localized slips can occur as confirmed by our previous test results [44,45,46] and signs of small-scale slips [47].
It can be seen that even this small amount of movement is stabilized in the autumn, and the IC4 inclinometer also shows a minimal effect of the October rainfall (Figure 8b).
4.2. The Results of Modeling Different Water Levels: Probabilities of Failure, Safety Factors and Sliding Surfaces
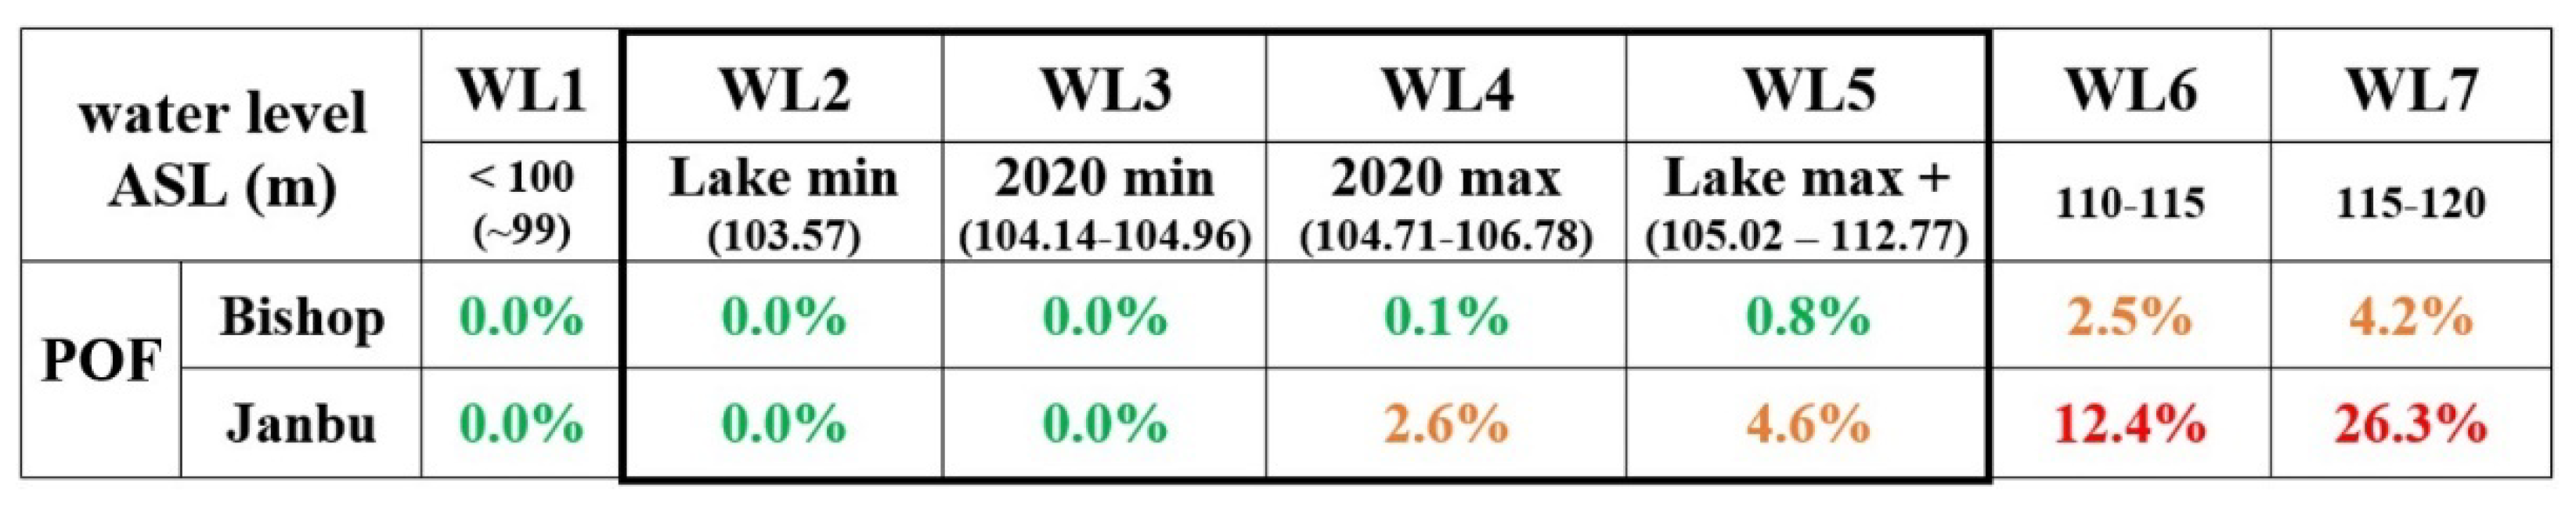
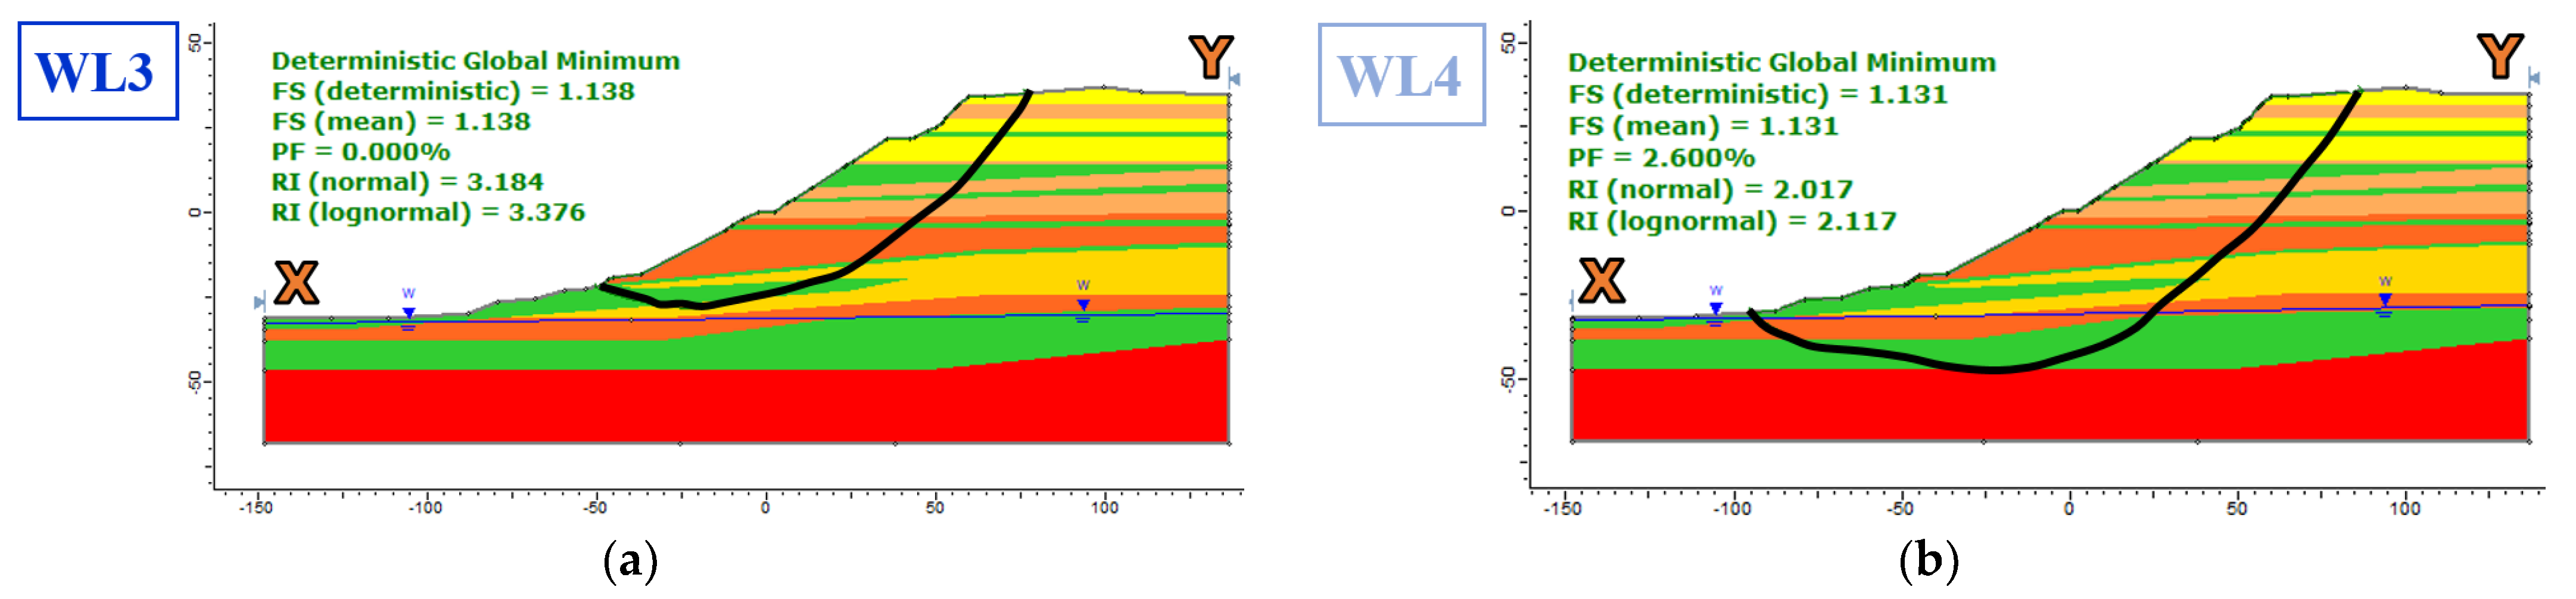
The extreme values of the seven different modeled water levels at the model boundaries are presented (Figure 9). The historical minimum (October 2003) to maximum (April 1917) lake levels, the extreme dry periods and extreme water-level rises are also given. The probability of failure values were calculated and compared to recommended values, which are to be kept below 1%. The probability of failure (POF) of overall or inter-ramp slopes, including haul road or key infrastructure, must be below 1% [65]. Maximum allowable POF of natural slopes with major to catastrophic consequence levels and a low level of design confidence is 2% [66]. The 2020 maximum water level and maximum pore water pressure (WL4), which occurred in February–March, already resulted in a POF of 2.6% based on the Janbu method (Figure 10), but also a larger landmass could be in motion based on the Bishop simplification method (Figure 11).
Slide2 models of the WL4 water level, with their deep circular slides, have been recorded using the geometric conditions given in a previous study [22]. In this paper, three methods were used to calculate the factor of safety, as a function of the modeled water level (Figure 12). The safety factor at lower water levels (WL1, WL2, WL3) is only around 1.2, which is less than the Eurocode value of 1.35 (green zone in Figure 12), but based on the probability calculations, we should not expect a failure at this level. However, the 2020 maximum water level and pore water pressure (WL4) could be a notification level, as the risk of movements is expected to increase rapidly as water levels continue to rise. The probabilistic calculations showed many more possible slip geometries than in the Plaxis software and the value of the factor of safety was lower in all cases by Slide2.
The previous application [67] of Slide2 has also proved that, for probabilistic regional landslide-hazard assessment, the software is a handy tool. Hadjigeorgiou et al. [68] also used Bishop’s simplified limit-equilibrium method to assess a road-embankment failure in Southwest Cyprus, presenting various slope-failure scenarios.
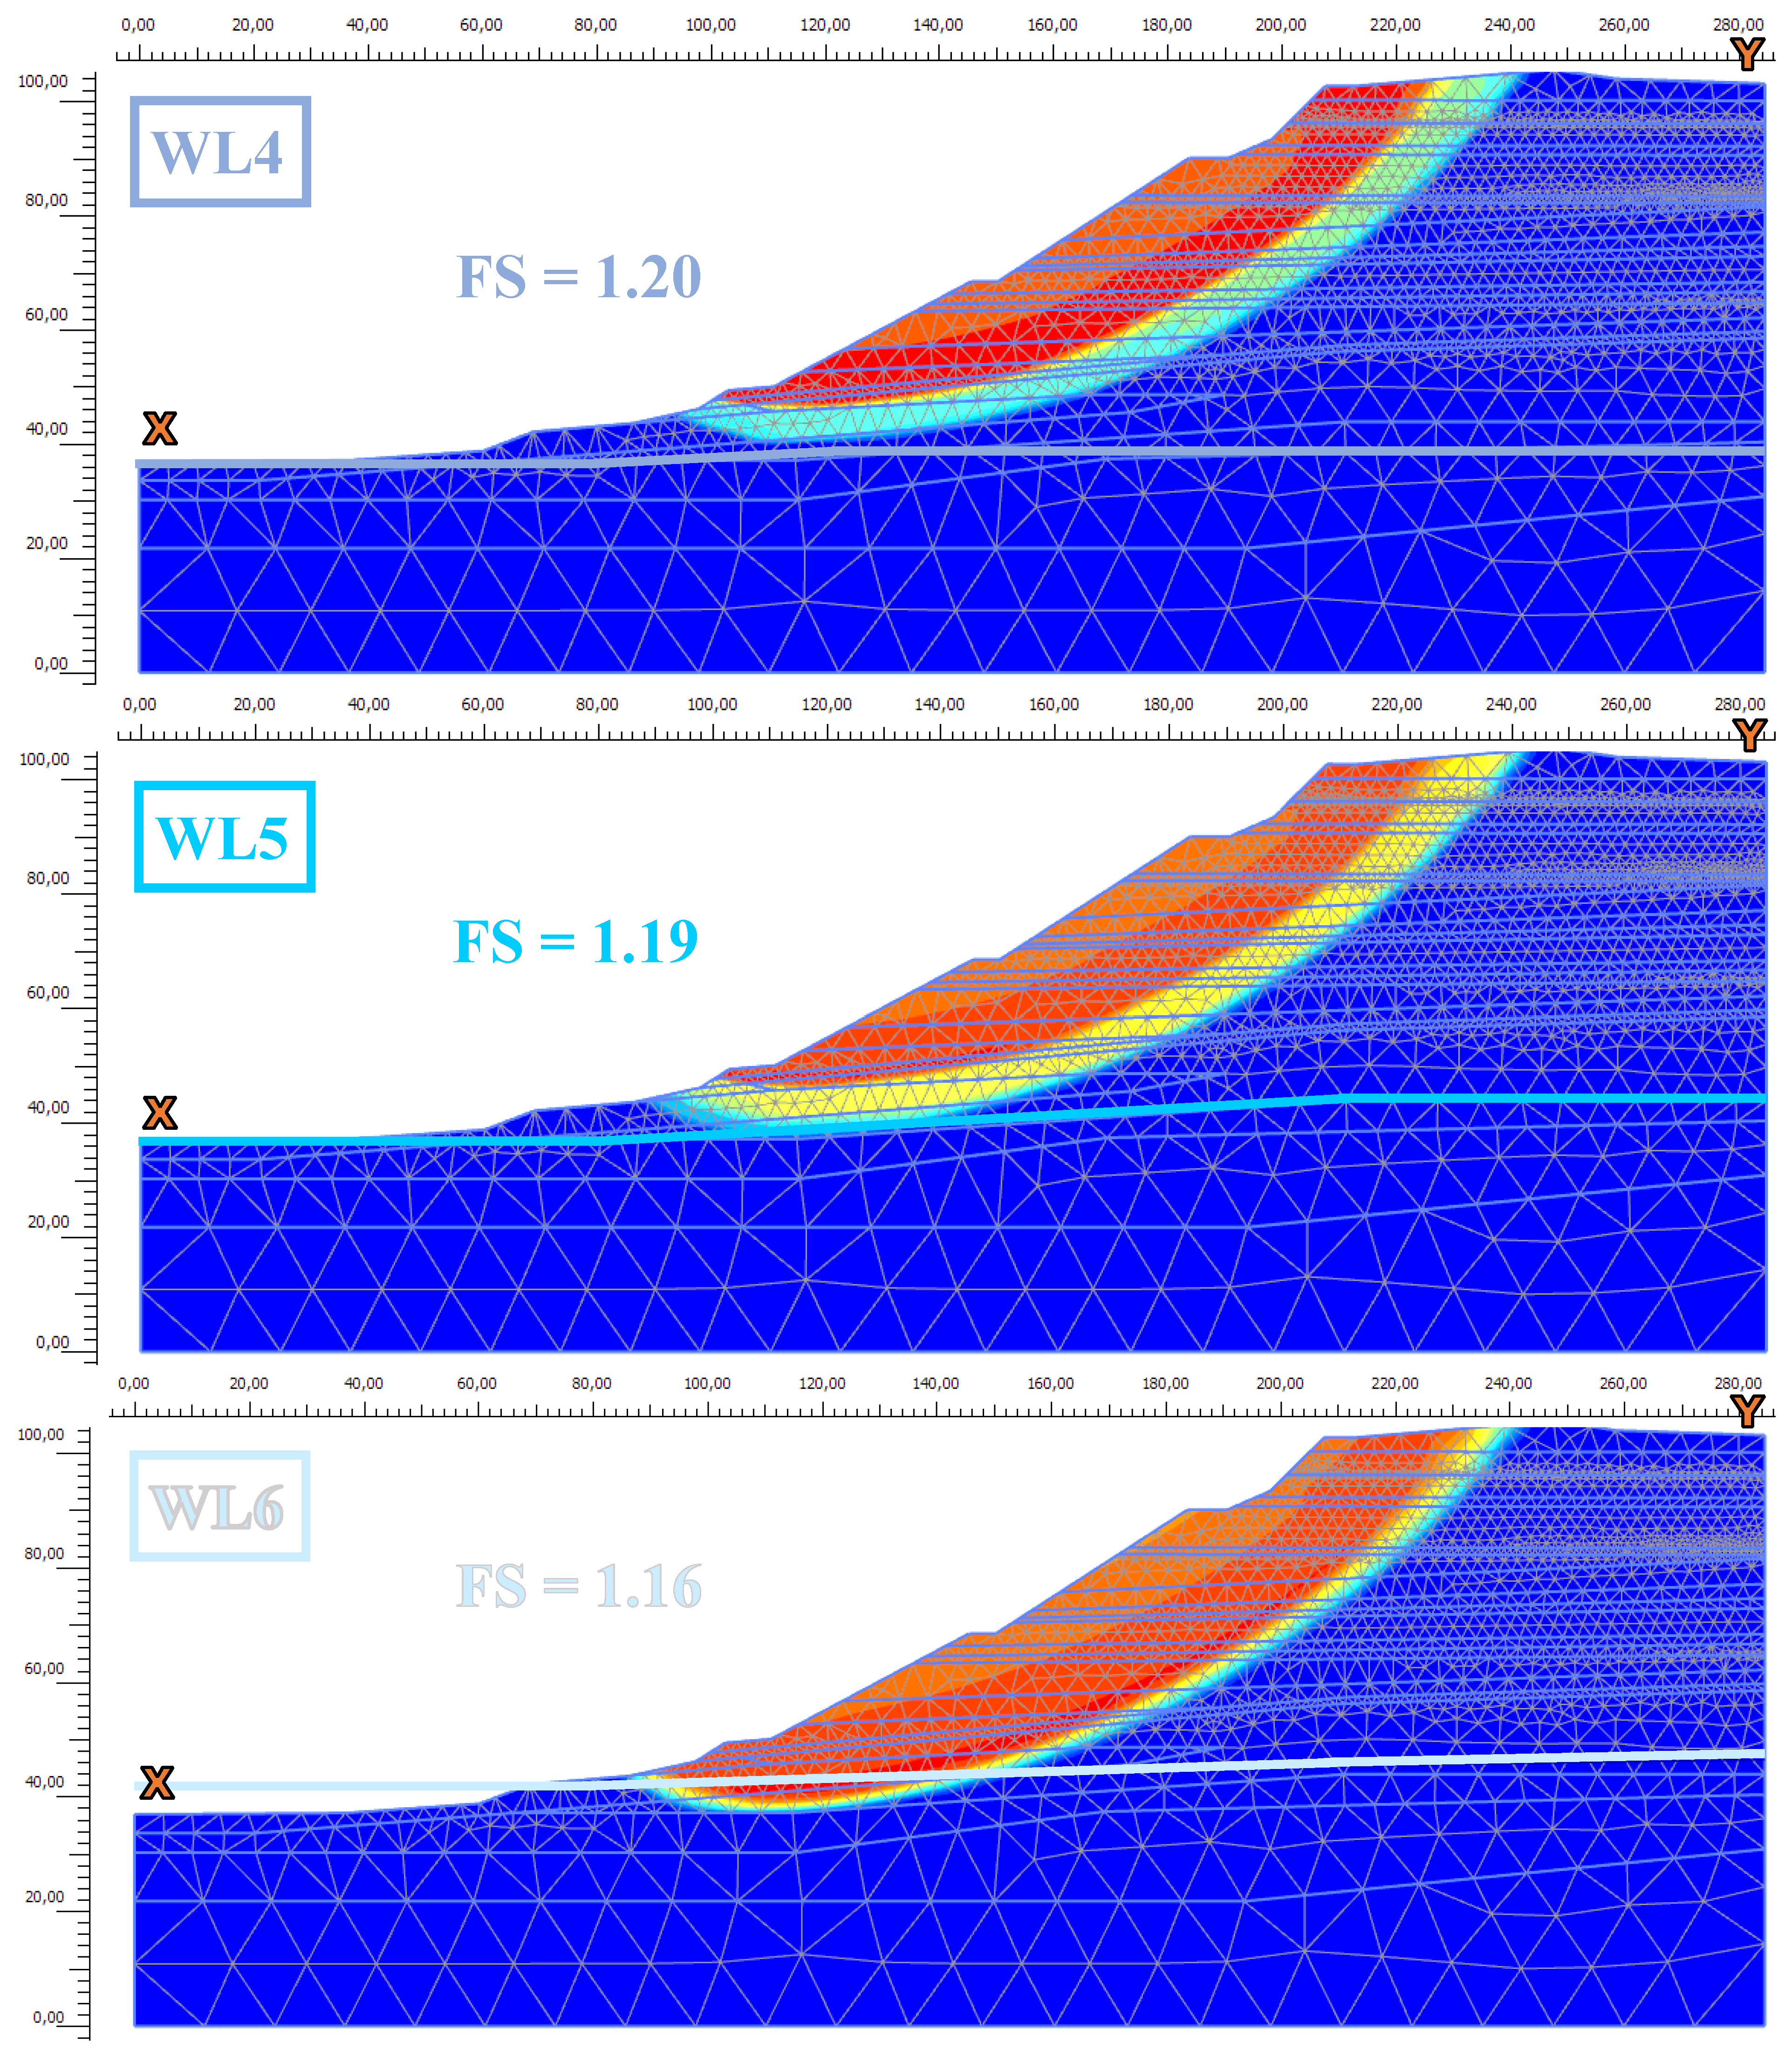
In the Plaxis software, the safety factor began to decrease only with the extreme water-level rise (WL6, WL7). The colors of the maximum displacement plots (Figure 13) indicate the amount of displacement: the dark blue areas indicate zero displacement, and the red areas show the maximum displacements at the time of failure. The typical rotational landslide movement of the high banks of Lake Balaton now has two slump blocks shown on the Plaxis result graphs: a red main body, and a slimmer, deeper block, the displacement of which increases with the water level: WL1–L4—light blue, WL5—yellow and finally WL6 and WL7—red zone.
The complex slip surface seen in Plaxis was previously identified by [28] in connection with the 1908 collapse, which led to the redesign of the railway line.
Overall, we found that the risk of deep slides in the area increases from when the lake level is higher than 104.7 asl and when the water table is higher than 105.4 asl (in P4 piezometer) and 106.8 asl (in P3 piezometer). It also increases the pore water pressures of the sliding-prone beds. We define this as a ’notification water level’, which means that at higher water levels, the probability of failure increases above the recommended level (<1) for slopes, and the safety factor decreases below 1.2. This water level was reached in February–March 2020, leading to a deformation that was detected in the inclinometer of IC1 in the lower part of the slope.
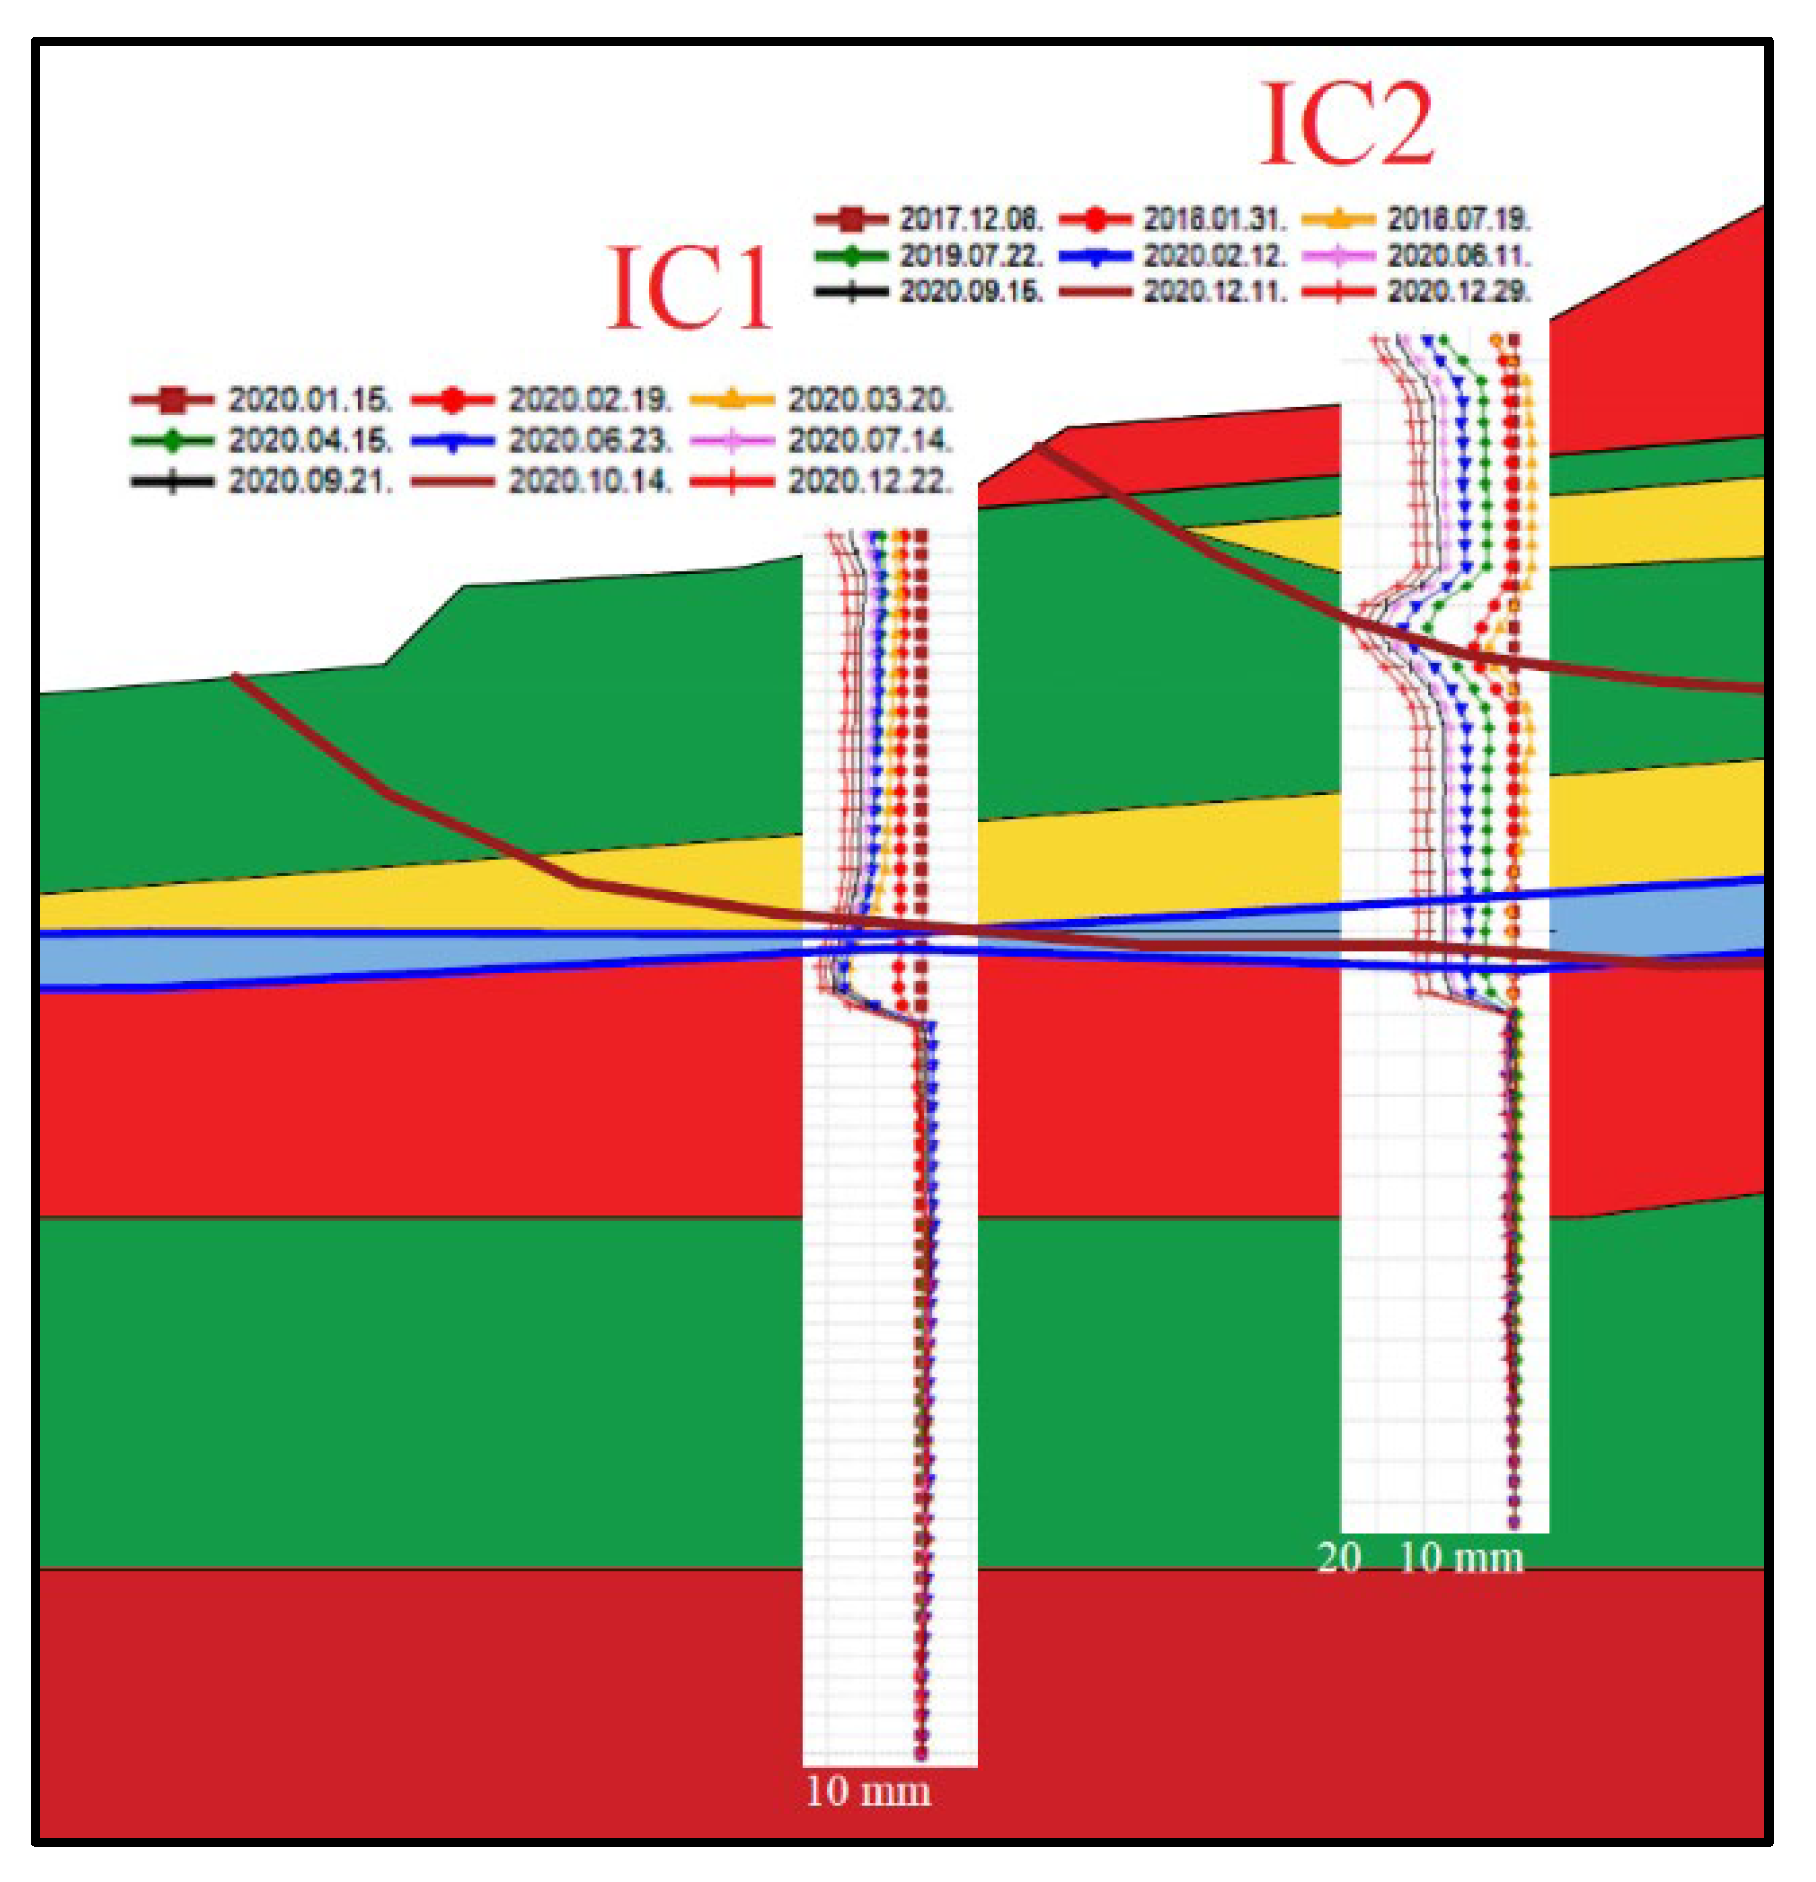
4.3. Comparing the Results of Movement Monitoring and Modeling
The IC1 inclinometer in the slope in the month of March (during the 2020 maximum water level and highest pore-water-pressure values) showed a visible downslope deformation at the surface of the clay layer, where the high water content reduced the shear strength. In the IC2 inclinometer, in addition to this displacement plane, slowly increasing displacement curves were also formed along the crest of a previous movement that had been recorded in the borehole logs between summer 2017 and summer 2020. The maximum measured displacement was around 18 mm, which stopped increasing in 2020–2021 and stabilized. The small displacement peaks seen on inclinometers can be found and identified in the peak clusters of the probabilistic calculation (Figure 14 and Figure 15). Hence, at water levels above the specified ’notification water level’ there is a serious risk of acceleration of slow intermittent movement. It is evidenced by the displacement curves of the inclinometers installed in the debris slope. An example clearly justifies this assumption, since during the February–March 2020 a maximum water level and pore water pressure, and an acceleration of movement was observed along the same slip surfaces that was modeled. With a decrease in water level, the slowing down and stabilization of the movement is observed. Over the long term, the alternations of suspended and reactivated phases are recorded [22].
Landslides commonly occur after heavy rainfall worldwide [1]. In fact, traces of these local slips were also observed on the ground in the study area. Similar examples were also reported for landslides that occurred when the rainfall intensity reached it peak [69,70]. As the lake level rises over time and pore water pressure increases in the deeper layers, mass movement can occur along with deeper global slides. This is facilitated by the mixed materials of the previous movements eroded at the bottom of the slope and the torrential effect on the water table. One study found that such a dramatic change in surface–groundwater interactions was due to quick surface-water recession and delayed groundwater response [71]. Groundwater drawdown can protect the slopes from further deterioration and can maintain the slope stability at an acceptable and satisfactory level [72]. The Plaxis models do not achieve the safety factor of 1.35 required by the international geotechnical standard Eurocode7 at any water level. Indeed, groundwater models are extremely complex in reality [73], and it is difficult to implement these results in a slope-stability analysis.
The literature [48] has warned that active landslides (usually with low velocities) are often controlled by groundwater-level fluctuations, and that movements are generally concentrated in a defined shear zone. These landslides are usually triggered by rising groundwater levels, and the falling groundwater levels reduce the landslide velocity until the unstable ground mass comes to rest. We have observed the same phenomenon. According to the Surface Movement Cadastre of Hungary, the area is also in motion, namely periodic slumping or intermitant sliding. During field inspection, we saw trees with curved trunks on the slope, which is a characteristic of creep and it is possible that a section of concrete retaining wall at the foot of the slope was cracked, potentially caused by the slow global movement. Similar to previous studies [74], appropriate monitoring methods could be used to detect precursors of landslides and thereby enable landslide prewarning.
5. Conclusions
In the present case study, a section of an active landslide area at the high bank of the eastern basin of Lake Balaton was analyzed using annual ground-movement-monitoring data, groundwater-porewater pressure-precipitation lake-water-level-monitoring systems, and both deterministic FEM and probabilistic LEM geotechnical models under varying water levels.
The study revealed that the entire shore is in slow, intermittent movement. Rainy seasons can induce small-scale slumps around the shoreline by soaking the near-surface layers. The top of the slope failures are not influenced by groundwater level; erosional processes trigger these motions. These are induced by rain, as evidenced by the inclinometers’ maximum displacement values at the top of the shoreline. The largest displacements were recorded after the wet summer. According to the results of modeling and monitoring, we defined a ’notification water level’, which means that at higher water levels, the probability of failure increases above the recommended level (<1) for slopes including important infrastructure, and the safety factor decreases below 1.2.
The modeled results are in good agreement with the monitoring data of the site as well as historical observations. Based on these results, it is possible to develop a motion-prediction system for the high banks of the eastern basin of Lake Balaton. In this system, a ‘notification water level’ of the water table is given for different characteristic layers, and through further analysis, it is possible to outline how long and to what extent the precipitation influences the rise of the water level, leading to a risk of movement.
Author Contributions
Conceptualisation, Á.T. and F.K.N.-G.; methodology, Á.T. and F.K.N.-G.; software, F.K.N.-G.; validation, Á.T., formal analysis F.K.N.-G.; resources, F.K.N.-G. and Á.T.; data curation, Á.T.; writing—original draft preparation, F.K.N.-G. and Á.T.; writing—review and editing, Á.T. and F.K.N.-G; visualisation, F.K.N.-G. and Á.T.; supervision, Á.T.; project administration, Á.T.; funding acquisition, Á.T. All authors have read and agreed to the published version of the manuscript.
Funding
This research was funded by The National Research Development and Innovation Office of Hungary, grant number TKP2020 BME-IKA-VIZ.
Institutional Review Board Statement
Not applicable.
Informed Consent Statement
Not applicable.
Data Availability Statement
No additional data is available, however authors can provide additional research details if requested.
Acknowledgments
The authors would like to thank Geovil ltd. and colleagues for the excavations, laboratory results, but especially for providing regular results of the monitoring system and for their professional support.
Conflicts of Interest
The authors declare no conflict of interest.
References
- Gariano, S.L.; Guzzetti, F. Landslides in a Changing Climate. Earth-Sci. Rev. 2016, 162, 227–252. [Google Scholar] [CrossRef] [Green Version]
- Polemio, M.; Lonigro, T. Trends in climate, short-duration rainfall, and damaging hydrogeological events (Apulia, Southern Italy). Nat. Hazards 2015, 75, 515–540. [Google Scholar] [CrossRef]
- Borgatti, L.; Soldati, M. Landslides as a Geomorphological Proxy for Climate Change: A Record from the Dolomites (Northern Italy). Geomorphology 2010, 120, 56–64. [Google Scholar] [CrossRef]
- Lonigro, T.; Gentile, F.; Polemio, M. The Influence of Climate Variability and Land Use Variations on the Occurrence of Landslide Events (Subappennino Dauno, Southern Italy). Rend. Online Soc. Geol. Ital. 2015, 35, 192–195. [Google Scholar] [CrossRef] [Green Version]
- Nagy-Göde, F.K.; Török, Á. Types of Landslides along Lake Balaton, Hungary. Period. Polytech. Civil. Eng. 2022, 66, 411–442. [Google Scholar] [CrossRef]
- Froude, M.J.; Petley, D.N. Global Fatal Landslide Occurrence from 2004 to 2016. Nat. Hazards Earth Syst. Sci. 2018, 18, 2161–2181. [Google Scholar] [CrossRef] [Green Version]
- Barlow, J.; Gilham, J.; Cofrã, I.I. Kinematic Analysis of Sea Cliff Stability Using UAV Photogrammetry. Int. J. Remote Sens. 2017, 38, 2464–2479. [Google Scholar] [CrossRef]
- Edil, T.B. Erosion of Coastal Slopes and Landslide. In Geo-Congress 2013: Stability and Performance of Slopes and Embankments III; Geo-Institute: San Diego, CA, USA, 2013; pp. 1320–1334. [Google Scholar] [CrossRef]
- Edil, T.; Vallejo, L. Mechanics of coastal landslides and the influence of slope parameters. Eng. Geol. 1980, 16, 83–96. [Google Scholar] [CrossRef]
- Wu, C.H.; Chen, S.C.; Feng, Z.Y. Formation, Failure, and Consequences of the Xiaolin Landslide Dam, Triggered by Extreme Rainfall from Typhoon Morakot, Taiwan. Landslides 2014, 11, 357–367. [Google Scholar] [CrossRef] [Green Version]
- Mickovski, S.B.; Santos, O.; Ingunza, M.; Breassani, L.A. Coastal Slope Instability in Contrasting Geoenvironmental. In Proceedings of the Geotechnical Engineering for Infrastructure and Development: Proceedings of the XVI European Conference on Soil Mechanics and Geotechnical Engineering; Winter, M.G., Smith, D.M., Derek, M., Eldred, P.J.L., Eds.; Institution of Civil Engineers publishing: London, UK, 2015; pp. 1801–1806. [Google Scholar]
- Catani, F.; Tofani, V.; Lagomarsino, D. Spatial patterns of landslide dimension: A tool for magnitude mapping. Geomorphology 2016, 273, 361–373. [Google Scholar] [CrossRef] [Green Version]
- Giordan, D.; Adams, M.; Aicardi, I.; Alicandro, M.; Allasia, P.; Baldo, M.; De Berardinis, P.; Dominici, D.; Godone, D.; Hobbs, P.; et al. The use of unmanned aerial vehicles (UAVs) for engineering geology applications. Bull. Eng. Geol. Environ. 2020, 79, 3437–3481. [Google Scholar] [CrossRef] [Green Version]
- Utili, S.; Crosta, G.B. Analysis Tools for Mass Movement Assessment. In Landslide Hazards, Risks and Disasters; Shroder, J.F., Davies, T., Eds.; Elsevier: Amsterdam, The Netherlands, 2015; pp. 441–465. [Google Scholar]
- Kordić, B.; Lužar-Oberiter, B.; Pikelj, K.; Matoš, B.; Vlastelica, G. Integration of Terrestrial Laser Scanning and UAS Photogrammetry in Geological Studies: Examples from Croatia. Period. Polytech. Civil. Eng. 2019, 63, 989–1003. [Google Scholar] [CrossRef] [Green Version]
- Živec, T.; Anžur, A.; Verbovšek, T. Determination of rock type and moisture content in flysch using TLS intensity in the Elerji quarry (south-west Slovenia). Bull. Eng. Geol. Environ. 2019, 78, 1631–1643. [Google Scholar] [CrossRef]
- Franconi, M.; Coggan, J.S.; Eyre, M.; Staed, D. A combined field/remote sensing approach for characterising landslide risk in coastal areas. Int. J. Appl. Earth Obs. Geoinf. 2018, 67, 79–95. [Google Scholar] [CrossRef]
- Jaboyedoff, M.; Carrea, D.; Derron, M.-H.; Oppikofer, T.; Penna, I.M.; Rudaz, B. A review of methods used to estimate initial landslide failure surface depths and volumes. Eng. Geol. 2020, 267, 105478. [Google Scholar] [CrossRef]
- Vlastelica, G.; Miščević, P.; Cvitanović, N. Durability of soft rocks in Eocene flysch formation (Dalmatia, Croatia). Eng. Geol. 2018, 245, 207–217. [Google Scholar] [CrossRef]
- Auflič, M.J.; Jež, J.; Popit, T.; Košir, A.; Maček, M.; Logar, J.; Petkovšek, A.; Mikoš, M.; Calligaris, C.; Boccali, C.; et al. The variety of landslide forms in Slovenia and its immediate NW surroundings. Landslides 2017, 14, 1537–1546. [Google Scholar] [CrossRef]
- Juhász, Á. Településeket, létesítményeket veszélyeztető tömegmozgások a balatoni magaspartok mentén (Mass movements endangering human settlements and structures along the high bluff flanking lake Balaton). Földr. Közlemények 2004, 128, 19–30. (In Hungarian) [Google Scholar]
- Horváth, Z. Engineering geological evolution of the danger surface movement on the raised shorelines along lake Balaton. In Quaternary Studies in Hungary; INQUA Hungarian National Committee: Budapest, Hungary, 1982; pp. 245–253. [Google Scholar]
- Domján, J.; Pappfalvy, F. A balatonfűzfői magaspart talajmechanikai vizsgálata (Soil mechanics study of the high bank of Balatonfűzfő). Hidrol. Közlöny 1953, 33, 389–395. (In Hungarian) [Google Scholar]
- Horváth, Z. A balatoni magaspartok összehasonlító mérnökgeológiai értékelése (Comparative engineering geological assessment of the high shores of Lake Balaton). Mérnökgeológiai Szle 1984, 33, 125–143. [Google Scholar]
- Horváth, Z.; Scheuer, G. A balatonföldvári és fonyódi magaspartok állékonyságának mérnökgeológiai vizsgálata. Földt. Közlöny 1975, 105, 335–343. (In Hungarian) [Google Scholar]
- Galli, L. A dunai és balatoni magaspartok állékonyságának törvényszerűségei (The regularities of the stability of the high banks of the Danube and Lake Balaton). Hidrol. Közlöny 1952, 32, 409–415. (In Hungarian) [Google Scholar]
- Lóczy, L. A Balaton környékének geológiai képződményei. In A Balaton Tudományos Tanulmányozásának Eredményei; Magyar Földrajzi Társaság Balaton-Bizottsága: Budapest, Hungary, 1913; 618p. (In Hungarian) [Google Scholar]
- Kézdi, Á. A Balaton északkeleti peremén bekövetkező mozgások vizsgálata (Examination of movements on the northeastern edge of Lake Balaton). Hidrológ. Közlöny 1952, 32, 403–408. (In Hungarian) [Google Scholar]
- Kenesei, J.; Marokházi, G.; Nagy, J. Mozgásveszélyes Duna-menti és Balaton parti magaspartok veszélyelháritási munkáinak tanulmányterve. Kézirat 2005, 71, 68. (In Hungarian) [Google Scholar]
- National Surface Movement Cadastre of Hungary. Available online: https://mbfsz.gov.hu/hatosagi-ugyek/nyilvantartasok/orszagos-felszinmozgas-kataszter (accessed on 5 June 2021).
- Online Landslide Hazard Map of Hungary. Available online: https://map.mbfsz.gov.hu/FDT_veszely_orszag/ (accessed on 5 June 2021).
- Radvánszky, R.; Csilléry, B. Harc a Löszfallal Balatonakarattyán. Sínek Világa 2010, 4, 18–20. [Google Scholar]
- Bentley Plaxis 2D (2021) Version 21.01.00.479 Finite Element Slope Stability Analysis, Dublin, Ireland.
- Rocscience Slide2 Modeler 2D Limit Equilibrium Analysis for Slopes Version: 9.010 64-bit, Toronto, ON, Canada.
- Bazin, S. Guidelines for landslide monitoring and early warning systems in Europe, Design and required technology, Project SafeLand “Living with Landslide Risk in Europe: Assessment, Effects of Global Change, and Risk Management Strategies”. 2012. Available online: https://www.ngi.no/eng/Projects/SafeLand (accessed on 20 November 2017).
- Calvello, M. Early warning strategies to cope with landslide risk. Riv. Ital. Geotec. 2017, 2, 63–91. [Google Scholar] [CrossRef]
- Krøgli, I.; Devoli, G.; Colleuille, H.; Sund, M.; Boje, S.; Engen, I.K. The Norwegian Forecasting and Warning Service for Rainfall- and Snowmelt-Induced Landslides. Nat. Hazards Earth Syst. Sci. 2017, 18, 1427–1450. [Google Scholar] [CrossRef] [Green Version]
- Cholnoky, J. Balaton (Lake Balaton); Franklin: Budapest, Hungary, 1936; 137p. (In Hungarian) [Google Scholar]
- Sztanó, O.; Magyar, I.; Szónoky, M.; Lantos, M.; Müller, P.; Lenkey, L.; Katona, L.; Csillag, G. A Tihanyi Formáció a Balaton környékén: Típusszelvény, képződési körülmények, rétegtani jellemzés (Tihany Formation in the surroundings of Lake Balaton: Type locality, depositional setting and stratigraphy). Földt. Közlöny 2013, 143, 73–98. (In Hungarian) [Google Scholar]
- Sztanó, O.; Magyar, I.; Müller, P.; Katona, L.; Babinszki, E.; Magyari, Á. Sedimentary cycles near the coast of Lake Pannon, Late Miocene, Hungary. In Proceedings of the 12th RCMNS Congress: Patterns and Processes in the Neogene of the Mediterranean Region, Universität Wien, Wien, Austria, 6–11 September 2005; pp. 227–230. [Google Scholar]
- Koroknai, B.; Wórum, G.; Tóth, T.; Koroknai, Z.; Fekete-Németh, V.; Kovács, G. Geological deformations in the Pannonian Basin during the neotectonic phase: New insights from the latest regional mapping in Hungary. Earth-Sci. Rev. 2020, 211, 103411. [Google Scholar] [CrossRef]
- Surface Geological Map of Hungary 1:100 000. Available online: https://map.mbfsz.gov.hu/fdt100/ (accessed on 5 June 2021).
- Surface Geological Map of Hungary 1:500 000. Available online: https://map.mbfsz.gov.hu/fdt500/ (accessed on 5 June 2021).
- Nagy-Göde, F. A balatonakarattyai magaspart állékonyságának elemzése. In Mérnökgeológia új eredményei; Török, Á., Ed.; Magyarhoni Földtani Társulat: Budapest, Hungary, 2020; pp. 75–92. ISBN 978-963-8221-78-0. [Google Scholar]
- Kápolnainé Nagy-Göde, F.; Török, Á. The Probabilistic Analysis of Steep Lakeside Slopes; Geotechnical-Geological-Hydrogeological Constraints and Numerical Analysis, an Example from Hungary. In Proceedings of the Rocscience International Conference: The Evolution of Geotech—25 Years of Innovation; Reginald, E.H., Thamer, E.Y., Alison, M., John, C., Eds.; CRC Press Taylor & Francis Group: Boca Raton, FL, USA, 2021; pp. 465–474. [Google Scholar]
- Nagy-Göde, F.; Török, Á.; Horváth-Kálmán, E. The Stability Analysis of a Steep Slope at a Lake; Hungary. In Proceedings of the 6th International Conference on Geotechnical and Geophysical Site Characterisation—ISC6, Budapest, Hungary, 26–29 September 2021; pp. 1–6. [Google Scholar]
- Kápolnainé Nagy-Göde, F.; Török, Á. A Balatonakarattya-Balatonfűzfő Közötti Vasúti Pályaszakasz Állékonysága, a Magaspart Vonulat Csapadék-Elmozdulás Összefüggései a 20. Században (The Stability of the Railway Section between Balatonakarattya and Balatonfűzfő, Correlations of Precipitation and Displacement of the High Shores in the 20th Century). In Proceedings of the XXV. Nemzetközi Építéstudományi Konferencia—ÉPKO, Online, 5 June 2021; pp. 86–91. [Google Scholar]
- Ciampalini, A.; Farina, P.; Lombardi, L.; Nocentini, M.; Taurino, V.; Guidi, R.; Pina, F.; Tavarini, D. Integration of Satellite Insar with a Wireless Network of Geotechnical Sensors for Slope Monitoring in Urban Areas: The Pariana Landslide Case (Massa, Italy). Remote Sens. 2021, 13, 2534. [Google Scholar] [CrossRef]
- Segalini, A.; Carri, A.; Grignaffini, C.; Capparelli, G. Formulation of Landslide Risk Scenarios Using Underground Monitoring Data and Numerical Models: Conceptual Approach, Analysis, and Evolution of a Case Study in Southern Italy. Landslides 2019, 16, 1043–1053. [Google Scholar] [CrossRef]
- Barla, G.; Antolini, F.; Barla, M. Slope Stabilization in Difficult Conditions: The Case Study of a Debris Slide in NW Italian Alps. Landslides 2013, 10, 343–355. [Google Scholar] [CrossRef]
- Conte, E.; Donato, A.; Troncone, A. A Simplified Method for Predicting Rainfall-Induced Mobility of Active Landslides. Landslides 2017, 14, 35–45. [Google Scholar] [CrossRef]
- Leroueil, S.; Vaunat, J.; Picarelli, L.; Locat, J.; Faure, R.; Lee, H. A geotechnical characterisation of slope movements. In Proceedings of the 7th International Symposium on Landslides, Trondheim, Norway, 17–21 June 1996; Volume 1, pp. 53–74. [Google Scholar]
- Zhou, Y.; Qi, S.C.; Fan, G.; Chen, M.L.; Zhou, J.W. Topographic Effects on Three-Dimensional Slope Stability for Fluctuating Water Conditions Using Numerical Analysis. Water 2020, 12, 615. [Google Scholar] [CrossRef] [Green Version]
- Chen, Z.; Lin, X.; Xiong, C.; Chen, N. Modeling the Relationship of Precipitation and Water Level Using Grid Precipitation Products with a Neural Network Model. Remote Sens. 2020, 12, 1096. [Google Scholar] [CrossRef] [Green Version]
- Yeh, H.F.; Tsai, Y.J. Analysing the Effect of Soil Hydraulic Conductivity Anisotropy on Slope Stability Using a Coupled Hydromechanical Framework. Water 2018, 10, 905. [Google Scholar] [CrossRef] [Green Version]
- Rong, G.; Alu, S.; Li, K.; Su, Y.; Zhang, J.; Zhang, Y.; Li, T. Rainfall Induced Landslide Susceptibility Mapping Based on Bayesian Optimized Random Forest and Gradient Boosting Decision Tree Models—a Case Study of Shuicheng County, China. Water 2020, 12, 3066. [Google Scholar] [CrossRef]
- Long, N.T.; de Smedt, F. Analysis and Mapping of Rainfall-Induced Landslide Susceptibility in A Luoi District, Thua Thien Hue Province, Vietnam. Water 2018, 11, 51. [Google Scholar] [CrossRef] [Green Version]
- Castro, J.; Asta, M.P.; Galve, J.P.; Azañón, J.M. Formation of Clay-Rich Layers at the Slip Surface of Slope Instabilities: The Role of Groundwater. Water 2020, 12, 2639. [Google Scholar] [CrossRef]
- Conte, E.; Troncone, A. A Method for the Analysis of Soil Slips Triggered by Rainfall. Geotechnique 2012, 62, 187–192. [Google Scholar] [CrossRef]
- Troncone, A.; Pugliese, L.; Lamanna, G.; Conte, E. Prediction of Rainfall-Induced Landslide Movements in the Presence of Stabilising Piles. Eng. Geol. 2021, 288, 106143. [Google Scholar] [CrossRef]
- Ozbay, A.; Cabalar, A.F. FEM and LEM stability analyses of the fatal landslides at Çöllolar open-cast lignite mine in Elbistan, Turkey. Landslides 2015, 12, 155–163. [Google Scholar] [CrossRef]
- Nguyen, L.C.; Van Tien, P.; Do, T.-N. Deep-seated rainfall-induced landslides on a new expressway: A case study in Vietnam. Landslides 2020, 17, 395–407. [Google Scholar] [CrossRef]
- Dawson, E.M.; Roth, W.H.; Drescher, A. Drescher Slope Stability Analysis by Strength Reduction. Géotechnique 1999, 49, 835–840. [Google Scholar] [CrossRef]
- Shafiee, A.H.; Falamaki, A.; Shafiee, A.; Arjmand, F. Probabilistic analysis of an 80,000 m2 landslide in Shiraz, Iran. Landslides 2022, 19, 659–671. [Google Scholar] [CrossRef]
- Gibson, W. Probabilistic Methods for Slope Analysis and Design. Aust. Geomech. 2011, 46, 29. [Google Scholar]
- Adams, B.M. Slope Stability Acceptance Criteria for Opencast Mine Design. In Proceedings of the 12th Australia New Zealand Conference on Geomechanics; Graham, R., Ed.; New Zealand Geotechnical Society: Wellington, Switzerland, 2015; pp. 916–923. [Google Scholar]
- Acciaro, M.D. Probabilistic Regional Landslide Hazard Assessment for the Enguri dam (Jivari, Georgia) Open Access. Master’s Thesis, Michigan Technological University, Houghton, MI, USA, 2018. [Google Scholar] [CrossRef]
- Hadjigeorgiou, J.; Kyriakou, E.; Papanastasiou, P. A road embankment failure near Pentalia in Southwest Cyprus, The South African Institute of Mining and Metallurgy. Int. Symp. Stab. Rock Slopes Open Pit Min. Civil. Eng. 2006, 10. [Google Scholar]
- Tsai, P.-H.; Feng, Z.-Y.; Yu, F.-C.; Lin, J.-H. Stability Analysis of Landslide Dam under Rainfall. IACGE 2013, 515–522. [Google Scholar]
- Tsou, C.Y.; Feng, Z.Y.; Chigira, M. Catastrophic Landslide Induced by Typhoon Morakot, Shiaolin, Taiwan. Geomorphology 2011, 127, 166–178. [Google Scholar] [CrossRef] [Green Version]
- Li, A.; Tsai, F.T.C. Understanding Dynamics of Groundwater Flows in the Mississippi River Delta. J. Hydrol. 2020, 583, 124616. [Google Scholar] [CrossRef]
- Lin, D.G.; Chang, K.C.; Ku, C.Y.; Chou, J.C. Three-Dimensional Numerical Investigation on the Efficiency of Subsurface Drainage for Large-Scale Landslides. Appl. Sci. 2020, 10, 3346. [Google Scholar] [CrossRef]
- Pham, H.V.; Tsai, F.T.-C. Modélisation de Systèmes Aquifères Complexes: Cas d’étude à Baton Rouge, Louisiane (Etats-Unis d’Amérique). Hydrogeol. J. 2017, 25, 601–615. [Google Scholar] [CrossRef]
- Feng, Z.Y.; Chen, S.H. Discussions on Landslide Types and Seismic Signals Produced by the Soil Rupture Due to Seepage and Retrogressive Erosion. Landslides 2021, 18, 2265–2279. [Google Scholar] [CrossRef]
Figure 1.
The location of the study area (Google Earth Pro Application).


Figure 3.
Site plan of the study area with landslide-hazard areas (marked by black lines) according to National Surface Movement Cadastre of Hungary [30] and the location of core drillings, inclinometers and piezometers.
Figure 3.
Site plan of the study area with landslide-hazard areas (marked by black lines) according to National Surface Movement Cadastre of Hungary [30] and the location of core drillings, inclinometers and piezometers.

Figure 4.
X–Y cross section with core drillings and Casagrande piezometers.

Figure 5.
Casagrande piezometers (P1–P4) with measured water levels (legend: WUP—water under pressure, i.e., the level where water was first detected at the time of drilling; PWT—piezometric water table; and MPWP—measured pore water pressures).
Figure 5.
Casagrande piezometers (P1–P4) with measured water levels (legend: WUP—water under pressure, i.e., the level where water was first detected at the time of drilling; PWT—piezometric water table; and MPWP—measured pore water pressures).

Figure 6.
Soil parameters applied in the models.

Figure 7.
The development of lake-water level, pore water pressures and rainfall in the area during 2020.
Figure 7.
The development of lake-water level, pore water pressures and rainfall in the area during 2020.

Figure 8.
Graphs of monthly maximum displacements measured by inclinometers and monthly rainfall (a) B direction displacements of inclinometer IC3 and monthly rainfall (b) B direction displacements of inclinometer IC4 and monthly rainfall.
Figure 8.
Graphs of monthly maximum displacements measured by inclinometers and monthly rainfall (a) B direction displacements of inclinometer IC3 and monthly rainfall (b) B direction displacements of inclinometer IC4 and monthly rainfall.

Figure 9.
Probability of failure (POF) by Bishop and Janbu simplified methods for different modeled water levels.
Figure 9.
Probability of failure (POF) by Bishop and Janbu simplified methods for different modeled water levels.

Figure 10.
Janbu simplified, complex shaped slides from Rocscience Slide2 software. (a) Results for WL3 modeled water level, considering the minimum values of water levels measured in 2020; (b) Results for WL4 modeled water level, taking into account the maximum values of water levels measured in 2020.

Figure 11.
Bishop simplified sliding surfaces with safety factor less than 1.35 from Slide2 software. (a) Results for WL3 modeled water level, considering the minimum values of water levels measured in 2020; (b) Results for WL4 modeled water level, taking into account the maximum values of water levels measured in 2020.

Figure 12.
The change in safety factor as a result of the different modeled water levels in Plaxis and Rocscience (Bishop and Janbu simplified) software.
Figure 12.
The change in safety factor as a result of the different modeled water levels in Plaxis and Rocscience (Bishop and Janbu simplified) software.

Figure 13.
Results of Plaxis software: shape of failure mechanism and safety factor for three different modeled water levels (WL4: maximum values of water levels measured in 2020; WL5: maximum lake-water level ever and congested waters; WL6: extra high water level 1).
Figure 13.
Results of Plaxis software: shape of failure mechanism and safety factor for three different modeled water levels (WL4: maximum values of water levels measured in 2020; WL5: maximum lake-water level ever and congested waters; WL6: extra high water level 1).

Figure 14.
Slip surfaces of the model results and IC1 and IC2 displacements.

Figure 15.
Displacements of IC1 and IC2 inclinometers with soil layers and sliding surfaces of the model result.
Figure 15.
Displacements of IC1 and IC2 inclinometers with soil layers and sliding surfaces of the model result.

Publisher’s Note: MDPI stays neutral with regard to jurisdictional claims in published maps and institutional affiliations. |
© 2022 by the authors. Licensee MDPI, Basel, Switzerland. This article is an open access article distributed under the terms and conditions of the Creative Commons Attribution (CC BY) license (https://creativecommons.org/licenses/by/4.0/).
Share and Cite
MDPI and ACS Style
Nagy-Göde, F.K.; Török, Á. Rainfall-Induced or Lake-Water-Level-Controlled Landslide? An Example from the Steep Slopes of Lake Balaton, Hungary. Water 2022, 14, 1169. https://doi.org/10.3390/w14071169
AMA Style
Nagy-Göde FK, Török Á. Rainfall-Induced or Lake-Water-Level-Controlled Landslide? An Example from the Steep Slopes of Lake Balaton, Hungary. Water. 2022; 14(7):1169. https://doi.org/10.3390/w14071169
Chicago/Turabian StyleNagy-Göde, Fruzsina Kápolnainé, and Ákos Török. 2022. "Rainfall-Induced or Lake-Water-Level-Controlled Landslide? An Example from the Steep Slopes of Lake Balaton, Hungary" Water 14, no. 7: 1169. https://doi.org/10.3390/w14071169
Note that from the first issue of 2016, this journal uses article numbers instead of page numbers. See further details here.