
Investigation of Gender-Differentiated Impacts of Water Poverty on Different Livelihood Groups in Peri-Urban Areas around Dhaka, Bangladesh


1
South Asian Water (SAWA) Leadership Program on Climate Change, Institute of Water and Flood Management, Bangladesh University of Engineering and Technology, Dhaka 1000, Bangladesh
2
Urban and Rural Planning Discipline, Khulna University, Khulna 9208, Bangladesh
3
Institute of Water and Flood Management, Bangladesh University of Engineering and Technology, Dhaka 1000, Bangladesh
*
Author to whom correspondence should be addressed.
Water 2022, 14(7), 1167; https://doi.org/10.3390/w14071167
Submission received: 14 March 2022
/
Revised: 28 March 2022
/
Accepted: 30 March 2022
/
Published: 6 April 2022
(This article belongs to the Special Issue Advance in Water Management and Water Policy Research)
Abstract
:The concept of water poverty integrates water stress, access to safe water and sanitation, socioeconomic capacity, water uses and environmental aspects. This study presents a new concept to demonstrate gender-differentiated impacts of water poverty for different livelihood groups in a peri-urban setting. The objective is to identify how gender and livelihood groups are affected by dynamic water poverty. A few peri-urban areas around Dhaka city were selected as the study area, and male and female industrial workers, small-scale male and female farmers, and economically inactive women were the target groups. Data were collected through a questionnaire survey of 220 respondents and using a number of participatory appraisal tools, such as focus group discussions, and semi-structured and key-informant interviews. Water poverty was assessed by its five components: resource, access, capacity, use and environment. Peri-urban water poverty is found not only to be limited to scarcity, or physical availability, of water resources, but also to encompass political, social, economic and institutional dimensions. The study found that inadequate availability and quality of water, restricted access and use, poor socioeconomic capacity and fragile environment affected every livelihood group, but these factors eventually led to extreme impoverishment for adolescent girls, and physically challenged and elderly women. Suggestions are provided as to how gender issues of water can be balanced at different levels to make water management decisions gender-sensitive.
1. Introduction
Water is considered as the center of life and livelihoods in rural areas of Bangladesh [1]. Water also plays a major role in human well-being, as well as in economic activities, particularly in agricultural and industrial sectors [2]. High population density, unplanned change in land use, decreasing surface and groundwater levels, unacceptable quality of water and other water issues have added extra stresses on water resources [1,2,3]. The impacts of these stresses fall disproportionately on marginalized groups of society, especially on women and children, as they are regarded as the water managers at household level [1,4,5,6,7,8,9]. Daily struggle for water collection is one of the terrible burdens on women and young girls, who spend a considerable amount of time fetching water over long distances [5,6,10,11]. Women’s duties of providing water at a household level negatively impact their participation in other household activities, as well as in the formal labor market and income-generating activities [1,4,6,7,8,12], and thus hamper their productivity. Meanwhile, the water sector is mostly male dominated, from engineers responsible for designing irrigation systems and farmers responsible for selecting cropping patterns, to upper class/elderly men who decide on the location of canals, tube wells, pumps and other water systems at all scales [13,14]. On the other hand, women have little or no contribution to water provision decisions [14,15]. Men and women should have equal rights to water without discrimination [7]. Hence, concerns about the gender-differentiated impact of water issues need attention in water resources planning for gender-inclusive water management [1]. Gender is a basic axis of social differentiation. Gender is not simply about men and women but defines the way behavior, roles and responsibilities are shaped by the process of socialization which begins from birth and is mediated by different institutions, including schools, the family, organizations, and cultural and religious practices [16,17].
When sources of water are unaffordable or have inferior quality, or there is restricted access to use this water, many poor and marginalized groups suffer a lot. Insufficient and unsafe water means constant suffering from water-borne diseases. In developing countries, hospital beds are mostly occupied by people suffering from water-related diseases. An estimated 443 million school days are lost each year from water-related illness [18]. Women are generally responsible for all tasks involving water, such as cooking, cleaning, laundry, bathing children and cattle, and caring for sick family members [19]. So, water-related illness leads to loss of time, and of educational and employment opportunities for women and young girls. Low incomes and limited access to water also mean choosing whether to pay for water, food, school fees, or medicines [20].
These issues are more prominent in peri-urban areas, due to their disproportionate share of environmental burdens [21,22]. Not everyone is equally exposed to environmental burdens, such as toxic waste facilities, waste dumping, odor issues and other sources of environmental pollution. In peri-urban areas, disadvantaged and marginalized groups bear a greater burden related to water collection and health problems that result from exposure to waste and pollution. The definition of ‘peri-urban’ area varies according to different circumstances in different ways, namely, to denote a place, a concept or a process [23,24]. A peri-urban area is considered to be an extension of a city or a part of an adjacent rural area [25]. The peri-urbanization process can be understood as a concept that describes an interface between three systems: namely, the agricultural system, the urban system, and the natural resource system [22]. A distinguishing characteristic of peri-urban livelihoods is the role of both rural and urban resources in maintaining household water security [26]. A growing number of migrant households, who move towards the city area, continue to engage in the agricultural sector along with the formal or informal urban employment sector, on a more or less regular basis, maintain their mental and socio-cultural links with rural ‘homes’, and even support urban settlers with their rural asset bases as sources of income, giving rise to a phenomenon of what Kruger calls the ‘ruralization of cities’ [27]. Multiple income generation opportunities are there for poor peri-urban women who do not have access to sufficient cash to guarantee access to the basic needs of life [23]. In the peri-urban areas of Khulna, Bangladesh, rapid urbanization, industrialization and land use change adversely affected water availability and access for the communities [28], leading to competition and conflict over water [29]. In Manikganj district, urban land use increased by 4% from 1989 to 1999 and 8% from 1999 to 2009. This rapid change in land use led to a significant decrease in the area of agriculture, water surface, bare land and vegetation cover [30]. All surface and groundwater samples of Singair Upazila (sub-district) exceeded the Bangladesh standard value (0.05 mg/L) for arsenic concentration [31].
Peri-urban residents differ in their adaptive capacity as well as resilience, which is shaped in large part by their ability to mobilize social relationships, access to urban assets, linkages with the urban centers, and access to technologies. Peri-urban spaces face unique water governance challenges too [32]. They are also marked by environmental degradation, marginalization, lack of services and regulation, informality and illegality. Basic service infrastructure groans under the pressures of peri-urban population growth. Socioeconomic heterogeneity of the peri-urban interface often leads to conflict between different groups. It is thus a challenge for most citizens to access safe and secure water [33]. Both rural and urban authorities often fail to address the needs of peri-urban communities. The most prevalent water-related challenges for peri-urban residents are water pollution due to industrial and domestic waste with the presence of iron, arsenic and manganese in water, encroachment of water bodies, and finally lack of institutions and actors in the water sector. Considering these issues, it is more challenging to ensure safe water for poor peri-urban settlements. All these water-related issues lead the peri-urban poor settlements towards water poverty. Hence, these issues need increased academic attention and acknowledgement in policy making to eradicate water poverty and ensure water sustainability. Also, acknowledging these water-related issues in the peri-urban context from a gendered lens is important to investigate the impacts of water poverty.
Water poverty is basically a measure of water scarcity, where water scarcity is evaluated by incorporating both physical scarcity of water and socioeconomic factors. Components such as water availability and accessibility, use and environmental condition are combined to estimate water scarcity [3,34]. Water scarcity is more concerned with measuring available water and its associated issues, which is related to resource availability only [35]. Water scarcity is defined as a state of insufficient water to satisfy the requirements of people and also those of the environment they live in [36]. Peri-urban water poverty is concerned not only with the physical availability of water, but also with political, social, economic and institutional dimensions [3]. In water scarcity assessment it is difficult to determine whether water is scarce, in terms of its physical availability (a supply problem), or whether it is physically available but requires more efficient handling (a demand problem) [37]. Current water scarcity assessments are mainly based on measuring water quantity, rather than water quality issues [38]. Physical estimation of water availability cannot always identify a water stress region, as with highest per-capita water availability a region or livelihood group may eventually become water-poor [39]. Water poverty does not focus explicitly on physical availability of water but it considers other important dimensions of water availability and usability, along with socio-economic factors [35,40,41]. Assessment of water poverty in a region, or for a livelihood group, can be done with a cost-effective, transparent process by calculating the Water Poverty Index (WPI) [41,42].
Globally, the impact of water poverty is differently distributed among different regions, nations, and classes of people. Water poverty has become more of an issue in the poverty of lower-class people and disadvantaged groups, especially women, as compared to men, in developing countries like Bangladesh [43].
Several studies were conducted to measure water poverty on different temporal and spatial scales [34,35,39,40,41,42,44]. Those studies focused on quantifying water poverty of different countries, regions, river basins, etc., through a standard water poverty framework that was used for all cases and all scales. Peri-urban areas have different water-related issues which need to be considered while designing the WPI framework. One study modified the existing framework to better capture peri-urban water poverty regarding some disadvantaged livelihood groups [3]. However, it did not focus on the underlying gender-based water linkages for which water poverty could be changing. Our study used this modified framework for peri-urban water poverty to calculate the index value, and also analyzed the gender-based water poverty nexus in a more comprehensive manner. Although there is growing literature on changing and diminishing access to water in peri-urban areas [41,45], efforts to analyze the impacts of this through gender lens have been very few. Several studies explored complex gender-based water interrelations considering different analytical dimensions [1,2,14,19,46]. However, they failed to cover the gender-differentiated impacts of changing access, availability, capacity and environment altogether and the geographic and spatial differentiation related to these dimensions [46]. This paper seeks to bridge this gap.
The objective of the study is to identify gender-differentiated impacts of water poverty in a peri-urban setting. Accordingly, this study seeks to address the current gap with the following research questions:
- What are the impacts of water poverty on livelihood groups and also on both men and women?
- How are these impacts shaping current vulnerabilities of particular groups?
- What are the strategies that can be adopted to cut off the gender-based water poverty nexus in a peri-urban setting?
This paper is organized as follows: Section 2 presents conceptual details on the water poverty framework, Section 3 deals with materials and methods, including information on the study area, Section 4 illustrates the results and the findings of this study, Section 5 highlights some policy recommendations, and, lastly, Section 6 presents some concluding remarks.
2. Conceptual Framework
The water poverty framework considers the full complexity of the situation, along with the smallest details [42]. Water poverty was assessed by considering its five components: Resource, Access, Capacity, Use and Environment [41]. In this study, these five components were used to evaluate the associated impacts, but the indicators were modified as per the prevailing situation in the study area and relevance to the study [3]. Table 1 presents a conventional structure of the set of indicators for determining the final index value.
Resource: This component estimated the physical availability of both surface and groundwater, considering variability and quality, as well as total amount of water [41,42]. However, these indicators were not representative for measuring livelihood groups’ resource availability. So, the indicators were modified as per the present context of the study area [3]. The Resource component denoted availability of water [41], which was understood as its physical availability through rainfall, rivers, and other water bodies in a particular region [14]. Analysis of this component demonstrated how gender and water availability were linked in the midst of peri-urban water pollution and land use changes.
Access: This component measured the extent of access to water for human use, accounting for not only the distance to a safe source, but also the time needed for collection of water for the household. Access means not simply safe water for drinking and cooking, but water for irrigating crops, or for industrial use [42]. Access to water focused on the mechanisms for water allocation and regulation of its uses, and the infrastructure (pumps, pipelines, taps, tube wells) that may support or hinder access, despite the availability of sufficient water in local water bodies or aquifers [14]. Gender and accessibility of water and sanitation were intrinsically linked.
Capacity: Capacity was interpreted in the sense of income to allow purchase of improved water, and education and health, which indicated capacity to lobby for more effective management of water resources [42]. Social and economic capacity denotes mostly the adaptability of the groups towards prevailing water poverty. This component showed how gender and poverty were shaping water poverty in the study area.
Use: The Use component denoted the ways in which water is used for different purposes, including domestic, agricultural and industrial uses [42]. This component indicated the adequacy of either irrigation or domestic water provision for a particular group. Analyzing this component, it was demonstrated how inadequate water provision was affecting gender roles and how much the degree of the impact was.
Environment: An evaluation of environmental integrity related to water and ecosystem goods and services from aquatic habitats in the area [42] attempts to capture the environmental impact of water management to ensure long-term ecological integrity. This component showed how the inhabitants were sharing disproportionate burdens of environmental stress, due to peri-urbanization.
For gender-inclusive water management, all these components and their associated indicators were further grouped into four categories: namely, physical or environmental, economic, social and political. The Resource and Environment components were combined under the physical domain. The indicators of the Capacity component were divided into two domains: namely, economic and political. The indicators of the Access and Use components fell under the social domain. All these domains were helpful in suggesting potential measures for improving the water poverty situation by following gender-inclusive water management. Figure 1 represents the conceptual framework of this study.
3. Materials and Methods
3.1. Study Area
Singair Upazila, situated in Manikganj district, has an area of 217.38 km2. It is bound by Dhamrai and Manikganj Sadar Upazilas in the north, Nawabganj Upazila in the south, Savar and Keraniganj Upazilas in the east, and Manikganj Sadar Upazila in the west. Singair Upazila is divided into one municipality and 11 unions (lowest tier of local administration) [47]. The total population of the upazila is 287,451 [48]. The main rivers are the Kaliganga and the Dhaleshwari. Among the 11 unions, a total of 5 unions, namely Bayra, Dhalla, Jamirta, Jamsha, and Saista, were selected for this study, based on their peri-urban characteristics (Figure 2).
Most of the inhabitants in the study area fall under the age group of 30 to 49 years. Agricultural farming is the main occupation in the study area, whereas the percentage of industrial workers in the Dhalla union has recently increased to a large extent due to rapid industrialization. The distribution of occupation in the study area is as follows: industrial worker - 0.98%, farmer - 42.80%, agricultural laborer - 14.04%, and wage laborer - 2.55% [49,50].
The study area offers sufficient existence of both urban and rural characteristics. These areas are located beside a large city (Dhaka), and are outside the formal urban jurisdiction and identified as zones in transition. Both agricultural and non-agricultural activities exist simultaneously, though the agricultural and rural characteristics are gradually decreasing in relation to urban landscapes. The total urban area in Singair Upazila has increased from 8.31 km2 in 2001 to 16.56 km2 in 2011 [51]. Accessibility and availability of different livelihood groups were the other important considerations in the selection of the study area. Table 2 gives a comparative profile of the study area.
The climate of the study area is tropical monsoon with hot summer and cool winter. Maximum average temperature over the year is usually observed in April (36.7 °C) and minimum average temperature in January (10.1 °C) [52]. The main source of drinking water is groundwater using tube wells. Excess extraction has caused the groundwater level to deplete at a rate of more than 1.0 m per year in the study area. Groundwater is available at around 5.3–7.6 m below the ground surface [53]. The main surface water body in the study area is the Dhaleshwari river which serves the purpose of natural drainage of storm water. Several factories are present on the banks of the river which receives their waste streams. The study area is subjected to riverine flooding with flood depth ranging from 0–0.1 m in some areas and from 0.1–0.3 m in others [54]. During the monsoon season, especially in July and August, crop loss occurs, due to heavy rainfall.
3.2. Data
Primary data was collected from 5 unions. The major disadvantaged livelihood groups, namely industrial workers (male and female), farmers (male and female) and economically inactive women, were the target groups. Workers who are currently working in garment factories, steel industries, and washing plants, with monthly average incomes less than US$100, were considered as respondents for the industrial worker group. The industrial worker group was sourced only from Dhalla union, as other unions did not have sufficient respondents from this group. In the farmer group, small-scale male farmers (0.02–1.00 ha of personal land, and also agricultural laborers working on others’ farms) [50] and women involved directly in farm activities (seeding, weeding, post harvesting) or indirectly (cooking or carrying lunch on the farms for the workers) were considered. The economically inactive women group consists of unemployed women, adolescent girls, physically challenged and elderly women who are not involved in any kind of economic activities. Adolescent girls are in the age group of 10 to 19 years [55,56] and elderly women are aged 60 years and above [7].
Primary data were collected through Focus Group Discussions (FGDs), Key Informant Interviews (KIIs) and a household questionnaire survey. A total of 17 FGDs were conducted in 5 unions with male and female members of the industrial worker group (2 FGDs in Dhalla union), the male farmer group (5 FGDs in 5 unions), women involved in agricultural activities (5 FGDs in 5 unions), and the economically inactive women group (5 FGDs in 5 unions), between October and December, 2018. 14 KIIs were conducted with Assistant and Sub-Assistant Engineers from the Department of Public Health Engineering (DPHE) in Singair Upazila, two local school teachers, 5 large farmers (1 in each union), and 5 local representatives (1 in each union), in December, 2018. Also, a total of 40 in-depth interviews with the target groups were conducted to capture the gender-differentiated impacts of water poverty. Data from the FGDs, KIIs and in-depth interviews were used to determine the gender-differentiated impacts of water poverty in the study area.
A household questionnaire survey was also conducted with 220 respondents after pretesting the questionnaire (Table 3). The sample was selected through a purposive random sampling method. According to the published tables by Glenn (1992), which provided the sample size for a given set of criteria, sample size for ±10% precision levels, 95% confidence level, sample proportion p = 0.5 and size of population >100,000 is 100 [57,58]. In this study, the total population is 131,615 (Table 2) and hence the sample size (220) is considered to be representative.
3.3. Methods
To evaluate the gender-differentiated impact of water poverty, this study followed a mixed method approach (Figure 3). Gender inequalities in the study area, due to the exacerbating water situation and peri-urban features, were identified by reviewing relevant literature and conducting reconnaissance surveys. Then, a qualitative evaluation was conducted through FGDs, KIIs and in-depth interviews with local communities, administrative officials and experts in order to portray gender-differentiated impacts in the water poverty framework. A quantitative analysis was done through a questionnaire survey to establish the overall comparative water poverty situation and to validate the qualitative results. Finally, some policy suggestions were made, based on the findings and experiences gained during the study.
3.3.1. Qualitative Assessment
The qualitative assessment was done through FGDs, KIIs and in-depth interviews. Quotations were also used to contextualize gender-differentiated impacts of water poverty. A qualitative analysis of narratives and quotations was supplemented by data from a total of 40 in-depth interviews, 17 FGDs with the target groups and 14 KIIs.
3.3.2. Quantitative Assessment
A semi-structured questionnaire survey of 220 respondents was conducted with the target groups in order to calculate the index values from 5 components of WPI, namely Resource, Access, Capacity, Use and Environment. Responses from the questionnaires were converted into numeric scores using a scale of 0 to 100 (0 = risky, 33 = poor, 67 = acceptable and 100 = fair) [3,60]. The qualitative indicators under 5 components were also rated using the same scale.
Indicators under Resource and Capacity components were grouped into some subcomponents that corresponded to major water issues. For Resource, they were surface water availability and quality, groundwater availability and quality, and rainfall pattern; for Capacity, economic and social capacity. Each subcomponent was given an equal weighting within the components to reduce sensitivity from an unequal number of indicators [61]. For the Access component, indicators were access to safe water supply (for the farmer group, this indicator was access to irrigation), and improved sanitation and healthcare facilities. For the Use component, adequacy of daily water provision and conflicts regarding water use, and for the Environment component, reduction in fish species, damage and loss due to flood or drought, crop loss, drainage facilities and reduction in vegetation cover were chosen as the indicators [3]. All the indicators were given equal weightage. The value of each component was calculated by simply taking the average of all the indicators under that component [45,61]. After calculating the values of five components, the final index was calculated by taking the mean of the five component scores, with equal weighting. An equal weighting was used instead of other weighting, such as weighting based on multivariate analysis, to make the index construction as simple as possible for the sake of community transparency [61,62,63].
The highest value of the WPI, 100, is the best situation (or the lowest possible level of water poverty), while the lowest value of 0 is the worst situation (or a more extreme case of water poverty) [44,62]. Although there were no universally accepted interpretations on WPI scores, scores were classified beforehand as: 0 to 47.9 as severe water poverty, 48 to 55.9 as high water poverty, 56 to 61.9 as medium high water poverty, 62 to 67.9 as medium low water poverty, and 68 to 100 as low water poverty [64]. Then, multiple linear regression was used to assess the ability of 11 control measures to predict WPI (Table 4). The objective is to better understand how these variables influence water poverty. Preliminary analyses were conducted to ensure that there were no violations of the assumptions of normality, linearity, multicollinearity and homoscedasticity [65,66].
4. Results
Data were collected from respondents of different genders, ages, education levels and occupations to make the survey results representative. Details of the survey respondents are given in Table 5. It is seen from the table that the age group 31–40 was the most prevalent group, and the majority of the respondents had no formal education.
According to the WPI values (Table 6), all the unions are experiencing water poverty but the severity of it is different for different unions and also for different livelihood groups. Among all the unions, Jamsha had the highest index value of 64.6, indicating that it was the most water-secured union. Bayra, with an index value of 60.7, was the next water-secured union. The Dhalla union had an index value of 51.3, which indicated that the union had high water poverty. Finally, Jamirta and Saista unions experienced severe water poverty, with index values of 46.4 and 35.4, respectively. Among the livelihood groups, the economically inactive women group faced severe water poverty with an index value of 47.5. The farmer group fell under the high water poverty class and the industrial workers faced medium water poverty. The underlying reasons, and potential impacts, of this differential water poverty are explained in the following sub-section.
4.1. Gender-Differentiated Impacts of Water Poverty
The impacts of water poverty on the livelihood groups were assessed by looking into its 5 components: namely Resource, Access, Capacity, Use and Environment. Hence, the five impact areas are: impacts related to inadequate and unacceptable resource, impacts related to inadequate access to safe water and sanitation, impacts related to poor capacity for water management, impacts related to restricted use of water, and impacts related to poor environmental condition. Different unions suffered from different levels of water poverty. Data from FGDs, KIIs and in-depth interviews with the respondents and local community assisted in interpretation of the impacts on the groups.
4.1.1. Impacts Related to Inadequate and Unacceptable Resource
The Resource component is comprised of the indicators that reflect the condition of surface water, groundwater and rainfall in the area. As per the findings, Jamsha had the highest score for Resource component (62.5), and Dhalla had the lowest score (26.6) (Figure 4a). Among the groups, the industrial workers’ score was the lowest (Figure 4b). As the industrial workers were from the Dhalla union, they suffered due to the union’s unacceptable resource quality.
Almost all the respondents in the unions reported a decrease in surface water level, indicating lower availability of water than before. The Dhalla union is situated on the bank of the Dhaleswari River. In recent times, the water of this river has become polluted to a greater extent, due to newly established tanneries by the river. Along with this, the other surface water bodies of the study area, such as ponds and small canals, remained dry in most months of the year. As a result, people of this area had to depend entirely on groundwater. One elderly woman from the Dhalla union said, “Approximately 15–20 years back, we used the river water for bathing, cleaning, and washing clothes and utensils. At present, the water quality has degraded so much that if we use this water for any of these purposes, we are prone to suffer from skin and other diseases. So, we have been using groundwater for all purposes. But, in summer, the depletion in groundwater is also a problem for us. If the ponds were full of water throughout the year, our sufferings could be reduced as we could not go to the local elites’ houses to collect water”. The quality of surface and groundwater is worst in the Dhalla union, due to pollution of the river. On the other hand, the Jamsha union is situated near the Kaliganga River and the river water is not polluted at all. The inhabitants often use this water for bathing, cooking, and washing their clothes and utensils. The farmers also use this water for irrigation purposes. Hence the reports of illness are lower than for the other unions.
Quality of water affected every group, but it particularly affected women and poor people. As women are the household managers, they have to do all water-related tasks. For this reason, if the quality of water was not good, women of every family suffered from water related skin diseases, like itches and rashes. So, the rate of occurrence of illness was higher for the female groups than for the male groups. One woman from the Saista union mentioned that she had been suffering from skin allergies (itches, rashes, etc.) frequently due to the poor quality of water. In addition, a small farmer also informed us that he had suffered from serious skin diseases during cultivation. Women are the primary caregivers of the families, and hence if any family member suffers from any disease, women are prone to take on extra physical burden and mental pressure. If the quality of water is not good, then women need to travel long distances to fetch safe and clean water. Dealing with arsenic and iron contaminated water also puts burdens on women and young girls, as they have to carry water from other safer sources. The arsenic concentrations in water samples collected from the Jamsha, Jamirta and Saista unions were 0.69, 0.27 and 0.80 mgL−1, respectively [31]. All the measured values of arsenic exceeded the Bangladesh standard value (0.05 mgL−1) and the WHO standard value (0.01 mgL−1) [67,68]. In this study, Dhalla union has the highest number of respondents reporting water sources contaminated with both arsenic and iron (Figure 5).
Almost 80% of the women involved in agricultural activities reported minor (skin irritation) and moderate (skin disease, allergy) illnesses from using surface water. The physically challenged and elderly women in Dhalla also reported major, or extreme, illnesses (cholera, typhoid and dysentery) from using surface water. The respondents identified rainfall variability and illegal dumping of wastewater from industries as significant reasons for water shortages. Illegal dumping of industrial waste led to serious water pollution, which resulted in severe water scarcity for the people who used to rely on river water for domestic and agricultural uses. Soil pollution, or illegal dumping, was causing groundwater pollution, as harmful substances leached into the groundwater during rainfall. A small farmer (male) from the Dhalla union said, “I used to utilize river water for bathing my cattle. After using that water, my body started itching. The water is highly polluted due to hazardous chemicals dumped from the tannery estate. If the river water or local ponds could be used for bathing of livestock, then the pressure on groundwater could be decreased”.
The quality of common tube well water was described as poor by 84% of the respondents from the Saista union. The supply water had a brownish color and an unpleasant smell. Due to the poor groundwater quality, adolescent school-going girls suffered the most during their menstrual cycle. A girl from the Saista union, aged 14 years, said, “My family drinks water from the nearest government tube well as our own tube well is marked red for the presence of high level of arsenic. The collection of water from government tube well is very time consuming, especially in summer. During these days, I have to collect water even when I am physically sick. I feel very tired”. A small farmer from the Saista union said, “When my wife was pregnant in the last summer, I had to fetch water from a distant tube well for my family. The water quality of my own tube well is not satisfactory”.
Data on rainfall variability showed that the perception of the farmer group was more accurate than the other two groups. About 91% of the farmer respondents reported on high variability of rainfall. The other groups were not aware of the changes in rainfall and other climatic parameters. The degree of rainfall variability in the study area varies from 20% to 48%, which is medium to high [3].
From multiple linear regression (Table 7), it appears that surface water, groundwater and rainfall accounted for only 7% of the variability in water poverty of the industrial workers (R2 = 0.066) with groundwater recording a higher beta value (beta = 0.225, p < 0.001) than surface water (beta = 0.135, p < 0.001) and rainfall (beta = 0.020, p < 0.001). If we could increase groundwater, surface water and rainfall scores by one standard deviation, the water poverty scores would increase by 0.23, 0.14 and 0.02 standard deviation, respectively. Regarding the farmers, surface water has the major impact, and for the economically inactive women, both surface and groundwater have almost similar contributions to the index value.
4.1.2. Impacts Related to Inadequate Access to Safe Water and Sanitation
The Access component is comprised of the indicators measuring the accessibility to safe water supply, sanitation and healthcare facilities of the respondents. The value of the Access component showed that Jamsha, Dhalla and Bayra had better values than Jamirta and Saista (Figure 6a). Among the groups, the industrial workers’ score was the highest (Figure 6b). A reliable and satisfactory water supply system in the Bayra and Jamsha unions eased the water collection process for the inhabitants of those areas. The Dhalla union also had satisfactory access to safe drinking water.
Collection of water: The study revealed that women were overburdened, as they had to perform all the household duties. About 84.2% of the male respondents perceived that collecting water for a household was the duty of women. One of the adolescent respondents stated, “Despite having two younger brothers, the duty of water collection is my responsibility only. My family does not allow the male children to fetch water for the household”. A large farmer in the Dhalla union said, “In our area, collection of water is seen as the women’s duty. This is the common practice. The male members of the households are mostly engaged in wage-earning activities. So, they are not involved in the household chores”. These statements confirm that the society is patriarchal in structure and division of labor is gender-biased.
In the study area, some respondents mentioned that safe and good quality water was available in their next-door neighbors’ houses, but it was not always accessible. This was mostly due to the existence of power relations and absence of social capital. Sometimes, the deep tube wells were accessible only to women due to certain religious beliefs. A small farmer in the Saista union said, “I am not allowed to collect water from my neighbor’s tube well, even when my wife is sick or busy in the household chores. The female members of that house were hesitant to allow outside men to fetch water. Despite having the chance of helping my wife in collection of water, I cannot do so”. So, from these findings, it can be said that in the context of accessibility of water, women, adolescent girls and the female heads of households suffered a lot.
Intermittent supply of water: Water supply in the study area varied from one season to the other. In the dry season, water supply became highly intermittent. The piped water supply in the Dhalla union was available from 6:00 to 10:00 am, and again from 3:00 to 4:00 pm. In this union, the supply was intermittent and the timing of supply was less reliable than in Bayra and Jamsha unions. A female industrial worker in the Dhalla union said, “I have a piped water connection at my home which is highly erratic in the summer season. Sometimes, I cannot store enough water for the whole day, as I have to stay away from home for a considerable period of time. The timing of water supply is very irregular”. According to a male industrial worker in the Dhalla union, “The service from the piped network is under huge pressure at present and it is worse than before as a result of population growth in the area”. On the other hand, a female farmer in the Jamsha union said, “The water supply system is very reliable and the water is of good quality and highly satisfactory”. However, the respondents from the Dhalla, Bayra and Jamsha unions had an advantage over the respondents from other unions in their piped water connection. They did not need to collect water from a distant source.
Distance to source: In the Saista union, women suffered from time poverty due to distant water sources. The distances travelled by the respondents were within a 3 km radius. One of the unemployed women said, “My home is approximately 1.5 km from the common water source. I have been waiting in the queue for the last 2 h. I need approximately 5 to 10 min to fill up my containers. Then I spend one hour to get home after filling the containers. I carry two heavy buckets, and for this load, my journey takes more time than usual”. It thus emerges that the female respondents invest approximately 5 to 6 h per day in fetching water once.
The time spent in fetching water in the Saista union put the female farmers at a disadvantaged position compared to the male farmers. Females were deprived of equal opportunities as males to engage in economic activities because of the burden to fetch water. A female farmer who works on others’ farms on a daily wage basis revealed, “Sometimes, I do not go to work due to fatigue when I have to collect water twice a day and do all the household chores. As a result, my wage is cut for that day and my contribution to the household income is reduced. In consequence, my opinion concerning how my earnings are used has become valueless”. Thus, the fatigue from collecting water adversely affected the performance and productivity of women. The respondents indicated that better water access would increase their income earning potential. Young girls faced difficulties in balancing their education and household activities. One of the adolescent girls revealed that the task of collection of water during weekdays had negatively affected her schoolwork, as a result of fatigue and stress.
The majority of the female respondents reported that they had to collect water even when they were sick. 125 out of 160 female respondents stated that the collection of water was mandatory for them in any circumstance. Only 5 respondents had supporting family members who helped them in collecting water in case of illness (Figure 7a). Another finding indicated that 15 respondents who collected water for their families faced security issues during the collection of water (Figure 7b). Even after facing such issues and sharing these issues with their families, they still had to collect water. These societal and family situations and practices caused a serious gender-differentiated impact on poor accessibility to water.
Sanitation and healthcare facilities: In the study area, women were more aware of the health issues arising from lack of sanitation and medical facilities than men. Only 23% of male respondents reported that sanitation was seen as less of a priority than access to drinking water, whereas 93% of female respondents prioritized sanitation facilities and access to drinking water equally. Most of the industries provided drinking water points and separate washroom facilities for women on each floor. An industrial worker, aged 29, said, “There is no drinking water point near my seat. The water point is almost at the other end of the room (at around 30m distance). I usually avoid drinking water while working as it seems wastage of time. A medical officer is on the ground floor, but I do not pay a visit even when I am sick as it will affect my productivity. I cannot visit a private hospital as it is not affordable or a government hospital due to my long working hours. The factory does not accommodate the needs of female workers of reproductive age”. Female workers were highly concerned about the necessity of a gender-friendly workplace, especially considering specific needs during pregnancy, such as better washroom facilities and provision of water points equally accessible to all.
All the adolescent girls revealed that lack of adequate female toilets and access to clean water for washing hands in schools and homes made it difficult to ensure hygiene during menstruation. A female industrial worker in the Dhalla union said, “On my floor, there is only one washroom, which is used by around 250 female workers and is not well-maintained”. About 34.6% of the respondents suffered from urinary tract infections due to improper sanitation facilities. All of them were from the unemployed and elderly women group, whereas the rest of the respondents were unaware of this disease. An industrial worker, aged 35, said, “The water point is easily accessible to him, but the number of washrooms inside the industry is not adequate for all the workers”.
Few respondents from the economically inactive women group reported on their lack of access to medical facilities. Several factors were behind this situation. The major reason was that they were mostly dependent on some other male members to take them to the hospital or bring them their prescribed medicines. Their lack of decision-making power and social relations were the other factors.
Although the impacts due to poor sanitation and medical facilities were differently distributed among gender, age and occupation, all the groups in the study area had better provision to sanitation and medical facilities due to the peri-urbanization process.
Multiple linear regression results showed that for the industrial worker group, the two variables, access to safe water and access to sanitation and medical facilities inside their industry, explained 49.7% of the index value (R2 = 0.497), with access to sanitation and medical facilities recording a higher beta value (beta = 0.679, p < 0.001) than access to safe water (beta = 0.204, p < 0.001) (Table 8). If we could increase the scores for the access to sanitation and medical facilities, and to safe water, by one standard deviation, the water poverty score would rise by 0.679 and 0.204 standard deviation, respectively. From this analysis, it is evident that the group had better access value (69.6, Figure 6b), due to the better score in access to sanitation and medical facilities. For the farmers, access to safe water (access to irrigation), and for the economically inactive women, access to sanitation and medical facilities are the major predictors for the final index value.
4.1.3. Impacts Related to Poor Capacity for Water Management
The Capacity component is comprised of the indicators measuring both economic and social capacity of the respondents. The respondents from the Bayra union had better capacity for water management than other unions (Figure 8a). Among the groups, the industrial workers’ score was the highest (Figure 8b).
Affordability: The Dhalla and Saista unions had different water pricing strategies depending on water availability. As far as affordability is concerned, the small farmers of Saista were the most disadvantaged group, due to a higher water price. In the Dhalla union, most of the respondents paid a monthly bill of $4.11–$4.70 for water. A small farmer, aged 50, said, “I cultivate rice, mustard and vegetables. I do not have my own land and so I work on other peoples’ land on a contract basis. Currently, I am using shallow tube well to irrigate their farms. In the dry season, the water level goes down, so it becomes very difficult to irrigate and also to store sufficient amount of drinking water. The amount that I have to pay for water ($7.05 per month) is very high compared to my income. The profit from rice cultivation is very low, but the cost of water and labor are very high”. This revealed that their cost to income ratio was very high. About 42.9% and 56.7% of the respondents in the Saista and Dhalla unions, respectively, had piped water connections. However, 87.5% of the small male and female farmers in the Saista union reported very high cost to income ratios which implied that they had less affordability. Thus, the higher the cost to income ratio was, the lower the affordability was.
Discrimination in wage rates of male and female farmers was prominent in the study area, which in turn affected the affordability of the groups. As a result, female workers, who paid their water bills, or who contributed financially to their family, had to struggle a lot to fulfill their daily target. According to a female industrial worker in the Dhalla union, “I have a ten-hour workday with one-hour lunch break with constant pressure of achieving the target on my head though the wage rate is not satisfactory. The wage rate should be fair and free from discrimination”.
Economically inactive women had a lower index value than the other groups, due to their inability to pay for water. They were entirely dependent on other family members for making any financial decisions, including paying for water and healthcare.
Social networks and relationships: Access to financial help from relatives or institutional loans from NGOs, during water-related disasters, is an important indicator of the groups’ capacity for water management. In this regard, only 8% of the adolescent girls, and the physically challenged and elderly women in the Saista union had access to financial help in case of an emergency. The duration of residence is another factor that positively influences the capacity score of a group. The more the duration of residence is, the greater the chances of getting help from neighbors and local people in the case of an emergency. In this regard, a male industrial worker said, “I formerly lived in another union. But recently I have shifted to the Dhalla union due to my work. Here, I do not have any access to bank loans or financial help from the neighbors”. Adolescent girls had lower chances of getting financial help unless other family members got the help from their relatives. Thus, institutional and political linkages heavily influence the capacity of the local people. An unemployed woman of the Saista union stated, “It takes 3 h daily to fetch water. Today the queue is slower than usual because preference is given to those linked to a local NGO. I have been here for almost 3 h”. In such cases, the economically inactive group are most disadvantaged due to the power relations in the locality. These cases are some examples of how social capital is shaping differential access to water. Bourdieu argues that social capital is manifested through benefits derived from social networks. However, the source of social capital stems from social, economic and cultural structures that create differential power and status for specific individuals and not others. Bourdieu framed social capital as accrued actual or virtual resources acquired by individuals or groups through the possession of ‘more or less institutionalized relationships of mutual acquaintance and recognition’ [69].
Participation in decision-making: The majority of female respondents in the study area (80%) believed that they had equal chances of being selected in local water management committees. However, most of the female respondents are excluded from formal participation. The key reasons behind women’s inactive involvement in NGOs, or other institutions, were identified from this study as those below:
- Women lacked knowledge about water management issues. So, they lacked confidence to attend and participate (95 out of 180 female respondents agreed);
- Women lacked interest in water management issues (15 out of 180 female respondents agreed);
- Women did not consider it their role to attend such meetings and participate (22 out of 180 female respondents agreed);
- They needed permission of their husbands to attend the meetings (153 out of 180 female respondents agreed);
- Family tradition and cultural norms prevented women from attending and participating in the meetings (171 out of 180 female respondents agreed);
- Husbands thought that women would challenge the existing roles in the household and community by participating in the meetings (61 out of 180 female respondents agreed);
- Lack of land ownership prevented women from membership or participation in the committees (159 out of 180 female respondents agreed).
One of the inhabitants in the Dhalla union said, “Women in our village are already overburdened with responsibilities of childcare, household chores, livestock care and agricultural work. Where is the time for attending village meetings or other training activities? Also, attending meetings where men are there is against our cultural norms”. This statement depicted the cultural restrictions on women’s participation in decision-making processes in the study area. Some women respondents who used to attend meetings agreed that they only participated in the meetings, but were not vocal about their problems and issues.
Active involvement of women in committees will not only require nominal participation (just being a member of the committee) but also requires them to be interactive participants (raise their voices to make a decision in their favor) [70,71]. Only 12% of the female respondents considered themselves as empowered women to make decisions regarding their income, crop production and utilization of resources.
Education: The Education ratio is measured by the ratio of the number of household members completing primary level education to the total number of household members. The Education ratio is important for the disadvantaged groups to raise their voice and fight for their rights. Water scarcity makes it difficult for young girls to get the education that they need because they often remain sick and miss school days, or they have to help fetch water for their family. In this case, 66.7% of the adolescent girls reported that they missed school when they had to collect water early in the morning.
Water governance: Water governance relates to a range of political, social, economic and administrative systems that are in place to develop and manage water resources and the delivery of water services at different levels of society [72]. It includes government and non-government organizations, laws and regulations, and water-related programs and policies where gender is generally excluded. In the study area, the rainfall magnitude is the same as the national average. The water body can be restored with water during the rainy season which does not last throughout the year. The poor and marginalized people are less capable of storing water in a scientific way, and cannot use rainwater for long periods. In some houses of Saista, people collected rainwater in a “Maithel”, but the capacity was not sufficient. The collected rainwater was used only for cooking rice; if it was cooked with water from other sources contaminated with iron, it became brown. One female respondent urged that if they could get training on rainwater harvesting, it would be very helpful for them. As the study area has peri-urban characteristics and is changing its spatial characteristics, the natural water bodies are depleting due to land use and land cover changes. There is no authority to organize a training, or capacity building, program. In the Bayra union, BRAC, an international development organization based in Bangladesh, was working on human rights and social empowerment of poor women. This activity led towards better Capacity value of the Bayra respondents.
As a cultural practice, women and marginalized people often have no right to land and water. In the study area, all the inhabitants, including women and men of all strata, were not well aware of the activities, laws and regulations, and programs and policies of water-related organizations. In this context, due to lack of capacity and affordability, this experience was worse for the most disadvantaged population and vulnerable groups, who are mostly women. According to a respondent, very few water management activities are performed by government and non-government organizations in the study area.
In most cases, women who are participating in any kind of farm activities, through either cooking or carrying lunch to the farm or participating in post-harvesting activities, are not recognized as working women. So, no opportunities for capacity development are present in the study area.
Role in operation and maintenance: In the study area, women were not actively involved in most of the decisions regarding crop selection, when to irrigate, payment of irrigation fees, and spending additional income. These were all largely male-dominated decisions. The findings from this study indicated that independent decision-making by women in water-related matters was rare. The female farmers’ involvement was higher with respect to voicing the needs and concerns of women, assessment of water supply/demand, and monitoring water use than for the other female groups. On the other hand, very low involvement of the economically inactive female group was reported regarding decision-making related to water distribution, pricing, maintenance, and taking action against misusers.
Multiple linear regression analysis showed that for all the groups, the two variables, economic and social capacity, explained about 40% to 46% of the index value (R2 = 0.404, 0.396, 0.464) (Table 9). For industrial workers and the economically inactive women group, social capacity is the major predictor of the index value. For the farmer group, economic capacity is the major predictor of the index value. From this analysis, it can be said that the industrial worker group had a better Capacity value (57, Figure 8b), due to their better social capacity. For economically inactive women, the poor Capacity score (31.2, Figure 8b) was due to poor social capacity.
4.1.4. Impacts Related to Restricted Use of Water
The Use component is comprised of the indicators measuring perceptions on adequacy of daily water provision and conflicts regarding water use. The Bayra, Jamsha and Dhalla unions had better scores than the Jamirta and Saista unions. The respondents from the Bayra union had the highest value for the Use component (86.7) and that from the Saista union had the lowest value (47.1) (Figure 9a). Among the groups, the industrial workers’ score was the highest (Figure 9b).
Adequacy of daily water provision: The study found that only 21 respondents, out of 220, reported that no water shortage was faced by them. Thirty-two respondents reported low shortage, where low shortage indicated that this water shortage can be easily managed. The majority of the respondents (102 respondents) ranked the level of water shortage as medium. Medium water shortage indicated that the water shortage was due to a seasonal difference and the availability was highly influenced by this. Due to these factors, the respondents were unable to withdraw water from their own drinking water sources. Sixty-five respondents reported that they faced high shortage of drinking water (Figure 10a). Out of 100 farmer respondents, 55 reported high shortage of water (Figure 10b). The farmers reported that water shortage was growing day by day due to changes in rainfall pattern, water pollution, rapid urbanization and land use changes.
Conflicts: If there is conflict over water use, it gets more difficult to access the water. In the Saista union, people ended up fighting with each other while trying to access water from a government tube well during summer. One of the respondents reported, “We sometimes get tired of waiting in long queue while collecting water in hot temperature. Hence, if someone tries to get in the middle of the queue from behind, other people become restless and in a worst-case situation, they start fighting with each other”. The conflicts regarding water use were reported to be higher in the summer than the other seasons in the Saista union. Moreover, people stopped sharing water sources with their neighbors when water shortage was acute in the locality.
Physical violence: There is a relationship between the gender-based division of labor around water collection, poor access to water, and domestic violence. A female respondent, aged 44, living in the Saista union, stated, “I work both in farms and at home. I am involved in post-harvesting activities, and also, I have to cook for my family members and laborers who work in the farms. Both inside and outside activities need water and I am the only responsible manager of it. My husband is a small farmer who works in the farms the whole day. I have to carry his lunch to the farms. As I am living in an area where water availability is highly erratic, sometimes I do not have enough water to store. My husband often beats me for not having enough water when he comes back home”. According to her statement, working in both farm and home is not an easy task. It gets tougher when there is not enough clean and safe water at home. Almost all the adolescent girls reported that they faced physical violence when they could not bring water in a timely fashion. This situation presents a picture of gender-based violence in relation to water collection in the study area.
Multiple linear regression analysis showed that for all the groups, adequacy of daily water provision is the major predictor of the index value (Table 10).
4.1.5. Impacts Related to Poor Environmental Condition
The Environment component consists of the indicators measuring environmental stress, and loss and damage due to water related disasters. The Jamsha union had the highest score (65.9) and the Dhalla union had the lowest score (41.3) (Figure 11a). Among the groups, the industrial workers’ score was the lowest because this group belonged to the Dhalla union (Figure 11b).
Environmental stress: If water poverty persists for a longer period, it may lead to loss of many animals and plants. According to the respondents in the Dhalla union, there were no consumable fish species in the water bodies in the union. In the Saista union, though fish culture was practiced in some ponds, fish species had reduced over the past 15 years. As a result, the fishermen group had to diversify their livelihoods, or migrate to other peri-urban unions for income generation. Also, many plants either could no longer be grown, or their reproduction rates were insufficient, causing serious biodiversity loss. A respondent in the Dhalla union said, “About 15–20 years back, there were about 132 large and small canals all over the union. Now there are about 15–20 canals and local ponds only. The government has acquired the land containing a long canal for construction of a connecting road throughout the union”. He also added, “Previously I used to be a fisherman. But now aquaculture is impossible in this union due to massive industrialization and illegal disposal of wastewater into the water resources”. A small-scale, landless farmer in the Dhalla union, said, “We, the farmers, are suffering the most due to the contaminated water sources. Groundwater contamination is very common in this area due to the tannery wastes dumped into the river. We are using it for irrigation purposes. Currently we are facing crop loss more often than before”.
Reduction in vegetation cover over the last 15 years was evident in the study area. Almost all the respondents reported disproportionate balance in the land cover. About 60% of the respondents noticed that the urban area had increased, and the water bodies and vegetation had decreased in the area. They suggested restoring these areas. The majority of the respondents labelled peri-urbanization as a negative feature in response to the question, “How would you characterize peri-urbanization in your area?” (Figure 12). This perception was built due to the consequences faced by them, due to water and soil pollution, restricted access arising out of water shortage, increasing conflicts and environmental stress. However, some respondents labelled peri-urbanization as a blessing because of diversified livelihood opportunities, improved access to sanitation, medical facilities and education, and rapid development of their respective areas.
Water related disasters: The study area faced flooding in the rainy season and drought in the dry season about 15–20 years ago. The severity of loss and damage due to flooding or drought in the last 15 years was reported to be moderate by 88.5% of the respondents. Drainage congestion, due to dumping of waste irregularly, is another problem for the local people. Blocked drains and canals led to water logging in the area. Adolescent girls suffered the most due to water-related disasters and issues of maintaining hygiene and sanitation. The farmer group suffered due to crop loss in the study area. According to them, crop loss had increased to a large extent over the last 15 years. Increases in insect attack, groundwater depletion and climate variability (changes in the pattern and intensity of rainfall and temperature) were responsible for this.
Multiple linear regression analysis showed that for all the groups, environmental stress is the major predictor of the index value for the farmers and economically inactive women group (Table 11).
5. Discussion
The study shows that water poverty prevailed throughout the study area even though some parts were not considered water scarce. The WPI values accurately reflected the existing situation among the unions and livelihood groups. In this regard, scale issues are a very important factor to portray the real picture, as the results merely depend on selection of up-scaling or down-scaling [73,74]. In order to reflect actual variations, scales need to be selected at which the indices are applied for policy purposes [41]. The application of the index values at national level is of limited use, as the dynamism of water poverty may be obscured by aggregation of a large set of data [75]. To produce representative WPIs to inform policies, the method must follow a participatory and inclusive approach for targeting the water poor [41,76]. The method used in this research accurately reflects local perceptions of water poverty [66]. This study has been successful in identifying the link between poverty, resource accessibility and socio-cultural contexts.
This study provides a means of understanding the complexities of the gender-differentiated impact of water issues by integrating physical, social, economic and environmental aspects, and by linking water issues to poverty [44]. The study reveals that different groups suffer differently in the study area. Also, geographic location of the unions influences water poverty in the study area [3,45].
The survey found that the gender-differentiated impact of water poverty was shaped by gender inequalities, and the most significant variables that impact gender inequalities in the water sector were land use and ownership of resources, labor markets, income, decision-making aspects, education and access to information and technology [17,59,77]. Lack of land ownership restricts women’s access to institutional loan and credit which, in turn, hampers their economic capacity [46,59]. Inability to participate in financial decision-making aggravated the limited participation of women in trainings and village meetings [59,78]. Active participation in trainings should be encouraged for those who are willing to participate in decision-making activities and agricultural management [59]. The study argues that women need to be placed in water management positions to empower them [5]. However, only nominal participation cannot improve this situation, which heavily persists in the study area [70,71].
This study claimed that the WPI was primarily dependent on the Access and Capacity components and the impacts associated with these components greatly influenced the livelihood groups [40]. The study showed that severe water poverty will increase vulnerability of women towards increasing health issues, due to poor quality of water, and decreasing education and employment opportunities. In peri-urban areas, these situations will degrade due to rapid urbanization and population growth. There is no chance of improving the gendered distribution of household responsibilities, as these norms are deeply entrenched [11]. Reports on personal security issues and water conflicts proved another dimension of gender inequality, which is also deeply entrenched in the societal norms [1,2].
The study also established that religious and gender differences strongly affected access to water [59]. The study found that harvesting and post-harvesting activities were considered as feminized labor, which were the responsibilities of women and young girls. Women’s roles in irrigation, agricultural harvesting and household chores were largely ignored and taken for granted [14,16,79]. Also, male contributions to domestic tasks were overlooked [14,15]. During harvesting season, women became overloaded with the doubled work burden of their household chores along with water collection and agricultural activities [46,80]. So, improved access to drinking water sources can reduce the work burden on women by minimizing time spent in collecting water [46]. The study found that farmers had limited access to water and hence they were water-poor. Also, the economically inactive women group were the most water-poor group as they were income-poor [35,40,44]. On the other hand, industrial workers in the Dhalla union had high levels of access, yet they were water-poor due to other factors.
From multiple linear regression analysis, it appeared that the value of WPI correlates mostly to the access, capacity and environment components [40,44]. For the women group, the three most important components are Access, Capacity and Use, and for the male respondents these are Access, Use and Environment [61]. A strong correlation between WPI and Capacity indicates that societies with low-income levels and weak health and educational systems are likely to have inhabitants lacking access to safe drinking water [40].
In the study area, the burden of domestic water collection mostly falls on women and female children. Hence, fetching water is part of the gender inequality in the study area [5,20,41]. Some respondents claimed that they were failing to contribute to household income as they were in charge of collecting water, cleaning and cooking, and taking care of sick people. The study highlights that their failure to contribute to household income weakened their voice concerning financial decisions [6]. Women in the study area faced physical, psychological and social problems while collecting water from community or shared tube wells [1].
The key findings on gender-differentiated impacts of water poverty and some recommendations based on the responses from the inhabitants of the study area are presented in a conceptual framework in Figure 13.
Measurements are categorized under four domains, namely, physical or environmental, economic, social and political/institutional. Under the physical domain, the components that need attention are water availability, water quality, environmental integrity, crop loss and water-related disasters. Dredging of the Dhaleshwari River and excavation of existing canals would lower pressure on groundwater and thus would ensure water availability. As the Dhaleshari River is continuously polluted by tannery industries [3,33,45], there must be scope for wastewater treatment facilities in order to reuse the water for irrigation purposes. Wastewater reuse is another way of saving water. Unlike canal irrigation, constant production of wastewater has an advantage. It can be used in agricultural sector [81]. The Central Effluent Treatment Plant must be made functional. Local respondents suggested establishing a few Water Treatment Plants and water quality monitoring systems in order to reduce water-related illnesses. Additionally, addressing quality of water would help women, as the nursing of sick people involves a considerable amount of time. In order to ease water logging problems, especially in the Dhalla union, proper sewage and waste disposal systems must be maintained. To prevent crop loss, climate-tolerant crops should be cultivated, and to do so, awareness programs on climate change should be run for all the inhabitants of peri-urban areas.
Under the economic domain, regulating the amount, manner and price in which people access, use and dispose of water is mandatory to afford clean and sustainable water. Water pricing policies for small farmers should be gender-inclusive in order to remove inequalities in wage rate, especially in the Saista union. Women’s participation in income-generation activities will improve their economic condition, as well as increase affordability of water for them. Training in improved agricultural technologies, such as pesticides and plant biotechnology, will help farmers to fight against climate change and improve their economic condition by enhancing production.
Strategies that must be adopted to improve the social domain of the gender water poverty nexus are those that ensure a uniform and equitable water distribution system, especially in the Dhalla and Saista unions, to enhance accessibility and ensure reliability of the water supply system. In order to balance the gender water poverty nexus, 98% of the respondents suggested that a consistent piped water supply and deep tube wells would reduce the burden on women. Allocation of funds and monetary support from institutions are required to improve sanitation facilities, especially in the Saista union. Recognizing women’s roles would help reduce the conflicts regarding water use and occurrence of physical violence.
Ensuring equity in access to technology, knowledge and information, and facilitating active participation of women, rather than nominal participation, in decision-making processes for water management are a few initiatives that would empower the women group. Gender-responsive water programs, like skill or capacity building training, training in water filtration methods, and training in disaster risk management are necessary to improve the political domain of the nexus. Ownership of land and assets, by ensuring women’s rights to land and water, would help formulate a gender-inclusive water management policy which will, in turn, ease the process of eradicating water poverty.
6. Conclusions
In this paper, a comprehensive framework to assess water poverty is proposed drawing on both the physical and social sciences. Women and young girls are treated as ‘second class citizens’ in peri-urban areas around Dhaka city with unpaid household work, including water collection, and management and domestic chores at household level. Thus, water poverty has become the poverty of women and young girls. Hence, initiatives are needed at household level to address the inequalities brought out by cultural norms in the division of labor. To balance the gender water poverty nexus, there is a need for policy reforms in the water sector to promote gender equality and stipulate gender-inclusive practices. In such cases, women must be actively engaged in the planning, operation and management of all water supply projects.
This study finds that different livelihood groups suffer differently in peri-urban areas. The physical components (Resource and Environment) are very low compared to the social components (Access, Capacity and Use), as physical components are deteriorating gradually due to peri-urban processes. The gender-differentiated impacts of water poverty are also determined by a mixed method approach, which complements the index values calculated following the conventional survey approach.
The study depicts that community-based piped water supply systems relieve rural women from the burden of water collection from distant sources. The study underscores the need for taking a gender-sensitive approach in water resources planning which will address various sectors and activities in which nature and culture play a pivotal role.
The proposed WPI fits this concept of an index which measures water poverty along with its components. Based on the present study, it is recommended that further study should be conducted at different time scales to determine temporal variation in water poverty. There is also scope for predicting future water poverty by considering climatic conditions, rate of urbanization, and change in environmental condition. The results would be useful in policy-making and prioritizing the water needs of small-scale disadvantaged groups. The study has the potential to be expanded to other unions, sub-districts and districts to determine the water poverty situation in each individual spatial scale. In this regard, focus is needed to improve the water poverty situation for disadvantaged livelihood groups, and how these groups can effectively manage their shared water resources for the benefit of all. Component or indicator selection should be field oriented or participatory.
Author Contributions
Conceptualization, L.S.J., R.S.L. and M.S.M.; methodology, L.S.J., R.S.L. and M.S.M.; software, L.S.J.; validation, L.S.J. and R.S.L.; formal analysis, L.S.J. and R.S.L.; investigation, L.S.J. and R.S.L.; resources, M.S.M.; data curation, L.S.J. and R.S.L.; writing—original draft preparation, L.S.J. and R.S.L.; writing—review and editing, M.S.M.; visualization, L.S.J.; supervision, M.S.M.; project administration, M.S.M.; funding acquisition, M.S.M. All authors have read and agreed to the published version of the manuscript.
Funding
This research was funded by the International Development Research Center (IDRC), Canada under IDRC-South Asian Water (SAWA) Leadership Program on Climate Change.
Informed Consent Statement
Informed consent was obtained from all subjects involved in the study.
Data Availability Statement
Data can be made available upon request.
Acknowledgments
We thank the two anonymous reviewers for their valuable comments and useful suggestions, which helped improve the quality of this manuscript.
Conflicts of Interest
The authors declare no conflict of interest. The funders had no role in the design of the study; in the collection, analyses, or interpretation of data; in the writing of the manuscript; or in the decision to publish the results.
References
- Faisal, I.M.; Kabir, M.R. An analysis of gender–water nexus in rural Bangladesh. J. Dev. Soc. 2005, 21, 175–194. [Google Scholar] [CrossRef]
- Sultana, F.; Crow, B. Water concerns in rural Bangladesh: A gendered perspective. In Proceedings of the 2000 26th WEDC International Conference: Water, Sanitation and Hygiene-Challenges of the Millennium, Dhaka, Bangladesh, 1 January 2000; pp. 416–419. [Google Scholar]
- Jaren, L.S.; Mondal, M.S. Assessing water poverty of livelihood groups in peri-urban areas around Dhaka under a changing environment. Water 2021, 13, 2674. [Google Scholar] [CrossRef]
- Besada, H.; Werner, K. An assessment of the effects of Africa’s water crisis on food security and management. Int. J. Water Resour. 2015, 31, 120–133. [Google Scholar] [CrossRef] [Green Version]
- Khosla, P.; Pearl, R. Gender, water and poverty: Key issues, government commitments and actions for sustainable development. In Proceedings of the Fourth World Conference on Women, Beijing, China, 4–15 September 2002. [Google Scholar]
- United Nations (UN). The World’s Women 2015: Trends and Statistics. New York. Available online: http://unstats.un.org/unsd/gender/downloads/WorldsWomen2015_report.pdf (accessed on 25 December 2019).
- United Nations World Water Assessment Program (WWAP). Water and Jobs: Facts and Figures. The United Nations World Water Development Report 2016; UNESCO-UN-Water, United Nations: Paris, France, 2016. [Google Scholar]
- Mjoli, N. Gender-balanced policy in water delivery. Agenda 1998, 14, 38–42. [Google Scholar] [CrossRef]
- Mukuhlani, T.; Nyamupingidza, M.T. Water scarcity in communities, coping strategies and mitigation measures: The case of Bulawayo. J. Sustain. Dev. 2014, 7, 144. [Google Scholar] [CrossRef] [Green Version]
- Singh, N.; Singh, O.P. Climate change, water and gender: Impact and adaptation in north-eastern hills of India. Int. Soc. Work 2015, 58, 375–384. [Google Scholar] [CrossRef]
- Kher, J.; Aggarwal, S.; Punhani, G. Vulnerability of poor urban women to climate-linked water insecurities at the household level: A case study of slums in Delhi. Indian J. Gend. Stud. 2015, 22, 15–40. [Google Scholar] [CrossRef]
- Abrahams, Y.; Mhlongo, S.; Napo, V. A gendered analysis of water and sanitation services policies and programs in South Africa: 2006–2010. Agenda 2011, 25, 71–79. [Google Scholar] [CrossRef]
- Zwarteveen, M. Men, masculinities, and water powers in irrigation. Water Altern. 2008, 1, 111–130. [Google Scholar]
- Mitra, A.; Rao, N. Gender, water and nutrition in India: An intersectional perspective. Water Alt. 2019, 12, 930. [Google Scholar]
- Solomon, D.; Rao, N. Wells and wellbeing: Gender dimensions of groundwater dependence in South India. Econ. Political Wkly. 2018, 53, 38–45. [Google Scholar]
- Ahmed, S.; Zwarteveen, M. Gender and water in South Asia: Revisiting perspectives, policies and practice. In Diverting the Flow: Gender Equity and Water in South Asia; Zwarteveen, M., Ahmed, S., Gautam, S.R., Eds.; Zubaan: New Delhi, India, 2014. [Google Scholar]
- Food and Agriculture Organization of the United Nations (FAO). Training Guide: Gender and Climate Change Research in Agriculture and Food Security for Development; FAO: Rome, Italy, 2013; Available online: http://www.fao.org/docrep/018/i3385e/i3385e.pdf (accessed on 10 November 2020).
- Watkins, K. Beyond Scarcity: Power, Poverty and the Global Water Crisis; UNDP Human Development Reports: New York, NY, USA, 2006. [Google Scholar]
- Bennett, V.; Dávila-Poblete, S.; Rico, M.N. Water and gender: The unexpected connection that really matters. J. Int. Aff. 2008, 61, 107–126. [Google Scholar]
- Connor, R. The United Nations World Water Development Report 2015: Water for a Sustainable World; UNESCO Publishing: Paris, France, 2015; Volume 1. [Google Scholar]
- Douglas, I. Peri-urban ecosystems and societies: Transitional zones and contrasting values. In The Peri-Urban Interface: Approaches to Sustainable Natural and Human Resource Use; McGregor, D., Simon, D., Eds.; Routledge: England, UK, 2012; pp. 18–26. [Google Scholar]
- Allen, A. Environmental planning and management of the peri-urban interface: Perspectives on an emerging field. Environ. Urban. 2003, 15, 135–148. [Google Scholar] [CrossRef] [Green Version]
- Brook, R.; Purushothaman, S.; Hunshal, C. Changing Frontiers: The Peri-Urban Interface Hubli-Dharwad, India; Books for Change: Bangalore, India, 2001. [Google Scholar]
- Narain, V.; Nischal, S. The peri-urban interface in Shahpur Khurd and Karnera, India. Environ. Urban. 2007, 19, 261–273. [Google Scholar] [CrossRef] [Green Version]
- Simon, D.; McGregor, D.; Thompson, D. Contemporary perspectives on the peri-urban zones of cities in developing areas. In The Peri-Urban Interface: Approaches to Sustainable Natural and Human Resource Use; McGregor, D., Simon, D., Eds.; Routledge: England, UK, 2012; pp. 1–17. [Google Scholar]
- Baker, J.; Wallevik, H. Poverty and wealth at the rural–urban interface: An actor-centered perspective from northern Tanzania. Environ. Urban. 2003, 15, 229–248. [Google Scholar]
- Krüger, F. Taking advantage of rural assets as a coping strategy for the urban poor: The case of rural urban interrelations in Botswana. Environ. Urban. 1998, 10, 119–134. [Google Scholar] [CrossRef]
- Khan, M.S.A.; Mondal, M.S.; Rahman, R.; Huq, H.; Datta, D.K.; Kumar, U.; Jalal, M.R. Urban burden on peri-urban areas: Shared use of a river in a coastal city vulnerable to climate change. In Water Security in Peri-Urban South Asia: Adapting to Climate Change and Urbanization; Narain, V., Prakash, A., Eds.; Oxford University Press: New Delhi, India, 2015; pp. 33–74. [Google Scholar]
- Narain, V.; Khan, M.S.A.; Sada, R.; Singh, S.; Prakash, A. Urbanization, peri-urban water (in)security and human well-being: A perspective from four South Asian cities. Water Int. 2013, 38, 930–940. [Google Scholar] [CrossRef]
- Sayed, M.B.; Haruyama, S. Dynamics of land use/cover change in Manikganj District, Bangladesh: A case study of Manikganj sadar upazila. J. Geogr. Inf. Syst. 2015, 7, 579. [Google Scholar] [CrossRef] [Green Version]
- Akter, A.; Mia, M.Y.; Zakir, H.M. Arsenic contamination in surface and groundwater in major parts of Manikganj district, Bangladesh. J. Bangladesh Agric. Univ. 2015, 13, 47–54. [Google Scholar] [CrossRef] [Green Version]
- Narain, V. Periurban Water Security in a Context of Urbanization and Climate Change: A Review of Concepts and Relationships; Peri Urban Water Security Discussion Paper Series, Paper No. 1; SaciWATERs: Hyderabad, India, 2010. [Google Scholar]
- Allen, A.; Dávila, J.D.; Hofmann, P. The peri-urban water poor: Citizens or consumers? Environ. Urban. 2006, 18, 333–351. [Google Scholar] [CrossRef] [Green Version]
- Garriga, R.G.; Foguet, A.P. Improved method to calculate a Water Poverty Index at local scale. J. Environ. Eng. 2010, 136, 1287–1298. [Google Scholar] [CrossRef] [Green Version]
- Feitelson, E.; Chenoweth, J. Water poverty: Towards a meaningful indicator. Water Policy 2002, 4, 263–281. [Google Scholar] [CrossRef]
- Chenoweth, J. A re-assessment of indicators of national water scarcity. Water Int. 2008, 33, 5–18. [Google Scholar] [CrossRef] [Green Version]
- Rijsberman, F.R. Water scarcity: Fact or fiction? Agric. Water Manag. 2006, 80, 5–22. [Google Scholar] [CrossRef] [Green Version]
- Zeng, Z.; Liu, J.; Savenije, H.H. A simple approach to assess water scarcity integrating water quantity and quality. Ecol. Indic. 2013, 34, 441–449. [Google Scholar] [CrossRef]
- Shalamzari, M.J.; Zhang, W. Assessing water scarcity using the Water Poverty Index (WPI) in Golestan province of Iran. Water 2018, 10, 1079. [Google Scholar] [CrossRef] [Green Version]
- Komnenic, V.; Ahlers, R.; van der Zaag, P. Assessing the usefulness of the Water Poverty Index by applying it to a special case: Can one be water poor with high levels of access? Phys. Chem. Earth 2009, 34, 219–224. [Google Scholar] [CrossRef]
- Sullivan, C.A. Calculating a Water Poverty Index. World Dev. 2002, 30, 1195–1210. [Google Scholar] [CrossRef]
- Sullivan, C.A.; Meigh, J.R.; Giacomello, A.M. The Water Poverty Index: Development and application at the community scale. Nat. Resour. Forum 2003, 27, 189–199. [Google Scholar] [CrossRef]
- Maganda, C. Water security debates in ‘safe’ water security frameworks: Moving beyond the limits of scarcity. Globalizations 2016, 13, 683–701. [Google Scholar] [CrossRef]
- Lawrence, P.; Meigh, J.R.; Sullivan, C.A. The Water Poverty Index: An International Comparison; Keele Economics Department Working Paper; Keele: Staffordshire, UK, 2003. [Google Scholar]
- Leya, R.S.; Bala, S.K.; Newton, I.H.; Chowdhury, M.A.; Haque, S.M. Water security assessment of a peri-urban area: A study in Singair Upazila of Manikganj district of Bangladesh. Environ. Dev. Sustain. 2022, 24. [Google Scholar] [CrossRef]
- Harris, L.M. Water rich, resource poor: Intersections of gender, poverty, and vulnerability in newly irrigated areas of southeastern Turkey. World Dev. 2008, 36, 2643–2662. [Google Scholar] [CrossRef] [Green Version]
- Banglapedia. Singair Upazila. Available online: http://en.banglapedia.org/index.php?title=Singair_Upazila (accessed on 8 February 2022).
- BBS. Population and Housing Census 2011: Community Report (Manikganj); Bangladesh Bureau of Statistics, Planning Division, Ministry of Planning, Government of the People’s Republic of Bangladesh: Dhaka, Bangladesh, 2011.
- BBS. Statistical Yearbook of Bangladesh 2011; Bangladesh Bureau of Statistics, Planning Division, Ministry of Planning, Government of the People’s Republic of Bangladesh: Dhaka, Bangladesh, 2012.
- BBS. Census on Agriculture 2008: Analytical Report; Bangladesh Bureau of Statistics, Planning Division, Ministry of Planning, Government of the People’s Republic of Bangladesh: Dhaka, Bangladesh, 2011.
- BBS. Population and Housing Census 2011: Zila Report (Manikganj); Bangladesh Bureau of Statistics, Planning Division, Ministry of Planning, Government of the People’s Republic of Bangladesh: Dhaka, Bangladesh, 2011.
- Bangladesh Meteorological Department. Available online: http://www.bmd.gov.bd/bd_climate.php (accessed on 8 February 2019).
- Bangladesh Agricultural Research Council. Available online: http://www.barc.gov.bd/ (accessed on 7 January 2018).
- Flood Forecasting and Warning Centre. Bangladesh Water Development Board (BWDB). Available online: http://www.ffwc.gov.bd (accessed on 12 February 2019).
- United Nations Children’s Fund (UNICEF). Adolescents Statistics. Available online: https://data.unicef.org/topic/adolescents/overview/ (accessed on 4 July 2021).
- World Health Organization (WHO). Adolescents Health. Available online: https://www.who.int/westernpacific/health-topics/adolescent-health/ (accessed on 4 July 2021).
- Israel, G.D. Sampling the Evidence of Extension Program Impact. Program Evaluation and Organizational Development, IFAS Cooperative Extension Service, Institute of Food and Agriculture Sciences, EDIS, University of Florida: Gainesville, FL, USA, 1992. [Google Scholar]
- Singh, A.S.; Masuku, M.B. Sampling techniques and determination of sample size in applied statistics research: An overview. Int. J. Econ. Commer. Manag. 2014, 2, 1–22. [Google Scholar]
- Xenarios, S.; Kakumanu, K.R.; Nagothu, U.S.; Kotapati, G.R. Gender differentiated impacts from weather extremes: Insight from rural communities in South India. Environ. Dev. 2017, 24, 156–169. [Google Scholar] [CrossRef]
- Jemmali, H. Mapping water poverty in Africa using the improved multidimensional index of water poverty. Int. J. Water Resour. Dev. 2017, 33, 649–666. [Google Scholar] [CrossRef]
- Wilk, J.; Jonsson, A.C. From water poverty to water prosperity—A more participatory approach to studying local water resources management. Water Resour. Manag. 2013, 27, 695–713. [Google Scholar] [CrossRef] [Green Version]
- Manandhar, S.; Pandey, V.P.; Kazama, F. Application of Water Poverty Index (WPI) in Nepalese context: A case study of Kali Gandaki River Basin (KGRB). Water Resour. Manag. 2012, 26, 89–107. [Google Scholar] [CrossRef]
- Van Ty, T.; Sunada, K.; Ichikawa, Y.; Oishi, S. Evaluation of the state of water resources using modified Water Poverty Index: A case study in the Srepok River basin, Vietnam—Cambodia. Int. J. River Basin Manag. 2010, 8, 305–317. [Google Scholar] [CrossRef]
- Guppy, L. The Water Poverty Index in rural Cambodia and Viet Nam: A holistic snapshot to improve water management planning. Nat. Resour. Forum 2014, 38, 203–219. [Google Scholar] [CrossRef]
- Prince, B.C.; Juran, L.; Sridhar, V.; Bukvic, A.; MacDonald, M.C. A statistical and spatial analysis of water poverty using a modified Water Poverty Index. Int. J. Water Resour. Dev. 2021, 37, 339–356. [Google Scholar] [CrossRef]
- Fenwick, C. Identifying the Water Poor: An Indicator Approach to Assessing Water Poverty in Rural Mexico. Ph.D. Thesis, University College London, London, UK, 2010. [Google Scholar]
- MoEF. The Environment Conservation Rules (ECR); Ministry of Environment and Forest, Government of the People’s Republic of Bangladesh: Dhaka, Bangladesh, 1997.
- World Health Organization (WHO). Guidelines for Drinking Water Quality; World Health Organization: Geneva, Switzerland, 2006. [Google Scholar]
- Bourdieu, P.; Wacquant, L.J.D. An Invitation to Reflexive Sociology; University of Chicago Press: Chicago, IL, USA, 1992. [Google Scholar]
- Agarwal, B. Participatory exclusions, community forestry, and gender: An analysis for South Asia and a conceptual framework. World Dev. 2001, 29, 1623–1648. [Google Scholar] [CrossRef]
- Bhattarai, B. How do gender relations shape a community’s ability to adapt to climate change? Insights from Nepal’s community forestry. Clim. Dev. 2020, 12, 876–887. [Google Scholar] [CrossRef]
- Rogers, P.; Hall, A.W. Effective Water Governance; TEC Background Papers, No. 7; Global Water Partnership, Technical Committee: Stockholm, Sweden, 2003. [Google Scholar]
- Schulze, R. Transcending scales of space and time in impact studies of climate and climate change on agro-hydrological responses. Agric. Ecosyst. Environ. 2000, 82, 185–212. [Google Scholar] [CrossRef]
- Gibson, C.C.; Ostrom, E.; Ahn, T.K. The concept of scale and the human dimensions of global change: A survey. Ecol. Econ. 2000, 32, 217–239. [Google Scholar] [CrossRef]
- Forouzani, M.; Karami, E. Agricultural Water Poverty Index and sustainability. Agron. Sustain. Dev. 2011, 31, 415–431. [Google Scholar] [CrossRef] [Green Version]
- Cullis, J.; O’Regan, D. Targeting the water-poor through water poverty mapping. Water Policy 2004, 6, 397–411. [Google Scholar] [CrossRef]
- Kabeera, N. Gender equality and women’s empowerment: A critical analysis of the third millennium. Gend. Dev. 2005, 13, 13–24. [Google Scholar] [CrossRef]
- Arun, S. We are farmers too: Agrarian change and gendered livelihoods in Kerala, South India. J. Gend. Stud. 2012, 21, 271–284. [Google Scholar] [CrossRef]
- Cleaver, F. Choice, complexity, and change: Gendered livelihoods and the management of water. Agric. Human Values 1998, 15, 293–299. [Google Scholar] [CrossRef]
- Jordans, E.; Zwarteveen, M. A Well of One’s Own: Gender Analysis of an Irrigation Program in Bangladesh; Grameen Krishi Foundation and International Irrigation Management Institute: Colombo, Sri Lanka, 1997. [Google Scholar]
- International Water Management Institute (IWMI). Confronting the Realities of Wastewater Use in Agriculture; IWMI Water Policy Briefing 009; International Water Management Institute: Colombo, Sri Lanka, 2003. [Google Scholar]
Figure 1.
Conceptual framework of the present study.

Figure 2.
Location of the study area: (a) Manikganj district in Bangladesh; (b) Singair Upazila in Manikganj; and (c) selected unions in Singair.
Figure 2.
Location of the study area: (a) Manikganj district in Bangladesh; (b) Singair Upazila in Manikganj; and (c) selected unions in Singair.

Figure 3.
Evaluation framework for gender-differentiated impacts of water poverty in Singair Upazila (Adapted from [59]).
Figure 3.
Evaluation framework for gender-differentiated impacts of water poverty in Singair Upazila (Adapted from [59]).

Figure 4.
Score of resource component for: (a) 5 unions; and (b) livelihood groups.

Figure 5.
Number of respondents reporting water sources contaminated with both arsenic and iron.

Figure 6.
Score of access component for: (a) 5 unions; and (b) livelihood groups.

Figure 7.
(a) Survey responses to the statement that collection of water is mandatory even when women members are sick; (b) Reports of security issues during collection of water.
Figure 7.
(a) Survey responses to the statement that collection of water is mandatory even when women members are sick; (b) Reports of security issues during collection of water.

Figure 8.
Score for c apacity component for: (a) 5 unions; and (b) livelihood groups.

Figure 9.
Score for use component for: (a) 5 unions; and (b) livelihood groups.

Figure 10.
Adequacy of daily water provision: (a) Drinking water; (b) Irrigation water.

Figure 11.
Score for environment component for: (a) 5 unions; and (b) livelihood groups.

Figure 12.
Survey responses against the question, “How would you characterize peri-urbanization in your area?”.
Figure 12.
Survey responses against the question, “How would you characterize peri-urbanization in your area?”.

Figure 13.
Gender-inclusive water management framework for the water-poor groups in peri-urban area.
Figure 13.
Gender-inclusive water management framework for the water-poor groups in peri-urban area.


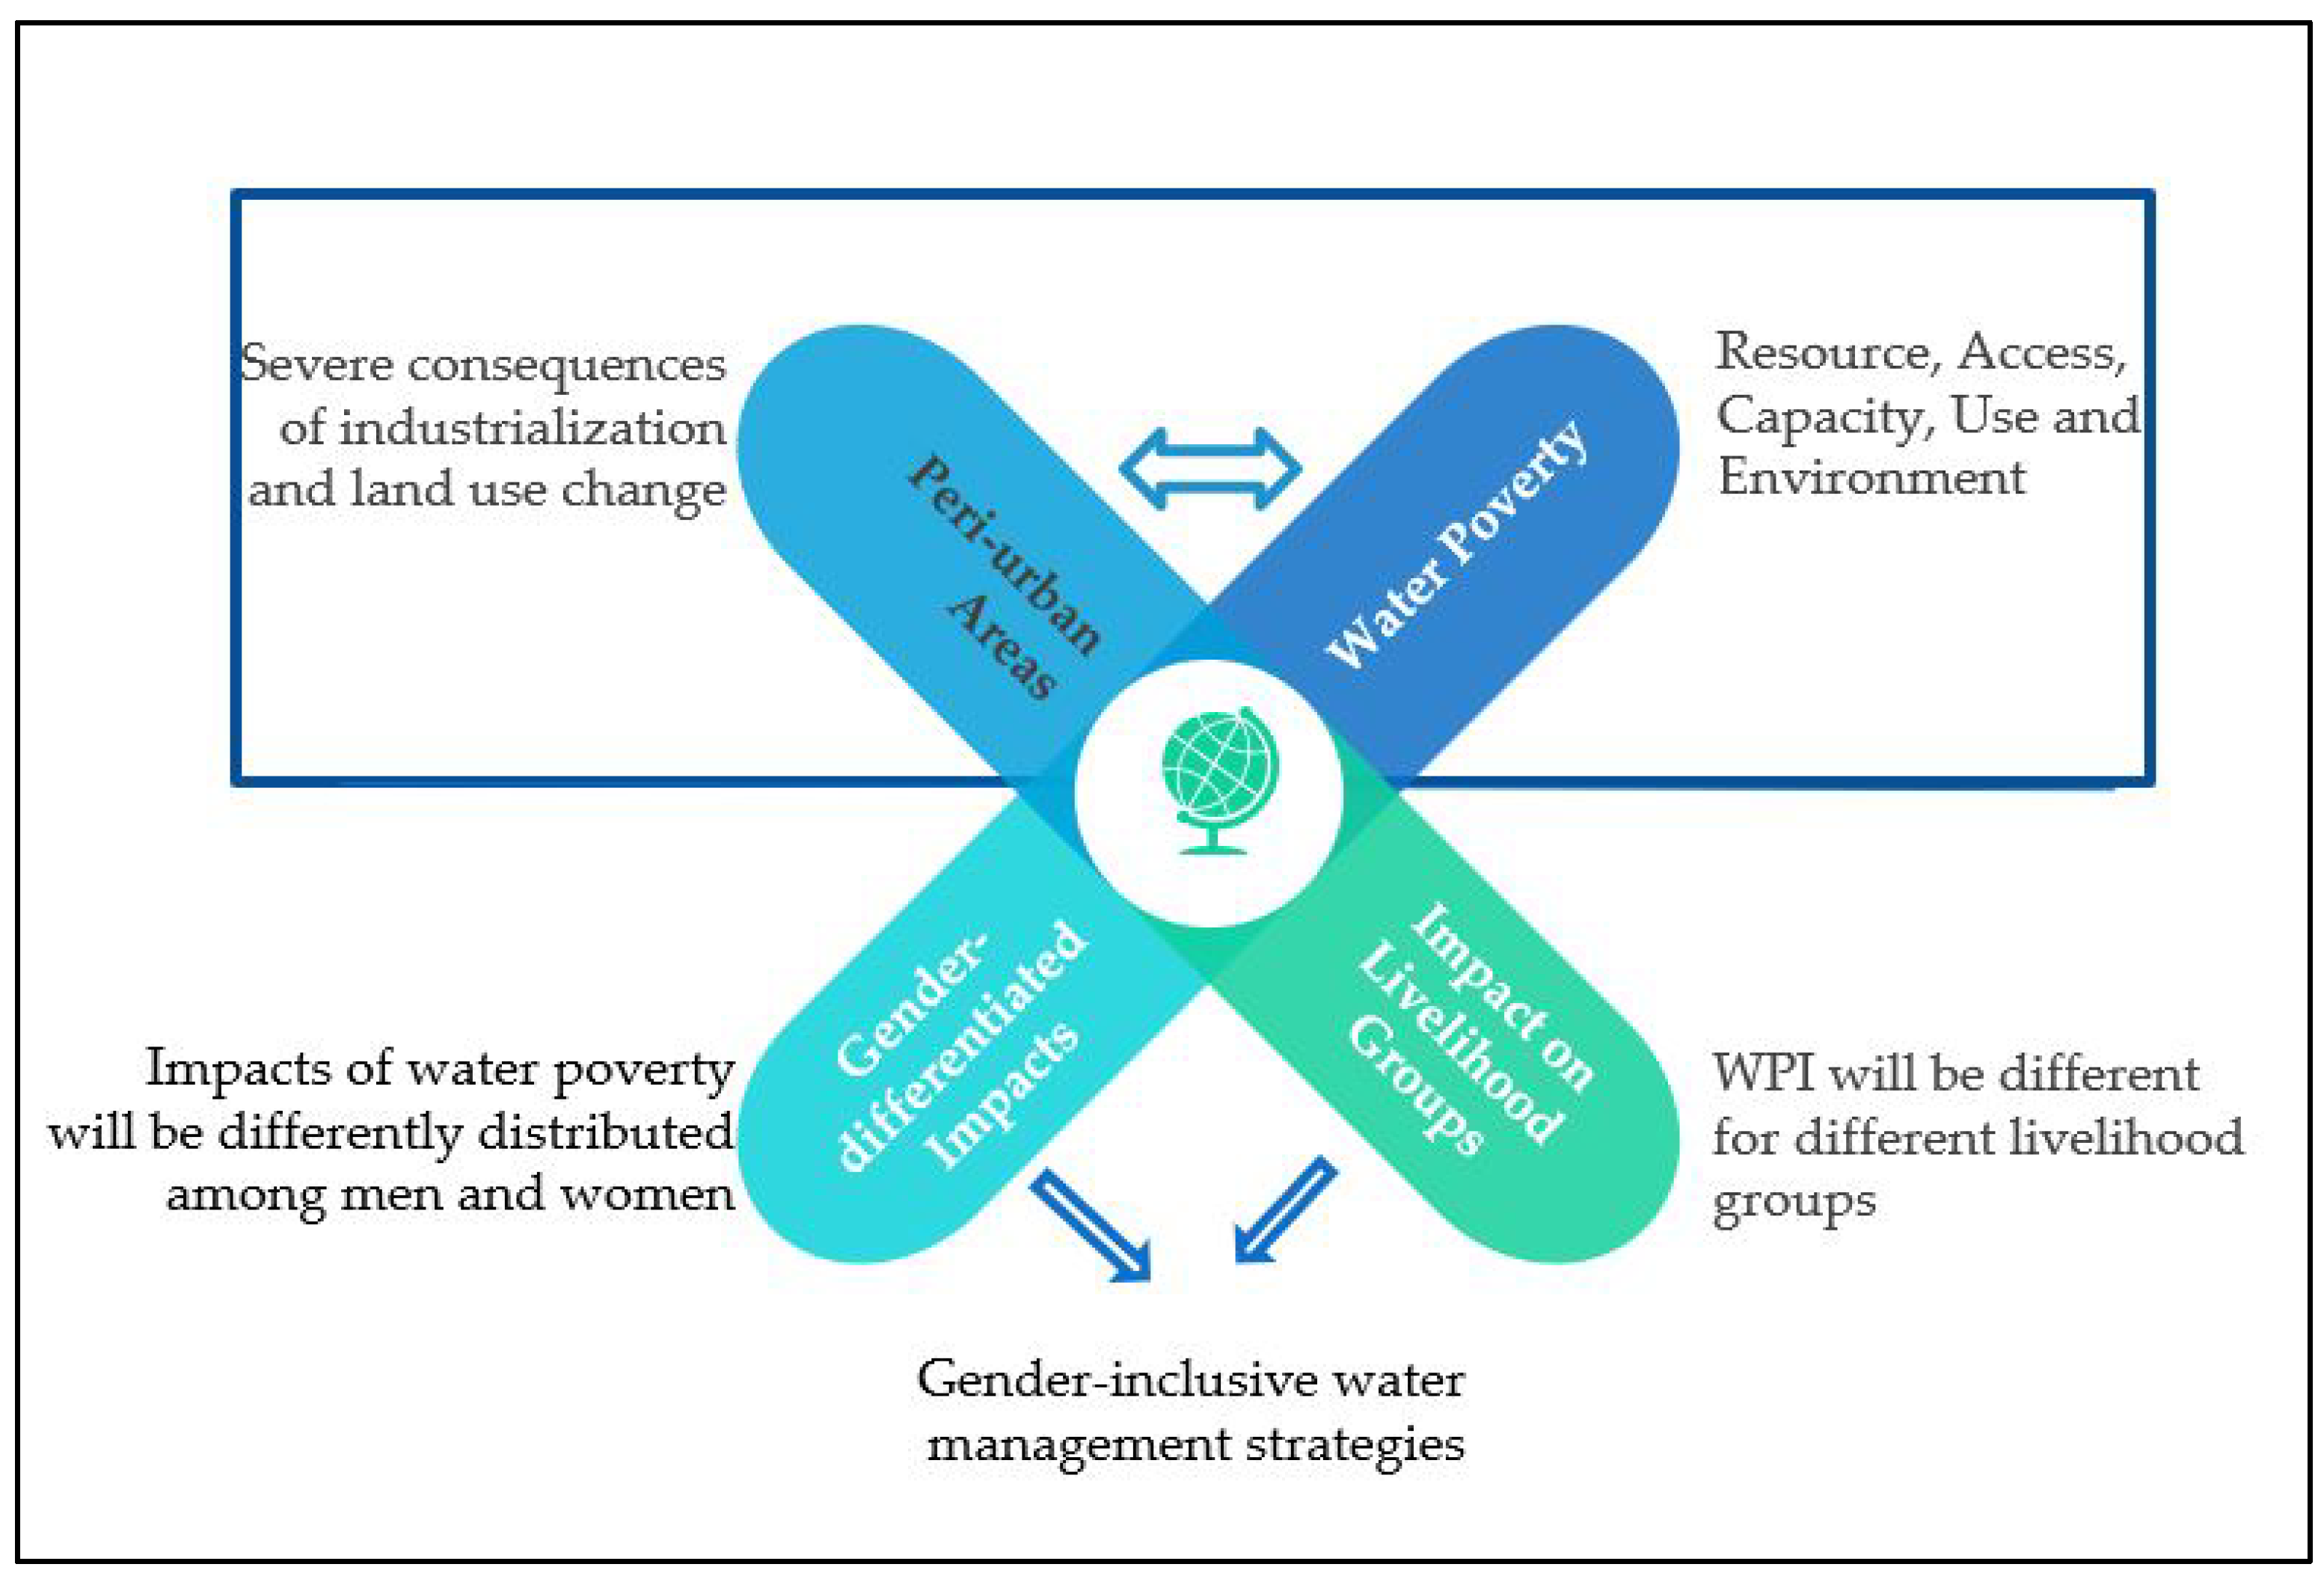
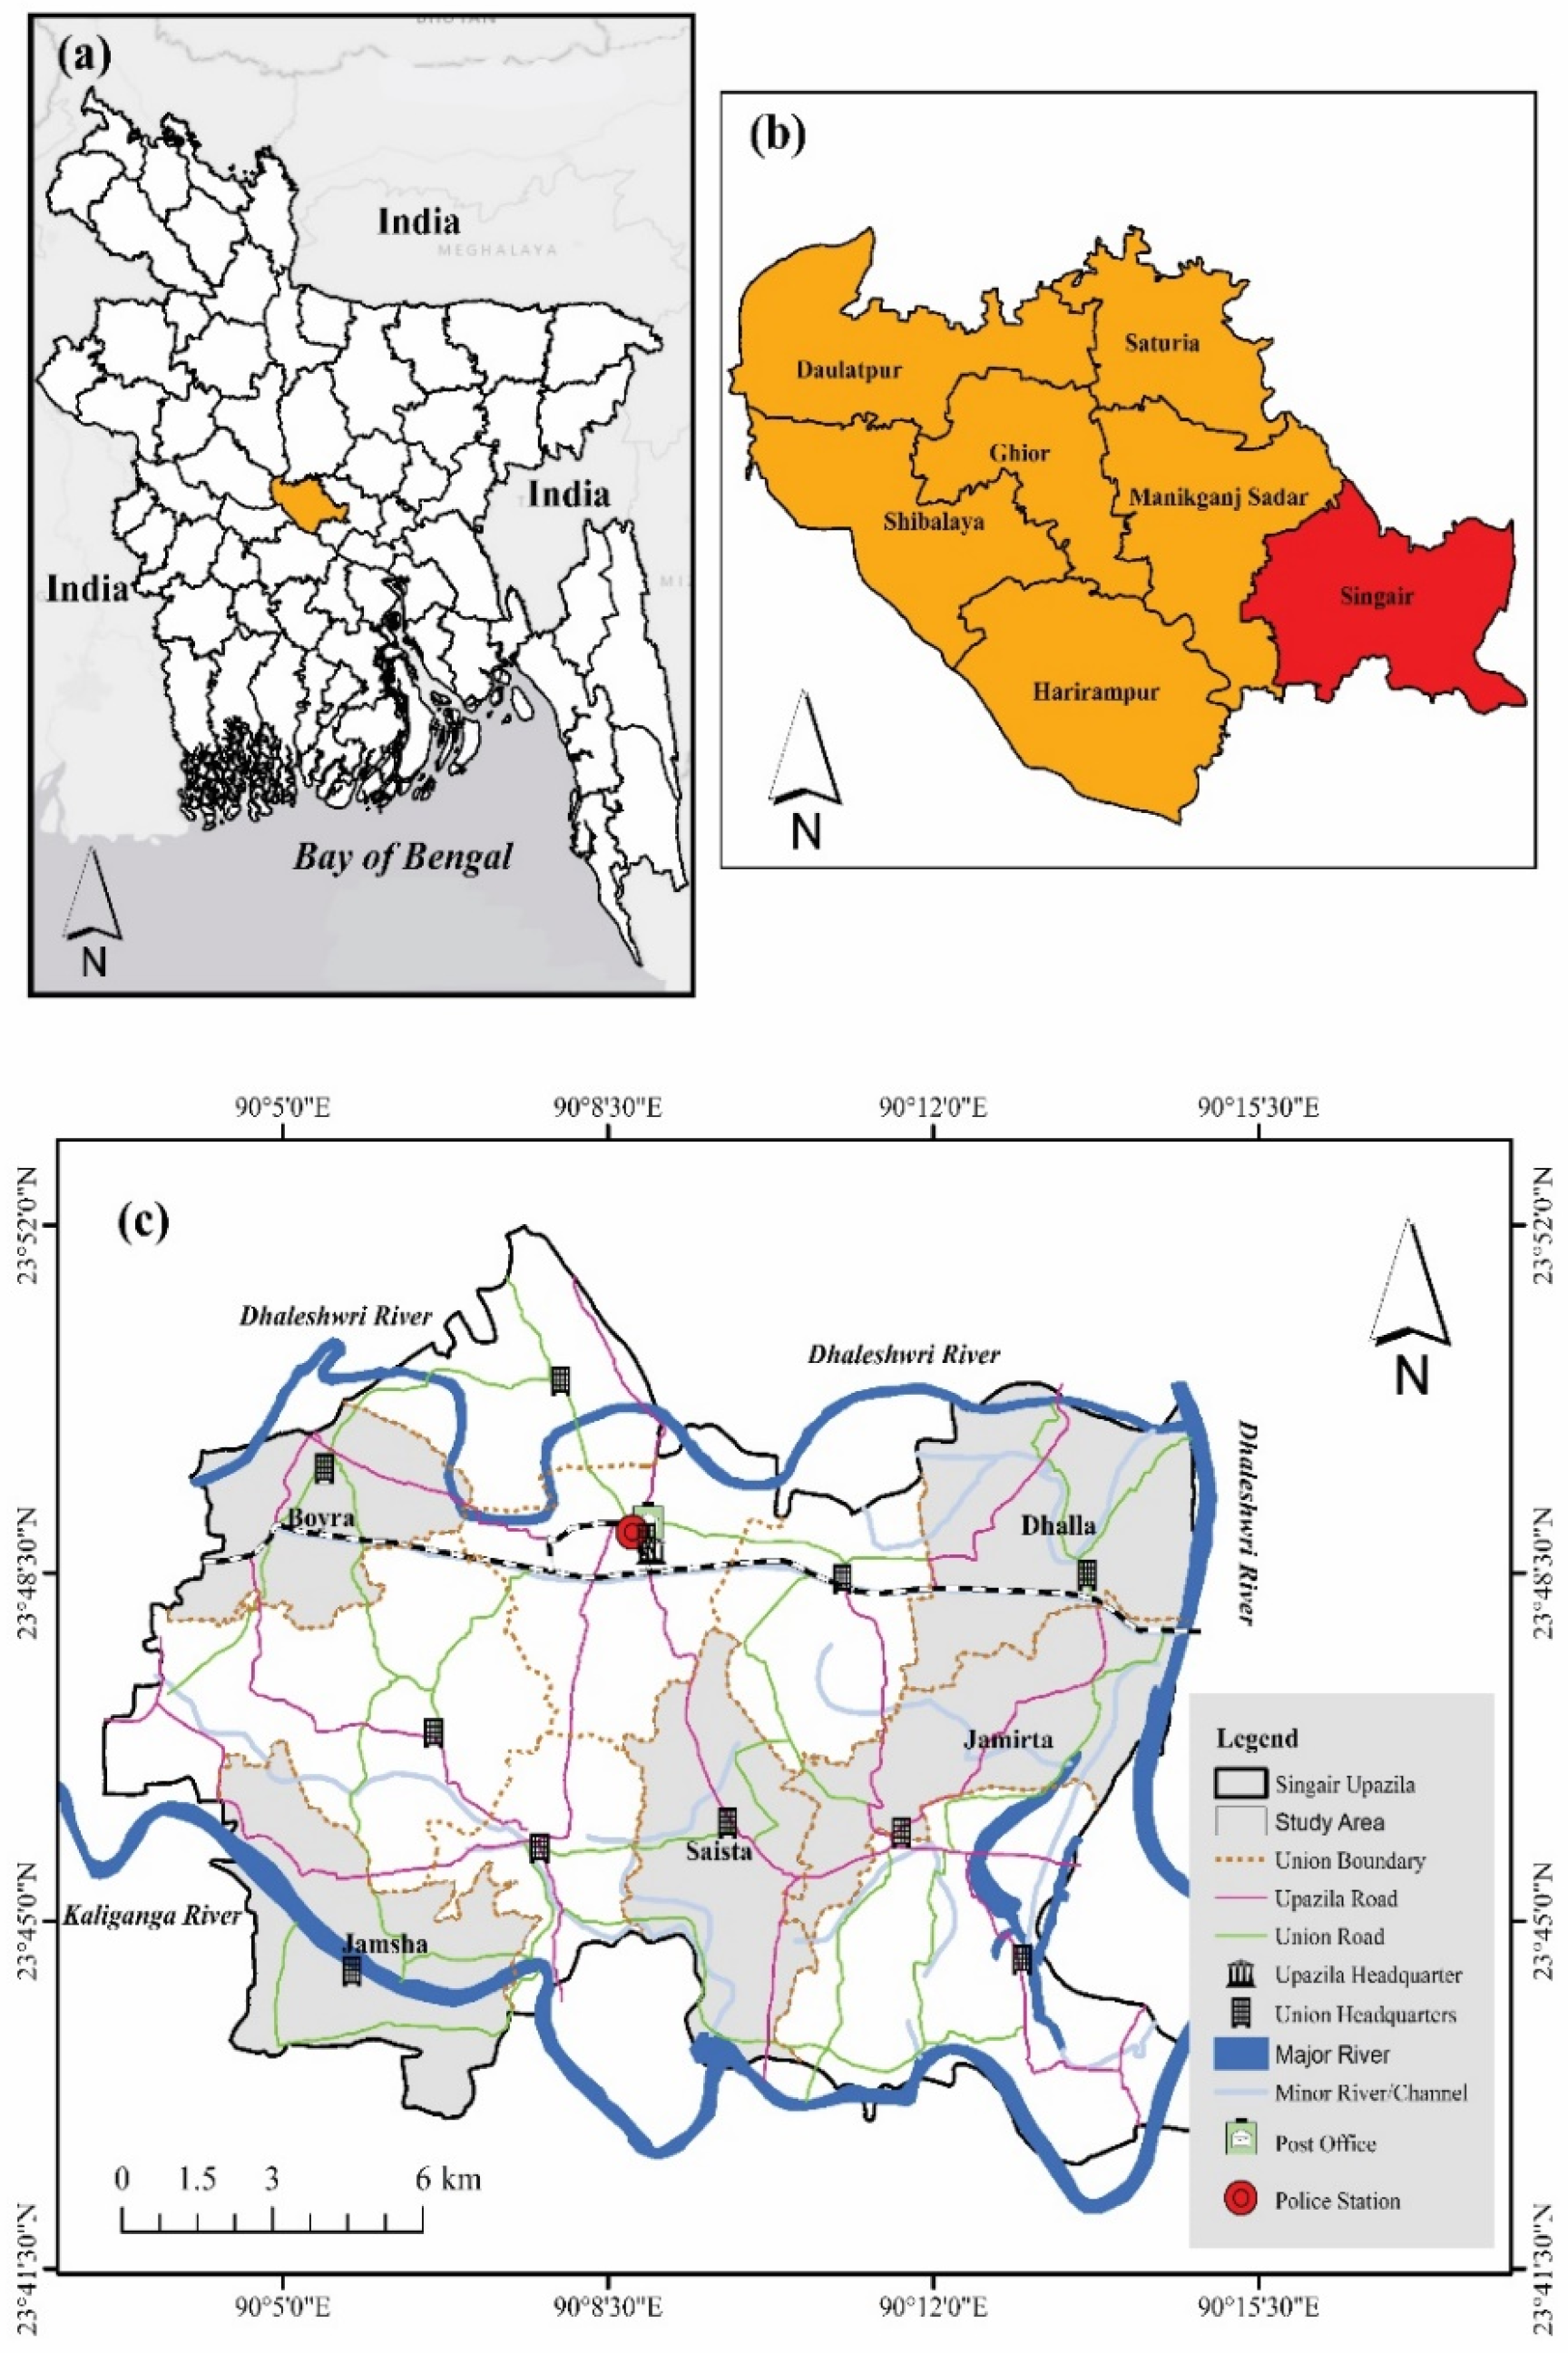
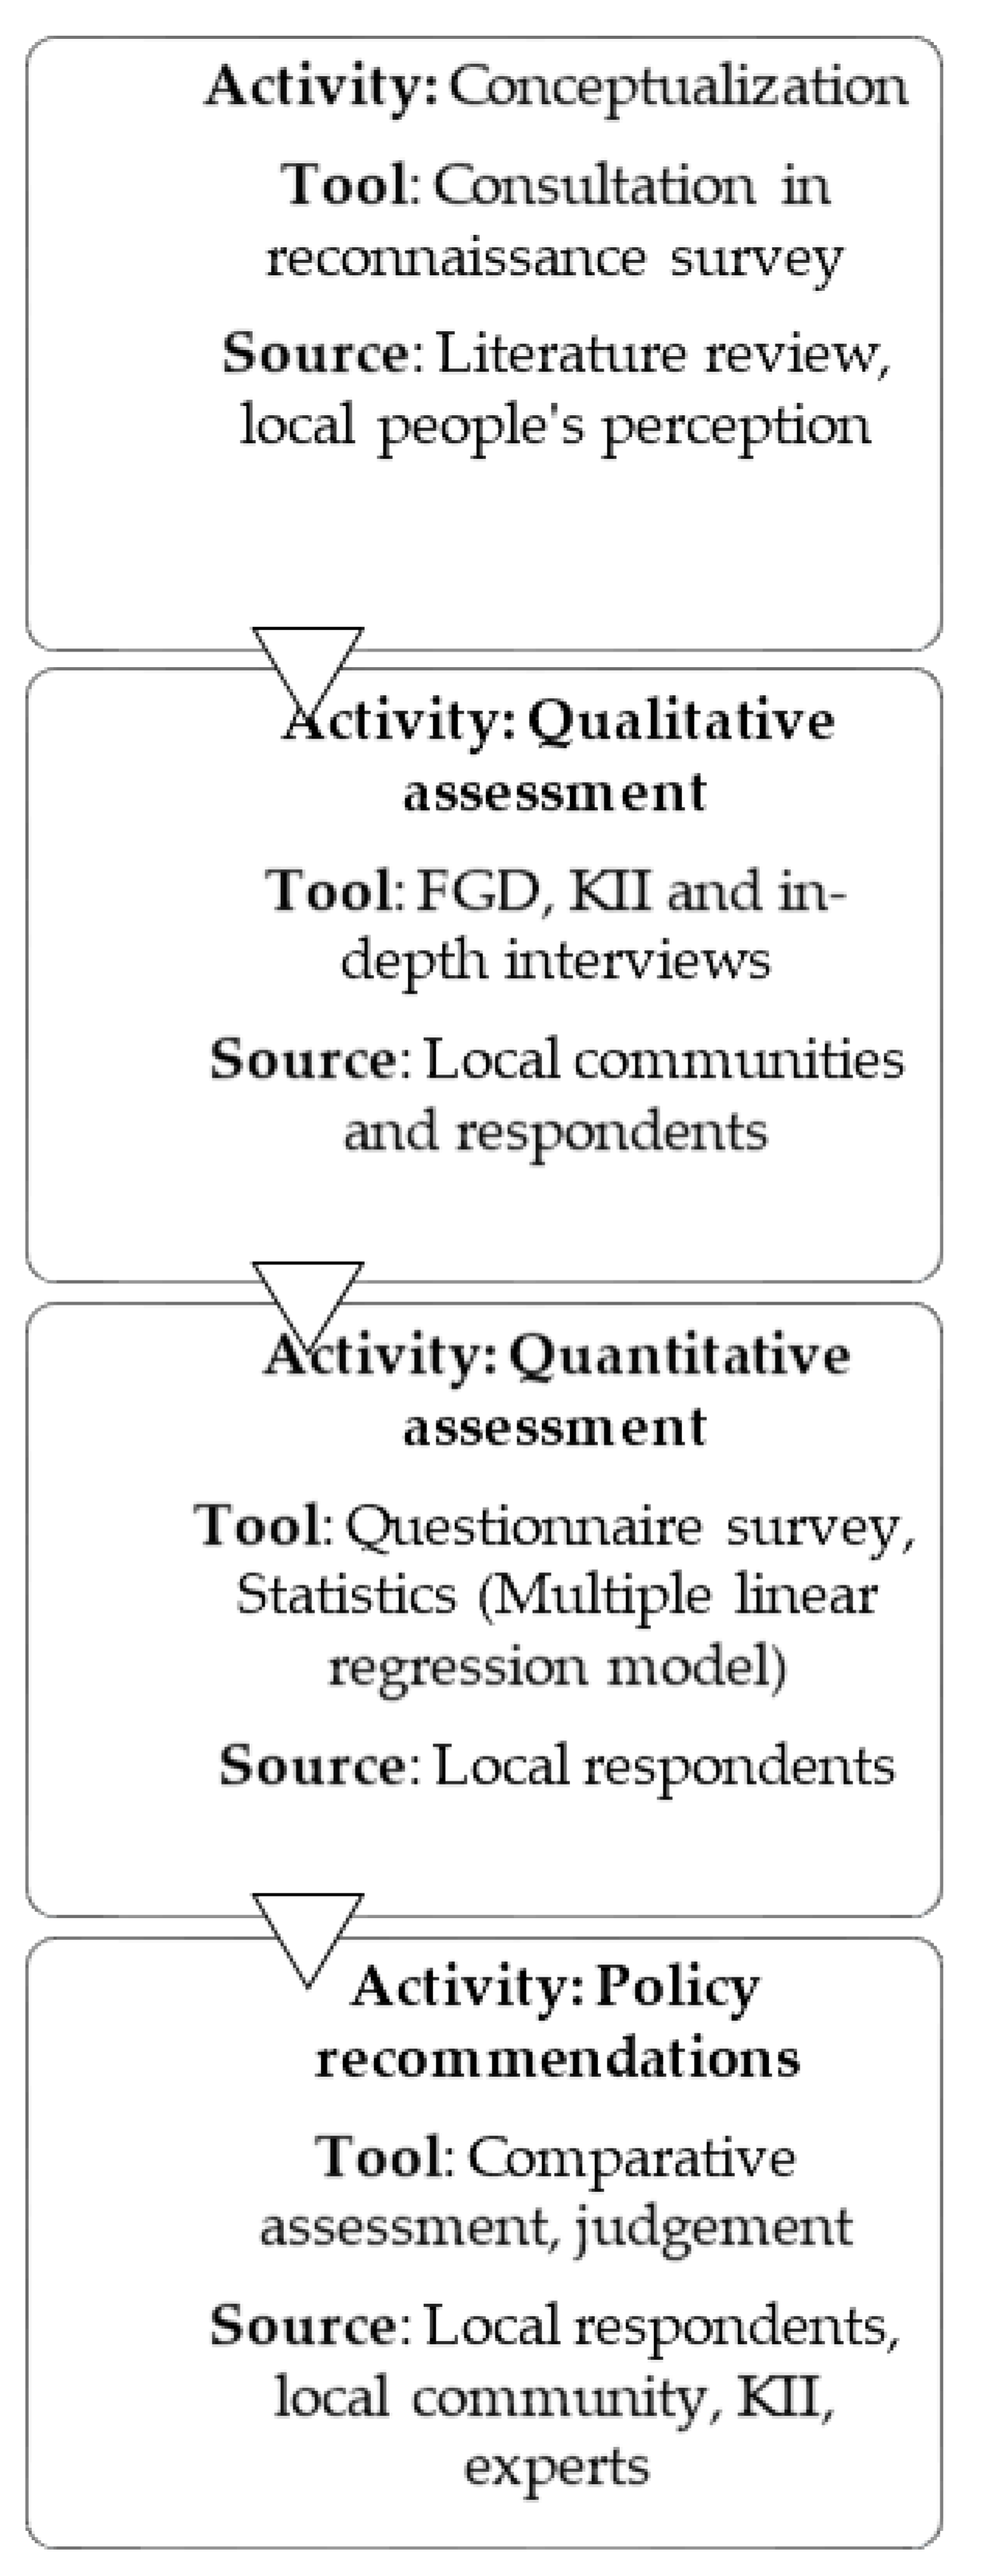
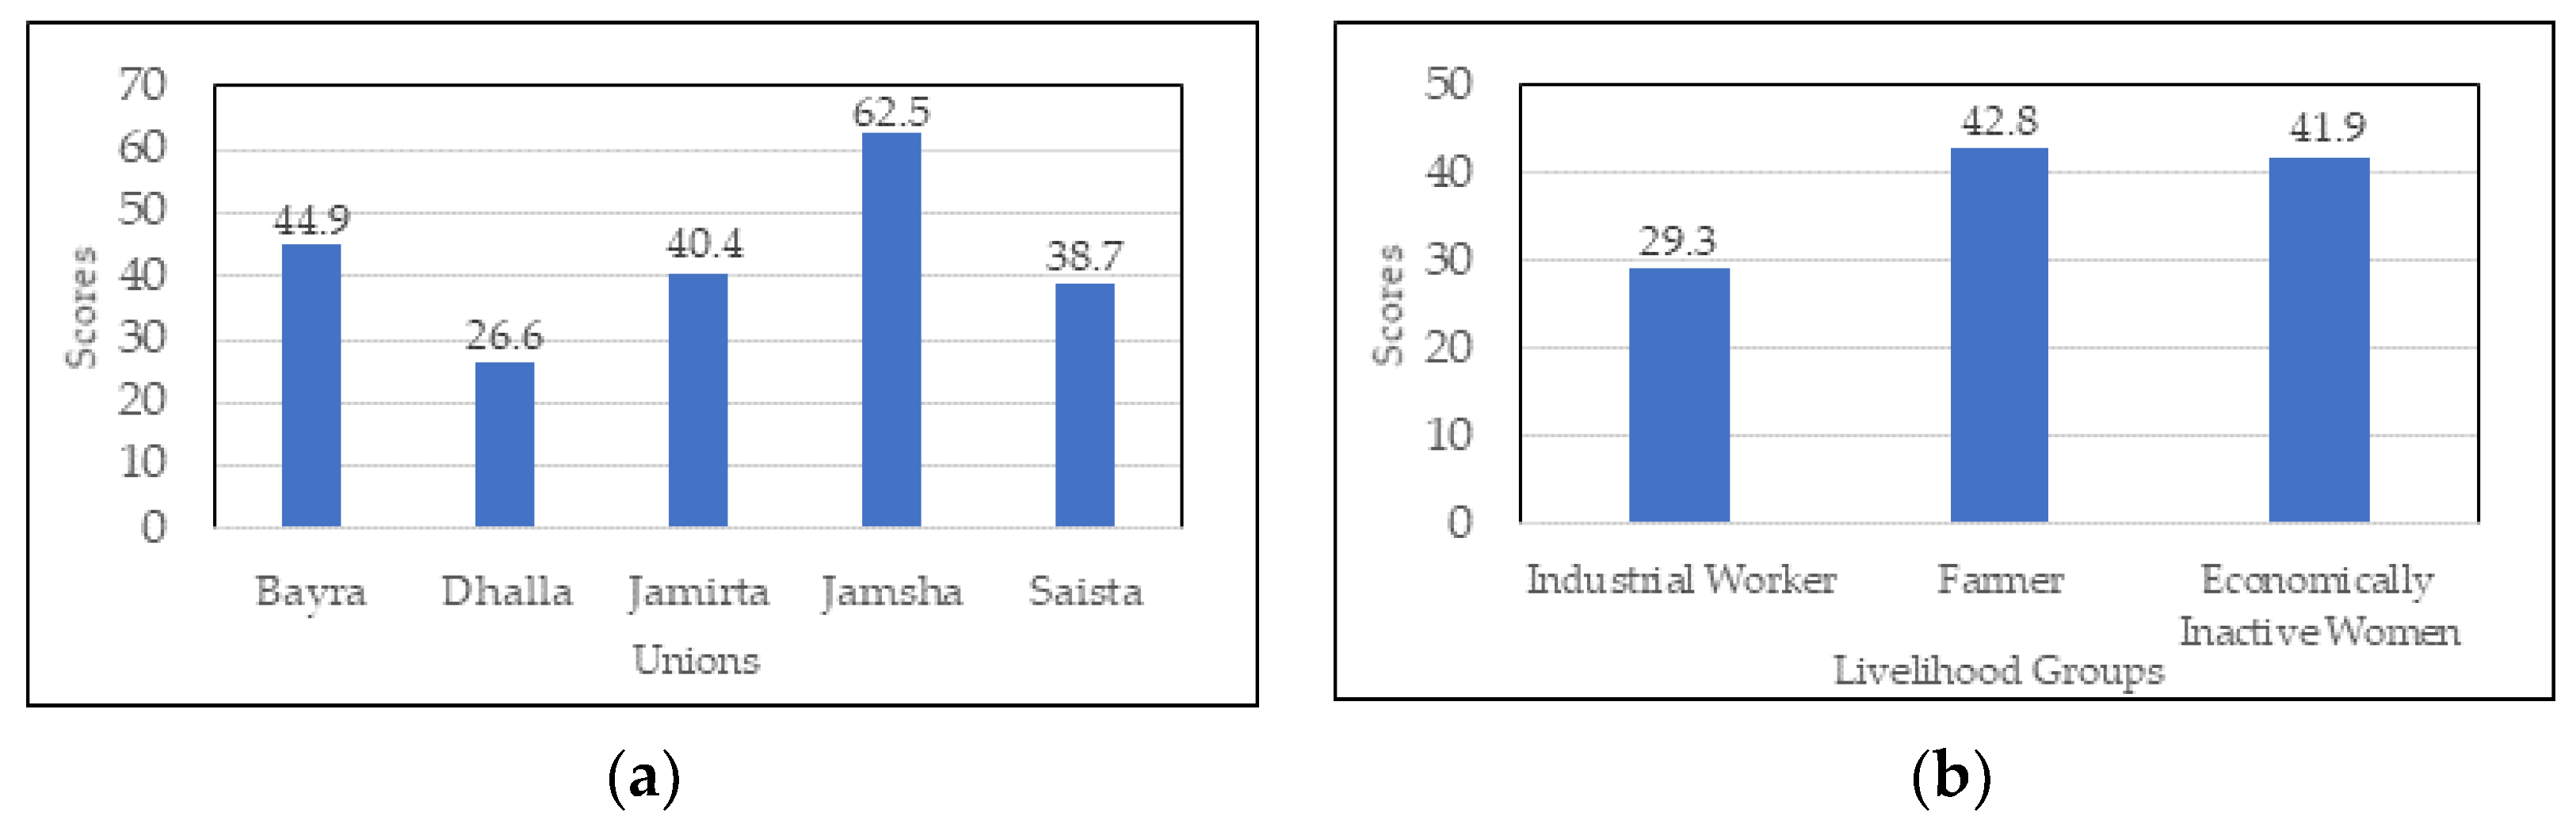
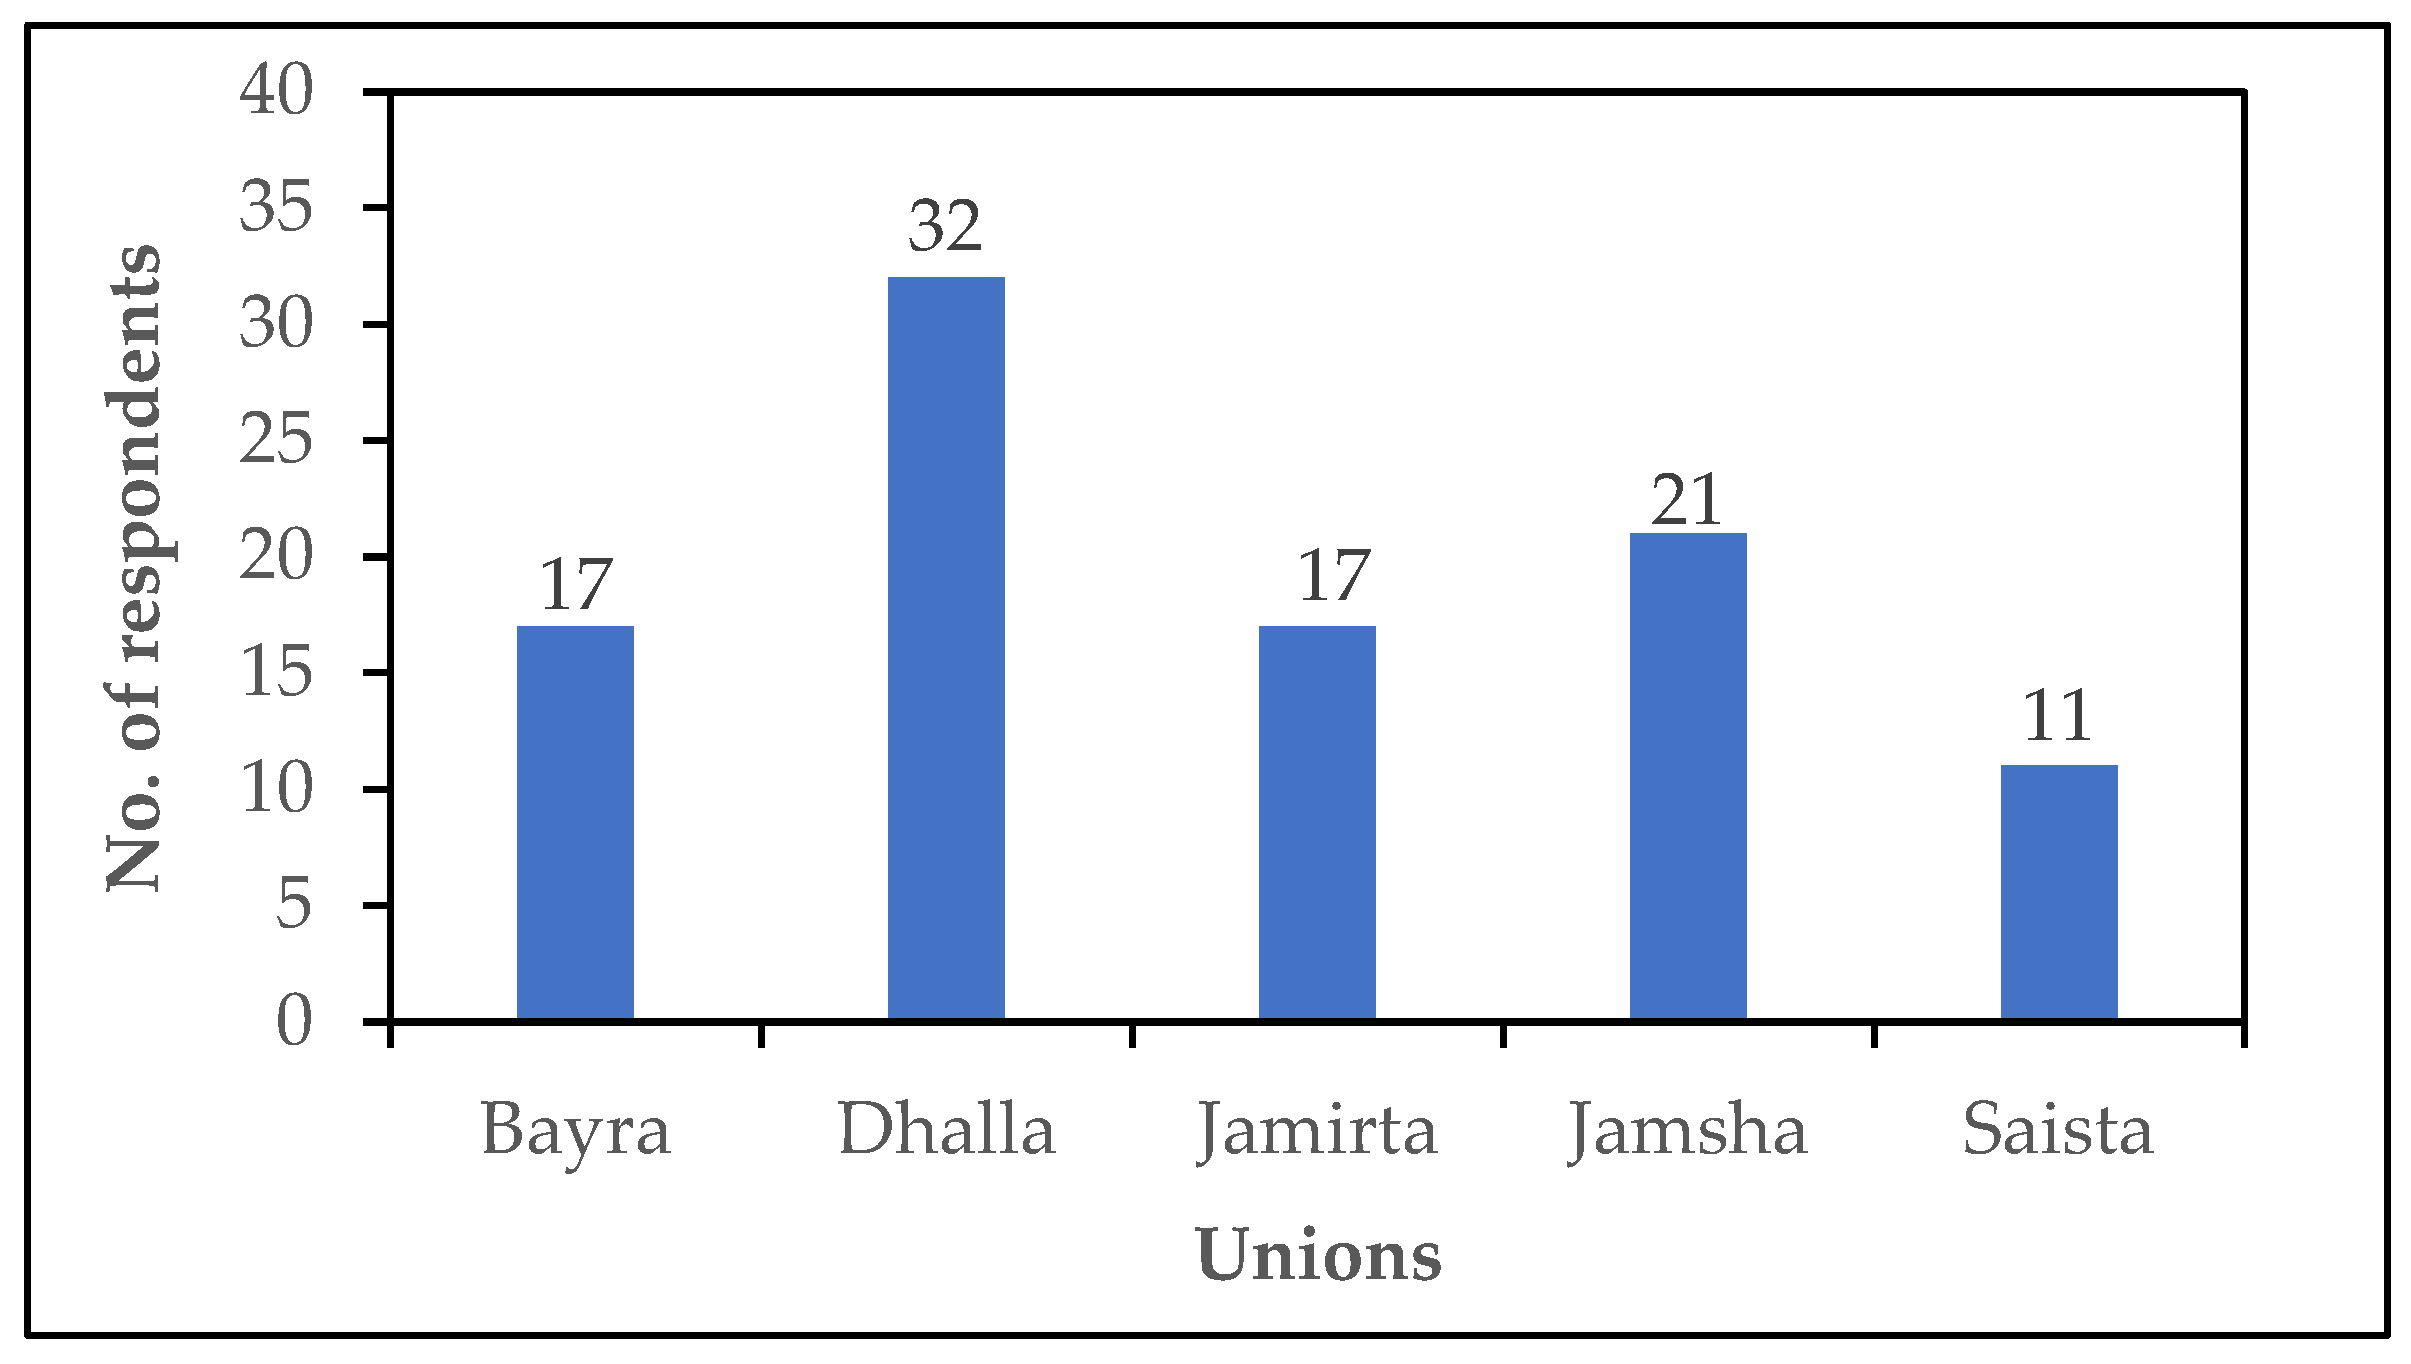
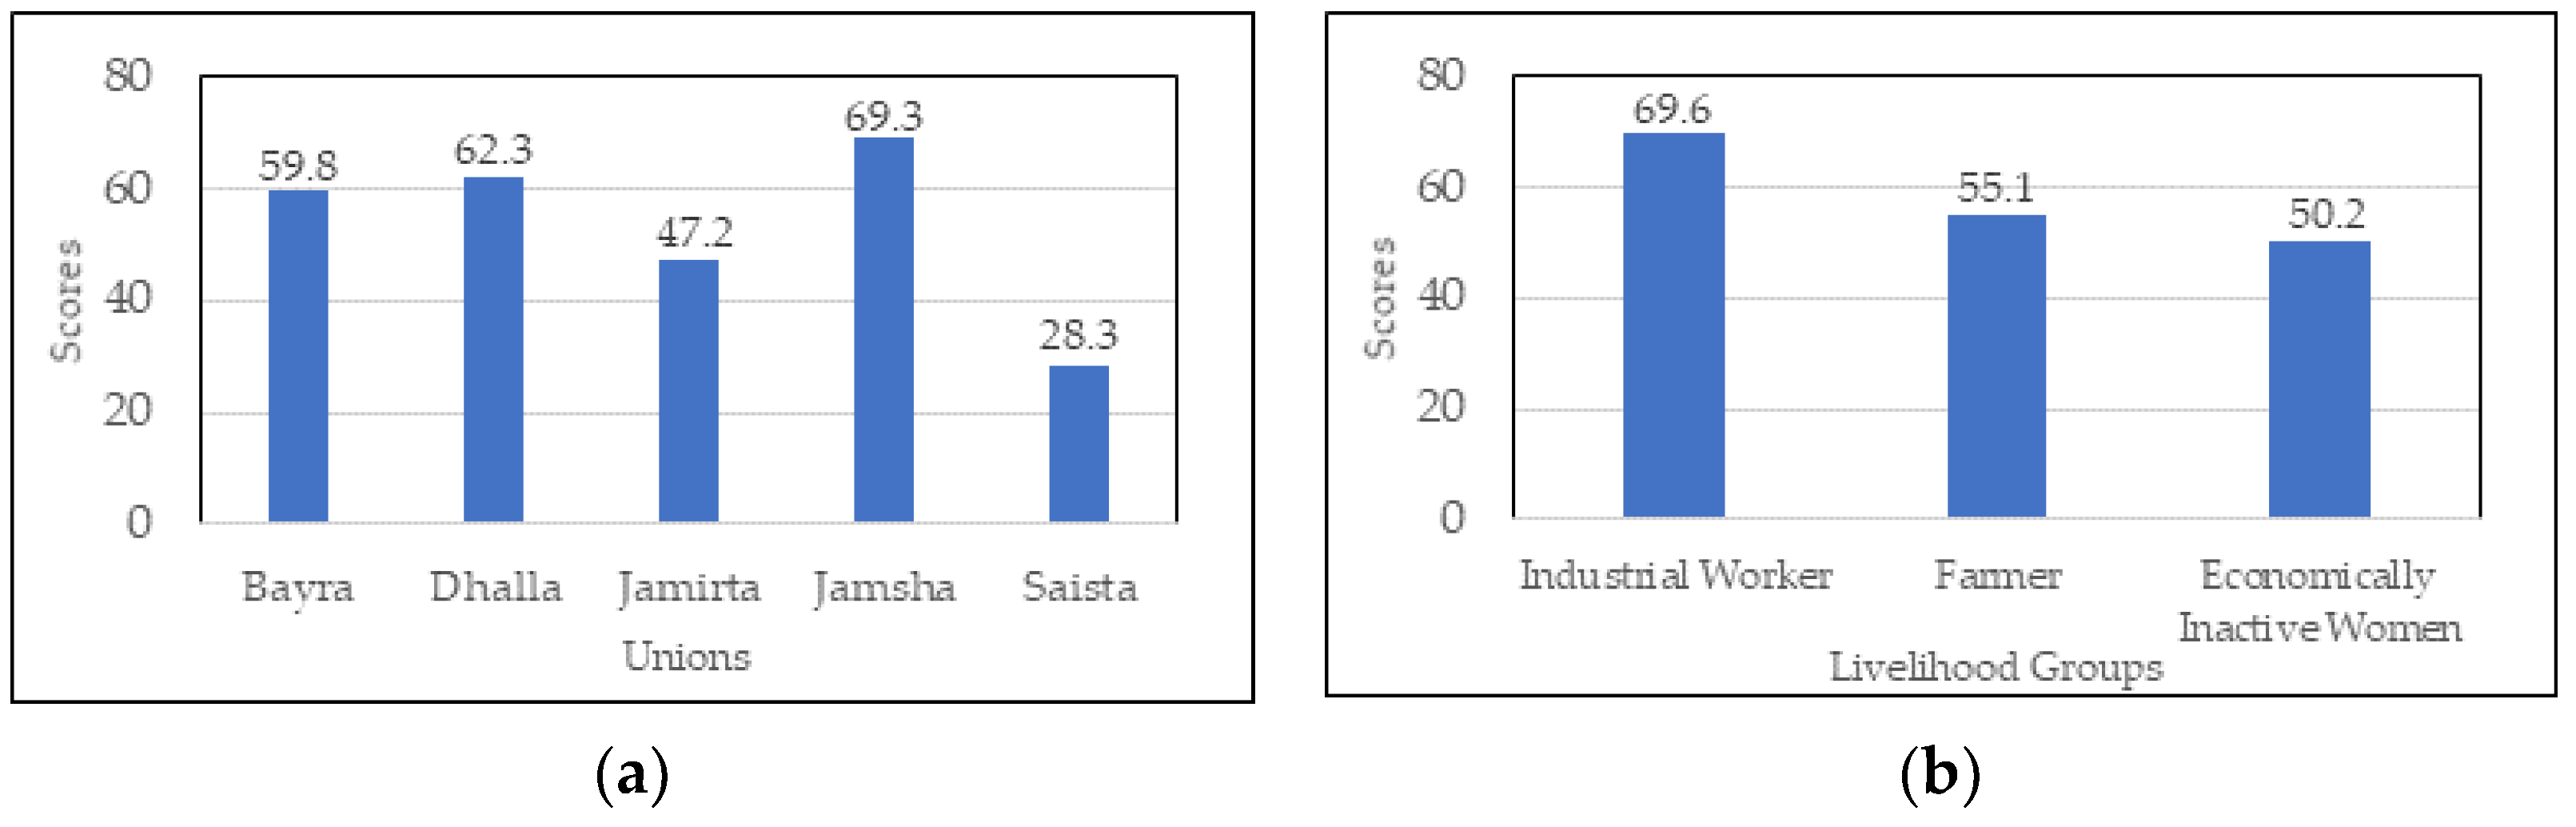
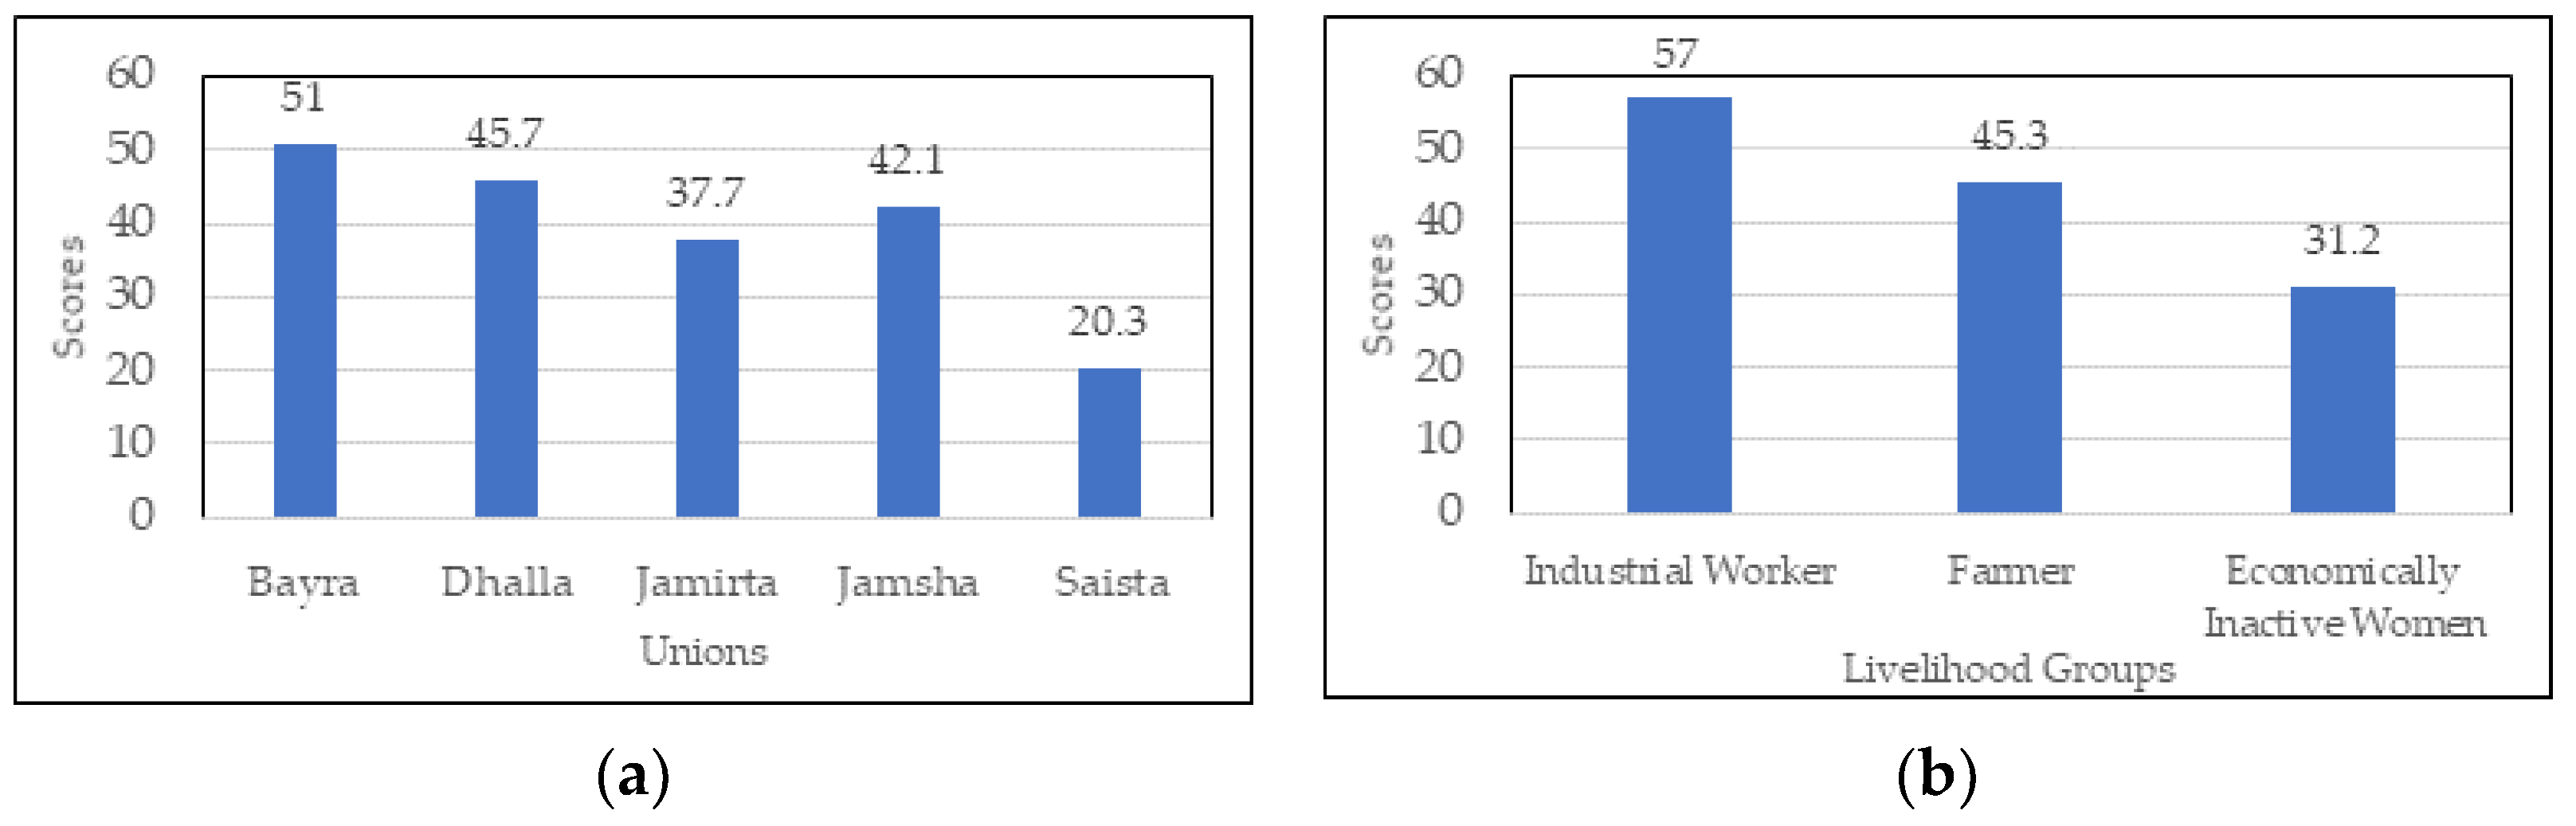
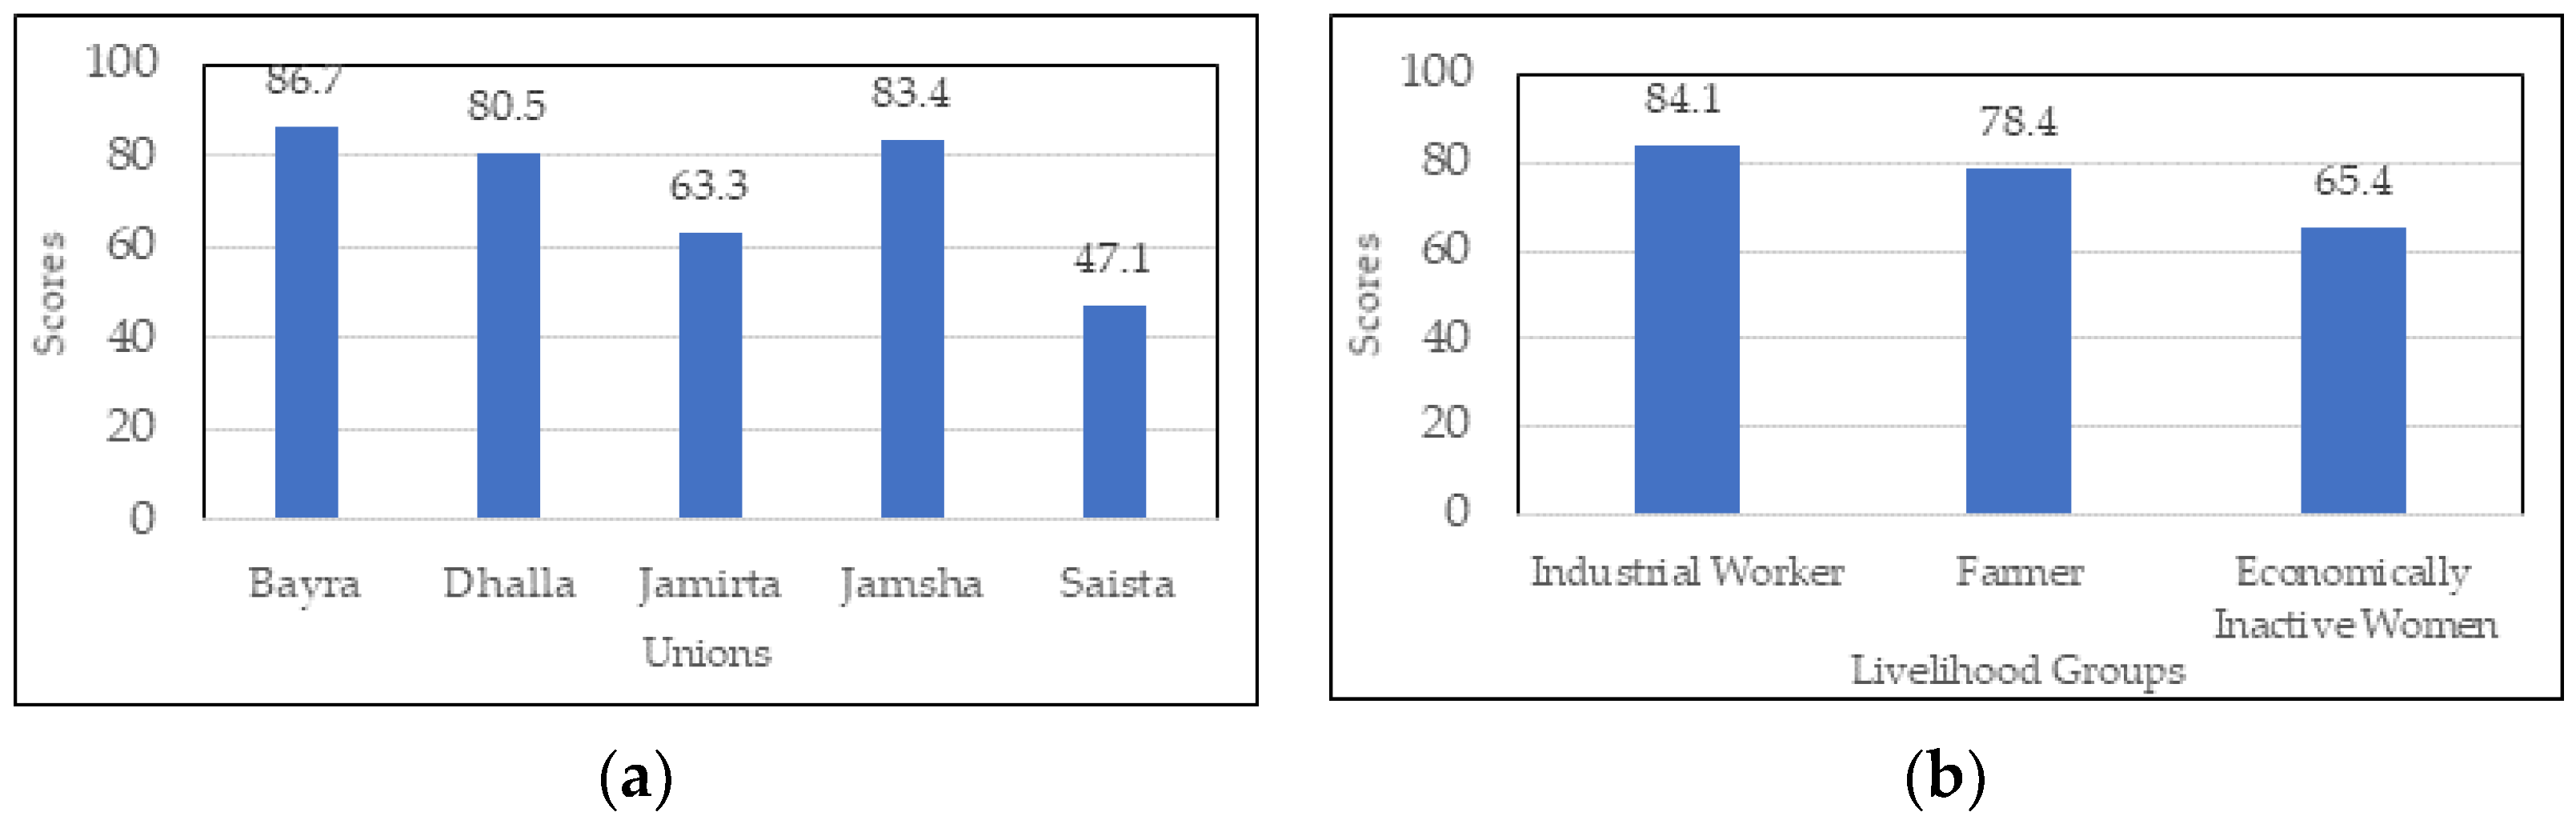
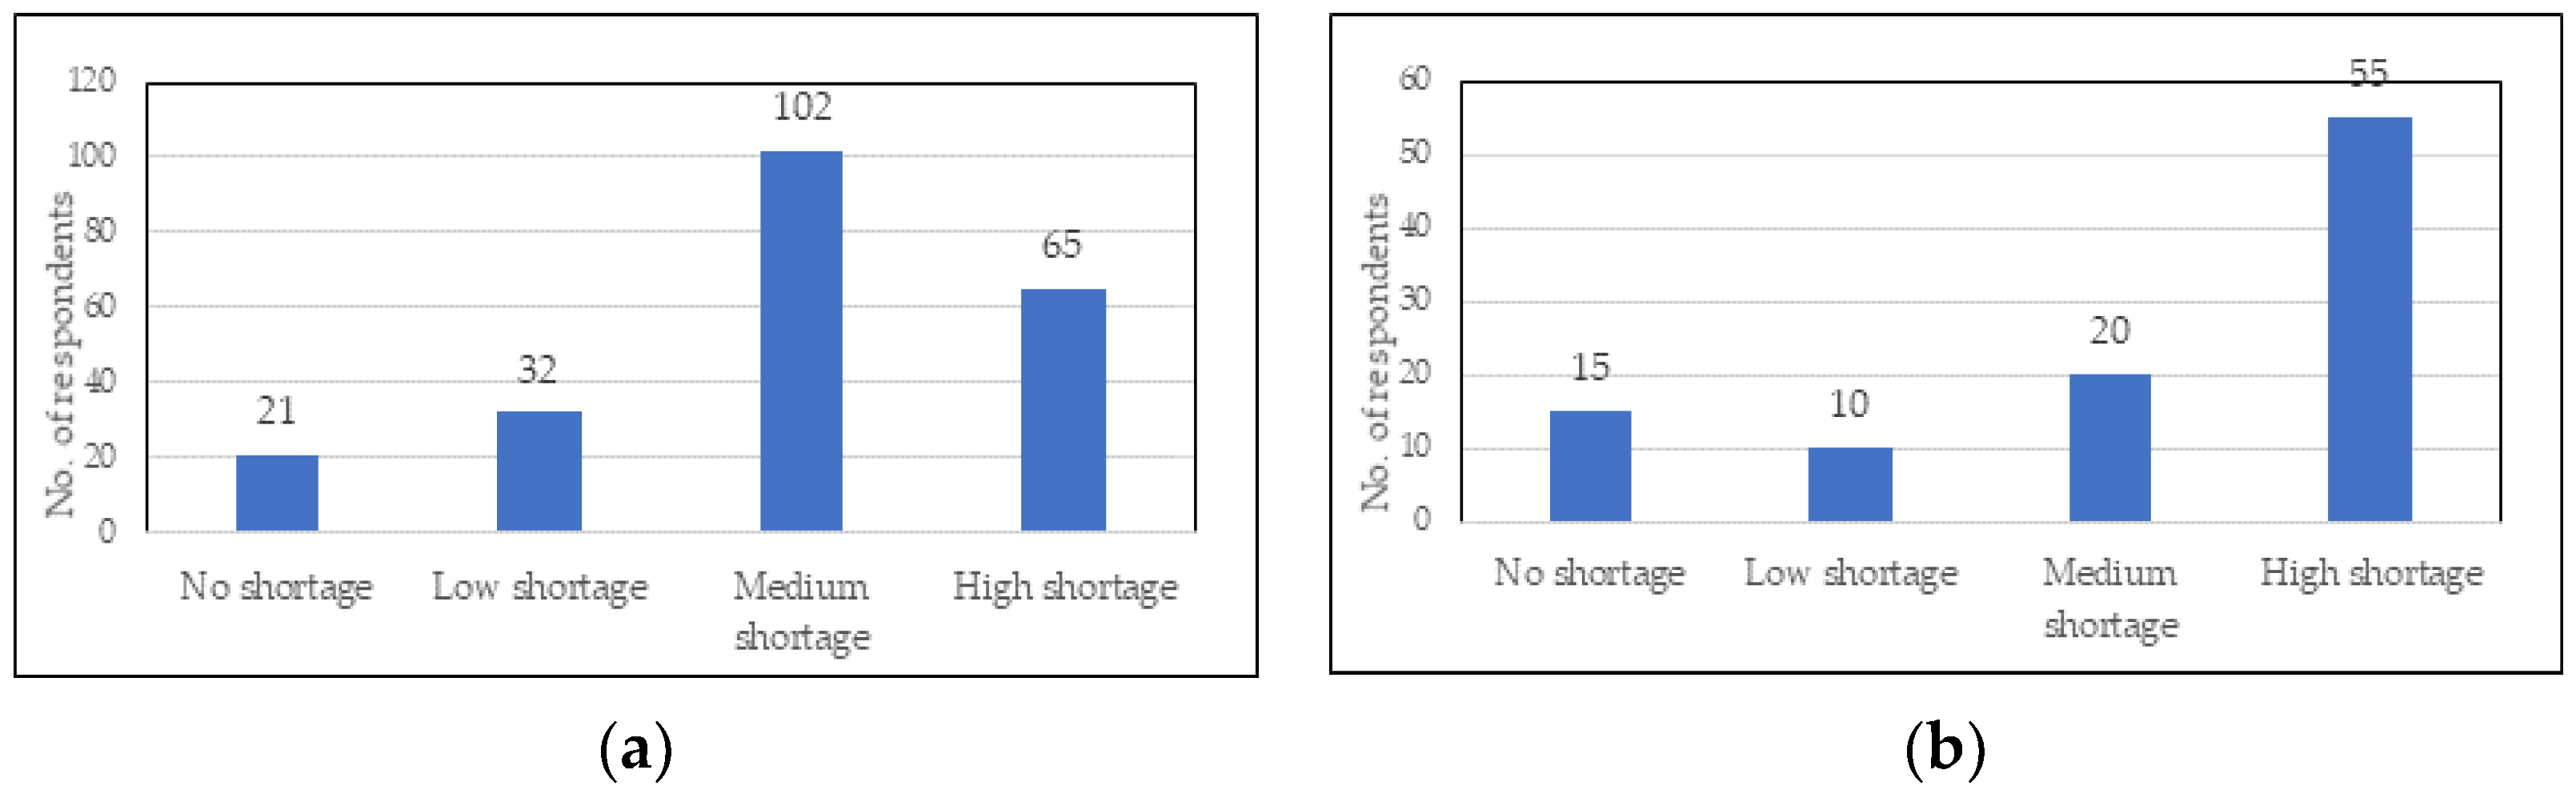
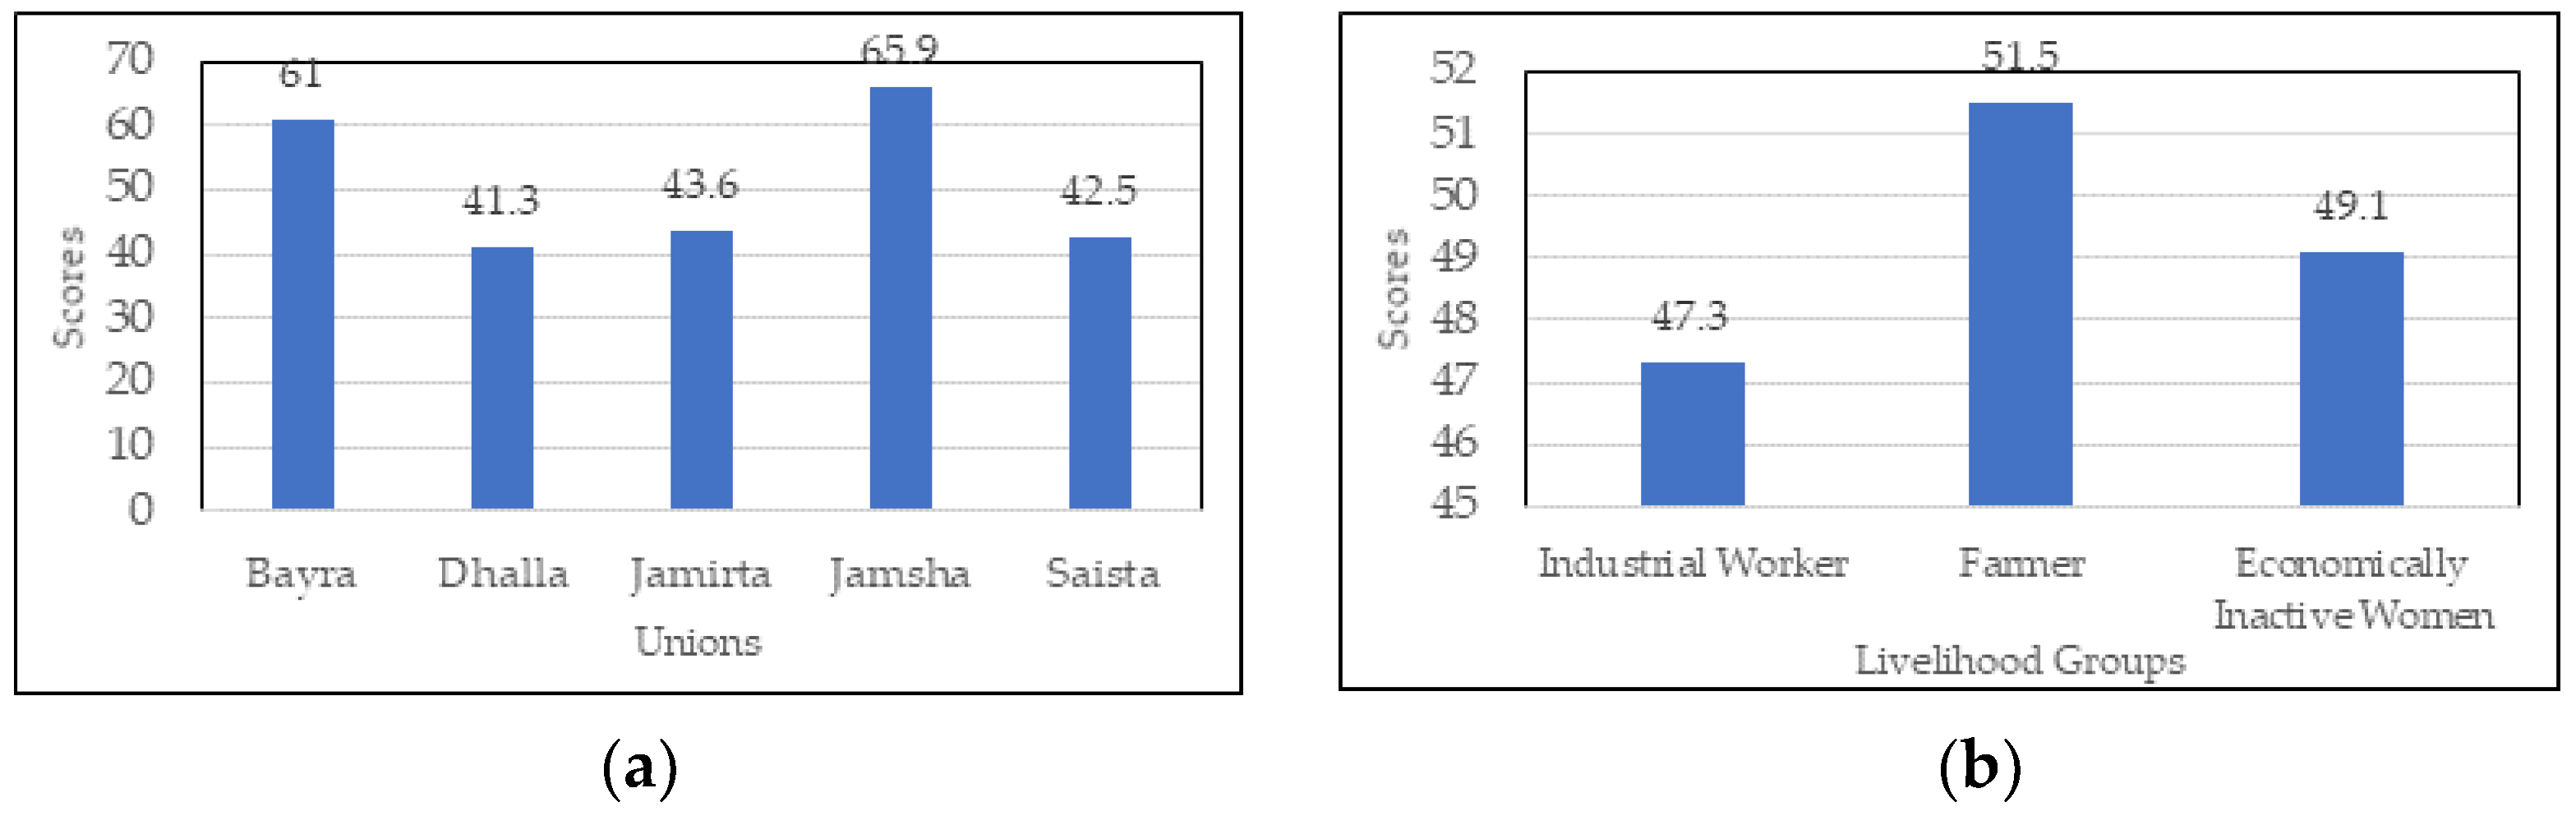
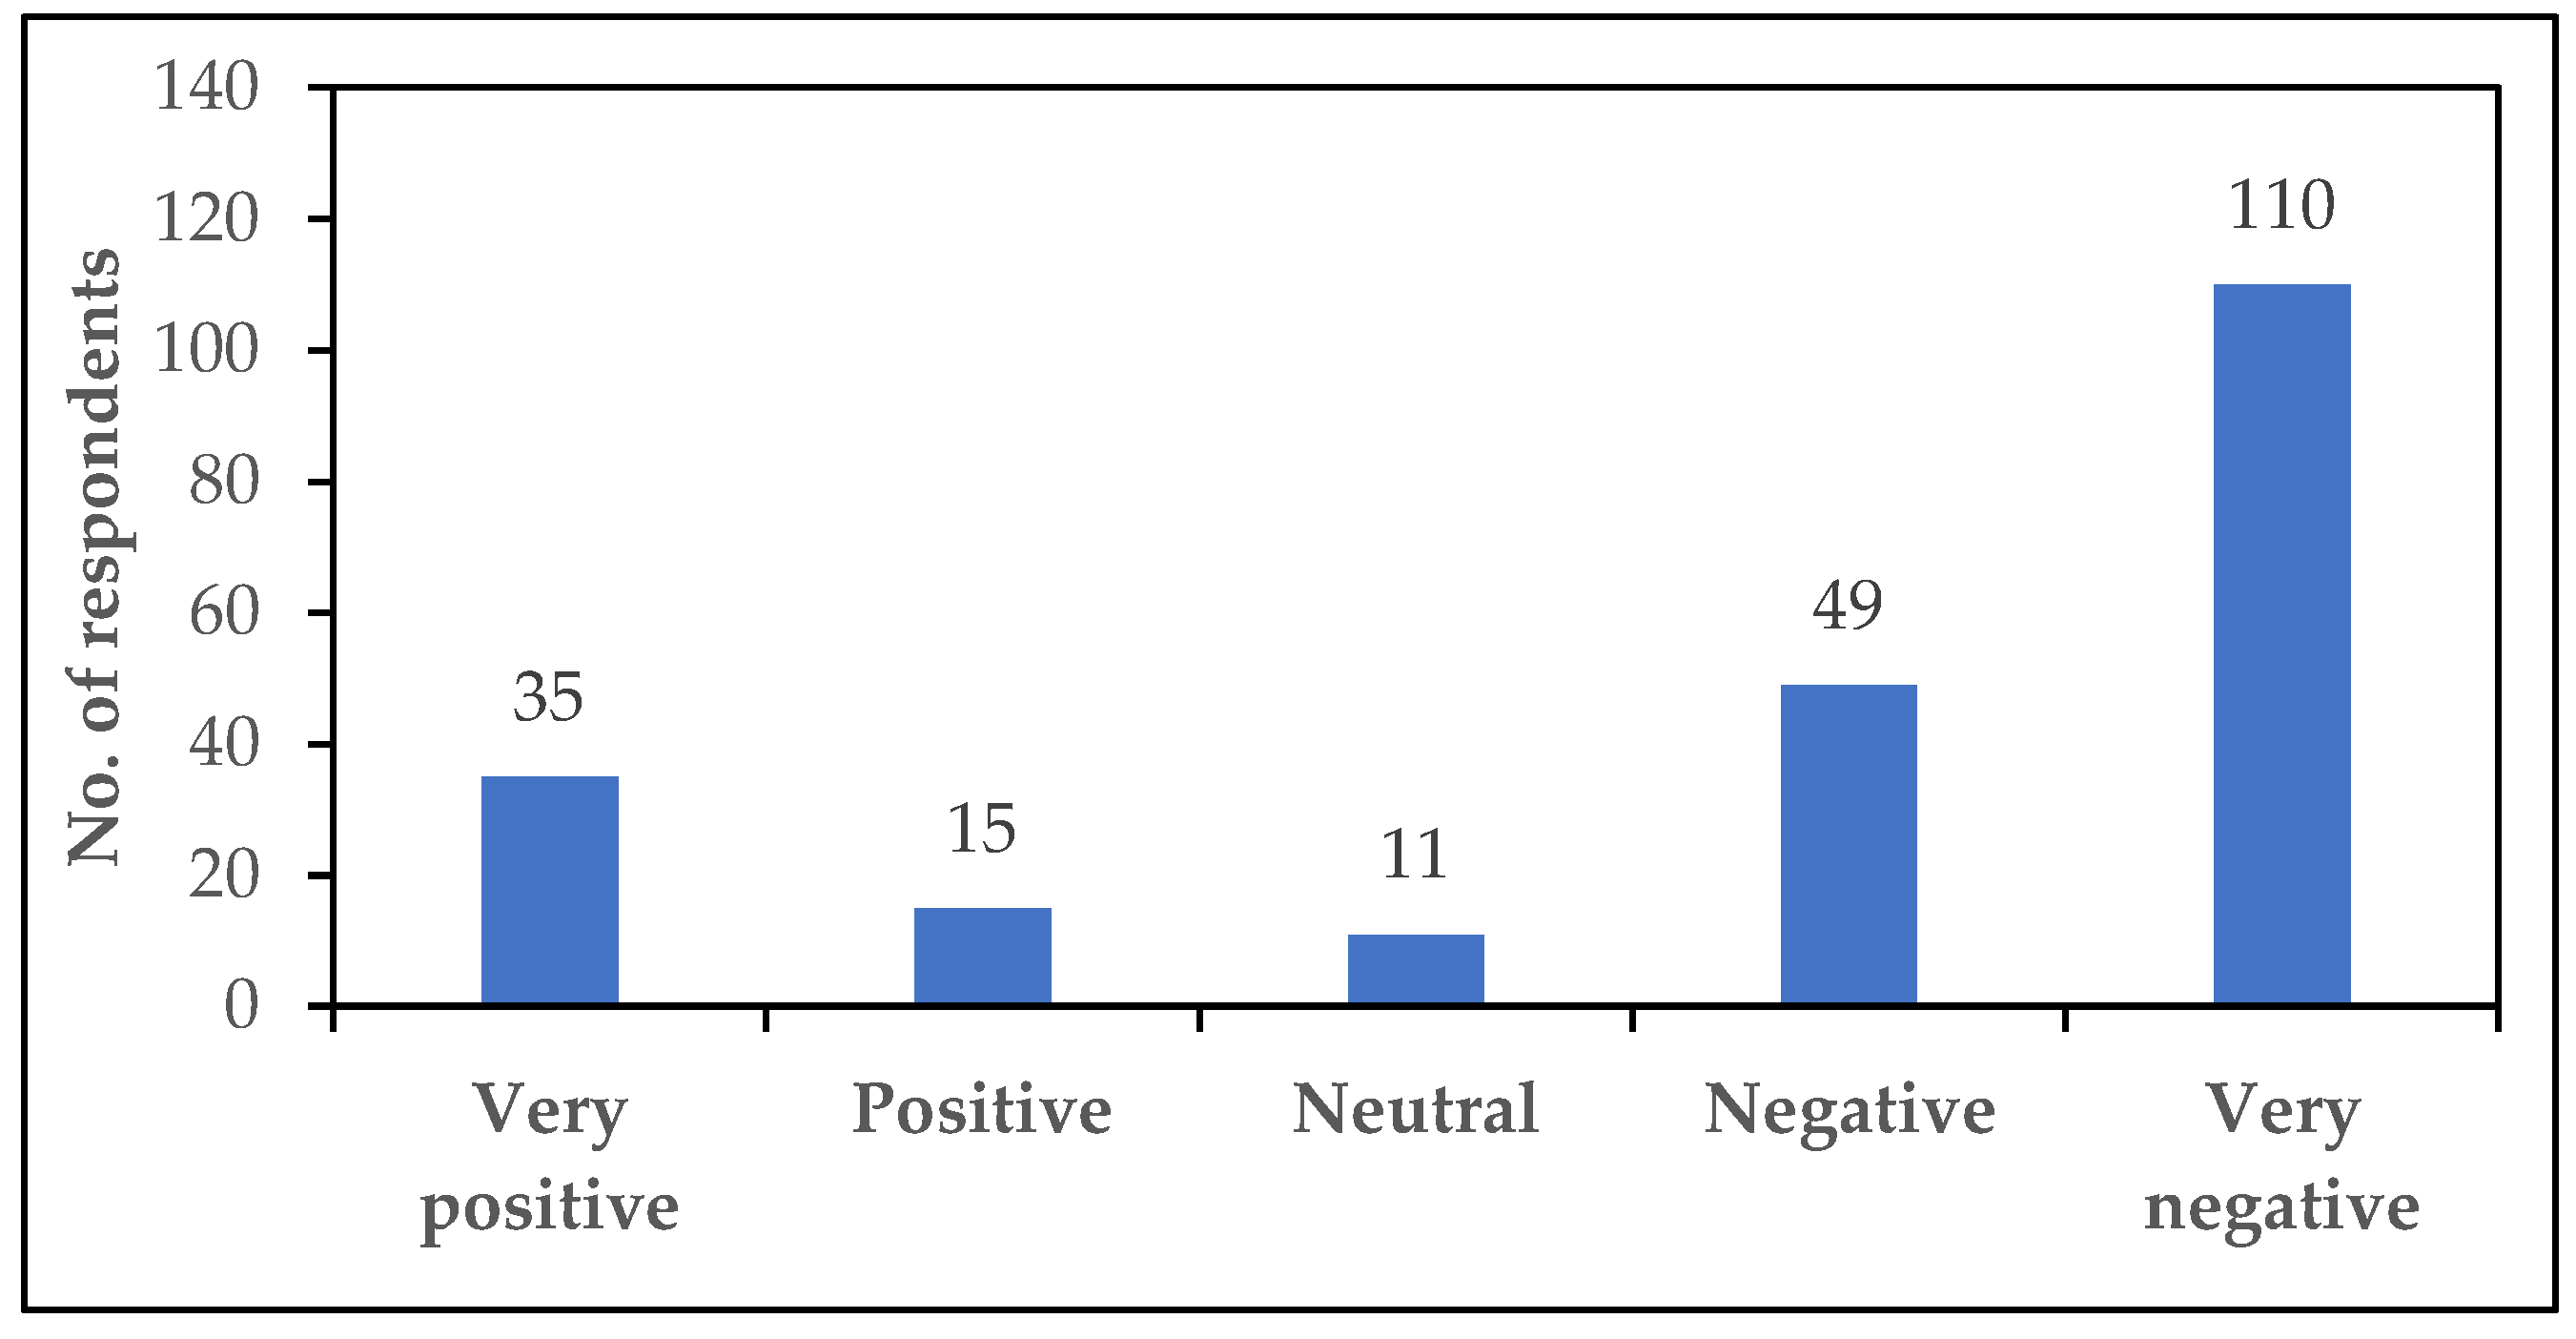
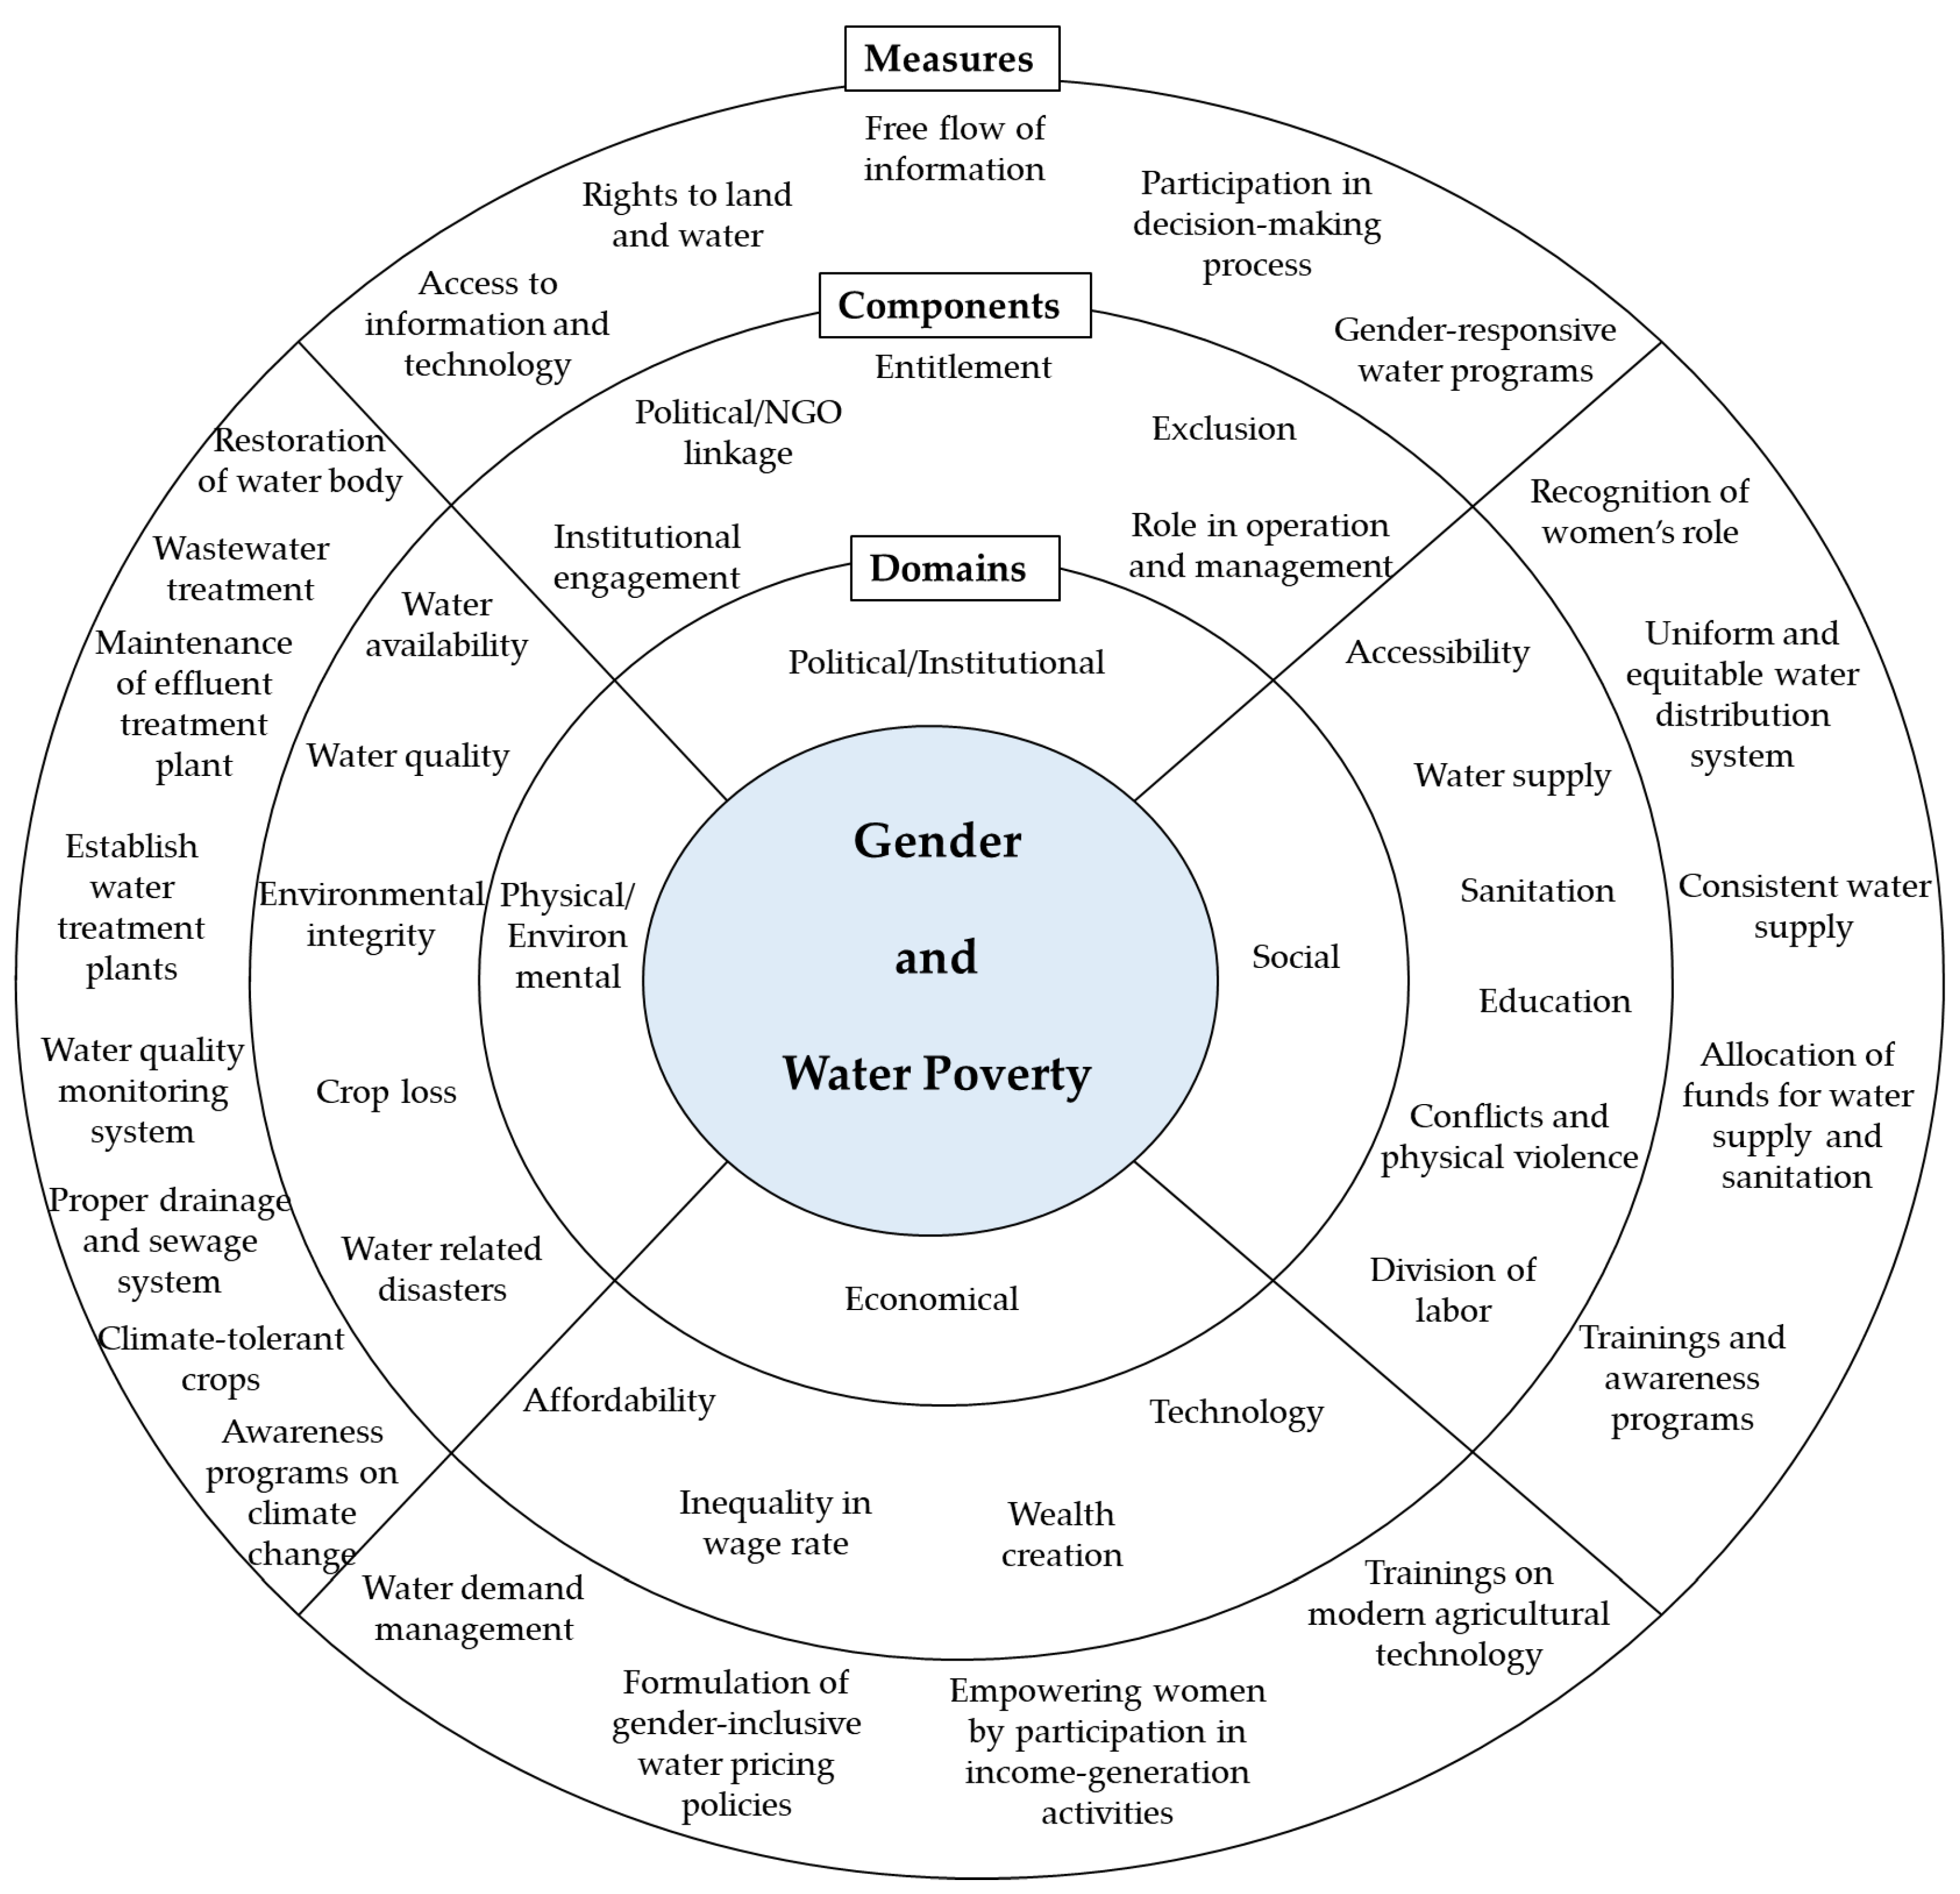
Table 1.
WPI structure used in the study.
| Components | Indicators |
|---|---|
| Resource | Surface and groundwater availability |
| Pollution and water quality | |
| Variability | |
| Access | Access to improved drinking water facilities |
| Access to irrigation | |
| Access to improved sanitation | |
| Access to healthcare facilities | |
| Capacity | Economic capacity |
| Social capacity | |
| Operation and management | |
| Use | Water consumption in different sectors |
| Conflicts regarding water use | |
| Environment | Water body health indicator |
| Water-related disasters | |
| Vegetation cover and land use |
Table 2.
Comparison of basic features among the five study unions.
| Features | Bayra | Dhalla | Jamirta | Jamsha | Saista |
|---|---|---|---|---|---|
| Area (km2) | 14.88 | 22.43 | 16.75 | 22.01 | 20.71 |
| Villages | 20 | 22 | 26 | 15 | 41 |
| Total no. of households | 5401 | 8210 | 5333 | 4688 | 6153 |
| Average household size | 4.4 | 4.3 | 4.4 | 4.3 | 4.4 |
| Population | 24,353 | 36,203 | 23,763 | 20,108 | 27,188 |
| Population density (per km2) | 1636 | 1614 | 1419 | 913 | 1313 |
| Sex ratio (Male:Female) | 98:100 | 105:100 | 95:100 | 88:100 | 98:100 |
| Literacy rate (%) | 37.25 | 27.98 | 30.18 | 38.3 | 26.89 |
| Major source of drinking water | Groundwater (Tubewell): 97.1% | Groundwater (Tubewell): 98.9% | Groundwater (Tubewell): 95.9% | Groundwater (Tubewell): 98.5% | Groundwater (Tubewell): 95.3% |
| Hydrological features | Branch of the Dhaleshwari River | On the bank of the Dhaleshwari River | Nearest river: Dhaleshwari | On the bank of the Kaliganga River | Nearest river: Kaliganga |
| Electricity connection (%) | 43.5 | 48.7 | 59.1 | 58.9 | 43.6 |
| Major livelihood groups | Farmers and small-scale businessmen | Farmers and industrial workers | Farmers and day laborers | Farmers and day laborers | Farmers and fishermen |
Table 3.
Distribution of sample size in the household survey.
| Unions | Livelihood Groups | ||||||
|---|---|---|---|---|---|---|---|
| Industrial Workers | Farmers | Economically Inactive Women | Total | ||||
| Male | Female | Male | Female | Male | Female | ||
| Bayra | 0 | 0 | 10 | 10 | 10 | 10 | 40 |
| Dhalla | 10 | 10 | 10 | 10 | 10 | 10 | 60 |
| Jamirta | 0 | 0 | 10 | 10 | 10 | 10 | 40 |
| Jamsha | 0 | 0 | 10 | 10 | 10 | 10 | 40 |
| Saista | 0 | 0 | 10 | 10 | 10 | 10 | 40 |
| Total | 20 | 100 | 100 | 220 | |||
Table 4.
Variables and indicators for the multiple linear regression model.
| Component | Variables/Predictors | Indicators |
|---|---|---|
| Resource | Surface water resources | Changes in surface water level |
| Occurrence of illness from surface water | ||
| Odor in surface water | ||
| Groundwater resources | Changes in groundwater level | |
| Occurrence of illness from groundwater | ||
| Groundwater quality | ||
| Groundwater odor | ||
| Rainfall | Perception on rainfall variability | |
| Access | Access to safe water | Access to safe water supply |
| Access to sanitation and medical facilities | Access to sanitation facilities | |
| Access to healthcare facilities | ||
| Capacity | Economic capacity | Affordability |
| Financial help from their relatives/NGO during disaster Access to institutional loan | ||
| Social capacity | Duration of residence | |
| Political/NGO linkage | ||
| Training in water sanitation, and hygiene issues | ||
| Education | ||
| Role in operation and maintenance | ||
| Use | Adequacy of daily water provision | Provision of daily water requirement |
| Conflicts regarding water | Reports of conflicts regarding water use | |
| Environment | Environmental stress | Reduction in fish species |
| Reduction in vegetation cover | ||
| Crop loss | ||
| Water-related disaster | Drainage facilities | |
| Damage and loss due to flood/drought |
Table 5.
Characteristics of the respondents participated in the household survey.
| Characteristics | Total (N = 220) | Percent (%) | |
|---|---|---|---|
| Gender | Male | 60 | 27 |
| Female | 160 | 73 | |
| Age | ≤20 | 30 | 14 |
| 21–30 | 18 | 8 | |
| 31–40 | 57 | 26 | |
| 41–50 | 45 | 20 | |
| 51–59 | 35 | 16 | |
| ≥60 | 35 | 16 | |
| Education level | No formal education | 101 | 46 |
| Primary (Class 1–5) | 98 | 44 | |
| High school (Class 6–8) | 6 | 3 | |
| Secondary (Class 10) | 5 | 2 | |
| Higher secondary (Class 12) | 10 | 5 | |
| Graduation and above | 0 | 0 | |
| Occupation | Student | 22 | 10 |
| Housewife | 70 | 32 | |
| Industrial worker | 20 | 9 | |
| Farmer | 100 | 45 |
Table 6.
WPIs for the unions and the livelihood groups in the study area.
| Union-Wise WPI | |||||||
|---|---|---|---|---|---|---|---|
| Unions | Resource | Access | Capacity | Use | Environment | WPI | Level of Water Poverty |
| Bayra | 44.9 | 59.8 | 51 | 86.7 | 61 | 60.7 | Medium |
| Dhalla | 26.6 | 62.3 | 45.7 | 80.5 | 41.3 | 51.3 | High |
| Jamirta | 40.4 | 47.2 | 37.7 | 63.3 | 43.6 | 46.4 | Severe |
| Jamsha | 62.5 | 69.3 | 42.1 | 83.4 | 65.9 | 64.6 | Medium low |
| Saista | 38.7 | 28.3 | 20.3 | 47.1 | 42.5 | 35.4 | Severe |
| Livelihood Group-Wise WPI | |||||||
| Groups | Resource | Access | Capacity | Use | Environment | WPI | Level of Water Poverty |
| Industrial Worker | 29.3 | 69.6 | 57 | 84.1 | 47.3 | 57.5 | Medium |
| Farmer | 42.8 | 55.1 | 45.3 | 78.4 | 51.5 | 54.6 | High |
| Economically Inactive Women | 41.9 | 50.2 | 31.2 | 65.4 | 49.1 | 47.5 | Severe |
Table 7.
Significant predictors of resource component.
| Variables | Industrial Workers (R2 = 0.066) | Farmers (R2 = 0.390) | Economically Inactive Women (R2 = 0.151) |
|---|---|---|---|
| Surface water resources | 0.135 | 0.417 | 0.247 |
| Groundwater resources | 0.225 | 0.329 | 0.235 |
| Rainfall | 0.020 | −0.128 | 0.082 |
Table 8.
Significant predictors of access component.
| Variables | Industrial Workers (R2 = 0.497) | Farmers (R2 = 0.611) | Economically Inactive Women (R2 = 0.444) |
|---|---|---|---|
| Access to safe water | 0.204 | 0.549 | 0.307 |
| Access to sanitation and medical facilities | 0.679 | 0.432 | 0.464 |
Table 9.
Significant predictors of capacity component.
| Variables | Industrial Workers (R2 = 0.404) | Farmers (R2 = 0.396) | Economically Inactive Women (R2 = 0.464) |
|---|---|---|---|
| Economic capacity | 0.411 | 0.483 | 0.409 |
| Social capacity | 0.495 | 0.292 | 0.514 |
Table 10.
Significant predictors of use component.
| Variables | Industrial Workers (R2 = 0.382) | Farmers (R2 = 0.424) | Economically Inactive Women (R2 = 0.62) |
|---|---|---|---|
| Adequacy of daily water provision | 0.630 | 0.527 | 0.541 |
| Conflicts regarding use | 0.059 | 0.284 | 0.423 |
Table 11.
Significant predictors of environment component.
| Variables | Industrial Workers (R2 = 0.185) | Farmers (R2 = 0.491) | Economically Inactive Women (R2 = 0.427) |
|---|---|---|---|
| Environmental stress | 0.022 | 0.606 | 0.542 |
| Water related disasters | 0.433 | 0.226 | 0.294 |
Publisher’s Note: MDPI stays neutral with regard to jurisdictional claims in published maps and institutional affiliations. |
© 2022 by the authors. Licensee MDPI, Basel, Switzerland. This article is an open access article distributed under the terms and conditions of the Creative Commons Attribution (CC BY) license (https://creativecommons.org/licenses/by/4.0/).
Share and Cite
MDPI and ACS Style
Jaren, L.S.; Leya, R.S.; Mondal, M.S. Investigation of Gender-Differentiated Impacts of Water Poverty on Different Livelihood Groups in Peri-Urban Areas around Dhaka, Bangladesh. Water 2022, 14, 1167. https://doi.org/10.3390/w14071167
AMA Style
Jaren LS, Leya RS, Mondal MS. Investigation of Gender-Differentiated Impacts of Water Poverty on Different Livelihood Groups in Peri-Urban Areas around Dhaka, Bangladesh. Water. 2022; 14(7):1167. https://doi.org/10.3390/w14071167
Chicago/Turabian StyleJaren, Lamiya Sharmeen, Rabeya Sultana Leya, and M. Shahjahan Mondal. 2022. "Investigation of Gender-Differentiated Impacts of Water Poverty on Different Livelihood Groups in Peri-Urban Areas around Dhaka, Bangladesh" Water 14, no. 7: 1167. https://doi.org/10.3390/w14071167
Note that from the first issue of 2016, this journal uses article numbers instead of page numbers. See further details here.