Article

Investigation of Groundwater Logging for Possible Changes in Recharge Boundaries and Conditions in the City of Aswan, Egypt

1
Civil Engineering Department, Faculty of Engineering, Aswan University, Aswan 81542, Egypt
2
Department of Water and Water Structures Engineering, Faculty of Engineering, Zagazig University, Zagazig 44519, Egypt
3
Geology Department, Faculty of Science, Aswan University, Aswan 81542, Egypt
4
Department of Environmental Engineering, Faculty of Civil Engineering, Technical University of Kosice, 04200 Kosice, Slovakia
*
Author to whom correspondence should be addressed.
Water 2022, 14(7), 1164; https://doi.org/10.3390/w14071164
Submission received: 13 February 2022 / Revised: 29 March 2022 / Accepted: 30 March 2022 / Published: 5 April 2022
(This article belongs to the Special Issue Assessment and Management of Hydrological Risks Due to Climate Change)

Abstract

:
Groundwater is of great importance in our daily life, and its importance is due to its multiple uses, whether in agriculture, industry or other uses. Increasing the Groundwater Levels (GWL) in any area is a great benefit for its importance and multiplicity of uses, but in the city of Aswan, it is different, as the increase in the GWL causes severe damage to buildings and leads to poor quality of agricultural land and the destruction of infrastructure due to the lack of good management. The main objective of this study is to develop a conceptual model of the groundwater system to gain better understanding of water dynamics in the study area and to investigate different management scenarios of the use of groundwater. The model was developed using MODFLOW code to achieve the objective of the study, where the necessary field data were collected to feed the model from the study area, such as Surface Water Levels (SWL) in the Aswan Dam lake and the Nile River, GWL in the Aswan Aquifer and the different characteristics of the layers constituting the aquifer, such as porosity and recharge for different periods to ensure obtaining the most accurate and best results from the model. The model was calibrated with mean residual and absolute mean residual which reached −0.08 and 0.629 m, respectively, with a Root Mean Square Error (RMSE) of 0.737m and a normalized RMSE of 4.319%. Two future scenarios have been developed to arrive at a future vision of GWL in the Aswan aquifer. The first scenario investigated GWL in the study area by changing the values of recharge to the aquifer resulting from an increase in the drinking water and sewage networks’ leakage values, which were predicted in the future for years 2025, 2030, 2035 and 2040. The GWL in the study area are increasing as a result of the increase in the amount of leakage in the years 2025, 2030, 2035 and 2040 compared to the GWL in the study area for the year 2020 by 0.29%, 1.31%, 2.01% and 3.16%, respectively. The second scenario investigated GWL by changing the water levels in El hebs (the lake between the High Dam and the Aswan Dam) as follows (108 m, 110 m, 112 m, 114 m, 116 m and 118 m), where the groundwater levels were calculated in the Aswan Aquifer corresponding to each level. The percentage of increase in groundwater levels corresponding to the levels 108 m, 110 m, 112 m, 114 m, 116 m and 118 m compared to the groundwater levels at the level of 106 m was found as follows: 0.92%, 2%, 2.87%, 4.05%, 4.91% and 5.67%, respectively. The simulation results are intended to support integrated groundwater modeling for the components of the hydrological water budget in the city of Aswan. Furthermore, the model provides us with a better understanding of long-term scenarios for the waterlogging in the city. The results are useful for managing the water logging problems and planning the future infrastructure in the city of Aswan.

1. Introduction

Millions of people around the world are depending on groundwater resources for drinking, industry, agriculture and more, but a growing world population combined with climate change leads to lower GWL. Understanding the spatial extension and diversity of GWL is essential to protect available water resources, especially as a main source of drinking water [1]. Gaur et al. [2] developed the combined use of numerical modeling and spatial modeling using GIS for groundwater management on the sub-basin of the Banganga River, India. The hydrological and spatial modeling presented in this study are highly useful for the evaluation of groundwater resources and for deciding the location of rainwater harvesting structures in semi-arid regions. Prasad et al. [3] delineated groundwater potential zones in hard rock terrain used the integrated approach of remote sensing and the geographical information system (GIS) in Nalgonda District (Andhra Pradesh), India. The result depicted the favourable prospective zones in the study area and can be helpful in better planning and management of groundwater resources, especially in hard rock terrains. Pathak et al. [4] developed a groundwater aquifer vulnerability map by incorporating the major geological and hydro-geological factors that affect and control the groundwater contamination using the GIS-based DRASTIC model in the shallow aquifer of Kathmandu Valley, Nepal. Yeh et al. [5] used GIS for the assessment of the groundwater recharge potential zone in Taiwan. The resulting map of the groundwater potential zone demonstrates that the highest recharge potential area is located towards the downstream regions in the basin because of the high infiltration rates caused by gravelly sand and agricultural land use in these regions. In contrast, the least effective recharge potential area is in upstream regions due to the low infiltration of limestone.
Due to the importance of the phenomenon of groundwater logging, which suffers in many places around the world, many researchers have been interested in studying it. Fakharinia et al. [6] studied the construction of the groundwater dam and its effects on water table, thus, the Shahrekord aquifer model was simulated by the MODFLOW model. The water table situation was drawn and analyzed using ArcGIS9.3 software before and after dam construction. The results showed that the subsurface dam raised the GWL in 4 km distance of upstream areas. Bob et al. [7] conducted an investigation in an attempt to gain insight into the shallow groundwater table rise problem that has recently been observed in this important location. Results obtained from this research provide useful information regarding the hydrogeology of an important area and can aid authorities in preparing well-founded scientific plans to deal with the SWTR problem, including the appropriate reuse of excess water. AL-Sefry and Sen [8] followed a quantitative method to assess GWL rise risks in Jeddah case in the Kingdom of Saudi Arabia. Ray [9] proposes an interdisciplinary planning strategy to deal with the issue of rising the GWL.
There are many researchers using MODFLOW software, which is considered one of the most important applications used in this field, for example: Huntington et al. [10] assessed the role of climate and resource management on groundwater dependent ecosystem changes in arid environments with the Landsat archive. Abd-Elaty et al. [11] used different wells systems to manage saltwater intrusion into coastal aquifers in the Nile Delta aquifer, Egypt. Abd-Elaty et al. [12] used MODFLOW to assess the impact of lining polluted streams on groundwater quantity in the Nile Delta, Egypt. Chitsazan et al. [13] simulated the Gotvand Plain aquifer using the MODFLOW code of GMS software and evaluated the Abbid-Sarbishe synthetic recharge project located in the north Gotvand, Iran. EL-Rawy et al. [14] developed MODFLOW for studying the effects of treated wastewater (TWW) discharge into the Zarqa River in Jordan and the underlying unconfined limestone in Hummar Aquifer. Abd-Elhamid et al. [15] used MODFLOW model to evaluate the impact of different pumping schemes on the groundwater quality due to seepage from open drains including different abstraction rates, depths and locations of wells. Al-Maktoumi et al. [16] used MODFLOW and MT3DMS codes to assess the impact of climate change on coastal aquifers in Oman; in this research the effects of climate change (precipitation, temperature and sea level rise (SLR) on two selected coastal aquifers located in the north of Oman were numerically evaluated. The water dynamics in both aquifers are studied numerically using MODFLOW code under the different Representative Concentration Pathway scenarios (RCPs) for the years 2050 and 2070 according to the Intergovernmental Panel on Climate Change (IPCC). El Shinawi et al. [17] used MODFLOW to hydrologically study the impact of rise in sea levels on groundwater in the coastal aquifer of the Nile delta, Egypt. Abd-Elaty et al. [18] used a coupled model of MODFLOW to study groundwater zone budget from polluted streams using new protection process techniques in the Nile delta aquifer. Chakraborty et al. [19] used MODFLOW for analyzing the GWL in Purba (East) Midnapur, West Bengal, India. Abd-Elaty et al. [20] developed the finite difference code of MODFLOW to investigate the stability of canals’ slopes considering the climate changes through SLR, fluctuation of GWL and the seismic actions in the northeastern part of Nile delta aquifer, Egypt. Ta’any et al. [21] used the MODFLOW model for evaluation and management of the groundwater Jerash catchment area, Amman-Zarqa basin, Jordan. Azaza et al. [22] used MODFLOW for groundwater management in arid and semiarid regions in the Jeffara of Medenine coastal aquifer, southeastern Tunisia, as a case study. Abd-Elaty et al. [23] used MODFLOW to simulate of flow of potential contaminants at the riverbank filtration (RBF) site at Embaba, Cairo, Egypt, and its impact on groundwater heads. Abd-Elhamid et al. [24] investigated the possible adverse impact of reducing the flow in the Nile River due to the construction of the Grand Ethiopian Renaissance Dam (GERD) on the Nile delta aquifer and considered possible measures to adapt with such impacts. A numerical flow model was developed to simulate the groundwater flow considering the operation of the new dam. Two scenarios of filling the reservoir during 3 and 6 years were considered. Abd-Elhamid [25] developed the numerical model to study the effect of aquifer geometry including bed slope and seaside slope on GWL. The effects of changing boundary conditions, including increasing sea head due to SLR and decreasing the landslide recharge due to over-abstraction, are also investigated. Abd-Elaty et al. [26] used MODFLOW and water budget analyses to evaluate interactions between irrigation canals and the Nile delta aquifer, Egypt under four operational scenarios. Abdelrhem et al. [27] used MODFLOW and MODOFIC packages to study the future groundwater situations in the well field area of the Great Man-Made River Project in Libya. Rejani et al. [28] used the MODFLOW package for analyzing the aquifer response to various pumping strategies in Balasore Coastal Basin, India. Youssef et al. [29] used the MODFLOW model for planning and managing the groundwater problems in Wadi El-Farigh in Western Desert, Egypt. Antoniou et al. [30] applied MODFLOW to a theoretical example found in its manual for comparison purposes by examining the optimization of its aquifer system in terms of minimizing the cost of pumping drilling. Hadded et al. [31] developed a Decision Support System (DSS) for groundwater management of the Zeuss Koutine aquifer in southeastern Tunisia using the WEAP–MODFLOW framework. Malekinezhad et al. [32] used MODFLOW for modeling impacts of climate change and human activities on groundwater resources in Yazd-Ardakan aquifer, Iran.
Many researchers have discussed the study of groundwater in the city of Aswan. Hamdan et al. [33] studied vulnerability of the groundwater in the quaternary aquifer at the El Shalal-Kima area, Aswan, Egypt. Abdelrady et al. [34] developed a MODFLOW model and coupling with GIS to characterize the groundwater flow system and levels in the area adjacent to the Nile River at Aswan City, Egypt. Abdalazem et al. [35] studied groundwater quality assessment for irrigation in the west Edfu region, Aswan, Egypt. Over the past few years, an increase in groundwater levels has been observed in several parts. Raising the water table can flood underground infrastructure, submerge basements of buildings and flood sewage pipes and utility lines that provide water and electricity, as well as to the surrounding environment, because of the formation of ponds, as shown in Figure 1 [36]. The magnitude of human influences on their environment makes humans the main logical geographic factor on the planet’s surface. The phenomenon of groundwater rise that occurred in 2009 is directly related to the cessation of pumping groundwater from El Shallal wells and the decrease in pumping from the wells of the Kima station. In general, the rate of water rise is much higher in the western side of the city and around the Kima factory, which is characterized by its low terrain and dense population. The most disturbed aquifers are more likely to develop in low-lying areas with a relatively highly permeable aquifer, which is not exploited for water supply. This damage will become more widespread if the rising groundwater table remains out of control. Therefore, it has become necessary to study them, know their sources and develop scenarios to control them and improve their utilization.
This study aims to investigate the groundwater levels in the Aswan city to assess and follow up on the problems of water logging in Aswan city and their impact on the infrastructure and the surrounding environment. This is achieved by developing several scenarios for the rise of groundwater in the study area, which will help the decision makers in the planning and provide alternative solutions to manage the problem. To achieve the aim of this research, MODFLOW software and field data were used.

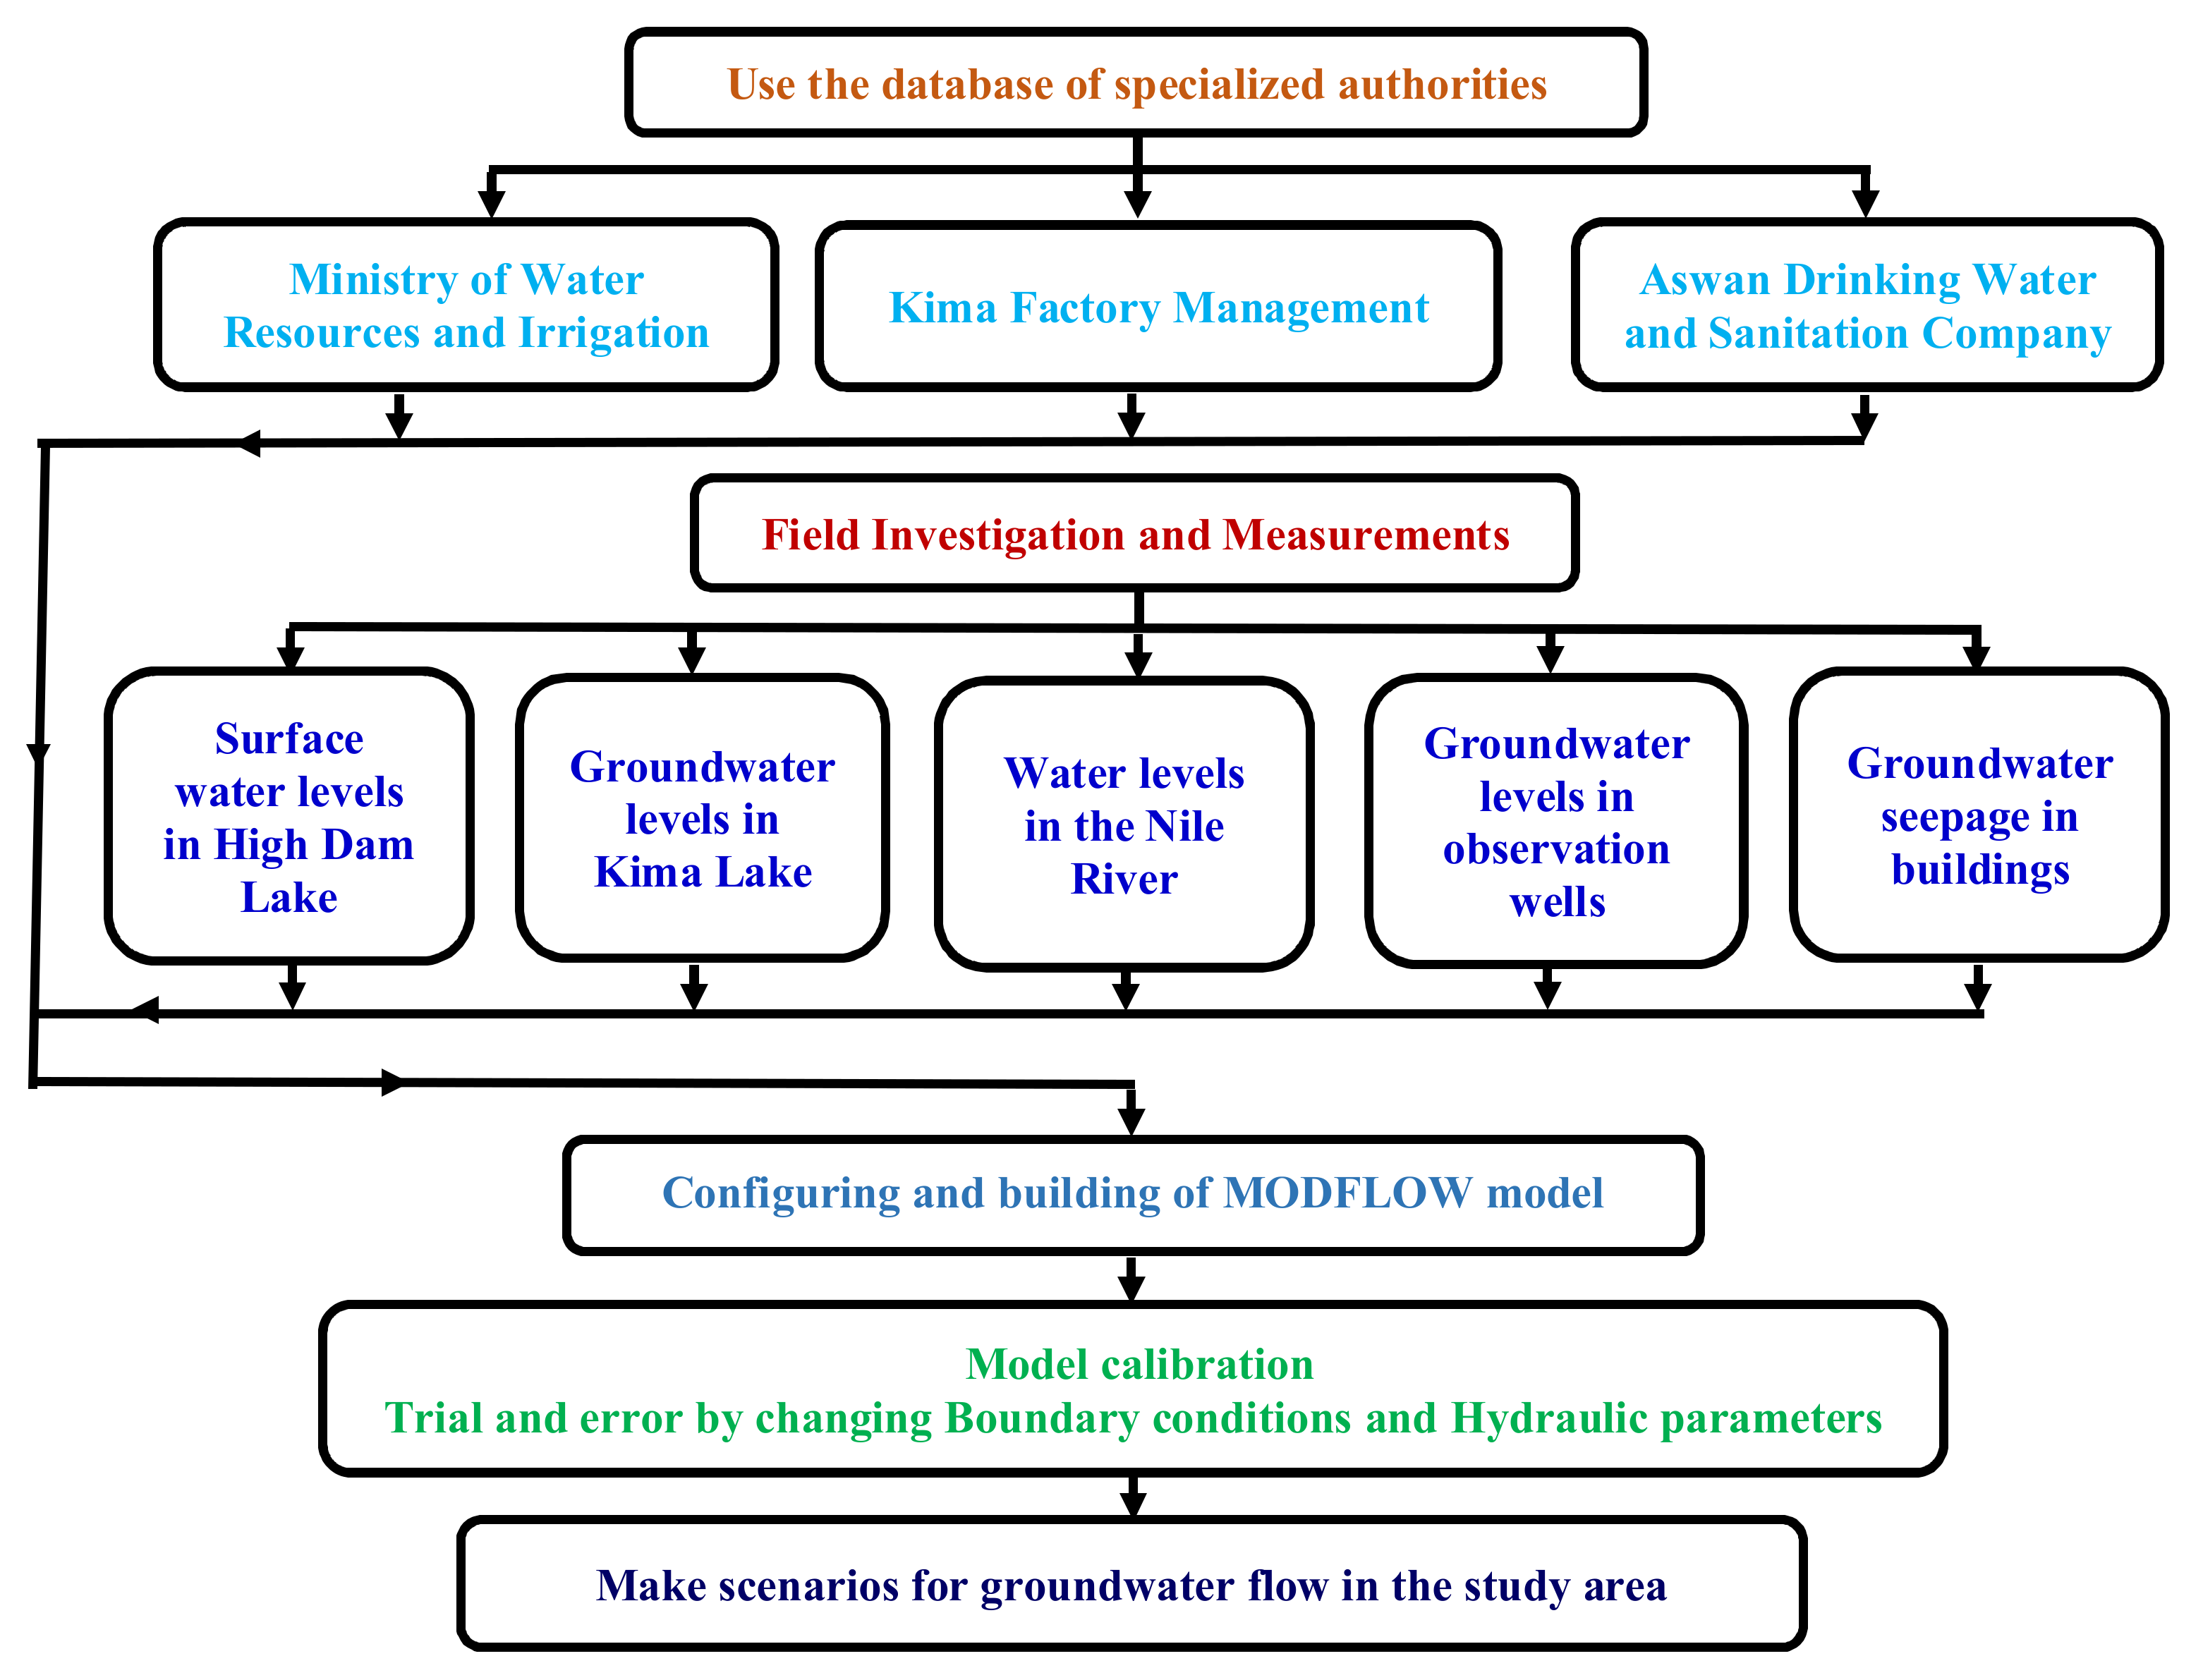
2. Material and Methods
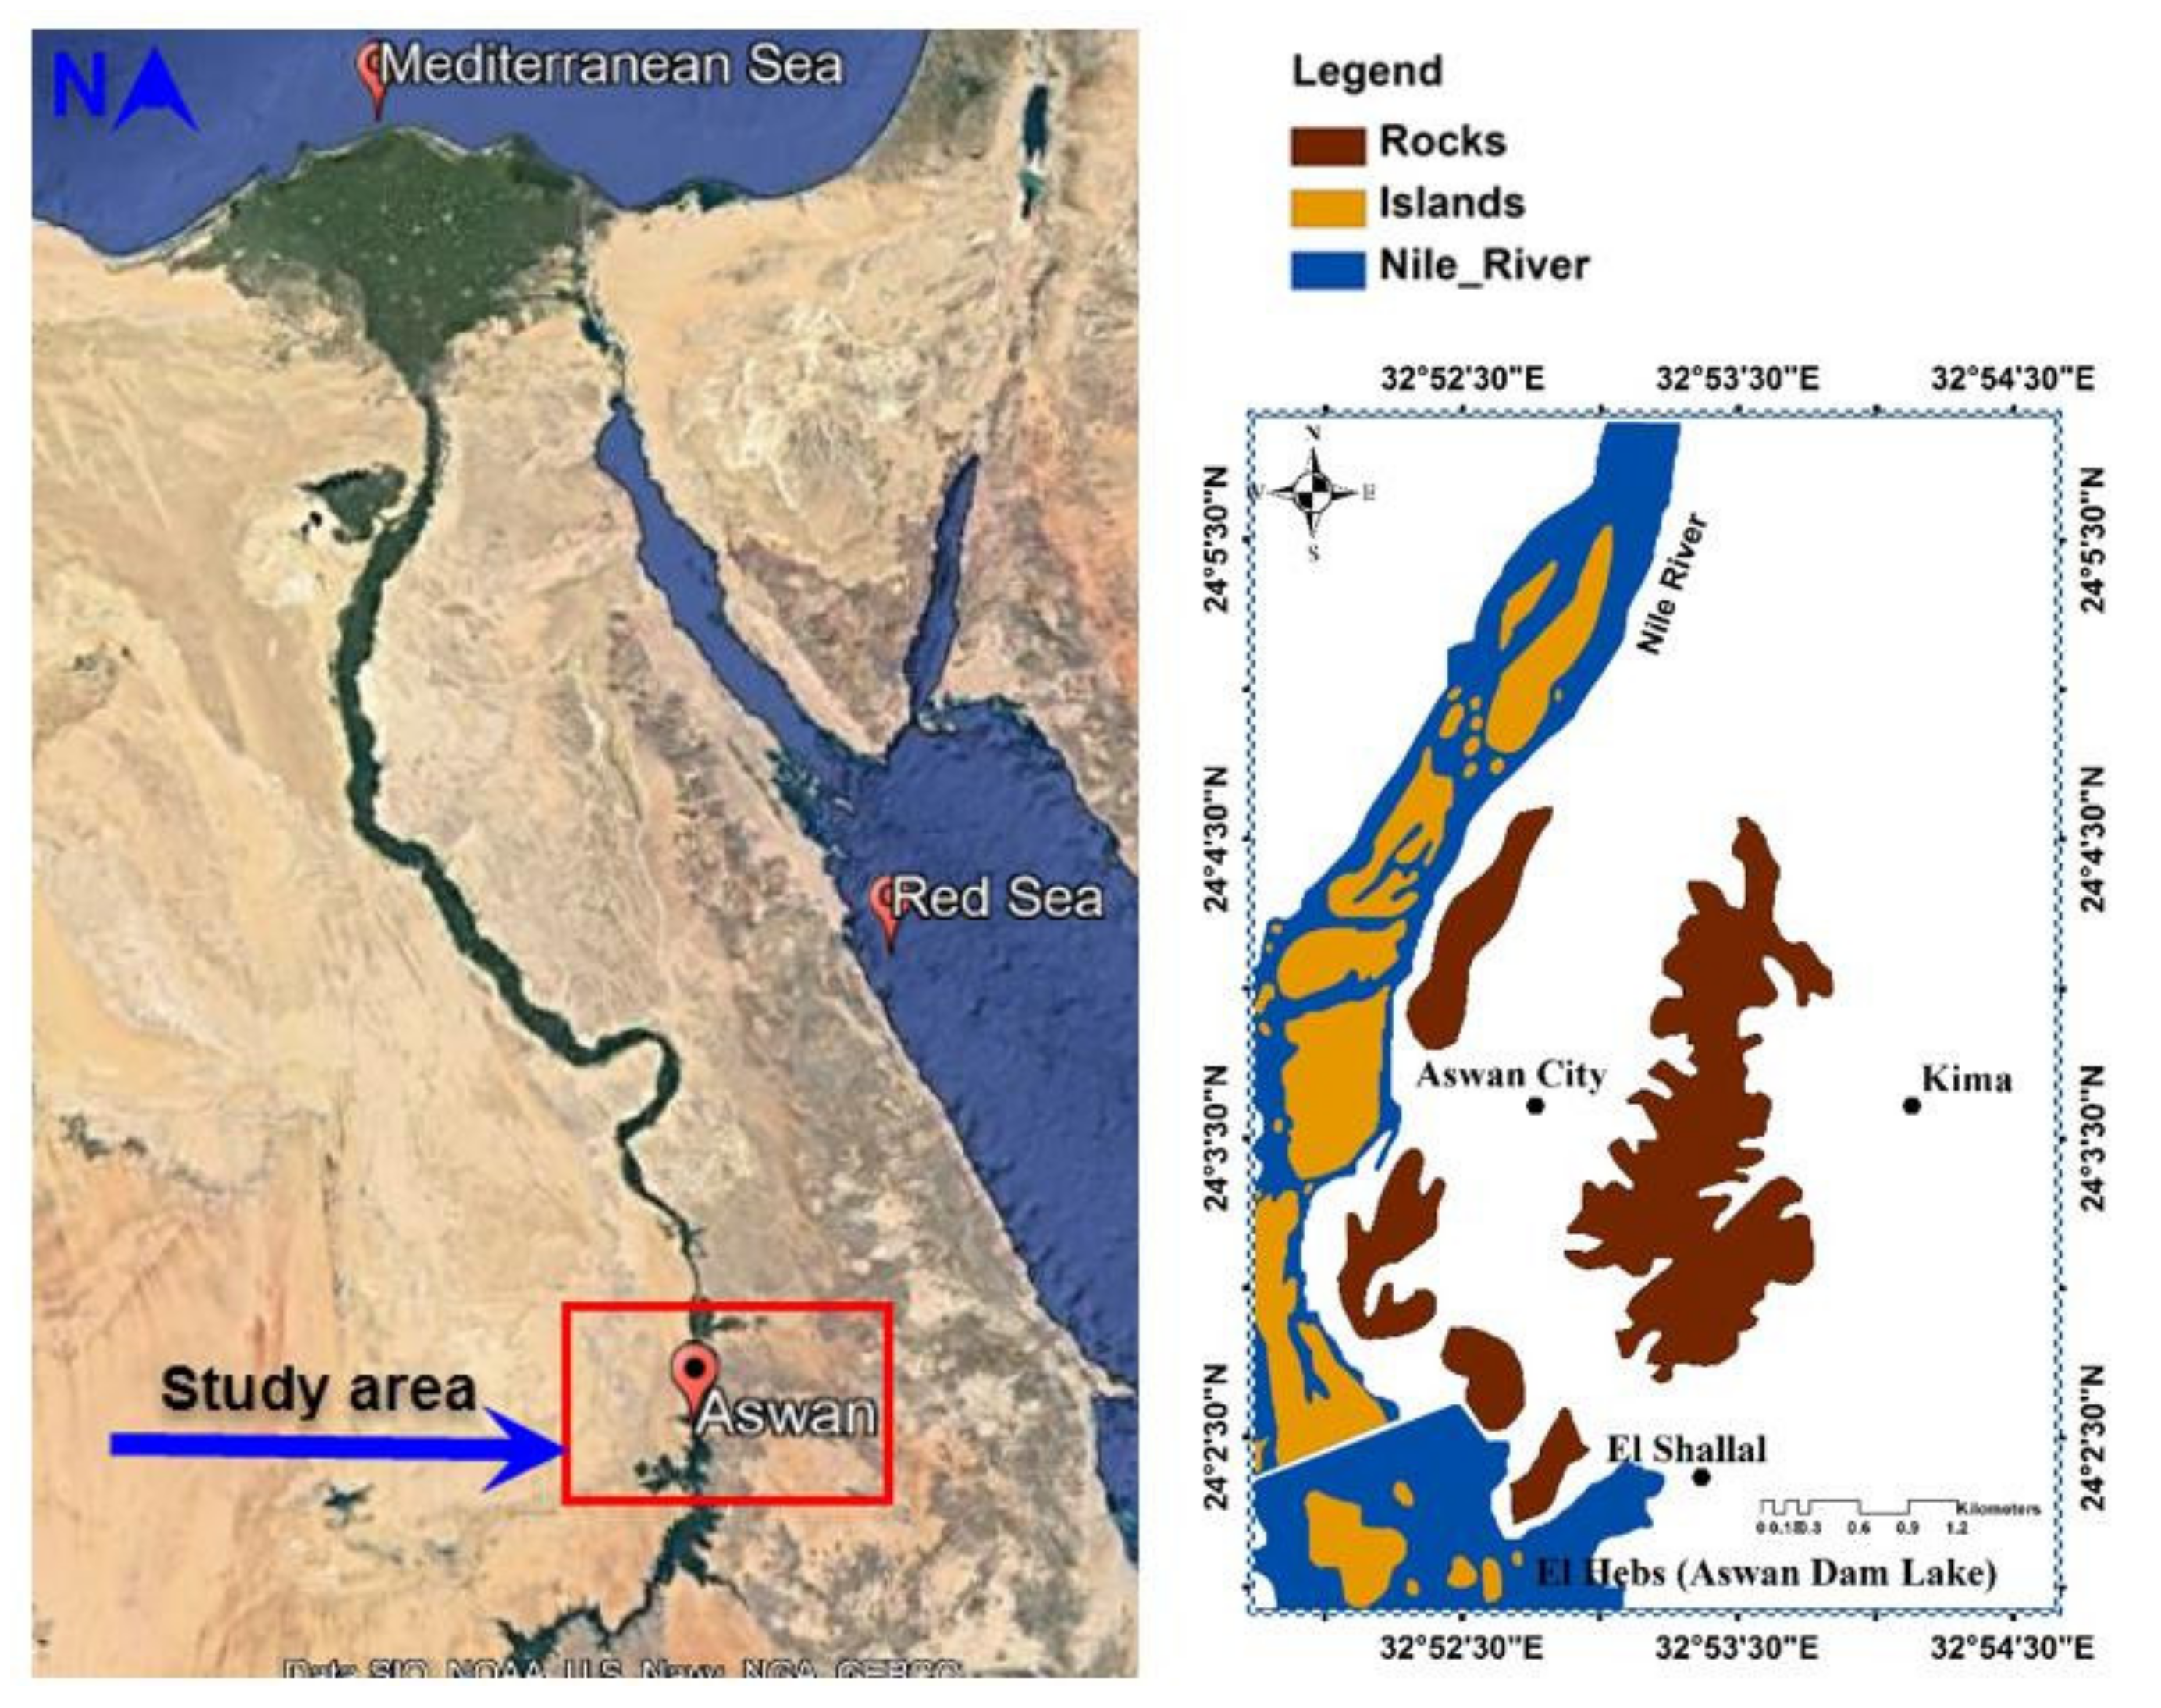
The flowchart of the optimum management methodology for the groundwater resources is presented in Figure 2. The proposed methodology utilizes models including MODFLOW as a groundwater simulation model. At the first step of the proposed methodology, the required data for developing a groundwater flow simulation model including hydrogeological and hydrological data are collected based on field visits. Different stakeholders with conflicting objectives which are involved in the groundwater resources management problem are also determined. Then, the numerical model of the aquifer is developed using MODFLOW for groundwater flow simulation. The MODFLOW simulation model is calibrated for one year of 2020.

2.1. Study Area

The phenomenon of the rising groundwater in the city of Aswan is a major problem that threatens the infrastructure and the surrounding environment. Therefore, developing scenarios to simulate groundwater flow in the Aswan aquifer is essential. This requires the collection and exploration of many field data, such as GWL in the study area and the water levels of the Aswan Dam Lake, in addition to the water levels in the Nile River. The collection of these data is conducted through field measurements and field visits, or by collecting data from the competent authorities.

2.1.1. Case Study

The area under investigation is situated along the Nile Valley at the east of Aswan town and the Nile River. It is located at the latitudes 24° 01′ 30″ and 24° 06′ 30″ N and longitudes 32° 52′ and 32° 56′ E (see Figure 3). The study area covered about 19.43 square kilometers and had a maximum width of about 4.5 km.

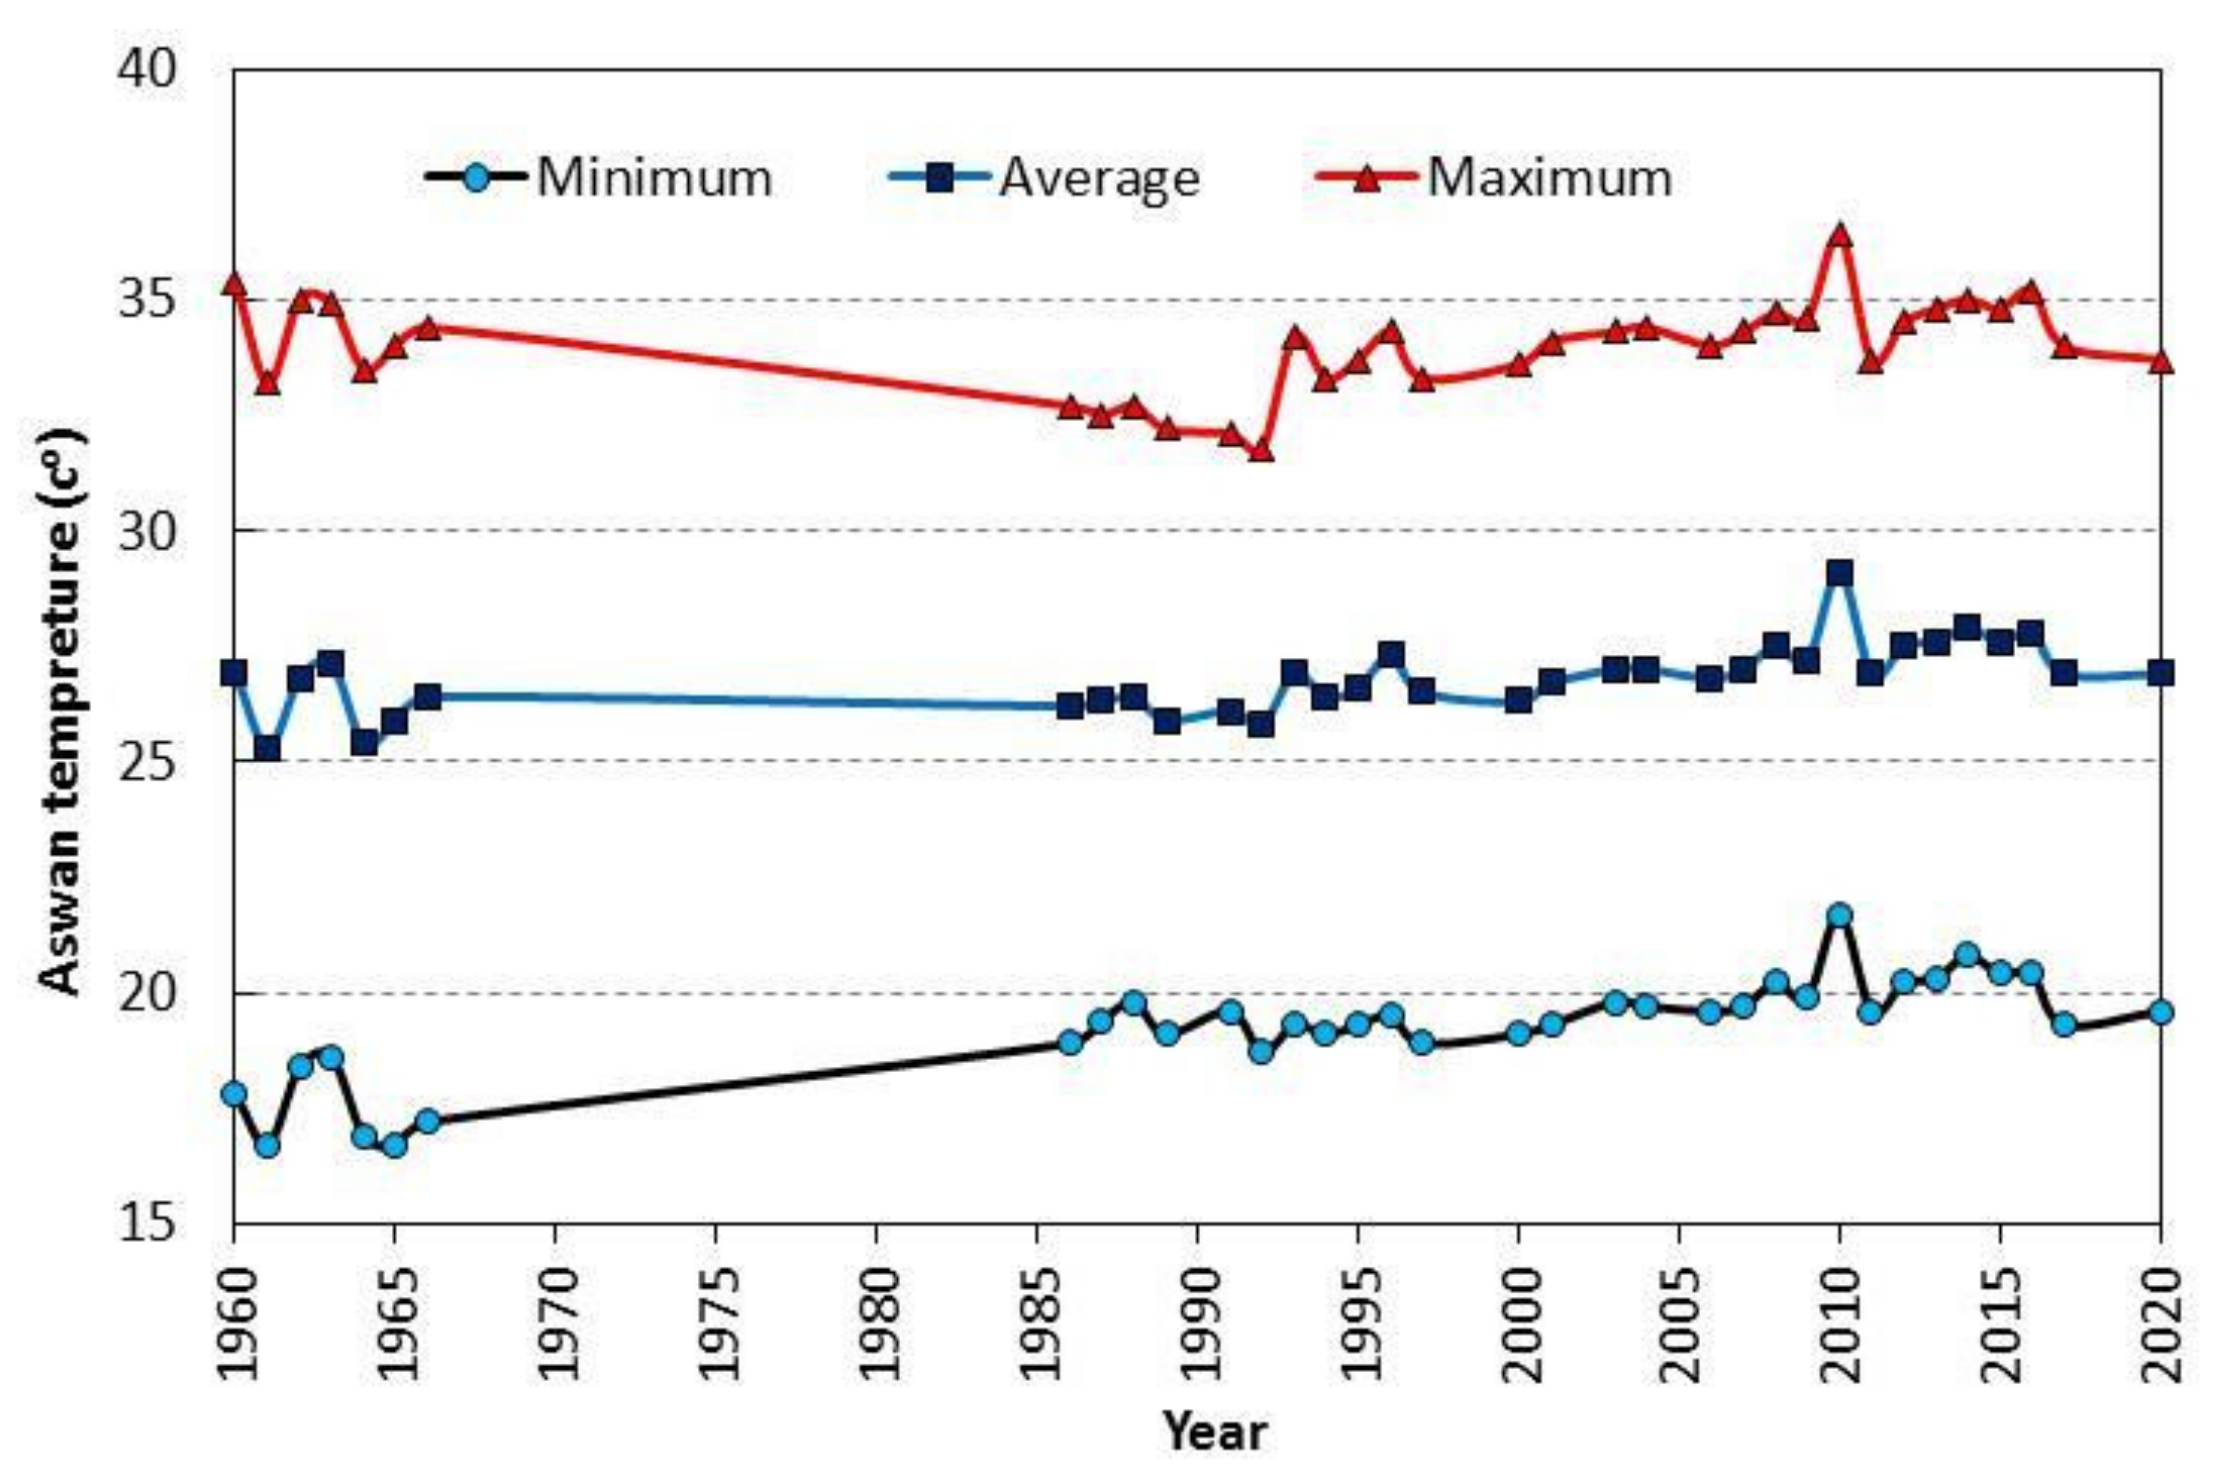
2.1.2. Climate in the Study Area

The study area is located in the Aswan governorate, which is characterized by very high temperatures in the summer and a mild climate in the winter. Figure 4 shows the values of the temperature in Aswan city during the past sixty years. The climate in this area is arid as it receives virtually no rainfall, except for occasional thunderstorms which may penetrate the area, on the average, once every 10 to 15 years. The precipitation ranged from 7.20 to 18.70 mm per year in the city of Aswan during the past six decades.

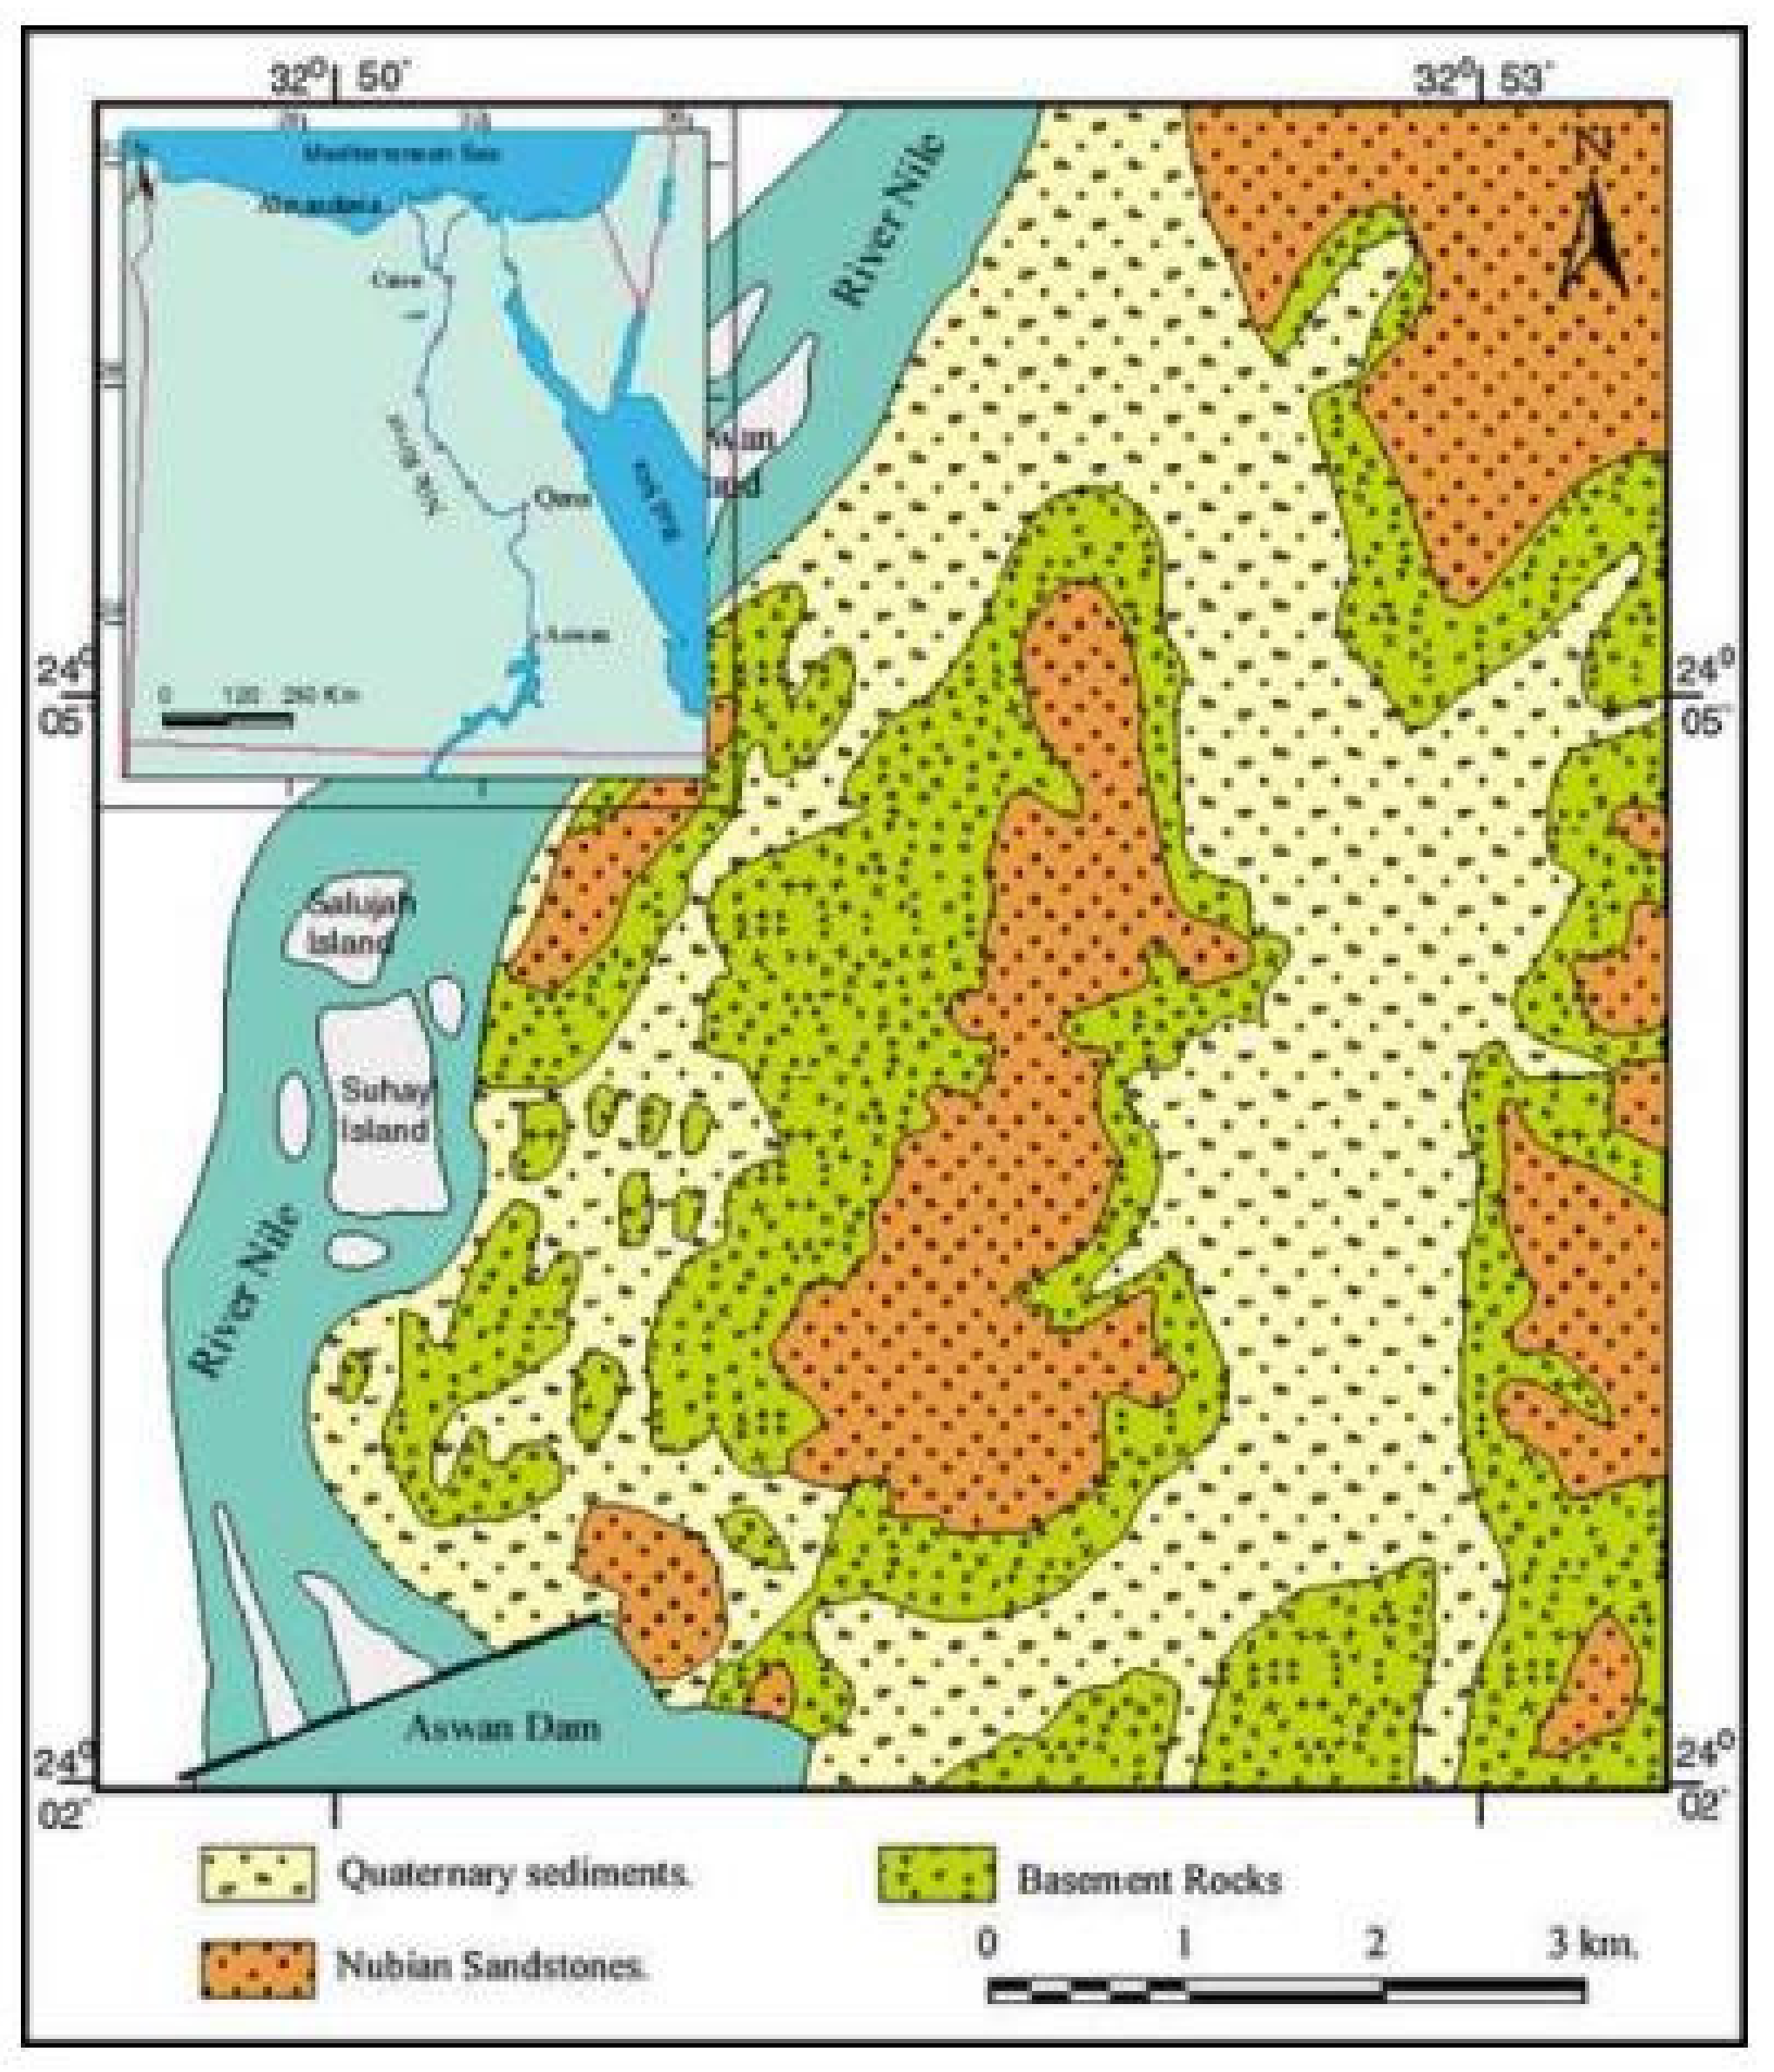
2.1.3. Geology of the Study Area

The study area included three geological units that are summarized as follows: the first type is the Precambrian rocks, which are a group of igneous and metamorphic rocks, mainly granites and schists. They are surrounding the study area from the east and west sides. The second type is the Nubian sandstone (age ranging from the Cambrian to the cretaceous), which overlay the basement rocks. This divides Aswan into three groups (lower, middle and upper) with total thickness ranges between 20 and 85 m. The third type is the Quaternary sediments, exposed in the middle part of the study area with a general increase from south to north. They are represented by sands, gravels and clays of the Pleistocene time, and by mud and Aeolian sediments of the recent. They are underlaid by a thick bed of Pliocene clays. They lie beneath the Nubian sandstone formations. The study area is bounded from the east and the west by the basement rocks of high relief. The land height in the study area ranges from 88 to 211 m above sea level, with an average of 112 m. The geology of the study area is shown in Figure 5 [33].

2.1.4. Hydrological of Recharge and Withdrawal Rates in Aswan Aquifer

For its recharge, the Aswan aquifer depends on several sources, including the main source as the Aswan Dam Lake (ADL) (the lake sandwiched between the Aswan High Dam (AHD) and the Aswan Dam (AD)), besides the quantities of leakage from the fish hatchery in the El Shallal area and leakage from the city’s drinking water and sewage networks, in addition to the small amounts of seasonal rain and small amounts of leaching from agricultural land.
The groundwater project was implemented by Aswan water and wastewater company, where there is a continuous withdrawal of industrial and domestic uses, especially in the Kima and El Shallal areas to reach 13.28 × 10⁶ and 12.44 × 10⁶ m3/year, respectively. After 2009, El Shallal wells stopped completely, and the production of Kima wells decreased to 9.12 × 10⁶ m3/year. During the current period, part of El Shallal wells began to operate, with a small production capacity 0.13 × 10⁶ m3/year, and with Kima wells continuing to produce at a rate 9.12 × 10⁶ m3/year. Figure 6 shows the quantities of withdrawal from Aswan aquifer [33].

2.2. Geometry of the Aquifer

The study area is located east of Aswan town and the Nile River. The direction of groundwater flow is generally from the south to the north due to the slope of the water table in the highland areas’ southern part. Recharge of the quadruple aquifer in the study area mainly comes from the Aswan Dam reservoir, where the water level varies between 106 and 112 depending on the water income from the High Dam and the leakage of water used by the fish hatchery center, which takes place in the southern part of study area. The recharge of the quaternary aquifer also comes from the infiltration of surface water used for irrigation in cultivated lands (in the far south), due to the use of the old method of irrigation (flooding) and leakage from the existing septic tanks that are widespread in the area under investigation. The quaternary aquifer is mainly composed of inconsistent material of sand, gravel and clay. The eastern and western borders of the aquifer are the bedrock and are bounded by clay. Its thickness ranges between 82 and 114 m, with a general increase from south to north. The aquifer is not covered by impermeable layers in the greater part of the area, and therefore it is in an unconfined state. Groundwater depths (from the ground surface) range from 7.5 to 16.3 m and are affected by the topography of the earth’s surface.
The Aswan aquifer has two types of boundary conditions. The first boundary condition is the constant head which represents ADL (the lake confined between the AHD and AD, which is the principal source of recharge for the aquifer). The second boundary condition is the river boundary which represents the Nile River, characterized as a river. In this case study, the study area was bonded from the west and south by the Nile River and ADL. The aquifer was bounded from the north and east with basement rocks where the lateral groundwater flow was negligible or non-existent, and thus these outer features were considered as no-flow boundaries. The aquifer base was assigned as a no-flow boundary (basement rocks).
The hydraulic parameters of the study area for each layer, including the permeable layer, were composed mainly of sand and gravel and demonstrated insignificant horizontal variations in the layer’s hydraulic parameters along the scale of the modelled area. Moreover, it was assumed to be internally homogenously anisotropic, with equal hydraulic conductivity (K) in the X and Y directions (Kx = Ky) and one order less in the Z direction (Kz = 0.10Kx). The values of hydraulic conductivity are presented in Table 1 [36].

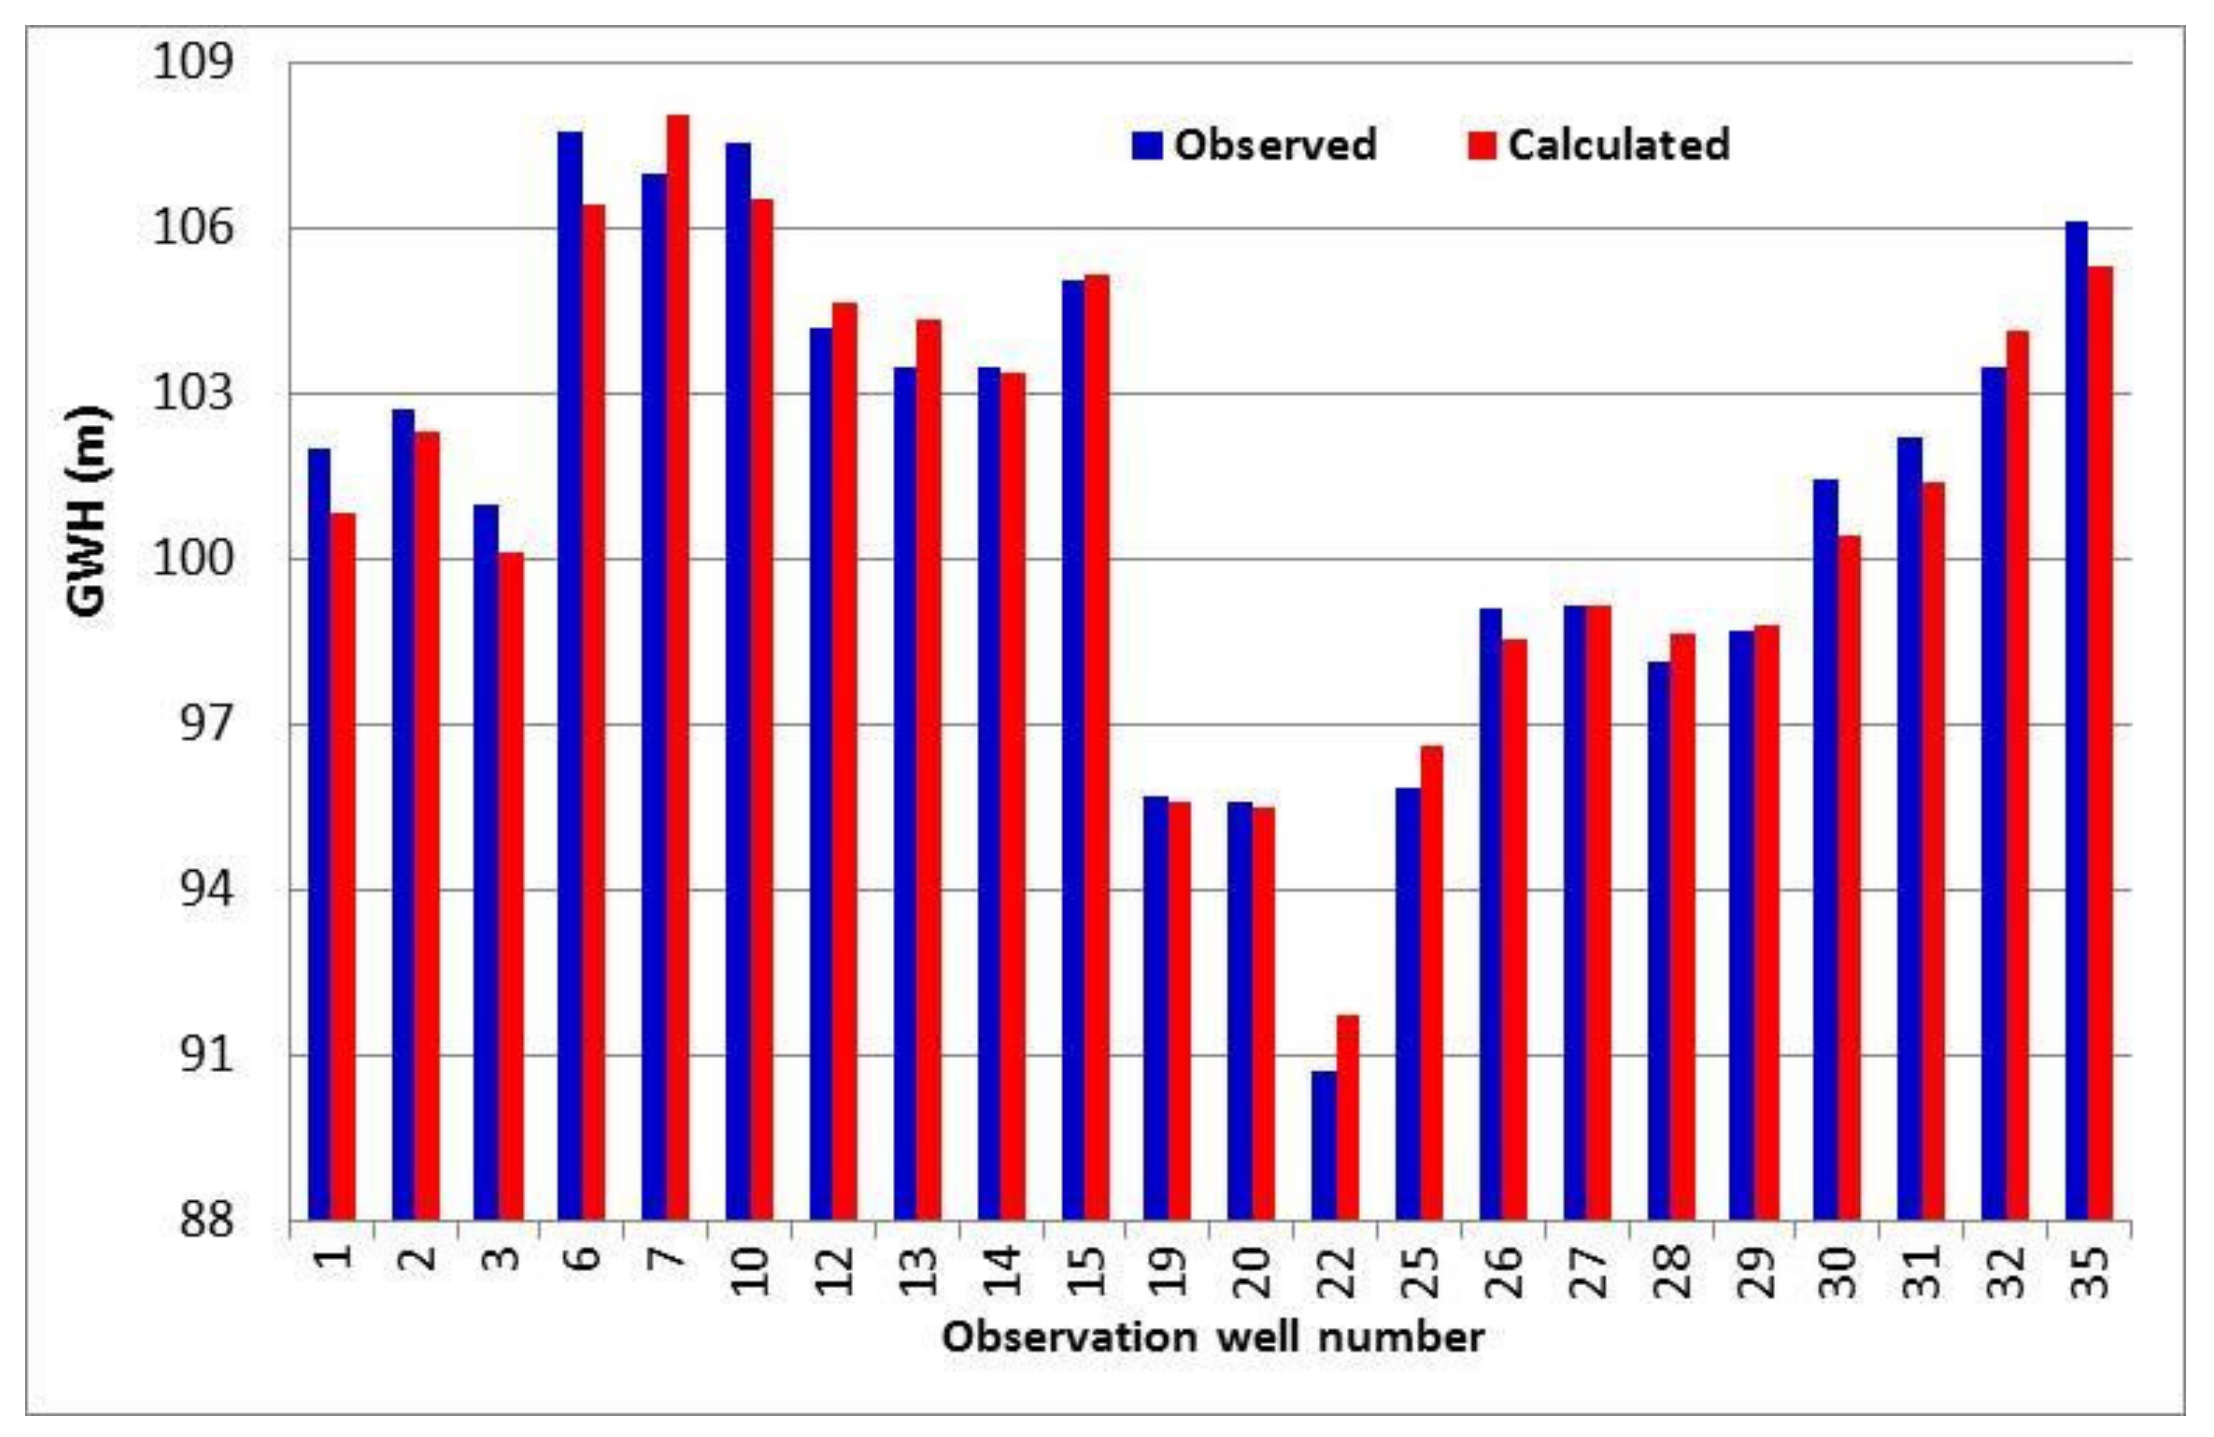
2.3. Numerical Model, Model Calibration and Scenarios

A 3D MODFLOW as a graphical user interface (GUI) was used to simulate groundwater flow. The model input parameters and results can be visualized in 2D (cross-section and plan view) or 3D at any time during the development of the model or the displaying of the results. The partial-differential equation of groundwater flow used in MODFLOW as (McDonald and Harbaugh, 1984 [37,38]):
x K x h x + y K y h y + z K z h z + q = S s * h t
where Kx, Ky and Kz are values of hydraulic conductivity along the x, y and z coordinate axes (LT−1), h is the potentiometric head (L), SS is specific storage of the porous material (L−1), t is time (T) and q is volumetric flux per unit volume representing source/sink terms, with q < 0.0 for flow out of the groundwater system, and q > 0.0 for flow in (T−1).
The model domain was 7465 km × 8850 km comprised of active and inactive cells distributed across 192 rows and 160 columns. The model grid extended from the north at the north of Aswan city to the south of ADL, from the east in mountain heights and to the west at the Nile River. The model included seven aquifer layers.
Calibration of the model was performed using 22 observation wells distributed in the Aswan aquifer domain based on field data. The calibration was developed by trial and error to match between the calculated head by MODFLOW and the observed head using the piezometric map and changing the hydraulic parameters including hydraulic conductivity, which range from 0.0001 to 0.0004 m/s, and transmissivity values range from 0.02 to 0.04 m2/s for the quaternary aquifer. Additionally, attempts were made to change the values of the boundary conditions, such as the water levels in El hebs (the water area confined between the HAD and the AD), changing the water levels in the Nile River and the recharge values of the aquifer to reach the best calibration of the model. The residual mean and absolute residual mean reached –0.08 and 0.629 m, respectively, with a root mean square (RMS) of 0.737 m and a normalized root mean square of 4.319%. Distribution of groundwater heads in Aswan city is shown in Figure 7. Furthermore, the figure shows that the groundwater flow from south (Aswan Dam Lake) to north (Nile River), in which the flow directions are parallel, and discharge in the Nile River. The distribution of field observation wells in the study area shown in Figure 8 was used in model calibration and the proposed scenarios. These wells are used in the monitoring of groundwater levels in Aswan city. Figure 9 represents a comparison between the calculated head by MODFLOW and observed head from field data and difference between observed and calculated.
Several future scenarios have been developed to formulate a future vision of GWL in the Aswan aquifer, in order to develop a good future management plan to control the groundwater in Aswan city and benefit from it and reduce the damage caused by rising groundwater levels in the study area, which could increase in the future. The first scenario is calculating GWL in the study area by changing the values of recharge to the Aswan aquifer resulting from an increase in the drinking water and sewage networks’ leakage values, which were predicted in the future for years 2025, 2030, 2035 and 2040. The second scenario was calculating groundwater levels by changing the water levels in El hebs (the lake between the HAD and the AD), as follows (108 m, 110 m, 112 m, 114 m, 116 m and 118 m).

3. Results and Discussion

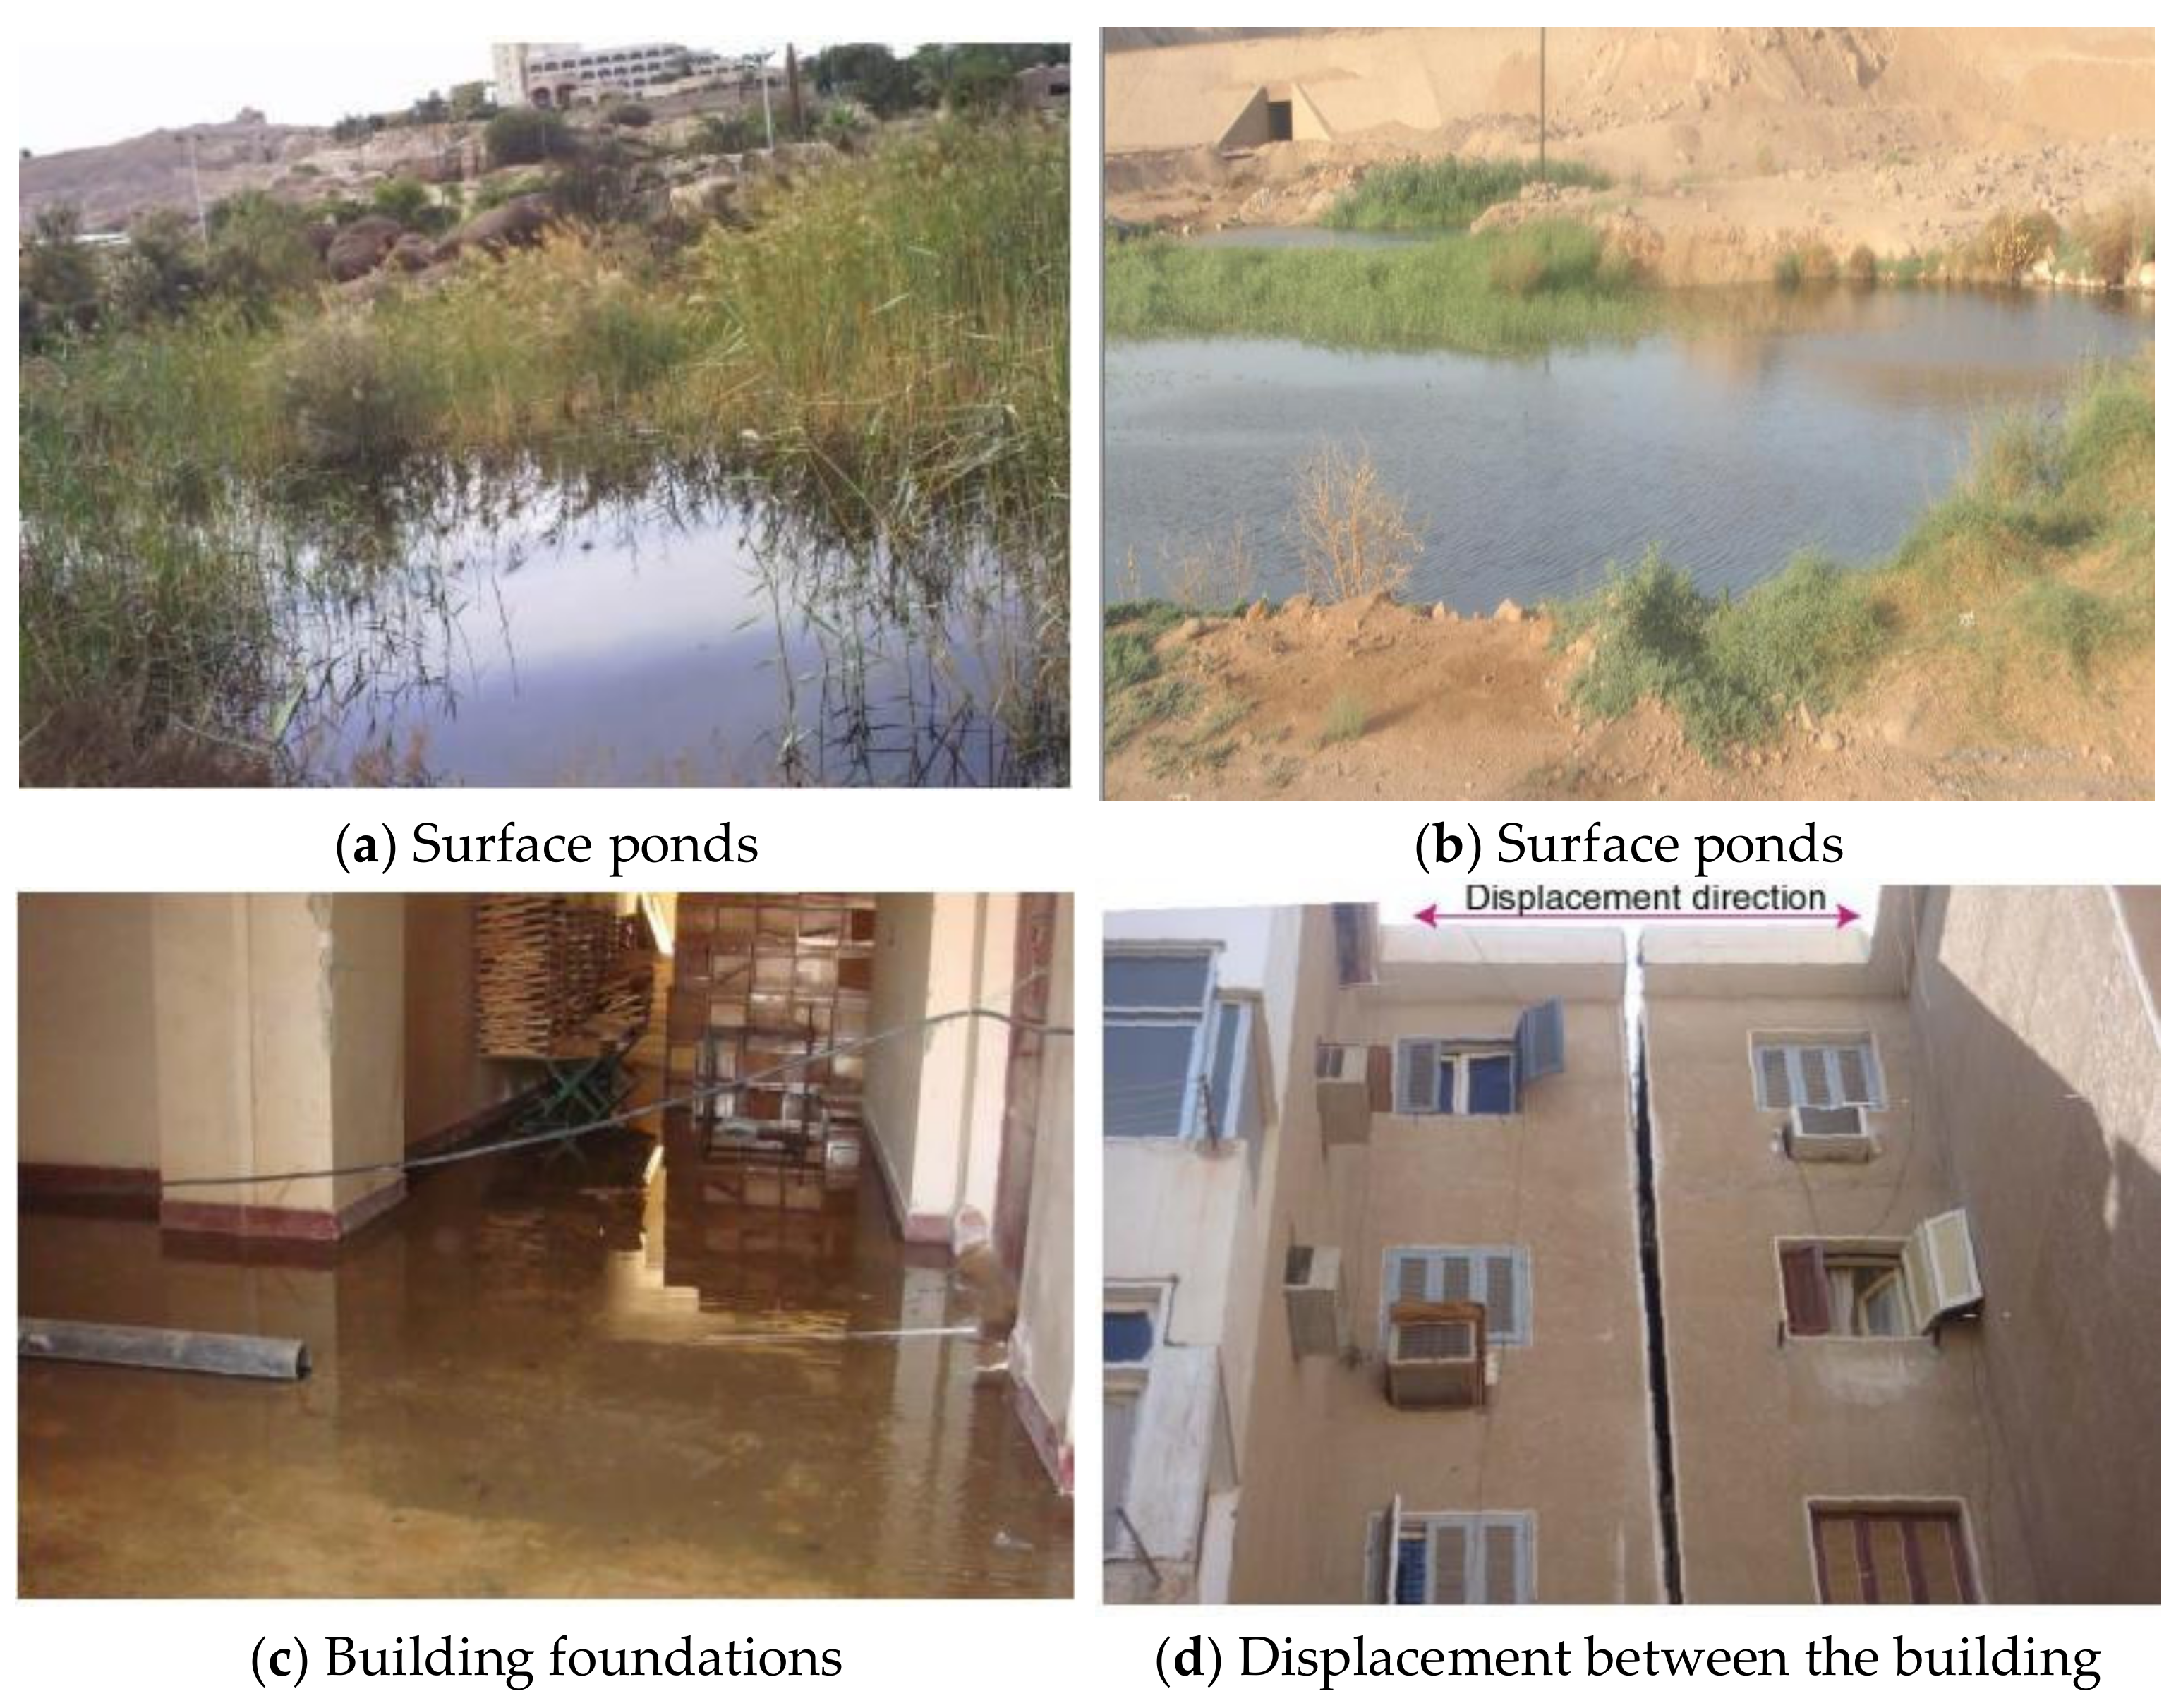
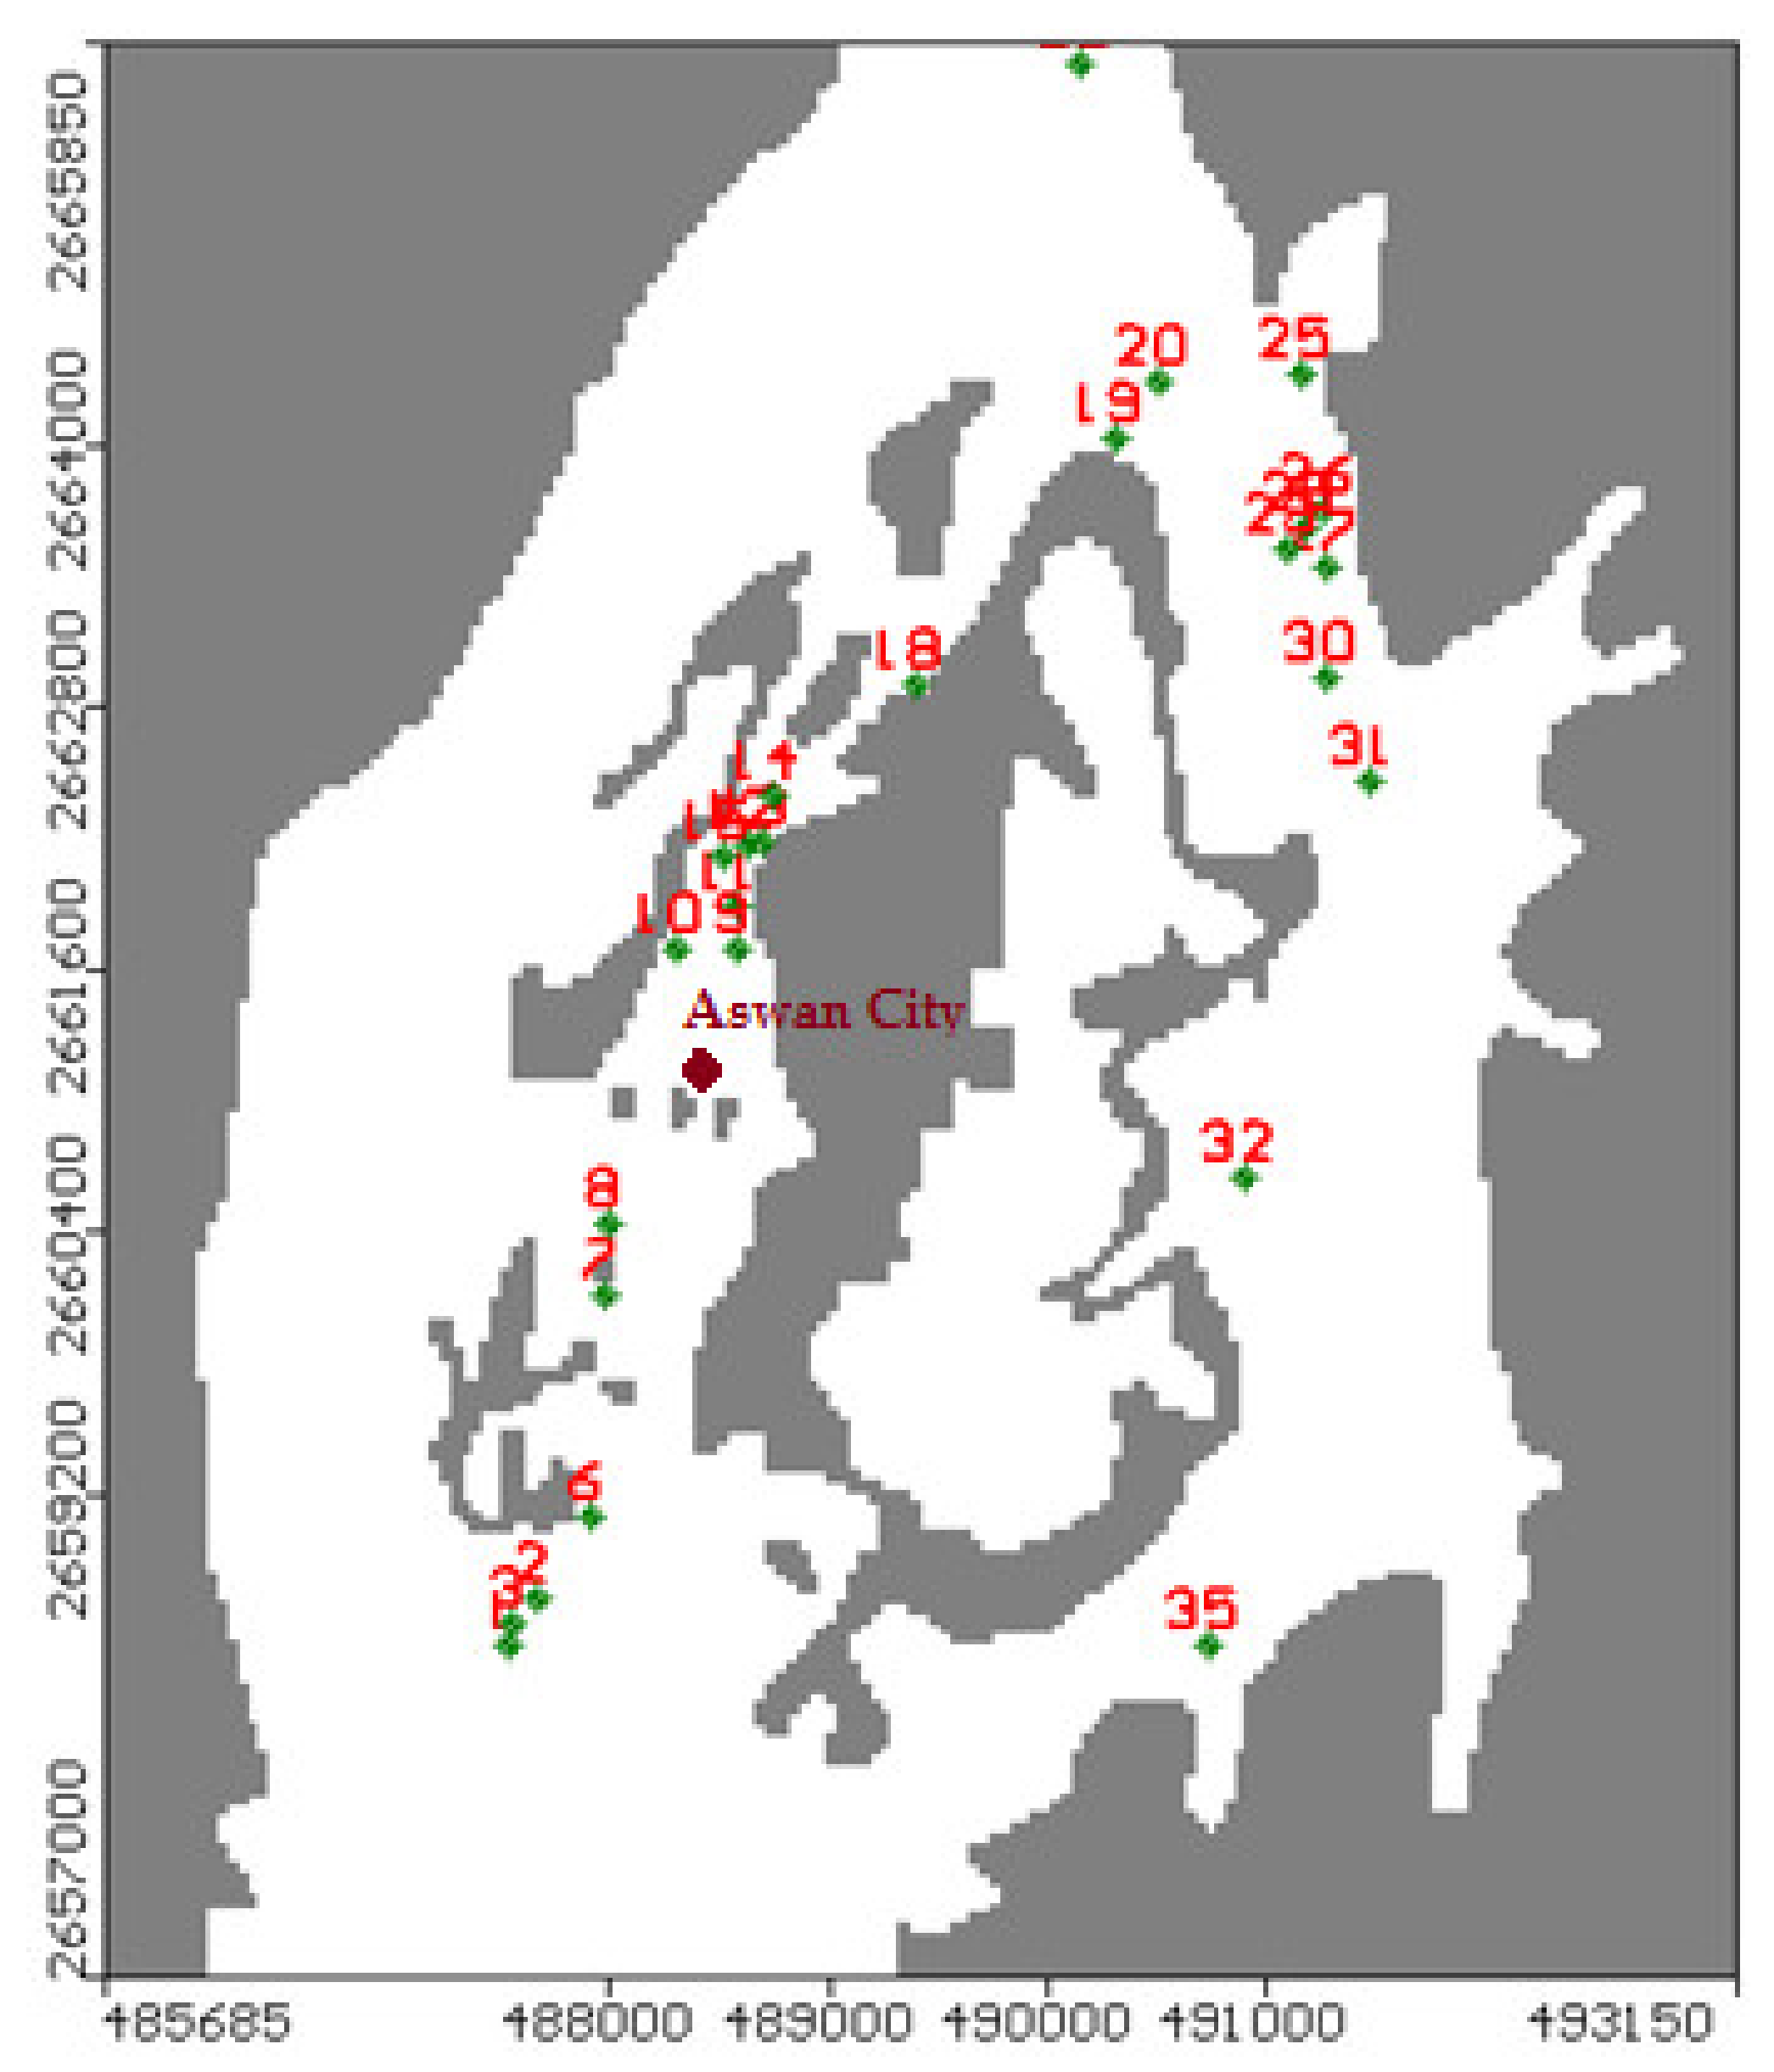
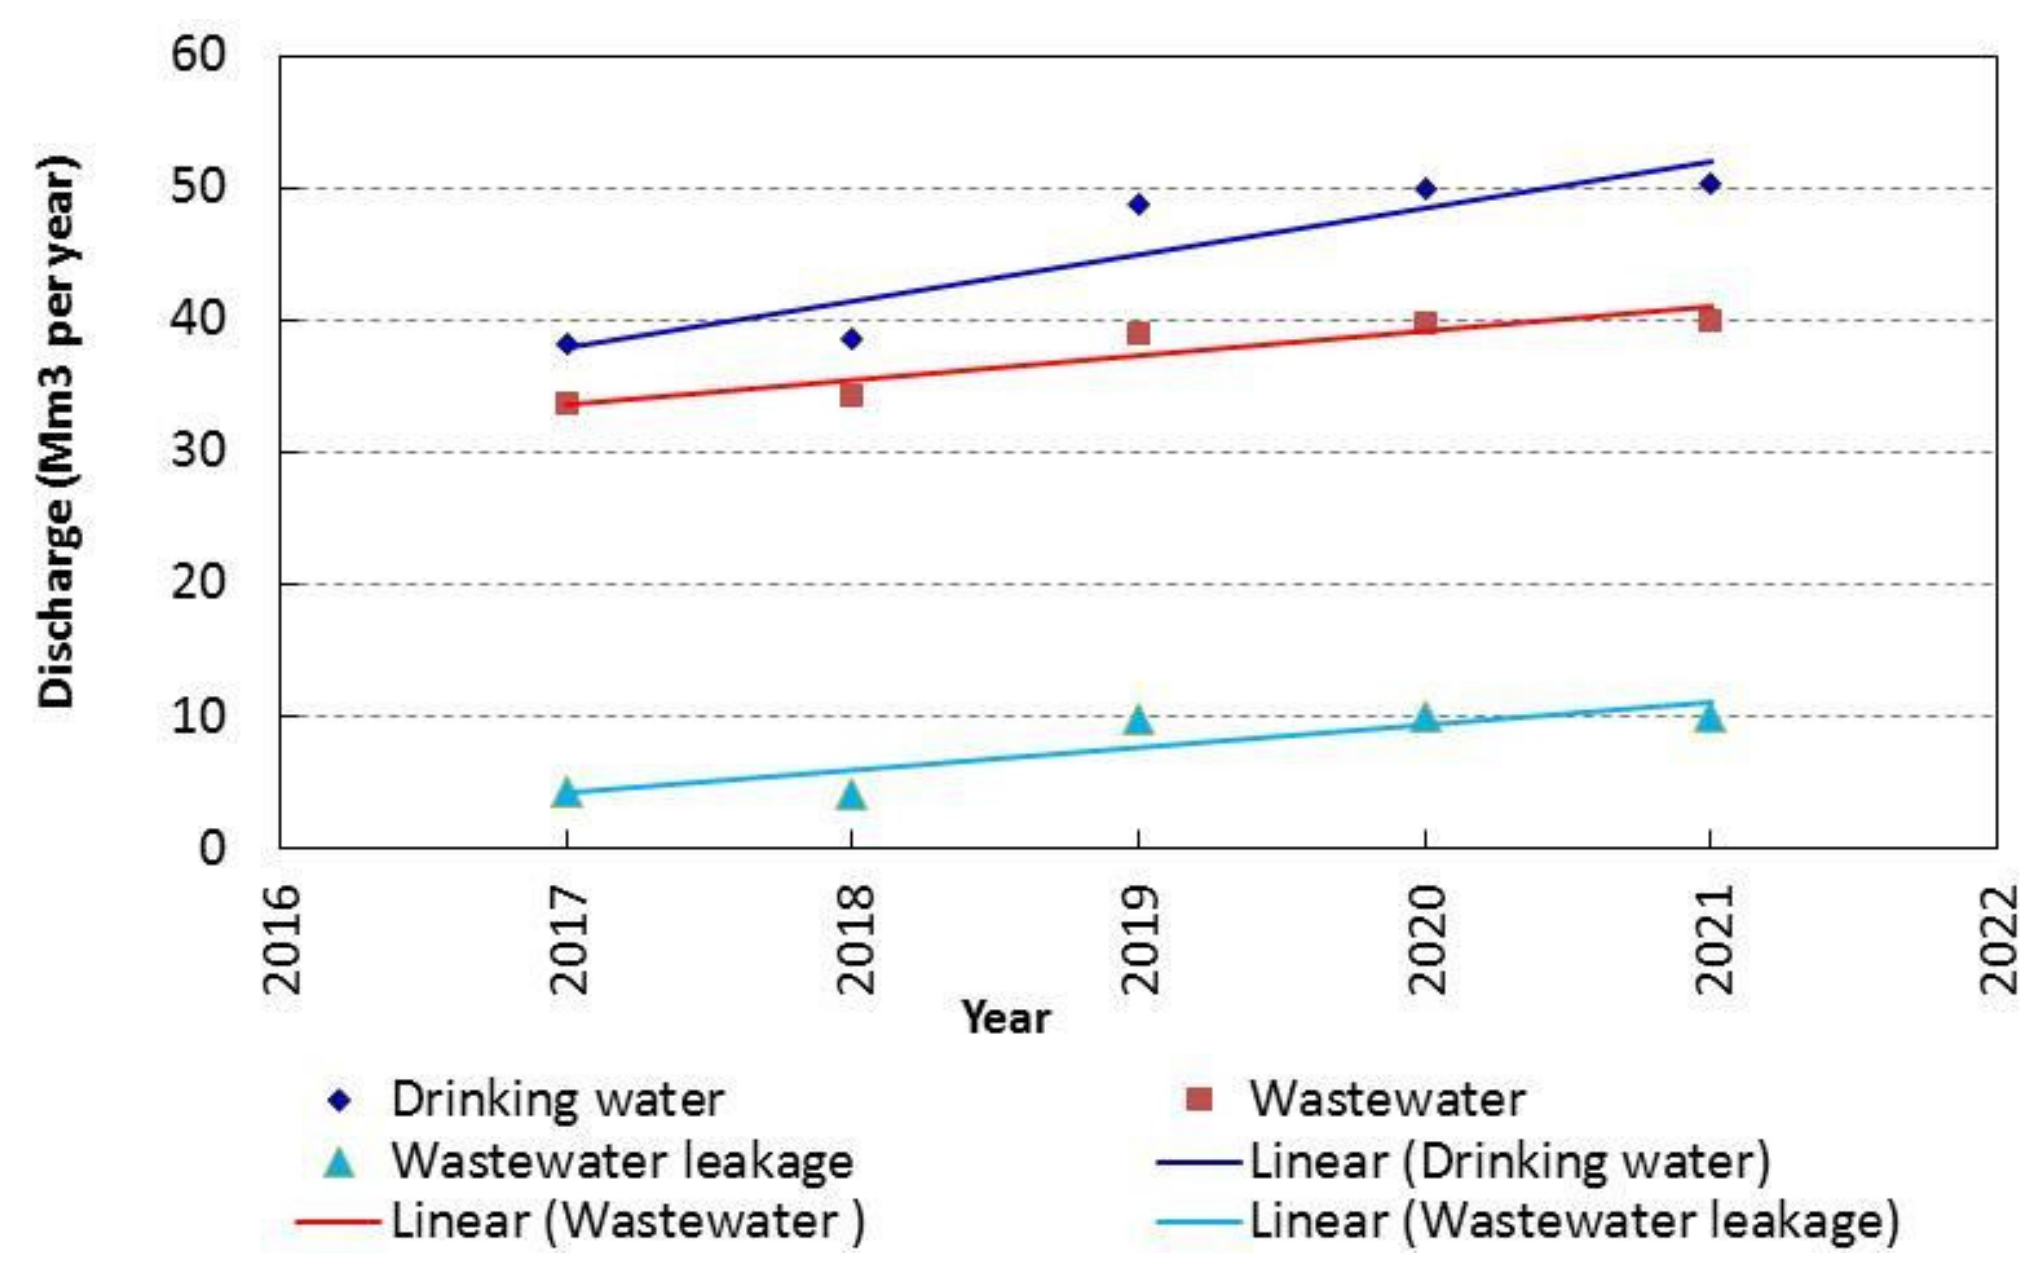
3.1. Investigation of the Leakage of Drinking Water and Sewage in Aswan City

Figure 10 shows the quantities of water produced and pumped into the networks for consumption purposes to Aswan city, the quantities of sanitation water that are collected from the city through lift sanitation stations and raised to the treatment plants, whether dual treatment through the Arbaeen station or triple treatment through Kima station, and the quantities of leakage from the drinking water and sewage networks were calculated by determining the difference between the quantities of inputs from drinking water and the quantities of outputs from wastewater from the two networks of drinking water and sewage. Based on the quantities of the leakage from the drinking water and sewage networks, a linear relationship was made to predict the future quantities of leakage.

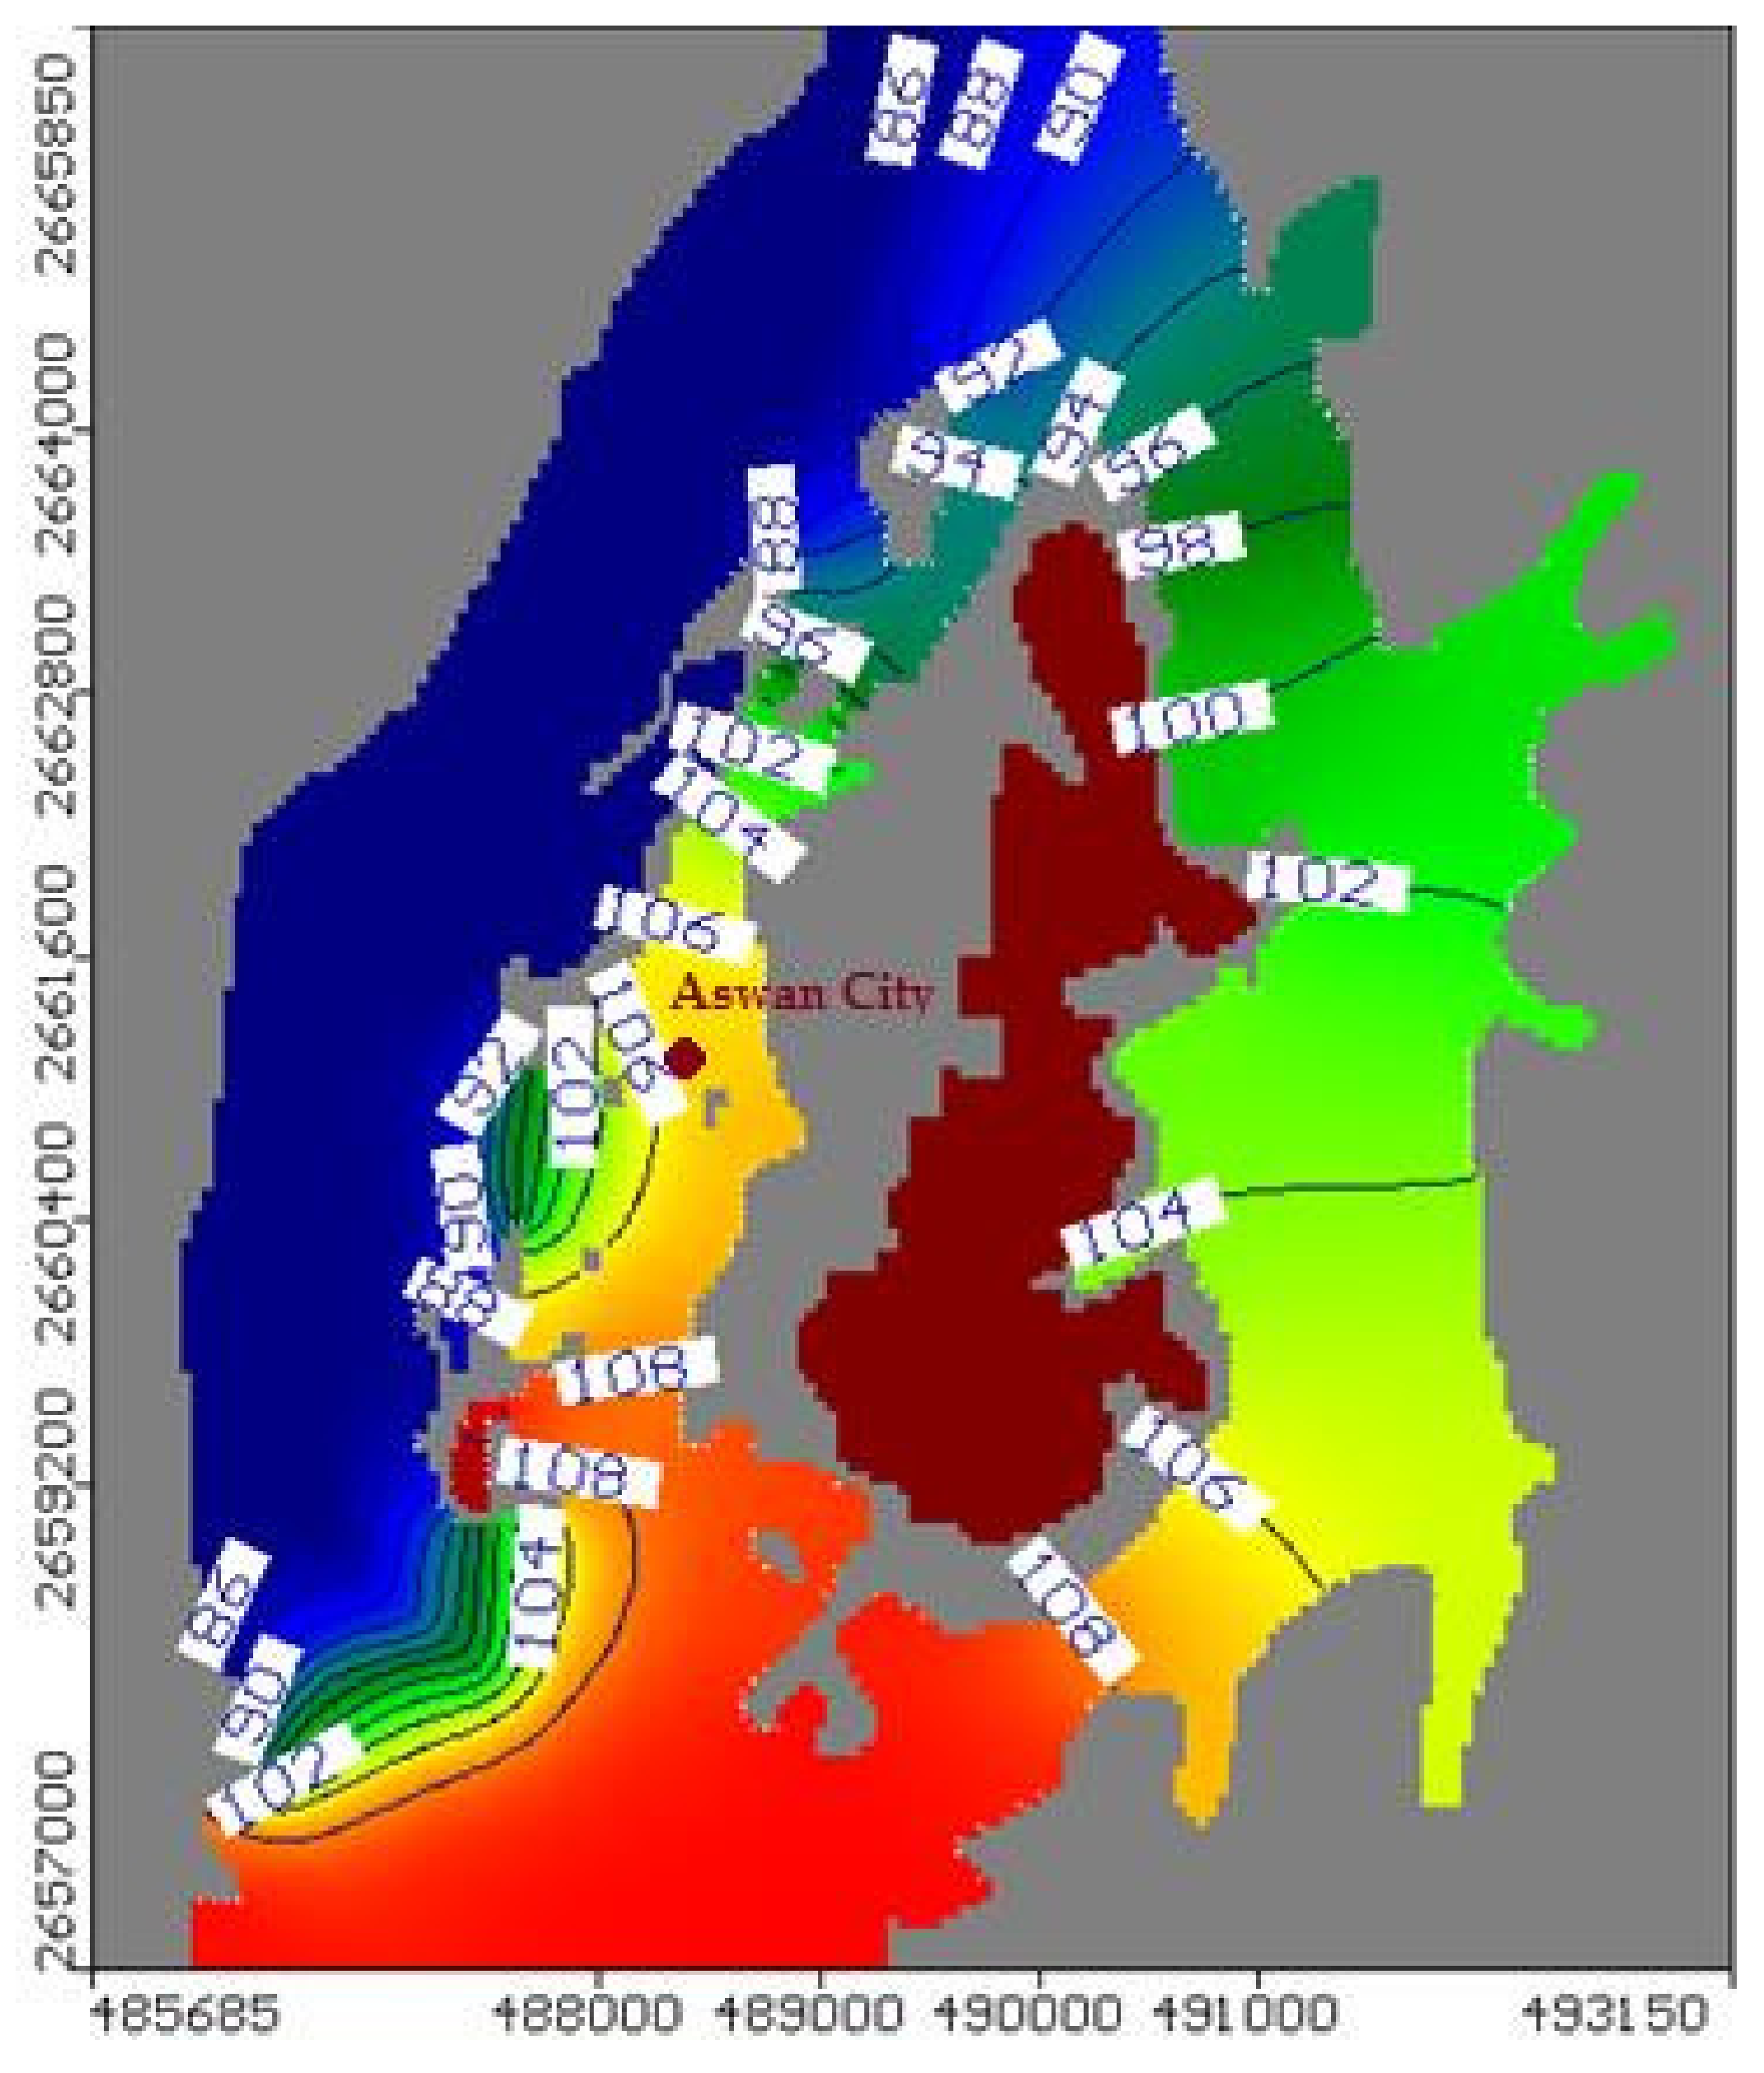
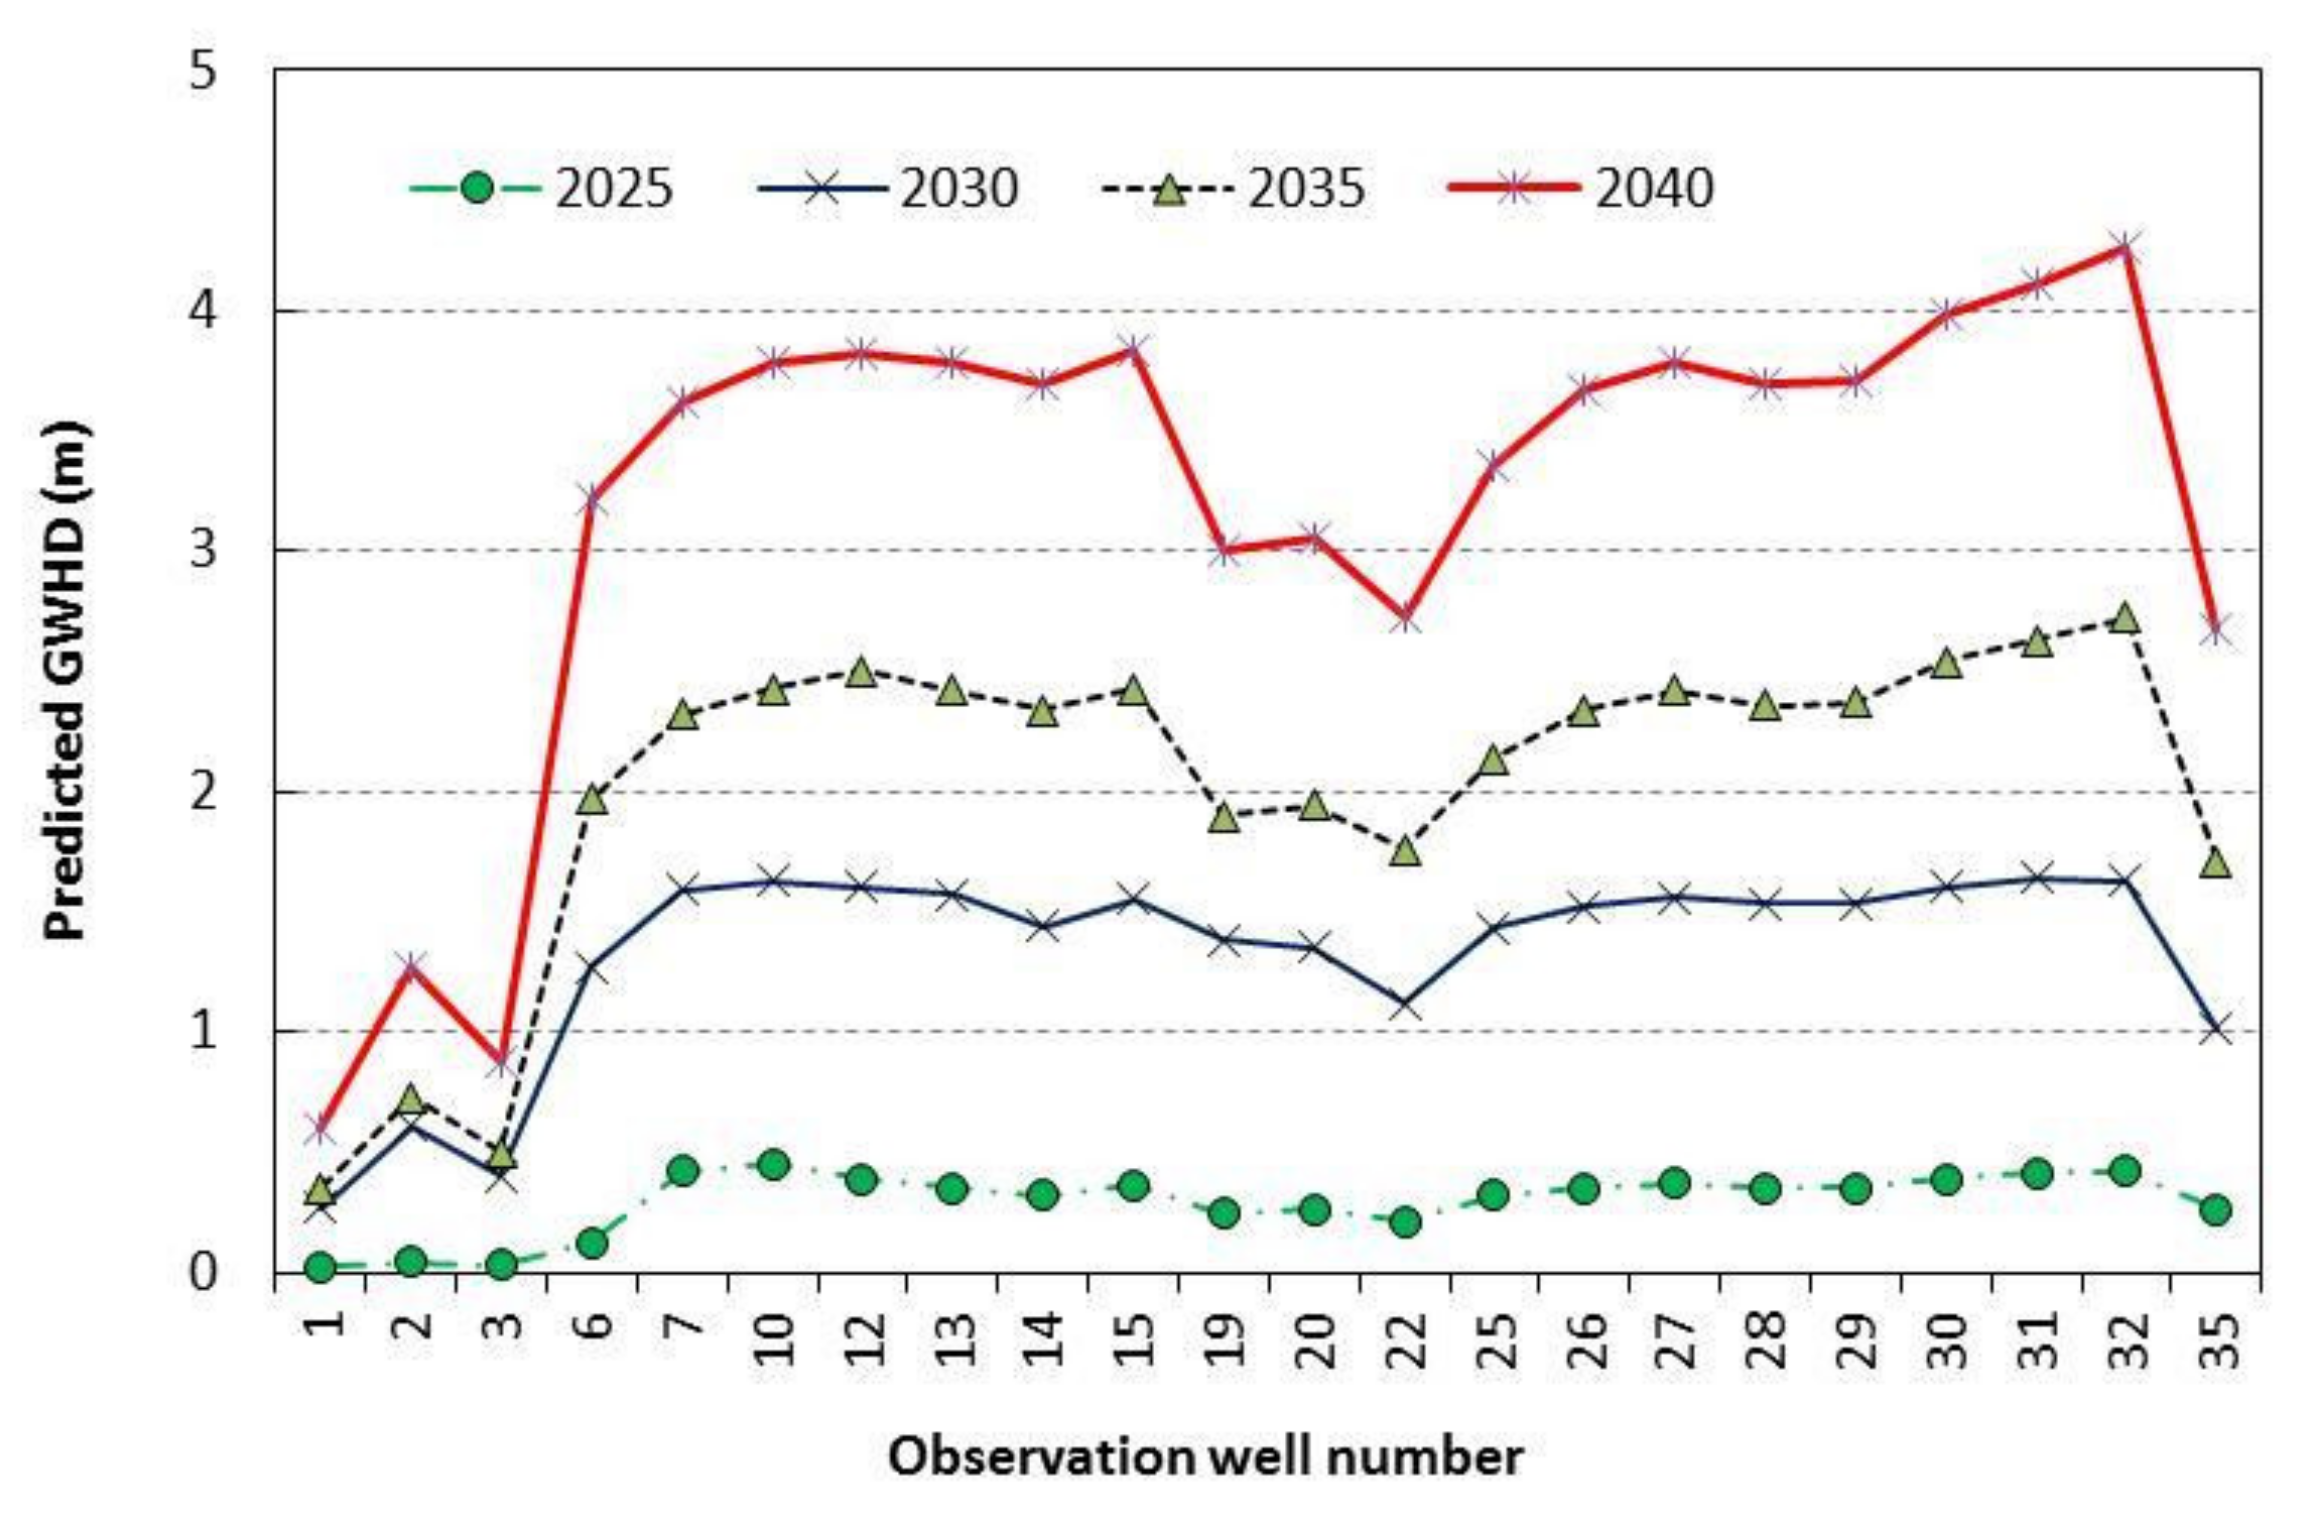
3.2. Impact of the Leakage of Drinking Water and Sewage on Groundwater Heads in Aswan City

The leakage from the drinking water and sewage networks in Aswan city is one of the most important factors that works to raise GWL in the Aswan Aquifer. The average percentage of leakage from drinking water and sewage networks was calculated. It is the difference between the amounts of the drinking water and sewage networks in Aswan city. Using the linear relationship that expresses the average leakage from the drinking water and sewage networks, the quantities were predicted in the future years as shown in Figure 10. The leakage amounts from the drinking water and sewage networks were predicted for the years 2025, 2030, 2035 and 2040. In the first scenario, the amount of the recharge to the aquifer was increased based on the increase in the quantities of future leakage, where the percentages of increase in recharge to the aquifer for the years 2025, 2030, 2035 and 2040 were as follows: 7%, 35%, 64% and 92%, respectively. From the results of the model, it was found that groundwater levels in the study area are increasing as a result of the increase in the amount of leakage from the drinking water and sewage networks in the years 2025, 2030, 2035 and 2040 compared to the levels of groundwater in the study area for the year 2020 by percentage (0.29%, 1.31%, 2.01%, and 3.16%, respectively). The prediction of groundwater heads due to the increase in the leakage in years 2025, 2030, 2035 and 2040 is shown in the Table 2. Figure 11 shows the difference in the GWL for the different future years compared to the GWL in 2020 as a result of the increase in the amount of recharge to Aswan aquifer due to the increase in the leakage from the drinking water and sewage networks. This is in agreement with both Selim et al. [36] and Farrag et al. [39], who proved that an increase in leakage from the drinking water and sewage networks leads to an increase in groundwater levels in the study area. Abd-Elaty et al. [40,41] concluded that increased recharge increases GWL.

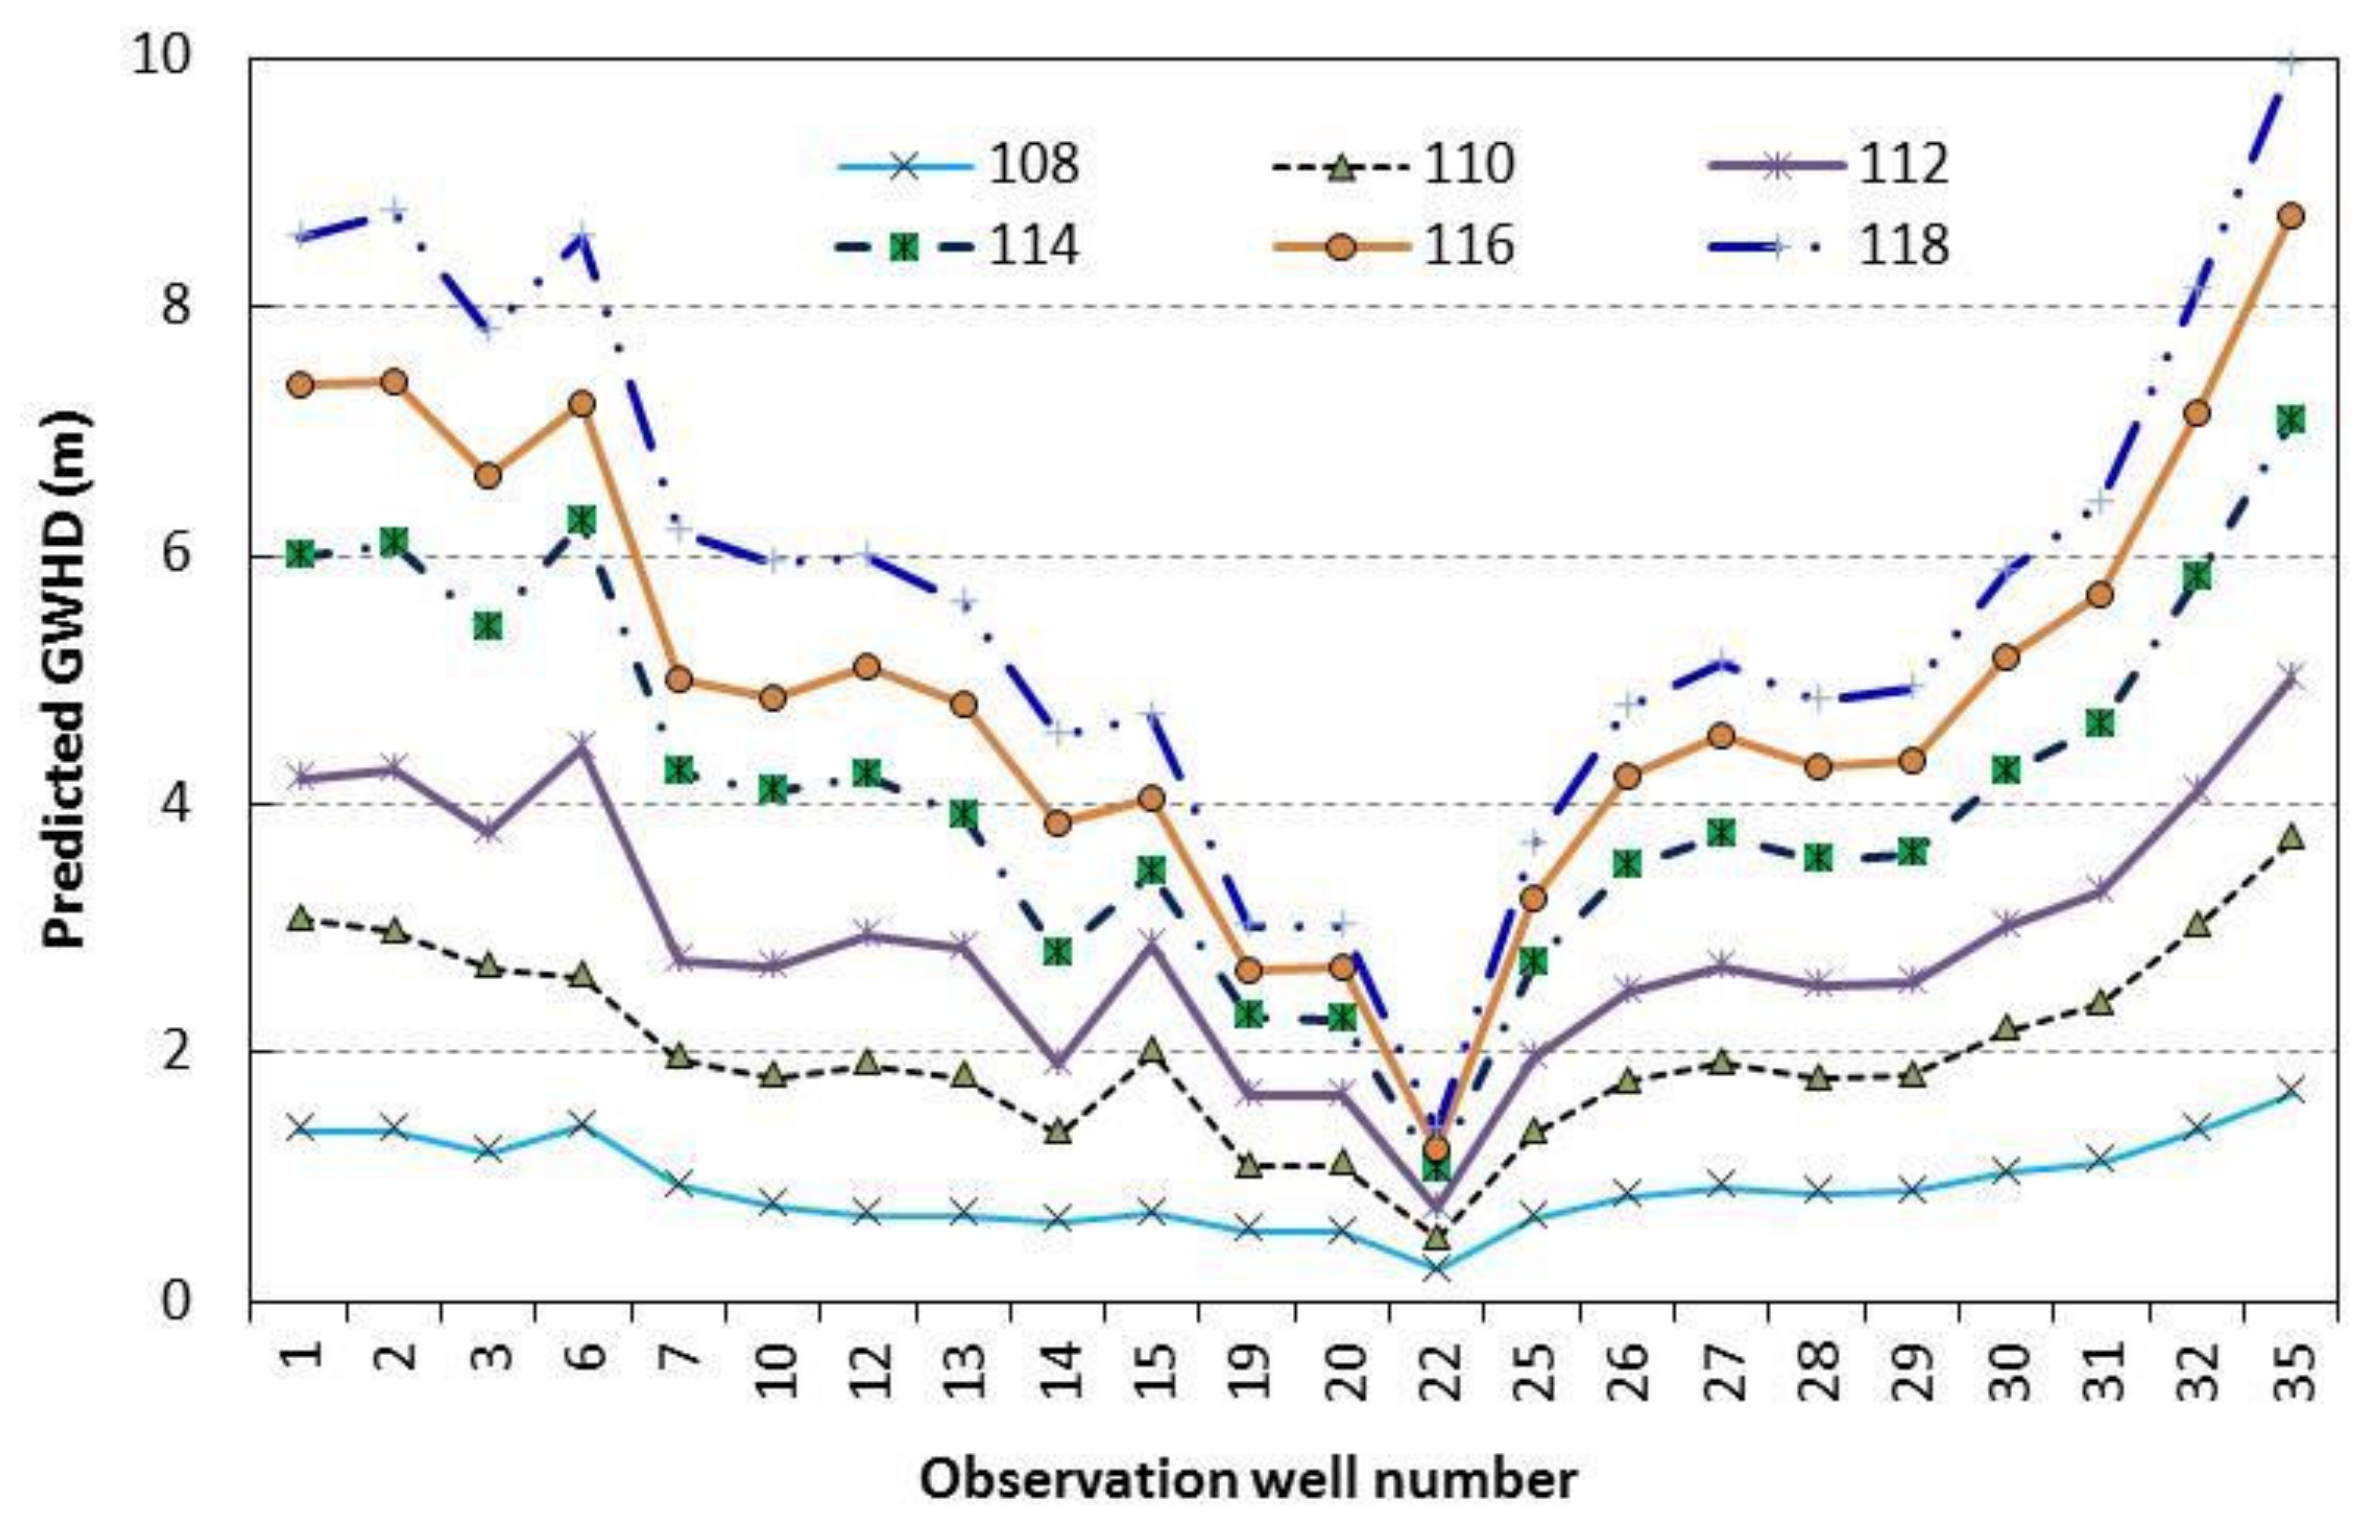
3.3. Impact of El hebs’ Boundary Conditions on Groundwater Heads in Aswan City

El hebs (the lake between the HAD and the AD) is the main source of the recharge for the Aswan aquifer, whose change in its level depends on the amount of water coming from the HAD and the amount of water leaving the AD. In the second scenario, the water levels in El hebs were changed as a boundary condition as follows: 108 m, 110 m, 112 m, 114 m, 116 m and 118 m (Selim et al. [30]) and the GWL were calculated in the Aswan Aquifer corresponding to each level, as shown in the Table 3. The percentage of increase in GWL corresponding to the levels 108 m, 110 m, 112 m, 114 m, 116 m and 118 m compared to the GWL at the level of 106 m was found as follows: 0.92%, 2%, 2.87%, 4.05%, 4.91% and 5.67%. The Groundwater Head Difference (GWHD) for the different levels of El hebs compared to the GWL at the El hebs water level of 106 m is shown in Figure 12. This is in agreement with Selim et al. [36] and Farrag et al. [39], who proved that an increase in El hebs water levels leads to an increase in groundwater levels in the study area. Noureldeen et al. [42] concluded that increasing the levels of the surface water sources for the aquifer led to a rise in GWL and agree with Abd-Elaty [26,43].

4. Conclusions

Increasing the groundwater level in any area is considered a great benefit for its importance and multiplicity of use, but the matter is different in the city of Aswan, where many negative effects occur on the study area as a result of the groundwater logging problem. One of these effects is damage to the foundations of buildings and basements, the collapse of infrastructure and environmental pollution due to the formation of surface ponds and the lack of agricultural land production. In the current study, the height of the groundwater level (GWL) in the city of Aswan has been studied and evaluated in order to be able to develop groundwater management scenarios to achieve the maximum possible benefit from it and reduce the damage resulting from poor groundwater management in the study area. The main objective of this study is to develop a groundwater flow model of the Aswan aquifer, to gain a better understanding of the water dynamics in the study area and to investigate different scenarios of groundwater use management. The model was developed using MODFLOW code, where the necessary field data were collected from the study area to feed the model. The necessary field data are the surface water levels in the Aswan Dam Lake (ADL), water levels in the Nile River, GWL in the Aswan aquifer and the different hydraulic characteristics of the aquifer layers, such as porosity and recharging for different periods. Calibration of the model was achieved using 22 observation wells distributed in the Aswan aquifer domain based on field data in 2020. A comparison was made between the head calculated by MODFLOW and the head observed from field data. Based on these results, it is clear that the MODFLOW model works correctly to simulate the components of the hydrological water budget in the city of Aswan. Moreover, the model provided us with a better understanding of the simulation of the long-term average spatial distribution about the water balance in the study area, which enables us to develop future scenarios for groundwater use management. Several future scenarios have been developed to arrive at a future vision of GWL in the Aswan aquifer and help in the management of groundwater logging. The first scenario is calculating groundwater levels in the study area by changing the values of recharge to the Aswan aquifer resulting from an increase in the drinking water and sewage networks’ leakage values, which were predicted in the future for years 2025, 2030, 2035 and 2040. The second scenario is calculating GWL by changing the water levels in El hebs (the lake between the High Aswan Dam and the Aswan Dam) as follows: 108 m, 110 m, 112 m, 114 m, 116 m and 118 m. From the results of the model, it was found that GWL in the study area were increased as a result of the increase in the amount of leakage from the drinking water and sewage networks in the years 2025, 2030, 2035 and 2040 compared to the year 2020 by percentages of 0.29%, 1.31%, 2.01% and 3.16%, respectively. In the second scenario, the percentage of increase in the GWLs reached 0.92%, 2%, 2.87%, 4.05%, 4.91% and 5.67%, respectively. The current study will help to develop proposed future scenarios for managing the groundwater logging problem in Aswan city.

Author Contributions

Conceptualization, M.Z.; methodology, H.H., I.A.-E., A.S.N.-E., A.N. and A.M.H.; validation, H.H., I.A.-E., A.S.N.-E. and A.N.; formal analysis, I.A.-E., A.S.N.-E. and M.Z.; investigation, H.H., I.A.-E., A.N. and A.S.N.-E.; data curation, I.A.-E., H.H., A.S.N.-E. and A.N.; writing—original draft preparation, I.A.-E., H.H. and A.S.N.-E.; writing—review and editing, I.A.-E., A.N., H.H., M.E., M.Z., A.S.N.-E. and A.M.H.; supervision, A.N. and M.Z.; project administration, M.Z.; funding acquisition, M.Z. All authors have read and agreed to the published version of the manuscript.

Funding

This research received no external funding.

Institutional Review Board Statement

Not applicable.

Informed Consent Statement

Not applicable.

Data Availability Statement

The data are not publicly available due to institutional property rights.

Acknowledgments

This work was supported by the Slovak Research and Development Agency under the Contract no. APVV-20-0281 and a project funded by the Ministry of Education of the Slovak Republic VEGA1/0308/20 “Mitigation of hydrological hazards, floods, and droughts by exploring extreme hydroclimatic phenomena in river basins”.

Conflicts of Interest

The authors declare no conflict of interest.

References

  1. Salem, A.; Dezső, J.; El-Rawy, M. Assessment of Groundwater Recharge, Evaporation, and Runoff in the Drava Basin in Hungary with the WetSpass Model. Hydrology 2019, 6, 23. [Google Scholar] [CrossRef] [Green Version]
  2. Gaur, S.; Chahar, B.; Graillot, D. Combined use of groundwater modeling and potential zone analysis for management of groundwater. Int. J. Appl. Earth Obs. Geoinf. 2011, 13, 127–139. [Google Scholar] [CrossRef]
  3. Prasad, R.K.; Mondal, N.C.; Banerjee, P.; Nandakumar, M.V.; Singh, V.S. Deciphering potential ground-water zone in hard rock through the application of GIS. Environ. Geol. 2008, 55, 467–475. [Google Scholar] [CrossRef]
  4. Pathak, D.R.; Hiratsuka, A.; Awata, I.; Chen, L. Groundwater vulnerability assessment in shallow aquifer of Kathmandu Valley using GIS-based DRASTIC model. Environ. Earth Sci. 2009, 57, 1569–1578. [Google Scholar] [CrossRef]
  5. Yeh, H.-F.; Lee, C.-H.; Hsu, K.-C.; Chang, P.-H. GIS for the assessment of the groundwater recharge potential zone. Environ. Geol. 2009, 58, 185–195. [Google Scholar] [CrossRef]
  6. Fakharinia, M.; Lalehzari, R.; Yaghoobzadeh, M. The use of subsurface barriers in the sustainable management of groundwater resources. World Appl. Sci. J. 2012, 19, 1585–1590. [Google Scholar]
  7. Bob, M.; Rahman, N.A.; Elamin, A.; Taher, S. Rising Groundwater Levels Problem in Urban Areas: A Case Study from the Central Area of Madinah City, Saudi Arabia. Arab. J. Sci. Eng. 2016, 41, 1461–1472. [Google Scholar] [CrossRef]
  8. Al-Sefry, S.A.; Şen, Z. Groundwater Rise Problem and Risk Evaluation in Major Cities of Arid Lands—Jedddah Case in Kingdom of Saudi Arabia. Water Resour. Manag. 2006, 20, 91–108. [Google Scholar] [CrossRef]
  9. Ray, A. Participatory Governance: Addressing the Problem of Rising Groundwater Level in Cities. J. Hum. Ecol. 2005, 18, 137–147. [Google Scholar] [CrossRef]
  10. Huntington, J.; McGwire, K.; Morton, C.; Snyder, K.; Peterson, S.; Erickson, T.; Niswonger, R.; Carroll, R.; Smith, G.; Allen, R. Assessing the role of climate and resource management on groundwater dependent ecosystem changes in arid environments with the Landsat archive. Remote Sens. Environ. 2016, 185, 186–197. [Google Scholar] [CrossRef] [Green Version]
  11. Abd-Elaty, I.; Javadi, A.A.; Abd-Elhamid, H. Management of saltwater intrusion in coastal aquifers using different wells systems: A case study of the Nile Delta aquifer in Egypt. Appl. Hydrogeol. 2021, 29, 1767–1783. [Google Scholar] [CrossRef]
  12. Abd-Elaty, I.; Said, A.; Abdelaal, G.; Zeleňáková, M.; Jandora, J.; Abd-Elhamid, H. Assessing the Impact of Lining Polluted Streams on Groundwater Quality: A Case Study of the Eastern Nile Delta Aquifer, Egypt. Water 2021, 13, 1705. [Google Scholar] [CrossRef]
  13. Chitsazan, M.; Movahedian, A. Evaluation of Artificial Recharge on Groundwater Using MODFLOW Model (Case Study: Gotvand Plain-Iran). J. Geosci. Environ. Prot. 2015, 03, 122–132. [Google Scholar] [CrossRef] [Green Version]
  14. El-Rawy, M.; Zlotnik, V.A.; Al-Raggad, M.; Al-Maktoumi, A.; Kacimov, A.; Abdalla, O. Conjunctive use of groundwater and surface water resources with aquifer recharge by treated wastewater: Evaluation of management sce-narios in the Zarqa River Basin, Jordan. Environ. Earth Sci. 2016, 75, 1146. [Google Scholar] [CrossRef]
  15. Abd-Elhamid, H.F.; Abdelaal, G.M.; Abd-Elaty, I.; Said, A.M. Evaluation of Groundwater Vulnerability to Seepage from Open Drains Considering Different Pumping Schemes in Unconfined Aquifers. In Proceedings of the Twenty-first International Water Technology Conference, IWTC21, Ismailia, Egypt, 28–30 June 2018. [Google Scholar]
  16. Al-Maktoumi, A.; Zekri, S.; El-Rawy, M.; Abdalla, O.; Al-Wardy, M.; Al-Rawas, G.; Charabi, Y. Assessment of the impact of climate change on coastal aquifers in Oman. Arab. J. Geosci. 2018, 11, 501. [Google Scholar] [CrossRef]
  17. El Shinawi, A.; Kuriqi, A.; Zelenakova, M.; Vranayova, Z.; Abd-Elaty, I. Land subsidence and environmental threats in coastal aquifers under sea level rise and over-pumping stress. J. Hydrol. 2022, 608, 127607. [Google Scholar] [CrossRef]
  18. Abd-Elaty, I.; Zelenakova, M.; Straface, S.; Vranayová, Z.; Abu-Hashim, M.; Elaty, A.; Hashim, A. Integrated Modelling for Groundwater Contamination from Polluted Streams Using New Protection Process Techniques. Water 2019, 11, 2321. [Google Scholar] [CrossRef] [Green Version]
  19. Chakraborty, S.; Maity, P.K.; Das, S. Investigation, simulation, identification and prediction of groundwater levels in coastal areas of Purba Midnapur, India, using MODFLOW. Environ. Dev. Sustain. 2019, 22, 3805–3837. [Google Scholar] [CrossRef]
  20. Abd-Elaty, I.; Eldeeb, H.; Vranayova, Z.; Zelenakova, M. Stability of Irrigation Canal Slopes Considering the Sea Level Rise and Dynamic Changes: Case Study El-Salam Canal, Egypt. Water 2019, 11, 1046. [Google Scholar] [CrossRef] [Green Version]
  21. Ta’any, R.A.; Al-Arabiyat, A.R.E.E.J.; Mahameed, J.I.H.A.D.; Al–Zu’bi, J.A. Groundwater Management Using Modflow Model in Jerash Catchment Area/Jordan. Ass. Univ. Bull. Environ. Res. 2013, 16, 113–139. [Google Scholar]
  22. Hamzaoui-Azaza, F.; Zammouri, M.; Ameur, M.; Sy, M.B.; Gueddari, M.; Bouhlila, R. Hydrogeochemical modeling for groundwater management in arid and semiarid regions using MODFLOW and MT3DMS: A case study of the Jeffara of Medenine coastal aquifer, South-Eastern Tunisia. Nat. Resour. Model. 2020, 33, 12282. [Google Scholar] [CrossRef]
  23. Abd-Elaty, I.; Saleh, O.K.; Ghanayem, H.M.; Grischek, T.; Zelenakova, M. Assessment of hydrological, geo-hydraulic and operational conditions at a riverbank filtration site at Embaba, Cairo using flow and transport modeling. J. Hydrol. Reg. Stud. 2021, 37, 100900. [Google Scholar] [CrossRef]
  24. Abd-Elhamid, H.; Abdelaty, I.; Sherif, M. Evaluation of potential impact of Grand Ethiopian Renaissance Dam on Seawater Intrusion in the Nile Delta Aquifer. Int. J. Environ. Sci. Technol. 2019, 16, 2321–2332. [Google Scholar] [CrossRef]
  25. Abd-Elhamid, H.F.; Sherif, M.; Abd-Elaty, I. Impact of Aquifer Geometry and Boundary Conditions on Saltwater Intrusion in Coastal Aquifers. In Proceedings of the World Environmental and Water Resources Congress (EWRI), West Palm Beach, FL, USA, 22–26 May 2016. [Google Scholar]
  26. Abd-Elaty, I.; Pugliese, L.; Bali, K.M.; Grismer, M.E.; Eltarabily, M.G. Modelling the impact of lining and covering irrigation canals on underlying groundwater stores in the Nile Delta, Egypt. Hydrol. Process. 2021, 36, e14466. [Google Scholar] [CrossRef]
  27. Abdelrhem, I.M.; Raschid, K.; Ismail, A. Integrated groundwater management for great man-made river project in Libya. Eur. J. Sci. Res. 2008, 22, 562–569. [Google Scholar]
  28. Rejani, R.; Jha, M.K.; Panda, S.N.; Mull, R. Simulation Modeling for Efficient Groundwater Management in Balasore Coastal Basin, India. Water Resour. Manag. 2007, 22, 23–50. [Google Scholar] [CrossRef]
  29. Youssef, T.; Gad, M.I.; Ali, M.M. Assessment of groundwater resources management in Wadi El-Farigh area using MODFLOW. IOSR J. Eng. (IOSRJEN) 2012, 2, 69–78. [Google Scholar] [CrossRef]
  30. Antoniou, M.; Theodossiou, N.; Karakatsanis, D. Groundwater management optimization with combined use of Harmony Search Algorithm and modular finite-difference flow model Modflow. In Proceedings of the 14th Conference of the Hellenic Hydrotechnical Association (HHA), Volos, Greece, 16–17 May 2019. [Google Scholar]
  31. Hadded, R.; Nouiri, I.; Alshihabi, O.; Maßmann, J.; Huber, M.; Laghouane, A.; Yahiaoui, H.; Tarhouni, J. A Decision Support System to Manage the Groundwater of the Zeuss Koutine Aquifer Using the WEAP-MODFLOW Framework. Water Resour. Manag. 2013, 27, 1981–2000. [Google Scholar] [CrossRef]
  32. Malekinezhad, H.; Banadkooki, F.B. Modeling impacts of climate change and human activities on ground-water resources using MODFLOW. J. Water Clim. Change 2018, 9, 156–177. [Google Scholar] [CrossRef]
  33. Hamdan, A.M.A.; Rady, A.R.A. Vulnerability of the groundwater in the quaternary aquifer at El Shalal-Kema area, Aswan, Egypt. Arab. J. Geosci. 2011, 6, 337–358. [Google Scholar] [CrossRef]
  34. Abdelrady, A.; Sharma, S.; Sefelnasr, A.; El-Rawy, M.; Kennedy, M. Analysis of the Performance of Bank Filtration for Water Supply in Arid Climates: Case Study in Egypt. Water 2020, 12, 1816. [Google Scholar] [CrossRef]
  35. Gameh, M.A.; Abdalazem, A.H.; Hamdan, A.M.; Awad, A.; Mohamed, A.G. Groundwater Quality As-sessment for Irrigation in West Edfu Region, Aswan, Egypt. Assiut J. Agric. Sci. 2020, 51, 125–149. [Google Scholar]
  36. Selim, S.A.; Hamdan, A.M.; Rady, A.A. Groundwater Rising as Environmental Problem, Causes and Solutions: Case Study from Aswan City, Upper Egypt. Open J. Geol. 2014, 4, 324–341. [Google Scholar] [CrossRef] [Green Version]
  37. McDonald, M.G.; Harbaugh, A.W. A Modular Three-Dimensional Finite-Difference Ground-Water Flow Model; USGS TWRI Chapter 6-A1; US Geological Survey: Denver, CO, USA, 1984; Volume 586, p. 11.
  38. Pinder, G.F.; Bredehoeft, J.D. Application of the Digital Computer for Aquifer Evaluation. Water Resource. Res. 1968, 4, 1069–1093. [Google Scholar] [CrossRef]
  39. Farrag, A.E.-H.A.; Megahed, H.A.; Darwish, M.H. Remote sensing, GIS and chemical analysis for assessment of environmental impacts on rising of groundwater around Kima Company, Aswan, Egypt. Bull. Natl. Res. Cent. 2019, 43, 14. [Google Scholar] [CrossRef] [Green Version]
  40. Abd-Elaty, I.; Abd-Elhamid, H.F.; Qahman, K. Coastal aquifer protection from saltwater intrusion using ab-straction of brackish water and recharge of treated wastewater: Case study of the gaza aquifer. J. Hydrol. Eng. 2020, 25, 05020012. [Google Scholar] [CrossRef]
  41. Abd-Elaty, I.; Zelenakova, M. Saltwater intrusion management in shallow and deep coastal aquifers for high aridity regions. J. Hydrol. Reg. Stud. 2022, 40, 101026. [Google Scholar] [CrossRef]
  42. Noureldeen, A.S.; Ghaly, S.; Ali, K.; Abozaid, G. ANN-Based Approach to Predict Changes in Ground Water Levels as a Result of Constructing New Naga-Hammadi Barrage, Egypt. In Collaboration and Integration in Construction, Engineering, Management and Technology; Springer: Cham, Swizerland, 2017; pp. 853–856. [Google Scholar]
  43. Abd-Elaty, I.; Shahawy, A.E.; Santoro, S.; Curcio, E.; Straface, S. Effects of groundwater abstraction and desalination brine deep injection on a coastal aquifer. Sci. Total Environ. 2021, 795, 148928. [Google Scholar] [CrossRef]
Figure 1. The effects of groundwater on the study area; (a,b) Formation surface ponds; (c) Flooding the foundations of buildings; (d) The appearance of displacement between buildings.
Water 14 01164 g001
Figure 2. Flowchart of the optimum management methodology for the groundwater resources.
Water 14 01164 g002
Figure 3. Location map for study area.
Water 14 01164 g003
Figure 4. Temperature values with different years.
Water 14 01164 g004
Figure 5. Geology of the study area [33].
Water 14 01164 g005
Figure 6. Quantities of withdrawal from study area.
Water 14 01164 g006
Figure 7. Distribution of groundwater heads in Aswan city.
Water 14 01164 g007
Figure 8. Distribution of observation wells in study area.
Water 14 01164 g008
Figure 9. The calculated head by MODFLOW and observed head from field data for year 2020.
Water 14 01164 g009
Figure 10. The amounts of drinking water and sanitation in the city of Aswan.
Water 14 01164 g010
Figure 11. The relation between GWHD and observation well number for the leakage of drinking water and sewage networks.
Water 14 01164 g011
Figure 12. The relation between GWHD and observation well number at different boundary conditions.
Water 14 01164 g012
Table 1. Hydraulic conductivity values.
ParameterHydraulic Conductivity
Kx = Ky (m/s)Kz (m/s)
Value0.0001 to 0.00040.00001 to 0.00004
Table 2. Prediction GWH and observation well number at the leakage from the drinking water and sewage networks.
Well GWH at Levels
20202025203020352040
1100.85100.87101.12101.2101.45
2102.28102.32102.89103.01103.54
3100.12100.15100.52100.62101
6106.44106.56107.71108.41109.66
7108.04108.46109.63110.36111.66
10106.54106.99108.17108.97110.32
12104.66105.05106.26107.16108.48
13104.36104.71105.93106.78108.15
14103.35103.67104.79105.69107.05
15105.14105.5106.69107.57108.97
1995.695.8496.9897.598.6
2095.4995.7596.8497.4398.54
2291.791.9192.8293.4694.43
2596.6196.9398.0498.7599.96
2698.5298.87100.04100.86102.19
2799.1699.53100.72101.58102.94
2898.6498.99100.17101102.34
2998.7999.14100.32101.16102.5
30100.44100.83102.04102.98104.42
31101.39101.8103.03104.02105.5
32104.14104.56105.77106.86108.4
35105.33105.59106.34107.04108.01
Table 3. Prediction GWL and observation well number at different boundary conditions.
Well Groundwater Heads at Levels
106108110112114116118
1100.85102.22103.92105.06106.85108.23109.4
2102.28103.65105.25106.55108.37109.69111.03
3100.12101.32102.81103.9105.53106.76107.92
6106.44107.85109.05110.9112.7113.67114.99
7108.04108.98109.99110.79112.29113.04114.24
10106.54107.31108.34109.24110.64111.39112.49
12104.66105.35106.56107.59108.89109.76110.66
13104.36105.05106.16107.21108.26109.16109.96
14103.35104104.7105.25106.15107.2107.9
15105.14105.85107.14108.01108.59109.19109.84
1995.696.1796.6997.2797.8898.2798.63
2095.4996.0596.5997.1497.7698.1798.52
2291.791.9692.292.4692.7592.9393.09
2596.6197.2897.9698.5799.3299.86100.28
2698.5299.37100.28101.02102.01102.74103.29
2799.16100.08101.07101.85102.91103.71104.3
2898.6499.51100.43101.18102.18102.93103.48
2998.7999.67100.61101.36102.38103.14103.71
30100.44101.47102.62103.47104.69105.63106.31
31101.39102.51103.78104.69106.03107.07107.81
32104.14105.52107.15108.25109.95111.29112.26
35105.33107.01109.05110.34112.41114.07115.28
Publisher’s Note: MDPI stays neutral with regard to jurisdictional claims in published maps and institutional affiliations.

