Article

The Ecological Compensation Mechanism in a Cross-Regional Water Diversion Project Using Evolutionary Game Theory: The Case of the Hanjiang River Basin, China

1
Faculty of Resources and Environmental Science, Hubei University, Wuhan 430062, China
2
Ecological Environment Monitoring Center Station of Hubei Province, Wuhan 430071, China
*
Authors to whom correspondence should be addressed.
These authors contributed equally to this work.
Water 2022, 14(7), 1151; https://doi.org/10.3390/w14071151
Submission received: 24 January 2022 / Revised: 30 March 2022 / Accepted: 31 March 2022 / Published: 3 April 2022

Abstract

:
As a vital method to resolve conflicts between water use in upstream and downstream areas and solve the problem of transboundary water pollution, watershed ecological compensation is widely used worldwide. It is necessary to analyze the influencing factors of watershed ecological compensation from the perspective of how different governments interact with each other. However, the previous literature has paid less attention to the special situation of cross-regional water diversion projects, the changing processes of governmental behavior, and the interventions by the central government. Therefore, when taking the upstream and downstream governments and the central government in the basin of a cross-regional water diversion project as research objects, it is important to study their behavior and influencing factors to improve the ecological compensation system in the basin. This paper first analyzes the interactions among upstream, downstream, and central governments in the basin, based on evolutionary game theory. Second, the evolutionary game models before and after the interventions by the central government were developed separately, and the effects of different contexts on the dynamic evolutionary process were analyzed. Finally, taking the Hanjiang River Basin as an example, which is where the water source area of China’s South-to-North Water Diversion Middle Project is located, the opportunity cost of protecting the water environment in the upstream areas of this basin was estimated by establishing an econometric regression model using data on water quality and gross domestic product. The results show that (1) the initial probabilities of governments affect their final behaviors; (2) even without the supervision of the central government, it is still possible for upstream and downstream governments to reach the desired state spontaneously; (3) the supervision of the central government can promote upstream and downstream governments to reach a stable state faster; and (4) the current level of compensation from the central government is significantly lower than the opportunity cost of protecting the water environment for upstream governments in the Hanjiang River Basin. This paper can provide helpful insights for improving the ecological compensation system in the basin, which helps promote cooperation in water environment protection.

1. Introduction

As an important type of natural resource, water resources play a vital role in the process of human survival and development [1,2]. However, with the rapid development of human society and the economy, while relying on water resources, human activities have caused unpredictable water resource pollution [3,4]. Due to the cumulative effect of such pollution, the pollutants discharged into the watershed have exceeded their self-purification capacity [5], resulting in serious water pollution. Because of the mobility of water resources, pollution in the upstream areas of a watershed can quickly spread to downstream areas [6]. Moreover, as a special public good, water resources have the exclusivity of consumption and the relevance of supply [7]. Therefore, watershed pollution usually involves multiple administrative regions and is a complex transboundary water pollution problem [8,9].
Transboundary water pollution has become a common global concern [10,11]. Because of the large influence of the basin and the complex relationships between stakeholders, all stakeholders have the same right to use water resources and pollutant discharge but act from different starting points; thus, it is difficult to coordinate these subjects of interest to take unified action to protect the aquatic environment. Many scholars have proposed different solutions from various perspectives in response to this problem, such as transboundary water pollution regulations [12], water pollution transfer taxes [13], and pollutant degradation technologies [14]. However, these solutions are not effective in mobilizing stakeholders to protect the water environment of the basin.
As a direct and effective environmental protection solution, payment for environmental services (PES) provides a new way to coordinate different stakeholders and solve transboundary water pollution problems [15,16]. PESs are a way to translate values with externalities into financial incentives for conservationists to ensure a sustainable supply of ecosystem services [17] and are widely used in natural resource management, such as forest ecological compensation [18], grassland ecological compensation [19], biodiversity compensation [20], and watershed ecological compensation [9]. The critical advantage of PESs is that they can coordinate different stakeholders to solve transboundary water pollution problems collaboratively through economic instruments instead of solving only pollution problems within each jurisdiction alone. Therefore, PES was widely recognized by the international community and implemented on numerous national and regional scales.
A system similar to PES has been widely used in China to effectively solve environmental pollution problems but is referred to as ecological compensation, and its application to water protection is known as watershed ecological compensation [21]. China is plagued by water pollution [22], such as that in the Huaihe River [23], the cyanobacteria events of Tai Lake [24], and eutrophication and heavy metal pollution in the water supply area of China’s South-to-North Water Diversion Project (SNWDP) [25]. Watershed ecological compensation policies are widely implemented in these watersheds. The Environmental Protection Law in China stipulates that watershed ecological compensation should follow the principle of “who develops, protects; who destroys, restores; who benefits, compensates; who pollutes, pays” and aim to strengthen the paid use of water resources and the “polluter pays” policy through economic means [26].
As the world’s largest and most invested-in cross-regional water diversion project, China’s SNWDP has gradually implemented a watershed ecological compensation system [27]. The SNWDP has planned three water transfer routes (the eastern, middle, and western routes) to transfer water resources from the Yangtze River Basin to the Huaihe River Basin and the Haihe River Basin. Currently, the eastern and middle routes have started operation, and as of January 2022, the cumulative volume of water transferred from the first phase of the SNWDP was close to 45 billion cubic meters, directly benefiting more than 120 million people and becoming the primary source of water for domestic use in several important cities [28]. The starting point of the middle route is located at the Danjiangkou Reservoir in the upstream areas of the Hanjiang River. With the rapid development of industry in the upstream areas of the Hanjiang River Basin (HJRB), the water quality in some areas has shown a declining trend, mainly due to the significant increase in industrial point source pollution and agricultural surface source pollution in upstream areas [29,30], which has led to the flow of untreated sewage into the HJRB. In addition, the fragmented management of different administrative regions has made it more challenging to control transboundary water pollution in the HJRB. The critical advantage of watershed ecological compensation is that it coordinates the interests of different governments through transfer payments to achieve the collaborative management of the water environment, solve transboundary water pollution, and ultimately ensure the sustainable use of water resources [31,32]. Therefore, how to improve the watershed ecological compensation system and encourage different governments to manage the water environment collaboratively have become complex problems for scholars.
Studying the behavior of upstream and downstream governments and their influencing factors is the key to improving the watershed ecological compensation system. The HJRB is divided into upstream and downstream areas. Generally, the economic condition of the downstream area is more developed than that of the upstream area. Downstream governments may have passed the stage of simply pursuing economic growth and can reach a more balanced state in economic development and environmental protection. However, since the start of the SNWDP, the environment of the downstream area of the HJRB has faced unforeseen risks, such as a sharp decrease in water quantity, a decrease in the self-purification capacity of the water body, a decrease in the carrying capacity of the waterway during the dry period, and a change in soil type and salinization [33], and has led to an increase in the cost of using water resources in downstream areas. Additionally, upstream areas, which are relatively less developed, may still regard economic development as their priority and thus tend to neglect the importance of environmental protection. The central government, as the coordinator, expects upstream governments to strengthen water environment management to provide cleaner water resources to the receiving area of the SNWDP [34]. However, water environment management requires a large amount of investment, and it is difficult to reap economic benefits through such management in the short term [35]. Accordingly, it is not easy to maintain water environment management without economic support. Therefore, watershed ecological compensation can be regarded as a long-term game process among the upstream, downstream, and central governments due to different conflicting interests [7].
This paper focuses on the evolution of upstream, downstream, and central governments’ decision-making behavior in watershed ecological compensation for cross-regional water diversion projects and examines the impact of opportunity costs on upstream government behavior within the HJRB.
The main research questions of this paper are as follows:
  • What is the difference in the evolution of the game between upstream and downstream governments before and after the introduction of the central government?
  • How do opportunity costs affect the decision-making behavior of upstream governments?
  • Is the current compensation rate from the central government to upstream governments in the HJRB reasonable?
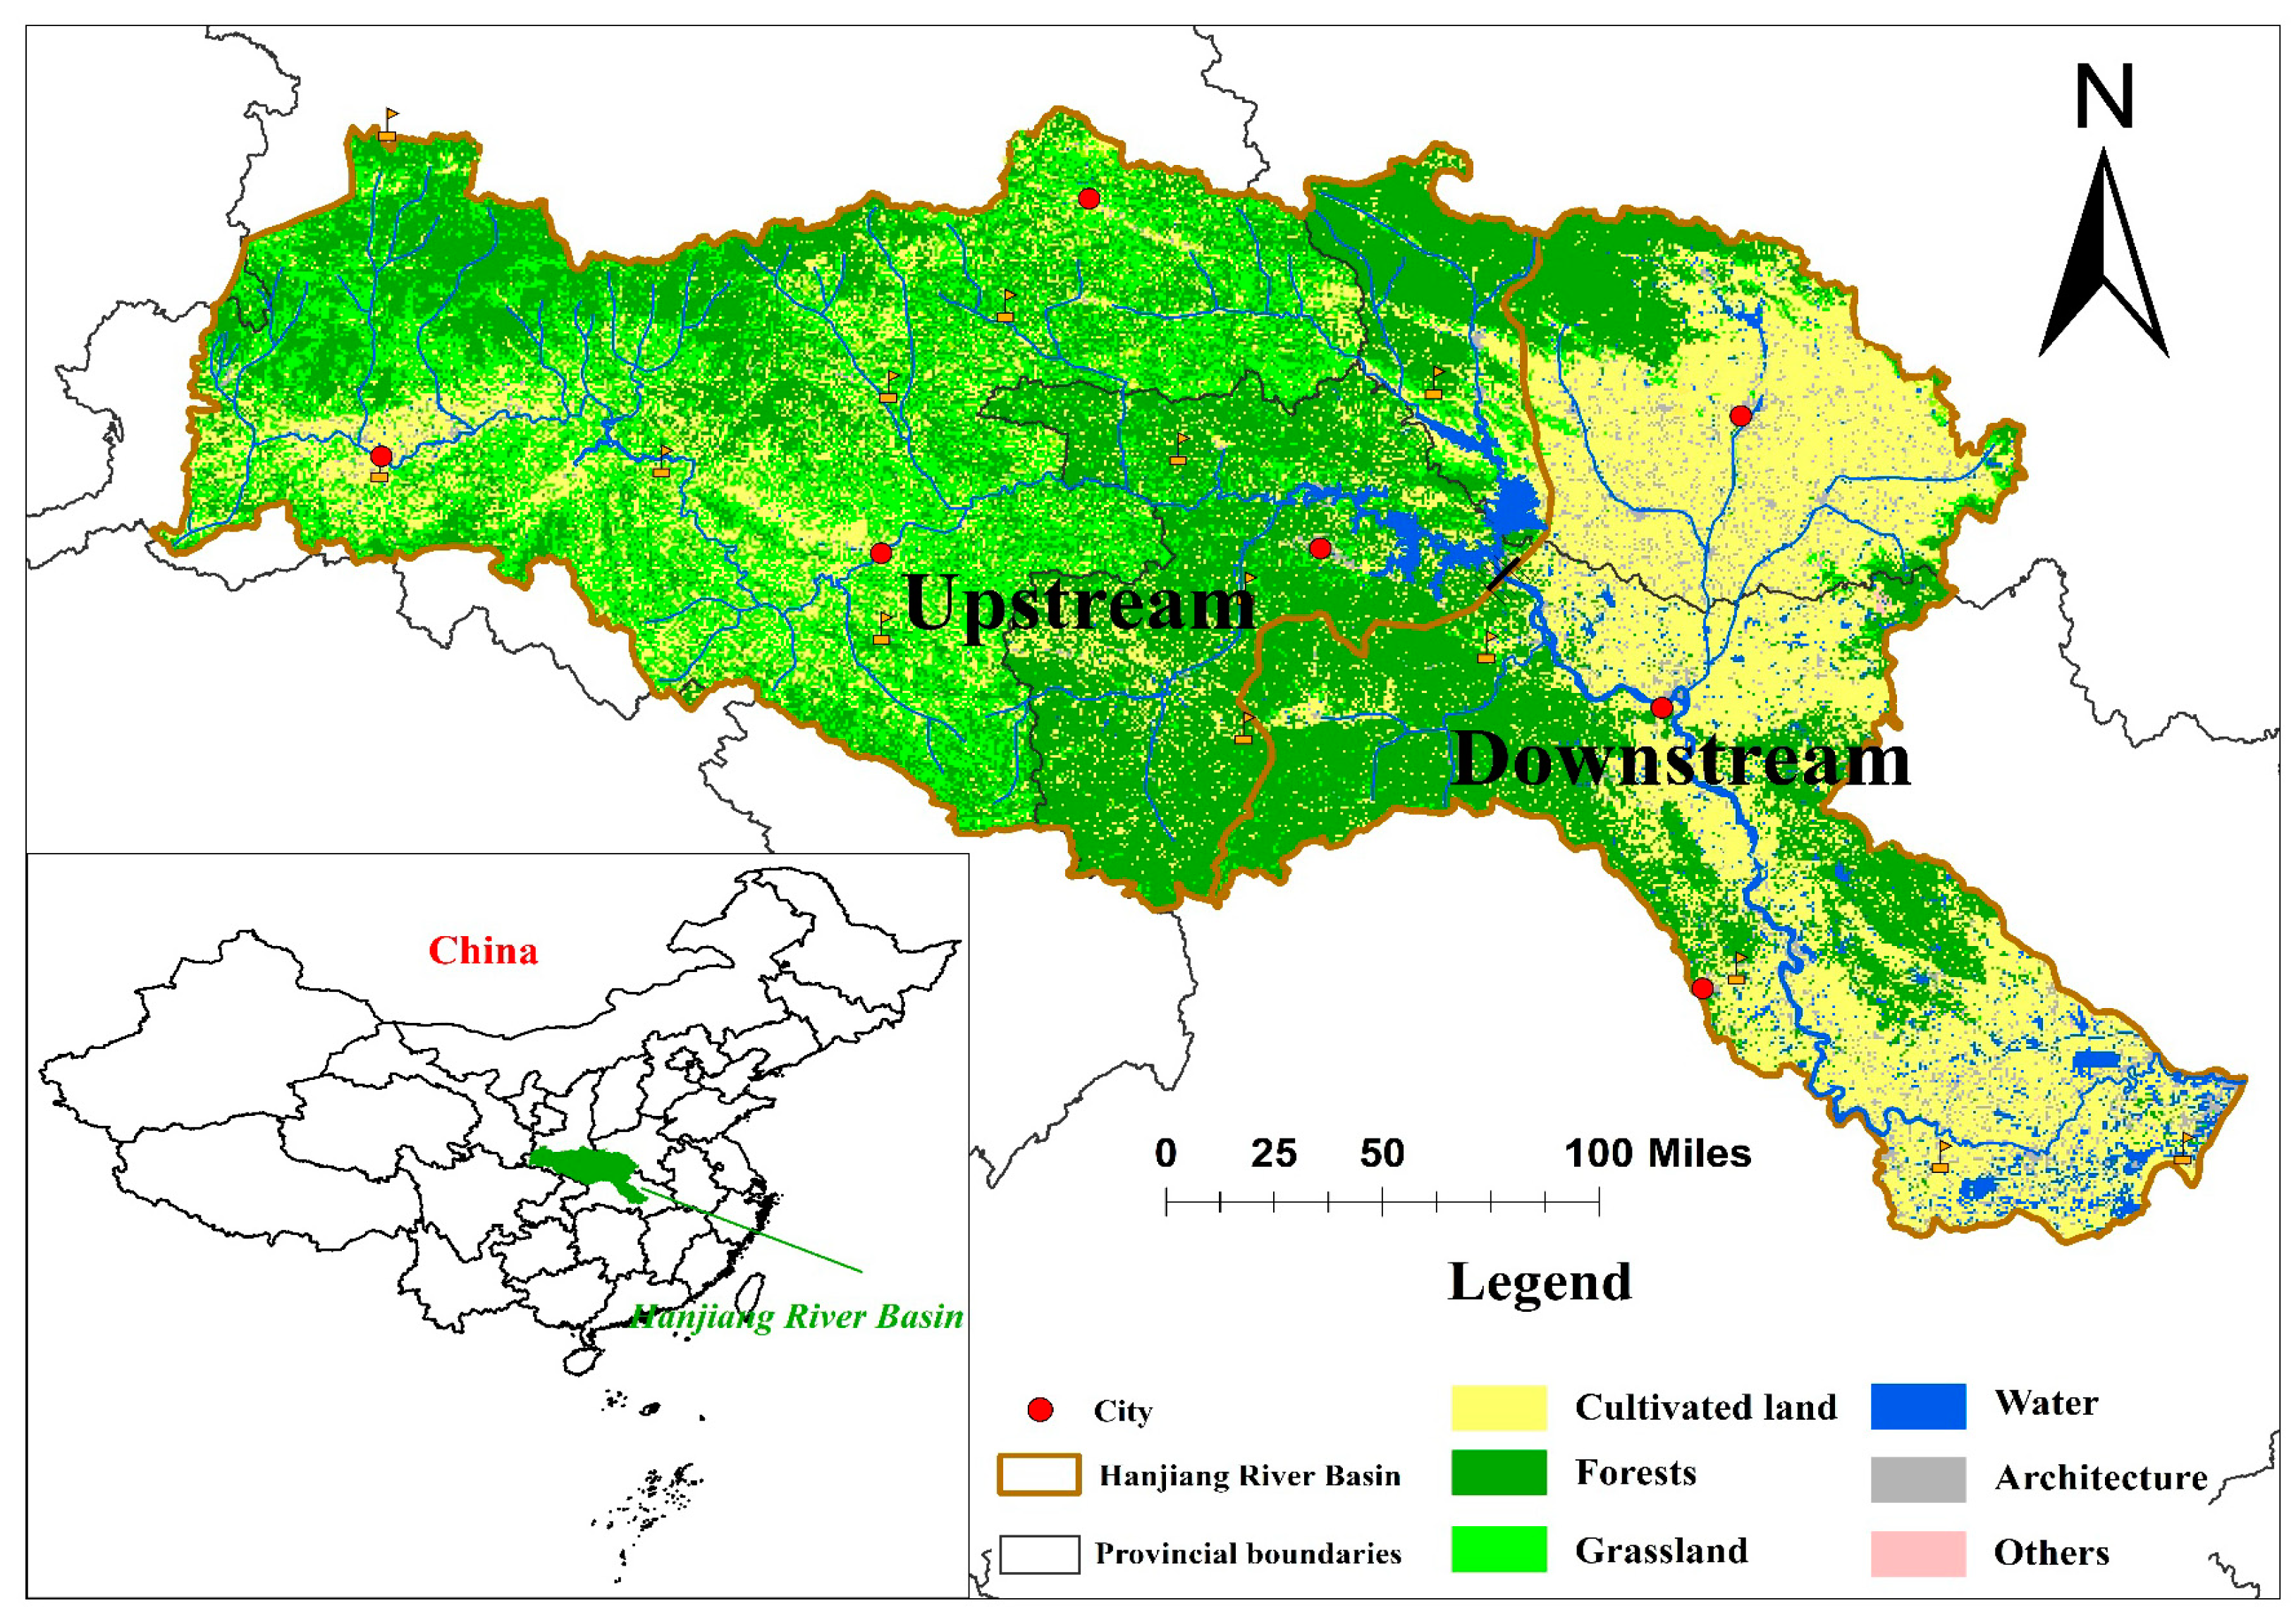
2. Case Overview

The SNWDP is currently the world’s largest water project benefiting the largest number of people and spanning the largest area. Addressing the uneven spatial distribution of water resources in China is an important initiative [36]. The HJRB is a strong backbone of the SNWDP. The Hanjiang River is 1577 km long and is an important bridge connecting the Yangtze River Economic Belt and the Silk Road Economic Belt. The middle and lower reaches of the Hanjiang River are an important ecological and economic corridor in Hubei Province [37,38]. The HJRB covers an area of approximately 159,000 square kilometers, involving 21 cities and 79 counties in a total of six provinces and cities in Hubei, Shaanxi, Henan, Sichuan, Chongqing, and Gansu. With the rapid population growth and economic development in the basin, much domestic sewage and industrial wastewater are discharged into the HJRB, thus seriously polluting the basin’s waters [39]. The Ministry of Ecology and Environment has set up more than 60 monitoring sections in the HJRB to evaluate the water environmental quality condition and conduct the dynamic monitoring of water pollution in key areas. The latest study concluded that the water bodies of the HJRB showed eutrophication, enrichment of nutrient salts such as N and P, and an overall increasing trend of heavy metal content, with Fe and Mn being the main pollutants [40,41,42].
As an important water source of the SNWDP, the water quality condition of the Hanjiang River directly affects the operation of the whole project. The Hanjiang River is the largest tributary of the Yangtze River [43,44]. Figure 1 shows that the HJRB is located in midwestern China, where the economy is relatively underdeveloped, arable land resources are relatively scarce, and mineral resources are abundant [45,46,47]. These areas have a strong desire to develop. However, overexploitation of resources can cause severe pollution of local water resources [48,49]. To ensure the delivery of high-quality water resources to the northern provinces, water sources must comply with stricter water quality standards. Nevertheless, it is difficult to balance economic development and environmental protection [50]. Water source areas have made great sacrifices for cross-regional water transfer projects. To solve the problem of relatively backward economic development of water source areas, the central government needs to compensate ecological compensation for water source areas to compensate for this imbalance of rights to achieve sustainable development of water source areas and thus promote coordinated regional development.
Clarifying the evolution of the decision-making behavior of upstream, downstream, and central governments in cross-regional water transfer projects is the key to the study of watershed ecological compensation. This study takes the HJRB as the case, combines the specific situation of the SNWDP, and uses realistic data to study the changes in the decision-making behavior of the upstream government as the main parties responsible for protecting water sources, which can not only provide data support for local watershed ecological compensation standardization but also provide case references for other watersheds in similar situations.

3. Theoretical Background

3.1. Static Game Theory

Game theory is a mathematical model for studying the behavior of stakeholders and their interactions [51]. Previous studies have mainly used static game theory to study the influencing factors of watershed ecological compensation [9]. A static game is one in which participants act simultaneously or, although participants do not choose at the same time, the latter participant does not know what strategy was chosen by the previous participant. Previous studies assumed that the upstream and downstream governments in the basin are completely rational and that the information obtained is perfectly symmetrical, constructing a static game model accordingly. One of the conclusions obtained is that upstream and downstream governments cannot spontaneously implement a watershed ecological compensation system [52]. This assumption is a simple idea. In practice, upstream and downstream governments do not always have symmetrical information [7]. Therefore, while the previous studies using static game theory provide some insights to improve watershed ecological compensation, they also have the following limitations: (1) the assumptions of static game theory are difficult to realize in reality, (2) static game theory cannot reflect the changes in upstream and downstream government behavior, (3) previous studies mainly focus on the game between the two sides—upstream and downstream governments—but rarely consider the central government as a factor; and (4) previous studies use mainly numerical simulation methods and rarely actual data.

3.2. Evolutionary Game Theory

Evolutionary game theory can compensate for the shortcomings of static game theory. The evolutionary game theory combines static game theory with evolutionary ideas. The evolutionary view comes from evolutionary biology, which considers the development of the biological world as a process of “mutation-genetics-selection” [53]. The evolutionary game theory proposes the “innovation-selection-diffusion” viewpoint on this basis and regards it as the primary mechanism of evolution [54]. In the process of multiple games, participants are not completely rational, the information obtained by them is not entirely symmetrical, and the deterministic replicated dynamic model is developed into a stochastic replicated dynamic model [55]. Participants change their decision-making dynamically through imitation and finally reach a stable state [56]. The advantage of the evolutionary game model is its ability to dynamically study the behavior change process of multiple bounded rational game subjects. The analytical framework of evolutionary game theory consists of the following three parts: the payoff matrix, replicated dynamic system, and evolutionary stabilization strategy.
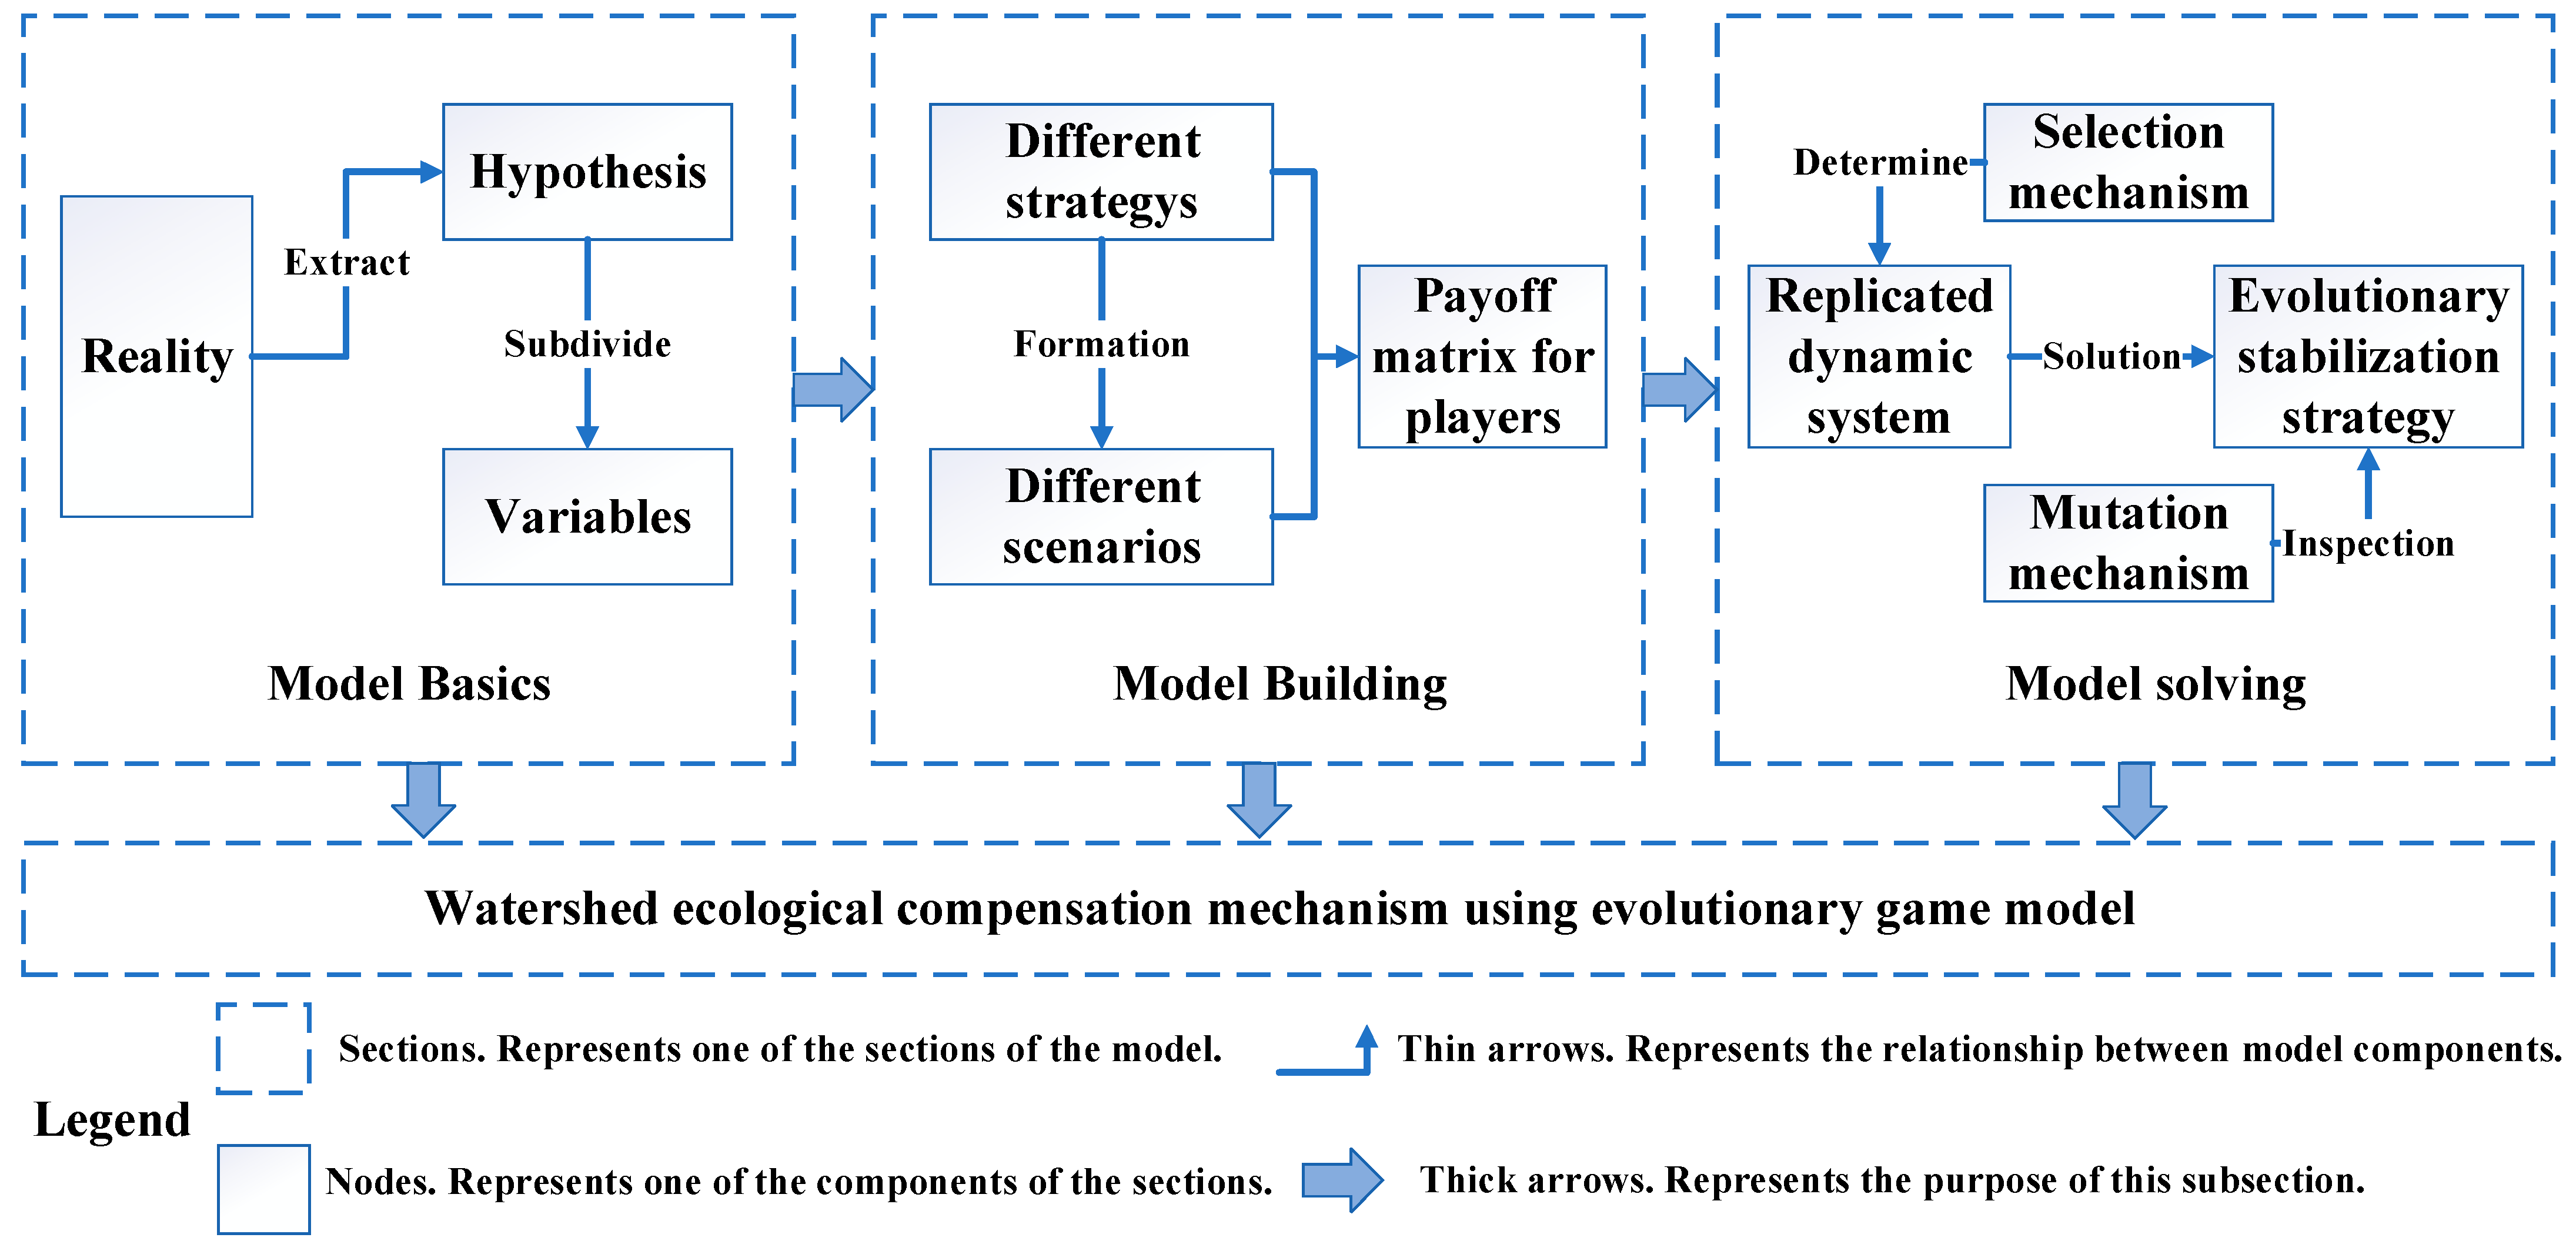
  • The payoff matrix: The payoff matrix is the basis of evolutionary game analysis. Different strategies of game subjects can form multiple strategy combinations, and the payoffs of different strategy combinations can be reflected in the form of a matrix [57].
  • The replicated dynamic system: The replicated dynamic system maps the relationship between the behavior of game subjects and fitness, which is the core concept of evolutionary biology and can be understood as the growth of the number of individuals who choose a certain strategy after the game [58].
  • The evolutionary stabilization strategy: When the evolutionary game model reaches a stable state, the strategic combination of all game participants is referred to as the evolutionary stabilization strategy, which reflects the equilibrium concept of evolutionary game theory [59]. Watershed ecological compensation is a complex and dynamic process. Therefore, it is more reasonable to analyze this process by using evolutionary game theory.
In the ecological compensation process of the SNWDP, there are three stakeholders in the game: upstream, downstream, and central governments [9]. To coordinate the smooth operation of this cross-regional water diversion project, the central government is responsible for promoting, coordinating, and supervising the upstream and downstream governments to protect the water environment. However, the central government needs to pay massive amounts of money to local governments for watershed ecological compensation through fiscal transfers every year, which puts tremendous pressure on the central government’s finances. The upstream area of the HJRB is the water source area of the SNWDP. Upstream governments pay a considerable price to ensure the long-term stable supply of clean water resources, which inevitably affects local economic development. To encourage upstream governments to actively protect the water environment, it is necessary to financially compensate them. Moreover, the implementation of the SNWDP has led to the continuous deterioration of water resource utilization in downstream areas, and the ecological environment along the river downstream can thus undergo unpredictable changes. As a victim of the water transfer project, downstream governments consider it a right to enjoy high-quality water resources. It is the responsibility of upstream and central governments to protect the water environment, and compensating upstream governments may increase the financial burden. It can be concluded that there is a game between the central government and upstream and downstream governments in terms of the ecological compensation of the cross-regional water diversion project. The different interests of different governments make it difficult to determine the optimal strategy in a single game, and these governments continuously adjust their strategies in successive games to eventually reach equilibrium. Therefore, evolutionary game theory is well suited for the study of the influencing factors of watershed ecological compensation.

4. Methodology

4.1. Scenarios

China’s environmental protection law clearly states that local governments are responsible for protecting the water environment within their jurisdictions [26]. Moreover, as the superior to local governments, the central government can regulate them. Thus, only governments at different levels can participate in the game and become stakeholders of watershed ecological compensation. In the SNWDP, the upstream area is the water source area and the downstream area is the impact area. The central government maintains the operation of the cross-regional water diversion project on behalf of the receiving area through financial transfers and administrative orders. Based on this, the following scenarios are set in this paper:
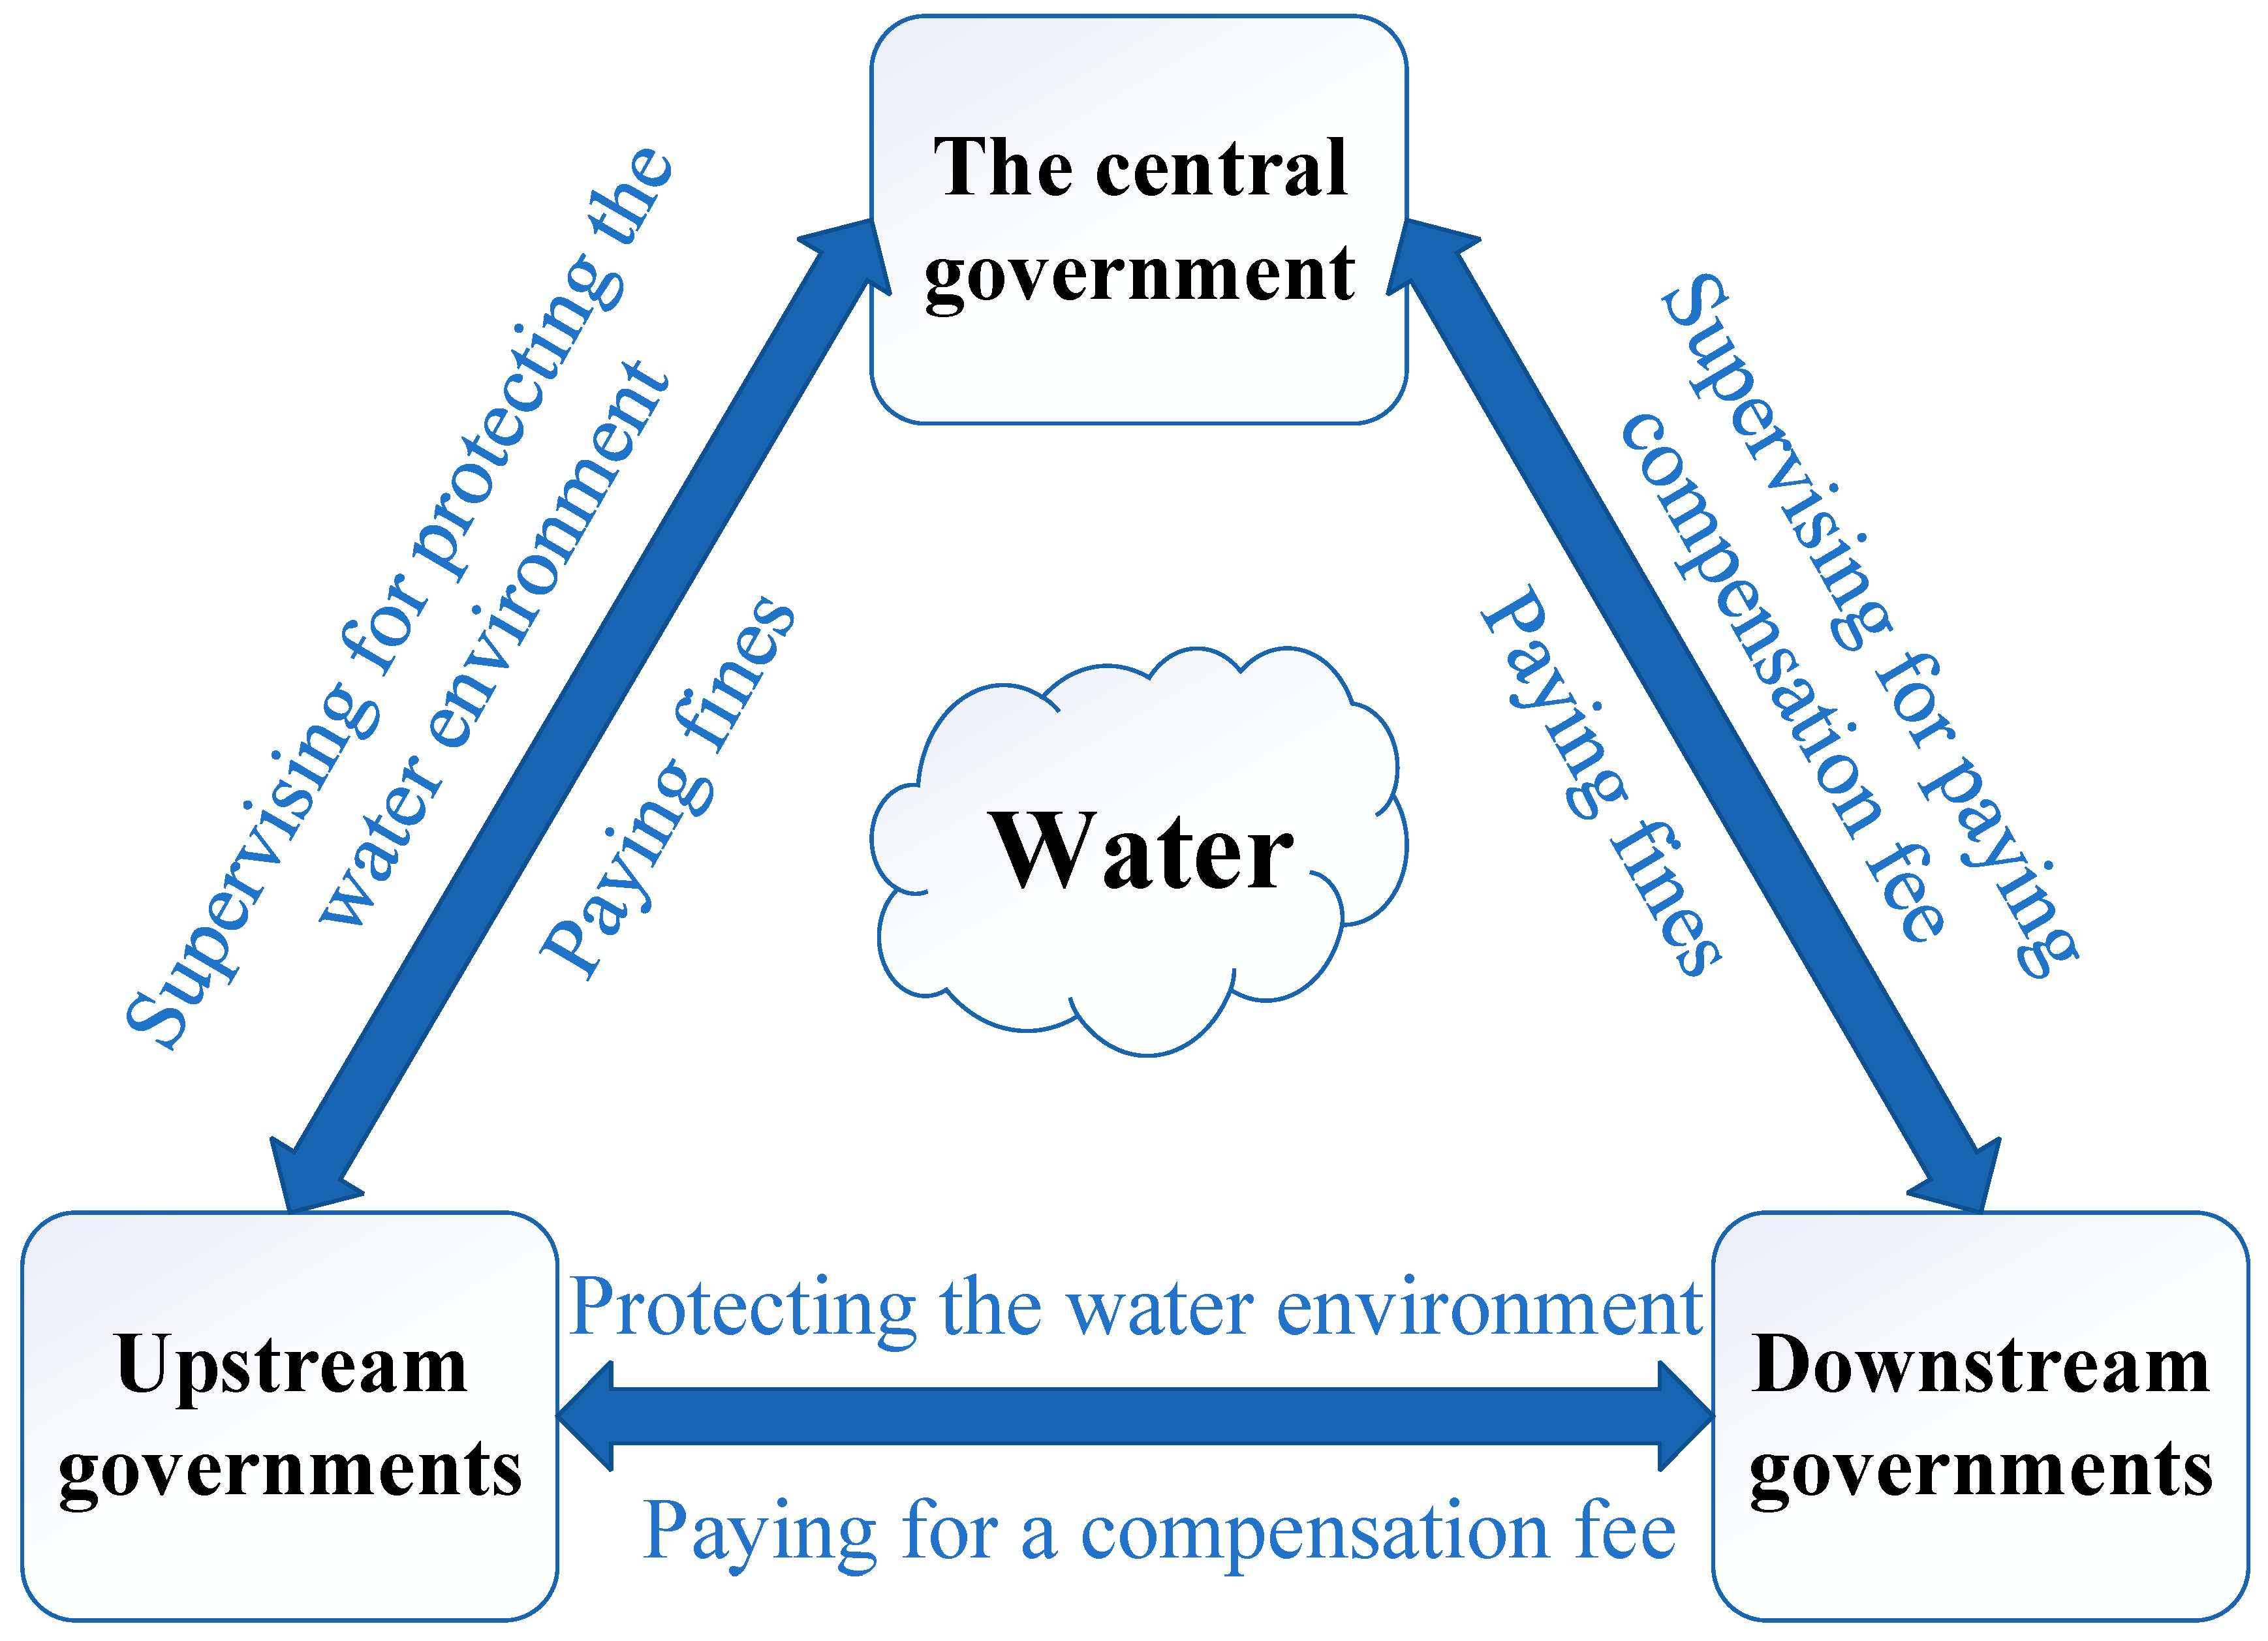
  • Upstream governments: The water quality upstream of the basin is better than that downstream, and the degradation of ecosystem services caused by the deterioration of the water environment has less of an impact on economic and social development in the upstream area. In addition, because the effectiveness of water environment management is difficult to see immediately, upstream governments, as the main management party, may choose to pollute the water environment in exchange for economic development and lower their priority for environmental protection. However, the upstream area is also the water source of the cross-regional water diversion project and faces intense pressure from the receiving area for high-quality water resources.
  • Downstream governments: Due to the implementation of the cross-regional water diversion project, the water environment in the downstream area is becoming increasingly severe. The quality of life of people in the downstream area is closely related to the water environment, so downstream governments have a more urgent need to improve the water environment than upstream governments. Constrained by the horizontal compensation mechanism upstream and downstream of the basin, downstream governments compensate upstream governments to encourage them to protect the water environment. Reciprocally, when upstream governments’ environmental governance policies are ineffective, downstream governments refuse to compensate them, resulting in a lack of funds for upstream governments’ treatment. The whole watershed ecological compensation system can thus fall into a prisoner’s dilemma.
  • The central government: To ensure the sustainability of the cross-regional water diversion project and to provide clean water to the receiving area, the central government actively promotes the implementation of watershed management by upstream governments. To ease the burden on the central government, it encourages local governments in the basin to establish a horizontal compensation system, as the outcome of the basin’s ecological management depends on the level of investment in water protection by the local governments in the basin. In this system, the central government has the authority to monitor upstream governments to protect the water environment and requires downstream governments to compensate upstream governments. The central government emphasizes that environmental protection is a prerequisite for economic development and is the optimal strategy expected by the public. The central government resorts to financial and administrative penalties to induce upstream and downstream governments to cooperate to meet this public expectation.
Figure 2 describes the relationships among upstream, downstream, and central governments in watershed ecological compensation.

4.2. Hypothesis

The scenario setting of the evolutionary game in this paper contains three main stakeholders: upstream, downstream, and central governments. To analyze the problem of watershed ecological compensation in a cross-regional water diversion project, this paper proposes the following hypotheses:
  • H1: The rights and obligations of upstream and downstream governments are not exactly equal. They have the same power to use water resources, and the central government can supervise them.
  • H2: Upstream, downstream, and central governments want to maximize their interests in the game process.
  • H3: Upstream, downstream, and central governments have two alternative strategies for each player. Table 1 lists the specific strategy contents, and Figure 3 shows the decision tree of stakeholder subjects.
  • H4: Upstream, downstream, and central governments are bounded rational, which means that they cannot determine the optimal strategy at one time. Nevertheless, they can continuously adjust their strategies in continuous games and ultimately achieve the optimal strategy.

4.3. Variables

There are several variables in the game of upstream, downstream, and central governments. All of the variables are positive and are defined as follows:
  • C1: Costs incurred by upstream governments in protecting the water environment.
  • C2: Costs incurred by downstream governments in compensating.
  • A1: The ecological benefits of upstream governments when they protect the water environment and downstream governments compensate them.
  • A2: Ecological benefits of downstream governments when upstream governments protect the water environment and downstream governments compensate them.
  • B1: Ecological benefits of upstream governments when upstream governments protect the water environment, but downstream governments do not compensate them.
  • D2: Ecological benefits of downstream governments when upstream governments protect the water environment, but downstream governments do not compensate them.
  • D1: Ecological benefits of upstream governments when downstream governments pay a compensation fee, but upstream governments do not protect the water environment.
  • B2: Ecological benefits of downstream governments when they compensate but upstream governments do not protect the water environment.
  • S1: To promote collaboration between upstream and downstream governments, the central government financially compensates upstream governments.
  • S2: To promote collaboration between upstream and downstream governments, the central government financially compensates downstream governments.
  • F1: The central government penalizes upstream governments when upstream and downstream governments fail to adopt proper watershed protection policies.
  • F2: The central government penalizes downstream governments when upstream and upstream governments fail to adopt proper watershed protection policies.
If neither upstream nor downstream governments take any action, then the ecological benefit for both parties is 0.

4.4. Research Design

Figure 4 illustrates the research design of this study. First, this study abstracts several hypotheses from realistic watershed environmental problems and decomposes them into specific variables. Second, different players have different behavioral strategies, dividing the game model into different contexts and forming different payoff matrices. Finally, the whole evolutionary process follows a selection mechanism, which determines the replicated dynamic equation by the payoff matrix and finds the contained solution, and a variation mechanism, which is used to test whether the evolutionary equilibrium is stable, i.e., to verify whether the solution found by the replicated dynamic system is an evolutionary stabilization strategy.

5. Model Building

5.1. Evolutionary Game Model of Watershed Ecological Compensation with Non-Supervision of the Central Government

The central government can choose two alternative strategies—supervision and non-supervision—dividing the tripartite game into two different scenarios. The first scenario is without supervision. If X indicates the probability that upstream governments will protect the water environment, then 1–X indicates the probability of them not protecting the environment. Similarly, if Y indicates the probability that downstream governments will compensate, then 1–Y indicates the probability of them not compensating. Table 2 shows the payoff matrix for both players under different strategies with the non-supervision of the central government.
The variables π u 1 and π u 2 represent the ecological benefits when upstream governments choose the protecting and not protecting strategies, respectively. Variable π u ¯ represents the average ecological benefits of upstream governments. Therefore,
π u 1 = Y × A 1 C 1 + ( 1 Y ) × ( B 1 C 1 )
π u 2 = Y × D 1
π u ¯ = X × π u 1 ( 1 X ) × π u 2
According to Equations (1) and (2), the replicated dynamic equation of upstream governments can be calculated as follows:
F u ( x ) = d x d t = X × ( 1 X ) × ( π u 1 π u 2 ) = X × ( 1 X ) × ( B 1 C 1 ) + Y × ( A 1 B 1 D 1 )
Similarly, the variables π d 1 , π d 2 and π d ¯ represent the ecological benefits of paying, not paying, and the average ecological benefits of downstream governments, respectively.
π d 1 = X × A 2 C 2 + ( 1 X ) × ( B 2 C 2 )
π d 2 = X × D 2
π d ¯ = Y × π d 1 ( 1 Y ) × π d 2
According to Equations (5) and (6), the replicated dynamic equation of downstream governments can be calculated as follows:
F d ( y ) = d x d t = Y × ( 1 Y ) × ( π d 1 π d 2 ) = Y × ( 1 Y ) × ( B 2 C 2 ) + X × ( A 2 B 2 D 2 )
Equations (4) and (8) constitute the dynamic game system. According to the basic hypotheses of H2, H3, and H4, upstream and downstream governments are not completely rational but have limited rationality, which means that they cannot simultaneously find the optimal strategy in a single game, changing their strategies over time. Therefore, they change their own strategies over time until they achieve a stable state, which is called the evolutionary stable strategy (ESS). The stable state of the replication dynamic equation is affected by the initial willingness to cooperate between upstream and downstream governments. To find the stable strategy condition for the evolutionary game model, let F u ( x ) = 0 and F d ( y ) = 0 . Therefore,
F u ( x ) = d x d t = X × ( 1 X ) × ( π u 1 π u 2 ) = X × ( 1 X ) × ( B 1 C 1 ) + Y × ( A 1 B 1 D 1 ) = 0
F d ( y ) = d x d t = Y × ( 1 Y ) × ( π d 1 π d 2 ) = Y × ( 1 Y ) × ( B 2 C 2 ) + X × ( A 2 B 2 D 2 ) = 0
We obtain five equilibrium points, namely, M1 (0, 0), M2 (1, 0), M3 (1, 1), M4 (0, 1), and M5 (X*, Y*) = C 2 B 2 A 2 B 2 D 2 , C 1 B 1 A 1 B 1 D 1 , by solving differential equations in dynamic systems. These five points constitute the boundary of the solution of the dynamic evolution system and form the space of the solution. By calculating the replicated dynamic evolution system, the Jacobian matrix J is obtained as follows:
J = F u ( x ) X   F u ( x ) Y F d ( y ) X   F d ( y ) Y = ( 1 2 X ) × ( B 1 C 1 ) + Y ( A 1 B 1 D 1 ) X ( 1 X ) × ( A 1 B 1 D 1 ) Y ( 1 Y ) × ( A 2 B 2 D 2 ) ( 1 2 Y ) × ( B 2 C 2 ) + X ( A 2 B 2 D 2 )
The determinant of matrix J is as follows:
det ( J ) = F u ( x ) X × F d ( y ) Y F u ( x ) Y × F d ( y ) X = ( 1 2 X ) × ( B 1 C 1 ) + Y ( A 1 B 1 D 1 ) × ( 1 2 Y ) × ( B 2 C 2 ) + X ( A 2 B 2 D 2 ) X ( 1 X ) × ( A 1 B 1 D 1 ) × Y ( 1 Y ) × ( A 2 B 2 D 2 )
and its trace is as follows:
t r ( J ) = F u ( x ) X + F d ( y ) Y = ( 1 2 X ) × ( B 1 C 1 ) + Y ( A 1 B 1 D 1 ) +   ( 1 2 Y ) × ( B 2 C 2 ) + X ( A 2 B 2 D 2 )
In the above equations, X and Y are the probabilities of upstream and downstream governments choosing different strategies, respectively, so it can be that 0 X 1 , and 0 Y 1 . Following this notion, it is clear that 0 X = C 2 B 2 A 2 B 2 D 2 1 and 0 Y = C 1 B 1 A 1 B 1 D 1 1 . When A 1 C 1 D 1 , upstream governments gain more ecological benefits from choosing to protect the water environment, so they take the initiative to adopt a protection strategy. Likewise, when A 2 C 2 D 2 , downstream governments gain more ecological benefits from choosing to compensate, so they take the initiative to adopt a payment strategy.
Based on the above analysis, calculations are performed for M1, M2, M3, M4, and M5. Table 3 demonstrates the determinants, traces, and stability of these five equilibria.
In Table 3, M1 (0, 0) and M3 (1, 1) are two equilibrium points with stable states, which represent the strategies of “not protecting, not compensating” and “protecting, compensating”, respectively. Figure 5 shows the phase diagram of the evolution of upstream and downstream governments’ decision-making behavior without supervision by the central government. Line M4M2 divides region M1M2M3M4 into two regions, where region M1M2M4 represents upstream and downstream governments choosing the strategies of not protecting or not compensating. Region M2M3M4 represents governments choosing the strategies of protecting and compensating.
Case 1: When the initial behaviors of upstream and downstream governments are in the state of protecting and compensating (i.e., the initial cooperation probability is within region M2M3M4), they gradually prefer the positive strategy, and the behaviors of both players converge to point M3 (1, 1), which is the ideal state of the watershed ecological compensation system. In this scenario, upstream governments’ strategy choice dominates. However, in reality, upstream governments may be less proactive in choosing a strategy to protect the water environment for economic purposes when there is no constraint regarding the central government.
Case 2: The treatment cost of watershed environmental protection increases with time, and the ecological benefits are difficult to realize immediately. When the initial behavior of upstream and downstream governments is in the state of not protecting and not compensating (i.e., the initial cooperation probability is within region M1M2M4), they gradually prefer a negative strategy, and the behavior of both players converges to point M1 (0, 0).
From the coordinates ( C 2 B 2 A 2 B 2 D 2 , C 1 B 1 A 1 B 1 D 1 ) of the saddle point, the probability of an evolutionary stabilization strategy is influenced by the difference between the governance costs C1 and C2 of the upstream and downstream governments and the ecological benefits A1D1 and A2D2 before and after governance, respectively. The direction of the saddle point’s movement determines the area of regions M2M3M4 and M1M2M4, which affects the initial willingness to cooperate between upstream and downstream governments. The initial willingness to cooperate between these two sides of the game can influence their final decisions, and the probability of convergence of their behavioral decisions to point M1 (0, 0) is greater when the area of region M1M2M4 is larger. Similarly, when the area of region M2M3M4 is larger, the probability that both behavioral decisions converge to point M3 (1, 1) is higher. The direction of movement of saddle point M5 depends on the cost and ecological benefits of water environment management. However, it is difficult for basin governments to invest much money to seek a consensus on collaborative water environment management.
In summary, it is difficult for upstream and downstream governments to spontaneously reach a stable state without the supervision of the central government. In other words, it may take several evolutionary iterations and consume more time for upstream and downstream governments to reach a stable state, and thus, the public value of the watershed cannot be efficiently realized.

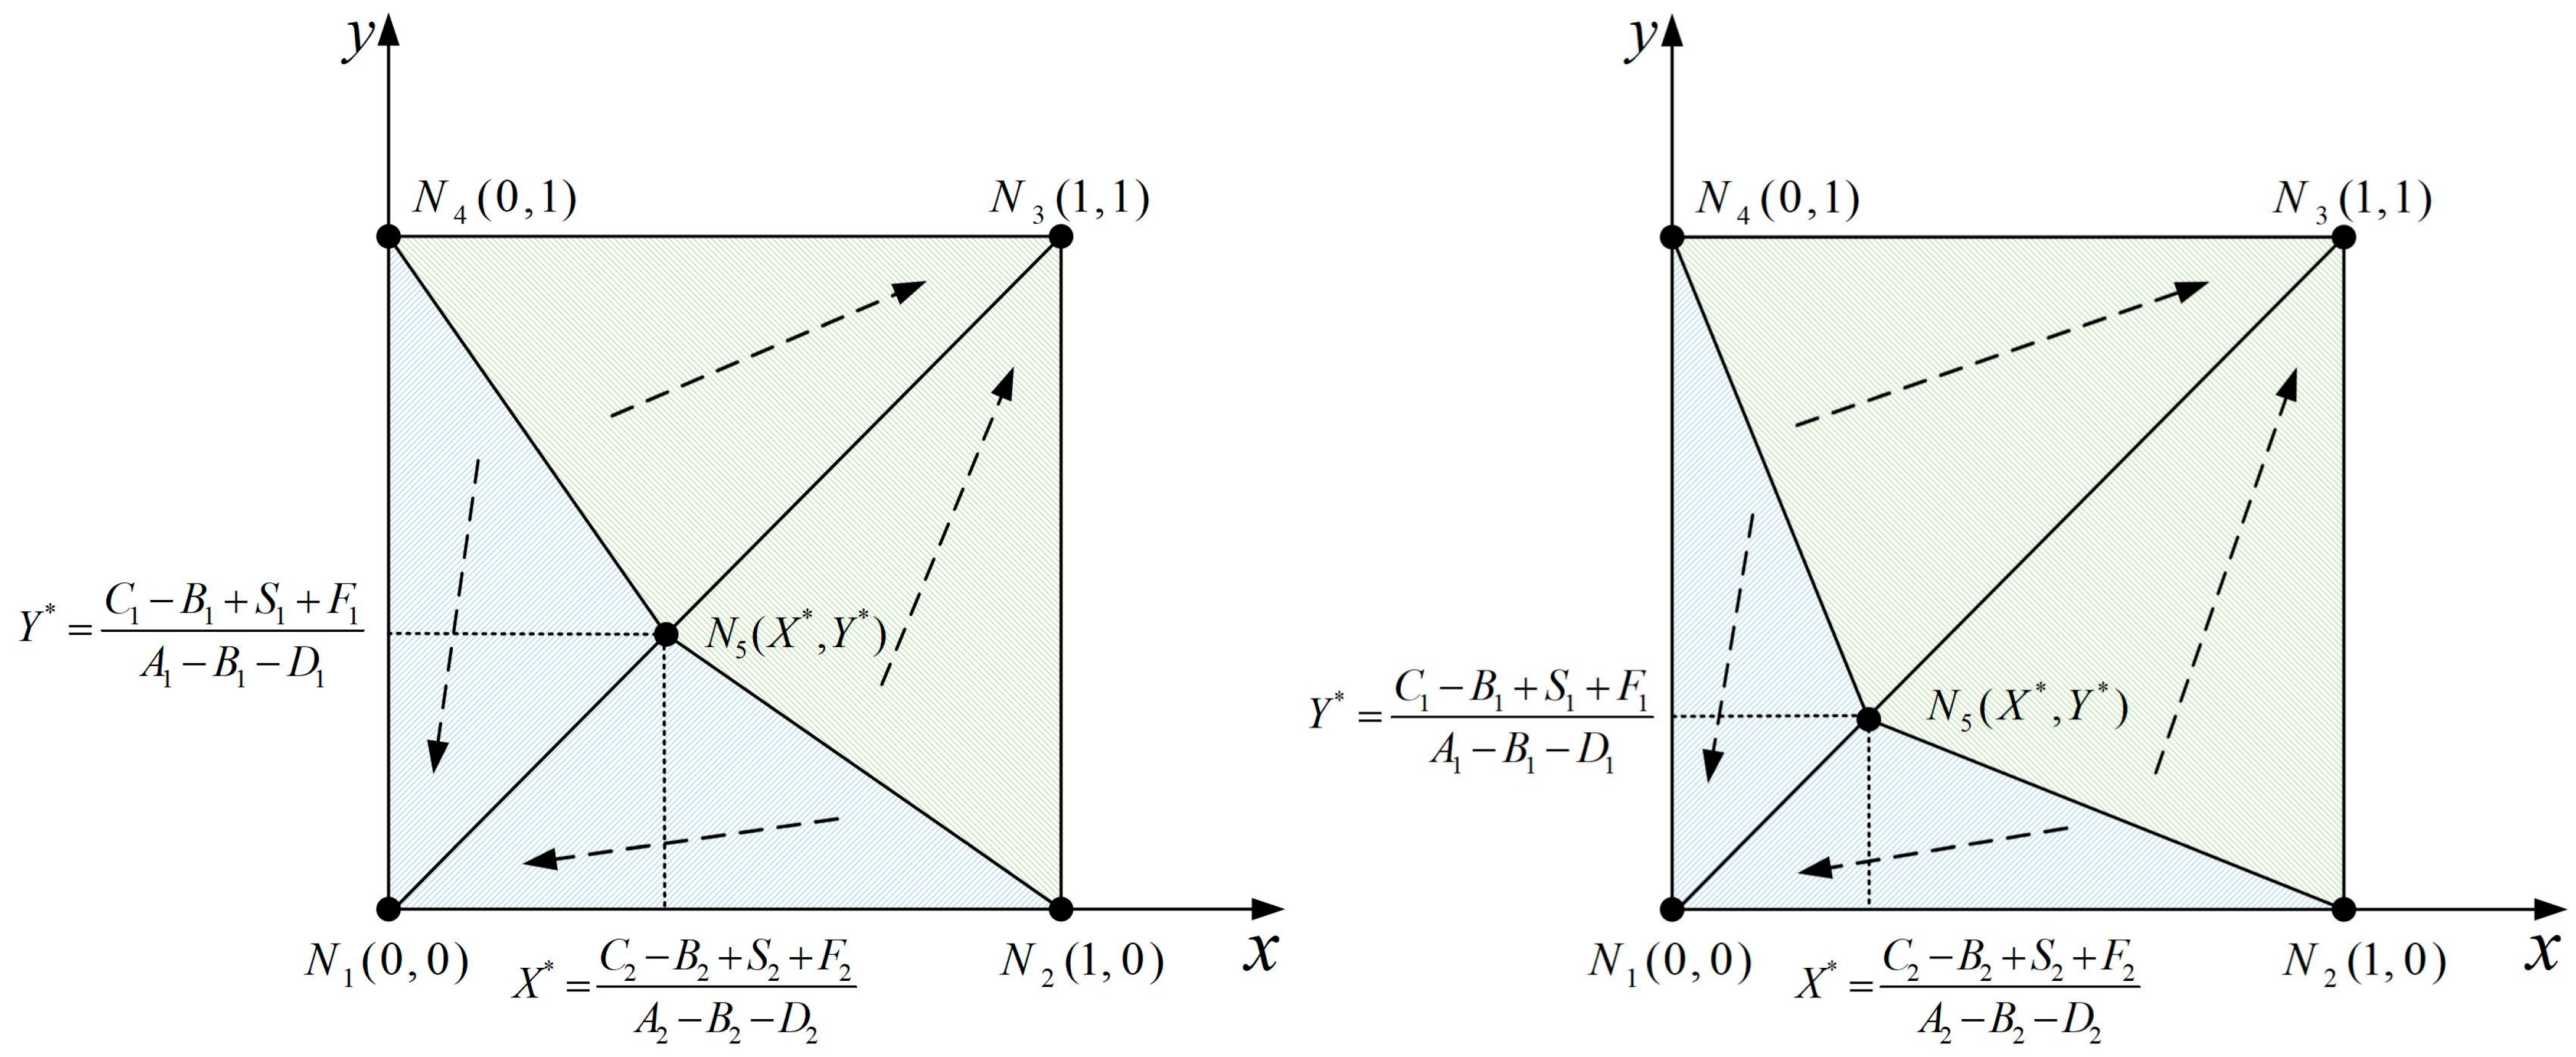
5.2. Evolutionary Game Model of Watershed Ecological Compensation with the Supervision of the Central Government

The central government is the author of watershed protection policies and cross-regional water diversion projects. The strategy of protecting and compensating is the most expected upstream and downstream government cooperation model by the central government. The central government regulates upstream and downstream governments through both compensation and punishment. To provide clean water to the receiving area on a sustainable basis, the central government provides a certain amount of financial compensation to facilitate cooperation between upstream and downstream governments in watershed management, denoted as variables S1 and S2, respectively. Conversely, when upstream and downstream governments fail to adopt appropriate watershed protection policies, the central government imposes appropriate penalties, denoted as variables F1 and F2, respectively. Table 4 shows the payoff matrix for both players under different strategies with the supervision of the central government; the other variables in the payoff matrix remain unchanged.
The second scenario is that with the supervision of the central government. Similar to Section 5.1 of this paper, π u 3 and π u 4 represent the ecological benefits when the upstream governments choose the strategy of protecting and not protecting, respectively. π u ¯ represents the average ecological benefits of upstream governments. Then, the replicated dynamic equation of upstream governments can be calculated as in Equation (17).
π u 3 = Y × ( A 1 C 1 + S 1 ) + ( 1 Y ) × ( B 1 C 1 + S 1 )
π u 4 = Y × D 1 F 1
π u ¯ = X × π u 3 ( 1 X ) × π u 4
F u ( x ) = d x d t = X × ( 1 X ) × ( π u 3 π u 4 ) = X × ( 1 X ) × ( B 1 C 1 + S 1 + F 1 ) + Y × ( A 1 B 1 D 1 )
Similarly, π d 3 , π d 4 , π d ¯ and F d ( y ) represent the ecological benefits of paying, not paying, the average ecological benefits, and the replicated dynamic equation of the downstream governments, respectively.
π d 3 = X × ( A 2 C 2 + S 2 ) + ( 1 X ) × ( B 2 C 2 + S 2 )
π d 4 = X × D 2 F 2
π d ¯ = Y × π d 3 ( 1 Y ) × π d 4
F d ( y ) = d x d t = Y × ( 1 Y ) × ( π d 3 π d 4 ) = Y × ( 1 Y ) × ( B 2 C 2 + S 2 + F 2 ) + X × ( A 2 B 2 D 2 )
Equations (17) and (21) construct a new tripartite game model of upstream, downstream, and central governments. Let F u ( x ) = 0 and F d ( y ) = 0 , and five equilibria were obtained by solving this model, namely, N1 (0, 0), N2 (1, 0), N3 (1, 1), N4 (0, 1), and N5 (X*, Y*) = C 2 B 2 + S 2 + F 2 A 2 B 2 D 2 , C 1 B 1 + S 1 + F 1 A 1 B 1 D 1 . By calculating the replicated dynamic evolution system, the new Jacobian matrix J is obtained as follows:
J = F u ( x ) X   F u ( x ) Y F d ( y ) X   F d ( y ) Y = ( 1 2 X ) × ( B 1 C 1 + S 1 + F 1 ) + Y ( A 1 B 1 D 1 ) X ( 1 X ) × ( A 1 B 1 D 1 ) Y ( 1 Y ) × ( A 2 B 2 D 2 ) ( 1 2 Y ) × ( B 2 C 2 + S 2 + F 2 ) + X ( A 2 B 2 D 2 )
The determinant of the new matrix J is as follows:
det ( J ) = F u ( x ) X × F d ( y ) Y F u ( x ) Y × F d ( y ) X = ( 1 2 X ) × ( B 1 C 1 + S 1 + F 1 ) + Y ( A 1 B 1 D 1 ) × ( 1 2 Y ) × ( B 2 C 2 + S 2 + F 2 ) + X ( A 2 B 2 D 2 ) X ( 1 X ) × ( A 1 B 1 D 1 ) × Y ( 1 Y ) × ( A 2 B 2 D 2 )
and its trace is as follows:
t r ( J ) = F u ( x ) X + F d ( y ) Y = ( 1 2 X ) × ( B 1 C 1 + S 1 + F 1 ) + Y ( A 1 B 1 D 1 ) +   ( 1 2 Y ) × ( B 2 C 2 + S 2 + F 2 ) + X ( A 2 B 2 D 2 )
Calculations are performed for N1 (0, 0), N2 (1, 0), N3 (1, 1), N4 (0, 1), and N5 (X*, Y*). Table 5 demonstrates the determinants, traces, and stability of these five equilibria.
Since 0 X 1 and 0 Y 1 , it can be seen that after the introduction of central government regulation, the game state of governments has two cases, C 2 B 2 + S 2 + F 2 < 0 and C 2 B 2 + S 2 + F 2 > 0 . Figure 6 shows the phase diagram of the evolution of upstream and downstream governments’ decision-making behavior with the supervision of the central government.
Case 3: When C 2 B 2 + S 2 + F 2 < 0 , it is known that A 2 C 2 + S 2 > ( B 2 C 2 + S 2 ) , i.e., the central government’s penalty to upstream governments is higher than the cost of treatment. To avoid being penalized, upstream governments choose to protect the water environment strategy. Similarly, downstream governments choose a compensation strategy. At this point, the game state has a higher probability of convergence to point N3 (1, 1), and the evolutionary game model achieves the ideal state of protecting and compensating.
Case 4: When C 2 B 2 + S 2 + F 2 > 0 , because of the introduction of variables S and F, point X* moves to the left, point Y* moves down, and the saddle point moves with it. At this point, upstream and downstream governments gradually agree to the active watershed management policy because of the expected increase in ecological benefits, and the game state has a higher probability of converging to point N3 (1, 1). This equilibrium point represents the ideal state—the protecting and compensating strategy.
As seen in Figure 6 and Table 5, point N3 (1, 1) is the only equilibrium point with a stable state and indicates that upstream governments protect the water environment and that downstream governments compensate. Under central government regulation, the relationship between stakeholders is more complicated. When upstream governments are not effective in managing the water environment, the central government punishes them, which positively affects the promotion of upstream governments to manage the water environment while simultaneously increasing the confidence of downstream governments. The central government’s regulatory policy can effectively synergize cooperation between upstream and downstream governments. Moreover, compensation and punishment strategies can form a virtuous cycle of the river basin ecological compensation game. Economic compensation and administrative punishment are important tools with which the central government can regulate upstream and downstream governments, and the amount of compensation is the critical value that affects the evolutionary game model and is the basis for designing the watershed ecological compensation system. Therefore, when it is difficult to achieve a cooperative state through the spontaneous behavior of upstream and downstream governments alone, it is imperative to introduce central government regulation, which can effectively shorten the time needed for the game model to reach a stable state.
Compensation can influence the strategic choices of upstream and downstream governments and directly impact the effectiveness of environmental management in the basin. How to determine a reasonable compensation amount is crucial, which is further discussed in the following section using the HJRB, where the water source of the SNWDP is located, as a case study.

6. Model Testing

6.1. The Reality of Ecological Compensation in the HJRB

In response to the water pollution status of the HJRB, in March 2018, Hanzhong city, Shaanxi Province, used water quality indicators as the basis for assessment and penalized counties that failed by withholding ecological compensation funds [60]. The implementation of the watershed ecological compensation system, using economic rewards and punishments, not only stimulates the basin environment in good areas to continue to increase investment but can also force relatively poor water environment areas to improve their protection strategies. Upstream and downstream governments jointly manage the water environment, expecting the water quality of the HJRB to be significantly improved.
To reconcile the contradiction between water environmental protection and economic development in the upstream area of the HJRB, since 2008, the central government has been practicing ecological compensation for the water sources of the Hanjiang River, with annual compensation rates of 870 million CNY (137.11 million USD. Exchange Rates: 1 USD ≈ 6.35 CNY, similarly hereinafter) in Hanzhong city, 770 million CNY (121.35 million USD) in Ankang city, 520 million CNY (81.95 million USD) in Shangluo city, 680 million CNY (107.17 million USD) in Nanyang city, and 750 million CNY (118.20 million USD) in Shiyan city [61]. In December 2016, the Ministry of Finance encouraged upstream and downstream governments to establish horizontal ecological compensation mechanisms and financially compensate provinces with outstanding results in watershed protection [62]. The HJRB belongs to the capital compensation scope of the Yangtze River Economic Belt. From 2018 to 2020, the central government paid compensation funds, totaling 18 billion CNY (2.84 billion USD), to 11 provinces (cities) in the Yangtze River Economic Belt [63].
Is the amount of this compensation reasonable? Has this compensation had a positive effect on the water protection efforts of upstream governments? These are important questions that deserve to be studied.

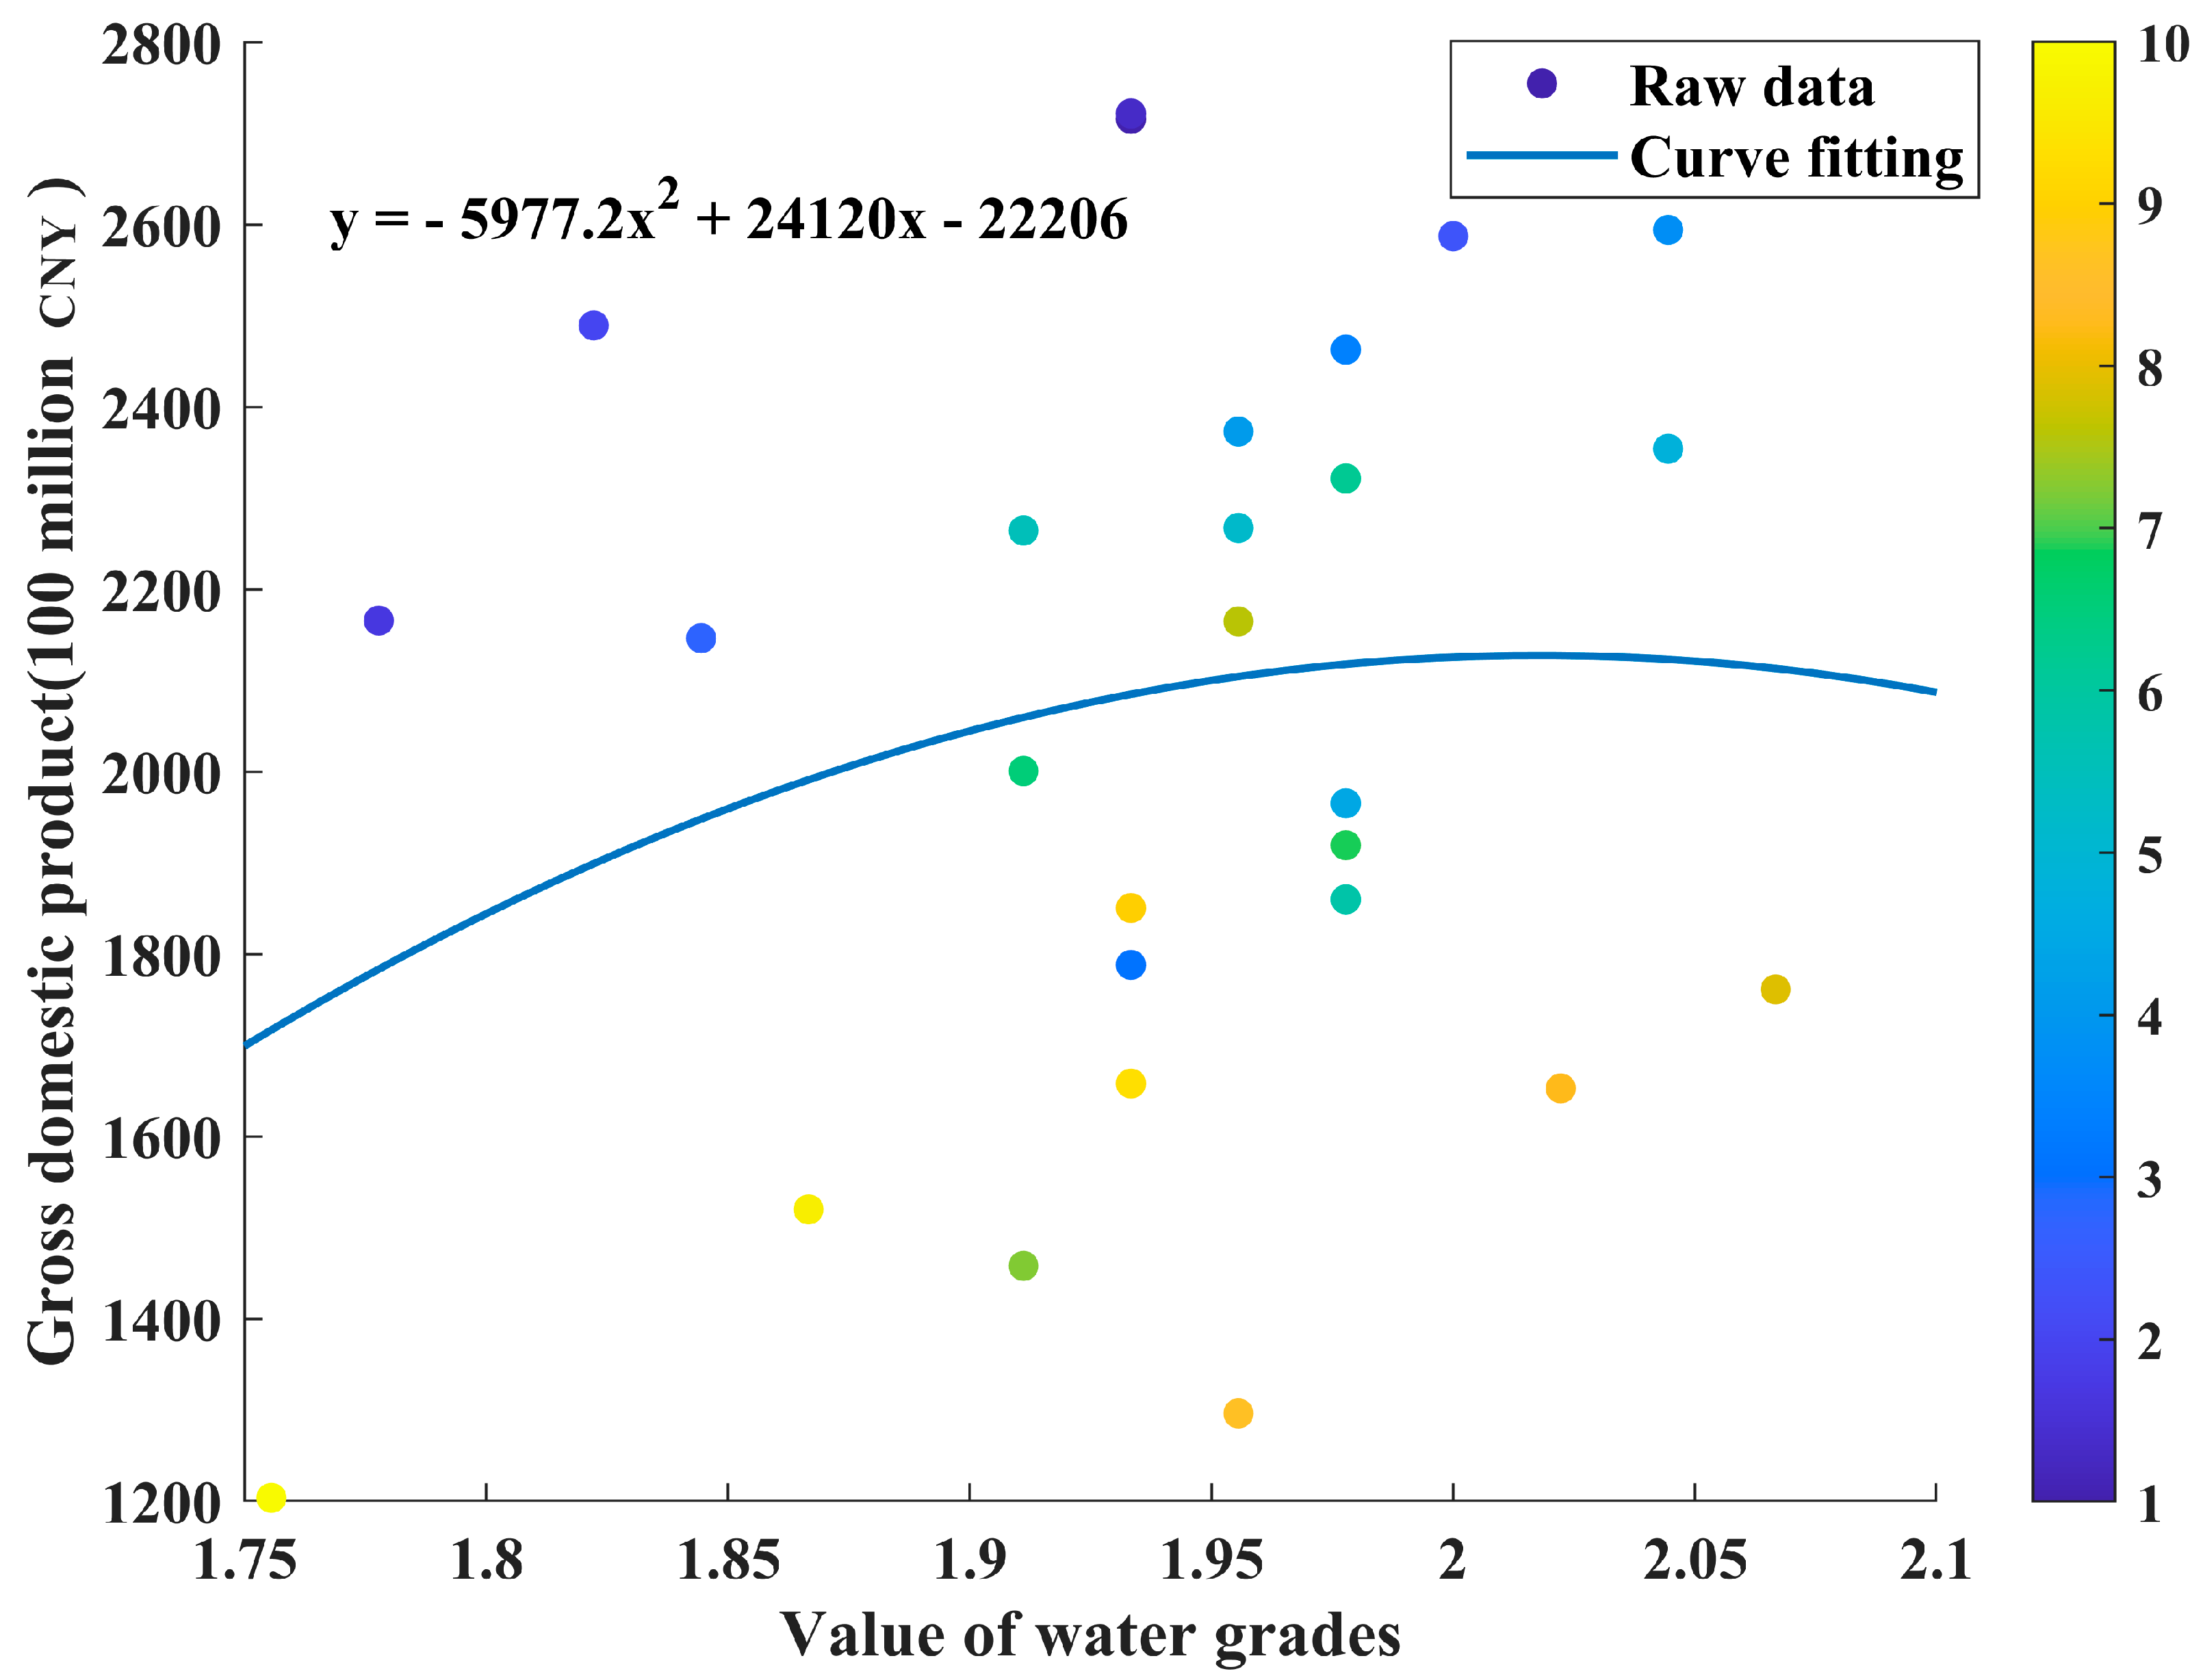
6.2. Parameter Partial Regression Model of Watershed Ecological Compensation Measurement

The relationship between economic growth and environmental pollution in China has a variety of manifestations, including linear, U-shaped, inverted U-shaped, and N-shaped relationships, depending on the region and pollution selection of indicators [64]. Although many factors can affect the opportunity costs of protecting the aquatic environment, this paper focuses on the water quality grade indicators related to surface water. China’s current water quality evaluation method stipulates that the better the water quality is, the smaller the water quality grade value. According to this principle, Table 6 shows the corresponding weights assigned to the five water quality categories according to the comprehensive evaluation method.
This paper takes the evolutionary game model of watershed ecological compensation and opportunity cost theory as the theoretical basis, selects suitable economic and environmental indicators, establishes a parametric regression econometric model, and explores the marginal effects of environmental and economic indicators using local linear regression. A parametric regression econometric model was developed as follows:
Q = f ( β ¯ ) + ε
By taking different fitting functions to fit and optimize the index data, it was found that the quadratic function is more effective than its mathematical model:
Q = f ( β ¯ ) = a β ¯ 2 + b β ¯ + c +
In Equation (26), Q = f ( β ¯ ) is the sum of quarterly gross domestic product (GDP) of upstream areas (Hanzhong, Ankang, Shangluo, Nanyang, and Shiyan cities) of the HJRB from 2015 to 2021, which is the dependent variable of this function and represents the economic indicator. β ¯ is the average water quality of each quarter from 2015 to 2021 at the cross-sectional monitoring sites in the upstream area of the HJRB, which is the independent variable of the function and represents the environmental indicators. a, b and c are the function coefficients and is the function error parameter. Figure 7 shows the fit of the function. The marginal effect values of Q = f ( β ¯ ) and β ¯ are determined using local linear regression in the function solution to reflect the cost relationship between environmental and economic indicators in the upstream area of the HJRB.

6.3. Analysis of Model Regression Results

Marginal effects break the old “input–output” inertia and vary with water quality [65]. In this paper, a total of 15 cross-sectional monitoring points in five cities were selected. To more scientifically reflect the marginal effects of water quality on regional GDP, the marginal effect values of all sample points were calculated one by one. Then, the marginal effect values of all sample points were averaged. Table 7 shows the average marginal effect values corresponding to the GDP calculated using different kernel functions.
As seen in Table 7, under different kernel functions, the minimum value of the marginal effect of the water quality grades of these five cities on the regional GDP is 1086.31 million CNY (171.20 million USD), the maximum value is 1848.57 million CNY (291.33 million USD), and the average value is approximately 1401.47 million CNY (220.87 million USD). This result means that the five cities will lose a minimum of 1086.31 million CNY (171.20 million USD) and a maximum of 1848.57 million CNY (291.33 million USD) in GDP, with an average loss of 1401.47 million CNY (220.87 million USD), for each level of improvement in quarterly average water quality for water environment protection. This lost GDP is the opportunity cost for upstream governments of the HJRB to protect the water environment, translated into annual units of 4345.24 million CNY (684.81 million USD), 7394.28 million CNY (1165.34 million USD), and 5605.88 million CNY (883.49 million USD). The current compensation paid directly by the central government to these five municipalities is 3590 million CNY (565.79 million USD) annually, which is obviously lower than the theoretical opportunity cost calculated in this paper. Therefore, the central government should increase the compensation level based on the current compensation policy and promote upstream and downstream governments of the HJRB to quickly reach the equilibrium state (protecting and compensating) expected by the public in the game.

7. Discussion

Ecological civilization is the sum of the material, spiritual and institutional achievements made by human beings following the objective law of harmony between human beings and nature, reflecting the state of progress of society [66]; the construction of ecological civilization is the way through which to achieve the “Chinese dream”—the great rejuvenation of the Chinese nation [67]. As an integral type of natural resource, watersheds have received widespread attention as important support with which to promote the construction of ecological civilization in China. To control transboundary water pollution, resolve water resource conflicts between upstream and downstream areas, and promote cooperation in water environment management, countries around the world have studied or implemented watershed ecological compensation mechanisms [68]; in China, these mechanisms have been widely implemented. In this paper, we discuss the impact of the initial willingness to cooperate between upstream and downstream governments on the game outcome. Moreover, we calculate the opportunity cost for upstream governments of the HJRB to protect the water environment based on the indicators of water quality grades and GDP.

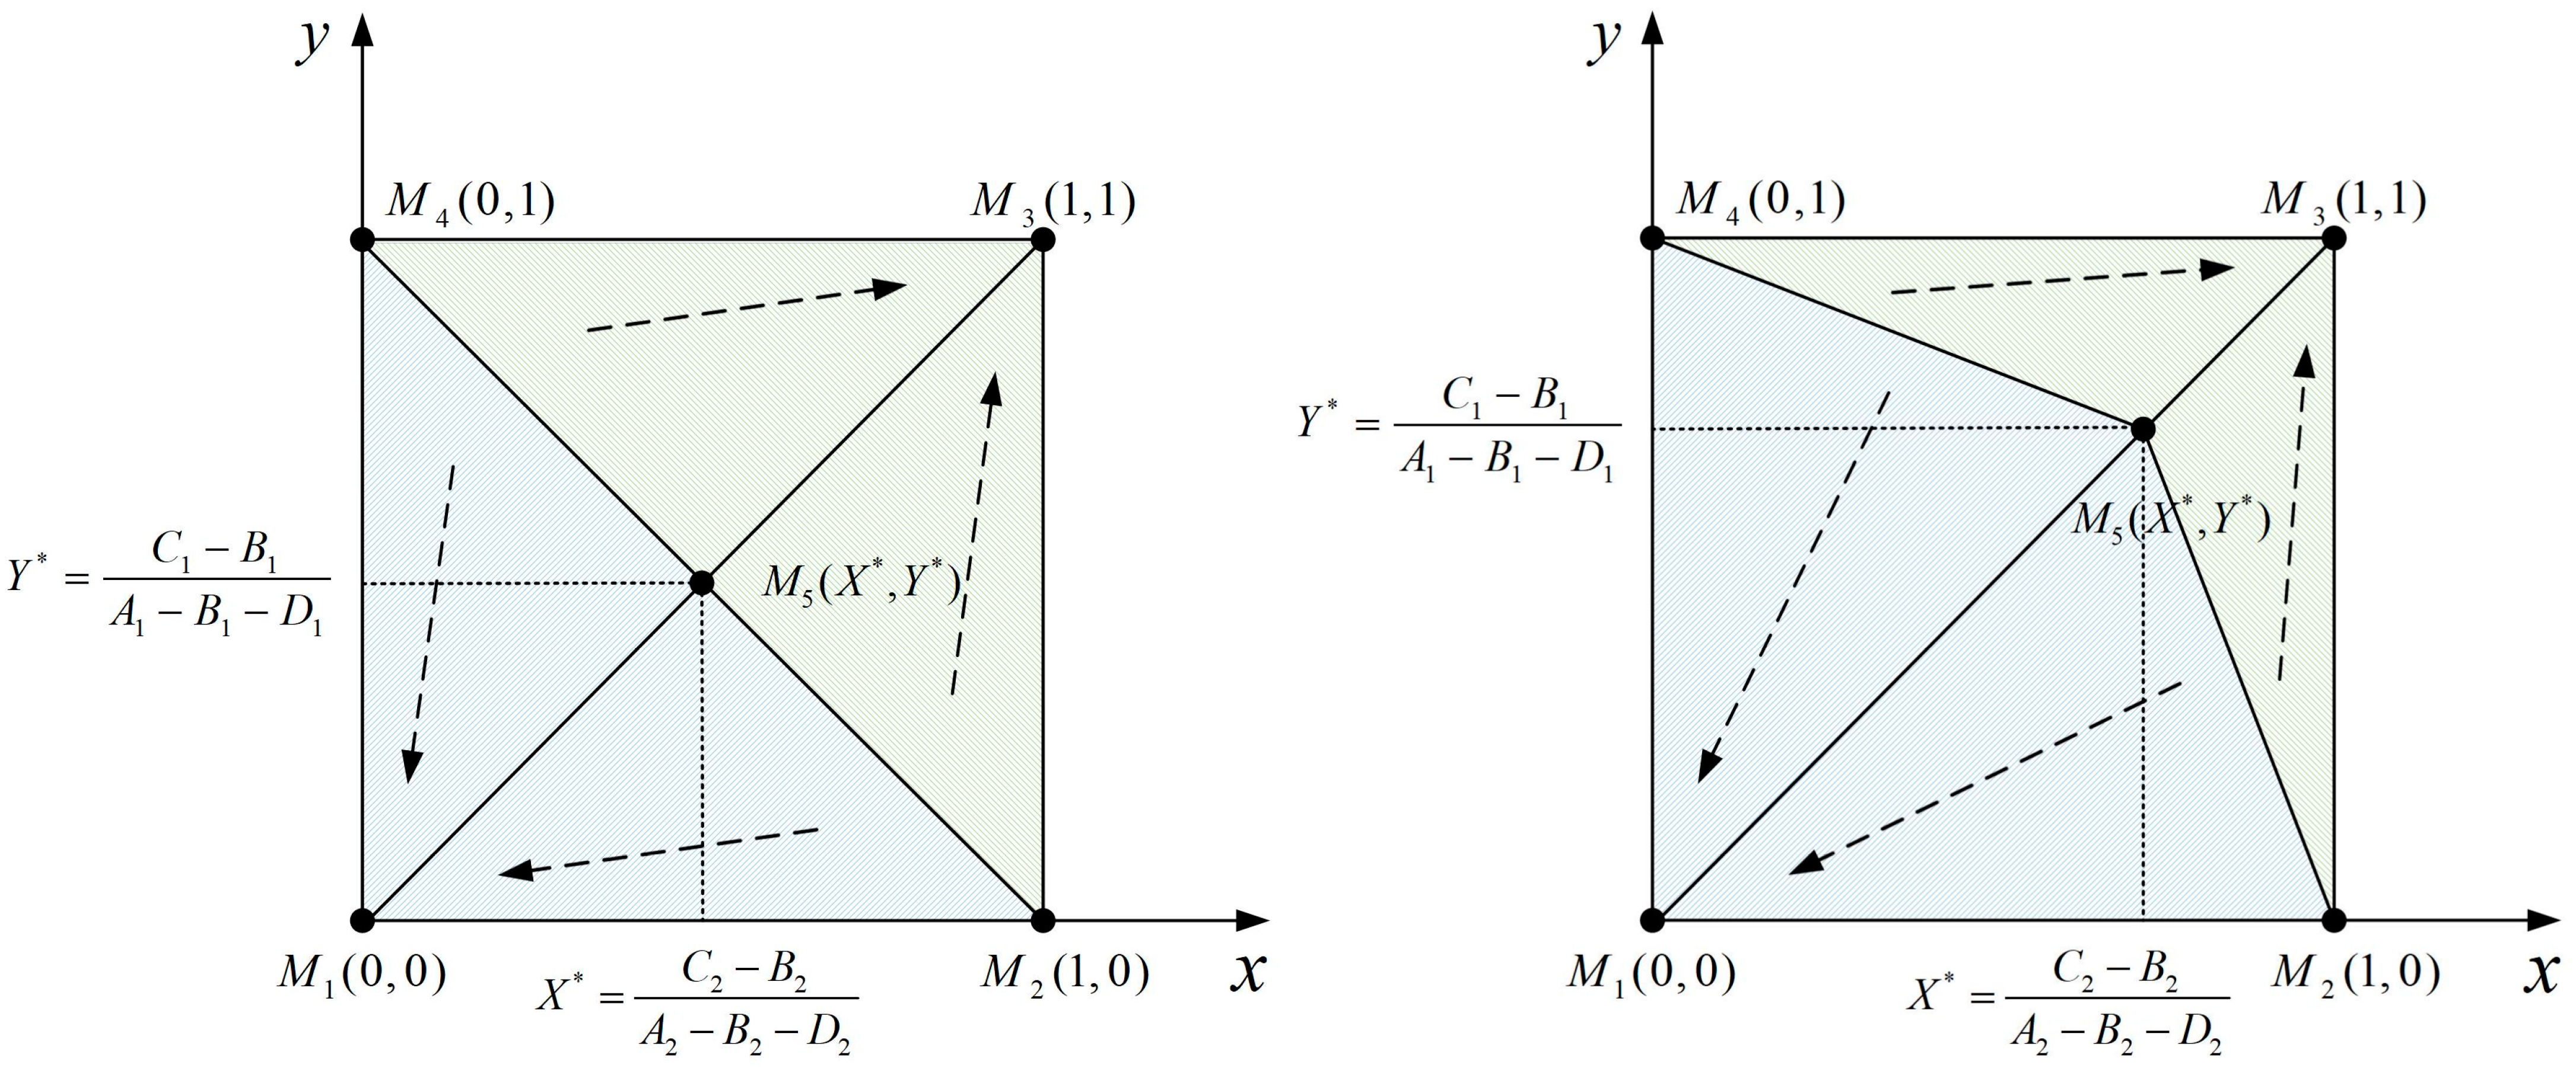
7.1. Watershed Ecological Compensation with Non-Supervision of the Central Government

According to the results in Section 5.1, the initial willingness to cooperate directly affects the final decision-making of upstream and downstream governments. The initial willingness to cooperate reflects the inclination of upstream and downstream governments toward different strategies and simulating different scenarios through the evolutionary game model allows for the exploration of more realistic results. When the initial willingness to cooperate is high, upstream governments are willing to choose to protect the water environment, and downstream governments are willing to choose to compensate. In this case, the evolutionary game model quickly stabilizes in the optimal state, i.e., the model converges to point M3. In contrast, the evolutionary game model may also reach a stable state under certain constraints when the initial willingness to cooperate is low. Nevertheless, the time consumed increases significantly, and there is a greater possibility of stabilizing in the worst state, i.e., the model converges to point M1.
The reason may be that when upstream and downstream governments participate in watershed ecological compensation, the willingness of downstream governments to pay compensation fees is low due to the high cost of environmental treatment. Upstream governments reduce investment in ecological protection due to a lack of subsidies, leading to an imbalance in the game between the upstream and downstream governments and affecting the basin’s ecological sustainability. Therefore, it is necessary to increase the cooperation willingness and consciousness between upstream and downstream governments to achieve stable implementation of the watershed ecological compensation mechanism and to protect water resources.

7.2. Watershed Ecological Compensation with the Supervision of the Central Government

According to the results in Section 5.2, under the supervision of the central government, it is easier for upstream and downstream governments to reach a stable state. Regardless of the initial willingness of upstream and downstream governments to cooperate, the central government’s regulatory actions can significantly shorten the time for the evolutionary game model to reach a stable state. It is worth noting that this point N3 (1, 1) is the only state-stable equilibrium, which indicates that under the regulation of the central government, upstream and downstream governments must eventually achieve positive cooperation.
It can be speculated that under central government intervention, as the probability of the downstream government taking measures increases, the attitude of the upstream government will change from initial noncooperation to cooperation, and they will collaborate to further promote environmental management in the basin. When the downstream government has a higher probability of implementing compensation policies, the upstream and downstream governments will adopt a more positive attitude to solve the watershed environmental problems, conducive to the sustainable development of the basin and the realization of public values.
The behavioral choices of upstream and downstream governments have a strong coupling synergy, i.e., the behavioral choices of one party have a strong influence on the behavioral strategies of the other party. The results of the evolutionary game model show that the watershed ecological compensation mechanism needs to be jointly governed by the central and local governments. The central government should clarify the interests of all parties in the watershed and promote cooperation between the upstream and downstream governments by promoting them to obtain the corresponding ecological compensation benefits through a perfect reward and punishment mechanism.
In reality, the central government rarely imposes economic punishment on local governments, and such punishments are mainly in the form of administrative orders, notifications, and disciplinary actions, but the compensation is mainly economic in nature, which can be more easily quantified. The regulation of the central government can effectively solve the prisoner’s dilemma of upstream and downstream governments. Whether the compensation amount is reasonable is the key issue that needs to be considered by the central government to implement the regulation, which was discussed in this paper.

7.3. The Relationship between Opportunity Costs and the Decision-Making Behavior of Upstream Governments in the HJRB

Upstream governments are the main parties responsible for watershed management, and the amount of compensation from the central government is closely related to the opportunity costs of upstream governments. Opportunity costs can reflect the driving force behind upstream governments choosing different strategies. High opportunity costs indicate that upstream governments lose more economic benefits to protect the water environment, and thus, they face more social and economic pressure, such as concerns about people’s income level and employment rate in their jurisdictions. When the economic compensation provided by the central government is higher than the opportunity costs, the concerns of upstream governments are effectively alleviated. Upstream governments choose an active strategy to protect the water environment without any concern. The evolutionary game model of upstream and downstream governments reaches a stable state more quickly.
In Section 6.2 and Section 6.3, the HJRB is discussed as a case study concerning compensation amounts and opportunity costs. We introduced the water quality class and GDP indicators for calculation. We found that the opportunity costs borne by the upstream governments of the HJRB were at least 4345.24 million CNY (684.81 million USD)/year and at most 7394.28 million CNY (1165.34 million USD)/year, with an average of 5605.88 million CNY (883.49 million USD)/year. Under the current central financial compensation policy, the compensation fees received by the upstream governments of the HJRB do not offset the opportunity costs of protecting the water environment. Therefore, the upstream governments of the HJRB lack a strong incentive to protect the water environment, indicating that the central government needs to increase its financial compensation.

7.4. Comparison with Previous Literature

This study finds that the initial willingness of upstream and downstream governments to cooperate largely influences the outcome of the game model; this finding is similar to previous literature. In reality, upstream and downstream governments are the central stakeholders in watershed protection and economic development [69]. Consequently, they will inevitably prefer to make decisions that yield faster benefits in the game [59]. However, short-term benefits often come at the expense of the ecological environment, which is not in the public interest [32]. Therefore, it is necessary to introduce incentives and penalties from the central government. Based on this, the game model after central government regulation is studied in Section 5.2, which concludes that central government regulation accelerates the game model to a steady state. Many previous studies have placed high expectations on central government regulation because the central government has the power to reward and punish local governments, and there is a difference in administrative status between them [9].
However, the previous literature has argued that ecological compensation without the supervision of the central government is impractical and that upstream and downstream governments cannot spontaneously cooperate in implementing ecological compensation systems [9]. However, the results of this paper conclude that as long as the initial willingness to cooperate between the two sides of the game is high, although there is no intervention by the central government, upstream and downstream governments cooperate to protect the water environment but doing so may consume more time and evolve several times to reach the stable state, which is obviously different from the findings of the previous literature.
The main reason for this difference may be that when upstream and downstream governments realize that cooperation in managing the water environment is the only way to achieve sustainable development, the initial willingness of the two sides of the game to cooperate is significantly increased, and an alliance of interest is formed [70]. Nevertheless, China’s current watershed management model is based on administrative regions, where local governments are responsible only for the water environment under their jurisdiction [71]. The entire watershed is divided into several parts by different administrative regions, leading to higher management and governance costs, which also makes upstream and downstream governments less willing to cooperate initially due to the existence of different interests. Specifically, upstream governments are driven by the interest of making full use of water resources to develop the local economy, including enterprises that may cause severe pollution to the water environment [72]. The flowing river links the upstream area to the downstream area, and the polluted water then spreads to the downstream area, so downstream governments will refuse to compensate upstream governments. Therefore, it is essential to increase the initial willingness of upstream and downstream governments to cooperate. In other words, strengthening the sense of cooperation between upstream and downstream governments can allow for the unnecessary waste of resources to be avoided and the achievement of better results in terms of protecting the water environment at a smaller cost.
The criteria for watershed ecological compensation are not only a focus of government management but also one of the hot issues discussed in academia [68,73]. The previous literature has proposed the concept of opportunity cost by analyzing the law of cost and linking utility to cost [74,75]. Since then, opportunity cost accounting has been widely used in ecological compensation studies and used as an important basis for determining ecological compensation standards [76], and the method is often used in the measurement of the minimum compensation amount for ecological compensation [77]. In the HJRB, the main purpose is to compensate the upstream government for the loss of giving up other development opportunities so that the upstream government can gain enough incentive to participate in watershed protection. While previous literature has estimated ecological compensation standards mainly by accounting for the economic value of natural resources [78], this study uses actual data from the HJRB to demonstrate that the current compensation standards are not reasonable, which makes the results of this study more realistic compared with those of previous literature.

8. Conclusions

Watershed ecological compensation is a complex interactive process, and in the previous literature, the classical game theory failed to focus on how to achieve the equilibrium, timeliness, and stability of the game model. Based on evolutionary game theory, this paper considers upstream, downstream, and central governments in a unified model and then discusses the evolutionary steady state of each game subject under multiple scenarios based on the derived replicated dynamic equations. Moreover, this work further discusses the relationship between the compensation amount and opportunity costs using realistic data with the HJRB as the case. The main conclusions are presented below:
  • The initial willingness to cooperate directly affects the final steady state of the evolutionary game model.
  • In contrast to the findings in the previous literature, we argue that even without the regulation of the central government, it is still possible for upstream and downstream governments to reach a steady state spontaneously, provided their initial willingness to cooperate is high, although doing so may consume more time.
  • The regulation of the central government can effectively lead to cooperation between upstream and downstream governments so that the game model can quickly reach a stable state.
  • Opportunity costs significantly influence which strategy is adopted by upstream governments, and the current amount of compensation from the central government is significantly lower than the opportunity costs of treating the water environment for upstream governments in the HJRB.
Based on the analysis in this paper, the following suggestions are made to improve the watershed ecological compensation in the HJRB:
The model results show that initial willingness is crucial, so the willingness of upstream and downstream governments to cooperate and form an ecological community of interest should be increased. In addition, the central government’s supervision can make the game model reach a steady state faster, and the current compensation standard of the central government to the upstream government of the HJRB is unreasonable; therefore, the central government should strengthen the supervision of the implementation of the HJRB ecological compensation system and increase economic compensation to upstream areas. The relationship between opportunity cost and the compensation amount is complex and should be systematically studied, and diversified compensation methods should be explored. For example, ecological compensation mechanisms can be combined with the river chief system, unified management of watersheds should be implemented, and the negative impact of administrative divisions on the integrity of watershed protection work should be eliminated. On the other hand, it is also important to address the root causes of watershed pollution. The transformation of highly polluting industries in upstream areas to green and low-carbon areas should be promoted, and downstream areas should be suggested to make full use of ecological advantages to building eco-friendly industries.
The limitations of this paper and future work are as follows:
First, the evolutionary game model constructed in this paper is applicable only to watershed ecological compensation mechanisms in which the same type of government would maintain consistent actions. Suppose that there is not enough solidarity among both upstream and downstream governments, there may be competition among them, i.e., different upstream governments may compete for water use rights and compensation fees, while different downstream governments may shift compensation responsibilities to each other to compensate less or not at all. A more complex model to analyze this situation can be constructed in future studies. Second, the cross-effects of different variables may affect the applicability of the evolutionary game model constructed in this paper. This paper analyzes the effects of the following variables on the model: governance costs, ecological benefits, central government compensation, and penalties, and initial willingness to cooperate. However, this paper does not consider whether there is a cross-effect between these variables and considers only the strategy choice of the game subjects under a single factor change. Third, similar to other works, this paper is based on model-derivation-assuming strategies, or the pure interest needs of upstream and downstream governments in the basin, which may lead to gaps between our work and reality. However, we use actual data in the case study section, which makes our work more realistic than other only model derivation studies. Finally, the study of the opportunity costs of watershed governance is more complex and is related to many aspects of the economy and society. Therefore, in the future, more influencing factors can be added to the model constructed in this paper to study and calculate more reasonable opportunity costs.

Author Contributions

The authors undertook different tasks for this paper. K.Z. designed the models and wrote the paper. Y.Z. analyzed the data. M.W. provided direction for the research work. H.L. designed the research and revised the paper. All authors have read and agreed to the published version of the manuscript.

Funding

This research was funded by the National Natural Science Foundation of China (41971402).

Institutional Review Board Statement

Not applicable.

Informed Consent Statement

Not applicable.

Data Availability Statement

Data developed in this study will be made available on request to the corresponding authors.

Conflicts of Interest

The authors declare no conflict of interest. The funders had no role in the design of the study; in the collection, analyses, or interpretation of data; in the writing of the manuscript, or in the decision to publish the results.

References

  1. Varis, O.; Vakkilainen, P. China’s 8 Challenges to Water Resources Management in the First Quarter of the 21st Century. Geomorphology 2001, 41, 93–104. [Google Scholar] [CrossRef]
  2. Wang, Y.; Jiang, R.; Xie, J.; Zhao, Y.; Li, F. Water Resources Management under Changing Environment: A Systematic Review. J. Coast. Res. 2020, 104, 29–41. [Google Scholar] [CrossRef]
  3. Ma, T.; Sun, S.; Fu, G.; Hall, J.W.; Ni, Y.; He, L.; Yi, J.; Zhao, N.; Du, Y.; Pei, T.; et al. Pollution Exacerbates China’s Water Scarcity and Its Regional Inequality. Nat. Commun. 2020, 11, 650. [Google Scholar] [CrossRef] [PubMed] [Green Version]
  4. Lapworth, D.J.; Baran, N.; Stuart, M.E.; Ward, R.S. Emerging Organic Contaminants in Groundwater: A Review of Sources, Fate and Occurrence. Environ. Pollut. 2012, 163, 287–303. [Google Scholar] [CrossRef] [PubMed] [Green Version]
  5. Schwarzenbach, R.P.; Egli, T.; Hofstetter, T.B.; von Gunten, U.; Wehrli, B. Global Water Pollution and Human Health. Annu. Rev. Environ. Resour. 2010, 35, 109–136. [Google Scholar] [CrossRef]
  6. Huang, F.; Wang, X.; Lou, L.; Zhou, Z.; Wu, J. Spatial Variation and Source Apportionment of Water Pollution in Qiantang River (China) Using Statistical Techniques. Water Res. 2010, 44, 1562–1572. [Google Scholar] [CrossRef] [PubMed]
  7. Fan, W.; Wang, S.; Gu, X.; Zhou, Z.; Zhao, Y.; Huo, W. Evolutionary Game Analysis on Industrial Pollution Control of Local Government in China. J. Environ. Manag. 2021, 298, 113499. [Google Scholar] [CrossRef] [PubMed]
  8. Zeng, Y.; Li, J.; Cai, Y.; Tan, Q.; Dai, C. A Hybrid Game Theory and Mathematical Programming Model for Solving Trans-Boundary Water Conflicts. J. Hydrol. 2019, 570, 666–681. [Google Scholar] [CrossRef]
  9. Gao, X.; Shen, J.; He, W.; Sun, F.; Zhang, Z.; Guo, W.; Zhang, X.; Kong, Y. An Evolutionary Game Analysis of Governments’ Decision-Making Behaviors and Factors Influencing Watershed Ecological Compensation in China. J. Environ. Manag. 2019, 251, 109592. [Google Scholar] [CrossRef] [PubMed]
  10. Just, R.E.; Netanyahu, S. Conflict and Cooperation on Trans-Boundary Water Resources; Springer Science & Business Media: Berlin/Heidelberg, Germany, 1998; ISBN 978-0-7923-8106-8. [Google Scholar]
  11. Talukder, B.; Hipel, K.W. Diagnosis of Sustainability of Trans-Boundary Water Governance in the Great Lakes Basin. World Dev. 2020, 129, 104855. [Google Scholar] [CrossRef]
  12. Yu, X. Transboundary Water Pollution Management Lessons Learned from River Basin Management in China, Europe and the Netherlands. Utrecht Law Rev. 2011, 7, 188–203. [Google Scholar] [CrossRef] [Green Version]
  13. Zhao, L.; Li, C.; Huang, R.; Si, S.; Xue, J.; Huang, W.; Hu, Y. Harmonizing Model with Transfer Tax on Water Pollution across Regional Boundaries in a China’s Lake Basin. Eur. J. Oper. Res. 2013, 225, 377–382. [Google Scholar] [CrossRef]
  14. Lee, K.M.; Lai, C.W.; Ngai, K.S.; Juan, J.C. Recent Developments of Zinc Oxide Based Photocatalyst in Water Treatment Technology: A Review. Water Res. 2016, 88, 428–448. [Google Scholar] [CrossRef]
  15. Vatn, A. An Institutional Analysis of Payments for Environmental Services. Ecol. Econ. 2010, 69, 1245–1252. [Google Scholar] [CrossRef]
  16. Muradian, R.; Corbera, E.; Pascual, U.; Kosoy, N.; May, P.H. Reconciling Theory and Practice: An Alternative Conceptual Framework for Understanding Payments for Environmental Services. Ecol. Econ. 2010, 69, 1202–1208. [Google Scholar] [CrossRef]
  17. Wunder, S. Revisiting the Concept of Payments for Environmental Services. Ecol. Econ. 2015, 117, 234–243. [Google Scholar] [CrossRef]
  18. Pei, S.; Zhang, C.; Liu, C.; Liu, X.; Xie, G. Forest Ecological Compensation Standard Based on Spatial Flowing of Water Services in the Upper Reaches of Miyun Reservoir, China. Ecosyst. Serv. 2019, 39, 100983. [Google Scholar] [CrossRef]
  19. Hu, Y.; Huang, J.; Hou, L. Impacts of the Grassland Ecological Compensation Policy on Household Livestock Production in China: An Empirical Study in Inner Mongolia. Ecol. Econ. 2019, 161, 248–256. [Google Scholar] [CrossRef]
  20. Maron, M.; Hobbs, R.J.; Moilanen, A.; Matthews, J.W.; Christie, K.; Gardner, T.A.; Keith, D.A.; Lindenmayer, D.B.; McAlpine, C.A. Faustian Bargains? Restoration Realities in the Context of Biodiversity Offset Policies. Biol. Conserv. 2012, 155, 141–148. [Google Scholar] [CrossRef]
  21. Feng, D.; Wu, W.; Liang, L.; Li, L.; Zhao, G. Payments for Watershed Ecosystem Services: Mechanism, Progress and Challenges. Ecosyst. Health Sustain. 2018, 4, 13–28. [Google Scholar] [CrossRef] [Green Version]
  22. Han, D.; Currell, M.J.; Cao, G. Deep Challenges for China’s War on Water Pollution. Environ. Pollut. 2016, 218, 1222–1233. [Google Scholar] [CrossRef] [PubMed] [Green Version]
  23. Xiao, M.; Bao, F.; Wang, S.; Cui, F. Water Quality Assessment of the Huaihe River Segment of Bengbu (China) Using Multivariate Statistical Techniques. Water Resour. 2016, 43, 166–176. [Google Scholar] [CrossRef]
  24. Xu, H.; Paerl, H.W.; Qin, B.; Zhu, G.; Hall, N.S.; Wu, Y. Determining Critical Nutrient Thresholds Needed to Control Harmful Cyanobacterial Blooms in Eutrophic Lake Taihu, China. Environ. Sci. Technol. 2015, 49, 1051–1059. [Google Scholar] [CrossRef] [PubMed]
  25. Guo, C.; Chen, Y.; Xia, W.; Qu, X.; Yuan, H.; Xie, S.; Lin, L.-S. Eutrophication and Heavy Metal Pollution Patterns in the Water Suppling Lakes of China’s South-to-North Water Diversion Project. Sci. Total Environ. 2020, 711, 134543. [Google Scholar] [CrossRef]
  26. Liu, Y.; Wang, A.; Wu, Y. Environmental Regulation and Green Innovation: Evidence from China’s New Environmental Protection Law. J. Clean Prod. 2021, 297, 126698. [Google Scholar] [CrossRef]
  27. Zhang, L.; Li, S.; Loaiciga, H.A.; Zhuang, Y.; Du, Y. Opportunities and Challenges of Interbasin Water Transfers: A Literature Review with Bibliometric Analysis. Scientometrics 2015, 105, 279–294. [Google Scholar] [CrossRef]
  28. Wan, X.; Wang, R.; Wang, M.; Deng, J.; Zhou, Z.; Yi, X.; Pan, J.; Du, Y. Online Public Opinion Mining for Large Cross-Regional Projects: Case Study of the South-to-North Water Diversion Project in China. J. Manag. Eng. 2022, 38, 05021011. [Google Scholar] [CrossRef]
  29. Cheng, X.; Yang, Y.; Li, M.; Dou, X.; Zhang, Q. The Impact of Agricultural Land Use Changes on Soil Organic Carbon Dynamics in the Danjiangkou Reservoir Area of China. Plant Soil 2013, 366, 415–424. [Google Scholar] [CrossRef]
  30. Liu, W.; Kuo, Y.-M.; Zhao, E. Influence of the South-to-North Water Transfer and the Yangtze River Mitigation Projects on the Water Quality of Han River, China. Environ. Earth Sci. 2021, 80, 246. [Google Scholar] [CrossRef]
  31. Fu, Y.; Zhang, J.; Zhang, C.; Zang, W.; Guo, W.; Qian, Z.; Liu, L.; Zhao, J.; Feng, J. Payments for Ecosystem Services for Watershed Water Resource Allocations. J. Hydrol. 2018, 556, 689–700. [Google Scholar] [CrossRef]
  32. Gao, X.; Shen, J.; He, W.; Sun, F.; Zhang, Z.; Zhang, X.; Yuan, L.; An, M. Multilevel Governments’ Decision-Making Process and Its Influencing Factors in Watershed Ecological Compensation. Sustainability 2019, 11, 1990. [Google Scholar] [CrossRef] [Green Version]
  33. Kuo, Y.-M.; Liu, W.; Zhao, E.; Li, R.; Munoz-Carpena, R. Water Quality Variability in the Middle and down Streams of Han River under the Influence of the Middle Route of South-North Water Diversion Project, China. J. Hydrol. 2019, 569, 218–229. [Google Scholar] [CrossRef]
  34. Zhao, Z.-Y.; Zuo, J.; Zillante, G. Transformation of Water Resource Management: A Case Study of the South-to-North Water Diversion Project. J. Clean Prod. 2017, 163, 136–145. [Google Scholar] [CrossRef]
  35. Yang, L.; Qin, H.; Xia, W.; Gan, Q.; Li, L.; Su, J.; Yu, X. Resource Slack, Environmental Management Maturity and Enterprise Environmental Protection Investment: An Enterprise Life Cycle Adjustment Perspective. J. Clean Prod. 2021, 309, 127339. [Google Scholar] [CrossRef]
  36. Li, Y.; Xiong, W.; Zhang, W.; Wang, C.; Wang, P. Life Cycle Assessment of Water Supply Alternatives in Water-Receiving Areas of the South-to-North Water Diversion Project in China. Water Res. 2016, 89, 9–19. [Google Scholar] [CrossRef]
  37. Zhou, Y.; Guo, S.; Hong, X.; Chang, F.-J. Systematic Impact Assessment on Inter-Basin Water Transfer Projects of the Hanjiang River Basin in China. J. Hydrol. 2017, 553, 584–595. [Google Scholar] [CrossRef]
  38. Nong, X.; Shao, D.; Zhong, H.; Liang, J. Evaluation of Water Quality in the South-to-North Water Diversion Project of China Using the Water Quality Index (WQI) Method. Water Res. 2020, 178, 115781. [Google Scholar] [CrossRef]
  39. Floehr, T.; Xiao, H.; Scholz-Starke, B.; Wu, L.; Hou, J.; Yin, D.; Zhang, X.; Ji, R.; Yuan, X.; Ottermanns, R.; et al. Solution by Dilution?-A Review on the Pollution Status of the Yangtze River. Environ. Sci. Pollut. Res. 2013, 20, 6934–6971. [Google Scholar] [CrossRef] [PubMed]
  40. Zeng, H.; Wu, J. Heavy Metal Pollution of Lakes along the Mid-Lower Reaches of the Yangtze River in China: Intensity, Sources and Spatial Patterns. Int. J. Environ. Res. Public Health 2013, 10, 793–807. [Google Scholar] [CrossRef] [Green Version]
  41. Yin, S.; Wu, Y.; Xu, W.; Li, Y.; Shen, Z.; Feng, C. Contribution of the Upper River, the Estuarine Region, and the Adjacent Sea to the Heavy Metal Pollution in the Yangtze Estuary. Chemosphere 2016, 155, 564–572. [Google Scholar] [CrossRef]
  42. Wang, Z.; Liu, M.; Lin, L.; Zhang, S.; Pan, X.; Tao, J. Spatio-Temporal Distribution and Pollution Assessment of Heavy Metals in the Middle and Lower Reaches of Hanjiang River. J. Yangtze River Sci. Res. Inst. 2021, 38, 40–47. [Google Scholar]
  43. Liu, H.; Di, H.; Huang, Y.; Zheng, L.; Zhang, Y. A Comprehensive Study of the Impact of Large-Scale Landscape Pattern Changes on the Watershed Ecosystem. Water 2021, 13, 1361. [Google Scholar] [CrossRef]
  44. Tan, L.; Cai, Y.; Cheng, H.; Edwards, L.R.; Gao, Y.; Xu, H.; Zhang, H.; An, Z. Centennial- to Decadal-Scale Monsoon Precipitation Variations in the Upper Hanjiang River Region, China over the Past 6650 Years. Earth Planet. Sci. Lett. 2018, 482, 580–590. [Google Scholar] [CrossRef]
  45. Song, M.; Zhu, S.; Wang, J.; Zhao, J. Share Green Growth: Regional Evaluation of Green Output Performance in China. Int. J. Prod. Econ. 2020, 219, 152–163. [Google Scholar] [CrossRef]
  46. Luo, W.; Bai, H.; Jing, Q.; Liu, T.; Xu, H. Urbanization-Induced Ecological Degradation in Midwestern China: An Analysis Based on an Improved Ecological Footprint Model. Resour. Conserv. Recycl. 2018, 137, 113–125. [Google Scholar] [CrossRef]
  47. Hu, B.; Zhang, Z.; Han, H.; Li, Z.; Cheng, X.; Kang, F.; Wu, H. The Grain for Green Program Intensifies Trade-Offs between Ecosystem Services in Midwestern Shanxi, China. Remote Sens. 2021, 13, 3966. [Google Scholar] [CrossRef]
  48. Wang, X.-C.; Klemes, J.J.; Dong, X.; Fan, W.; Xu, Z.; Wang, Y.; Varbanov, P.S. Air Pollution Terrain Nexus: A Review Considering Energy Generation and Consumption. Renew. Sustain. Energy Rev. 2019, 105, 71–85. [Google Scholar] [CrossRef]
  49. Lott, M.C.; Pye, S.; Dodds, P.E. Quantifying the Co-Impacts of Energy Sector Decarbonisation on Outdoor Air Pollution in the United Kingdom. Energy Policy 2017, 101, 42–51. [Google Scholar] [CrossRef] [Green Version]
  50. Feng, Y.; Chen, H.; Chen, Z.; Wang, Y.; Wei, W. Has Environmental Information Disclosure Eased the Economic Inhibition of Air Pollution? J. Clean Prod. 2021, 284, 125412. [Google Scholar] [CrossRef]
  51. Madani, K. Game Theory and Water Resources. J. Hydrol. 2010, 381, 225–238. [Google Scholar] [CrossRef]
  52. Qu, F.; Sun, Y. Study on Payments for Environmental Services in Basin Area Based on Intergovernmental Game. China Popul. Resour. Environ. 2014, 24, 83–88. [Google Scholar] [CrossRef]
  53. Matthews, B.; Narwani, A.; Hausch, S.; Nonaka, E.; Peter, H.; Yamamichi, M.; Sullam, K.E.; Bird, K.C.; Thomas, M.K.; Hanley, T.C.; et al. Toward an Integration of Evolutionary Biology and Ecosystem Science. Ecol. Lett. 2011, 14, 690–701. [Google Scholar] [CrossRef] [PubMed]
  54. Hofbauer, J.; Sigmund, K. Evolutionary Game Dynamics. Bull. Am. Math. Soc. 2003, 40, 479–519. [Google Scholar] [CrossRef] [Green Version]
  55. Mendoza-Palacios, S.; Hernandez-Lerma, O. Evolutionary Dynamics on Measurable Strategy Spaces: Asymmetric Games. J. Differ. Equ. 2015, 259, 5709–5733. [Google Scholar] [CrossRef]
  56. Kaniovski, Y.M.; Young, H.P. Learning Dynamics in Games with Stochastic Perturbations. Games Econ. Behav. 1995, 11, 330–363. [Google Scholar] [CrossRef]
  57. Adami, C.; Schossau, J.; Hintze, A. Evolutionary Game Theory Using Agent-Based Methods. Phys. Life Rev. 2016, 19, 1–26. [Google Scholar] [CrossRef] [PubMed]
  58. Friedman, D. Evolutionary Economics Goes Mainstream: A Review of the Theory of Learning in Games. J. Evol. Econ. 1998, 8, 423–432. [Google Scholar] [CrossRef]
  59. Shen, J.; Gao, X.; He, W.; Sun, F.; Zhang, Z.; Kong, Y.; Wan, Z.; Zhang, X.; Li, Z.; Wang, J. Prospect Theory in an Evolutionary Game: Construction of Watershed Ecological Compensation System in Taihu Lake Basin. J. Clean. Prod. 2021, 291, 125929. [Google Scholar] [CrossRef]
  60. Hanzhong Municipal People’s Government Hanzhong City Will Promote Water Pollution Compensation Activities in the Hanjiang River Basin. Available online: http://sthjt.shaanxi.gov.cn/dynamic/city/2018-03-07/26091.html (accessed on 29 November 2021).
  61. Tang, P.; Zhang, X.; Hu, Y. The Construction and Application of Ecological Compensation Performance Evaluation System in Water Source Area: Based on Empirical Analysis of Hanjiang Water Source Area in Middle Route of the South-North Water Transfer Project. Ecol. Econ. 2018, 34, 170–174. [Google Scholar]
  62. Ministry of Finance of the People’s Republic of China Guidance on Accelerating the Establishment of Horizontal Ecological Protection Compensation Mechanisms Upstream and Downstream of the Watershed. Available online: http://www.gov.cn/xinwen/2016-12/30/content_5154964.htm#1 (accessed on 29 November 2021).
  63. The Xinhua News Agency The Central Government Will Reward 18 Billion Yuan to Encourage the Construction of Ecological Protection and Restoration Mechanisms in the Yangtze River Economic Belt. Available online: http://www.gov.cn/xinwen/2018-02/02/content_5263332.htm (accessed on 29 November 2021).
  64. Zhang, C.; Zhu, Q.; Yu, T. Relationship between Environmental Pollution and Economic Growth. Stat. Res. 2011, 28, 59–67. [Google Scholar] [CrossRef]
  65. Norton, E.C.; Dowd, B.E.; Maciejewski, M.L. Marginal Effects-Quantifying the Effect of Changes in Risk Factors in Logistic Regression Models. JAMA J. Am. Med. Assoc. 2019, 321, 1304–1305. [Google Scholar] [CrossRef]
  66. Meng, F.; Guo, J.; Guo, Z.; Lee, J.C.K.; Liu, G.; Wang, N. Urban Ecological Transition: The Practice of Ecological Civilization Construction in China. Sci. Total Environ. 2021, 755, 142633. [Google Scholar] [CrossRef]
  67. Hansen, M.H.; Li, H.; Svarverud, R. Ecological Civilization: Interpreting the Chinese Past, Projecting the Global Future. Glob. Environ. Chang.-Hum. Policy Dimens. 2018, 53, 195–203. [Google Scholar] [CrossRef]
  68. Wei, C.; Luo, C. A Differential Game Design of Watershed Pollution Management under Ecological Compensation Criterion. J. Clean Prod. 2020, 274, 122320. [Google Scholar] [CrossRef]
  69. Sheng, J.; Webber, M. Incentive-Compatible Payments for Watershed Services along the Eastern Route of China’s South-North Water Transfer Project. Ecosyst. Serv. 2017, 25, 213–226. [Google Scholar] [CrossRef]
  70. Wang, G.; Mang, S.; Cai, H.; Liu, S.; Zhang, Z.; Wang, L.; Innes, J.L. Integrated Watershed Management: Evolution, Development and Emerging Trends. J. For. Res. 2016, 27, 967–994. [Google Scholar] [CrossRef] [Green Version]
  71. Yan, L.; Jianhua, X.; Fen, Q.; Jiayao, W. Payments for Watershed Services and Practices in China: Achievements and Challenges. Chin. Geogr. Sci. 2018, 28, 873–893. [Google Scholar] [CrossRef] [Green Version]
  72. Luo, Z.; Zuo, Q. Evaluating the Coordinated Development of Social Economy, Water, and Ecology in a Heavily Disturbed Basin Based on the Distributed Hydrology Model and the Harmony Theory. J. Hydrol. 2019, 574, 226–241. [Google Scholar] [CrossRef]
  73. Jiang, K.; You, D.; Li, Z.; Shi, S. A Differential Game Approach to Dynamic Optimal Control Strategies for Watershed Pollution across Regional Boundaries under Eco-Compensation Criterion. Ecol. Indic. 2019, 105, 229–241. [Google Scholar] [CrossRef]
  74. Adams, V.M.; Pressey, R.L.; Naidoo, R. Opportunity Costs: Who Really Pays for Conservation? Biol. Conserv. 2010, 143, 439–448. [Google Scholar] [CrossRef]
  75. Smith, M.D.; Lynham, J.; Sanchirico, J.N.; Wilson, J.A. Political Economy of Marine Reserves: Understanding the Role of Opportunity Costs. Proc. Natl. Acad. Sci. USA 2010, 107, 18300–18305. [Google Scholar] [CrossRef] [PubMed] [Green Version]
  76. Mewes, M.; Drechsler, M.; Johst, K.; Sturm, A.; Waetzold, F. A Systematic Approach for Assessing Spatially and Temporally Differentiated Opportunity Costs of Biodiversity Conservation Measures in Grasslands. Agric. Syst. 2015, 137, 76–88. [Google Scholar] [CrossRef] [Green Version]
  77. Wang, X.; Li, X.; Xin, L.; Tan, M.; Li, S.; Wang, R. Ecological Compensation for Winter Wheat Abandonment in Groundwater Over-Exploited Areas in the North China Plain. J. Geogr. Sci. 2016, 26, 1463–1476. [Google Scholar] [CrossRef]
  78. Yu, B.; Xu, L. Review of Ecological Compensation in Hydropower Development. Renew. Sustain. Energy Rev. 2016, 55, 729–738. [Google Scholar] [CrossRef]
Figure 1. Location of the HJRB.
Water 14 01151 g001
Figure 2. Relationships among upstream, downstream, and central governments in watershed ecological compensation.
Water 14 01151 g002
Figure 3. Decision tree of interested parties.
Water 14 01151 g003
Figure 4. Research design.
Water 14 01151 g004
Figure 5. Phase diagram of the evolution of upstream and downstream governments’ decision-making behavior (with the non-supervision of the central government).
Water 14 01151 g005
Figure 6. Phase diagram of the evolution of upstream and downstream governments’ decision-making behavior (with the supervision of the central government).
Water 14 01151 g006
Figure 7. Relationship changes between water grades and GDP.
Water 14 01151 g007
Table 1. Strategies for each player in the evolutionary game.
GovernmentsValueStrategies
Upstream governments1Protecting
2Not protecting
Downstream governments1Compensating
2Not compensating
The central government1Supervising
2Not supervising
Table 2. Payoff matrix for both players with non-supervision of the central government.
When the Central Government Does Not Supervise Local Governments
River basin and strategiesUpstream governments
Protecting (X)Not protecting (1–X)
Downstream
governments
Compensating (Y) ( A 1 C 1 , A 2 C 2 ) ( D 1 , B 2 C 2 )
Not compensating (1–Y) ( B 1 C 1 , D 2 ) ( 0 , 0 )
Table 3. Equilibrium points for determinants and traces (with the non-supervision of the central government).
Equilibrium PointsDet(J)Tr(J)Stability
M1 (0, 0)+ESS
M2 (1, 0)++Unstable
M3 (1, 1)+ESS
M4 (0, 1)++Unstable
M5 (X*, Y*)+0Saddle point
Table 4. Payoff matrix for both players with the supervision of the central government.
When the Central Government Supervise Local Governments
River basin and strategiesUpstream governments
Protecting (X)Not protecting (1–X)
Downstream
governments
Compensating (Y) ( A 1 C 1 + S 1 , A 2 C 2 + S 2 ) ( D 1 F 1 , B 2 C 2 + S 2 )
Not compensating (1–Y) ( B 1 C 1 + S 1 , D 2 F 2 ) ( F 1 , F 2 )
Table 5. Equilibrium points of determinants and traces (with the supervision of the central government).
Equilibrium PointsDet(J)Tr(J)Stability
N1 (0, 0)+Unstable
N2 (1, 0)++Unstable
N3 (1, 1)+ESS
N4 (0, 1)++Unstable
N5 (X*, Y*)+0Saddle point
Table 6. Weightings of different water grade categories.
Water Quality GradesClass IClass IIClass IIIClass IVClass V
Weights12345
Table 7. The marginal effect of industrial value added under different kernel functions.
Kernel FunctionMarginal Effect (Million)
CNYUSD
Epanechnikov1848.57291.33
Gaussian1086.31171.20
Quadratic1269.54200.08
Publisher’s Note: MDPI stays neutral with regard to jurisdictional claims in published maps and institutional affiliations.

