
Feasibility Analysis of Energy Recovery Using PATs in Water Distribution Networks
by
 , , , ,
Ethan Pillay
1 ,
,
Muthukrishnavellaisamy Kumarasamy
1,*,
Joy Adu
1,
Saravana Prakash Thirumuruganandham
2,*,
Ayesha Paruk
1 and
Maranka Naidoo
1 1
Civil Engineering Programme, School of Engineering, University of KwaZulu-Natal, Durban 4041, South Africa
2
Centro de Investigación de Ciencias Humanas y de la Educación (CICHE), Facultad de Ingenieria y Tecnologias de la Informacion y la Comunicacion, Universidad Tecnologica Indoamerica, Ambato PC180151, Ecuador
*
Authors to whom correspondence should be addressed.
Water 2022, 14(7), 1150; https://doi.org/10.3390/w14071150
Submission received: 10 January 2022
/
Revised: 15 March 2022
/
Accepted: 25 March 2022
/
Published: 2 April 2022
(This article belongs to the Section Water-Energy Nexus)
Abstract
:Power generation is becoming an increasing problem in South Africa. South Africa produces approximately 90% of its electricity from coal-fired power stations and only 5% from hydroelectric power stations and pumped storage. Durban has a very steep topography, which results in high pressure in certain parts of the water distribution network (WDN). Leakage is costly and contributes to a large extent to non-revenue water (NRW) in the network. Pressure reducing valves (PRVs) are used in WDNs to control the pressure in the pipework to reduce leakage. This excess pressure can be used to generate electricity by a pump acting as a turbine (PAT). The electricity generated is a function of the flow rate and the pressure reduction through the PAT. The hydraulic modelling software EPANET 2.2 is used for the analysis of the Cornubia Integrated Human Settlement Development Phase 2A WDN in Durban. EPANET is used to determine the strategic placement of PATs in the WDN and their setting and configuration to extract the most energy and reduce pressure in the system. A configuration of five PATs of different sizes extracts a total power output of 166.31 kW and reduces leakage in the WDN by 45.59 kL per month, which is an 18.16% reduction in leakage.
1. Introduction
The growing population requires a sustainable source of energy and fresh water to meet their needs. New technologies are being used to meet the energy demand by using renewable energy sources such as hydropower and solar power plants [1]. The power generated from the flow of water generates approximately 16% of the world’s electricity [1]. Renewable energy generation can be achieved by recovering energy through pressure gradients in existing systems, such as water distribution networks [1]. WDNs are under high pressure, which leads to negative effects on pipelines, such as damage and leaks [2,3]. These negative effects shorten the operating life and increases the maintenance cost of the WDN. In order to regulate the pressure inside the WDN, pressure management options need to be implemented. Marchis et al. [4] stated that energy could be recovered by introducing mini and micro hydroelectric power plants in various WDNs, but the machines are very costly, which makes them an unfavourable solution for energy recovery. In South Africa, the cost of renewable energy is R1.2/kWh (USD 0.084/kWh) using the least-cost model [5]. The cost of purchasing electricity for the domestic consumer in South Africa is R2.03/kWh (USD 0.138/kWh) [6]. According to the Department of Energy, the renewable energy feed-in tariff (REFIT) for small hydro power plants less than 10 MW is R0.94/kWh (USD 0.121/kWh) as of 2010 [7]. With an escalation of 8% per year, REFIT can be calculated as R2.03/kWh (USD 0.138/kWh). Marchis et al. [4] also mention that a pump, which is readily available, can be used in reverse as a turbine, which is a cost-effective alternative to conventional hydro turbines. Using a pump as a turbine (PAT) is a sustainable method of pressure control with the added benefit of power generation [3,8]. Derakhshan and Nourbakhsh [9,10] have shown that centrifugal pumps with different speeds, different flow rates and heads can work as turbines [4]. Carravetta et al. [11] mentioned that a series-parallel combination can be used for PATs. In this case, a PAT control and isolation valve is connected in series before the PAT and a bypass control valve is connected in parallel with the PAT. This prevents PAT from being damaged at high heads as the control valve relieves some of the excess pressure. The bypass control valve bypasses the PAT during periods of high discharge when the pressure drop created by the PAT is greater than the supply head. The PAT can reduce the energy cost of WDNs and provide financial benefits to the community if the excess energy is sold [3].
This paper focuses on the implementation of PATs in the Cornubia Integrated Human Settlement Development Phase 2A to reduce the pressure within the network to an acceptable pressure at certain points, as well as to harness energy and reduce leakage in the network. The cost of water in South Africa is high and the availability of water is becoming increasingly scarce. Due to poor management of leaks in the water distribution network, eThekwini Municipality lost approximately 237 million L of water per day in 2013/2014 [12]. The need for optimal water distribution and leakage detection is clearly evident. Reducing leakage in the WDN results in water savings for communities and ensuring that all users connected to the WDN receive an appropriate water pressure from the system. Excess pressure in the WDN can cause damage to the pipes and connections in the WDN [13]. The recommended minimum pressure head in the WDN in South Africa is 24 m [14,15]. Finding the optimal location for PAT leads to the highest energy generation and pressure reduction opportunities. Fontana et al. [16] analysed a WDN for energy recovery potential by replacing PRVs with PATs using a multi-objective approach. De Marchis and Freni [17] showed that identifying optimal installation points for PATs is easy through hydraulic regulations in a small WDN. De Marchis et al. [18] used a hydrodynamic modelling approach to simulate complex WDN for the optimal positioning of PATs. The optimal placement of a PAT for energy generation would be at sections of the pipeline with the combination of the highest available head and flow. Thus, this research considers the use of EPANET simulation to identify the best scenario with PATs for maximum energy recovery and to reduce leakage as a secondary benefit.
2. Methodology
2.1. The Relationship between Pressure Reduction and Leakage Rate in a WDN
Pipes can leak if the pipe breaks, if the joints fail or if the pressure inside the pipe is too high so that the pipe cracks. This is all related to the pressure within the system [4,16,18,19,20]. Excessive pressure within a pipe can increase the likelihood of pipe rupture and increase the rate at which water leaks from the pipe [13]. The cost of non-revenue water, which is the cost of water lost from the system, can be associated with leaks in the WDN [19]. The flow rate through the hole can be calculated as [20]:
where: q = flow rate from the hole or crack (leakage flow rate) (L/h), H = pressure head in the pipe (m), C = leakage coefficient constant, = leakage exponent constant. The leakage coefficient constant is based on the hole’s diameter, the material of the pipe and the effect of the contraction of the flow path that is downstream of the hole in the pipe. The leakage coefficient (C) of 0.614 can be adopted for a circular hole in the pipe [21]. The leakage exponent () is taken as 0.5 [20].
2.2. Determination of Leakage in WDNs
The main purpose of the WDN is to supply water to the consumer from the source. The difference between the amount of water supplied and the amount of water charged is called non-revenue water (NRW) [22]. NRW is made up of water losses and approved unbilled consumption; this also includes theft and incorrect water meters. South Africa’s NRW leakage is around 30% [23], which is equivalent to 85,000 ML/year [20]. Leakage is most commonly analysed using the Minimum Night Flow (MNF) method as it is considered the most accurate method for leakage detection [22]. The MNF is the lowest flow delivered to an isolated supply zone within the WDN. The lower the water consumption in the network, the higher the pressure in the system. Higher pressures should result in higher leakage in the system. The WDN can be split into smaller metered zones, referred to as a District Metered Area (DMA). Using experimental data, the relationship between the dimensionless leakage index parameter (LI) and the average night time zone pressure (AZNP) in a DMA can be represented as follows [22,24].
where AZNP is in meters (m). The LI enables the prediction of the night flow and leakage rates in the DMA due to pressure changes in the system. A network with a higher LI requires greater attention than a network with a low LI. The Background Night Leakage, which is leakage occurring during low demand, particularly during the night, and is measured in litres per hour, is calculated as follows [22,24]:
where BLN = Background Night Leakage (litres per day), PCF = Pressure Correction Factor related to the AZNP shown in Table 1, C1, C2 and C3 are leakage constants, shown in Table 2, L = length of the pipeline (km), N = number of service connections.
The primary purpose of introducing PATs in the WDN is the generation of electricity using excess pressure within the system. The secondary benefit of PATs in the WDN is to reduce the pressure within the network, thereby reducing the leakage in the network and NRW volumes [3]. The optimal placement of PATs within the WDN must be determined to minimise the cost of purchase, installation and maintenance. According to [14], the minimum head at instantaneous peak load must be at least 24 m; the maximum head at zero discharge is 90 m. After the installation of a PAT, no pipes should have a negative pressure. For this particular case, any pressure reduction that results in a pressure in the system greater than 24 m at the nodes is accepted [25]. The setting of PAT, which leads to the highest pressure reduction before negative downstream conditions form, can be considered as the optimal setting of the PATs in the WDN. PATs are set to their optimal pressure reduction capability during the analysis. Power generated by a PAT is determined by the volumetric flow and pressure reduction across the PAT [26]. The power generated by the PAT is at its best efficiency point (BEP) [16,27], where the PAT is optimally generating electricity. Pump characteristic curves are used to represent the physical characteristics of the pump. When a pump operates in turbine mode, the flow increases with increasing head [4,16]. The efficiency was calculated using the empirical relationship by Derakhshan and Nourbakhsh [9,10]. The BEP of a PAT can be said to coincide with the pump’s BEP [9,10,16,17]. A PAT should be operated at its BEP to optimise its energy output and minimise costs [4,16,27]. Different pumps have been chosen for this network that operate at their BEP at different head and flow rate combinations. The power generated by each PAT has been calculated by a pump that is operating at its BEP for the specific location’s network conditions.
2.3. Determination of Electricity Generation and Profit of the PAT
EPANET software is used to analyse the hydraulic model of the Cornubia Phase 2A WDN. The network was designed for eThekwini Municipality [25]. Once a pipe is identified as a possible location to install a PAT, a parallel pipe with a PRV is placed in the EPANET software and the model is run. EPANET is not able to accurately model the PAT, so a PRV is implemented in the programme where a possible PAT is required. The flow rate and head reduction in the PRV are recorded. These values directly affect the power output of the PAT. Alternatively, general purpose valves (GPV) can be used in the EPANET model. However, this research focused on using PRV as found in the literature [18]. The results of the EPANET analysis are used to determine the power output of each PAT. The PATs are assumed to operate for 12 h per day. This was adopted by analysing water meter data within the network and as suggested in the literature [23]. The 12 h operation of the PATs is intended to account for pressure fluctuations within the pipeline throughout the day based on user demand [11]. It was adopted by analysing meter reading data of the network and nodal demands are assigned with demand multipliers to incorporate the variation in flow rate within the pipeline. This was considered to account for the fluctuations of flow during the peak demand periods. The EPANET simulated the network model as a step-wise steady state. This is a reasonable consideration, particularly for PATs, as suggested in the literature [11]. Operation 335 days per year was accounted for as there may be flow interruptions and no flow conditions, such as when the PAT is undergoing maintenance. PATs with a Capital Payback Period (CPP) of less than 2.5 years are considered feasible and are acceptable for the final design consideration, Scenario 6.
2.4. Feasibility and Cost Analysis of PAT Implementation
To determine the feasibility of implementing a PAT in the WDN, the annual life cycle cost (ALCC) must be analysed. ALCCs include factors such as initial implementation costs, maintenance costs, water conservation factors, capital recovery factors resulting from the sale of generated power and other expenses associated with the project. The cost of a PAT is much lower than that of a hydro turbine, and pumps are readily available, less complex to operate and maintain and are mass-produced. Marchis et al. [4] concluded in their study that a CPP of around 2.5 years can be achieved if the PATs are located near the water supply node. A maximum CPP of 2.5 years is used to determine the feasibility of implementing PATs in the network. The pump installation cost was taken as 30% of the pump cost [4,16]. The price of the energy generation equipment (EGE) including installation cost was determined as follows
where CE = cost of equipment. The Civil Works (CW) was set at 30% of the value of the EGE for each PAT as follows
In the literature [4,16], it is suggested a quote range between 10 and 15% of the total cost. The maintenance cost (MC) was set at 15% of the value of the EGE and CW as follows in this case.
The Annual Yearly Energy Production (AYEP) is equal to the power generated per year by each PAT. The Annual Financial Savings (AF) is the selling price of the electricity multiplied by the annual electricity production minus the maintenance cost:
where CP = cost of purchasing electricity. The CPP is the time it takes to pay back the cost of the equipment [18]. It is calculated as follows:
3. Study Area Description
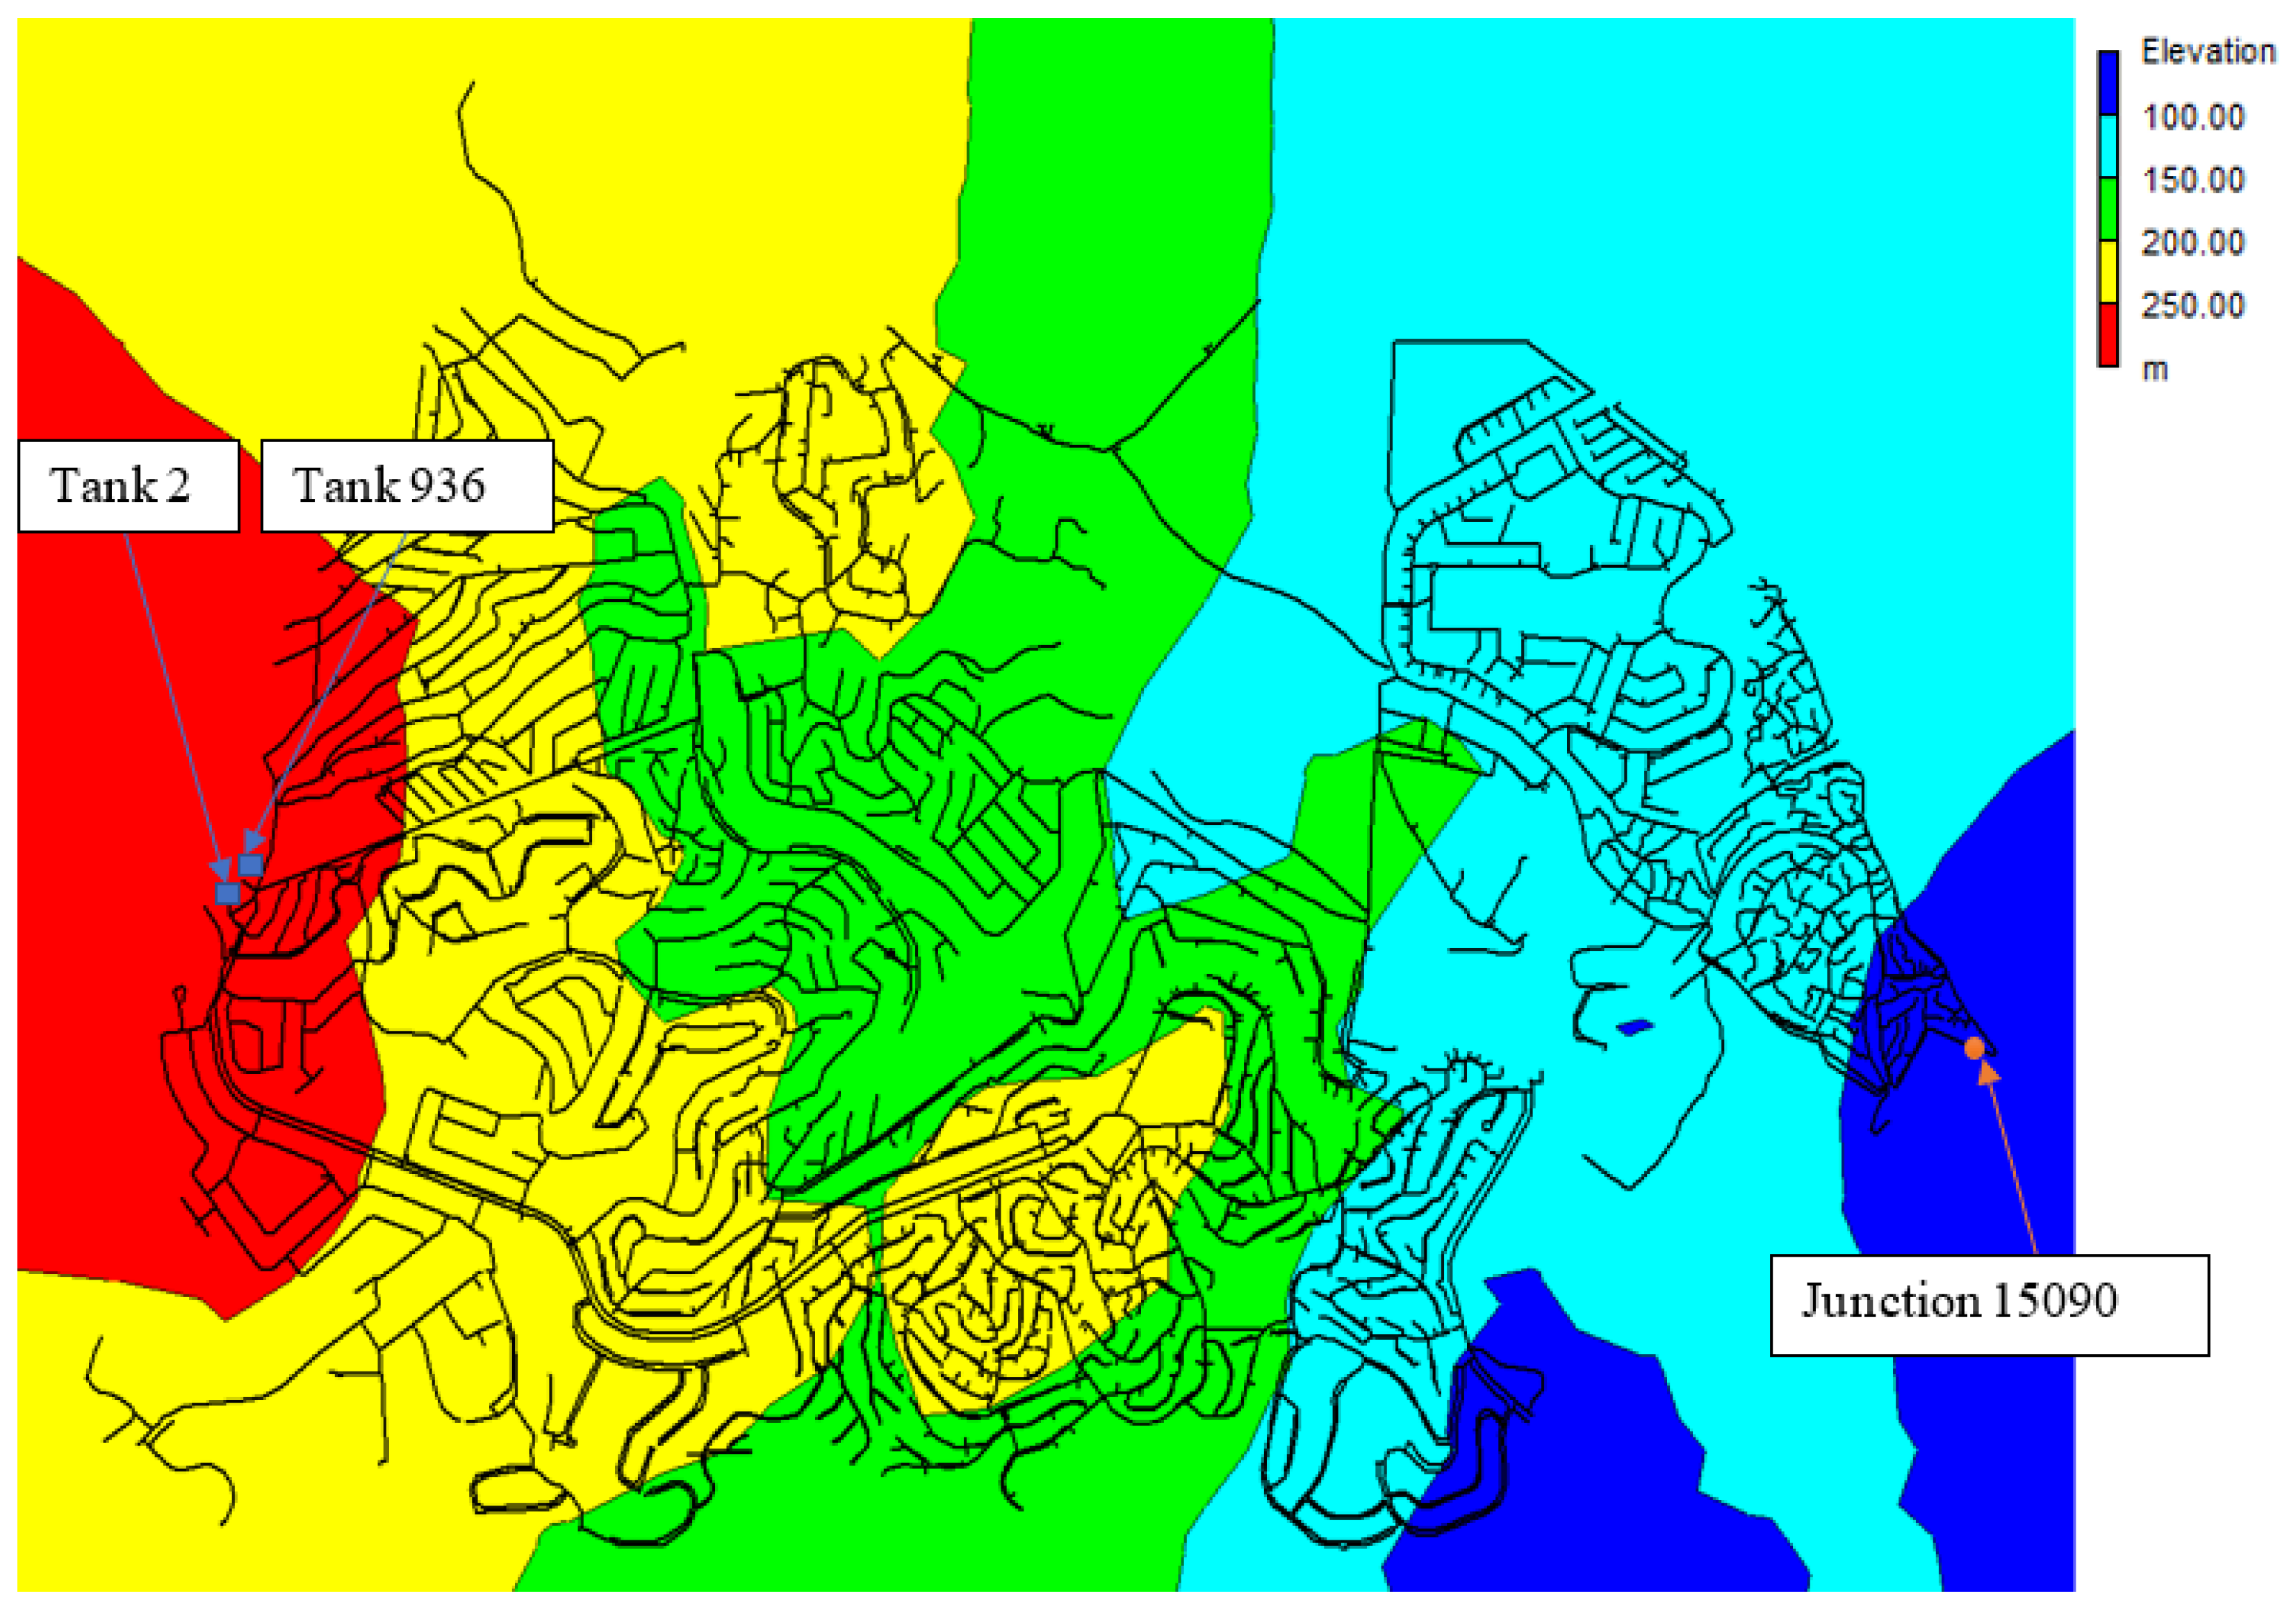
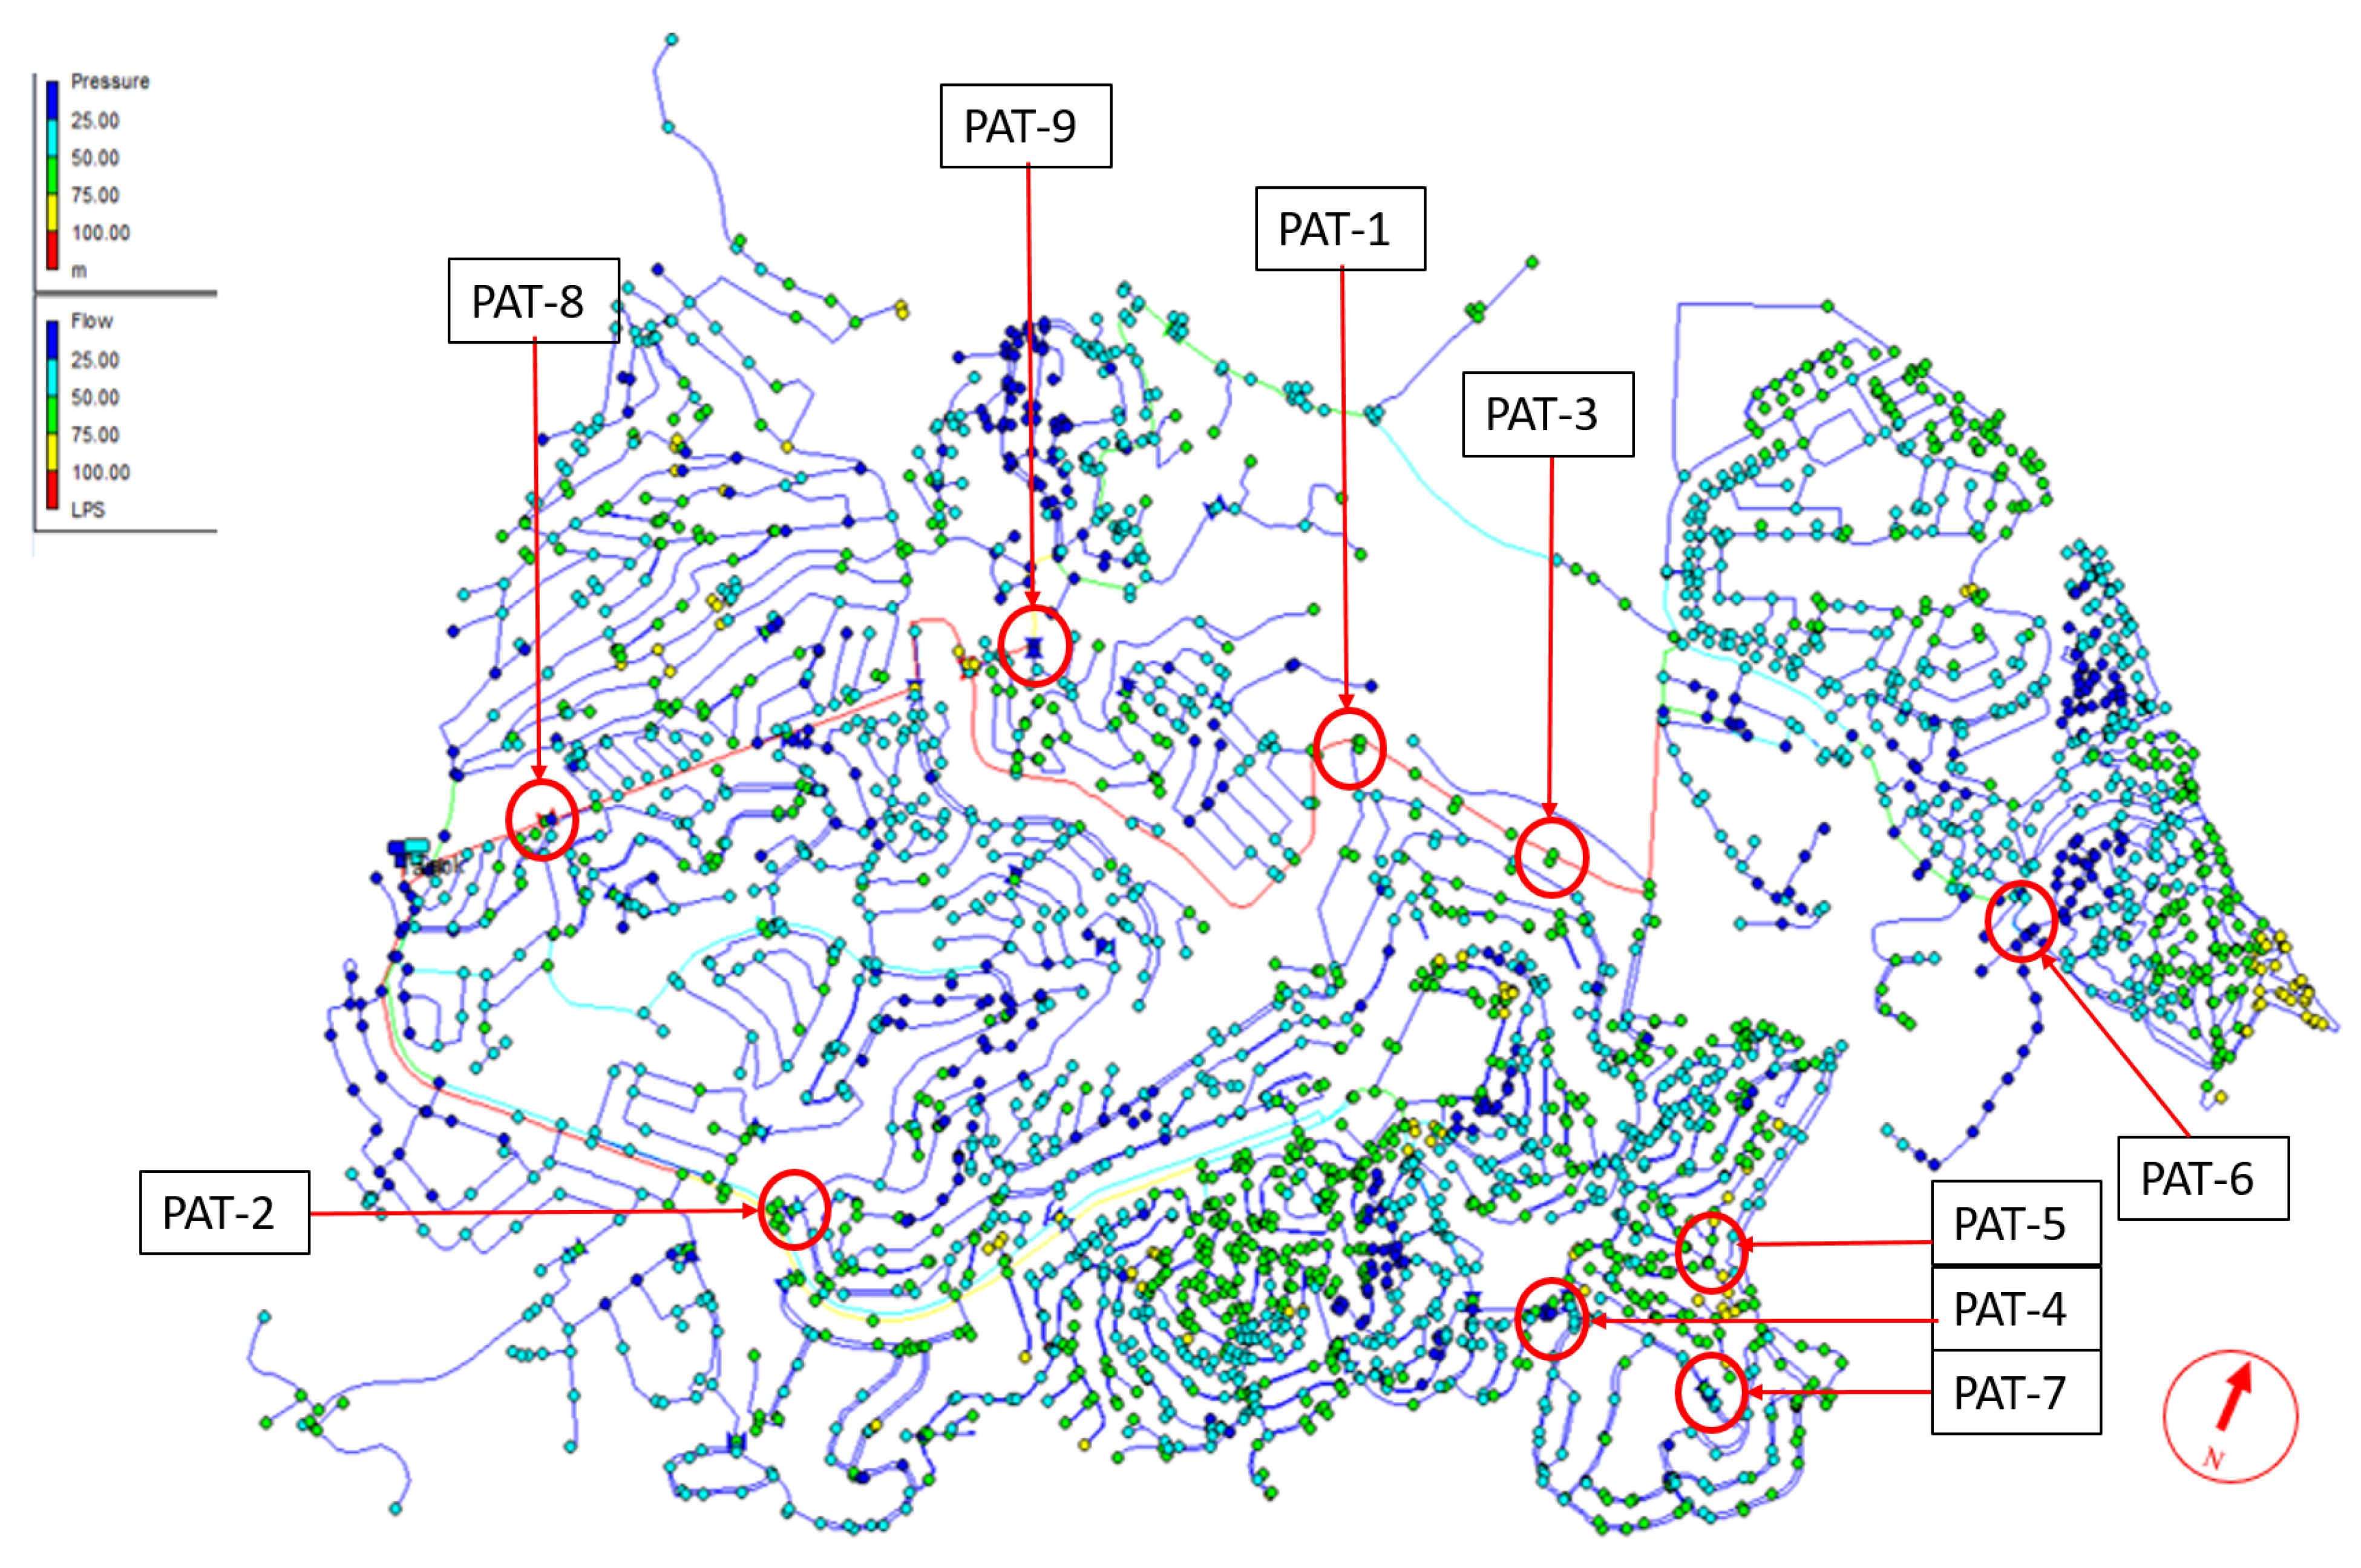
The proposed site is located in Cornubia with a Lat-Long of 29°42′26″ S and 31°03′17″ E, a mixed-use area north of Durban and south of King Shaka International Airport. Cornubia is very steep, with slopes that can exceed 25% at certain points [25]. Cornubia Phase 2A consists of 2461 government-subsidised houses of 40 m2 and a total population of 12,305 people. Each house has a 300 L yard tank with a water level of 6 m above the ground. The yard tanks are used to supplement the water supply to the households during peak hours when the desired flow rate might drop. Approximately 5900 m2 of the site is allocated for the proposed community facilities. This study focuses on part of the Cornubia development, specifically Zone 1 of Phase 2A. The Blackburn Reservoir feeds water into the mains via the 400 nominal diameter water main (DN), which runs to Cornubia Retail Park. DN400 is a temporary pipeline that will eventually connect to the existing network and Phoenix 1 reservoir. At least 17 m of head must be achieved under all flow conditions: average, peak and fire flow rates. These are measured pressure heads at the critical junctions and connection points within the network. The supply pressure head at the two inlet points of Blackburn Reservoir is nearly 30 m. The bed elevations at the two connection points on the DN400 pipeline are 103.84 m and 94.67 m above MSL. DN300 steel pipes were used for the main water intake points. These pipes have a roughness of 0.1 mm when applying the Darcy–Weisbach equation. The pipes of the internal network were modelled as DN110 and DN75 pipes made of uPVC SANS 966-1. The DN110 and DN75 uPVC pipes have a Darcy–Weisbach roughness of 0.03 mm. The elevations of the pipes were taken from Google Earth Pro. The network consists of seventy-five hydrants located along the DN110 and DN75 pipes. For the simulation, the characteristics of low-risk category 3 hydrants were considered [14]. The contour lines in Figure 1 show that the terrain is very steep. The highest elevation within the system is 297 m at Tank 2 and Tank 936 (shown in red), while the lowest elevation is 66 m at Junction 15,090 (shown in dark blue). This results in a total elevation difference of 231 m. This network is a gravity network. Figure 2 shows the flow rate in each pipe and the pressure head at each junction. This was used to determine the possible location of all PATs in the WDN, as shown in Figure 2. It should be noted that a PAT must be placed in a pipe with a high flow rate and that the junctions on both sides of the pipe must have a high pressure head.
4. Summary of Results
The installation of PATs makes the most sense if they are feasible when placed in the main lines of the WDNs, since these lines have high flow rates and high pressure heads. These regions within the pipeline have excess pressures above the minimum of 24 m described in [14]. These PATs were used in different configurations for a higher energy extraction from the WDN with six scenarios. Each scenario consists of combinations of PATs at appropriate places based on initial simulation. The maximum energy extraction potential was analysed by comparing various scenarios against the network with no PATs, i.e., Scenario 1. Scenarios 2–6 consists of single and multiple PAT combinations. These were chosen based on identified critical pressure zones within the network after initial simulation. Table 3 shows the various scenarios, their PAT combinations and the results of the power generated by each PAT and the CPP for each PAT. A CPP longer than 2.5 years and CPPs that are not feasible (negative) are highlighted in brown. CPPs under 2.5 years that are not highlighted indicate that the PAT is feasible for implementation in the WDN. Detailed descriptions of scenarios are provided in the following sections.
4.1. Scenario 1
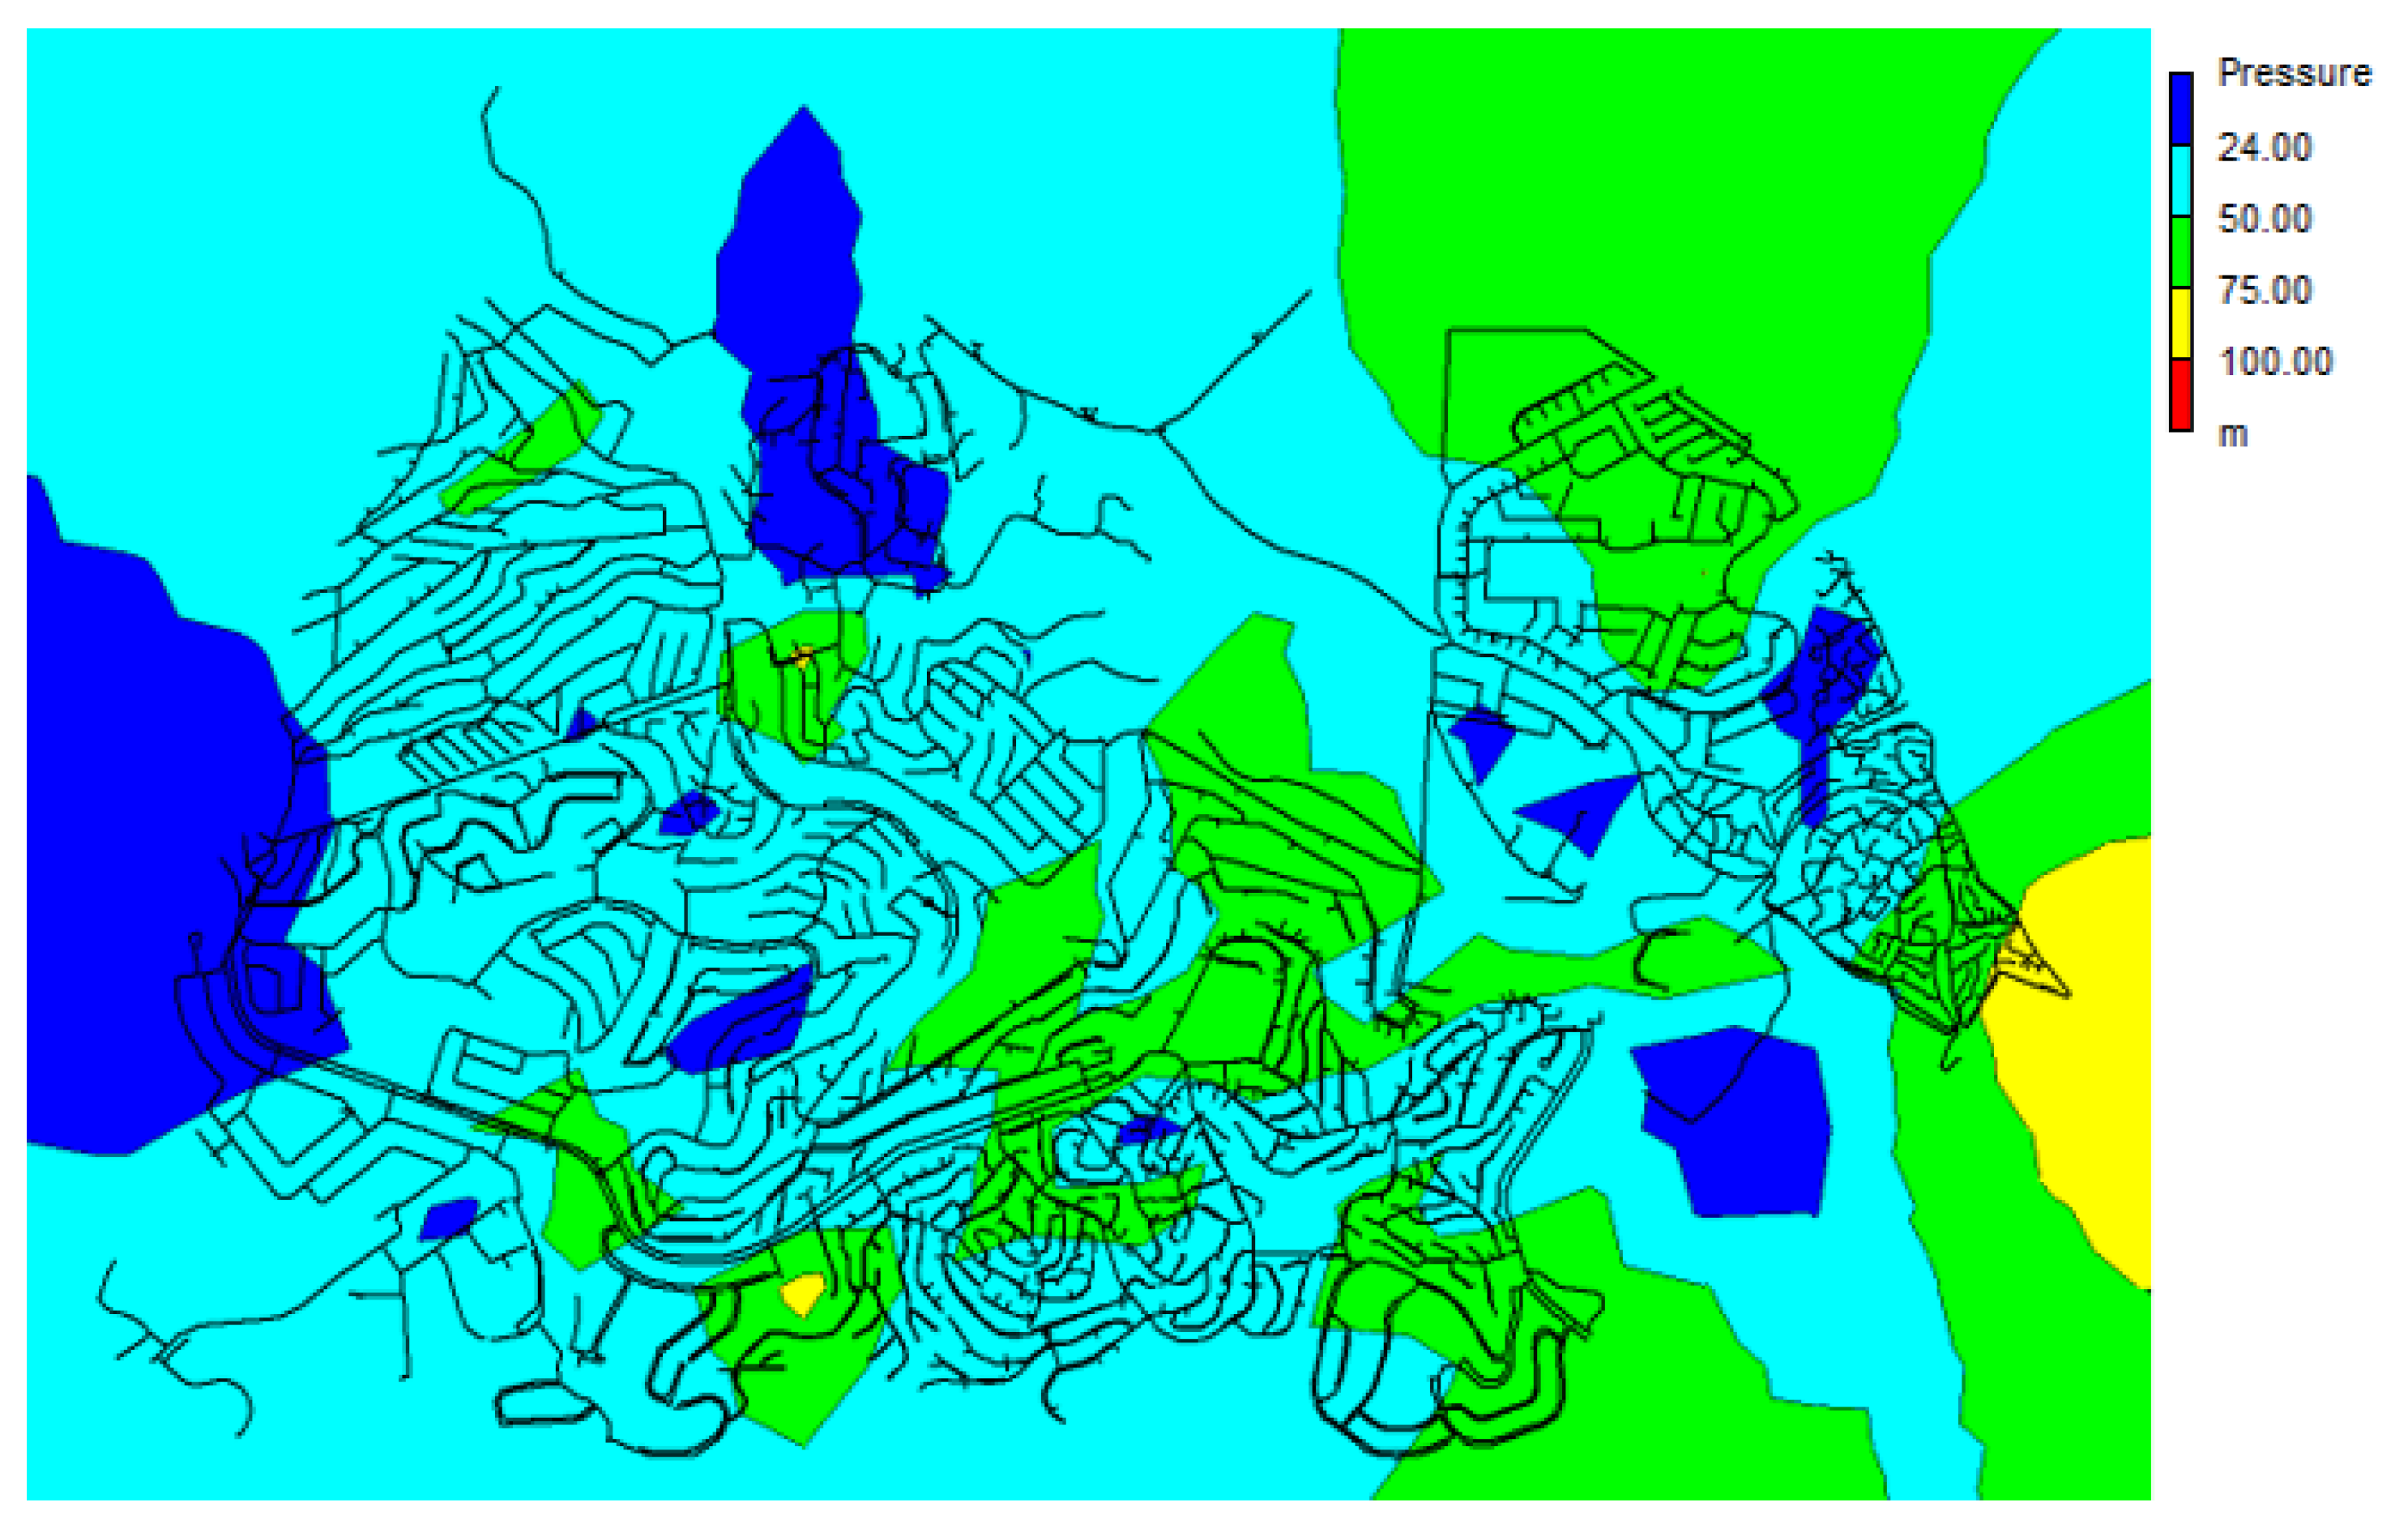
The WDN was initially analysed without the implementation of PATs in the WDN. This is considered as a control experiment that allows the identification of critical pressure zones for the possible locations of PATs within the WDN. The locations marked in green or yellow in Figure 3 represent lines with excess pressure head that can be extracted by implementing a PAT. For this study, the optimal location of the PATs will be in these two elevation regions.
4.2. Scenario 2
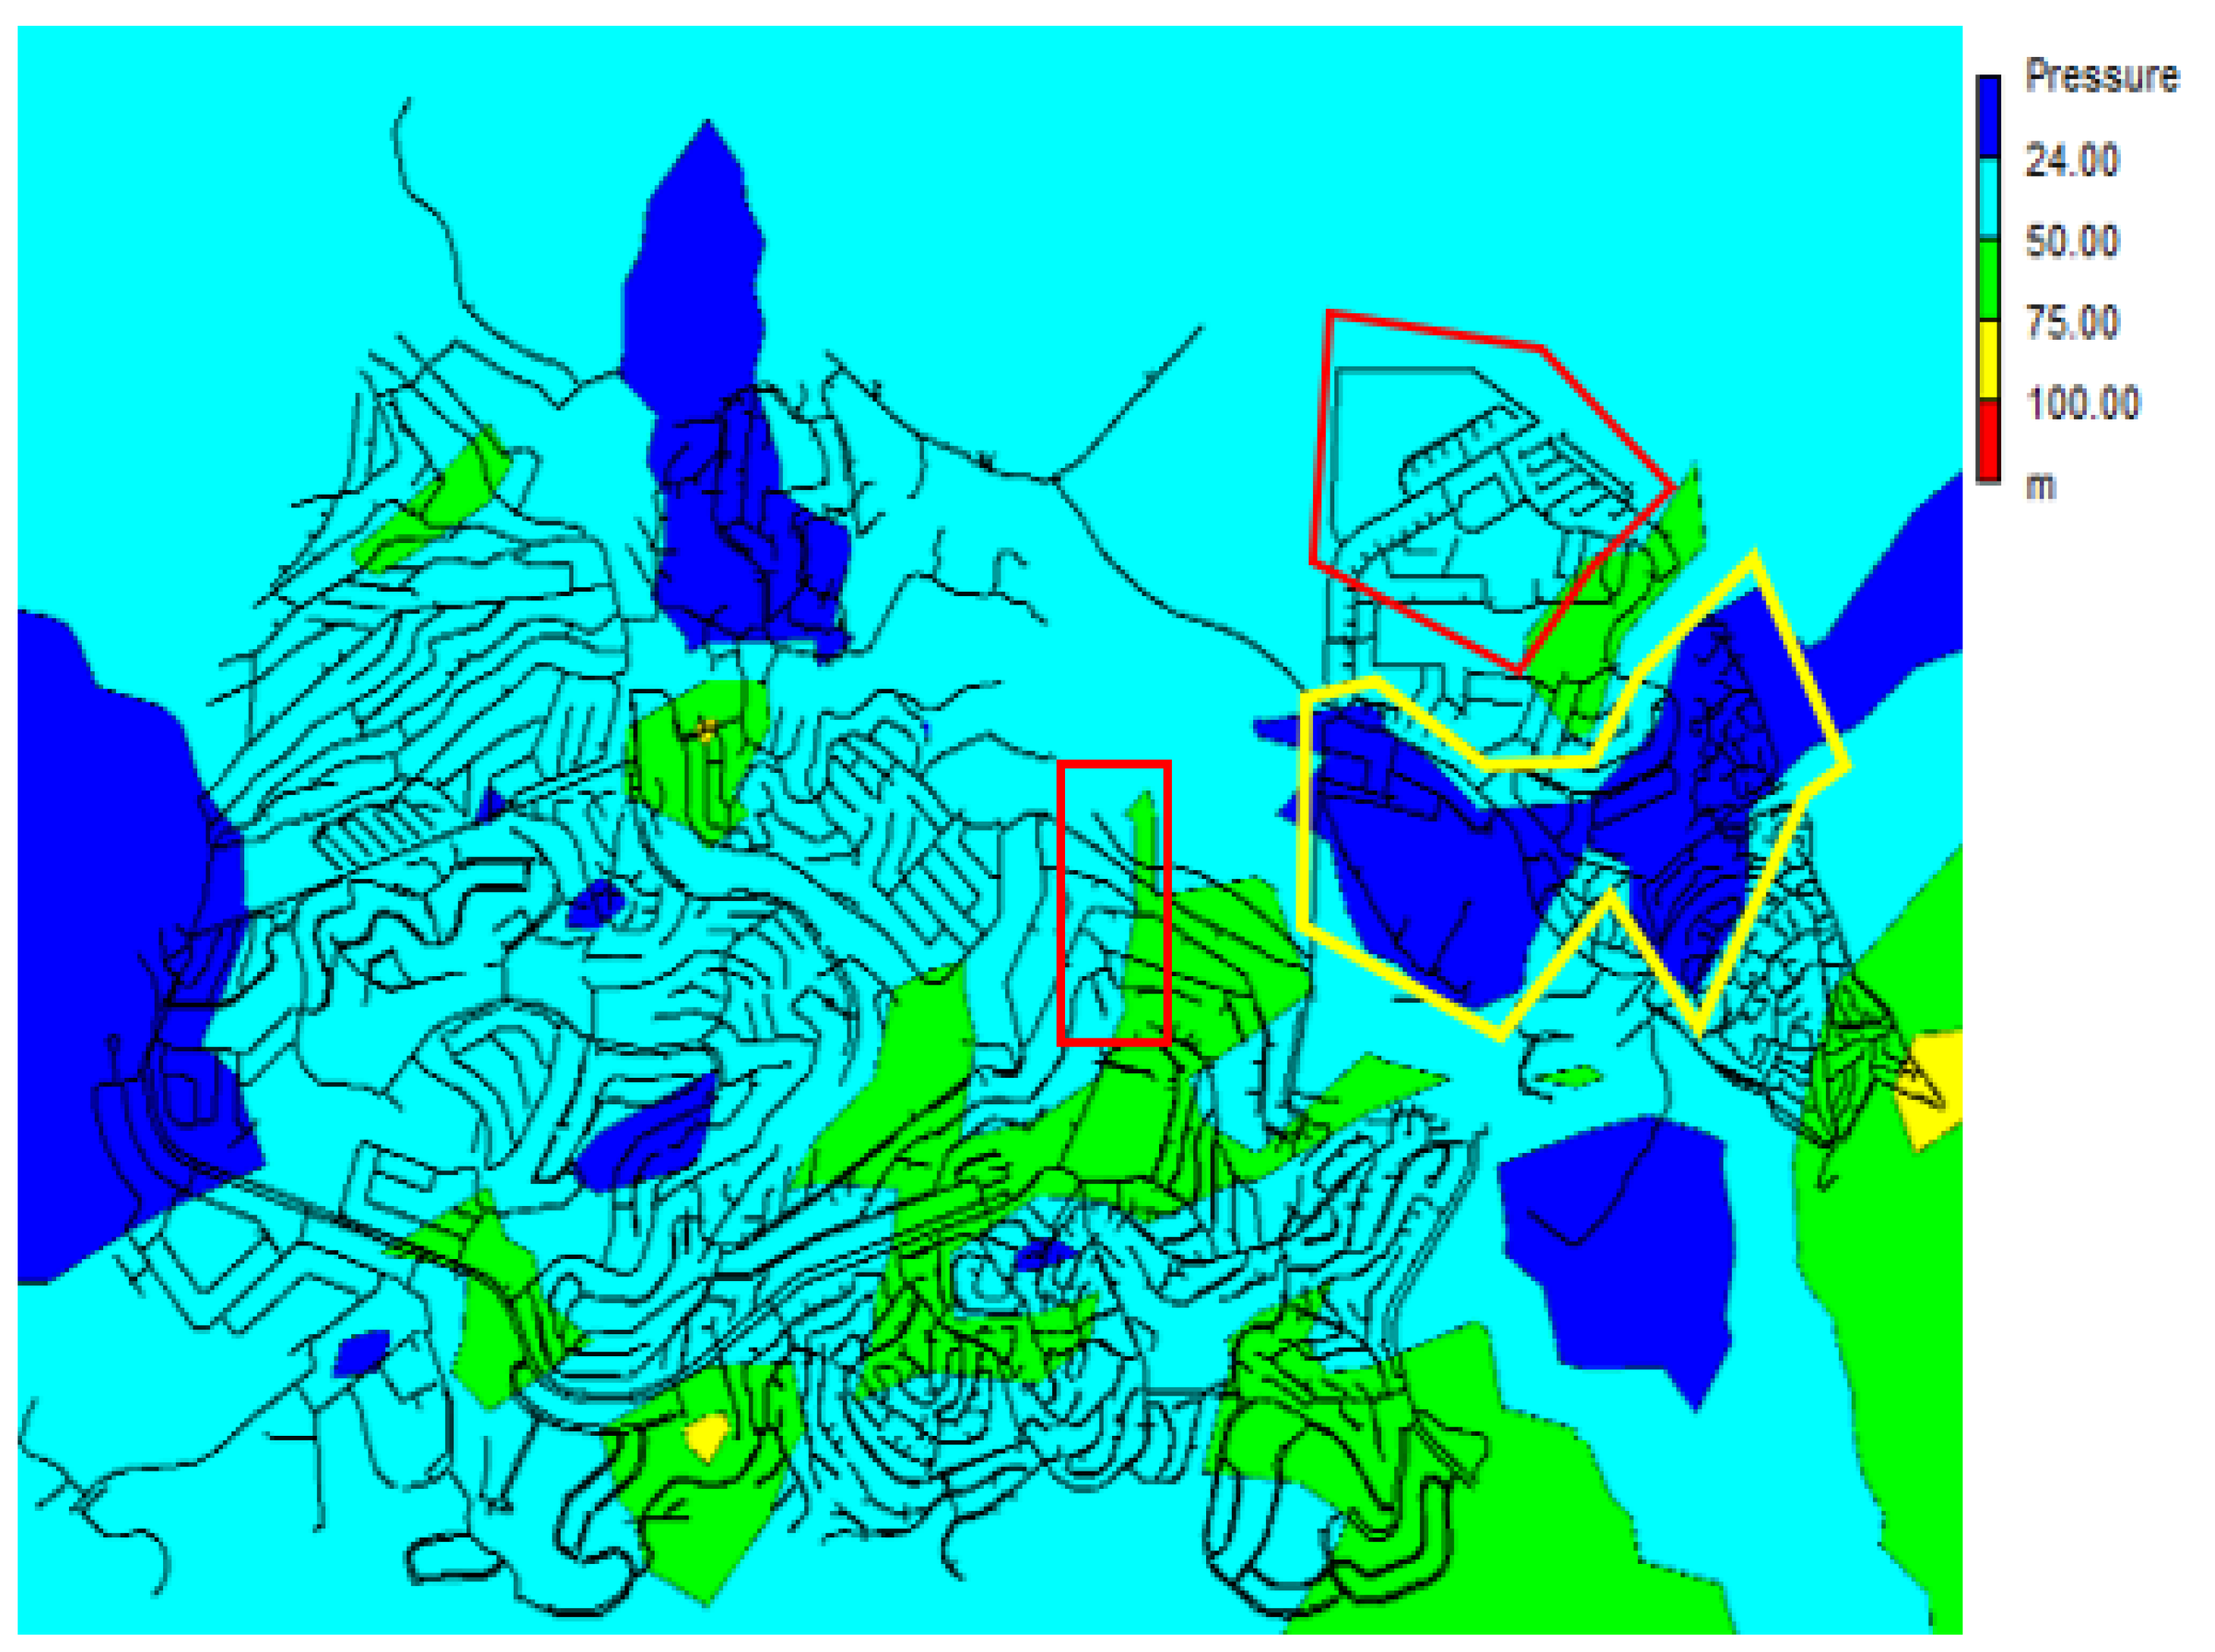
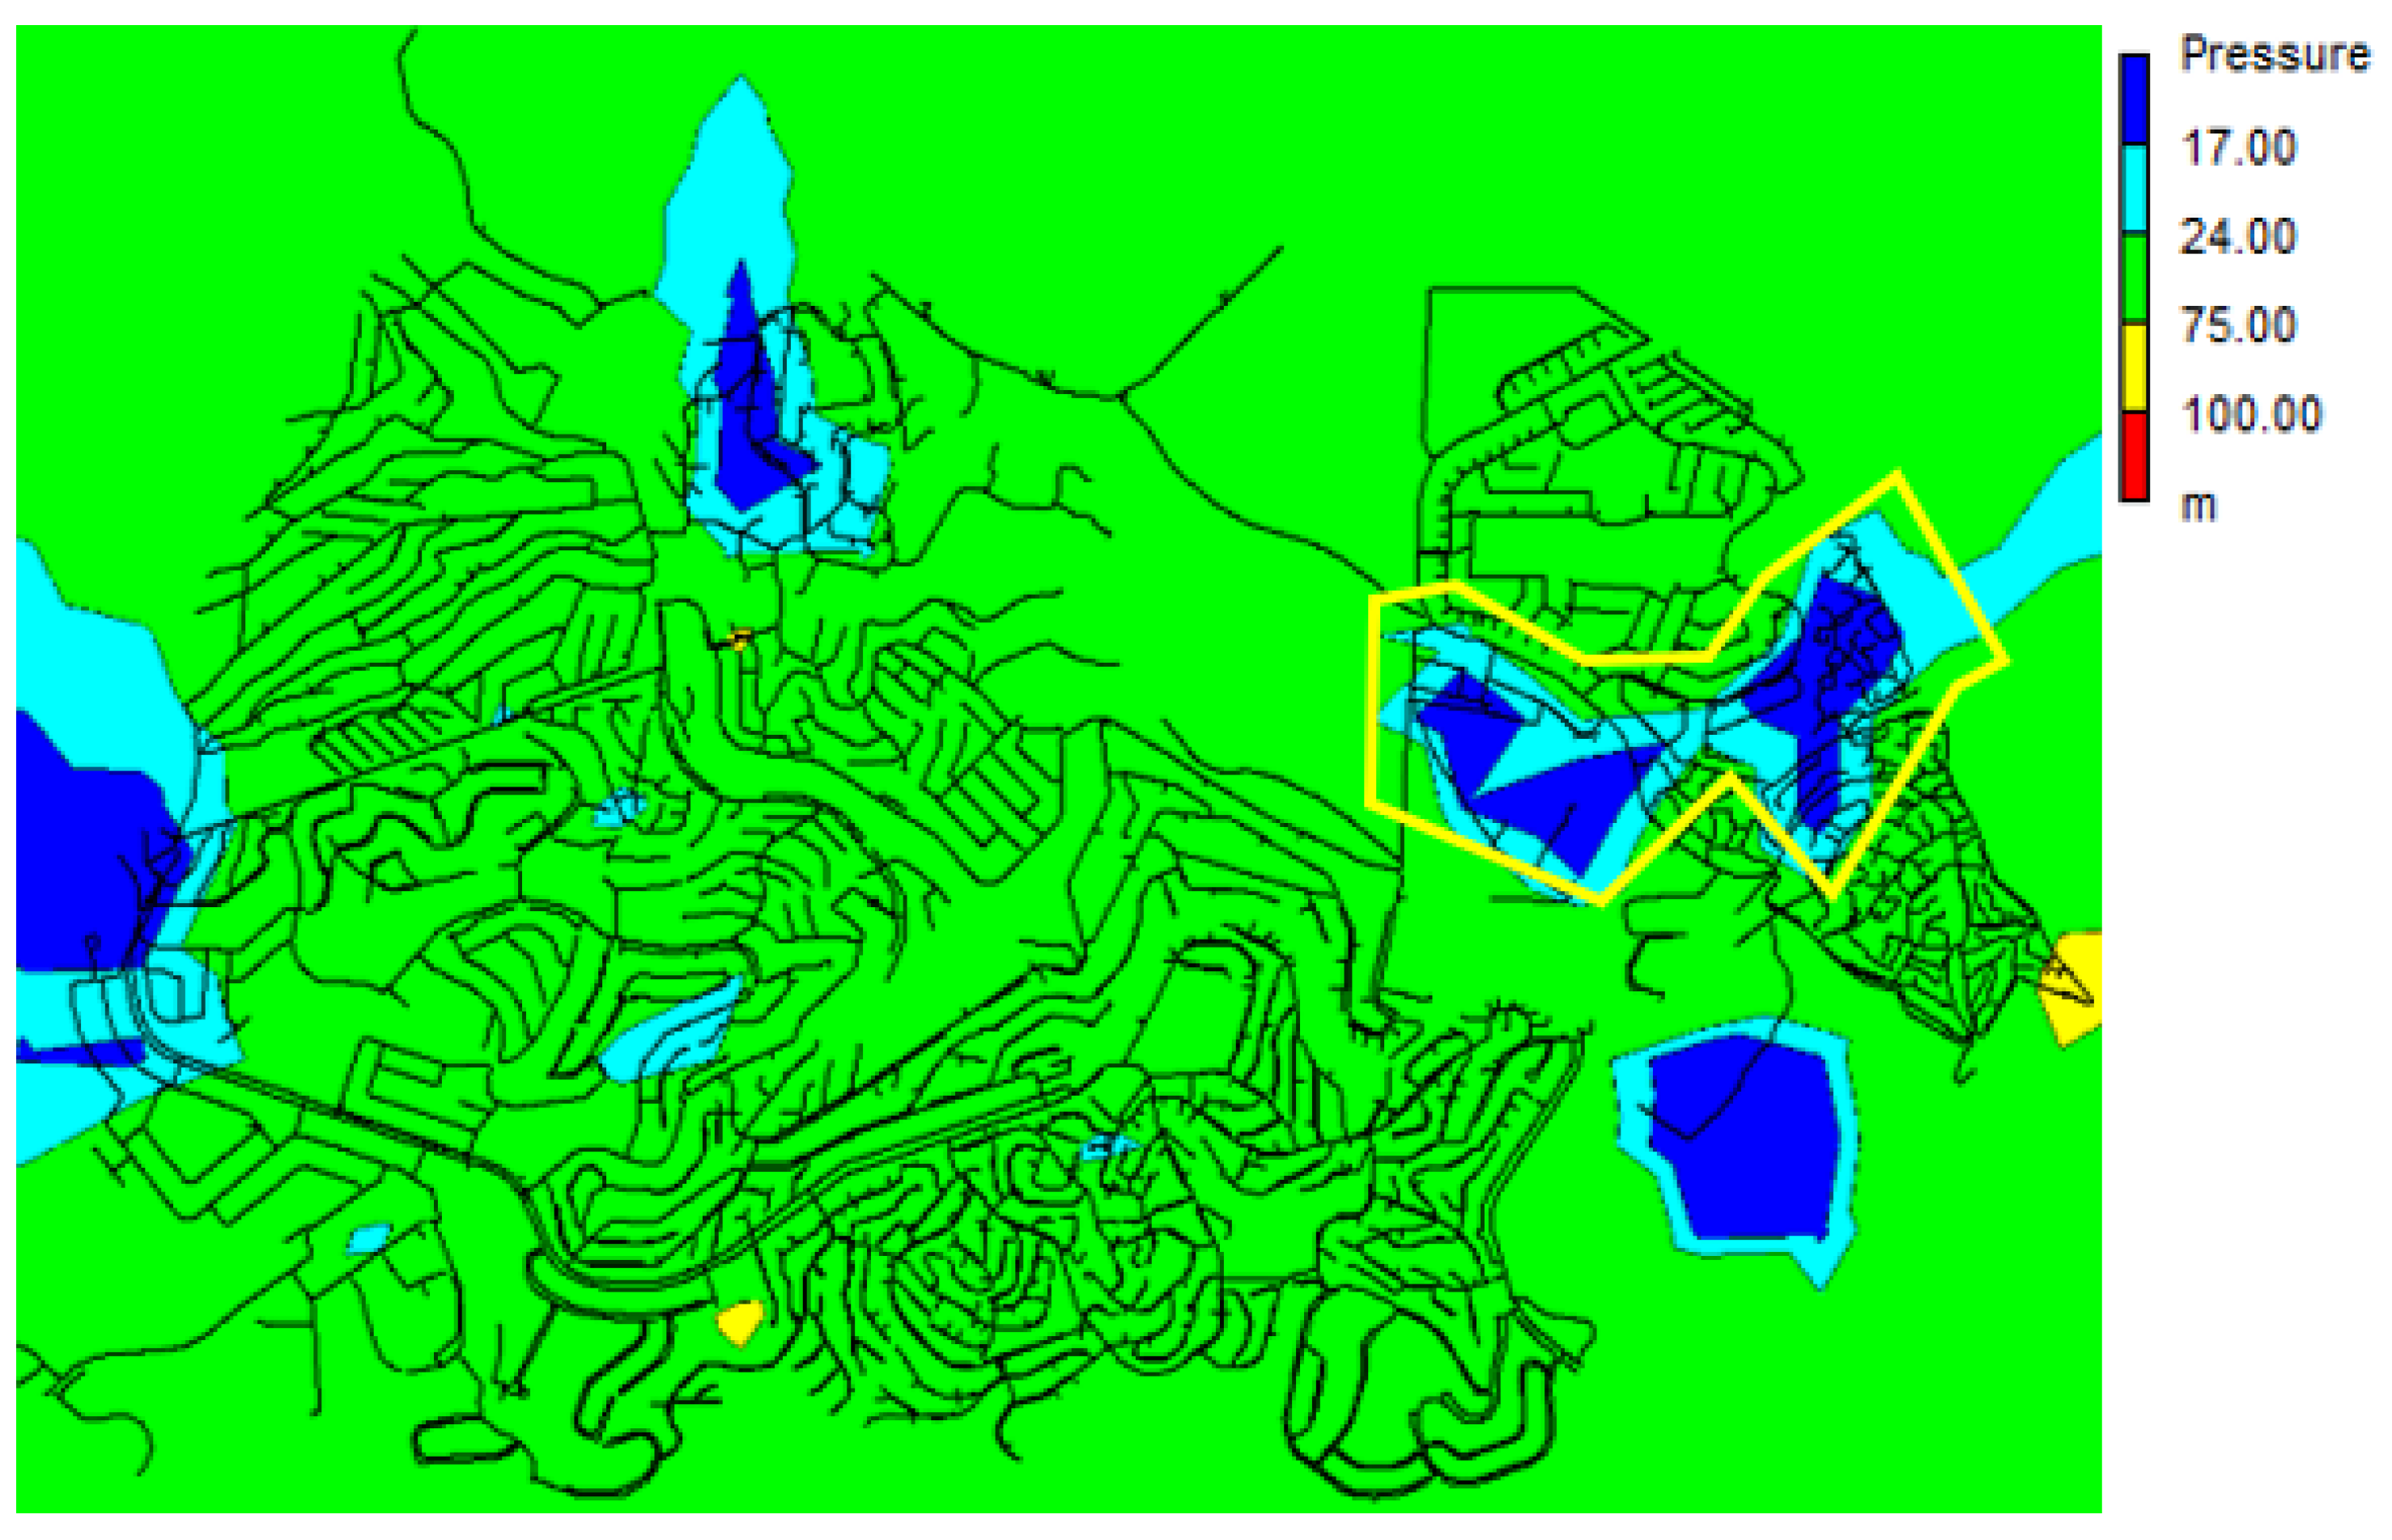
In Scenario 2, a PAT is implemented in the network, namely PAT-1. This scenario is used to study the behaviour of a single PAT in the system and its impact on downstream flow conditions and pressures. Figure 4 shows the effect of PAT-1 on the pressure head in the pipes within the WDN. A setting of 45 m was used for PAT-1. The pressure within the areas outlined in red was successfully reduced to an acceptable level and the area outlined in yellow has a pressure below 24 m. Figure 5 shows that the pipes within the yellow outlined area have a pressure between 17 m and 24 m. According to [25], pressures up to 17 m can be accepted, so the installation of PAT-1 is acceptable. The pressure reduction by PAT is 11.89 m. The power generated by PAT-1 is 13.56 kW. The CPP for PAT-1 is 1.11 years. This CPP is less than the 2.5 years generally reported for PATs [4], so this PAT is acceptable for Scenario 6.
4.3. Scenario 3
The accepted PATs from Scenario 3 form configuration “A”. As shown in Table 3, three PATs are implemented in the network in Scenario 3: PAT-1, PAT-2 and PAT-3. Figure 6 shows the impact of PAT-2 on the pressure head in the WDN. The pressure within the areas outlined in red was successfully reduced to an acceptable level. A setting of 24 m was used for PAT-2. This is the minimum required pressure according to [14]. The pressure reduction by PAT-2 is 32.8 m. The power generated by PAT-2 is 16.65 kW. The CPP for PAT-2 is 0.95 years. This CPP is less than 2.5 years [4], so PAT-2 can be accepted for Scenario 6. For PAT-3, a setting of 52 m was specified. This is the minimum requirement for PAT-3 that does not result in negative pressure downstream in the WDN. The pressure reduction due to PAT-3 is 1.24 m. The power generated by PAT-3 is 1.24 kW. The CPP for PAT-3 is negative and therefore not feasible. This results in PAT-3 being rejected for Scenario 6. Therefore, configuration “A” consists of PAT-1 and PAT-2. Configuration A has a total power of 30.21 kW.
4.4. Scenario 4
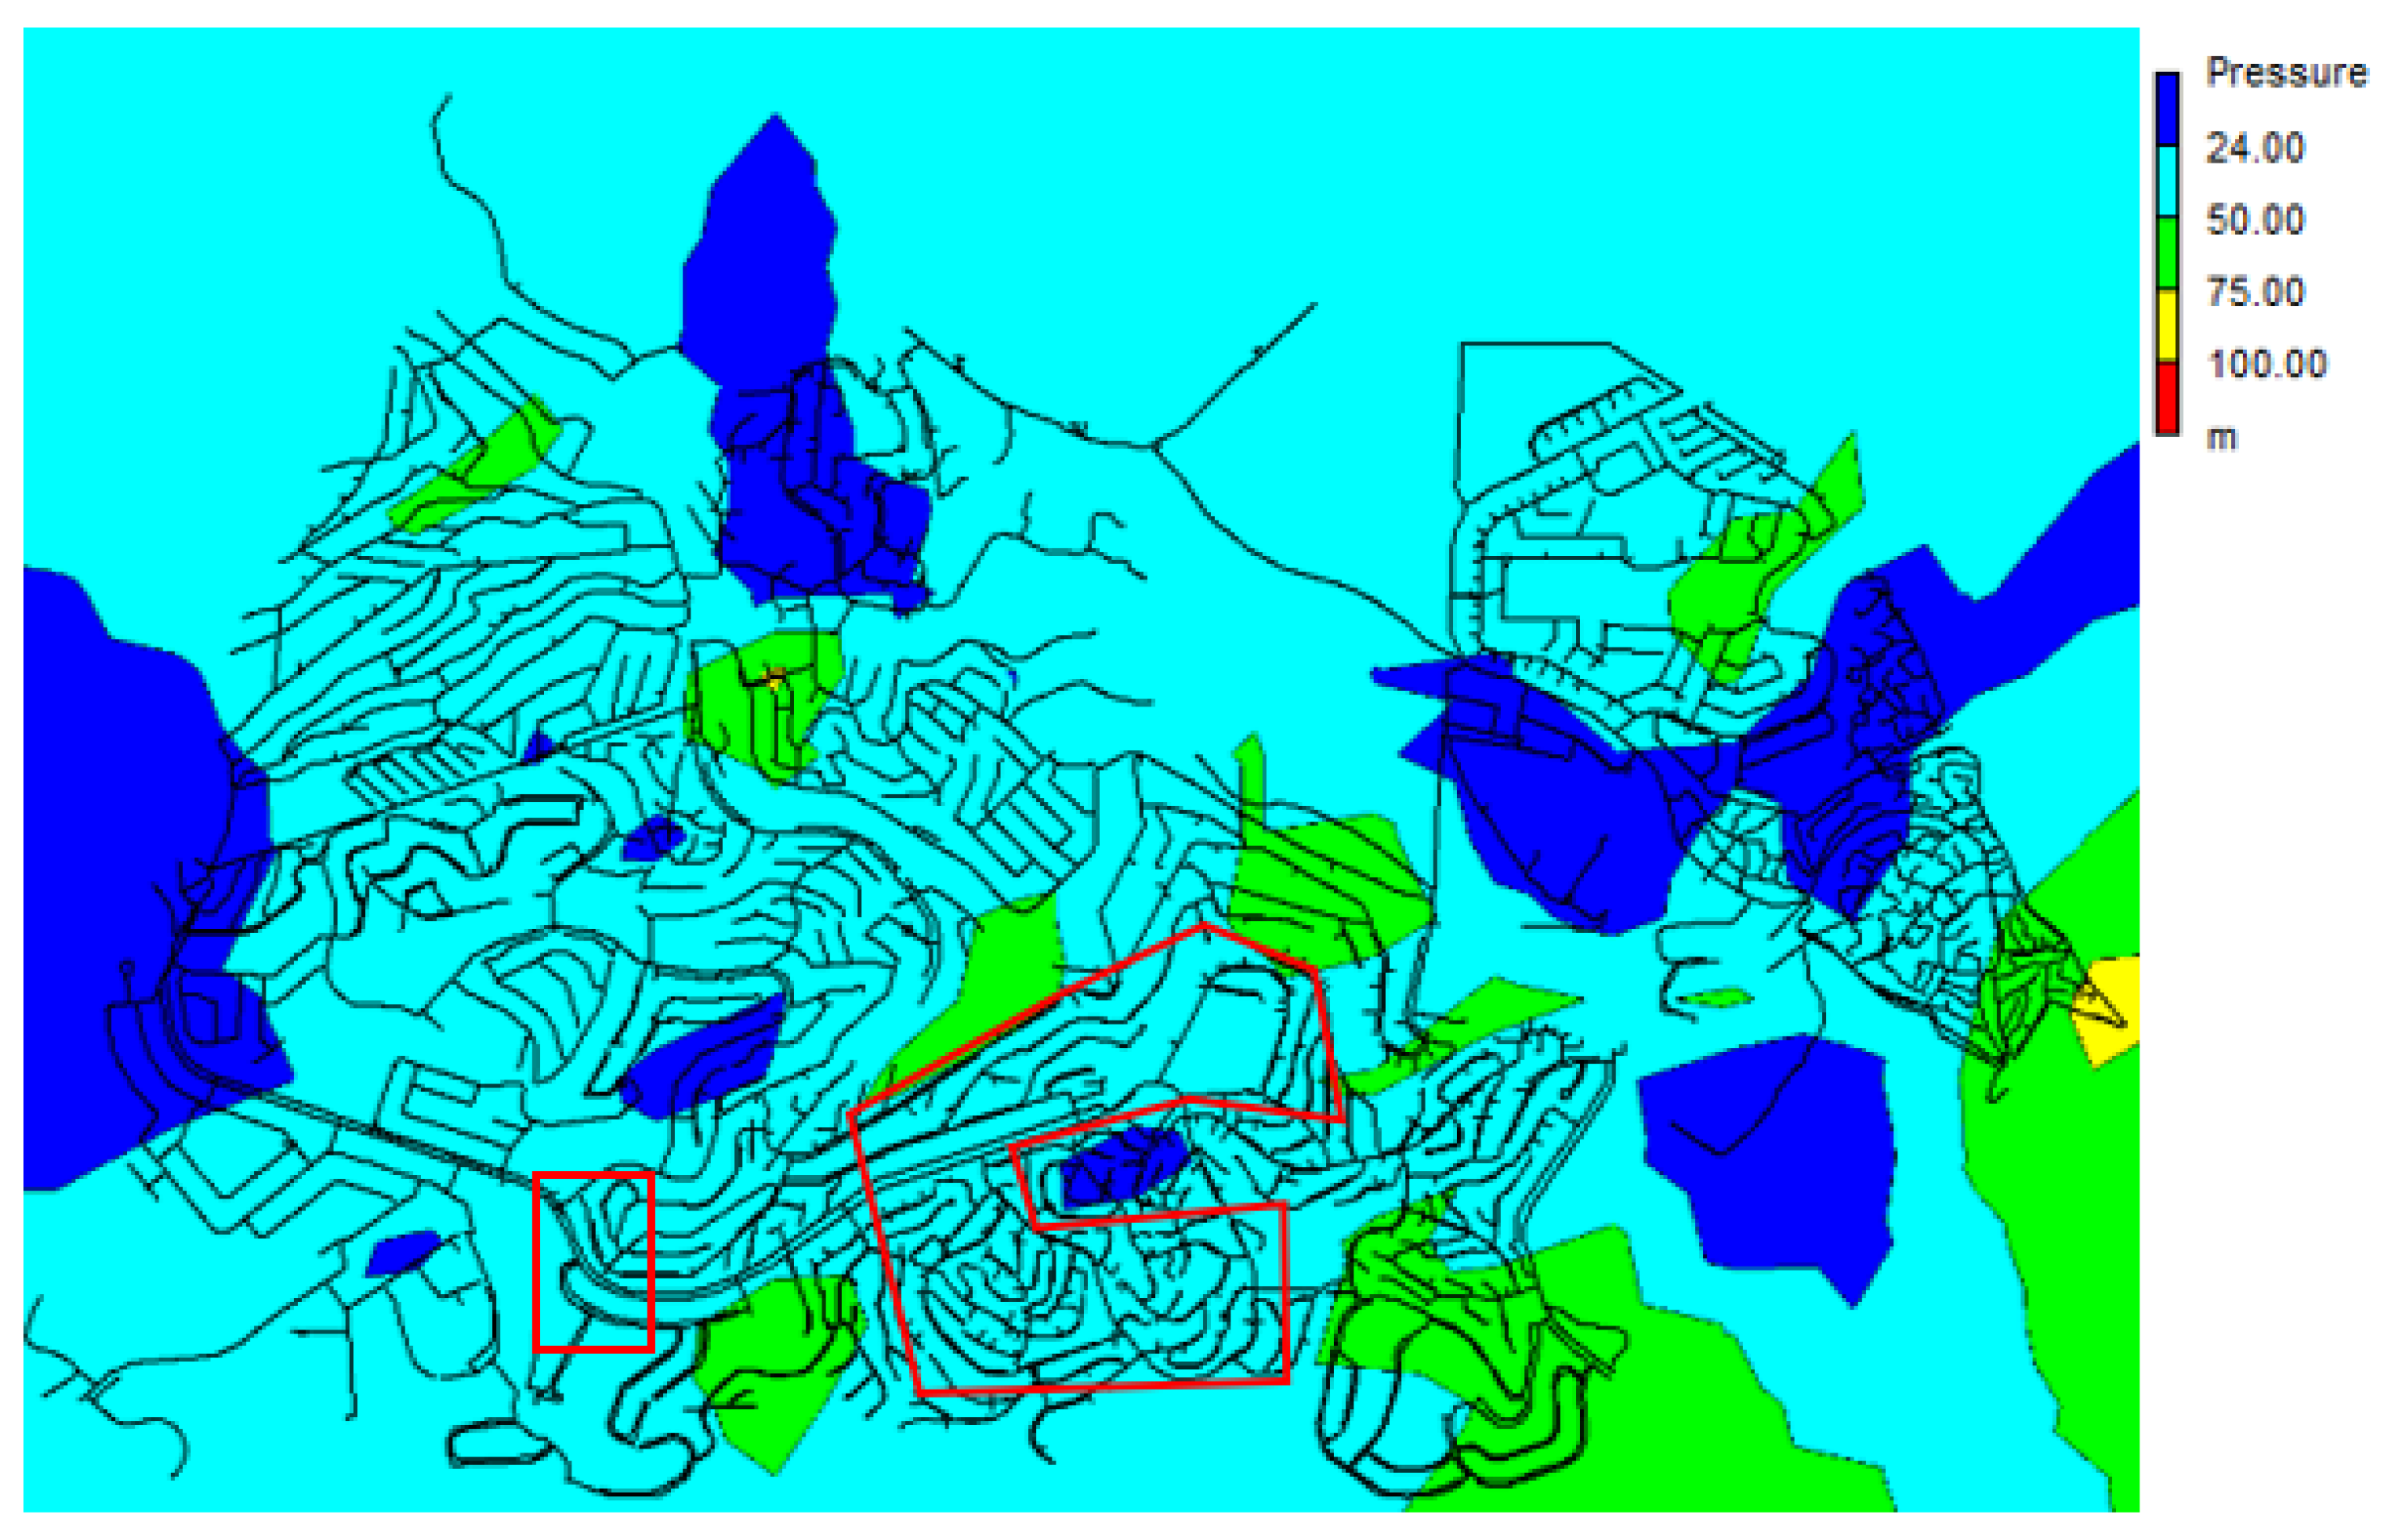
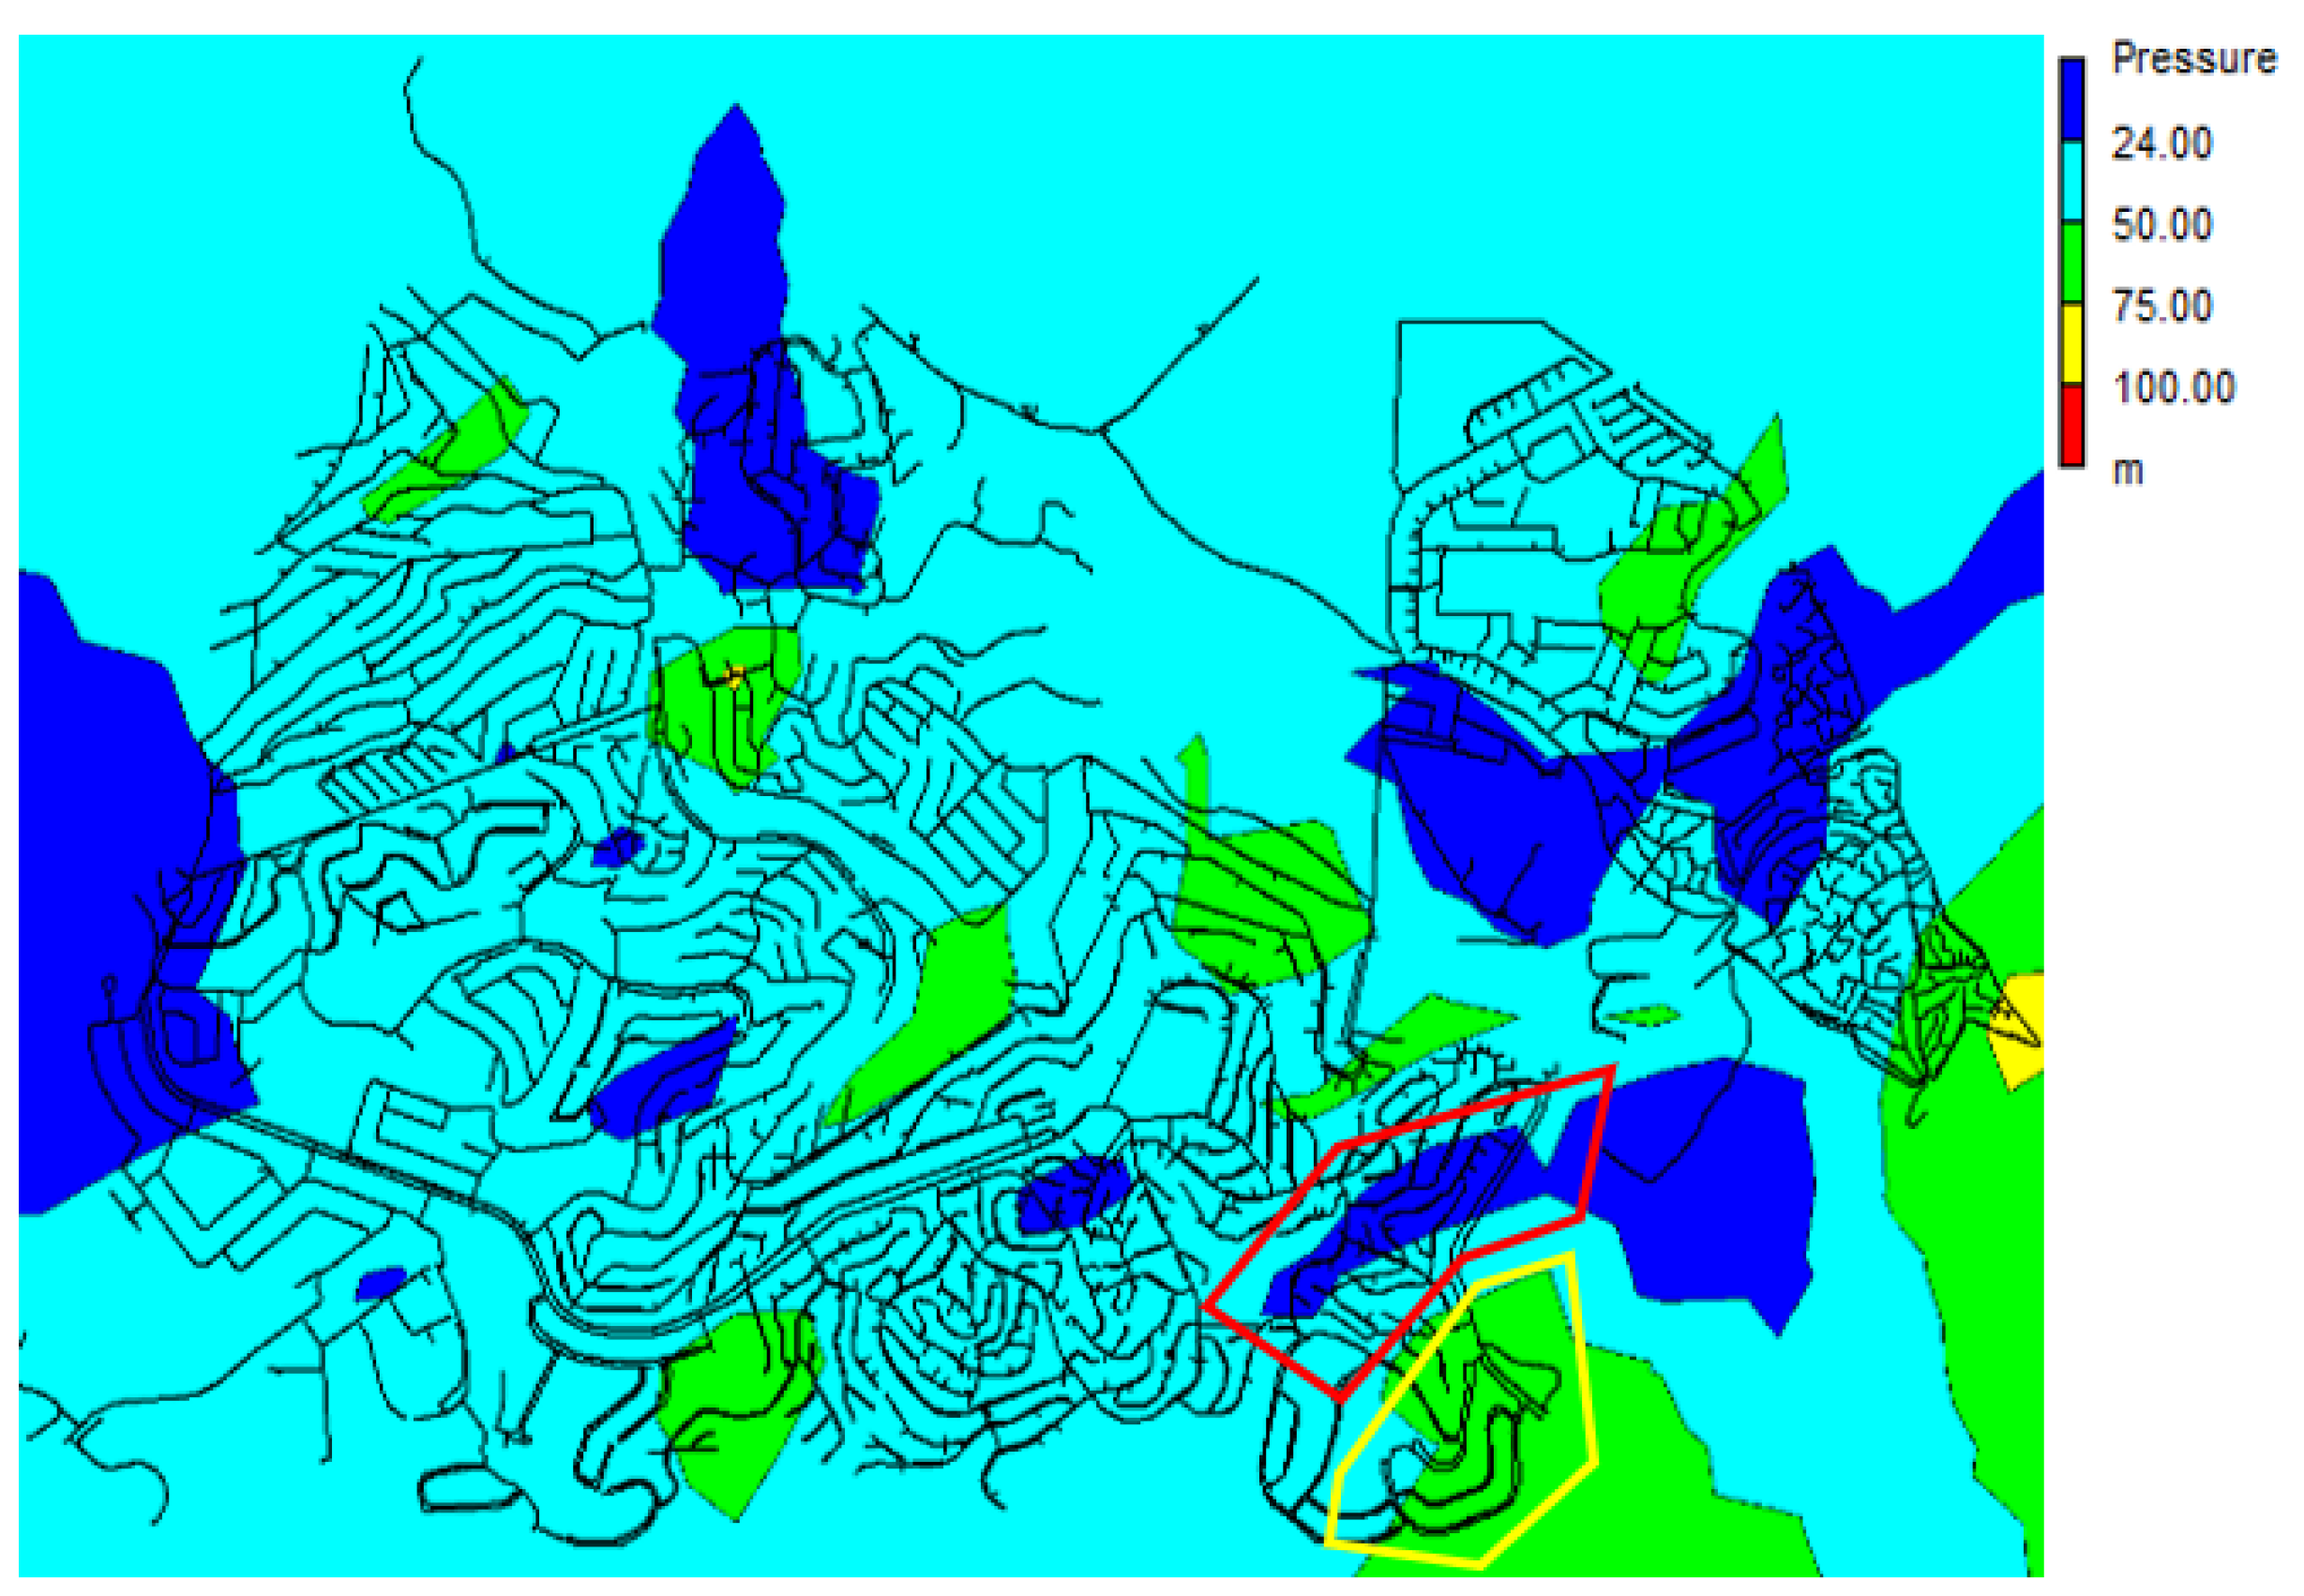
The accepted PATs from Scenario 4 will form configuration “B”. As shown in Table 3, five PATs are implemented in the network in Scenario 4: PAT-1, PAT-2, PAT-4, PAT-5 and PAT-6. Figure 7 shows the impact of adding PAT-4 on the pressure head in the WDN, including PAT-1 and PAT-2. The pressure within the area outlined in red has been successfully reduced compared to Figure 3. Figure 8 shows the impact of adding PAT-5 to this scenario in the WDN. The addition of PAT-5 in the WDN reduces the pressure in certain regions below the minimum value of 24 m, which is outlined in red in Figure 8. Therefore, PAT-5 is not added in configuration B. The region outlined in yellow in Figure 8 is not a feasible region to implement a PAT. This is because of the low flow rate in the pipes in this region. PAT-4 was set to 25 m. The pressure reduction by PAT-4 is 42.75 m. The power generated by PAT-4 is 7.05 kW. The CPP for PAT-4 is 2.03 years. The CPP is less than 2.5 years, so PAT-4 is acceptable for Scenario 6. A setting of 30 m was set for PAT-5. The pressure reduction by PAT-5 is 44.79 m. The power generated by PAT-5 is 0.51 kW. The CPP for PAT-5 is negative, and thus not feasible, and must be rejected for Scenario 6. A setting of 27 m was determined for PAT-6. The pressure reduction due to PAT-6 is 3.61 m. The power generated by PAT-6 is 0.59 kW. The CPP for PAT-6 is negative and thus not feasible and must be rejected for Scenario 6. Therefore, configuration B consists of PAT-1, PAT-2 and PAT-4. Configuration B has a total power output of 37.26 kW.
4.5. Scenario 5
The acceptable PATs from Scenario 5 form configuration “C”. As shown in Table 3, six PATs are implemented in the network in Scenario 5: PAT-1, PAT-2, PAT-4, PAT-7, PAT-8 and PAT-9. PAT-7, PAT-8 and PAT-9 replace the existing PRVs in the network. A setting of 25 m was used for PAT-7. The pressure reduction by PAT-7 is 26.36 m. The power generated by PAT-7 is 2.34 kW. The CPP for PAT-7 is 7.8 years. The CPP is greater than 2.5 years [4]; therefore, PAT-7 is rejected for Scenario 6. The pressure drop due to PAT-8 is 33.34 m. The power generated by PAT-8 is 74.04 kW. The CPP for PAT-8 is 0.53 years. The CPP is less than 2.5 years, so PAT-8 is acceptable for Scenario 6. A setting of 35 m was used for PAT-9. The pressure reduction by PAT-9 is 47.55 m. The power generated by PAT-9 is 55.01 kW. The CPP for PAT-9 is 0.64 years. The CPP is less than 2.5 years, so PAT-9 is acceptable for Scenario 6. Configuration C consists of PAT-1, PAT-2, PAT-4, PAT-8 and PAT-9. Configuration C has a total power output of 166.31 kW.
4.6. Scenario 6
The maximum CPP of 2.5 years was used to determine which PATs would be implemented in the final design, i.e., Scenario 6. The PATs for this configuration, configuration “D”, include: PAT-1, PAT-2, PAT-4, PAT-8 and PAT-9. Configuration D has a total power output of 166.31 kW. This scenario is the most optimal placement of PATs in the WDN. The implementation of PATs provides three benefits to the WDN: power generation, controlling downstream pressure in the pipe, reduction of leaks as lower pressures in the pipe result in fewer leaks. If the pipe is damaged, the lower pressure will reduce the amount of NRW until the pipe is repaired or replaced, and the excess pressure will be used to generate electricity.
4.7. Leakage in the WDN
Prior to the installation of PATs, the night time background leakage (BLN) in the WDN was calculated to be 251.0 kL/month. The total cost of water loss in this WDN is approximately R14,598.47/month (USD 969.84/month). Scenario 6 corresponds to an AZNP of 38.64 m after the installation of PATs. Using this AZNP, a PCF of 0.72 is used for the BLN calculation after PATs are installed. The new BLN is 205.41 kL/month. The total new cost of water losses in this WDN is R11,743.61/month (USD 780.18/month). This results in a water saving of 45.59 kL/month. This equates to a saving due to pressure reduction from the PAT installation (configuration D) of R2854.86/month (USD 185.69/month). By implementing configuration D, Scenario 6, a reduction in leakage of 18.16% is achieved in the WDN.
5. Discussion
Configuration D has a total power output of 166.31 kW. A capacity between 100 kW and 1 MW can be classified as a mini hydro power plant [28]. Therefore, the configuration “D”, proposed for the Cornubia integrated residential development in Phase 2A–Zone 1, can be classified as a mini hydro power plant equivalent. The CPP ranges from 0.53 to 2.03 years. The profit for the sale of electricity from non-renewable energy is R 0.83/kWh (USD 0.055/kWh). Applying this to Scenario 6, the total profit for configuration D is R1655.20 per day (USD 109.96 per day). The total power generated in one year by configuration D is 55,712.92 kW. This is equivalent to a profit of R554,492.52 per year (USD 36,837.67 per year). This profit can be used to offset the maintenance cost of the WDN.
6. Conclusions
The current research shows that replacing a PRV with a PAT at specific locations in the WDN can result in a similar pressure reduction, but with the added benefit of power generation. This method has been used in conjunction with the implementation of PATs in the Cornubia WDN to reduce excess pressure within the network. Configuration “D” includes: PAT-1, PAT-2, PAT-4, PAT-8 and PAT-9. Replacing PRVs with PATs in certain pipelines has been found to be very beneficial as the pressure reduction brings the added benefit of power generation. Reducing the pressure head directly reduces the water losses in the network due to leakage [13]. It can be concluded that pressure reduction leads to lower NRW in the network, which reduces maintenance costs in the system. A monthly water saving due to leakage reduction was achieved by implementing PAT configuration D, especially Scenario 6. This research also finds scope for further research focusing on Real-Time Control (RTC) automated optimisation algorithms to properly operate PAT placement in the WDNs.
Author Contributions
Conceptualisation, E.P., J.A. and M.K.; methodology, E.P.; software, E.P., A.P., M.N. and S.P.T.; validation, E.P., M.K., J.A. and S.P.T.; formal analysis, E.P.; investigation, E.P.; resources, M.K. and S.P.T.; data curation, E.P., A.P., M.N. and M.K.; writing—original draft preparation, E.P.; writing—review and editing, E.P., A.P., M.N., M.K., J.A. and S.P.T.; visualisation, E.P.; supervision, J.A. and M.K.; project administration, E.P. and S.P.T.; funding acquisition, M.K. and S.P.T. All authors have read and agreed to the published version of the manuscript.
Funding
This research was supported by the University of KwaZulu-Natal, Durban, South Africa and the seed grant “Computational modeling of biomaterials and applications to bioengineering and classical and quantum machine learning for predicting social engineering (2022–2026)”, Universidad Technologica Indoamérica, Ecuador, awarded to S.P.T.
Institutional Review Board Statement
Not applicable.
Informed Consent Statement
Not applicable.
Data Availability Statement
Not applicable.
Conflicts of Interest
The authors declare no conflict of interest. The funders had no role in the design of the study; in the collection, analyses, or interpretation of data; in the writing of the manuscript, or in the decision to publish the results.
References
- Rossi, M.; Righetti, M.; Renzi, M. Pump-as-Turbine for energy recovery applications: The case study of an aqueduct. Energy Procedia 2016, 101, 1207–1214. [Google Scholar] [CrossRef]
- Kanakoudis, V.; Gonelas, K. Applying pressure management to reduce water losses in two Greek cities’ WDSs: Expectations, problems, results and revisions. Procedia Eng. 2014, 89, 318–325. [Google Scholar] [CrossRef] [Green Version]
- Patelis, M.; Kanakoudis, V.; Gonelas, K. Combining pressure management and energy recovery benefits in a water distribution system installing PATs. J. Water Supply Res. Technol. 2017, 66, 520–527. [Google Scholar] [CrossRef] [Green Version]
- De Marchis, M.; Fontanazza, C.; Freni, G.; Messineo, A.; Milici, B.; Napoli, E.; Notaro, V.; Puleo, V.; Scopa, A. Energy recovery in water distribution networks. Implementation of pumps as turbine in a dynamic numerical model. Procedia Eng. 2014, 70, 439–448. [Google Scholar] [CrossRef] [Green Version]
- South African Wind Energy Association. The Cost Benefits of Renewable Energy, 1st ed.; South African Wind Energy Association: Johannesburg, South Africa, 2019; pp. 1–20. [Google Scholar]
- GlobalPetrolPrices.com: South Africa Energy Prices. March 2020. Available online: https://www.globalpetrolprices.com/South-Africa/ (accessed on 21 December 2020).
- South African Department of Energy. Potential Developers of Renewable Energy Projects under the REFIT Programme in South Africa (On-Shore Wind, Solar, Biomass, Biogas, Small Hydropower and Landfill Gas) and Potential Developers of Cogeneration Projects, 1st ed.; South African Department of Energy: Pretoria, South Africa, 2010.
- Novara, D.; McNabola, A. Design and Year-Long Performance Evaluation of a Pump as Turbine (PAT) Pico-Hydropower Energy Recovery Device in a Water Network. Water 2021, 13, 3014. [Google Scholar] [CrossRef]
- Derakhshan, S.; Nourbakhsh, A. Theoretical, numerical and experimental investigation of centrifugal pumps in reverse operation. Exp. Therm. Fluid Sci. 2008, 32, 1620–1627. [Google Scholar] [CrossRef]
- Derakhshan, S.; Nourbakhsh, A. Experimental study of characteristic curves of centrifugal pumps working as turbines in different specific speeds. Exp. Therm. Fluid Sci. 2008, 32, 800–807. [Google Scholar] [CrossRef]
- Carravetta, A.; Del Giudice, G.; Fecarotta, O.; Ramos, H.M. Energy production in water distribution networks: A PAT design strategy. Water Resour. Manag. 2012, 26, 3947–3959. [Google Scholar] [CrossRef]
- Olifant, N. IOL: Ethekwini Loses 237 Million Litres Daily. February 2015. Available online: https://www.iol.co.za/news/south-africa/kwazulu-natal/ethekwini-loses-237-million-litres-daily-1814726 (accessed on 4 October 2020).
- Shammas, N.K.; Al-Dhowalia, K.H. Effect of pressure on leakage rate in water distribution networks. J. King Saud Univ.-Eng. Sci. 1993, 5, 213–226. [Google Scholar] [CrossRef]
- CSIR Building and Construction Technology. Guidelines for Human Settlement Planning and Design, 2nd ed.; CSIR Building and Construction Technology: Pretoria, South Africa, 2005; Volume 2, Chapter 9; pp. 1–40. [Google Scholar]
- Strijdom, J. Evaluation of Minimum Pressure Head during Peak Flow as Design Criterion for Water Distribution Systems. Ph.D. Thesis, Stellenbosch University, Stellenbosch, South Africa, 2016. [Google Scholar]
- Fontana, N.; Giugni, M.; Portolano, D. Losses reduction and energy production in water-distribution networks. J. Water Resour. Plan. Manag. 2012, 138, 237–244. [Google Scholar] [CrossRef]
- De Marchis, M.; Freni, G. Pump as turbine implementation in a dynamic numerical model: Cost analysis for energy recovery in water distribution network. J. Hydroinform. 2015, 17, 347–360. [Google Scholar] [CrossRef] [Green Version]
- De Marchis, M.; Milici, B.; Volpe, R.; Messineo, A. Energy saving in water distribution network through pump as turbine generators: Economic and environmental analysis. Energies 2016, 9, 877. [Google Scholar] [CrossRef] [Green Version]
- Germanopoulos, G.; Jowitt, P. Leakage Reduction by Excess Pressure Minimization in a Water Supply Network. Proc. Inst. Civ. Eng. 1989, 87, 195–214. [Google Scholar] [CrossRef]
- Van Zyl, J. The effect of pressure on leaks in water distribution systems. In Proceedings of the 2004 Water Institute of Southern Africa (WISA) Biennial Conference, Cape Town, South Africa, 2–6 May 2004; pp. 1104–1109. [Google Scholar]
- Ferraiuolo, R.; De Paola, F.; Fiorillo, D.; Caroppi, G.; Pugliese, F. Experimental and numerical assessment of water leakages in a PVC-A Pipe. Water 2020, 12, 1804. [Google Scholar] [CrossRef]
- Babić, B.; Đukić, A.; Stanić, M. Managing water pressure for water savings in developing countries. Water Sa 2014, 40, 221–232. [Google Scholar] [CrossRef] [Green Version]
- Mckenzie, R.; Wegelin, W. Challenges facing the implementation of water demand management initiatives in Gauteng Province. Water SA 2009, 35, 168–174. [Google Scholar] [CrossRef] [Green Version]
- WSA/WCA. Engineering and Operational Committee, Managing Leakage: UK Water Industry Managing Leakage Reports A–J. Report A—Summary Report; Report B—Reporting Comparative Leakage Performance; Report C—Setting Economic Leakage Targets; Report D—Estimating Unmeasured Water Delivered; Report E—Interpreting Measured Night Flows; Report F—Using Night Flow Data; Report G—Managing Water Pressure; Report H—Dealing With Customer’s Leakage; Report J—Techniques, Technology and Training; WSA/WCA: London, UK, 1994. [Google Scholar]
- Nyirenda, M. Cornubia Integrated Human Settlement Development Phase 2A—Gravity Network Hydraulic Modelling Report; EThekwini Municipality: Durban, South Africa, 2019. [Google Scholar]
- Rakibuzzaman, M.; Jung, K.Y.; Suh, S.H. A study on the use of existing pump as turbine. E3S Web Conf. EDP Sci. 2019, 128, 06004. [Google Scholar] [CrossRef]
- Van Vuuren, S.; Blersch, C.; Van Dijk, M. Modelling the feasibility of retrofitting hydropower to existing South African dams. Water SA 2011, 37, 679–692. [Google Scholar] [CrossRef] [Green Version]
- Sustainable Energy Africa. Sustainable Energy Solutions for South African Local Government: A Practical Guide, 1st ed.; Sustainable Energy Africa: Cape Town, South Africa, 2017; pp. 1–20. [Google Scholar]
Figure 1.
Elevations in WDN.

Figure 2.
WDN showing proposed PAT locations and flow rate in pipes and pressure head at the junctions.
Figure 2.
WDN showing proposed PAT locations and flow rate in pipes and pressure head at the junctions.

Figure 3.
Pressure head in WDN with no PATs installed.

Figure 4.
Pressure head in WDN with one PAT installed on pipe no. 7590.

Figure 5.
Pressure head critical zones due to PAT-1.

Figure 6.
Pressure head reduction due to addition of PAT-2.

Figure 7.
Pressure head reduction due to PAT-1, PAT-2 and PAT-4 installed in the WDN. (Changes outlined in red).
Figure 7.
Pressure head reduction due to PAT-1, PAT-2 and PAT-4 installed in the WDN. (Changes outlined in red).

Figure 8.
Pressure head reduction due to PAT-1, PAT-2, PAT-4 and PAT-5 installed in the WDN. (Changes outlined in red).
Figure 8.
Pressure head reduction due to PAT-1, PAT-2, PAT-4 and PAT-5 installed in the WDN. (Changes outlined in red).


| Pressure Correction Factor (PCF) for Variable AZNP | |||||||||
|---|---|---|---|---|---|---|---|---|---|
| AZNP (m) | 20 | 30 | 40 | 50 | 60 | 70 | 80 | 90 | 100 |
| PCF | 0.33 | 0.53 | 0.75 | 1.0 | 1.27 | 1.57 | 1.88 | 2.23 | 2.59 |
| Background Night Leakage Components at Standard AZNP = 50 m | ||||
|---|---|---|---|---|
| Leakage Components | Unit | Infrastructure Conditions | ||
| Good | Average | Poor | ||
| C1: Distribution Mains | Lit/(km h) | 20 | 40 | 60 |
| C2: Communication Pipes | Lit/(conn h) | 1.5 | 3.0 | 4.5 |
| C3: Underground Supply Pipes | Lit/(conn h) | 0.5 | 1.0 | 1.5 |
Table 3.
PAT power generation and profit (per day and per year) and feasibility study for each PAT (1 ZAR (R) = USD 0.066 as on 12 February 2022).
Table 3.
PAT power generation and profit (per day and per year) and feasibility study for each PAT (1 ZAR (R) = USD 0.066 as on 12 February 2022).
| PAT Power Generation and Profit | Feasibility Analysis | ||||||||
|---|---|---|---|---|---|---|---|---|---|
| PATs | Power | Power/Year | Profit (R) | Price (R) | EGE | CW | MC | AF | CPP (Yr) |
| Scenario 2 | |||||||||
| PAT-1 | 13.56 kW | 4.54 MW | 45,196.53 | 62,452 | 81,188 | 24,356 | 15,832 | 94,757 | 1.11 |
| Scenario 3 | |||||||||
| PAT-1 | 13.56 kW | 4.54 MW | 45,196.53 | 62,452 | 81,188 | 24,356 | 15,832 | 94,757 | 1.11 |
| PAT-2 | 16.65 kW | 5.58 MW | 55,516.12 | 66,980 | 87,074 | 26,122 | 16,980 | 118,860 | 0.95 |
| PAT-3 | 1.24 kW | 0.42 MW | 4142.62 | 40,617 | 52,802 | 15,840 | 10,296 | −160 | −429.15 |
| Scenario 4 | |||||||||
| PAT-1 | 13.56 kW | 4.54 MW | 45,196.53 | 62,452 | 81,188 | 24,356 | 15,832 | 94,757 | 1.11 |
| PAT-2 | 16.65 kW | 5.58 MW | 55,516.12 | 66,980 | 87,074 | 26,122 | 16,980 | 118,860 | 0.95 |
| PAT-4 | 7.05 kW | 2.36 MW | 23,507.64 | 52,898 | 68,767 | 20,630 | 13,410 | 44,110 | 2.03 |
| PAT-5 | 0.51 kW | 0.17 MW | 1687.67 | 40,617 | 52,802 | 15,840 | 10,296 | −6167 | −11.13 |
| PAT-6 | 0.59 kW | 0.196 MW | 1951.08 | 40,617 | 52,802 | 15,840 | 10,296 | −5522 | −12.43 |
| Scenario 5 | |||||||||
| PAT-1 | 13.56 kW | 4.54 MW | 45,196.53 | 62,452 | 81,188 | 24,356 | 15,832 | 94,757 | 1.11 |
| PAT-2 | 16.65 kW | 5.58 MW | 55,516.12 | 66,980 | 87,074 | 26,122 | 16,980 | 118,860 | 0.95 |
| PAT-4 | 7.05 kW | 2.36 MW | 23,507.64 | 52,898 | 68,767 | 20,630 | 13,410 | 44,110 | 2.03 |
| PAT-7 | 2.34 kW | 0.78 MW | 7806.20 | 40,617 | 52,802 | 15,840 | 10,296 | 8804 | 7.80 |
| PAT-8 | 74.04 kW | 24.80 MW | 246,850.62 | 174,869 | 227,330 | 68,199 | 44,329 | 559,676 | 0.53 |
| PAT-9 | 55.01 kW | 18.43 MW | 183,421.61 | 154,616 | 201,001 | 60,300 | 39,195 | 409,610 | 0.64 |
| Best PAT Scenario—Scenario 6 | |||||||||
| PAT-1 | 13.56 kW | 4.54 MW | 45,196.53 | 62,452 | 81,188 | 24,356 | 15,832 | 94,757 | 1.11 |
| PAT-2 | 16.65 kW | 5.58 MW | 55,516.12 | 66,980 | 87,074 | 26,122 | 16,980 | 118,860 | 0.95 |
| PAT-4 | 7.05 kW | 2.36 MW | 23,507.64 | 52,898 | 68,767 | 20,630 | 13,410 | 44,110 | 2.03 |
| PAT-8 | 74.04 kW | 24.80 MW | 246,850.62 | 174,869 | 227,330 | 68,199 | 44,329 | 559,676 | 0.53 |
| PAT-9 | 55.01 kW | 18.43 MW | 183,421.61 | 154,616 | 201,001 | 60,300 | 39,195 | 409,610 | 0.64 |
| Total Scenario 6 | 166.31 kW | 55.71 MW | 554,492.52/year | ||||||
Publisher’s Note: MDPI stays neutral with regard to jurisdictional claims in published maps and institutional affiliations. |
© 2022 by the authors. Licensee MDPI, Basel, Switzerland. This article is an open access article distributed under the terms and conditions of the Creative Commons Attribution (CC BY) license (https://creativecommons.org/licenses/by/4.0/).
Share and Cite
MDPI and ACS Style
Pillay, E.; Kumarasamy, M.; Adu, J.; Thirumuruganandham, S.P.; Paruk, A.; Naidoo, M. Feasibility Analysis of Energy Recovery Using PATs in Water Distribution Networks. Water 2022, 14, 1150. https://doi.org/10.3390/w14071150
AMA Style
Pillay E, Kumarasamy M, Adu J, Thirumuruganandham SP, Paruk A, Naidoo M. Feasibility Analysis of Energy Recovery Using PATs in Water Distribution Networks. Water. 2022; 14(7):1150. https://doi.org/10.3390/w14071150
Chicago/Turabian StylePillay, Ethan, Muthukrishnavellaisamy Kumarasamy, Joy Adu, Saravana Prakash Thirumuruganandham, Ayesha Paruk, and Maranka Naidoo. 2022. "Feasibility Analysis of Energy Recovery Using PATs in Water Distribution Networks" Water 14, no. 7: 1150. https://doi.org/10.3390/w14071150
Note that from the first issue of 2016, this journal uses article numbers instead of page numbers. See further details here.