
Comparison of the Engineering Strategies for Low Impact Development in a Densely Populated Old Urban Area


1
School of Civil Engineering, Wuhan University, Wuhan 430072, China
2
Engineering Research Centre of Urban Disasters Prevention and Fire Rescue Technology of Hubei Province, Wuhan 430072, China
*
Author to whom correspondence should be addressed.
Water 2022, 14(7), 1149; https://doi.org/10.3390/w14071149
Submission received: 16 February 2022
/
Revised: 29 March 2022
/
Accepted: 30 March 2022
/
Published: 2 April 2022
(This article belongs to the Topic Hydrological Modeling and Engineering: Managing Risk and Uncertainties)
Abstract
:Most old urban areas of China have a dense population, severely indurated underlying surface, and highly developed underground space. Those increase the waterlogging risk and obstruct the stormwater management in old urban areas. To propose an appropriate engineering strategy for low impact development (LID) transformation in an urban area, a simulation was carried out by storm water management model (SWMM) in this project. Bioretention cells, permeable pavements, and green roofs were selected according to the study area surface. Runoff control performance of single LID control and combined schemes were compared. Results illustrate that only 50.21% of roofs can build green roofs in urban areas with dense populations, and the runoff control performance of green roofs is unsatisfactory, while bioretention cells and permeable pavements can effectively mitigate runoff caused by storms with a recurrence period less than 10 years, and combined LID controls can obtain better runoff control performance with less construction area. Those outcomes screened out the LID controls suitable for application in densely populated old urban areas and put forward reasonable engineering practice strategies. This study provides guidance and reference for the LID transformation in the densely populated old urban area.
1. Introduction
In the process of urbanization, the proportion of impervious surface keeps increasing, the infiltration of rainwater is blocked, the urban rainfall runoff is significantly increased [1,2]. After decades of development, a large number of population and wealth have been accumulated in the city, the rainwater drainage system needs a higher design standard [3], and the initial planning of urban pipe network often can not meet the current needs of rainwater drainage [4]. At the same time, climate change causes an escalation in temperature, which in turn increases the frequency and intensity of rainfall events in urban areas [5,6]. Therefore, the old urban areas with a dense population often face greater waterlogging risk [7]. To solve the problem of urban waterlogging, the traditional way is to upgrade the drainage system. However, the main pipes of the rainwater drainage system are often located under the main traffic roads. Upgrading the drainage network system by breaking the existing roads makes the traffic more crowded. Additionally, the underground space is usually occupied by complex networks of infrastructure services in urban areas [8,9]; the drainage system upgrading project is likely to damage the pipeline of other infrastructure services systems.
To solve problems caused by stormwater, the potential of natural drainage systems in runoff mitigation has become a hot topic. Stormwater management strategies, including natural drainage systems, have been proposed by some developed countries, such as green infrastructure (GI), water-sensitive urban design (WSUD), and low impact development (LID). Research studies about natural drainage systems prove that they are effective in runoff mitigation and runoff pollution control [10,11]. Some research studies even indicate a natural drainage system alleviates the heat island effect [12] and improves biodiversity [13]. Recently, the Chinese government introduced the concept of LID into the practice of urban rainwater management, combining green drainage facilities and concrete drainage facilities to make up for deficiencies of a traditional drainage system, which was known as the Sponge City strategy [14,15].
The hydrological model is a common tool to estimate the runoff control performance of LID controls. At present, various models have been proposed, such as SWMM, MIKE SHE, SWAT, and HYDRUS-1D [16]. Mobilia et al. [17] compared the Nash cascade model, SWMM, and HYDRUS-1D and found the models performed better for stratiform and tropical events. SWMM and HYDRUS predicted the convective events have a high degree of accuracy, while the Nash model appeared more suitable for stratiform events. Broekhuizen et al. [18] compared the performance of Urbis, SWMM, Hydrus-1D, and Mike SHE across two full-size green roofs. The results indicate predictions from SWMM and Mike SHE were jointly the best in terms of raw percentage observations covered by their flow prediction intervals, but the uncertainty in the predictions in SWMM was smaller. In general, reliable simulation results can be obtained by using SWMM, and the results are sufficient to determine the LID transformation strategy.
Although the natural drainage system has many advantages over the traditional concrete drainage system, there are many restrictions on LID controls in densely populated old urban areas. The severely indurated underlying surface leads to more rainfall runoff in these areas [19], the complex building type and high building density lead to limited space for the construction of LID controls, and highly developed underground space cuts off the natural infiltration channel of rainfall, weakening the mitigation effect of LID controls on urban waterlogging. Therefore, the engineering strategy of LID transformation in densely populated old urban areas is a focus of research on LID.
The objective of this research is to propose the LID transformation strategy that can overcome the restrictions on the construction of LID controls and has effective runoff control performance in densely populated urban areas. The results provide guidance and reference for the LID transformation in the densely populated old urban area.
2. Materials and Methods
2.1. Methodology
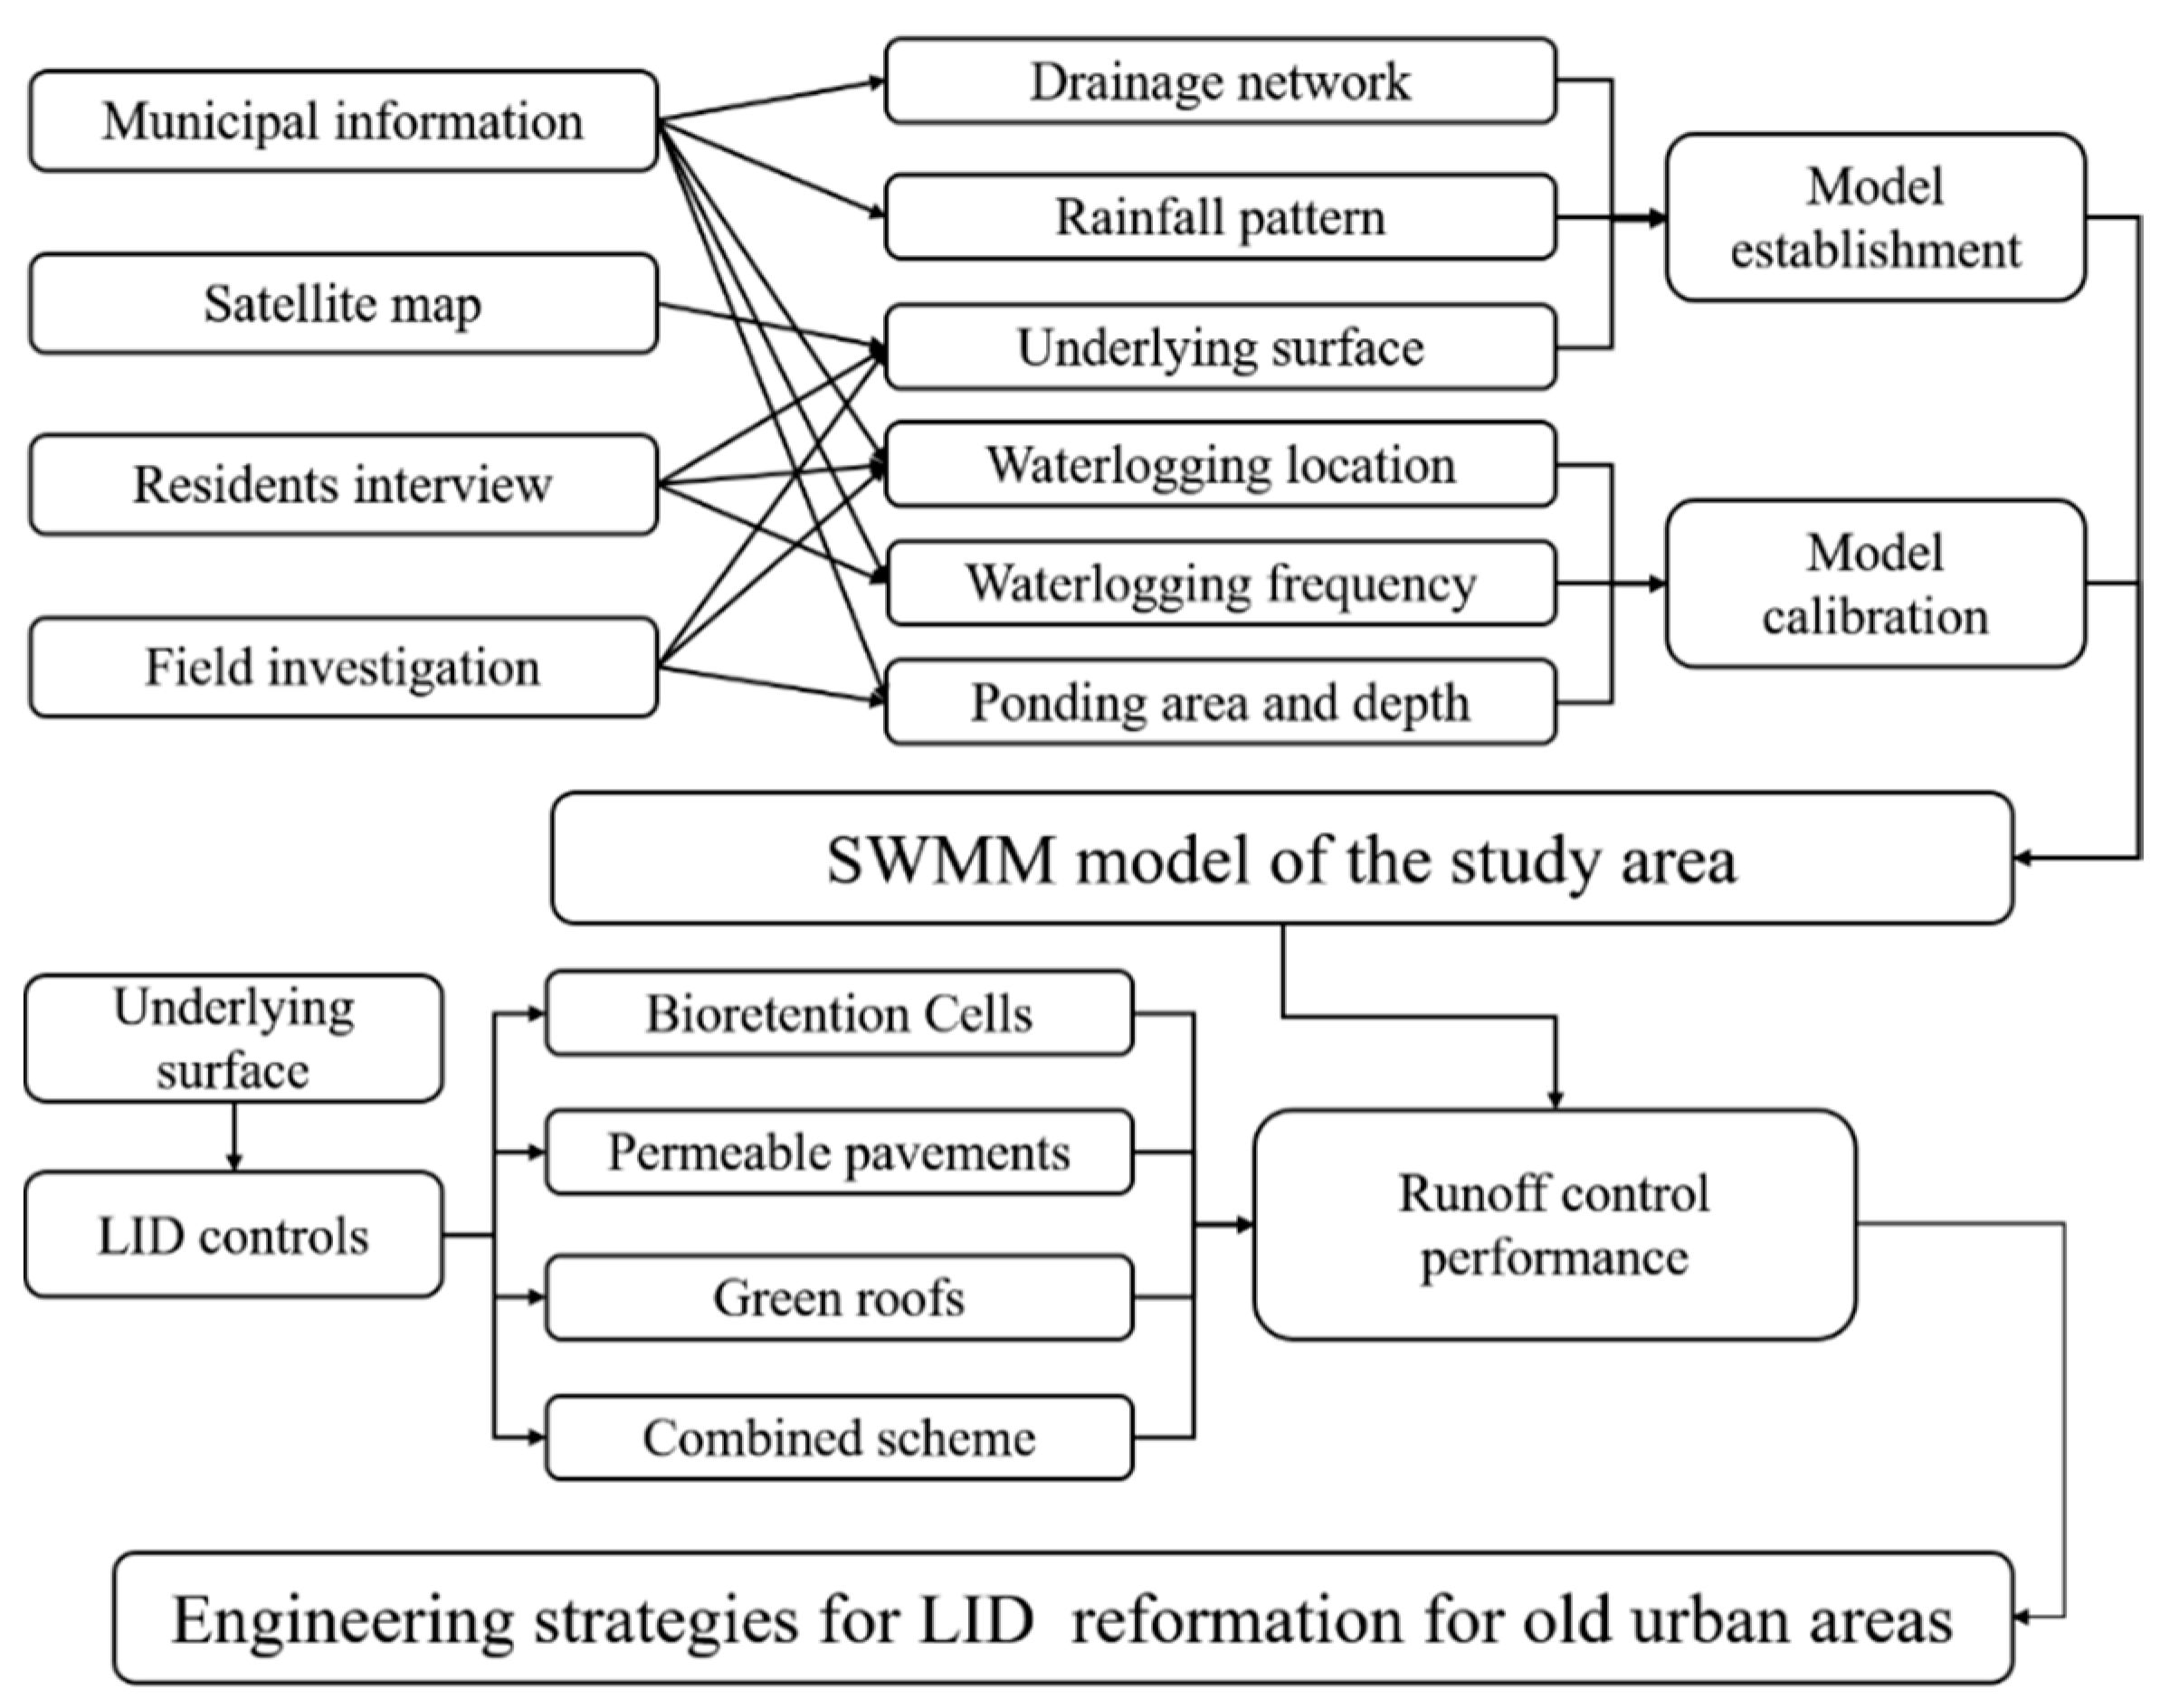
This paper takes a catchment in Jiang’an District, Wuhan, China, as the research object. LID controls suitable for old urban areas were selected by analysis of the properties of the underlying surface and characteristics of waterlogging. Based on this information, a hydrological model of the study area was established using SWMM, and LID reformation strategies for old urban areas were proposed by comparing the runoff control performance of single LID control and combined schemes. The methodology of this study is shown in Figure 1.
2.2. Study Area
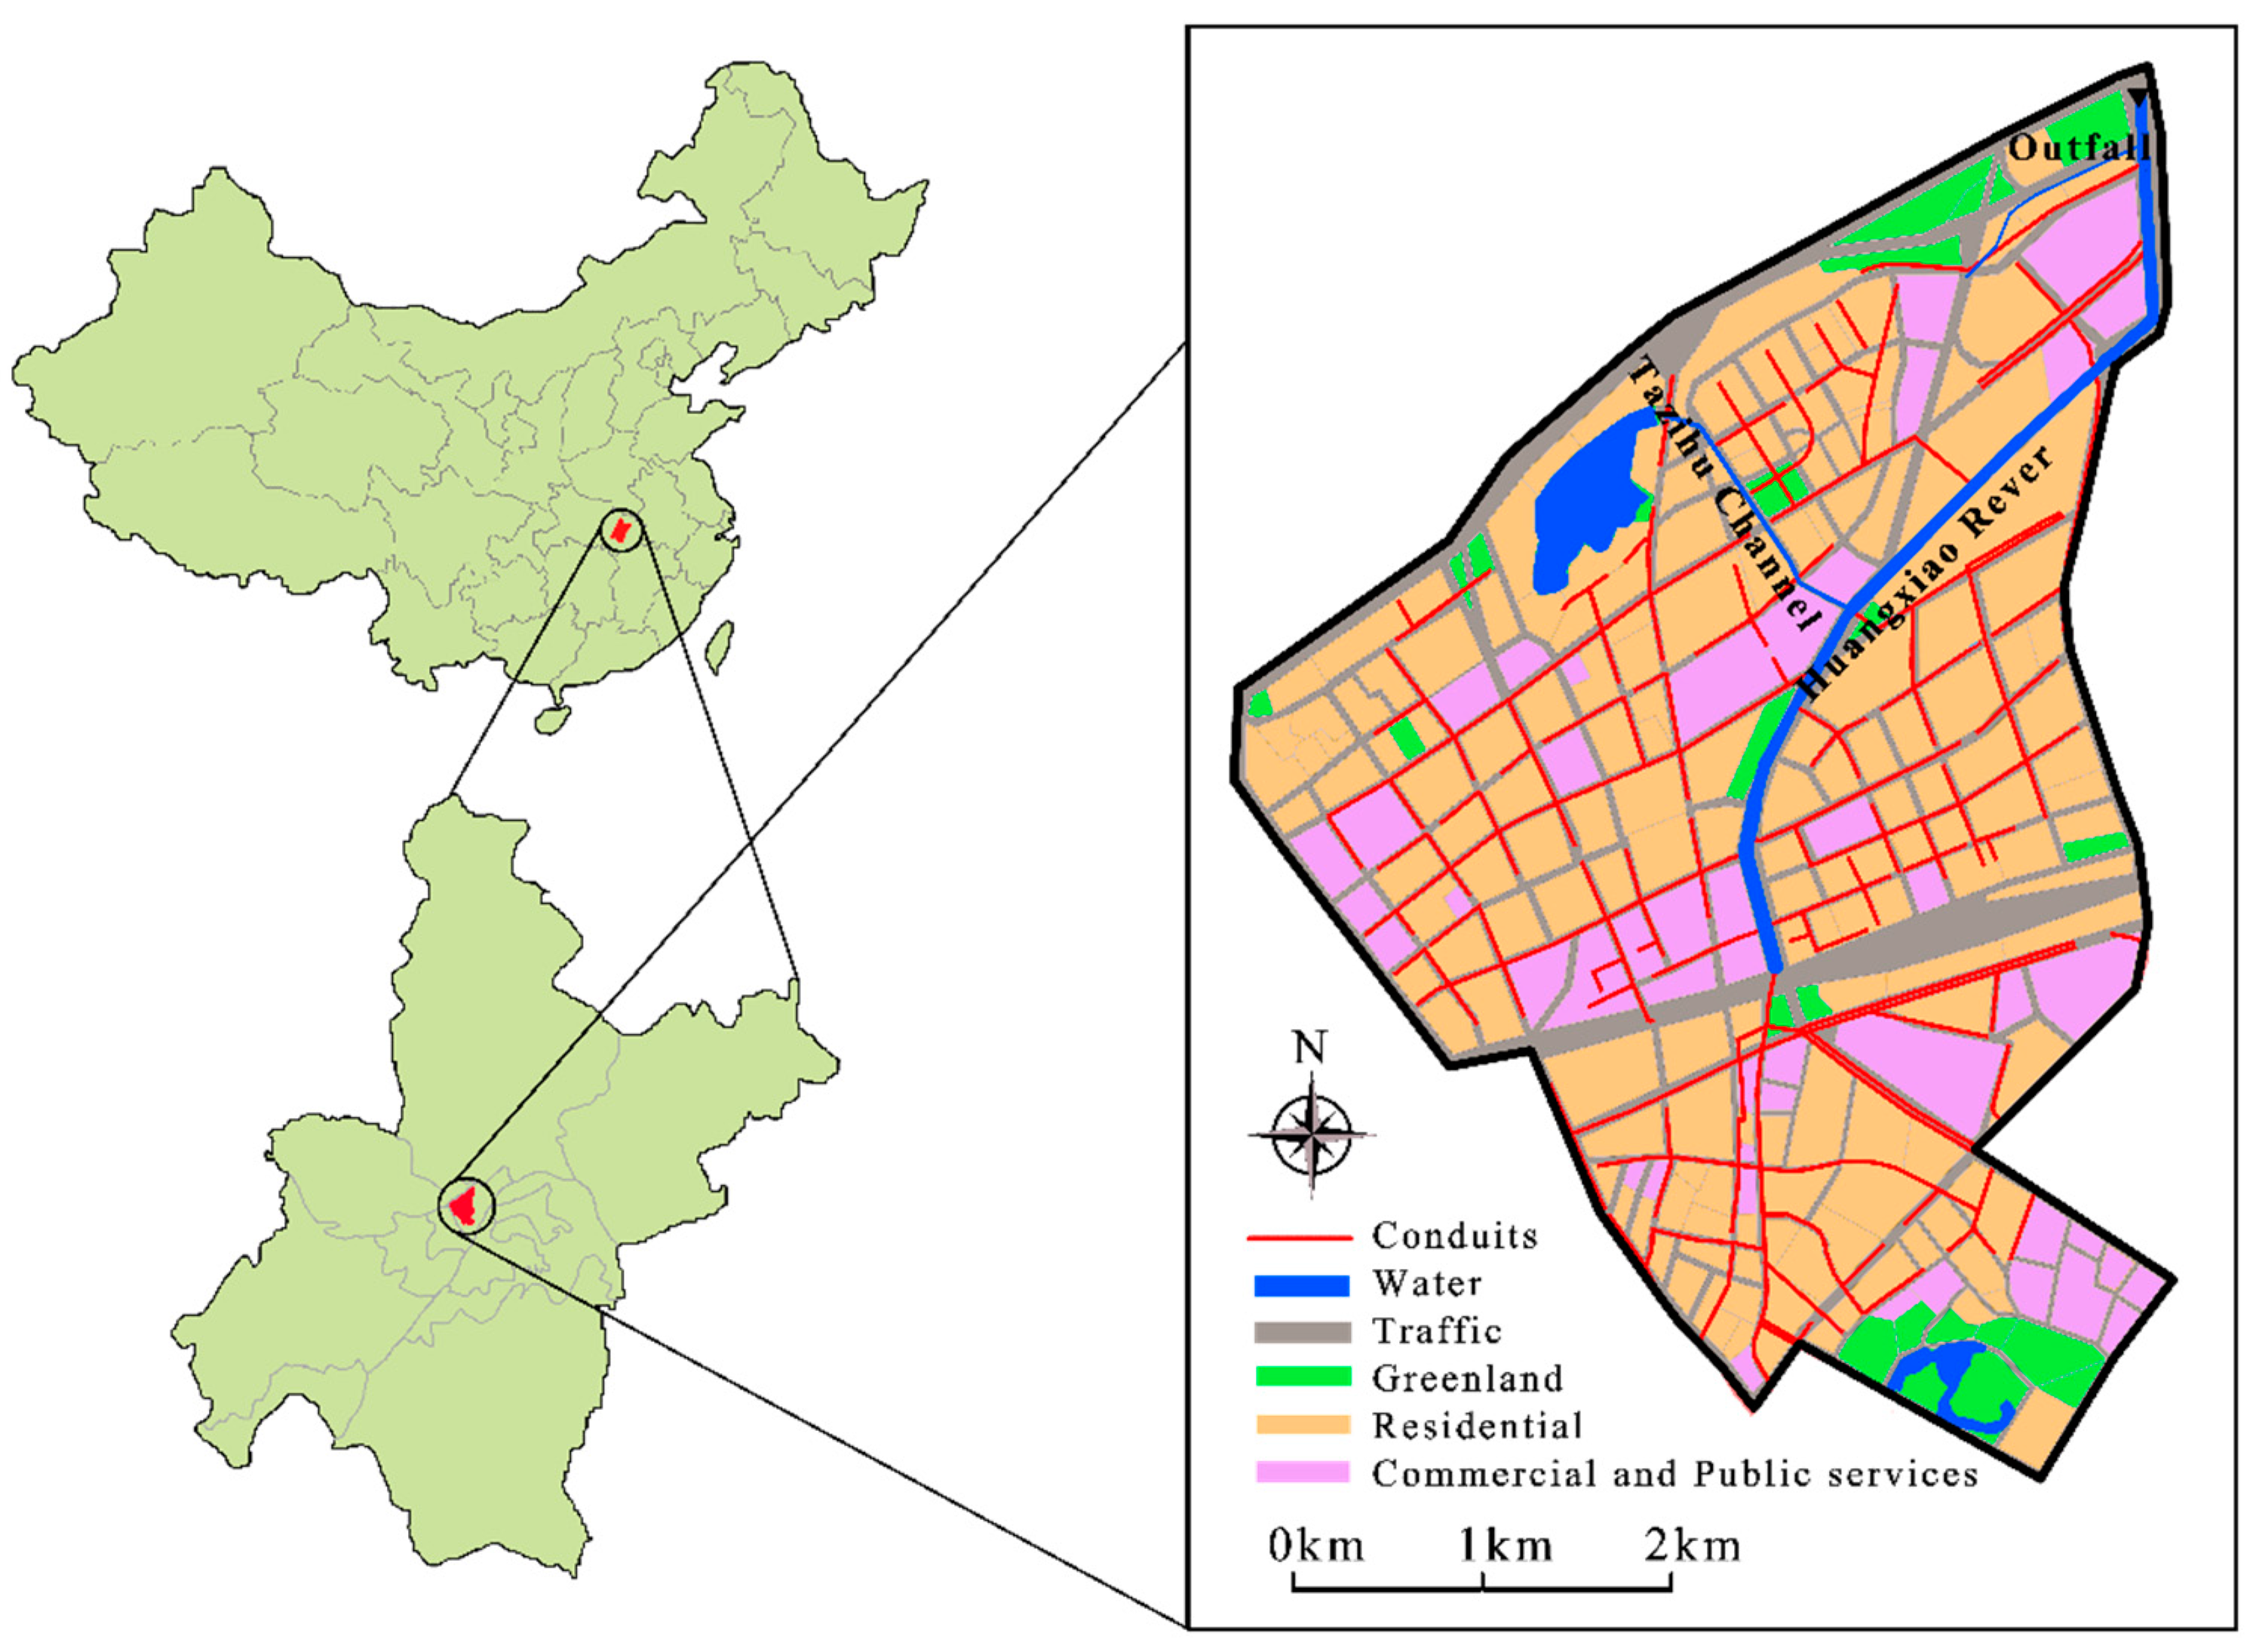
Jiang′an District is one of the seven central urban areas in Wuhan, covering 70 km2 with a population of over 1 million. The study area is located in the northwest part of Jiang′an District and covers 21.75 km2. The area is an alluvial plain, flat, open, with no obvious hills and highlands. The regional drainage flows from south to north, enters the Tazihu channel of Huangxiao River through the pipe network system, and finally flows to the Fuhe River, as shown in Figure 2.
The study area belongs to the subtropical monsoon climate, and the annual average rainfall is 1140~1265 mm. The rainstorm is mainly concentrated from April to August, accounting for 70~80% of the whole year [20].
2.3. Modeling
2.3.1. Storm Water Management Model
Studies about the hydrological process of a rainstorm on a watershed scale are difficult to carry out in the field. Research based on a dynamic rainfall-runoff simulation model is an important way to discuss these problems. Storm water management model (SWMM), developed by the U.S. Environmental Protection Agency, has been proved to be effective in analyzing, planning, and designing urban drainage systems [21,22]. SWMM has added the calculation module of LID controls since version 5.0 [23] and has become a common tool for assessing the effect of stormwater management measures [24,25,26,27].
SWMM is a dynamic rainfall-runoff simulation model for simulation of runoff quantity and quality from primarily urban areas. SWMM conceptualizes a drainage system as a series of water and material flows between several major environmental compartments. The Atmosphere compartment generates precipitation and deposits pollutants onto the land surface compartment. The Land Surface compartment receives precipitation and sends outflow in the form of infiltration to the Groundwater compartment and also as surface runoff and pollutant loadings to the Transport compartment. The Groundwater compartment receives infiltration and transfers a portion of this inflow to the Transport compartment. The Transport compartment contains a network of conveyance elements (channels, pipes, pumps, and regulators) and storage/treatment units that transport water to outfalls or to treatment facilities, and LID controls are part of treatment units.
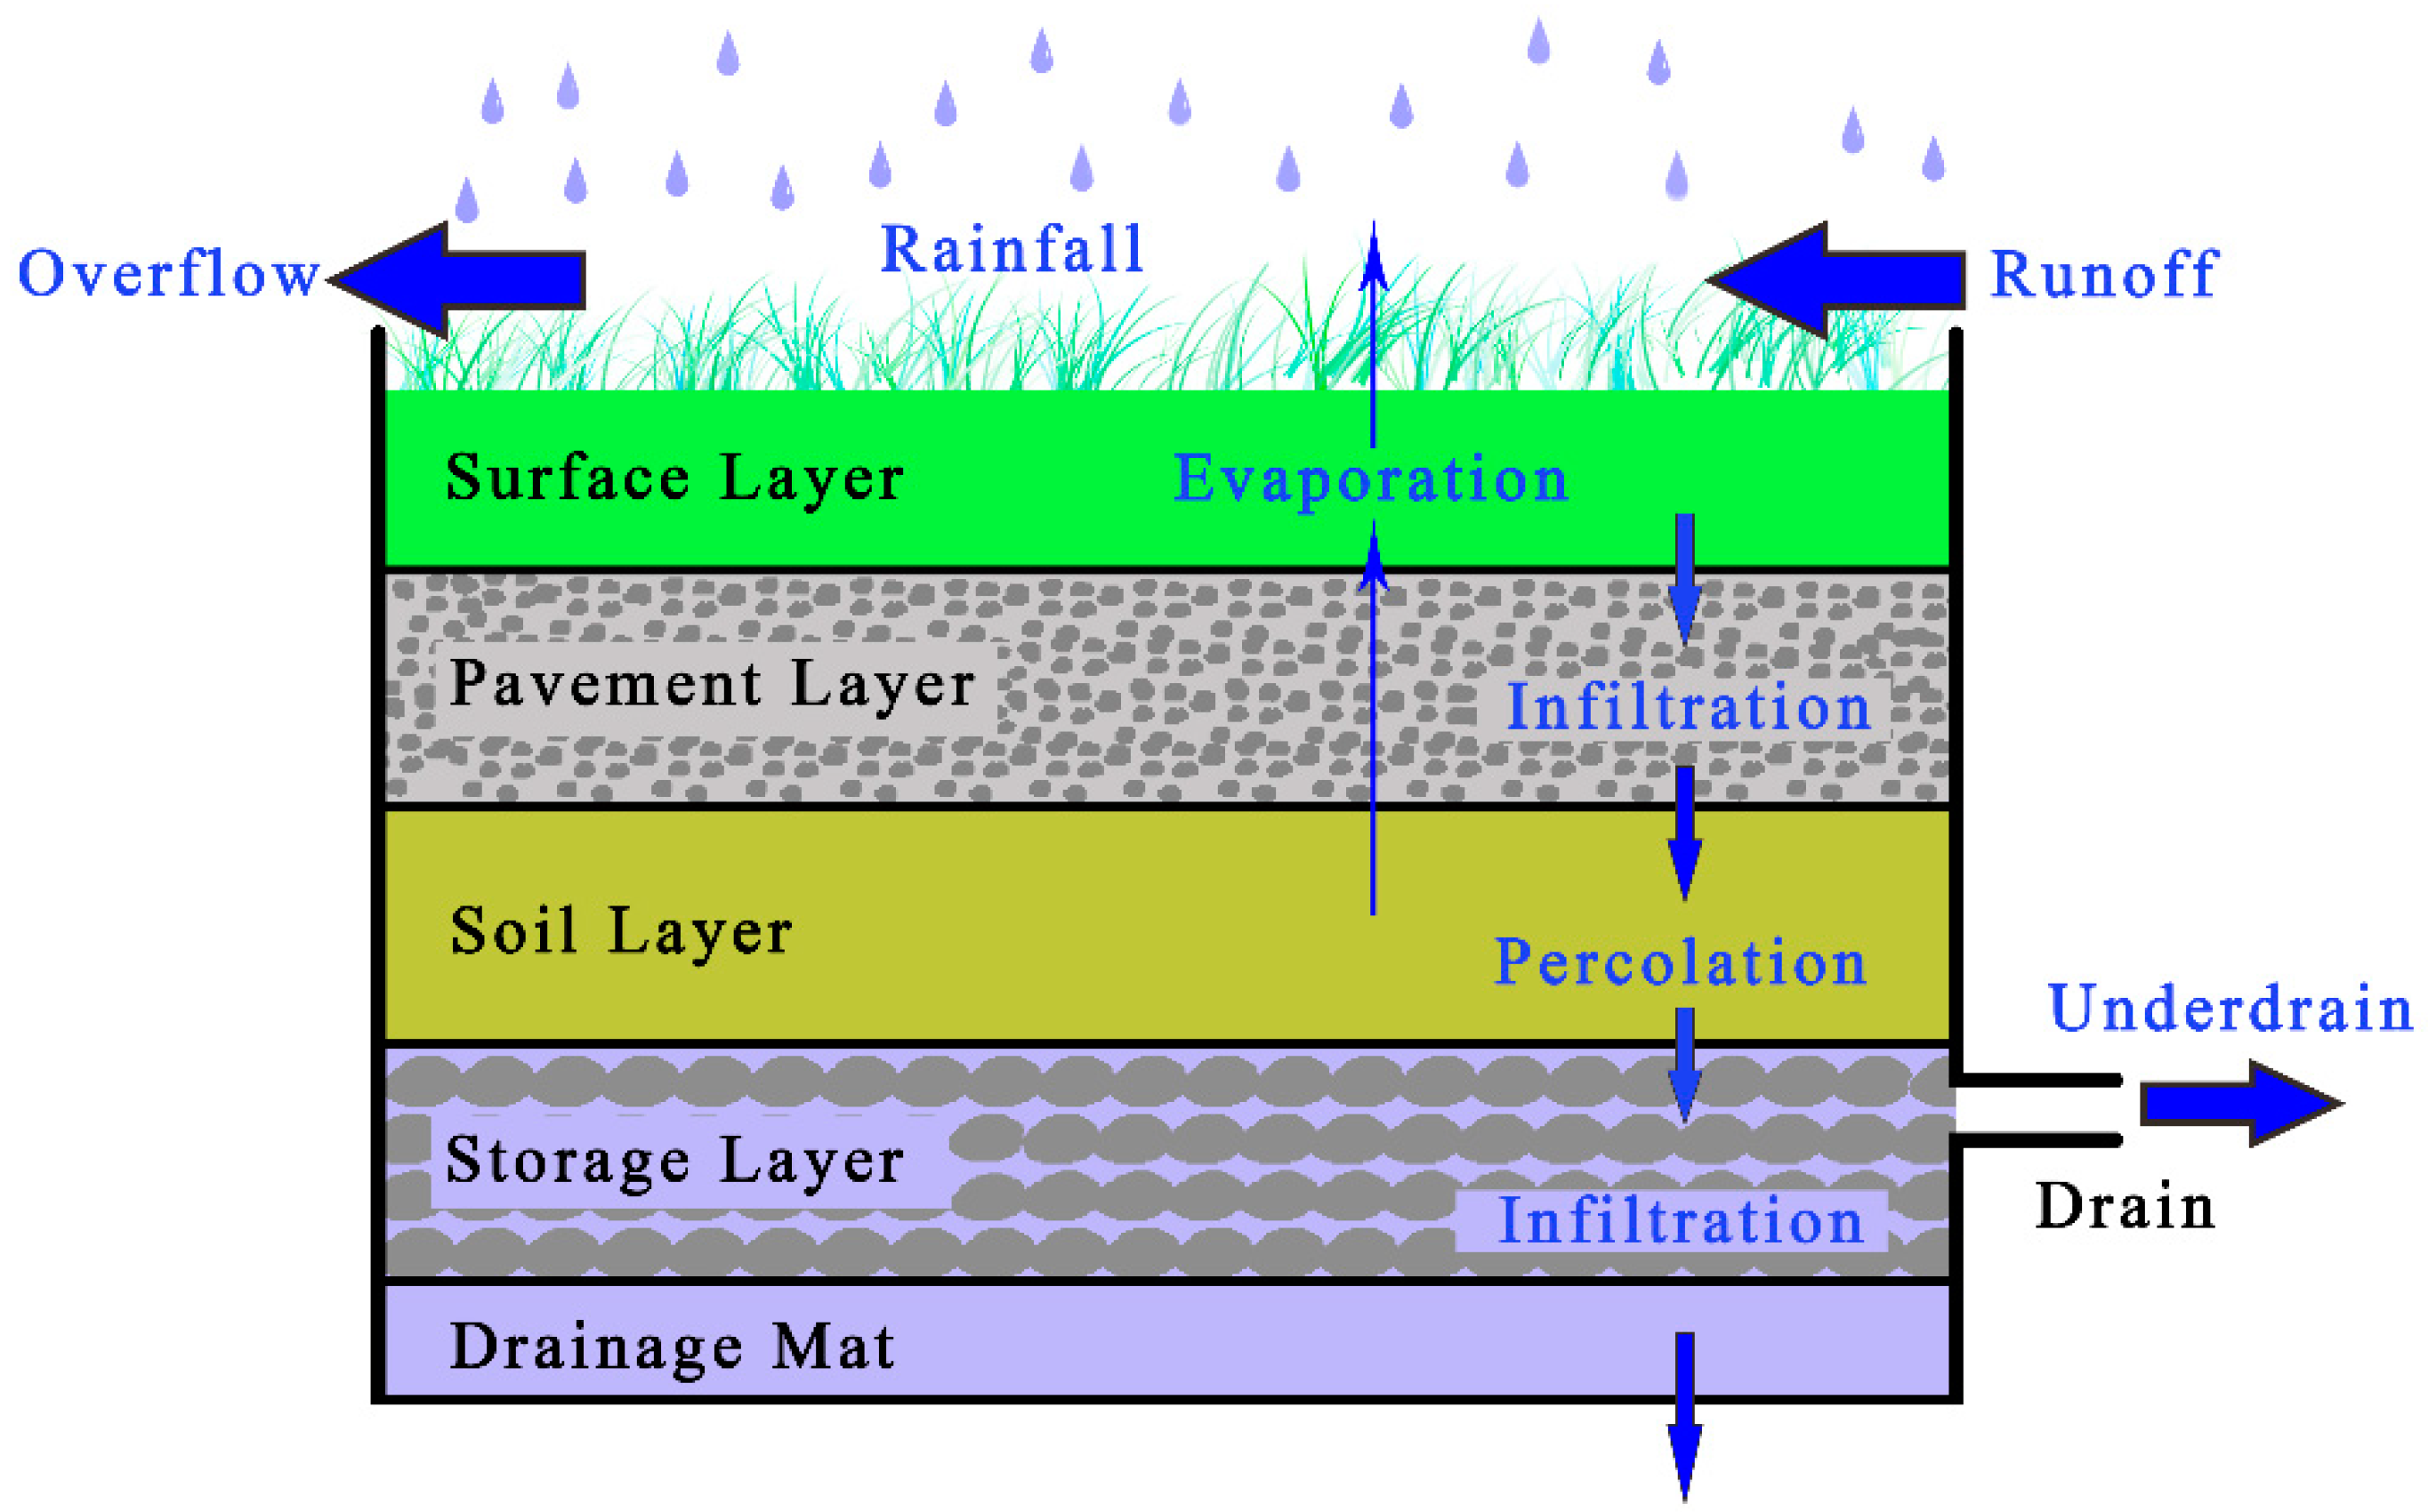
SWMM provides eight conceptual models of LID control, including bioretention cells, rain gardens, green roofs, infiltration trenches, continuous permeable pavement, rain barrels, rooftop disconnection, and vegetative swales. In SWMM, LID controls are represented by a combination of vertical layers (Figure 3), and each kind of LID control has a different number of layers (Table 1). During a simulation, SWMM performs a moisture balance that keeps track of how much water moves between and is stored within each LID layer.
2.3.2. Source of Data and Model Setup
The sub-catchment was mainly divided referring to the local road network map. The model of the local rainwater drainage system was established according to the pipe network diagram provided by the local municipal department.
For parameters of sub-catchment, the connectivity between sub-catchment and junction (Outlet) was determined by drainage direction. The area of sub-catchment (Area) and the proportion of impervious area (%Imperv) were estimated by satellite photos. The width of the overland flow path was calculated by Equation (1). The infiltration in this paper was calculated by the Horton model.
where W is the width of the overland flow path (m), A is the area of sub-catchment (m2), and l is the length of the overland flow path (this parameter is 150 m according to relevant research in China [28]).
W = A/l
For parameters of junctions, the elevation of junction′s invert (Invert EI) and maximum water depth (Max. depth) was supplied by the local municipal department. For junctions lacking the data of Invert EI, this parameter was calculated according to the adjacent junctions and relevant national standards in China.
For conduits, cross-section geometry (Shape), conduit length (Length), inlet offset, and outlet offset were provided by the local pipe network diagram.
2.3.3. Model Calibration
Model calibration is necessary to ensure that the model can correctly reflect the situation of the study area. The location of waterlogging, pounding area, ponding depth, and frequency were recorded by inquiring residents during the field survey. The model is calibrated by comparing the simulation result with the data collected in the survey. When the field survey is carrying out, the drainage channels downstream of the No.1 flooding node was under construction, leading to differences between simulation results and investigation results. For other flooding nodes, the simulation results were consistent with the investigation data (as shown in Table 3 and Figure 4).
2.4. Scenario Setting
2.4.1. Rainfall Events
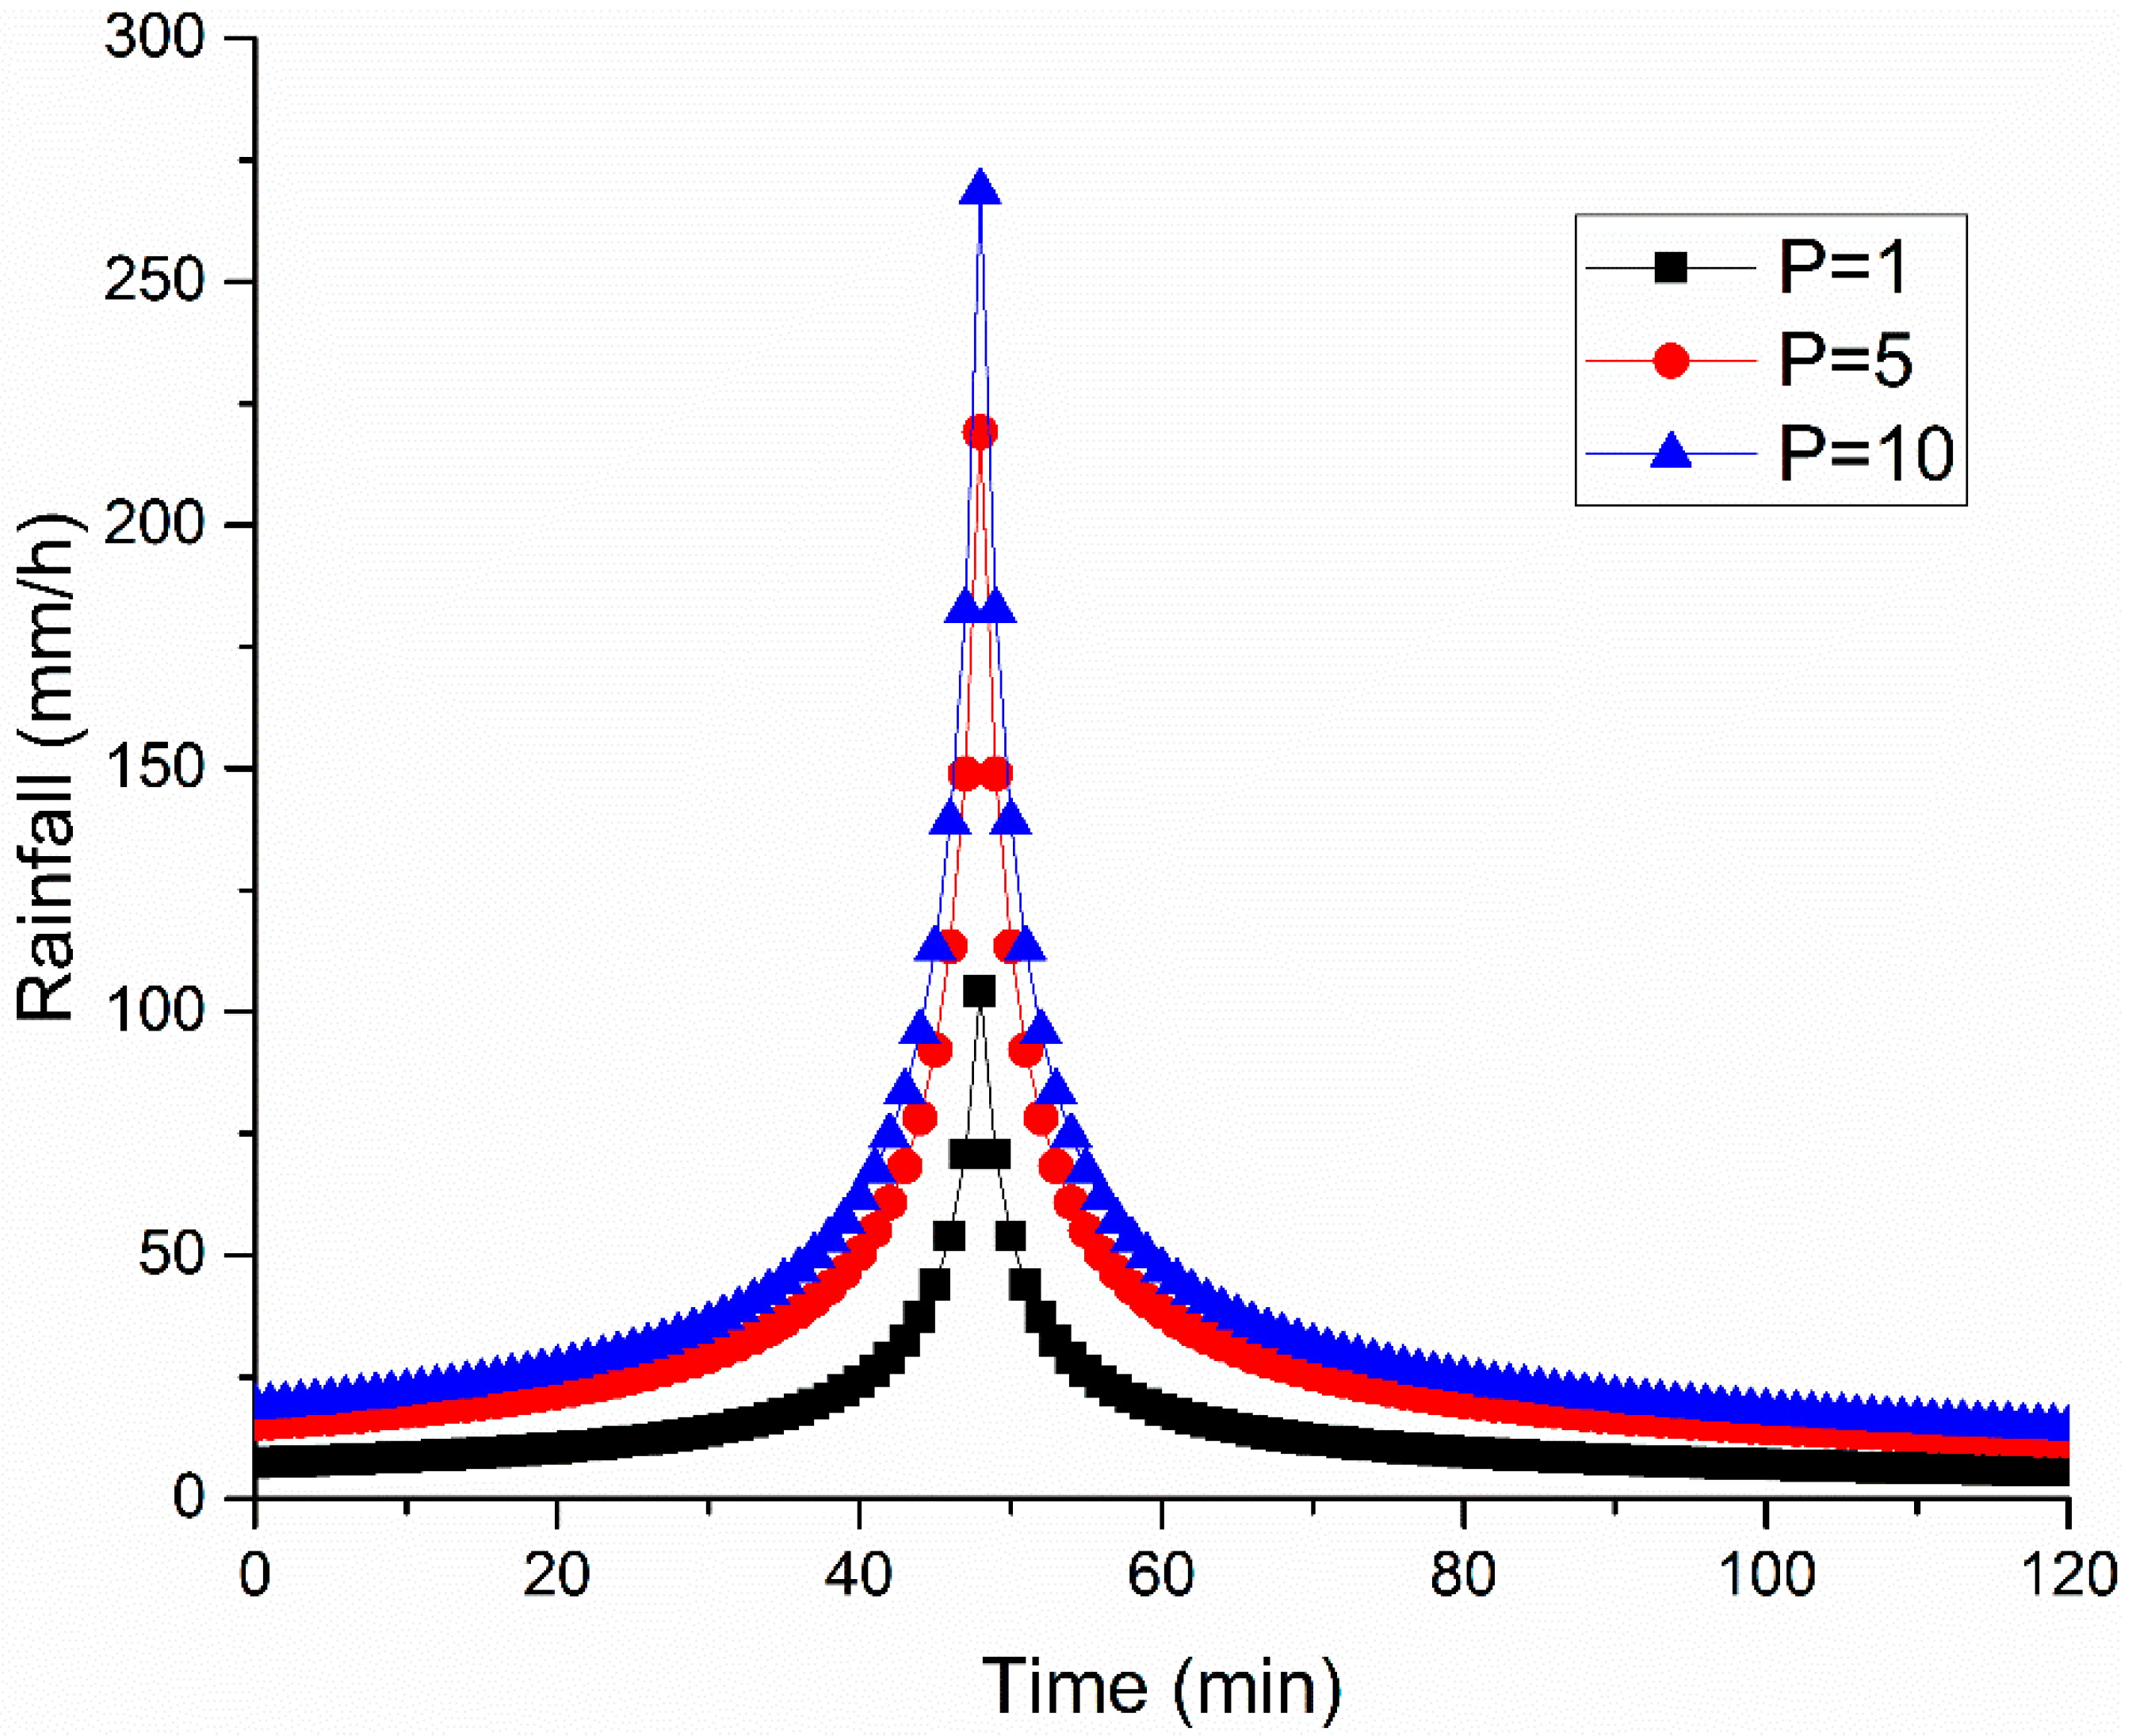
The rainfall events adopted in the simulation were designed by the Chicago rainfall pattern according to the local rainstorm formula. Existing research shows that LID controls have a good reduction effect on runoff caused by low recurrence period rainfall events [29]. In the calculation, rainstorm with recurrence period of 1 year (P = 1), 5 years (P = 5), and 10 years (P = 10) was selected for discussion. The rainfall processes are shown in Figure 5.
2.4.2. Schemes for Simulation
To choose the LID reformation strategy for the study area reasonably, an analysis of the underlying surface of the area is necessary. By analyzing the satellite photos of the study area, the underlying surface of the study area was divided into five types of land use, including green spaces, water, roofs, municipal pavements, and other impervious surfaces (mainly roads and squares in residential areas), as shown in Table 4.
No kinds of LID controls could be built on water and municipal pavements. While bioretention cells, permeable pavements, and green roofs can be built on green spaces, roads and squares in residential areas, and suitable roofs, respectively. Therefore, bioretention cells, permeable pavements, and green roofs were selected as the key LID controls for this research. The parameters of each kind of LID control are listed in Table 5.
To propose the engineering strategies of LID reformation in densely populated old urban areas, this research was divided into two phases. In the first phase of the study, the runoff mitigation performance of schemes with a single kind of LID control was compared. To describe the maximum potential of a single kind of LID in runoff control, each scheme changed all suitable underlying surfaces into LID control. To compare the performance of schemes with single and combined LID controls, in the second phase, schemes with combined LID controls were simulated based on the results of the first phase.
According to the field survey, the underground space of the study area was fully developed, occupying 57.73% of the total area and 80.59% of residential land. Since most of the underlying surfaces suitable for the bioretention cells and permeable pavements are distributed in residential land, bioretention cells and permeable pavements were set impermeable into the local soil layer. The simulation schemes are as follows:
- (1).
- Bioretention cells
Take bioretention cells as the only LID control in the scheme, and transform all the green space in the study area into bioretention cells. In this scheme, the total area of LID controls is 821.88 ha. The bioretention cells were set to receive runoff from all green spaces and roofs.
- (2).
- Permeable pavements
Take permeable pavements as the only LID control in the scheme, and transform all impervious surfaces except the roofs and the municipal pavements in the study area into permeable pavements. In this scheme, the total area of LID controls is 405.79 ha. The permeable pavements were set to receive runoff on their surface.
- (3).
- Green roofs
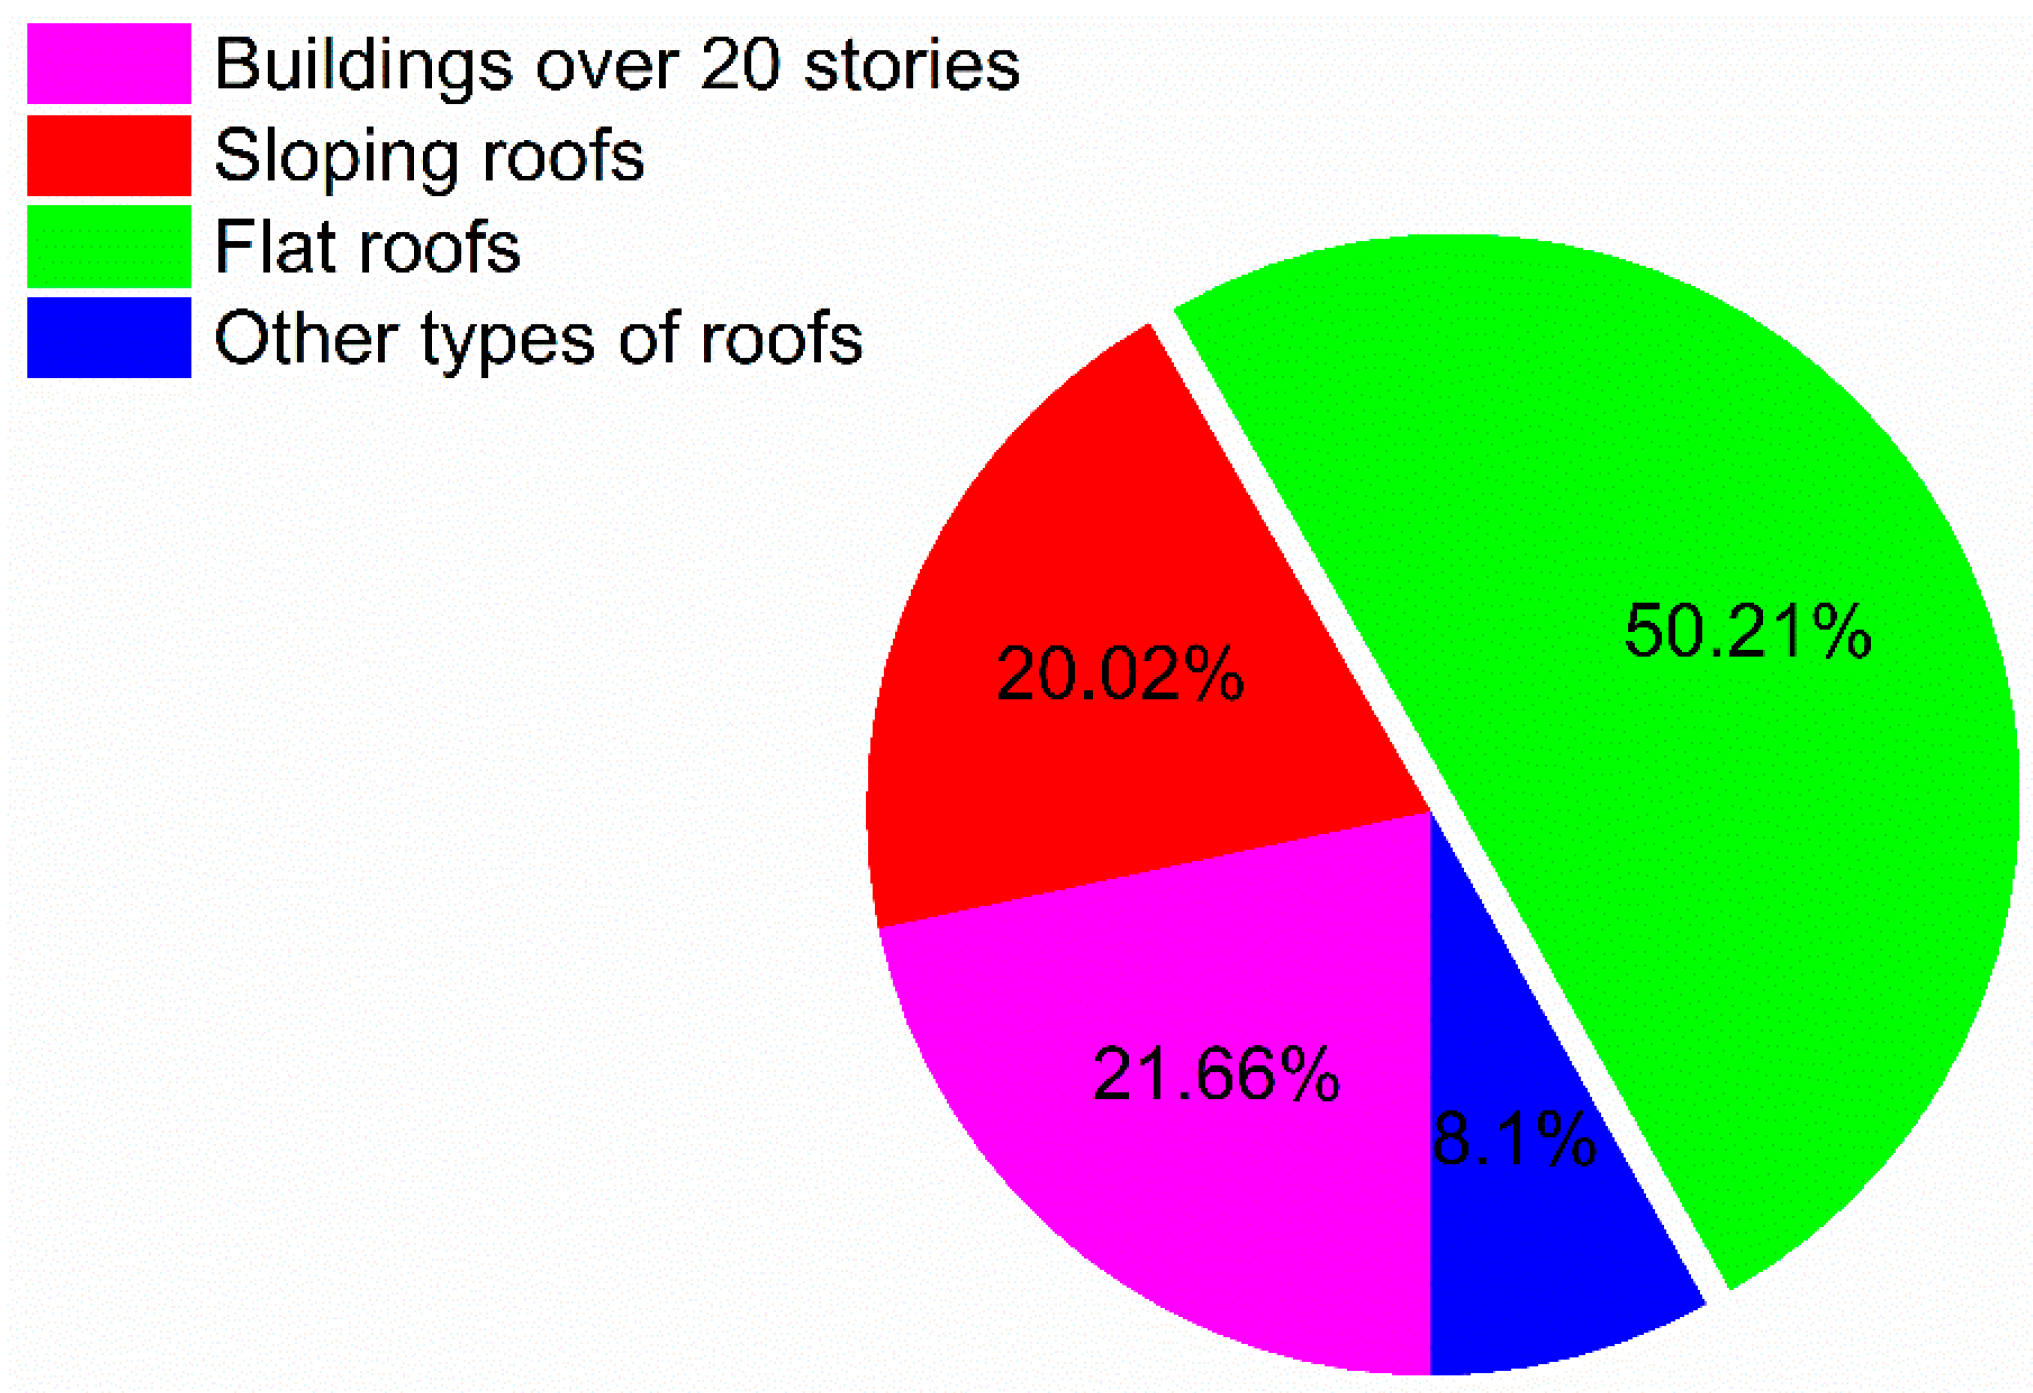
When building a green roof, it′s important to analyze the situation of the building roof. During the field survey, the height and roof condition of buildings in the study area were statistically analyzed. The result is shown in Figure 6, indicating 50.21% of the roofs in the study area can be reformed into green roofs, occupying 10.57% of the study area.
This scheme takes green roofs as the only LID control and transforms all suitable roofs in the study area into green roofs. In this scheme, the total area of LID control is 254.32 ha. The green roofs were set to receive runoff on their surface.
- (4).
- Combined schemes
Schemes with different combinations of LID controls were established based on the results of schemes with a single kind of LID control, and the performances of runoff controls were compared.
3. Results and Discussion
3.1. Effect of Schemes with Single LID Control
3.1.1. Outlet Flow Process of Schemes with Single LID Control
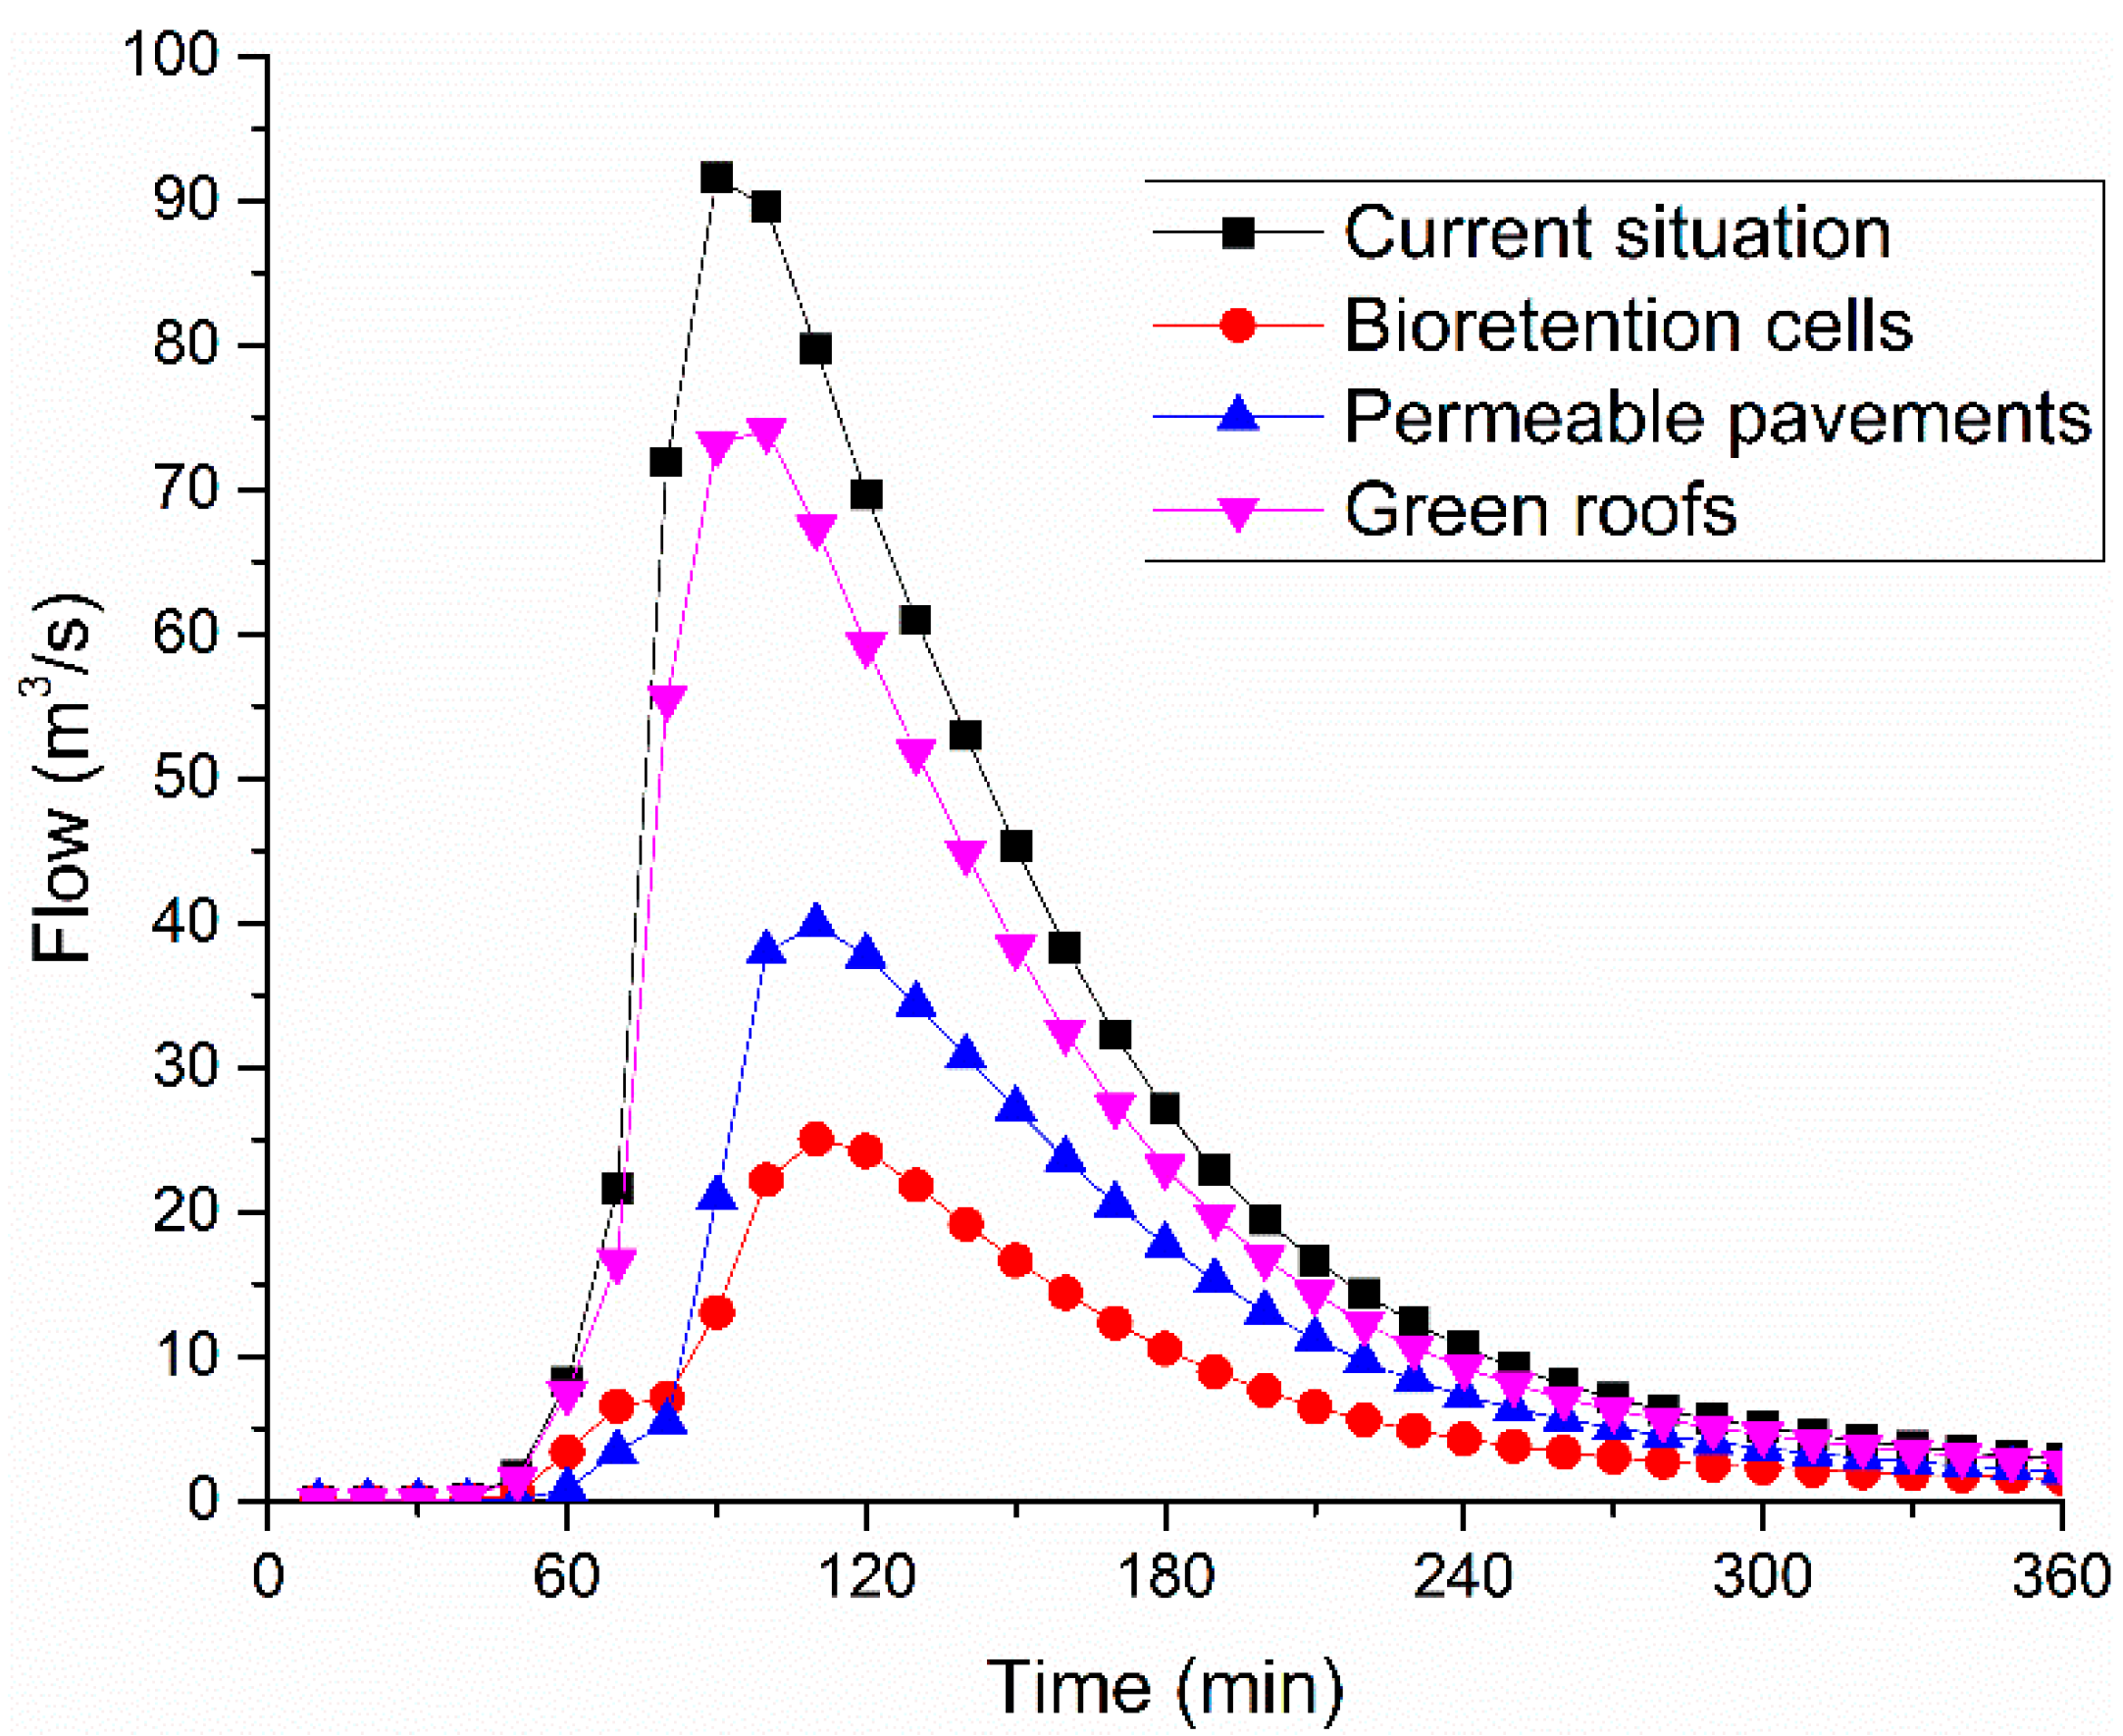
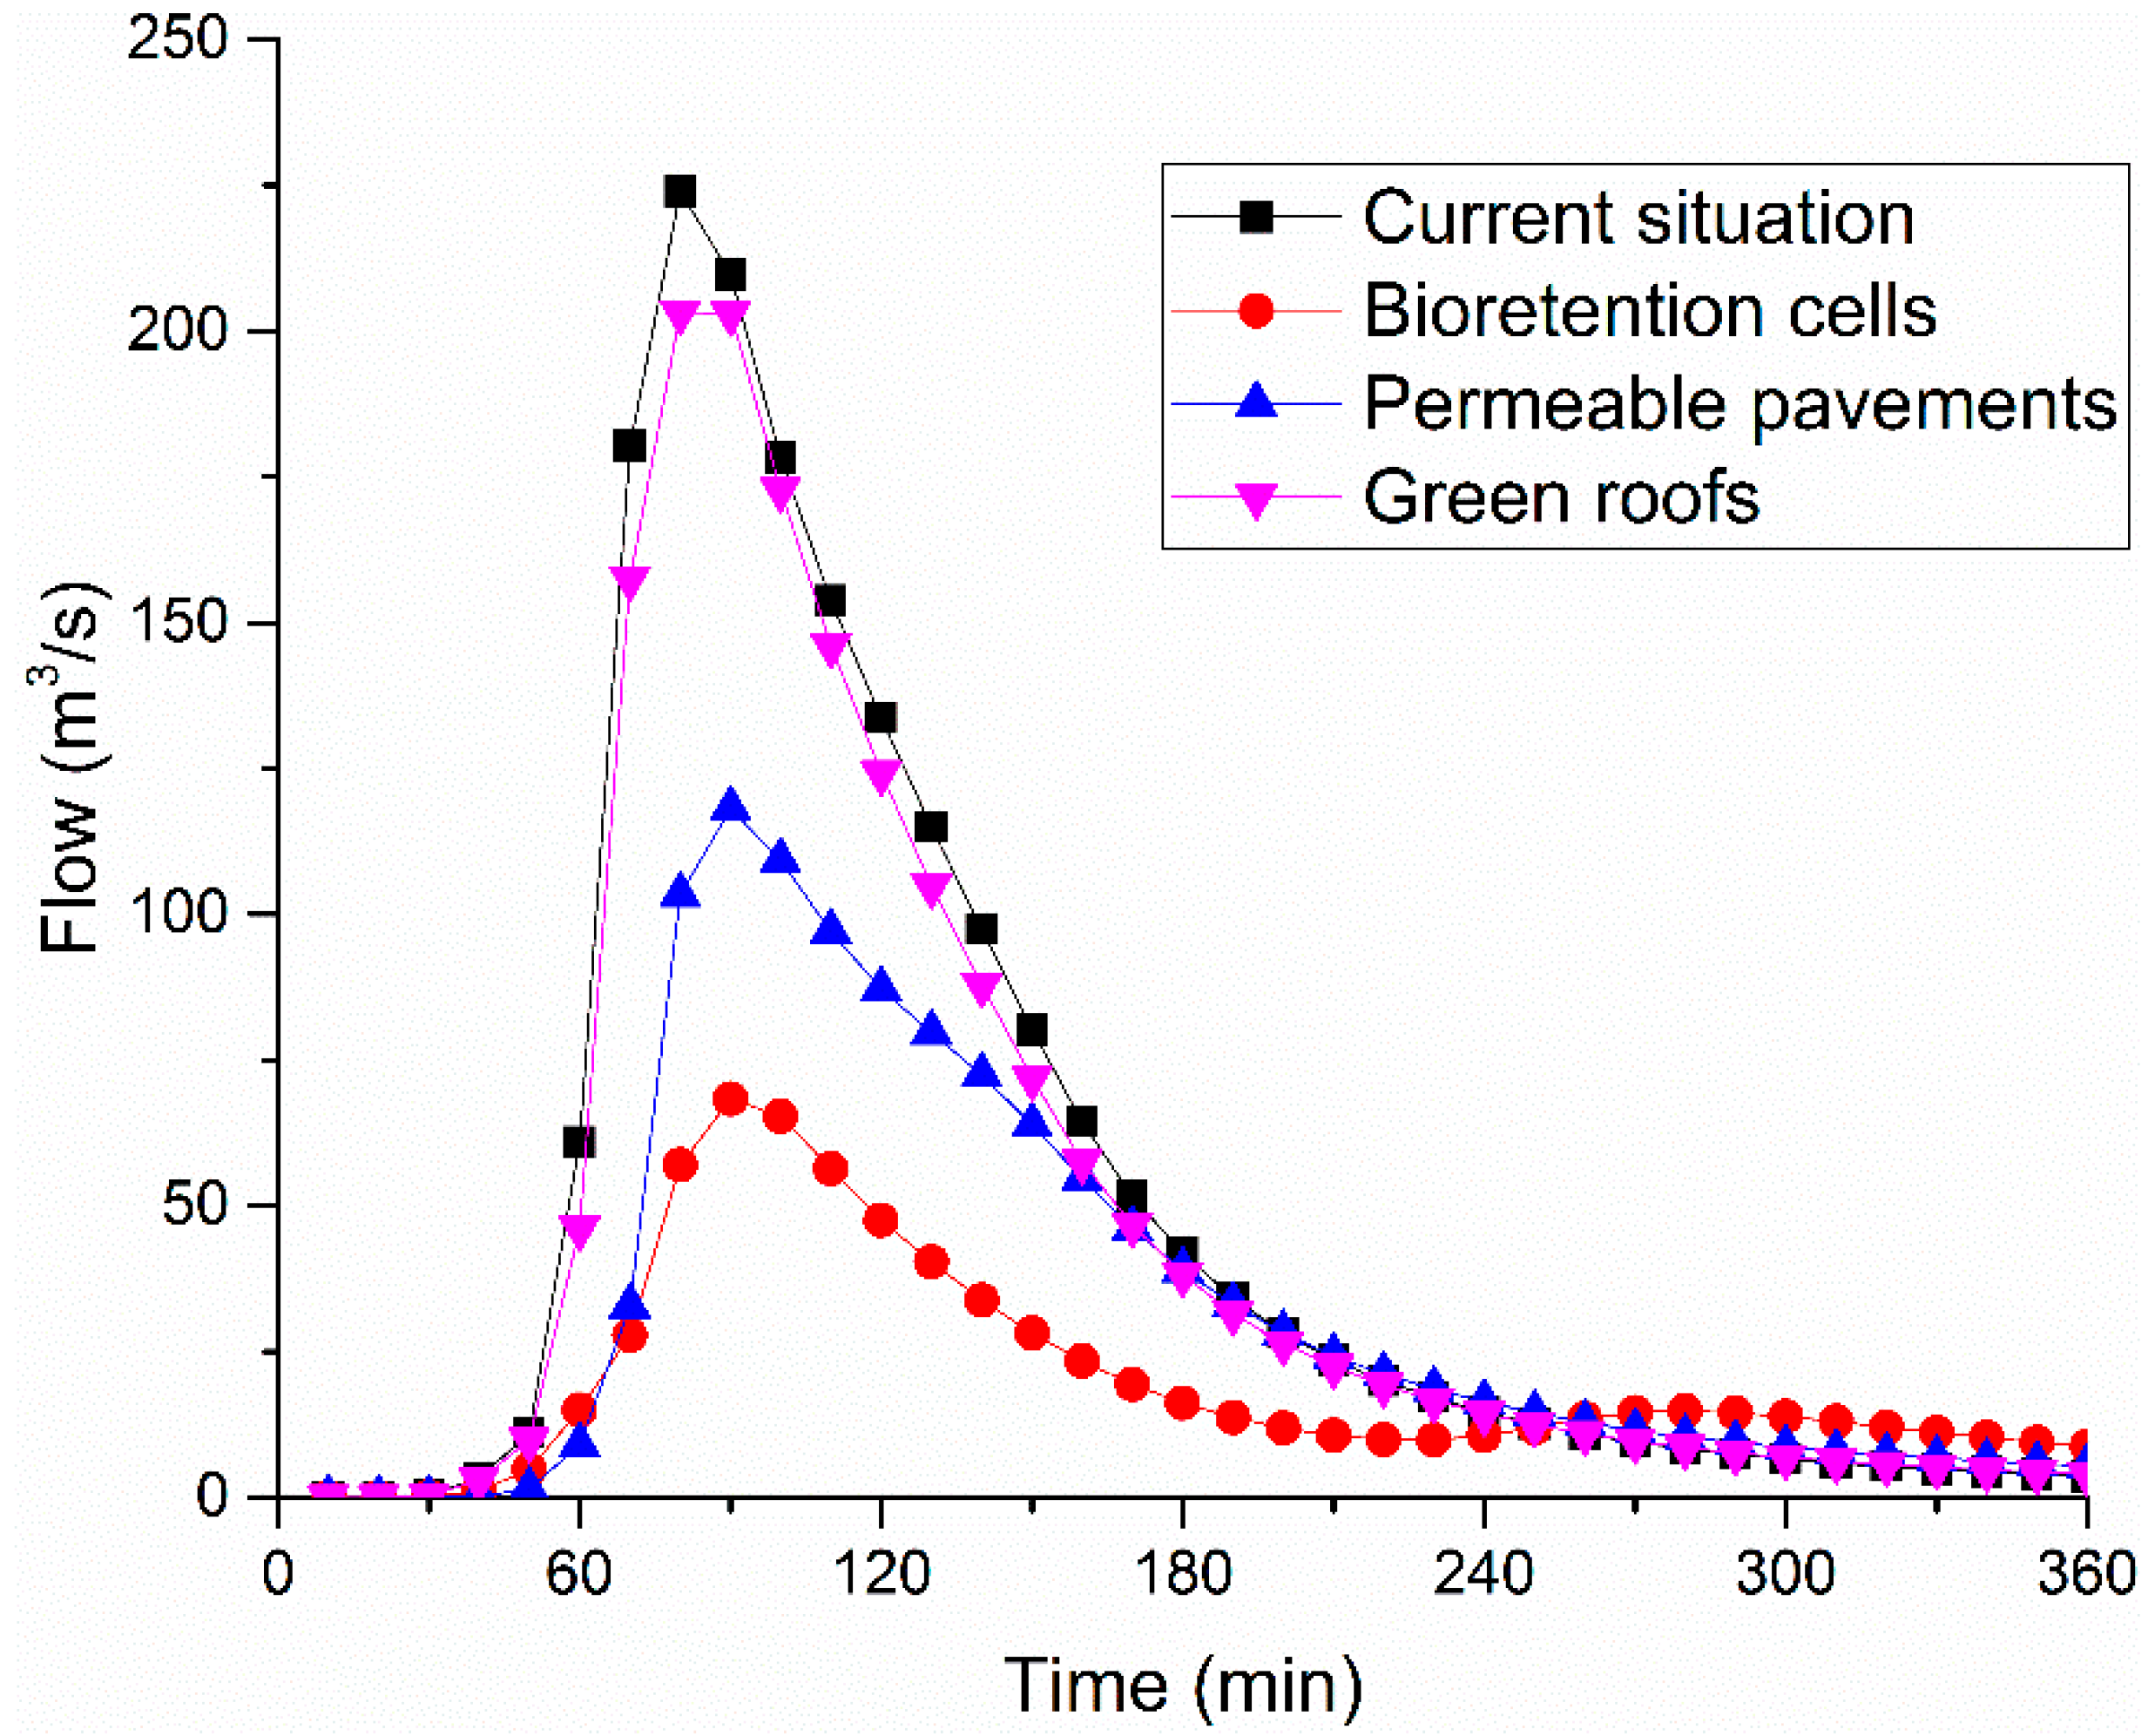
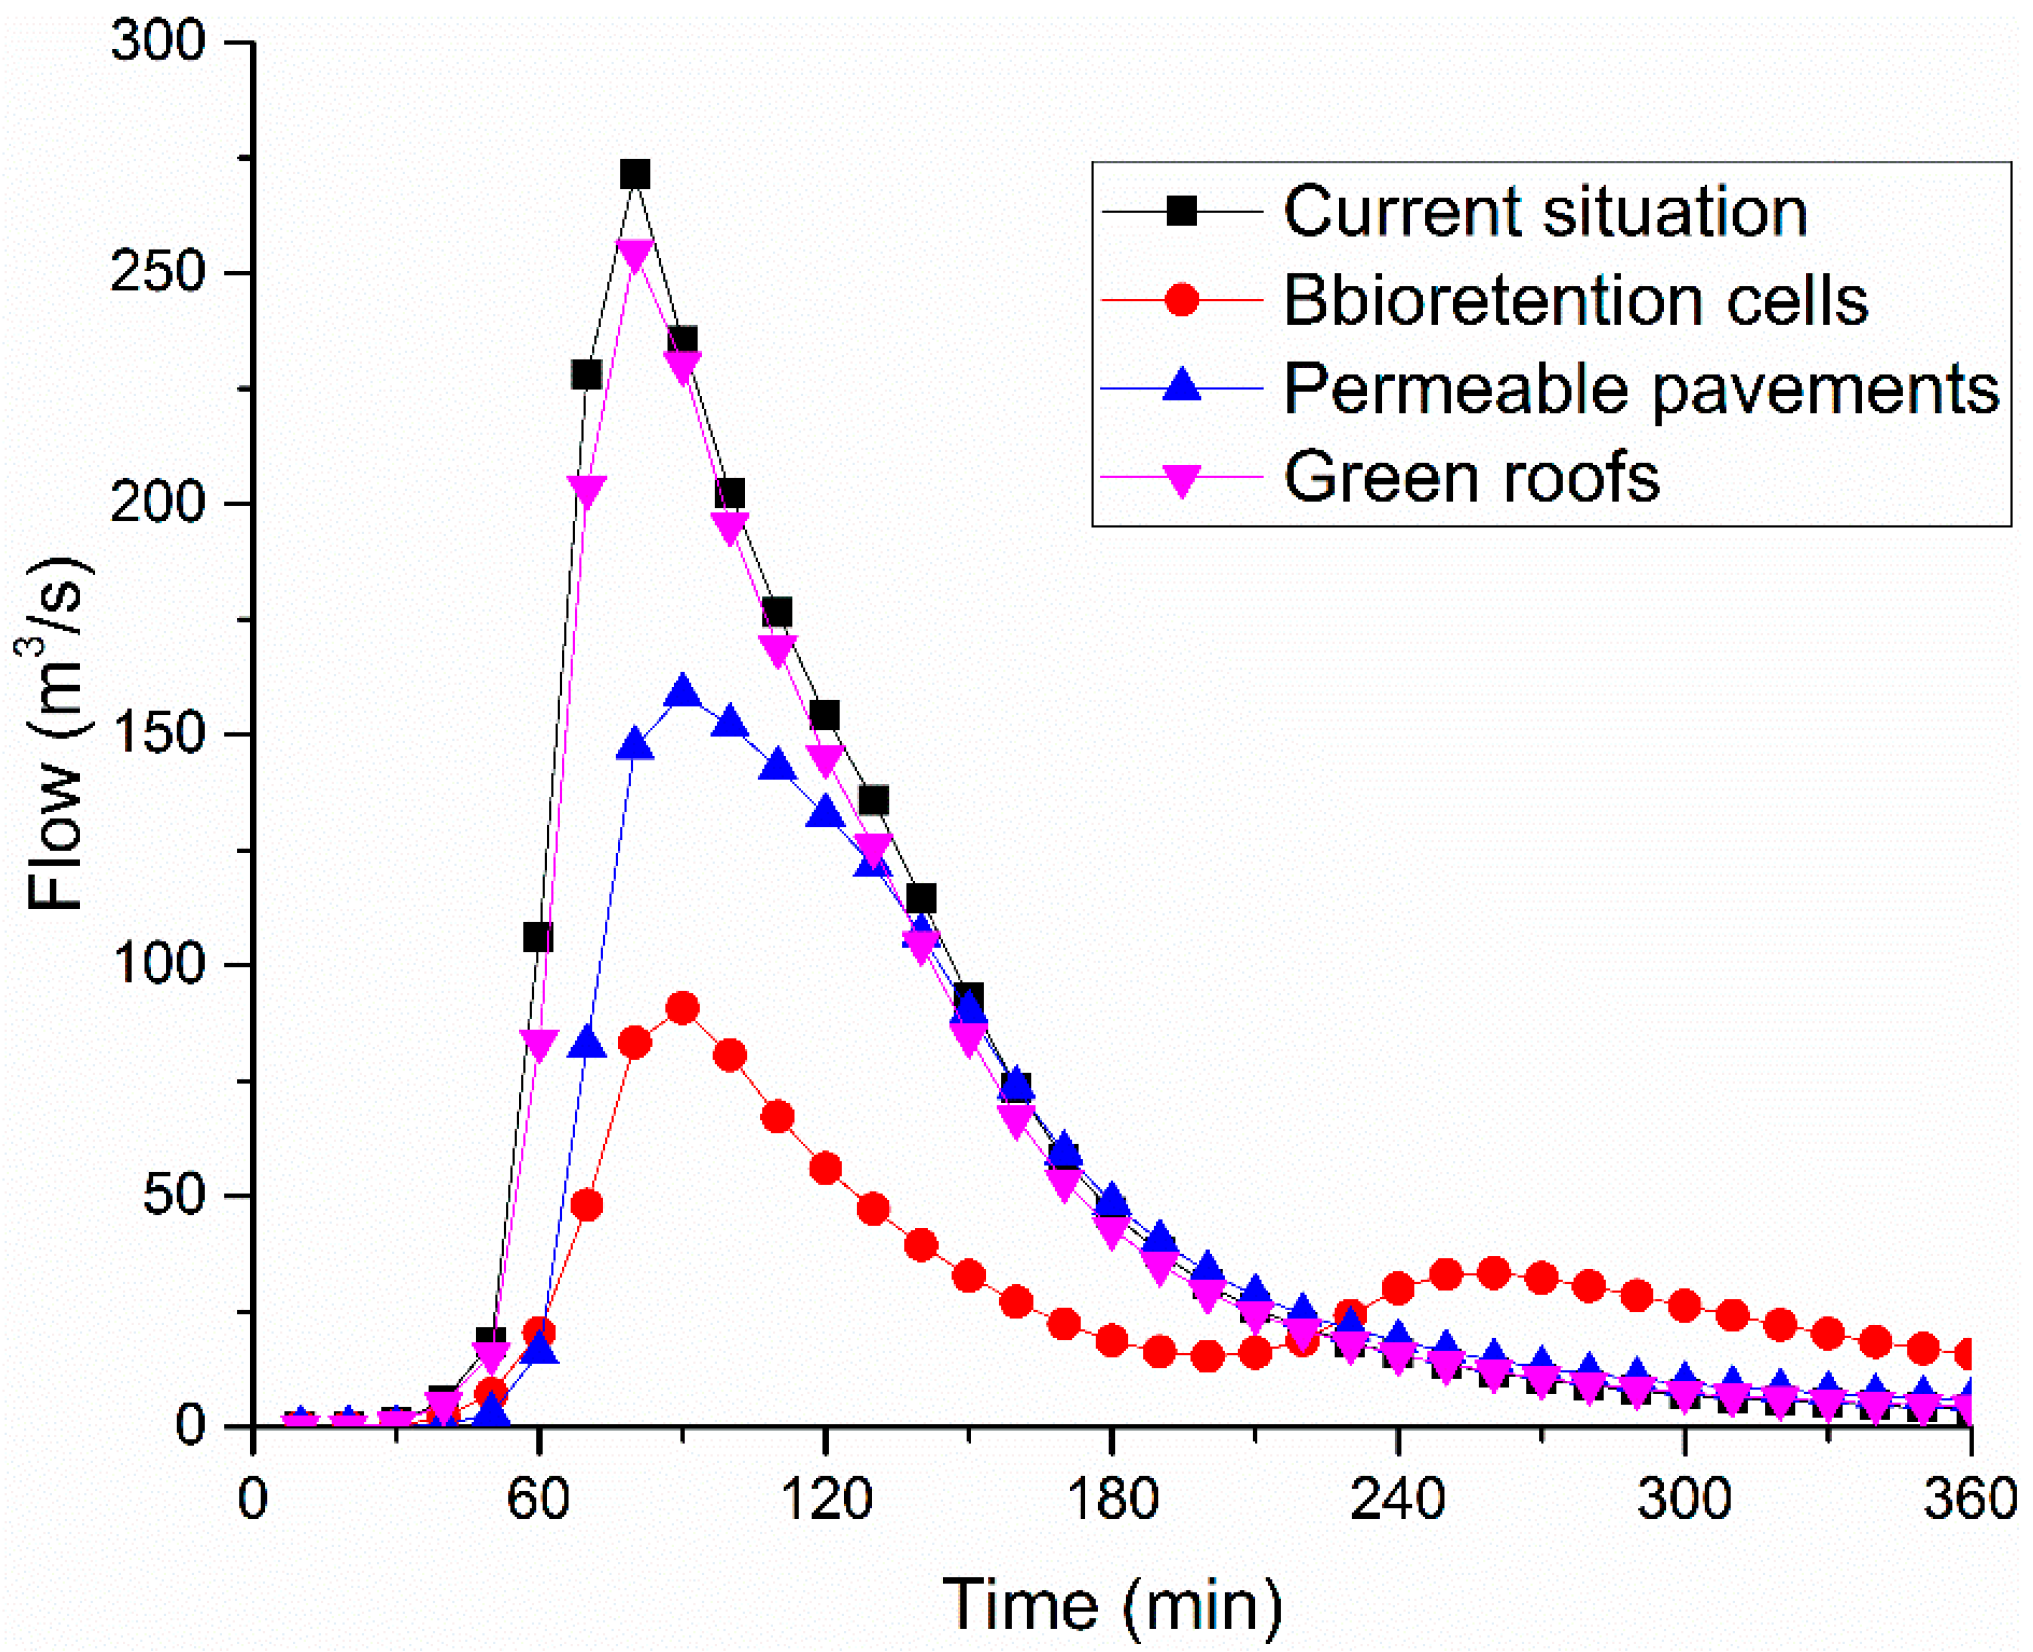
According to the simulation results, the outlet flow process of the study area with each scheme is shown in Figure 7, Figure 8 and Figure 9 under rainstorm recurrence periods of 1 year (P = 1), 5 years (P = 5), and 10 years (P = 10).
When the rainstorm recurrence period is 1 year (P = 1), the peak of outlet flow appears at the 93th minute (92.67 m3/s) without LID controls. Under the scheme with bioretention cells, the peak was delayed for 19 min compared with the current situation, and the value of peak flow was reduced by 67.56 m3/s (72.91%). Under the scheme with permeable pavements, the peak was delayed for 15 min, and the value of the peak flow was reduced by 52.70 m3/s (56.87%). Under the scheme with green roofs, the peak was delayed for 3 min, and the value of the peak flow was reduced by 17.55 m3/s (18.94%).
When P = 5, the peak of outlet flow appears at the 82nd minute (225.97 m3/s) without LID controls. Under the scheme with bioretention cells, the peak was delayed for 10 min compared with the current situation, and the value of peak flow was reduced by 157.22 m3/s (69.58%). Under the scheme with permeable pavements, the peak was delayed for 7 min, and the value of the peak flow was reduced by 107.75 m3/s (47.68%). Under the scheme with green roofs, the peak was delayed for 4 min, and the value of the peak flow was reduced by 16.58 m3/s (7.34%).
When P = 10, the peak of outlet flow appears at the 80th minute (271.32 m3/s) without LID controls. Under the scheme with bioretention cells, the peak was delayed for 8 min compared with the current situation, and the value of the peak flow was reduced by 180.21 m3/s (66.42%). Under the scheme with permeable pavements, the peak was delayed for 9 min, and the value of the peak flow was reduced by 112.54 m3/s (41.48%). Under the scheme with green roofs, the peak was delayed for 2 min, and the value of the peak flow was reduced by 13.32 m3/s (4.19%).
The outlet flow process of schemes with different LID controls indicates that these three kinds of LID controls have certain runoff mitigation effects. The scheme with bioretention cells has the most obvious runoff control effect. For a rainstorm with a rainstorm recurrence period of less than 10 years, the peak flow can be reduced by more than 66.42%, and the appearance of the peak could be delayed for more than 8 min. On the one hand, the green space has the largest area among the land use types that are suitable for LID reformation, which means that bioretention cells are the LID control with the largest space to construct in old urban areas. On the other hand, the surface layer and storage layer of bioretention cells can effectively store rainfall runoff and prevent part of the runoff from entering the drainage system for the first time. For permeable pavements, with a rainstorm recurrence period of less than 10 years, the peak flow could be reduced by over 41.48%, and the peak could be delayed for more than 7 min. Compared with bioretention cells, a surface layer of permeable pavements cannot store runoff, and the area suitable for permeable pavement is less than that for bioretention cells, which leads to the runoff control performance of permeable pavements is not as effective as bioretention cells. However, a similar soil layer structure provides an equal delay effect of runoff peak with bioretention cells. Although 23.02% of the underlying surfaces in the study area are roofs, the area suitable for green roofs is limited (only 10.57% of the study area) due to the limitation of building height and roof form. Since green roofs lack a water storage structure and a thin soil layer, the runoff control performance is unsatisfactory.
3.1.2. Waterlogging of Schemes with Single LID Control
According to the simulation results, the number of flooding nodes and total flood volume (the sum of flood volume of each flooding node) in the study area caused by rainstorms of 1-year, 5-year, and 10-year recurrence periods was recorded, as shown in Table 6.
The results indicate that schemes with bioretention cells or permeable pavements can significantly mitigate waterlogging. The flood volume can be reduced by more than 90% even under a rainstorm with a 10-year recurrence period. Under rainfall with a 1-year recurrence period, the scheme with green roofs can reduce 62.21% flood volume, but with the increase in rainfall intensity, the effect of flood volume mitigation becomes worse. When the rainfall recurrence period becomes 10 years, the scheme with green roofs can only reduce 11.33% of flood volume. The results are consistent with the simulation of outlet flow.
3.2. Effect of Schemes with Combined LID Controls
Results of schemes with single LID control indicate that the bioretention cells and permeable pavements have a good runoff mitigating effect. Green roofs not only face many restrictions in the construction process but also have a poor mitigation effect on waterlogging. Therefore, bioretention cells and permeable pavements were chosen for schemes with combined LID controls.
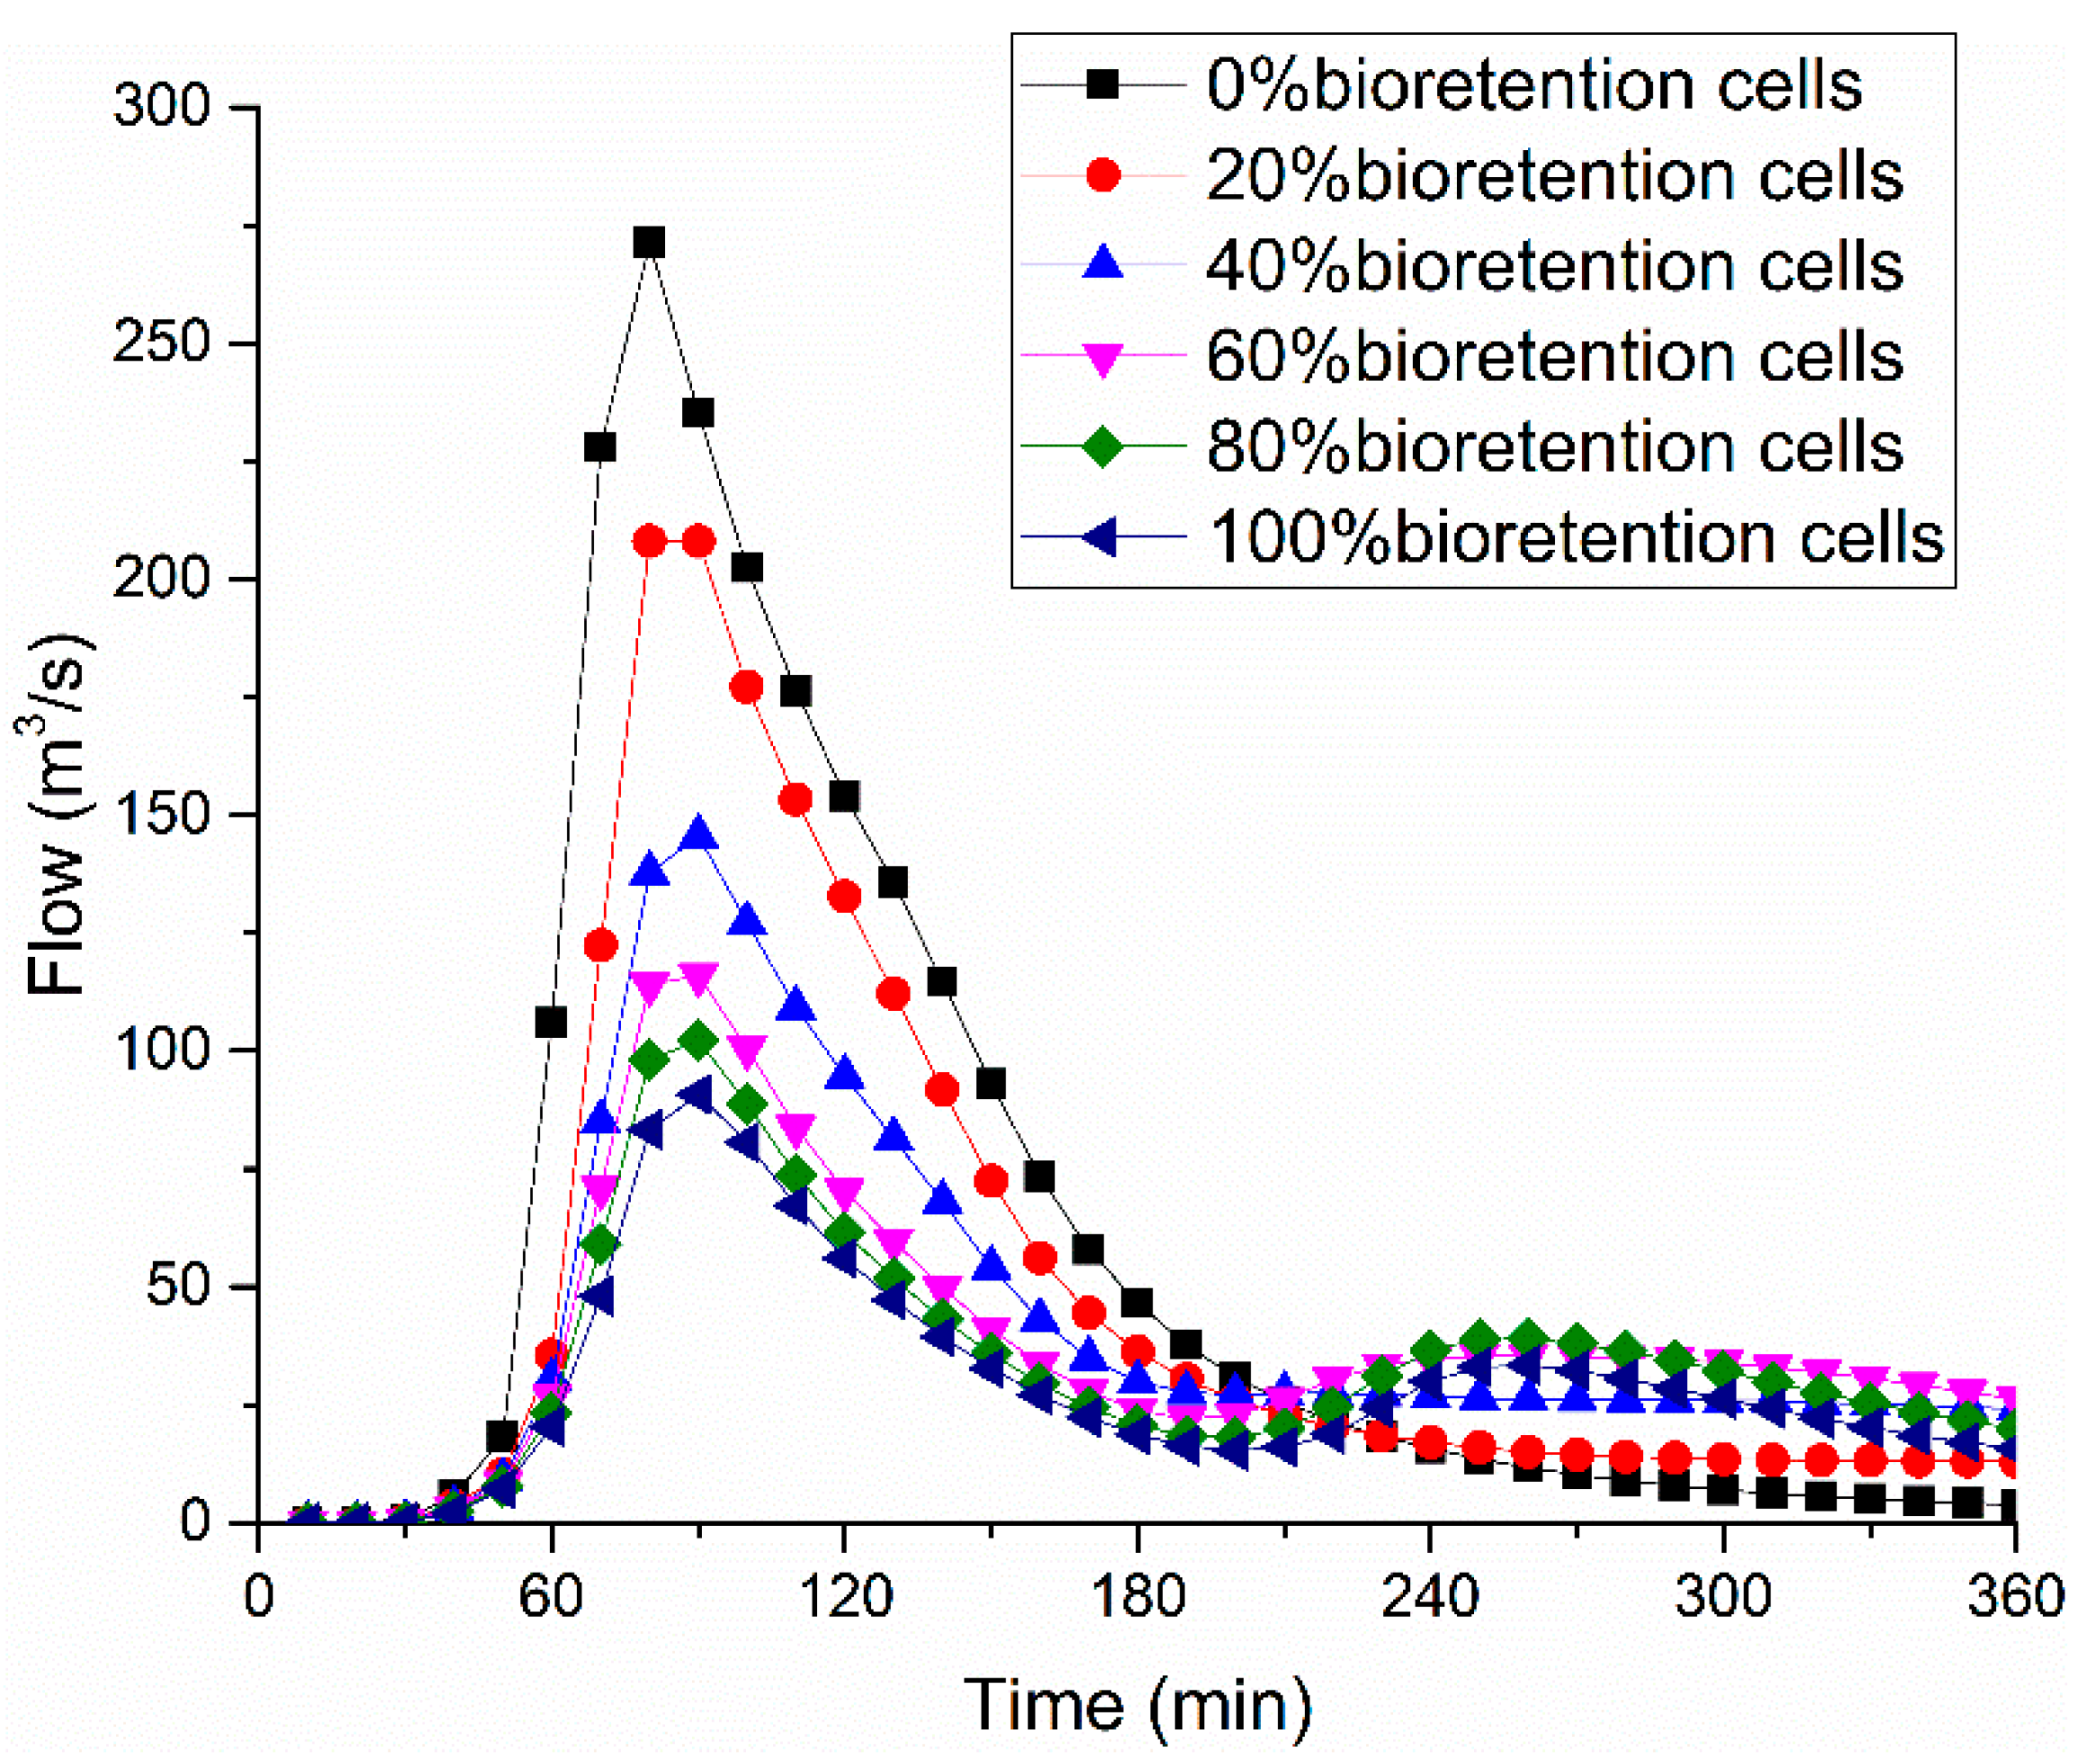
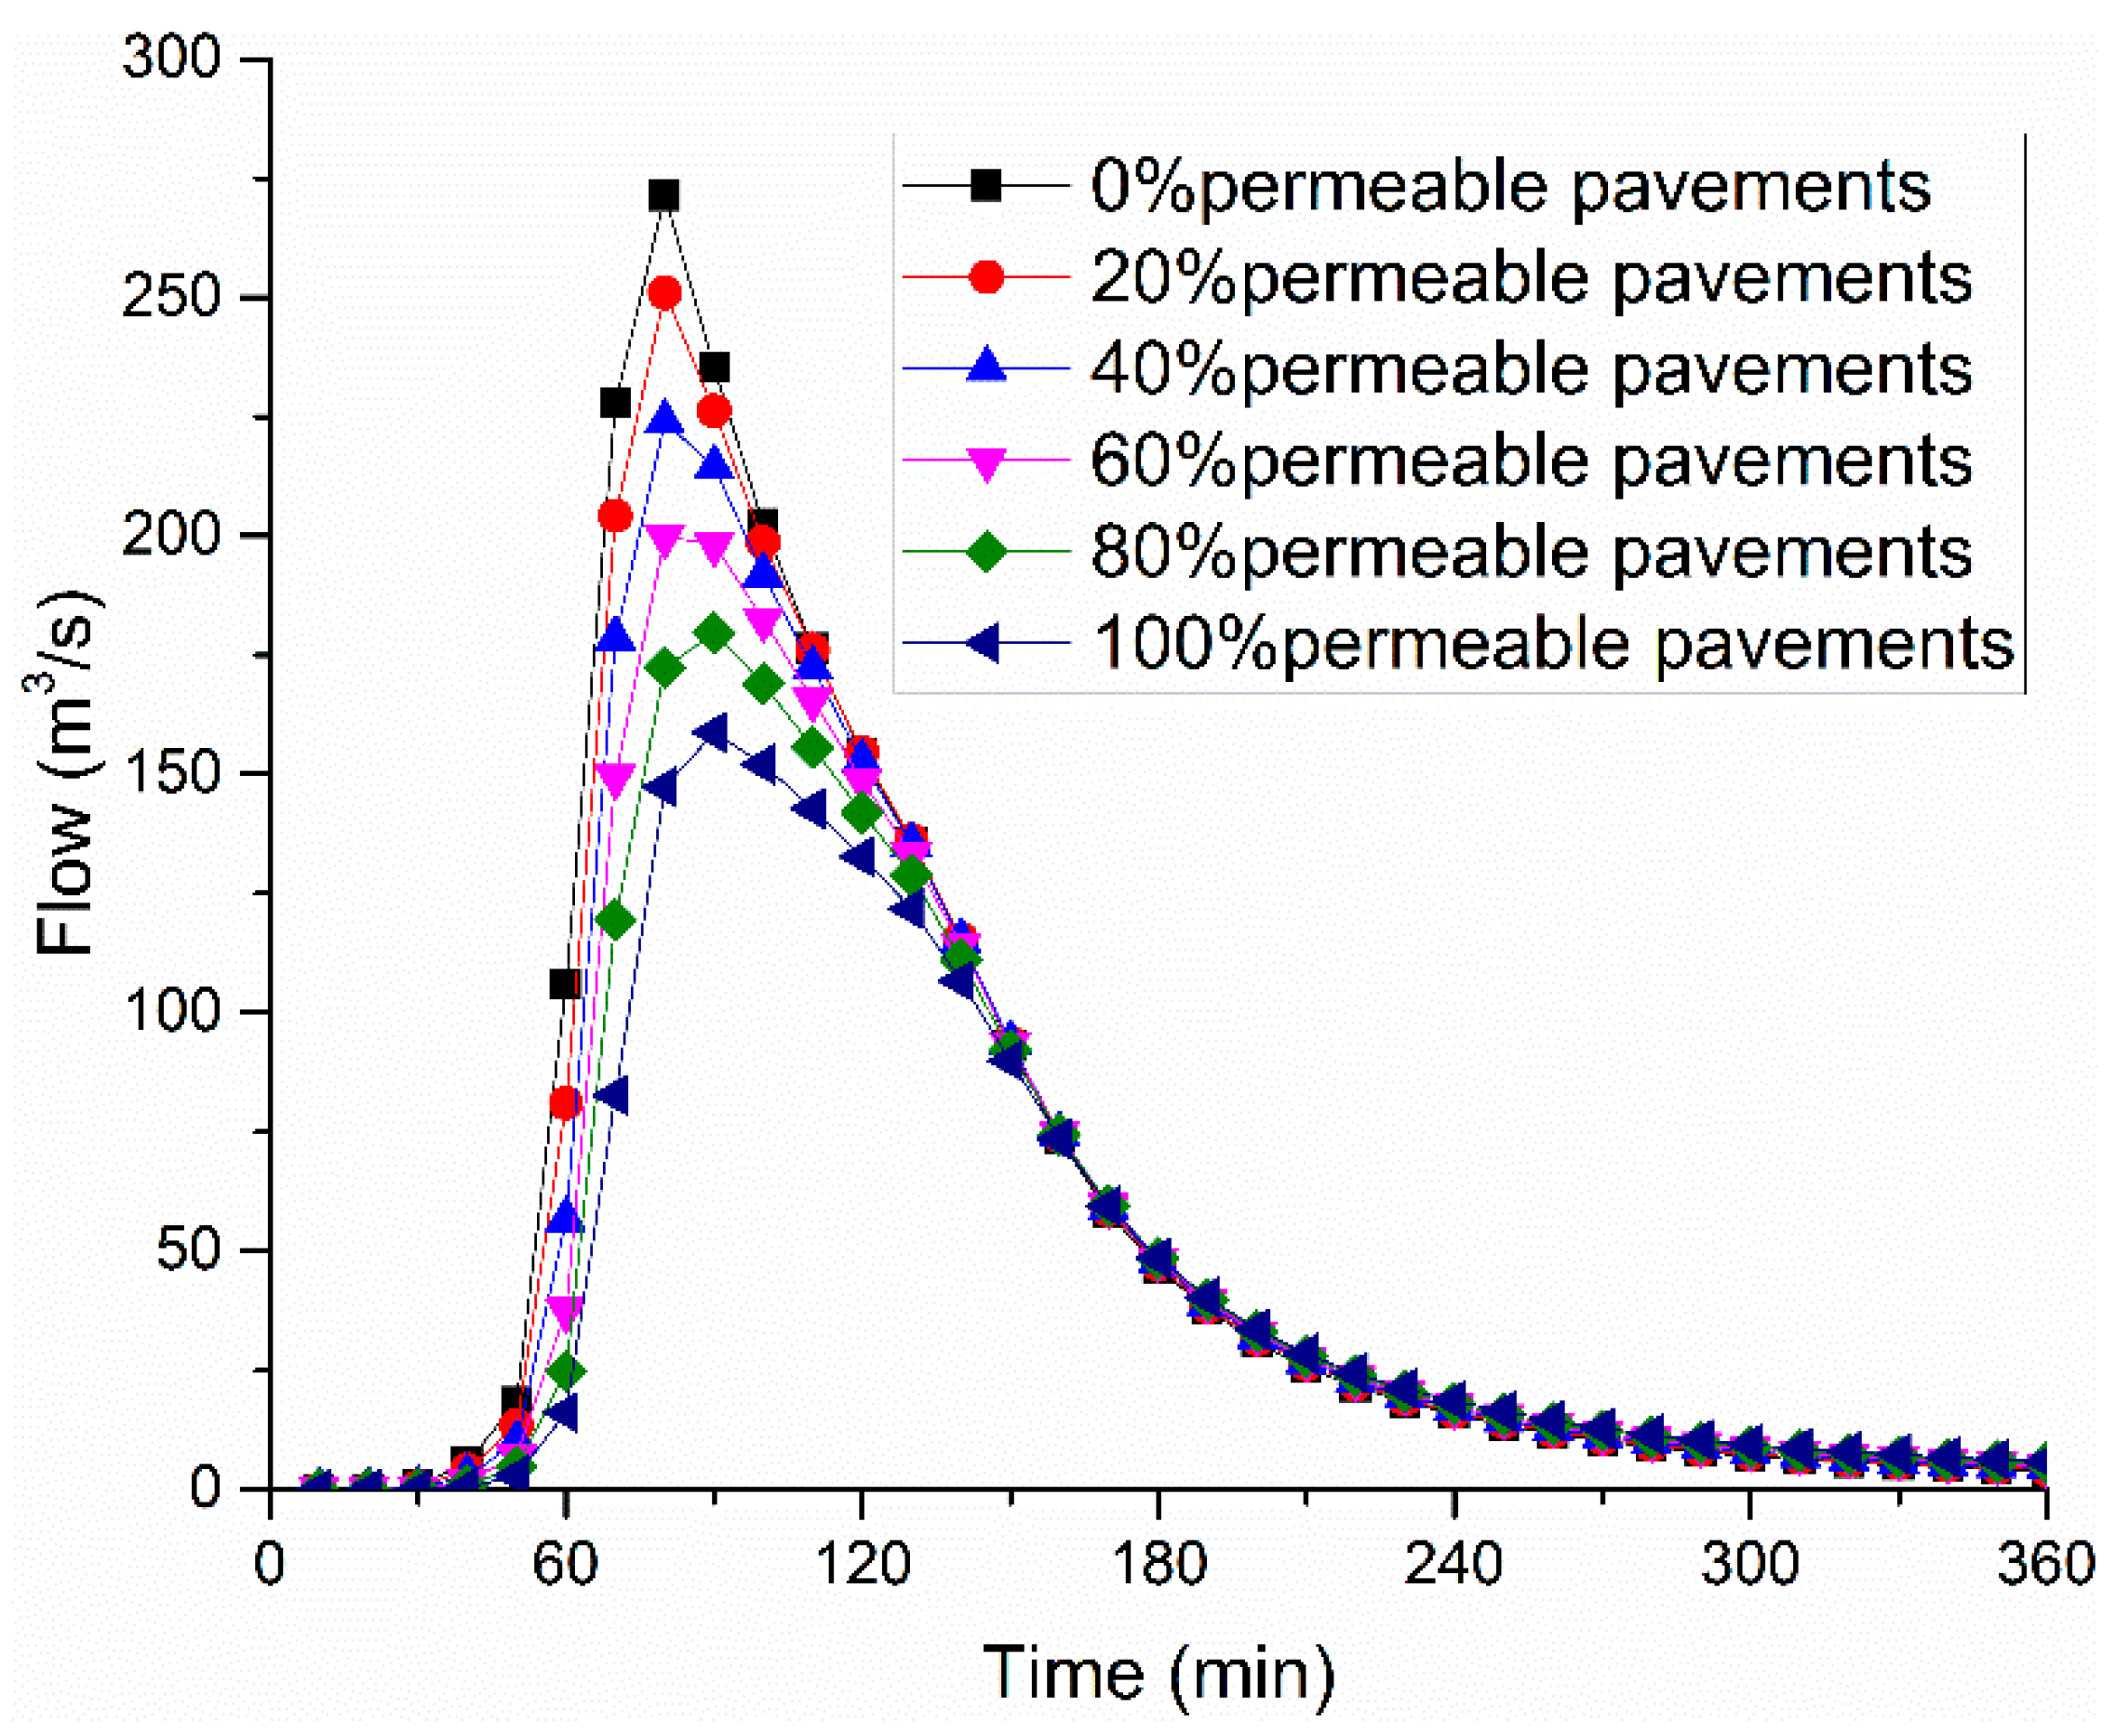
To understand the runoff control effect with different transformation proportions, the outlet flow process under P = 10 rainfall with different transformation proportions of the suitable underlying surface for bioretention cells and permeable pavement was simulated, respectively, as shown in Figure 10 and Figure 11.
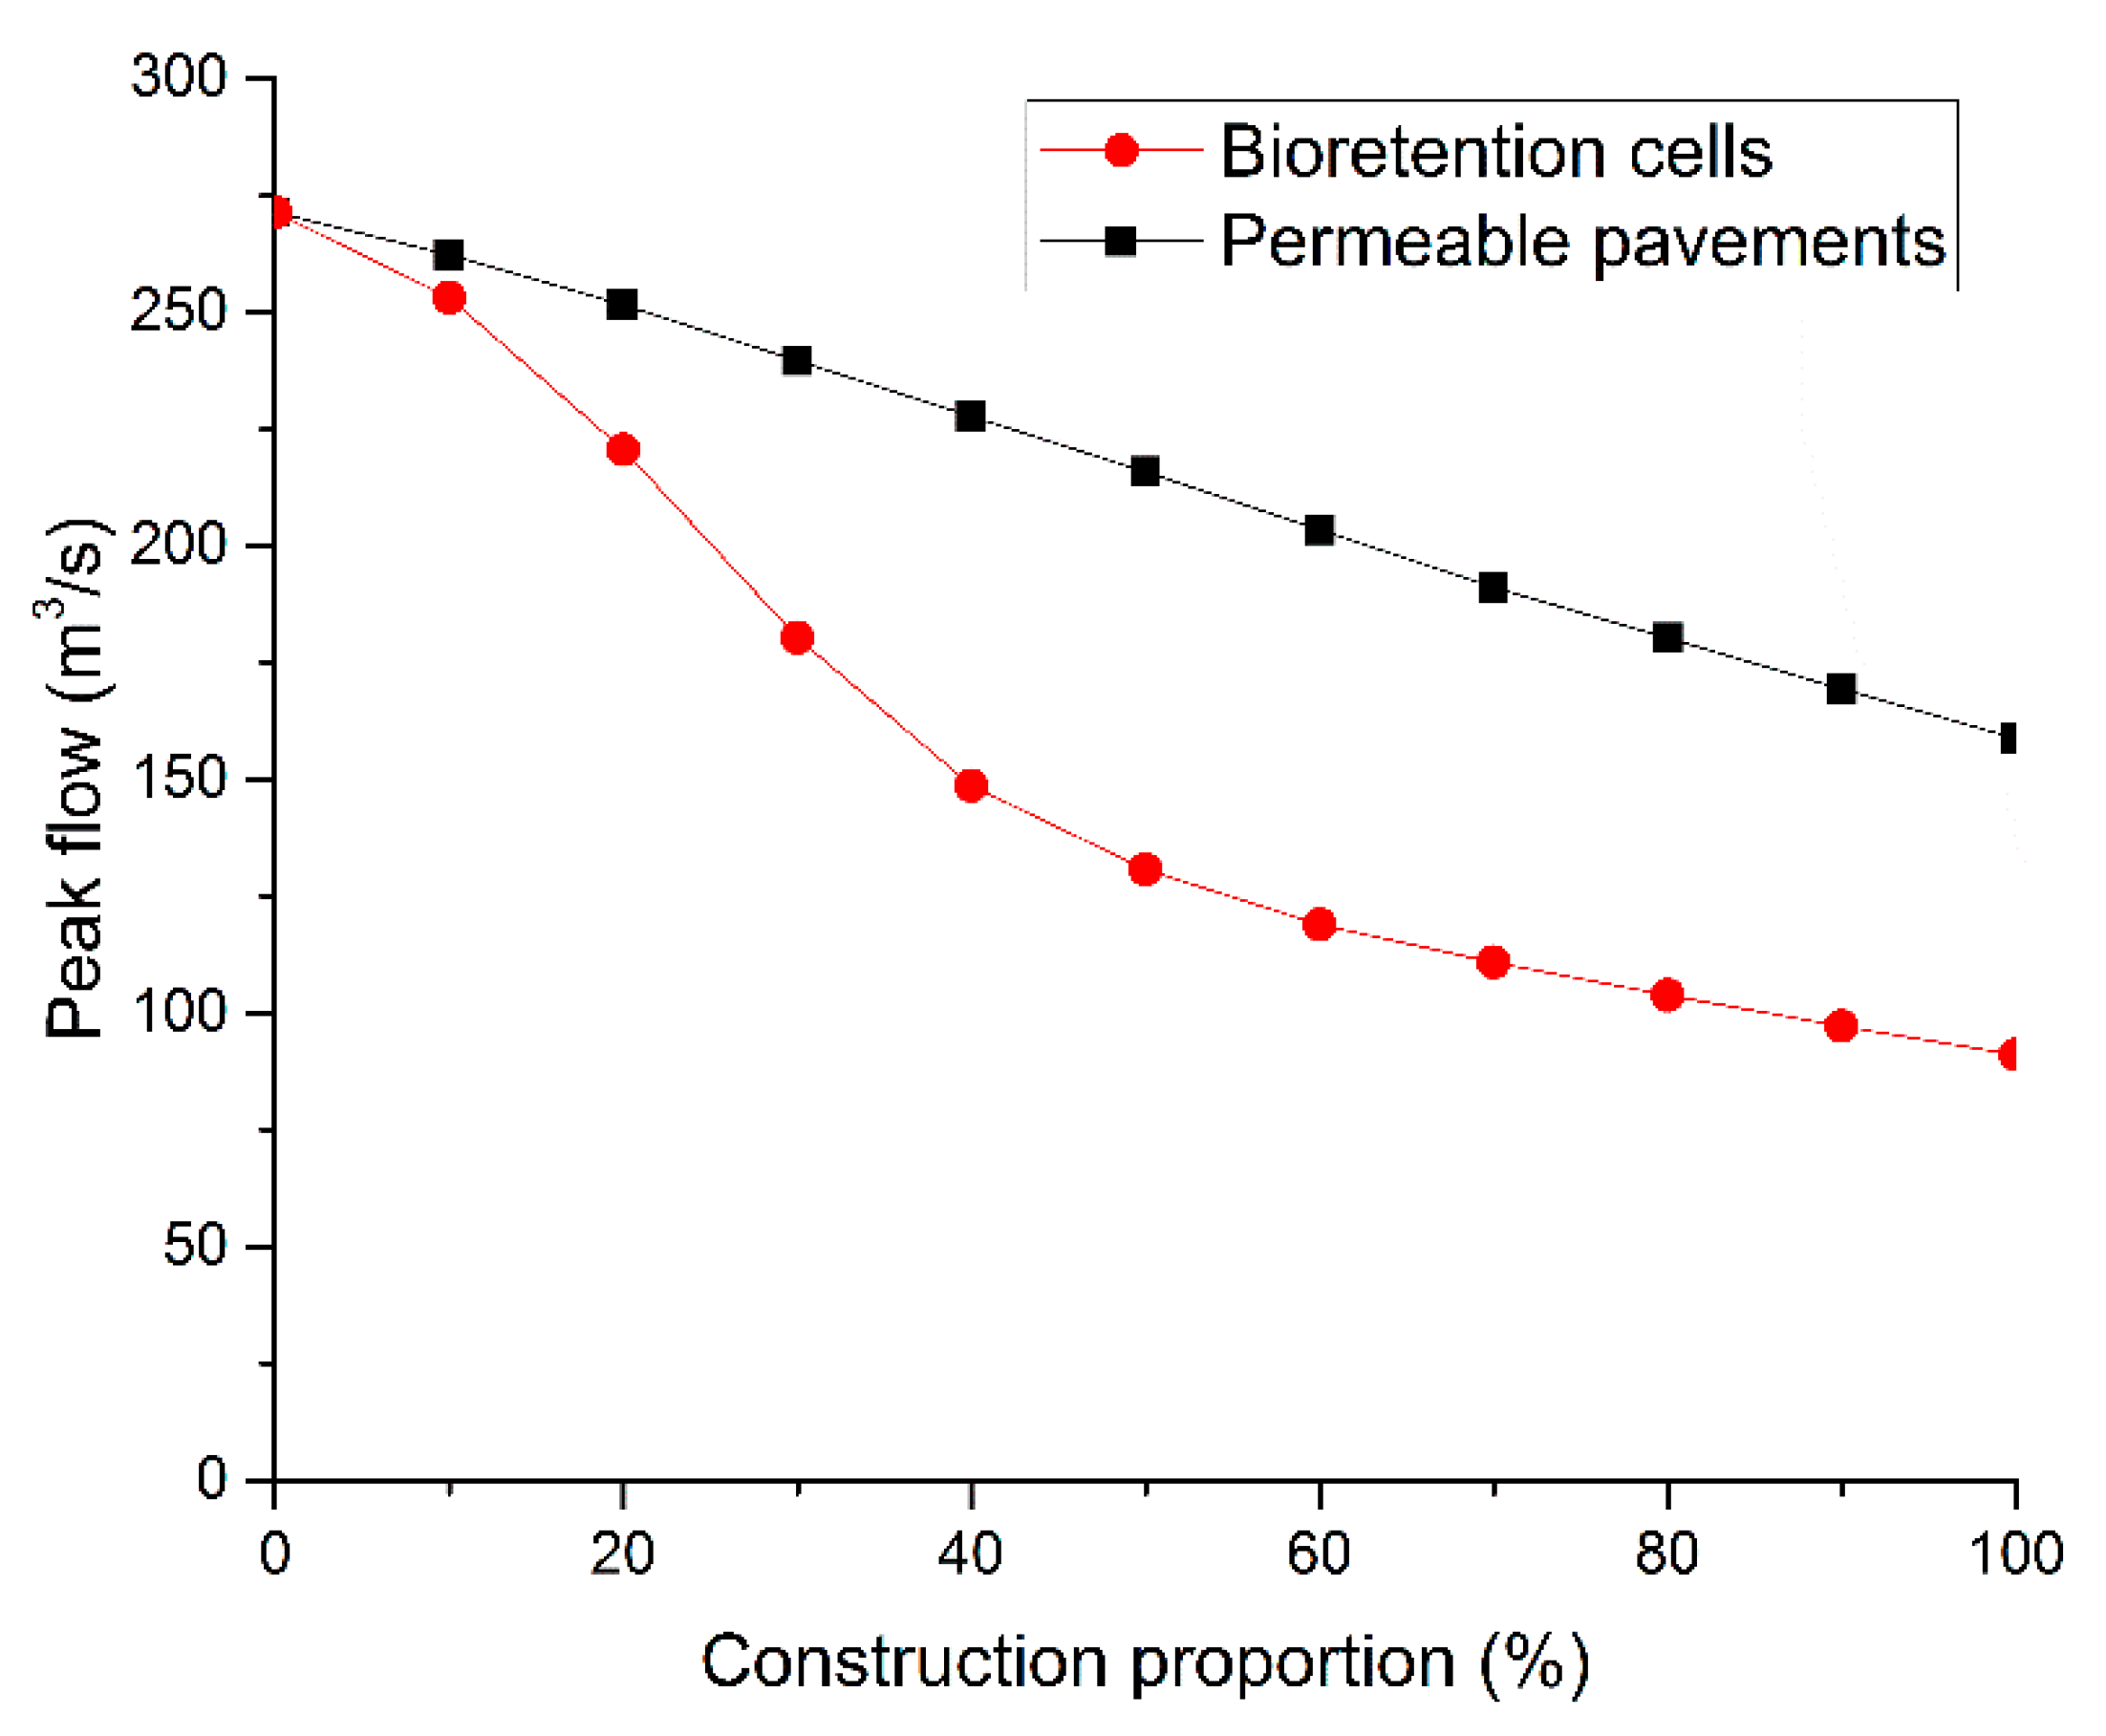
The peak values of outlet flow under different schemes are summarized in Figure 12. The result indicates that with the proportion of bioretention cells increasing, the reduction of peak flow is enhanced, but the enhancement is gradually reduced. With a proportion beyond 50%, this tendency becomes more obvious. Since bioretention cells can receive and store runoff from upstream catchment, when the area of bioretention cells exceeds the need, a part of the storage capacity will be wasted, leading to a lower runoff mitigation efficiency. While raising the construction proportion of permeable pavement, the enhancement of the reduction of the peak value of outlet flow is barely changed. This may be caused by the fact that permeable pavement receives and stores runoff generated on its own surface, and the volume of runoff reduction is proportional to the area of permeable pavements.
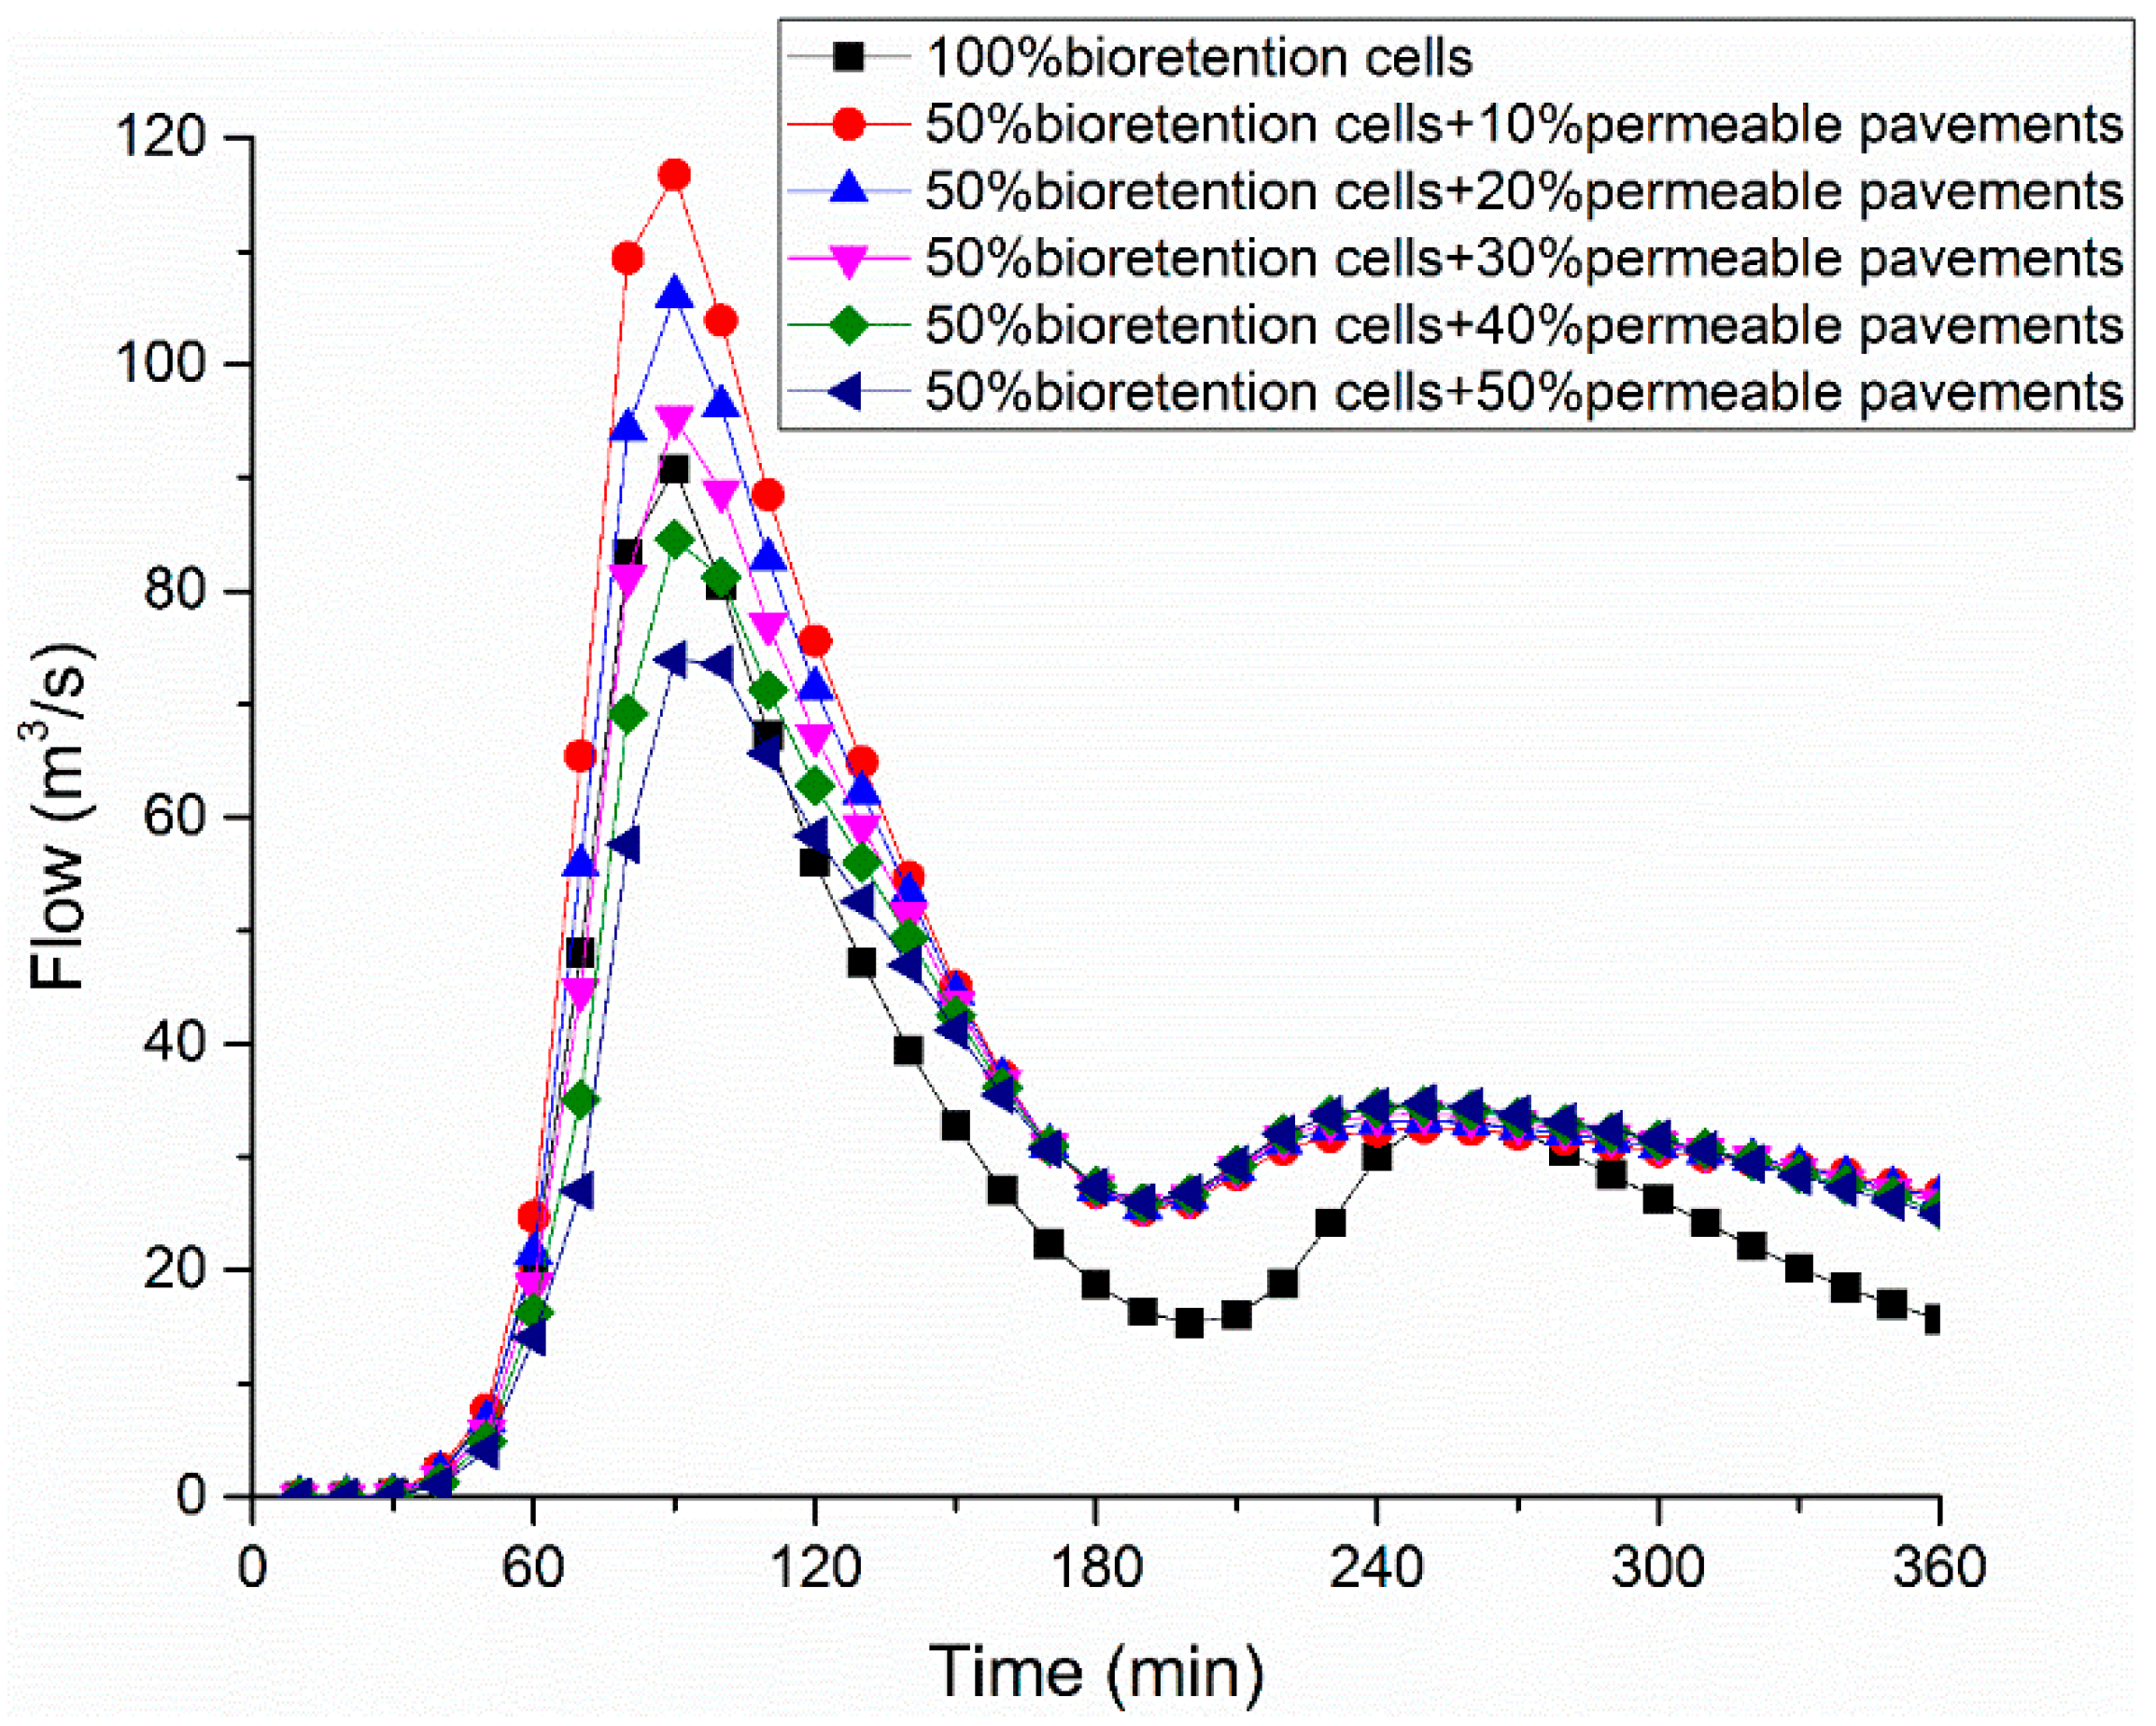
Therefore, when designing the combination schemes, the construction proportion of bioretention cells was set at 50%, permeable pavement construction proportion gradually increased from 10%, and the runoff control performance of each scheme with combined LID controls was compared with a scheme that changes all green space into bioretention cells (a single LID scheme with the best runoff control performance). The outlet flow process and waterlogging of the study area are shown in Figure 13 and Table 7.
The results indicate that the peak value of outlet flow generated by the scheme changing 50% of green space into bioretention cells and transforming 40% of impervious surface (except roofs and municipal pavements) into permeable pavements is less than that generated by the scheme with single LID control. Additionally, the scheme with 50% bioretention cells and 30% permeable pavements generated less flood volume than the scheme with single LID control.
Given that green space in the study area is larger than impervious surface except for roofs and municipal pavements (“Other impervious surface” in Table 4), the construction area of schemes with combined LID controls mentioned above are smaller than that of schemes with single LID control. This means that better runoff control performance with less construction area could be achieved by combining different kinds of LID controls based on the underlying surface condition.
4. Conclusions
There are many restrictions on the construction of LID controls in old urban areas with high population density, which leads to the difficulties of rainwater management in these areas. To explore feasible strategies for LID transformation in densely populated old urban areas, a catchment in Jiang′an District, Wuhan, was taken as the study area. By combining satellite photos and field investigation, the underlying surface of the study area was investigated. The mitigation of urban waterlogging by different LID transformation schemes was calculated by SWMM. The conclusions are as follows:
- (1).
- The type of underlying surface in densely populated old urban areas is relatively limited, and the permeable underlying surface is mainly residential green space. Available LID controls mainly include bioretention cells, permeable pavements, and green roofs. Since green roofs have strict restrictions on building roofs and a poor effect on runoff mitigation, the implementation of green roofs in engineering practice may be limited.
- (2).
- Facing rainstorms with a recurrence period of no more than 10 years, bioretention cells and permeable pavements can effectively mitigate runoff caused by rainfall. The effect of bioretention cells is better.
- (3).
- Adjusting the transformation proportion of different LID controls in a combination scheme may reduce the peak value of outlet flow more, lessen more flooding nodes, and occupy less area than schemes with single LID control. Schemes combining different LID controls can achieve better runoff mitigation effects according to local underlying surface conditions.
Author Contributions
Investigation, Y.S., Y.G. and Z.T.; Software, Y.S.; Supervision, Z.F.; Writing—original draft, Y.S.; Writing—review and editing, Y.G., Z.T. and Z.F. All authors have read and agreed to the published version of the manuscript.
Funding
This research was supported by the National Natural Science Foundation of China (grant no. 51978536).
Data Availability Statement
The data are available on request from the first author.
Acknowledgments
The data on pipe network and waterlogging in the study area were provided by the Wuhan Municipal Engineering Design and Research Institute. The data collection of this study also received the help of local residents. The authors also would like to thank the reviewers for their valuable remarks and comments.
Conflicts of Interest
The authors declare no conflict of interest.
References
- Woltemade, C.J.; Hawkins, T.W.; Jantz, C.; Drzyzga, S. Impact of Changing Climate and Land Cover on Flood Magnitudes in the Delaware River Basin, USA. J. Am. Water Resour. Assoc. 2020, 56, 507–527. [Google Scholar] [CrossRef]
- Nigussie, T.A.; Altunkaynak, A. Modeling the effect of urbanization on flood risk in Ayamama Watershed, Istanbul, Turkey, using the MIKE 21 FM model. Nat. Hazards 2019, 99, 1031–1047. [Google Scholar] [CrossRef]
- Park, K.; Won, J.H. Analysis on distribution characteristics of building use with risk zone classification based on urban flood risk assessment. Int. J. Disaster Risk Reduct. 2019, 38, 10. [Google Scholar] [CrossRef]
- Camilo, M.; Nakahashi, R.T.; Juliani, B.H.T.; Vieira, J.V.; Okawa, C.M.P. Computational modelling of urban drainage network using LID alternatives in a sub-basin in Maringa city, Parana, Brazil. Rev. Electron. Gest. Educ. Technol. Ambient. 2020, 24, 20. [Google Scholar] [CrossRef]
- Lee, J.Y.; Kwon, K.D.; Raza, M. Current water uses, related risks, and management options for Seoul megacity, Korea. Environ. Earth Sci. 2018, 77, 20. [Google Scholar] [CrossRef]
- Prokic, M.; Savic, S.; Pavic, D. Pluvial flooding in Urban Areas across the European Continent. Geogr. Pannonica 2019, 23, 216–232. [Google Scholar] [CrossRef] [Green Version]
- Hamilton, B.; Coops, N.C.; Lokman, K. Time series monitoring of impervious surfaces and runoff impacts in Metro Vancouver. Sci. Total Environ. 2021, 760, 13. [Google Scholar] [CrossRef] [PubMed]
- Deng, S.F.; Ma, S.Y.; Zhang, X.W.; Zhang, S.Q. Integrated Detection of a Complex Underground Water Supply Pipeline System in an Old Urban Community in China. Sustainability 2020, 12, 1670. [Google Scholar] [CrossRef] [Green Version]
- Abbas, A.; Carnacina, I.; Ruddock, F.; Alkhaddar, R.; Rothwell, G.; Andoh, R. An Innovative Method for Installing a Separate Sewer System in Narrow Streets. J. Water Manag. Modelling 2019, 27, 8. [Google Scholar] [CrossRef]
- Karnatz, C.; Thompson, J.R.; Logsdon, S. Capture of stormwater runoff and pollutants by three types of urban best management practices. J. Soil Water Conserv. 2019, 74, 487–499. [Google Scholar] [CrossRef]
- De Macedo, M.B.; do Lago, C.A.F.; Mendiondo, E.M. Stormwater volume reduction and water quality improvement by bioretention: Potentials and challenges for water security in a subtropical catchment. Sci. Total Environ. 2019, 647, 923–931. [Google Scholar] [CrossRef] [PubMed]
- Tiwari, A.; Kumar, P.; Kalaiarasan, G.; Ottosen, T.-B. The impacts of existing and hypothetical green infrastructure scenarios on urban heat island formation. Environ. Pollut. 2021, 274, 115898. [Google Scholar] [CrossRef] [PubMed]
- Morash, J.; Wright, A.; LeBleu, C.; Meder, A.; Kessler, R.; Brantley, E.; Howe, J. Increasing Sustainability of Residential Areas Using Rain Gardens to Improve Pollutant Capture, Biodiversity and Ecosystem Resilience. Sustainability 2019, 11, 3269. [Google Scholar] [CrossRef] [Green Version]
- Ma, Y.C.; Jiang, Y.; Swallow, S. China’s sponge city development for urban water resilience and sus-tainability: A policy discussion. Sci. Total Environ. 2020, 729, 7. [Google Scholar] [CrossRef] [PubMed]
- Huang, W.; Lin, W.; Huang, L.; Weng, H.; Huang, P.; Xia, Q.Y. Discussion of application of low impact development technology in the construction of sponge city in China. Desalin. Water Treat. 2020, 188, 297–302. [Google Scholar] [CrossRef]
- Kumar, P.; Debele, S.E.; Sahani, J.; Rawat, N.; Marti-Cardona, B.; Alfieri, S.M.; Basu, B.; Basu, A.S.; Bowyer, P.; Charizopoulos, N.; et al. Nature-based solutions efficiency evaluation against natural hazards: Modelling methods, advantages and limitations. Sci. Total Environ. 2021, 784, 27. [Google Scholar] [CrossRef] [PubMed]
- Mobilia, M.; Longobardi, A. Impact of rainfall properties on the performance of hydrological models for green roofs simulation. Water Sci. Technol. 2020, 81, 1375–1387. [Google Scholar] [CrossRef]
- Broekhuizen, I.; Sandoval, S.; Gao, H.X.; Mendez-Rios, F.; Leonhardt, G.; Bertrand-Krajewski, J.L.; Viklander, M. Performance comparison of green roof hydrological models for full-scale field sites. J. Hydrol. X 2021, 12, 18. [Google Scholar] [CrossRef]
- Xu, C.; Rahman, M.; Haase, D.; Wu, Y.P.; Su, M.R.; Pauleit, S. Surface runoff in urban areas: The role of residential cover and urban growth form. J. Clean Prod. 2020, 262, 11. [Google Scholar] [CrossRef]
- Cai, J. Local Chronicles of Jiang’an District; Wuhan Publishing House: Wuhan, China, 2009. (In Chinese) [Google Scholar]
- Khaleghi, E.; Sadoddin, A.; Najafinejad, A.; Bahremand, A. Flood hydrograph simulation using the SWMM model: A semiarid zone watershed case study, Shiraz Khoshk River, Iran. Nat. Resour. Model. 2020, 33, 11. [Google Scholar] [CrossRef]
- Dell, T.; Razzaghmanesh, M.; Sharvelle, S.; Arabi, M. Development and Application of a SWMM-Based Simulation Model for Municipal Scale Hydrologic Assessments. Water 2021, 13, 1644. [Google Scholar] [CrossRef]
- Rossman, L.A. Storm Water Management Model User’s Manual Version 5.1—Manual; EPA/600/R-14/413 (NTIS EPA/600/R-14/413b); US EPA Office of Research and Development: Washington, DC, USA, 2015.
- Rosa, D.W.B.; Nascimento, N.O.; Moura, P.M.; Macedo, G.D. Assessment of the hydrological response of an urban watershed to rainfall-runoff events in different land use scenarios—Belo Horizonte, MG, Brazil. Water Sci. Technol. 2020, 81, 679–693. [Google Scholar] [CrossRef]
- Iffland, R.; Forster, K.; Westerholt, D.; Pesci, M.H.; Losken, G. Robust Vegetation Parameterization for Green Roofs in the EPA Stormwater Management Model (SWMM). Hydrology 2021, 8, 12. [Google Scholar] [CrossRef]
- Bae, C.; Lee, D.K. Effects of low-impact development practices for flood events at the catchment scale in a highly developed urban area. Int. J. Disaster Risk Reduct. 2020, 44, 8. [Google Scholar] [CrossRef]
- Goncalves, M.L.R.; Zischg, J.; Rau, S.; Sitzmann, M.; Rauch, W.; Kleidorfer, M. Modeling the Effects of Introducing Low Impact Development in a Tropical City: A Case Study from Joinville, Brazil. Sustainability 2018, 10, 728. [Google Scholar] [CrossRef] [Green Version]
- Ren, J.; Liang, X.; Tao, T.; Xin, K.; Yan, H. Calculation and Parameter Analysis of Time of Concentration Based on Kinematic Wave Equation. China Water Wastewater 2019, 35, 118–122. [Google Scholar]
- Juan, A.; Hughes, C.; Fang, Z.; Bedient, P. Hydrologic Performance of Watershed-Scale Low-Impact Development in a High-Intensity Rainfall Region. J. Irrig. Drainage Eng. 2017, 143, 11. [Google Scholar] [CrossRef]
Figure 1.
The methodology of this study.

Figure 2.
Study area and drainage channels.

Figure 3.
Conceptual diagram of LID controls simulation in SWMM.

Figure 4.
Locations of surveyed pounding areas and simulated flooding nodes.

Figure 5.
Rainfall processes used in the simulations.

Figure 6.
Buildings and roofs in the study area.

Figure 7.
Outlet flow process under P = 1 rainfall.

Figure 8.
Outlet flow process under P = 5 rainfall.

Figure 9.
Outlet flow process under P = 10 rainfall.

Figure 10.
Outlet flow with different proportions of bioretention cells (P = 10 rainfall).

Figure 11.
Outlet flow with different proportions of permeable pavements (P = 10 rainfall).

Figure 12.
Peak value of outlet flow with different construction proportion of LID controls (P = 10 rainfall).
Figure 12.
Peak value of outlet flow with different construction proportion of LID controls (P = 10 rainfall).

Figure 13.
Outlet flow with different combination schemes (P = 10 rainfall).


Table 1.
Layers used to model different types of LID controls.
| LID Control | Surface | Pavement | Soil | Storage | Drain | Drainage Mat |
|---|---|---|---|---|---|---|
| Bioretention cell | √ a | √ | ○ b | ○ | ||
| Rain garden | √ | √ | ||||
| Green roof | √ | √ | √ | |||
| Permeable pavement | √ | √ | ○ | √ | ○ | |
| Infiltration trench | √ | √ | ○ | |||
| Rain barrel | √ | √ | ||||
| Roof disconnection | √ | √ | ||||
| Vegetative Swale | √ |
a: “√” means required; b: “○” means optional.
Table 2.
Conduit and sub-catchment parameters used in simulation.
| Objects | Parameter | Description (Units) | Value |
|---|---|---|---|
| Sub-catchment | N-Imperv | Manning’s n for impervious area | 0.01 |
| N-Perv | Manning’s n for pervious area | 0.15 | |
| Dstore-Imperv | Depth of depression storage on impervious area (mm) | 0.05 | |
| Dstore-Perv | Depth of depression storage on pervious area (mm) | 3 | |
| % Zero-Imperv | Percent of the impervious area with no depression storage (%) | 25 | |
| Infiltration | Max. Infil. Rate | Maximum infiltration rate on the Horton curve (mm/h) | 3 |
| Min. Infil. Rate | Minimum infiltration rate on the Horton curve (mm/h) | 0.5 | |
| Decay Const. | Infiltration rate decay constant for the Horton curve (1/h) | 4 | |
| Drying Time | Time in days for a fully saturated soil to dry completely | 7 | |
| Conduit | Roughness | Manning’s roughness coefficient | 0.015 |
Table 3.
Pounding areas and flood volume in field survey and simulation.
| Node | Frequency | Ponded Depth (m) |
Ponded Area (m2) |
Flood Volume (m3) |
Simulated Flood Volume (m3) |
|---|---|---|---|---|---|
| 1 | Every year | 0.1~0.3 | 1200 | 120~360 | - |
| 2 | Every year | 0.1~0.3 | 1500 | 150~450 | 361 |
| 3 | Every year | 0.4~0.6 | 3000 | 1200~1800 | 1562 |
| 4 | Every year | 0.4~0.6 | 2000 | 800~1200 | 920 |
| 5 | Every year | 0.1~0.3 | 3000 | 300~900 | 530 |
Table 4.
Proportion of underlying surface types.
| Underlying Surface | Area (ha) | Proportion |
|---|---|---|
| Green spaces | 821.88 | 37.79% |
| Water | 75.88 | 3.49% |
| Roofs | 500.62 | 23.02% |
| Municipal pavements | 370.82 | 17.05% |
| Other impervious surfaces | 405.79 | 18.66% |
Table 5.
Parameters of LID controls used in the simulation.
| Layers | Parameters (Units) | Bioretention Cells | Permeable Pavement | Green Roof |
|---|---|---|---|---|
| Surface | Berm height (mm) | 150 | 0 | 0 |
| Vegetative volume fraction | 0.1 | 0 | 0 | |
| Surface roughness | 0 | 0.13 | 0.15 | |
| Surface slope (%) | 0 | 0.2 | 5 | |
| Pavement | Thickness (mm) | NA | 150 | NA * |
| Void ratio | NA | 0.16 | NA | |
| Impervious surface fraction | NA | 0 | NA | |
| Permeability (mm/h) | NA | 120 | NA | |
| Clogging factor | NA | 0 | NA | |
| Regeneration interval (days) | NA | 0 | NA | |
| Regeneration fraction | NA | 0 | NA | |
| Soil | Thickness (mm) | 300 | 300 | 150 |
| Porosity | 0.5 | 0.45 | 0.45 | |
| Field capacity | 0.2 | 0.19 | 0.19 | |
| Wilting point | 0.1 | 0.085 | 0.085 | |
| Conductivity (mm/h) | 30 | 120 | 11 | |
| Conductivity slope | 45 | 45 | 45 | |
| Suction head(mm) | 3.5 | 110 | 110 | |
| Storage | Thickness (mm) | 300 | 300 | NA |
| Void ratio | 0.75 | 0.75 | NA | |
| Seepage rate (mm/h) | 0 | 0 | NA | |
| Clogging factor | 0 | 0 | NA | |
| Drain | Flow coefficient | 25 | 30 | NA |
| Flow exponent | 0.5 | 0.5 | NA | |
| Offset (mm) | 0 | 0 | NA | |
| Drainage Mat | Thickness (mm) | NA | NA | 3 |
| Void faction | NA | NA | 0.5 | |
| Roughness | NA | NA | 0.1 |
*: “NA” means “not applicable”.
Table 6.
Waterlogging with different rainfall events and LID controls.
| Rainfall | Current Situation | Bioretention Cells | Permeable Pavements | Green Roofs | |
|---|---|---|---|---|---|
| Number of nodes | P = 1 | 12 | 6 | 3 | 11 |
| P = 5 | 209 | 17 | 36 | 193 | |
| P = 10 | 232 | 31 | 94 | 225 | |
| Flooding volume (m3) | P = 1 | 4091 | 60 | 42 | 1546 |
| P = 5 | 72,074 | 6522 | 4058 | 56,404 | |
| P = 10 | 156,611 | 13,649 | 14,145 | 138,869 |
Table 7.
Waterlog of different combination schemes (P = 10 rainfall).
| Schemes | Construction Area (ha) |
Number of Flooding Nodes |
Flood Volume (m3) |
|---|---|---|---|
| 100% bioretention cells | 821.88 | 31 | 13,649 |
| 50% bioretention cells + 10% permeable pavements | 451.52 | 54 | 17,480 |
| 50% bioretention cells + 20% permeable pavements | 492.10 | 33 | 14,337 |
| 50% bioretention cells + 30% permeable pavements | 532.68 | 28 | 11,658 |
| 50% bioretention cells + 40% permeable pavements | 573.26 | 21 | 9432 |
| 50% bioretention cells + 50% permeable pavements | 613.84 | 20 | 7595 |
Publisher’s Note: MDPI stays neutral with regard to jurisdictional claims in published maps and institutional affiliations. |
© 2022 by the authors. Licensee MDPI, Basel, Switzerland. This article is an open access article distributed under the terms and conditions of the Creative Commons Attribution (CC BY) license (https://creativecommons.org/licenses/by/4.0/).
Share and Cite
MDPI and ACS Style
Shang, Y.; Guan, Y.; Tang, Z.; Fang, Z. Comparison of the Engineering Strategies for Low Impact Development in a Densely Populated Old Urban Area. Water 2022, 14, 1149. https://doi.org/10.3390/w14071149
AMA Style
Shang Y, Guan Y, Tang Z, Fang Z. Comparison of the Engineering Strategies for Low Impact Development in a Densely Populated Old Urban Area. Water. 2022; 14(7):1149. https://doi.org/10.3390/w14071149
Chicago/Turabian StyleShang, Yu, Yuxi Guan, Zhi Tang, and Zheng Fang. 2022. "Comparison of the Engineering Strategies for Low Impact Development in a Densely Populated Old Urban Area" Water 14, no. 7: 1149. https://doi.org/10.3390/w14071149
Note that from the first issue of 2016, this journal uses article numbers instead of page numbers. See further details here.