
Satellite Detection of Surface Water Extent: A Review of Methodology
by
 , , , and
Jiaxin Li
1,2 ,
,
Ronghua Ma
1,3,*,
Zhigang Cao
1,
Kun Xue
1,
Junfeng Xiong
1,4,
Minqi Hu
1,2 and
Xuejiao Feng
1,2 1
Key Laboratory of Watershed Geographic Sciences, Nanjing Institute of Geography and Limnology, Chinese Academy of Sciences, Nanjing 210008, China
2
University of Chinese Academy Sciences, Beijing 100049, China
3
Lake-Watershed Science Data Center, National Earth System Science Data Center, National Science & Technology Infrastructure of China, Nanjing 210008, China
4
Key Laboratory of Coastal Zone Exploitation and Protection, Ministry of Natural Resource, Nanjing 210023, China
*
Author to whom correspondence should be addressed.
Water 2022, 14(7), 1148; https://doi.org/10.3390/w14071148
Submission received: 17 January 2022
/
Revised: 28 March 2022
/
Accepted: 31 March 2022
/
Published: 2 April 2022
(This article belongs to the Special Issue Application of Remote Sensing Technology to Water-Related Ecosystems)
Abstract
:Water is an imperative part of the Earth and an essential resource in human life and production. Under the effects of climate change and human activities, the spatial and temporal distribution of water bodies has been changing, and the shortage of water resources is becoming increasingly serious worldwide. Therefore, the monitoring of water bodies is indispensable. Remote sensing has the advantages of real time, wide coverage, and rich information and has become a brand-new technical means to quickly obtain water information. This study summarizes the current common methods of water extraction based on optical and radar images, including the threshold method, support vector machine, decision tree, object-oriented extraction, and deep learning, as well as the advantages and disadvantages of each method. These methods were applied to the Huai River Basin in China and Nam Co on the Qinghai-Tibet Plateau. The extraction results show that all the aforementioned approaches can obtain reliable results. Among them, the threshold segmentation method based on normalized difference water index is more robust than others. In the water extraction process, there are still many problems that restrict the accuracy of the results. In the future, researchers will continue to search for more automatic, extensive, and high-precision water extraction methods.
1. Introduction
Various inland waters, such as rivers, lakes, ponds, reservoirs, and wetlands, are widely distributed on the Earth’s surface. Water provides invaluable supplies and resources to support human life, living, and production, such as drinking water, food, transportation, and recreation [1]. In addition, water information is widely used for many purposes [2,3,4,5], including water resource surveys, environmental protection, land classification, and flood monitoring. As a result of climate change and human activities, spatial and temporal distributions of water extents are changing [6,7], and water shortages and water pollution are becoming progressively more severe [8]. It is imperative to monitor water bodies for addressing their distribution and subsequent driving factors. Recent scholarly research has focused on determining how to obtain surface water information in an efficient, accurate, and timely manner [9,10].
Traditional methods for acquiring water bodies and hydrological information mainly include manual field surveys and data acquisition based on hydrological monitoring stations [11]. Despite the high accuracy, the process is time-consuming and laborious, and it may be difficult in remote areas. In addition, it is not suitable for the acquisition and monitoring of real-time water quality information on a large scale and over a long period. Remote sensing has several advantages, including broad coverage, periodic replay, real-time solid performance, and rich information. Since the emergence of high-space, high-time, and high-spectral resolution remote sensing data and the extensive study of remote sensing quantitative retrieval, extracting water body information has become the focus of current research in water conservation remote sensing technology [12]. Using satellite imagery, researchers and institutions have created a large-scale water distribution dataset (Table 1), which is no longer confined to a single lake or river [13]. Waterbody information is extracted primarily from optical remote sensing and microwave radar remote sensing data sources. According to the imaging characteristics of water bodies, various water body extraction algorithms have been developed, including threshold and machine learning methods. Among these methods, there are classical water body index and segmentation methods, including various water body indexes [14] improved in different regions [15,16]; In recent years, a large number of methods based on support vector machine [17], decision tree [18], and deep learning have also been widely used in water extraction [19].
When water bodies are distinguished from other ground features using spectral characteristics, other methods can combine multiple characteristics to classify and identify them. Water body information extraction accuracy varies between algorithms [30,31]. For a given algorithm based on different data, the water body extraction accuracy will vary; therefore, using a combination of different algorithms and datasets will produce results with different accuracies [32]. In order to optimize suitable water extraction methods, many studies have summarized the progress of water extraction. For example, Huang, et al. [33] introduced the water extraction method based on optical remote sensing and summarized the relevant research progress on water monitoring. Yan and Jinwei [32] described the development of sensors, methods, data processing platform, and water research content in recent years. Gholizadeh, et al. [34] introduced the qualitative parameters used for water quality monitoring and evaluated the commonly used methods and sensors for inversion of water quality parameters. Wang and Yesou [35] reviewed research developments using state-of-the-art remote sensing technologies for monitoring dynamics of floodpath lakes and wetlands. Many studies need water boundary as the research basis. Although these reviews summarized the advantages and disadvantages of various methods, they did not carry out specific tests. Likewise, the applicability and accuracy of traditional methods and machine learning in different water extraction are still unknown.
Recognizing the poor understanding of the applicability of various water body methods, this study aims to summarize the current methods with respect to the water body extraction and conduct water body extraction tests in the Huai River Basin and Nam Co on the Qinghai-Tibet Plateau to evaluate their applicability. The specific purposes are: (1) to summarize the commonly used sensors in water extraction, including optics and radar; (2) to introduce the principle of common water extraction methods, including threshold method and classification method, and to identify the progress of new methods in recent years; (3) to examine the performance of several state-of-the-art algorithms regarding water extract, such as water spectral index, support vector machine, cart decision tree, object-oriented classification, and deep learning, on extracting water bodies in the Huai River Basin and Nam Co. This review was anticipated to serve as a reference and support for researchers in related research fields and lay a theoretical foundation for future scientific studies.
To form a primary literature database with respect to water extraction with satellite, we searched the publications from the Web of Science database since 2010 (e.g., TI = (Satellite OR Remote sensing) AND (Water extraction OR Water Extent OR water boundary OR water body mapping)) and excluded documents with less than 10 citations. By quickly reading the literature abstracts, we removed the literature with little correlation. The information of each publication regarding remote sensing dataset, study area, method and accuracy of water extraction used in that study was extracted.
2. Data Sources
Remote sensing data sources for water extraction and monitoring include optical and radar data (Table 2). Generally, the Earth observation satellites provide data that can be used for water extraction. In recent years, data obtained from remote sensing of water bodies have evolved towards high spatial resolution, high temporal resolution, and high spectral resolution [32].
Optical imagery is part of passive remote sensing, which obtains the spectrum of ground objects by receiving the reflected sunlight from ground objects, mainly in the visible and infrared bands. It is currently the primary data source for extracting water body information. In comparison to other ground objects, water exhibits a low reflectivity in the visible and near-infrared ranges [36], as well as an extremely low reflectivity in the near-infrared and shortwave infrared spectra. These spectral characteristics are the main basis for identifying water bodies. Remote sensing data can be divided into low-resolution (more than 200 m) EOS MODIS, NOAA AVHRR, etc. For example, Landsat Multispectral Scanner (MSS)/Thematic Mapper (TM)/Enhanced Thematic Mapper Plus (ETM+)/Operational Land Imager (OLI), Sentinel-2 MSI, etc. have a medium-spatial resolution (10–200 m). IKONOS and Quickbird have a high-spatial resolution (~1 m). Landsat, Sentinel 2, and other high-resolution images provide more accurate results; therefore, they are commonly used to identify water bodies in single lakes or small watersheds. However, most high-spatial resolution data have a low-temporal resolution. When long-term continuous monitoring of water bodies is required, or the research scale is large, low-resolution data should be selected more frequently. MODIS data can provide daily images and cover large areas, and they are mainly used for global research purposes.

Table 2.
The typical data sources for water body extraction.
| Satellite | Sensor | Spatial Resolution | Time Resolution | Application |
|---|---|---|---|---|
| Optical Data | ||||
| Terra/Aqua | MODIS | 250 m | 2 times/day | Remote sensing mapping of large-scale water bodies [24,28] |
| Landsat 4,5 | TM | 30 m | 16 d | Land use and land cover change, water body monitoring, water color remote sensing [37,38,39] |
| Landsat 7 | ETM+ | 30 m | 16 d | |
| Landsat 8/9 | OLI | 15, 30 m | 8 d | |
| Sentinel-2 | MSI | 10, 20, 60 m | 5 d | High-precision water system map, water body monitoring [40,41] |
| Sentinel-3 | OLCI | 300 m | 2 d | |
| GF-1 | WFV | 16 m | 2 d | Water quality monitoring, water body extraction [42,43] |
| GF-2 | MSS | 3.2 m | 5 d | |
| HJ-1A/B | CCD | 30 m | 2 d | Disaster monitoring and forecasting [44] |
| IRS-P6 | LISS-3 | 23.5 m | 24 d | Land use and land cover change [45] |
| Radar Data | ||||
| GF-3 | SAR | 1–500 m | 1.5–3 d | Water extraction [46] |
| Sentinel-1 | SAR | 5 m | 12 d | Flood monitoring [47,48] |
| Envisat | ASAR | 30 m | 35 d | Lake ice and sea ice detection [49,50] |
Radar remote sensing belongs to active remote sensing. It actively emits microwave radiation and receives electromagnetic waves reflected or scattered by the Earth’s surface. Synthetic aperture radar (SAR), which is a component of the radar remote sensing system, can provide high-resolution radar images, increasing the possibilities for water extraction research. Based on the fact that water backscatters less in the microwave range, radar can be used to detect and extract water information [51]. SAR remote sensing grew in technical sophistication with the emergence of high-resolution wide-range SAR, synchronous orbit SAR, and video SAR. Radar has the characteristics of ignoring the weather and having certain penetrating power [52].
Various sensors provide different advantages when acquiring ground information, and, when extracting water bodies, two or more sources may be selected. Optical images have high spatial resolution and rich spectral information, but they are greatly affected by clouds and shadows during water recognition; SAR images can provide information on shallow water and shadow areas, but coherent speckle noise cannot be avoided. Combining textural features can reduce the impact of noise, but the calculation takes considerable time and requires continuous experimentation to obtain the optimal feature combination [53,54]. In addition, digital elevation models (DEMs) and digital surface models (DSMs) are often used to aid in water body estimation by calculating terrain factors [55] or modeling terrain [48,56] to eliminate missed water bodies and reduce shadow interference. Two methods are available for extracting water body information from multisource data: optical remote sensing for rough water extraction and, on the basis of rough extraction, radar images or combined DEM data for fine water extraction [57]. Another method is to directly perform image fusion processing of these two kinds of data, combining the characteristics of the original image and the information of the ground features to produce a higher-performance remote sensing image [58,59]. A large amount of data and rich spectral information allow for a flexible and effective water extraction method and a long-term water monitoring effort.
3. Water Extraction Method
A majority of the automatic extraction methods of remote sensing water body information can be divided into two categories: threshold segmentation and image classification. The threshold segmentation is mainly based on the spectral characteristics of water [36]. It uses spectral knowledge to construct various classification models and water body indices to extract water bodies. The image classification synthesizes the spectrum, texture, and spatial characteristics of the image and makes full use of the spectrum, shape, structure, and texture of the ground features to extract water body information [11].
In low- and medium-resolution images, small water bodies often appear in the form of mixed pixels, which cannot be accurately divided by the threshold method. With the development of high-spatial resolution satellites, images have more abundant spatial and texture information. Wavelet texture [60] and grey-level co-occurrence matrices (GLCMs) [61] are often used to extract the texture features of images. Researchers have constructed image classification and extraction methods by combining features such as spectrum, space, and texture. Various features can help extract more refined water information [62], but overly complex classification criteria may reduce efficiency and accuracy. Current image classification methods include the Support vector machines (SVMs), decision tree, and object-oriented methods. With the development of computer technology and the arrival of the era of big data, deep learning has been widely used in water extraction [63,64].
3.1. Threshold Segmentation
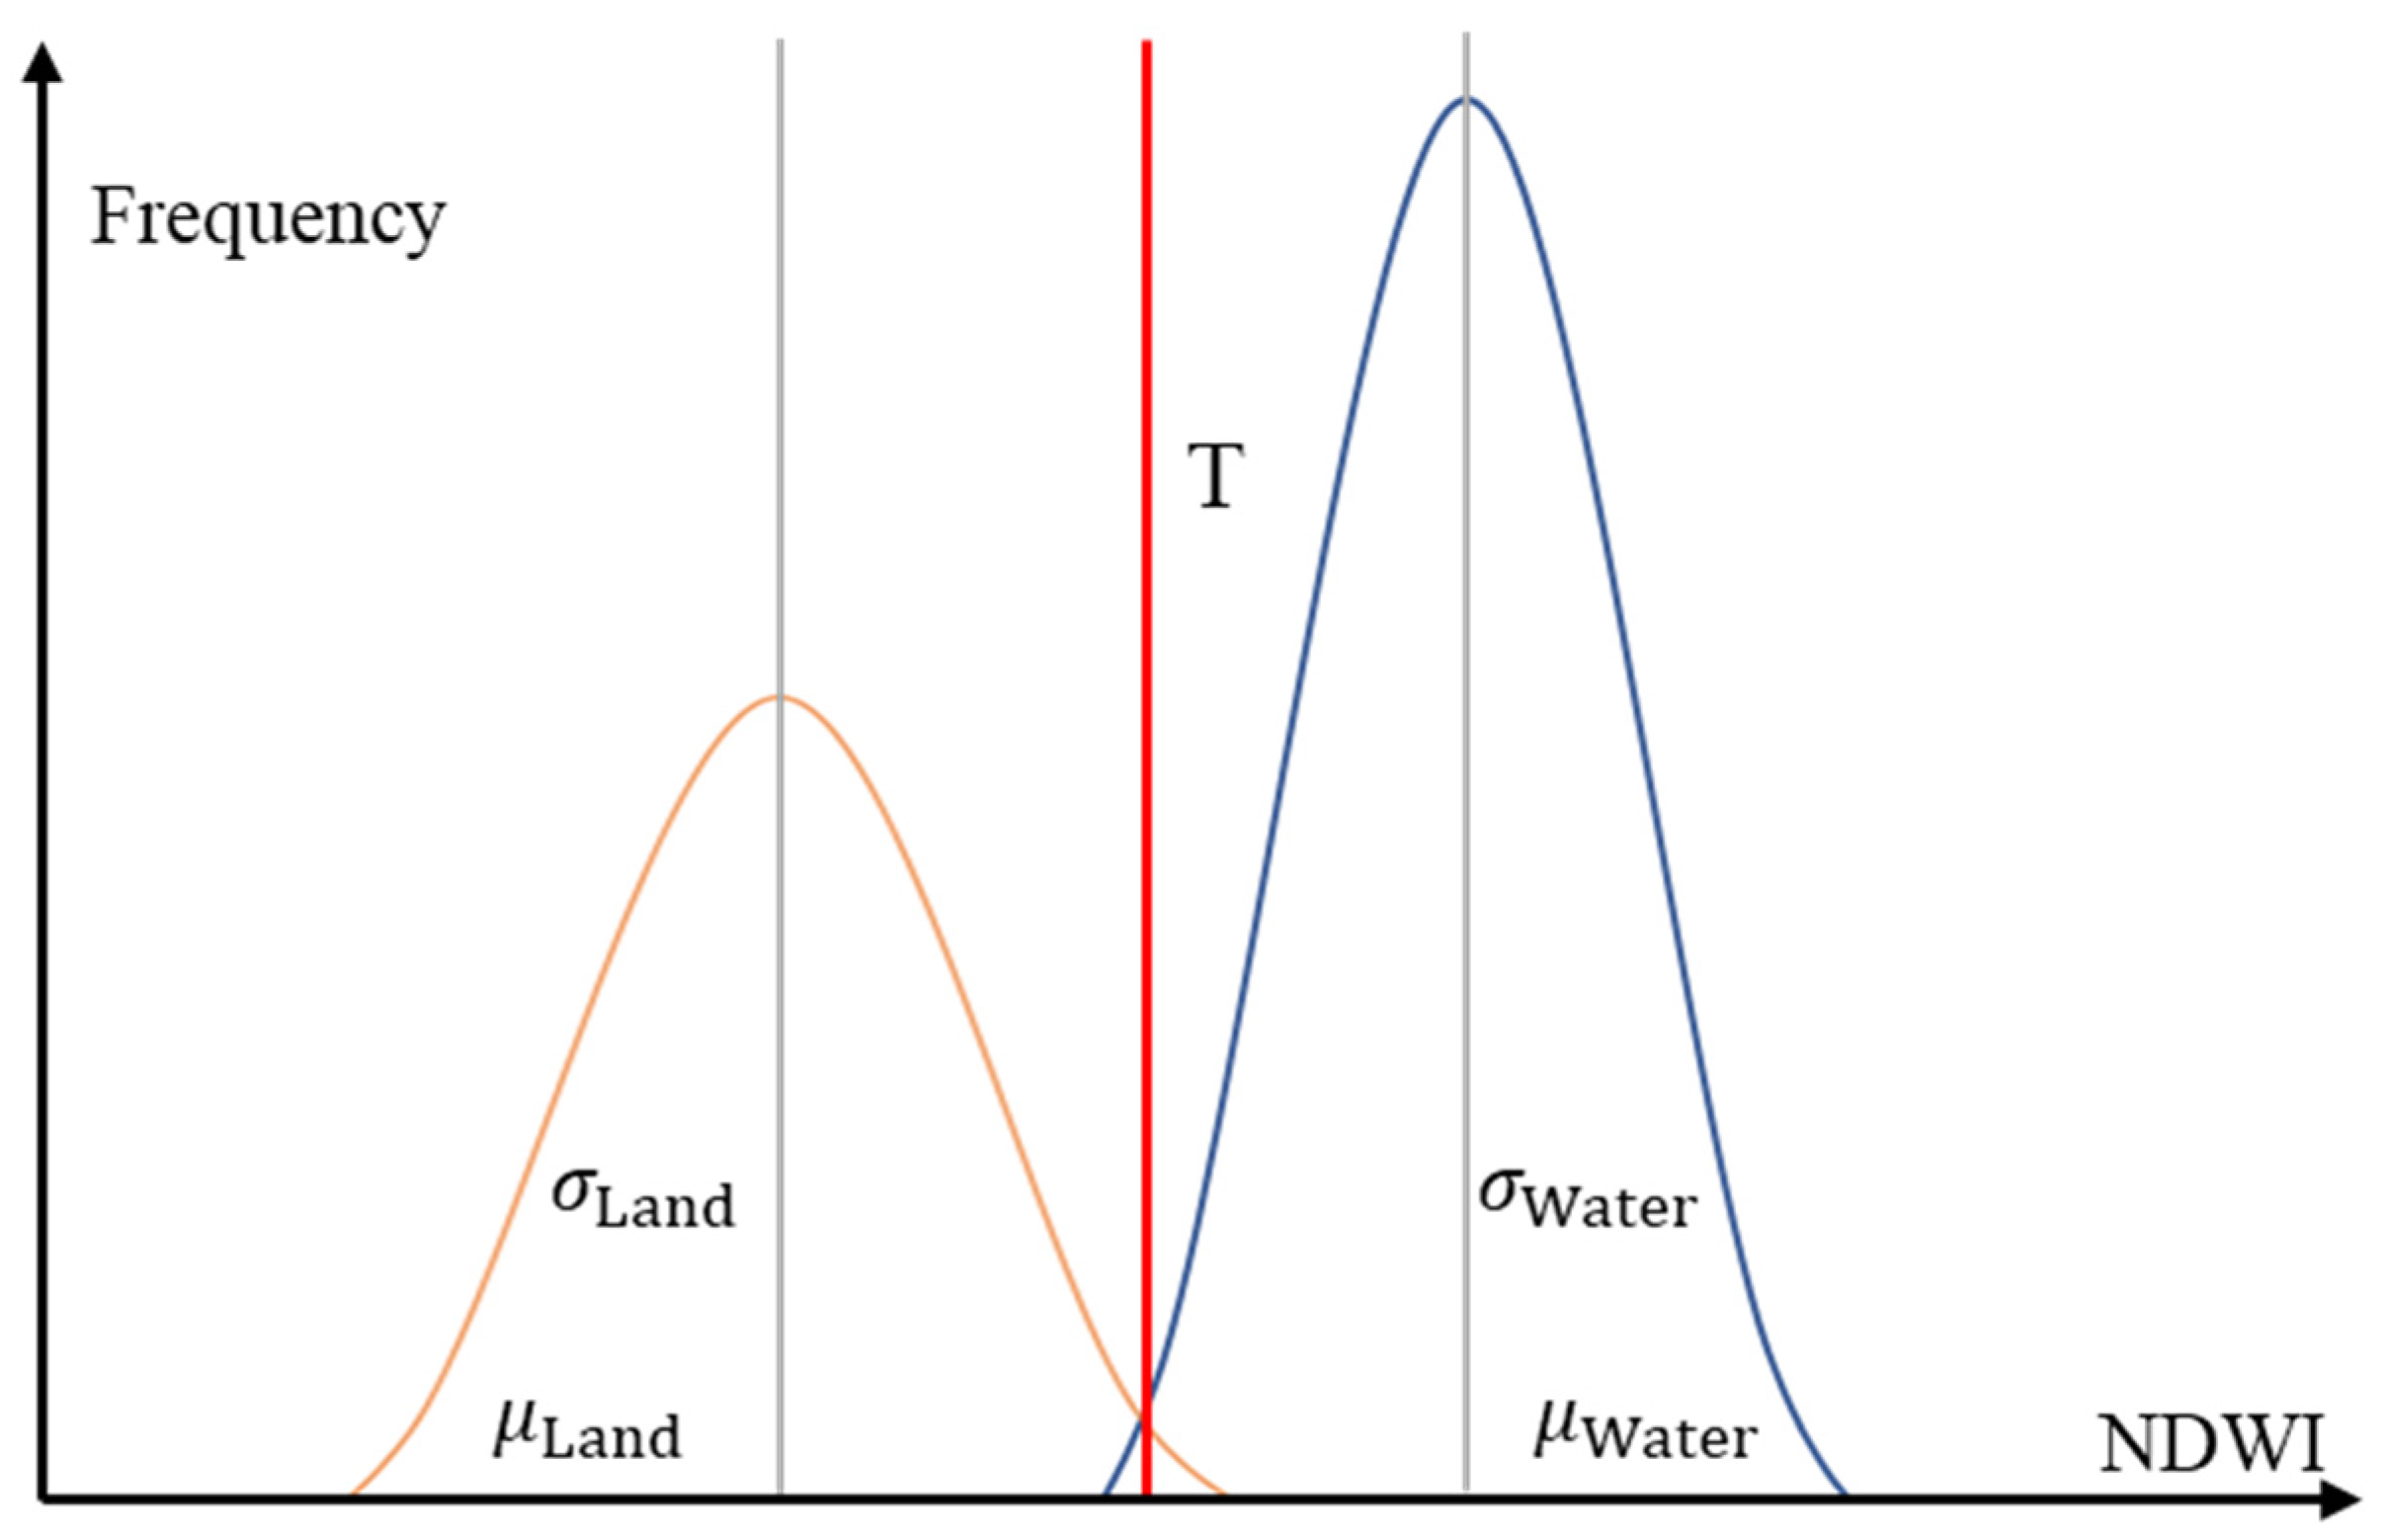
Compared with other ground objects, water bodies show lower reflectivity almost in the range of visible light to near-infrared, especially in the range of near-infrared and shortwave infrared. By choosing a threshold value derived by the single or multiple spectral bands, the water body could be extracted. The choice of the threshold value directly affects the accuracy of the results (Figure 1).
3.1.1. Single Band Threshold
The single-band method in optical imagery was mainly used in early water remote sensing research [65]. A specific waveband was selected, an appropriate threshold was set to extract water information, and the near-infrared or mid-infrared wavebands with low water reflectivity were used. Although the single-band threshold method is simple and easy to implement, the accuracy is not high, and this method also easily causes misprovisioning and omission of water body information; it is difficult to eliminate the influence of mountain shadows, and the water body boundary is blurred [66]. With the co-existence of multiple types of features in remote sensing images, it is difficult to accurately extract all water bodies based on the information of only one band. With the development of multiband methods, the application of single-band methods in water body extraction is no longer common [67].
Threshold segmentation is a method of extracting water bodies from radar images, primarily based on the low backscattering characteristics of water bodies in the microwave range [68], which appears as a dark area in the image, thus distinguishing the water bodies from other ground objects [69]. Its advantages are simple principle, small calculation amount, and suitability for water extraction from SAR images with low noise and small maps. The most commonly used grey-level threshold segmentation methods include the maximum between-class variance method [70], entropy threshold method, and bimodal histogram method. However, processing large-area images take a long time, is poor in accuracy and robustness, and is affected by coherent speckle noise and uneven grey information throughout the image. It is difficult to obtain accurate threshold points, and it is impossible to distinguish ground objects with similar water-scattering characteristics. Some researchers have improved the maximum between-class variance method to ensure the maximum between-class variance while ensuring that various internal pixels have better cohesion and obtaining higher-precision water extraction results [71]. Combining the threshold segmentation method with other methods, such as Markov random fields, can achieve high-precision and automated water information extraction [46].
3.1.2. Multiband Threshold Method
The multiband method mainly uses the advantages of multibands to comprehensively extract water information, including the interspectral relationship method and the water index method. This method extracts water bodies by analyzing the original waveband of the remote sensing image or the spectral characteristic curve of the characteristic waveband derived from the original waveband and constructing logical judgment rules [72]. The spectral characteristics of the water body in the AVHRR data indicate that CH1 is much greater than CH2, CH2 is less than the average value of the image, and CH3 is greater than the average value of the entire image [73].
The water body’s reflection gradually decreases from the visible to mid-infrared wavelength range, and the absorption is highest in the near-infrared and mid-infrared wavelength ranges, with almost no reflection, which is obviously different from other objects on the ground [74]. The water index is calculated by using the ratio of the strongest and weakest wavebands of the water body to achieve the purpose of increasing the difference between the water body and other ground features and then selecting a threshold to extract the water. The ratio index is usually normalized to make its value range between −1 and 1. Researchers have proposed a number of water indices (Table 3). The earliest normalized difference water index (NDWI) [14] uses the ratio of the green light band to the near-infrared band to suppress vegetation information to the greatest extent to highlight water body information. However, it ignores the influence of shadows, land, and buildings. Later, the modified normalized difference water index (MNDWI) [15] was proposed, which replaced the near-infrared in the NDWI with the mid-infrared band, which can be used to accurately extract water information within a town and effectively reduce the impact of shadows. Later, researchers proposed many improved water indices, which can enhance the applicability of specific areas and effectively suppress the influence of shadows. NDWI3 [75] has achieved good results in urban water body extraction; the enhanced water index (EWI) [76] is suitable for water body extraction in semiarid areas; and the new water index (NWI) [77] can be determined by simple thresholds. By quickly and accurately extracting water body information, the Gaussian normalized difference water index (GNDWI) [16] realizes the automatic extraction of complex and diverse river water body information. The temperature vegetation water index (TVWI) [78] has a certain universality, and water bodies are the threshold for nonwater bodies and can be set stably to 0. The automated water extraction index (AWEI) [79] can improve classification accuracy in areas that include shadow and dark surfaces that other classification methods often fail to classify correctly. The above water body indices are all used for optical data. The Sentinel-1 dual-polarized water index (SDWI) [80] is used for water body extraction from Sentinel-1 radar data, eliminating the presence of soil and vegetation, but it is susceptible to shadows.
In fact, the types of features in a region are often diverse, and using only one water index may not meet the accuracy requirements. The selection of the threshold is also a complicated process. Therefore, some scholars have comprehensively used multiple indices, and their results could obtain higher accuracy than using a single water body index. Rao and Wang [81] utilized the optimal partition and optimal index joint decision tree composed of three indices—MNDWI, AWEI, and NDTBI—and the results obtained by the joint decision tree was more accurate than any of them. Wen et al. [82] established collaborative decision-making with water indices (CDWI) with five water body indices and achieved good results in both water and land environmental tests worldwide.
Table 3.
Several common water spectral indexes.
| Water Index | Formula | Describe |
|---|---|---|
| NDWI [14] | Information that suppresses vegetation; can be affected by shadows, land, and buildings | |
| NDWI3 [75] | Town | |
| MNDWI [15] | Cities and towns, effectively suppressing shadows | |
| EWI [76] | Semi-arid areas | |
| NWI [77] | Simple threshold setting | |
| GNDWI [16] | Suitable for complex river water bodies | |
| TVWI [78] | Universal, the threshold can be set stably to 0 | |
| AWEI [80] | Suitable for areas with more shadows |
R, G, B, NIR, SWIR, MIR, and FIR are pixel values of red, green, blue, near infrared, short wave infrared, mid infrared, and far infrared bands, respectively; GNDWIi,j is the Gauss normalized water body index at point (I, J); NDWIi,j is the normalized difference water body index at point (I, J); is the mean value of NDWI of all pixels in the image; σ It is the standard deviation of NDWI of all pixels; FG is the constructed pseudo green band; Tsmax and Tsmin are obtained by fitting vegetation index NDVI and land surface temperature according to dry edge and wet edge; a, b, c, and d are the coefficients of the dry edge and wet edge linear fitting equation, respectively. VV is the pixel value of SAR image with VV polarization mode, and VH is the pixel value of SAR image with VH polarization mode.).
3.2. Machine Learning Methods
3.2.1. Support Vector Machine
Support vector machine (SVM) [83] is a machine learning method based on statistical learning theory. They use structural risk minimization (SRM) criteria to find the optimal classification hyperplane in the high-dimensional feature space to distinguish the water body from other ground objects, so as to identify the water body.
The basic mathematical form of the support vector machine is:
The constraint is: . Introducing the Lagrange multiplier αi, the solved equation of the above formula is:
The optimal solution is . Any is taken to find b. In the result, most αi are 0, and the samples whose αi is not 0 are called support vectors.
For a high-dimensional space, if one wants to transform the original feature space to a high-dimensional feature space, one must replace the dot product in the optimal classification surface with the inner product K(x, x’).
Using SVM to extract water information in high-resolution data can obtain high-precision extraction results [17], which is better than the traditional water index and easier to distinguish from hilly shadows [84]. The performance of the SVM method mainly depends on the selection of the kernel function type and the setting of the kernel function parameters. It has the advantages of small sample learning, anti-noise performance, high learning efficiency, and good generalization, but too many samples will increase missed points and errors. The commonly used kernel functions of support vector machines include the radial kernel function, sigmoid kernel function, linear kernel function, and polynomial kernel function (Table 4). The accuracy of the radial basis kernel function is relatively high [85], but its hardware requirements also vary. Improvements are made at the expense of extensive training.
3.2.2. Decision Tree
The decision tree is based on the hierarchical classification idea as its guiding principle, and it uses a tree structure to divide the data into subsets that have more homogeneous characteristics in accordance with a certain segmentation principle. The decision tree method for remote sensing image classification first uses training samples to generate a discriminant function, second builds tree branches according to different values, repeats the establishment of lower nodes and branches in each branch subset, and finally forms a classification tree. The most famous algorithm is ID3, followed by algorithms such as C4.5, CART, SLIQ, and SPRINT. The decision tree method uses knowledge other than spectral characteristics, including digital elevation models, water indices, texture, and spatial characteristics [86]; the recognition results are more accurate, but the abstraction of the decision-making process or the determination of the decision rules are more complicated [18].
3.2.3. Object-Oriented Classification
The object-oriented image analysis method is developed based on Hay and Niemann [87] concept of image objects [88]. Based on the results of image segmentation, this method fuses pixels with similar spectral characteristics and spatially adjacent pixels into one object, ensuring maximum local homogeneity in the same area, and classifying the object as the basic processing unit. Among them, image segmentation is the key to object-oriented classification, and the segmentation scale (scale) is the key to determining the segmentation effect. The most commonly used segmentation method is the multiscale segmentation algorithm. To determine the optimal segmentation scale, other judgments are needed. The classification-vector distance index method (classification-vector distance index method) judges whether the segmentation scale is accurate according to the distance between the boundary of the ground feature and the actual boundary. Compared with the more mature human trial and error method (“trial and error” method), accurate results have been obtained in the classification of water bodies and paddy fields. Traditionally, pixel-level analysis uses one pixel as the basic unit and cannot take advantage of pixel neighborhood information or its mutual relationship. Images are frequently isolated, with “same objects with different spectra” or “foreign matter with the same spectrum” phenomena, and the accuracy of water body extraction is low, making it difficult to meet the requirements of high-resolution images. In their paper, Gao et al. [89] introduced local variance variables and Moran’s I indices and combined them with the principle of the minimal risk Bayes decision to identify the optimal spatial segmentation scale intuitively, accurately, and uniquely.
3.2.4. Deep Learning
Benefiting from the development of computer technology and the advent of the era of big data, deep learning [90] has also ushered in a development climax. Deep learning mainly uses artificial neural networks for feature extraction and self-learning of remote sensing image water samples to automatically distinguish water bodies [91]. At this stage, deep learning was widely applied in remote sensing image classification and recognition, mainly including restricted Boltzmann machines (RBMs), convolutional neural networks (CNNs) and autoencoders (AEs). The multilayer RBM and backward propagation algorithm (BP) form deep belief networks (DBNs). Liu et al. [92] uses the characteristics of unsupervised learning to better extract image features, but its network parameter selection requires manual input. It is difficult to determine appropriate experimental parameters due to the intervention of experimental knowledge. The CNN is often used for remote sensing classification and has obvious advantages in processing image hyperspectral data. Stacked autoencoder (SAE) produces fewer reconstruction errors in dimensionality reduction and feature extraction. To achieve high-precision classification results, it must be combined with other classifiers [63].
A convolutional neural network and a DeepLabv3 semantic segmentation neural network are used to extract water information from high-resolution satellite remote sensing data. The results are better than those of the water index method, object-oriented method, and support vector machine method, and they can effectively remove the influence of shadows and buildings [64]. By introducing the dense block of the DenseNet neural network to construct a water body extraction deep learning full convolution neural network, it can enhance the sensitivity to small water bodies, improving the water extraction accuracy of remote sensing images, but remains vulnerable to the influence of building shadows [93]. By combining deep learning and multiple checkerboard segmentation methods for high-resolution remote sensing image river extraction, and fully considering the spatial geometric relationship between pixels with high recognition accuracy, it is possible to extract rivers with a width of up to two pixels [94]. He, Huang, and Li [19] proposed an improved U-Net network model for extracting water body information from GF-2 remote sensing images. In terms of small water bodies, shadow differentiation, and boundary segmentation, it is more advantageous in the environment of the study area. The extraction effect of regions with large differences needs to be further improved.
4. Applications of Common Methods on Landsat-8 Imagery
4.1. Material and Methods
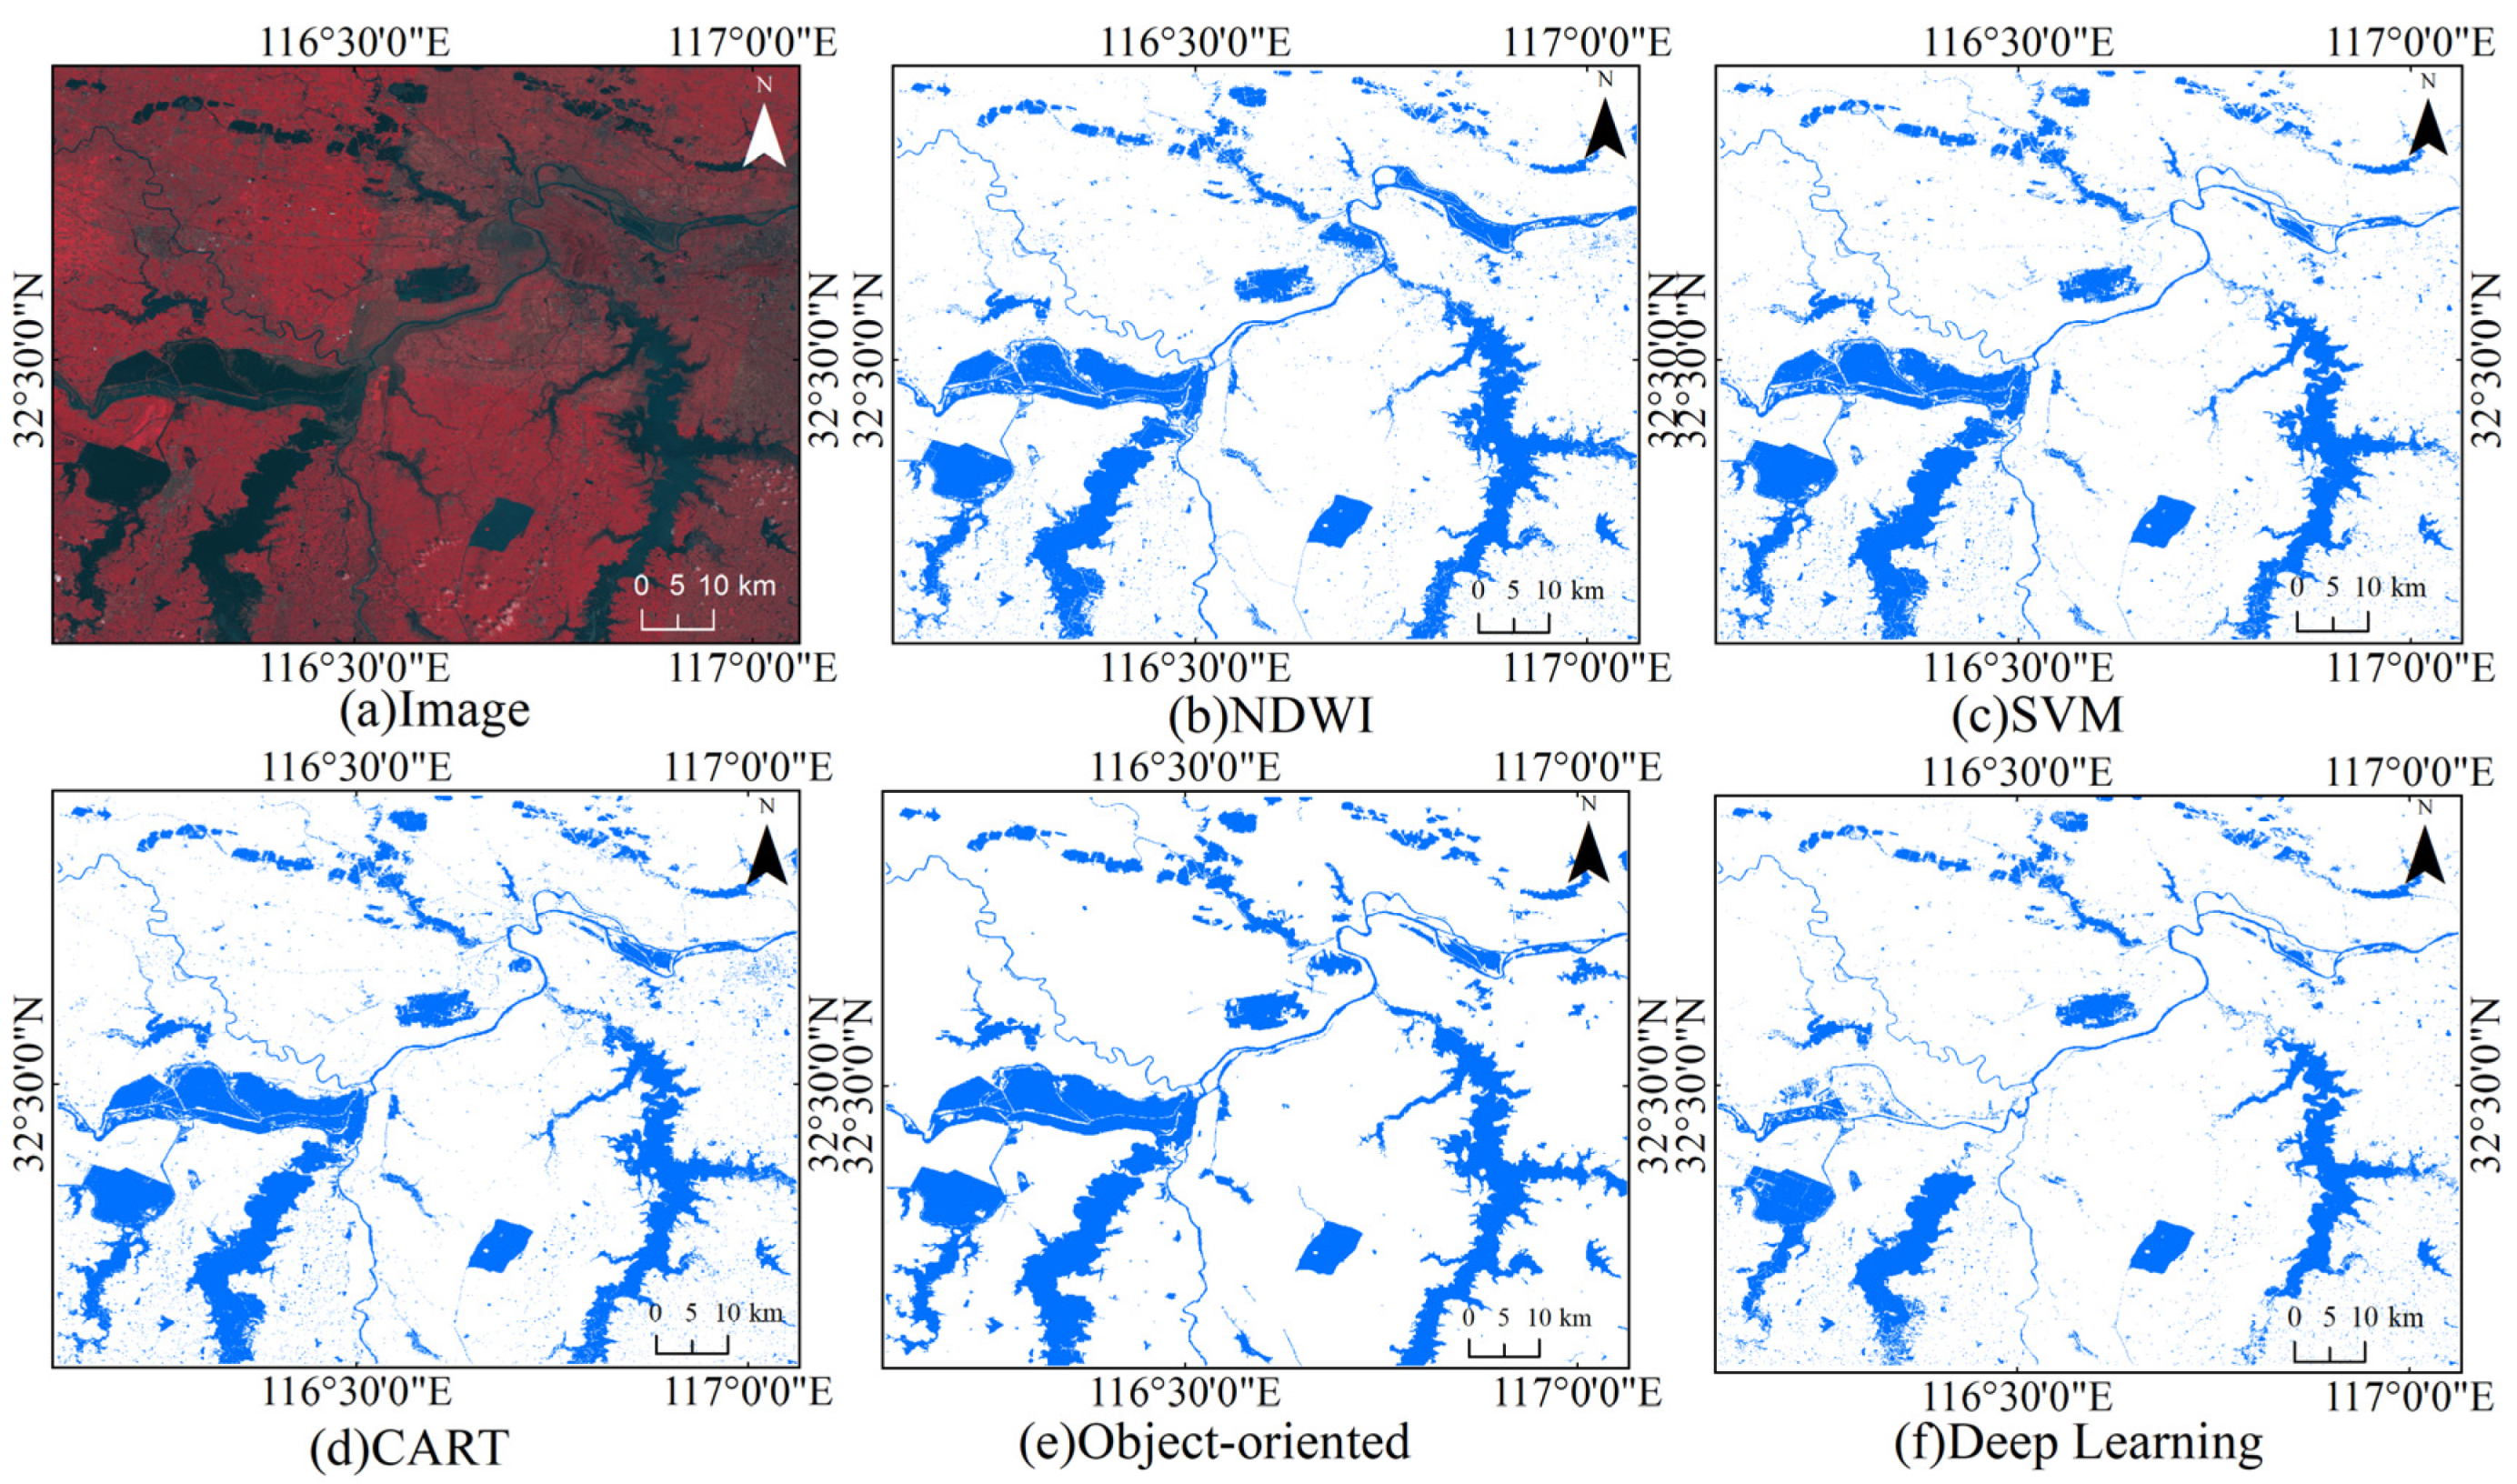
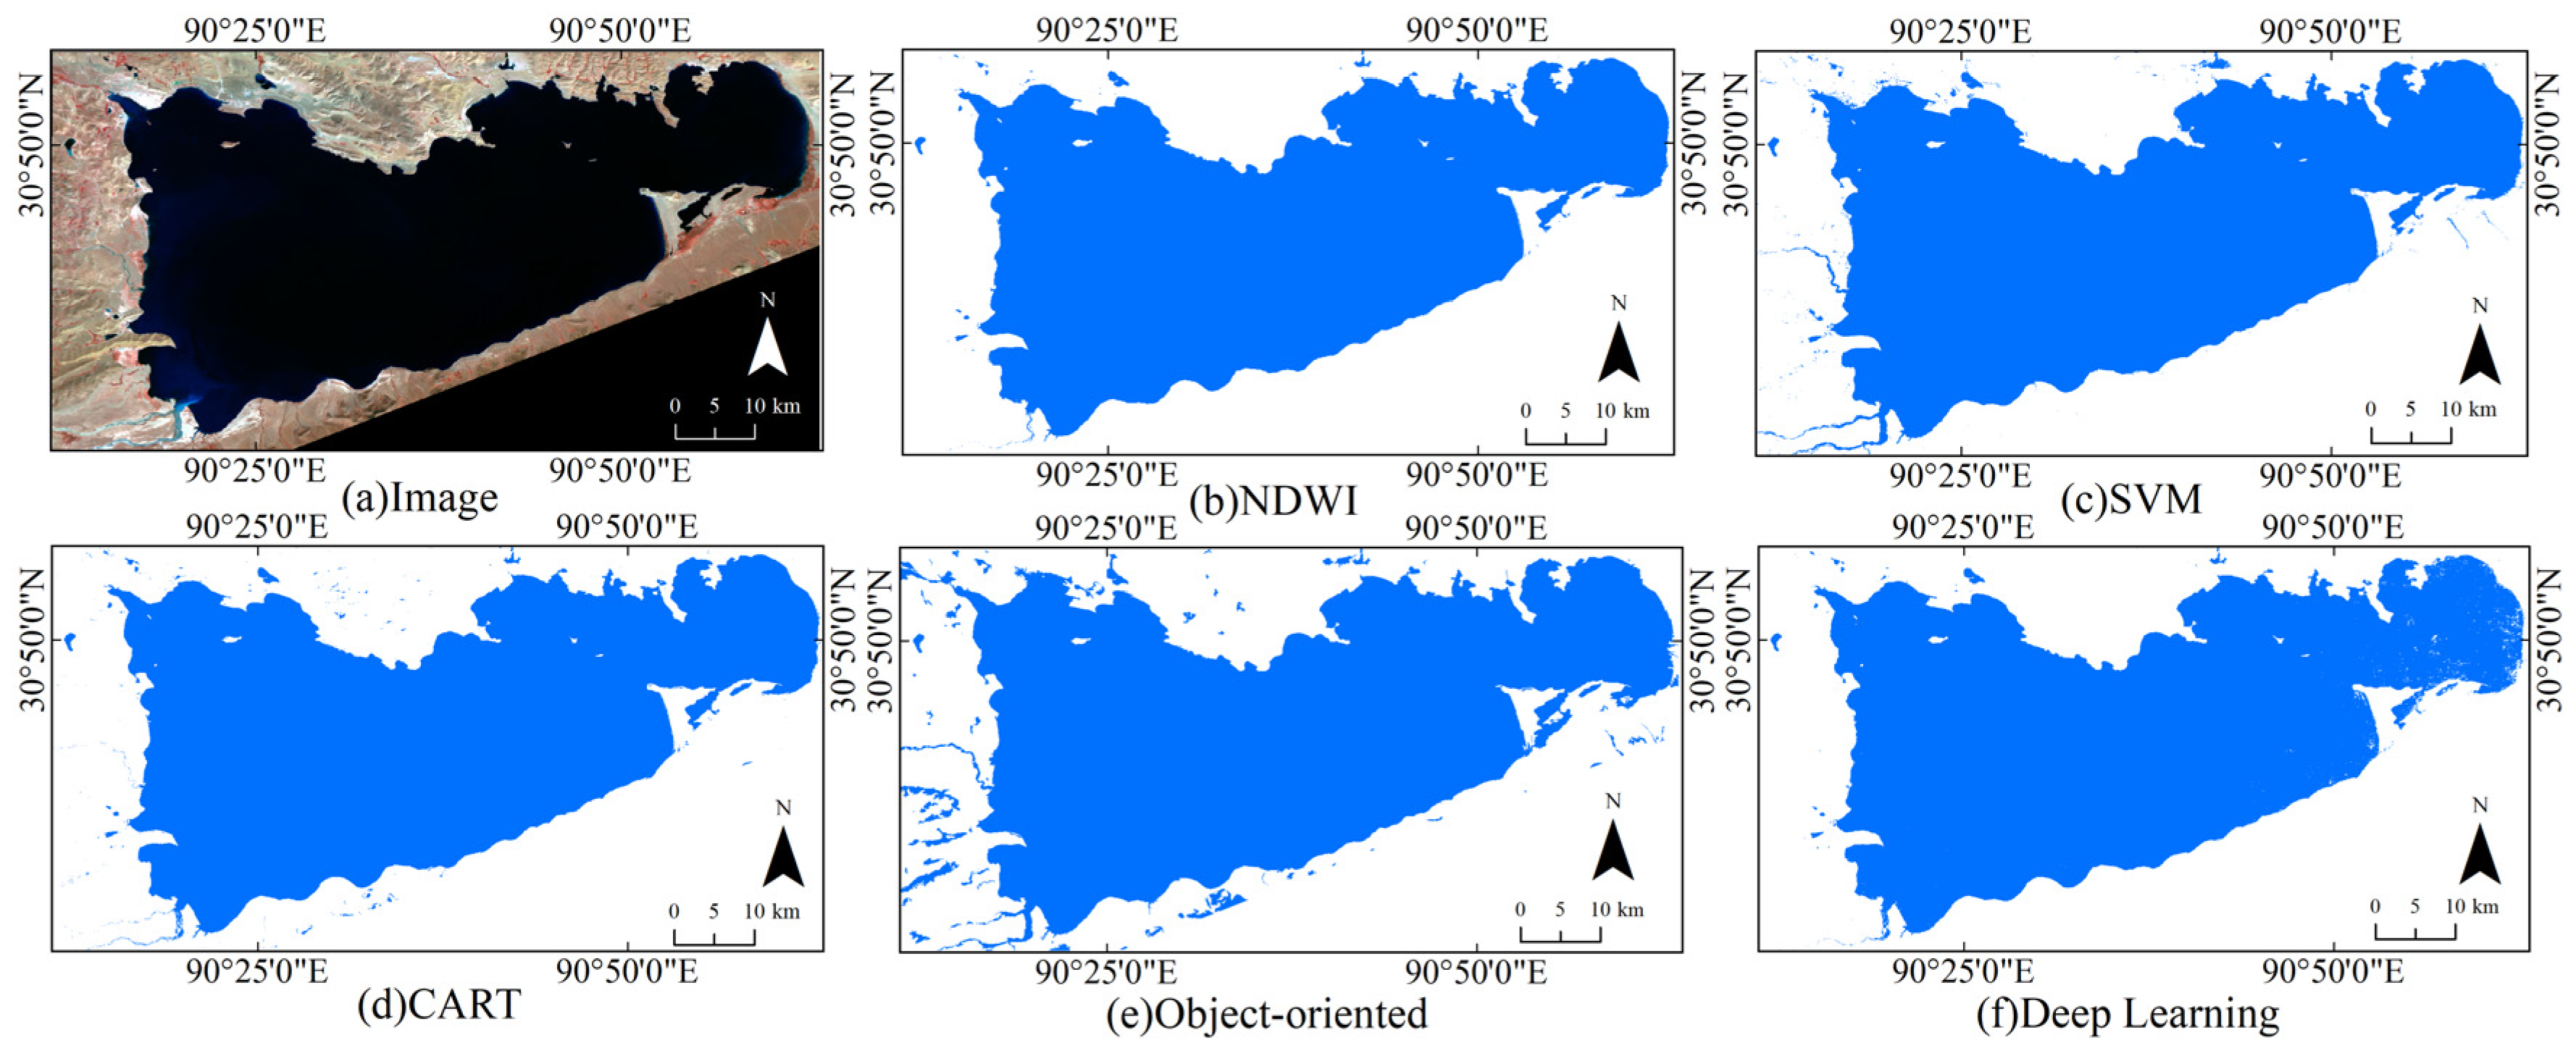
We selected the Huai River Basin (32°08′~32°51′ N, 116°10′~117°03′ E) and Lake Nam Co (30°30′~30°35′ N, 90°16′~91°03′ E). The Huai River Basin is part of Huai’an city in the north-central part of Jiangsu Province. Nam Co is the third-largest saltwater lake on the Qinghai-Tibet Plateau. It is located in the southeastern part of the northern Tibetan Plateau. We choose these two areas to examine the performance of the typical algorithms to extract water extent, because: (1) In the middle and lower reaches of the Huai River, the population densely populated and easily affected by human activities; Nam Co is not affected by human activities. The lake is dominated by mountains, and its ecological environment is basically natural. (2) There are interlaced breeding ponds, rivers, and lakes in the Huai River Basin; Nam Co is a closed inflow lake. (3) The Huai River Basin has abundant summer rainfall and large inter-annual variability; the area of Nam Co has changed from 1920 km2 to 1980 km2 in the past 30 years, and the lake area has not changed drastically. In general, these two regions represent plain area and plateau large area. Figure 2a and Figure 3a show that water bodies in the Huai River Basin are in different sizes and have complex boundaries, where the river network is dense and complicated, largely increasing the difficulty to accurate extract water extents. On the contrary, Lake Nam Co is a complete lake with clear land and water boundary. Researchers pay more attention to the interference of mountain shadows in the classification results.
We mainly used the Landsat Collection 2 Level-2 Science Products by the USGS, which has been atmospherically corrected. The NDWI, support vector machine, CART decision tree, and object-oriented methods are used to extract lake water. The threshold of the NDWI is determined using the OTSU algorithm [70]. SVM, CART, and object-oriented methods use the same training samples for training, and the categories include water and nonwater. We use the libsvm function and smileCart function on the Google Earth Engine (Google Inc., Santa Clara, CA, USA) [95] platform to train samples and SNIC algorithm for image segmentation. In addition, the global surface water dynamic dataset [23] will be compared with other methods as the classification results of deep learning below. We used confusion matrices to evaluate the precision of the extraction results, and the ANOVA test was used to examine whether the difference among groups was significant. p < 0.05 is significant throughout the manuscript.
4.2. Performance of Algorithms on Extracting Water Extents
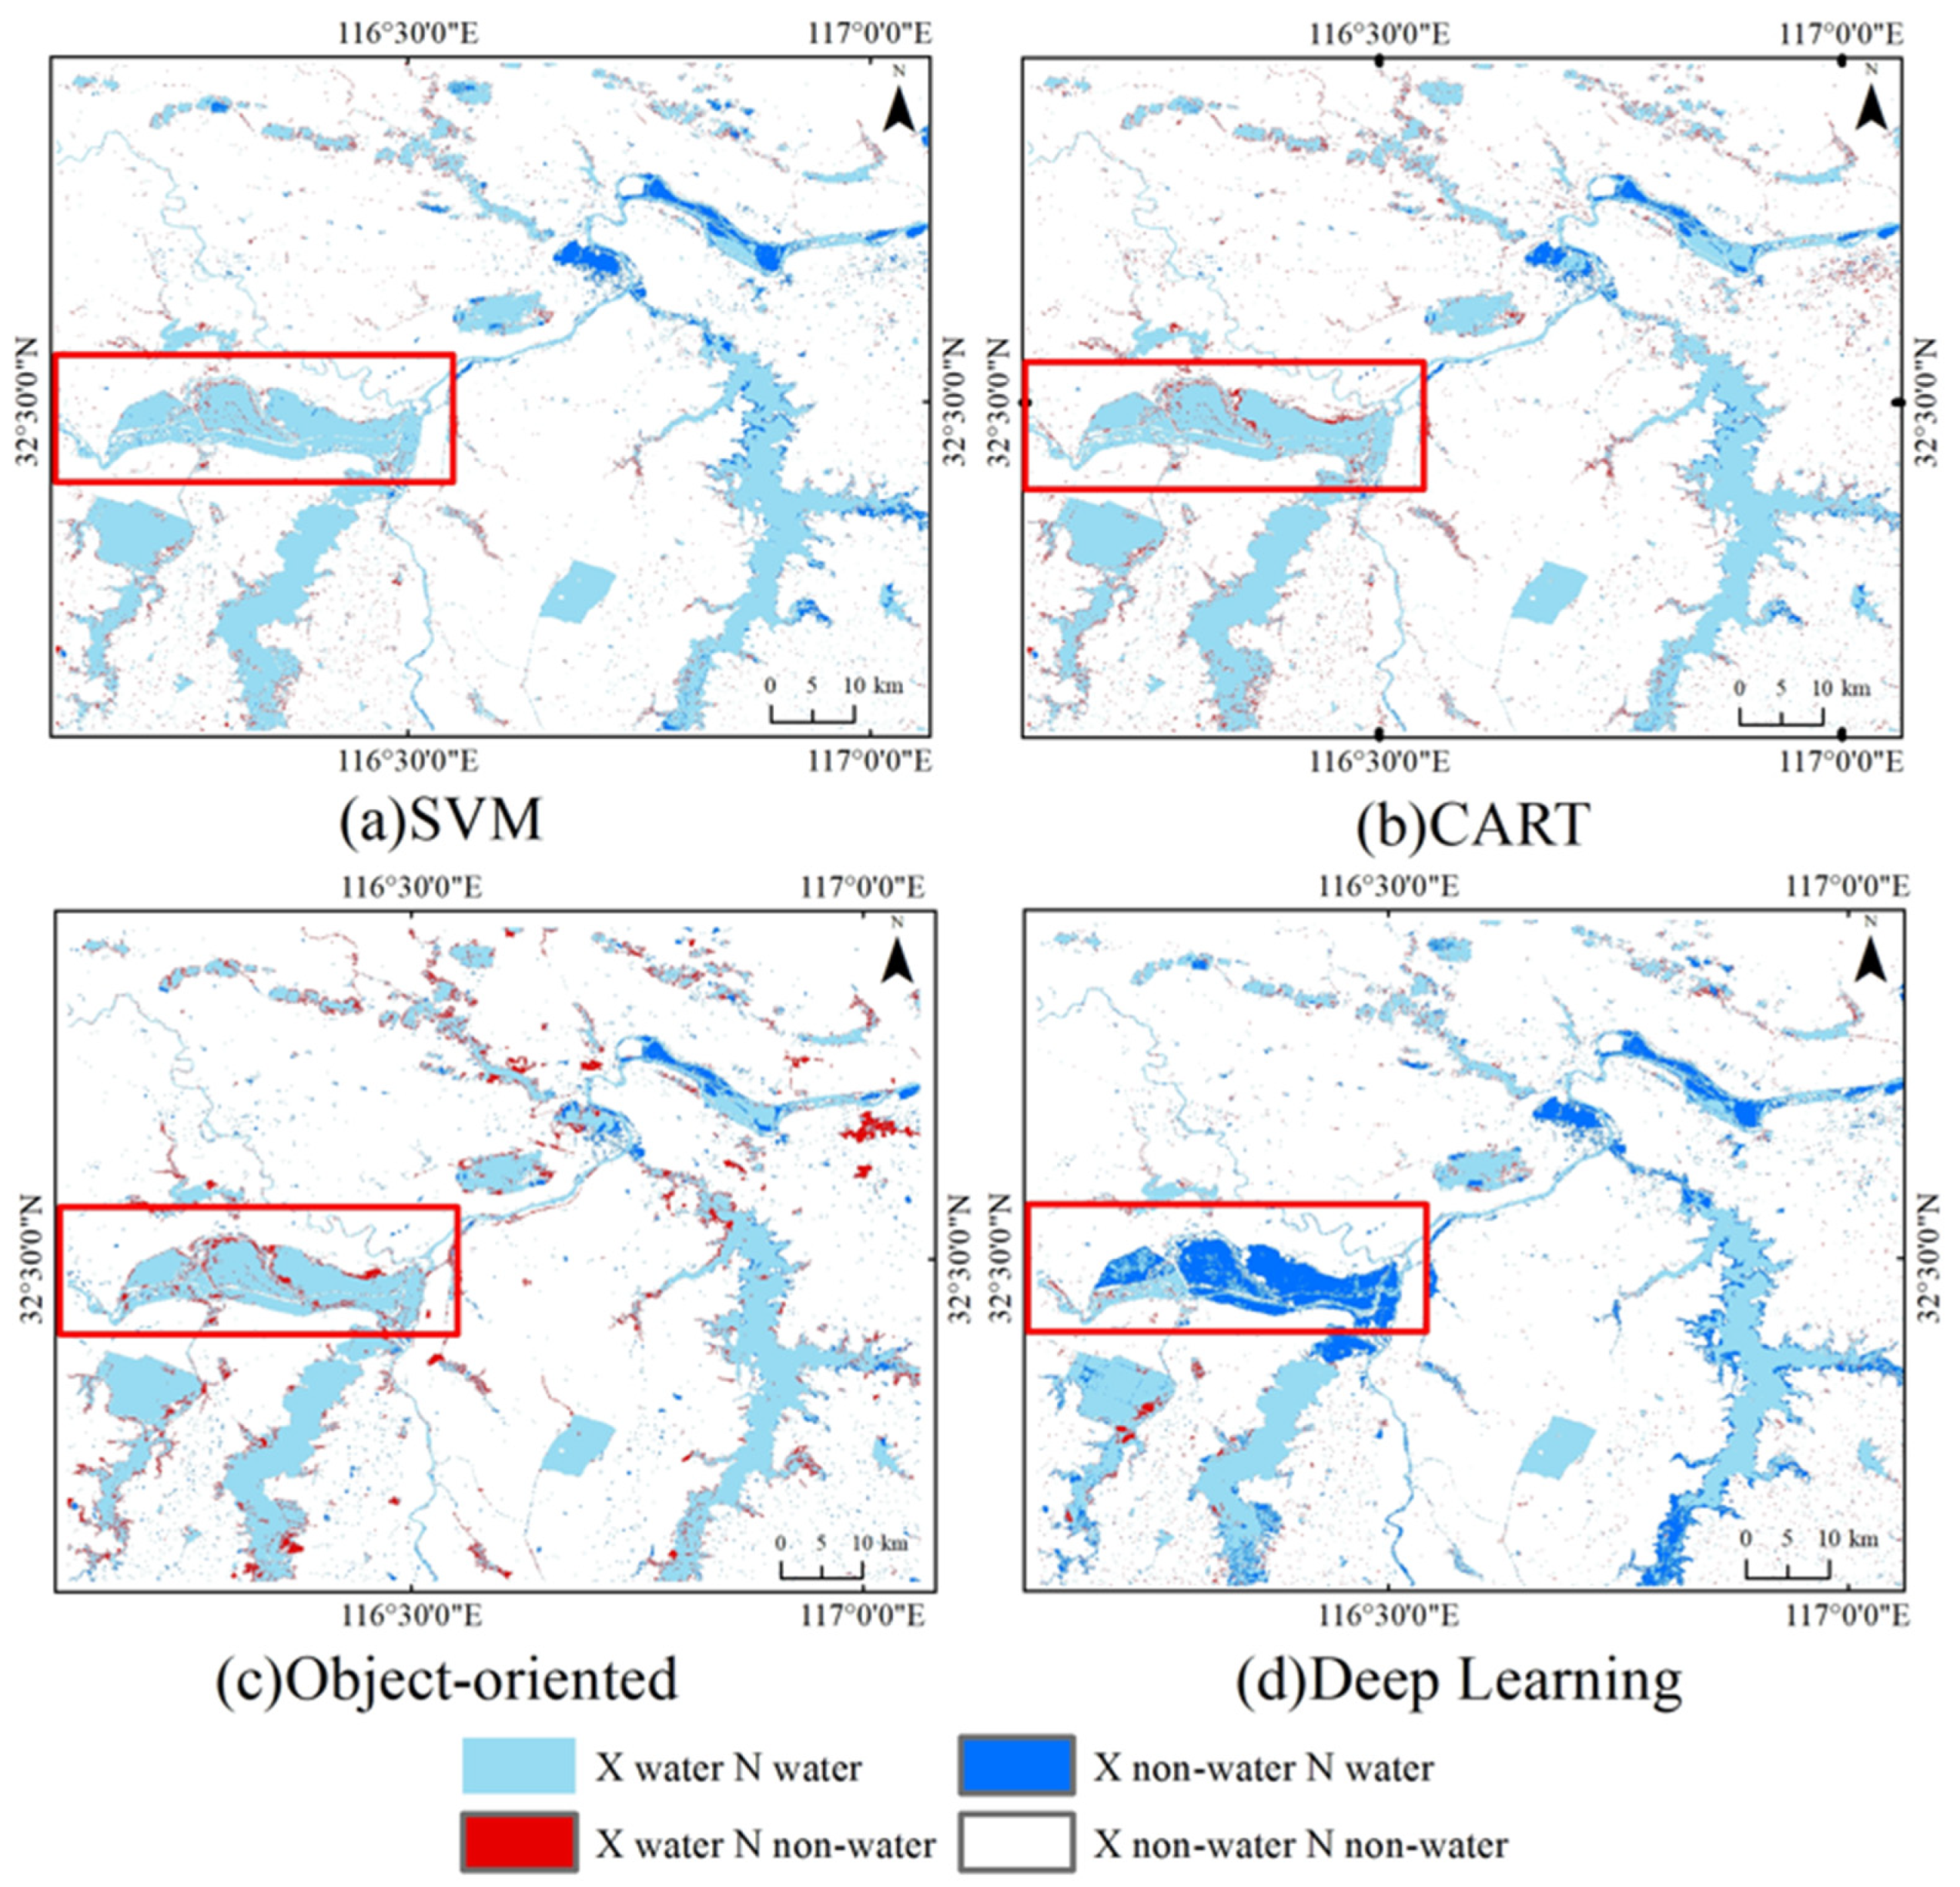
These methods showed noticeable differences in identifying the water body (Figure 2 and Figure 3). The water distribution obtained by the four methods, SVM, CART, object-oriented, and deep learning, is superimposed in the figure with the NDWI extraction results, as shown in Figure 4 and Figure 5. It can be found that the water extraction results of several methods are approximately the same; that is, the pixels of type X water and N water account for the majority. However, there are also local differences in the extraction results in the figure, which are manifested by inconsistent boundary contours and disconnected small rivers. Therefore, these local differences are compared with the original Landsat image, and further analysis is done.
Part of the Huai River Basin is located in a plain area with complex lake boundaries. In addition to large rivers and lakes, there are many small rivers, narrow artificial canals, and scattered ponds. As shown in the red box (Figure 4), the water and land boundaries extracted by several methods are inconsistent, and the deep learning method does not identify the breeding ponds around the lake. The object-oriented approach is limited by the segmentation scale and cannot identify very small water bodies.
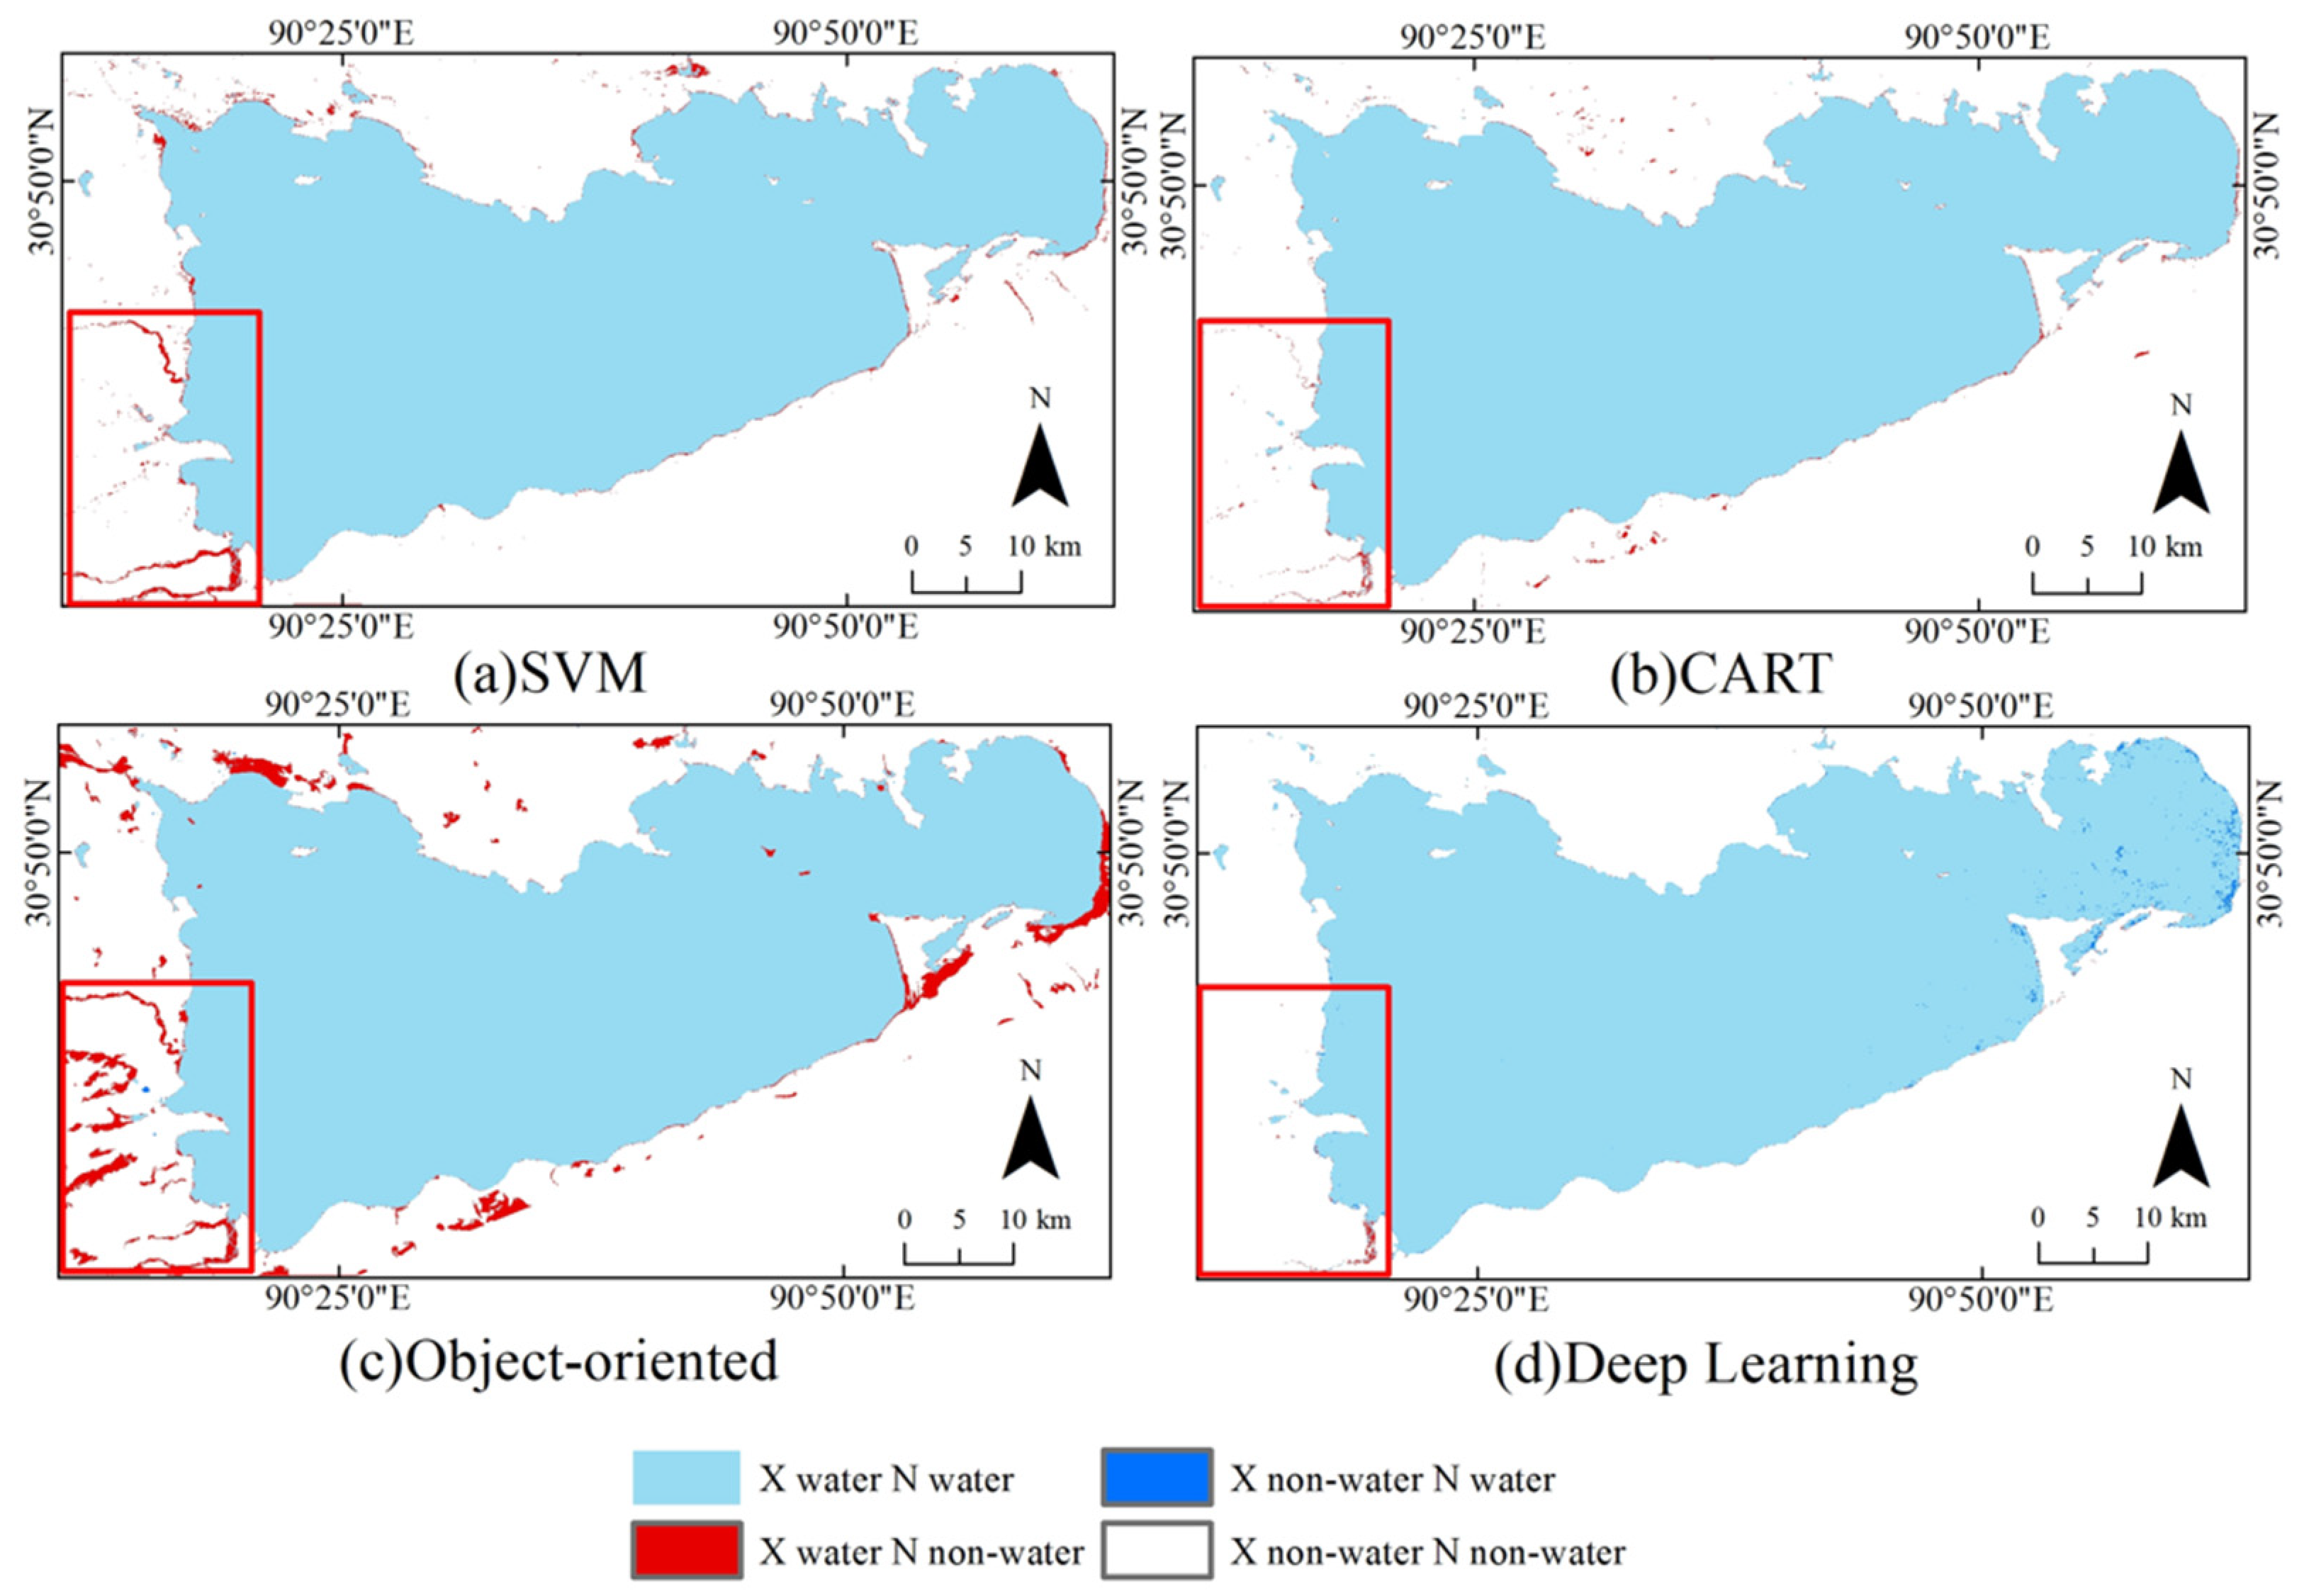
Lake Nam Co is located on the Qinghai-Tibet Plateau, and mountain shadows, ice, and snow are the main interference factors in water extraction. These five methods can extract the outline of the lake with clear water and land boundaries, but not all methods can accurately identify small and intermittent rivers (Figure 5). The SVM, CART, object-oriented, and deep learning in the red box can all identify more rivers than the NDWI, but the object-oriented method is most disturbed by the shadow of the mountain.
Accuracy evaluation of the extraction results of all water bodies in the Nam Co and Huai River basins was carried out, and the results obtained by calculating the overall accuracy and Kappa coefficient are shown in Table 5 and Table 6. The overall accuracy of the five methods in Nam Co is above 0.94, and the Kappa coefficient is above 0.95 except for the object-oriented method. In the Huai River basin, the overall accuracy of all methods is above 0.90, and the Kappa coefficient does not reach 0.94 only in deep learning. In addition, the NDWI, CART, and SVM can obtain similar results in both regions (p > 0.05), and SVM is slightly better than the other two methods (p < 0.05).
The NDWI is a fast water extraction method with wide applicability, and good results can be obtained in any area [96]. Furthermore, the NDWI can also be used as a feature in other water extraction methods to help improve the accuracy of the results [97]. The extraction results of SVM and CART are similar to the NDWI, but they are more advantageous when identifying small water bodies. Object orientation requires choosing a suitable segmentation scale to obtain smooth water and land boundaries. When extracting small water bodies, pixel-based methods are a better choice. Deep learning has high accuracy and vital applicability, but it requires a large number of samples for training, and various situations must be considered when selecting samples.
5. Conclusions
At present, there are many methods for extracting water information from remote sensing data, such as the threshold method and classification method based on optical remote sensing images, the threshold method and filtering method based on radar remote sensing images, the texture extraction method, and the combined DEM extraction method. In addition, there are complementary advantages of optical remote sensing and radar remote sensing that can be used to extract water body information. Researchers continue to improve and innovate on existing methods, looking for more automatic, extensive, and high-precision water extraction methods. There are some problems that need further study.
- Medium- and low-resolution images have a short revisit period and strong real-time performance, but the approximate resolution limits the accuracy of water body extraction. High-resolution images can obtain fine water body extraction results, but the time resolution is low, and the data are difficult to obtain. This problem of temporal and spatial resolution mismatch limits the accuracy of water body information extraction and real-time monitoring. At present, there are an increasing number of remote sensing data to choose from, and the fusion of multisource remote sensing data brings more possibilities for water body extraction;
- Water bodies do not always appear in the form of pure pixels in images. River networks, small rivers, and water and land boundaries mostly appear as mixed pixels. These water bodies are more difficult to identify [98]. Although higher-spatial resolution images can reduce these problems, they are still inevitable. When extracting the water body from a mixed pixel, not only are the abundances of the end members of the water body required, but also the position distribution of the water body must be known. Some scholars have made efforts in this regard [99], obtaining high-precision water maps through mixed pixel decomposition and super-resolution mapping;
- There are various methods of water extraction, but they lack universality. One reason is that there are widespread differences in the parameters of many remote sensing sensors at present, and different classification rules are often set for remote sensing images from different sensors. This makes the water extraction method not very versatile and poor in generalization. Another reason is that the spectral characteristics of water in the natural environment are affected by sediment, chlorophyll, etc., and many methods cannot take into account plains, mountainous areas, and urban areas. In addition, compared with ocean waters with simple optical properties, inland waters have more complex optical properties, which vary greatly with regions and seasons, and lack satellite remote sensors specifically for inland waters [100];
- There is no uniform evaluation standard for the results of water extraction, which is not conducive to a comparison between various methods. One of the current accuracy evaluation methods is based on the results of field investigation or manual interpretation, and the other is based on the extraction results of other images, using a confusion matrix, Kappa coefficient [101], and other parameters to evaluate the extraction results. Establishing a unified evaluation standard and standardizing the data quality evaluation system will make the water extraction method more mature and will accelerate its popularization and application;
- The large volume of remote sensing data and complicated processing has resulted in a concentration of research in a small area or local area. With the rapid changes in network and computer technology, cloud storage and cloud computing technologies have developed rapidly. The emergence of the NASA Earth Exchange (NEX), Amazon Web Services (AWS), and Google Earth Engine (GEE) have changed the traditional remote sensing processing method. Remote sensing images and high-performance computing power form a large-scale, long-term sequence. Remote sensing data analysis provides a new approach [102]. Currently, a large number of researchers are conducting scientific research utilizing GEE’s cloud platform [103,104].
Author Contributions
Conceptualization, J.L. and R.M.; formal analysis, J.L.; resources, M.H. and X.F.; writing—original draft preparation, J.L.; writing—review and editing, R.M. and Z.C.; visualization, J.L.; supervision, R.M.; funding acquisition, R.M., Z.C., K.X. and J.X. All authors have read and agreed to the published version of the manuscript.
Funding
This study was supported by the Strategic Priority Research Program of the Chinese Academy of Sciences (XDA28110503); the National Natural Science Foundation of China (42071341); the Science and Technology Service Network Initiative of Chinese Academy of Sciences (KFJ-STS-QYZD-2021-01-002); Science and Technology Achievement Transformation Foundation of Inner Mongolia Autonomous Region (2021CG0013); the Key Laboratory of Coastal Zone Development and Protection (2021CZEPK03).
Institutional Review Board Statement
Not applicable.
Informed Consent Statement
Not applicable.
Data Availability Statement
The data presented in this study are available on reasonable request from the corresponding author.
Acknowledgments
We thank USGS for providing the Landsat satellite data. We also thank Google Inc. for providing a platform for processing data. This research is supported by Lake-Watershed Science Data Center (http://lake.geodata.cn, accessed on 16 January 2022), National Earth System Science Data Center, and the 14th Five-year Network Security and Informatization Plan of the Chinese Academy of Sciences (WX145XQ06-04) (http://data.niglas.ac.cn, accessed on 16 January 2022).
Conflicts of Interest
The authors declare no conflict of interest.
References
- Palmer, S.C.J.; Kutser, T.; Hunter, P.D. Remote sensing of inland waters: Challenges, progress and future directions. Remote Sens. Environ. 2015, 157, 1–8. [Google Scholar] [CrossRef] [Green Version]
- Meng, L.; Guo, S.; Li, S. Summary on Extraction of Water Body from Remote Sensing Image and Flood Monitoring. Water Conserv. Informatiz. 2012, 3, 18–25. [Google Scholar]
- Danesh-Yazdi, M.; Bayati, M.; Tajrishy, M.; Chehrenegar, B. Revisiting bathymetry dynamics in Lake Urmia using extensive field data and high-resolution satellite imagery. J. Hydrol. 2021, 603, 17. [Google Scholar] [CrossRef]
- Das, N.; Bhattacharjee, R.; Choubey, A.; Ohri, A.; Gaur, S. Time series analysis of automated surface water extraction and thermal pattern variation over the Betwa river, India. Adv. Space Res. 2021, 68, 1761–1788. [Google Scholar] [CrossRef]
- Dang, B.; Li, Y.S. MSResNet: Multiscale Residual Network via Self-Supervised Learning for Water-Body Detection in Remote Sensing Imagery. Remote Sens. 2021, 13, 3122. [Google Scholar] [CrossRef]
- Woolway, R.I.; Kraemer, B.M.; Lenters, J.D.; Merchant, C.J.; O’Reilly, C.M.; Sharma, S. Global lake responses to climate change. Nat. Rev. Earth Environ. 2020, 1, 388–403. [Google Scholar] [CrossRef]
- Grant, L.; Vanderkelen, I.; Gudmundsson, L.; Tan, Z.; Perroud, M.; Stepanenko, V.M.; Debolskiy, A.V.; Droppers, B.; Janssen, A.B.G.; Woolway, R.I.; et al. Attribution of global lake systems change to anthropogenic forcing. Nat. Geosci. 2021, 14, 849–854. [Google Scholar] [CrossRef]
- Cao, Z.G.; Ma, R.H.; Duan, H.T.; Pahlevan, N.; Melack, J.; Shen, M.; Xue, K. A machine learning approach to estimate chlorophyll-a from Landsat-8 measurements in inland lakes. Remote Sens. Environ. 2020, 248, 111974. [Google Scholar] [CrossRef]
- Zhang, Y.; Pan, M.; Wood, E.F. On Creating Global Gridded Terrestrial Water Budget Estimates from Satellite Remote Sensing. Surv. Geophys. 2016, 37, 249–268. [Google Scholar] [CrossRef]
- Al Bitar, A.; Parrens, M.; Fatras, C.; Luque, S.P.; IEEE. Global Weekly Inland Surfanc Water Dynamics From L-Ban Microwave. In Proceedings of the IEEE International Geoscience and Remote Sensing Symposium (IGARSS), Electr Network, Waikoloa, HI, USA, 26 September–2 October 2020; pp. 5089–5092. [Google Scholar]
- Li, D.; Wu, B.; Chen, B.; Xue, Y.; Zhang, Y. Review of water body information extraction based on satellite remote sensing. J. Tsinghua Univ. Sci. Technol. 2020, 60, 147–161. [Google Scholar] [CrossRef]
- Li, Y.; Ding, J.; Yan, R. Extraction of small river information based on China-made GF-1 remote sense images. Resour. Sci. 2015, 37, 408–416. [Google Scholar]
- Verpoorter, C.; Kutser, T.; Tranvik, L. Automated mapping of water bodies using Landsat multispectral data. Limnol. Oceanogr. Methods 2012, 10, 1037–1050. [Google Scholar] [CrossRef]
- McFeeters, S.K. The use of the Normalized Difference Water Index (NDWI) in the delineation of open water features. Int. J. Remote Sens. 2007, 17, 1425–1432. [Google Scholar] [CrossRef]
- Xu, H. A study on information extraction of water body with the modified normalized difference water index (MNDWI). J. Remote Sens. 2005, 9, 589–595. [Google Scholar]
- Shen, Z.; Xia, L.; Li, J.; Luo, J.; Hu, X. Automatic and high-precision extraction of rivers from remotely sensed images with Gaussian normalized water index. J. Image Graph. 2013, 18, 421–428. [Google Scholar]
- Zhang, D.; Yang, S.; Wang, Y.; Zheng, W. Refined water body information extraction of Three Gorges reservoir by using GF-1 satellite data. Yangtze River 2019, 50, 233–239. [Google Scholar] [CrossRef]
- Chen, C.; Fu, J.; Sui, X.; Lu, X.; Tan, A. Construction and application of knowledge decision tree after a disaster for water body information extraction from remote sensing images. J. Remote Sens. 2018, 22, 792–801. [Google Scholar] [CrossRef]
- He, H.; Huang, X.; Li, H. Water Body Extraction of High Resolution Remote Sensing Image based on Improved U-Net Networ. J. Geo-Inf. Sci. 2020, 22, 2010–2022. [Google Scholar] [CrossRef]
- Anping, L.; Lijun, C.; Jun, C.; Chaoying, H.; Xin, C.; Jin, C.; Shu, P.; Fangdi, S.; Peng, G. High-resolution remote sensing mapping of global land water. Sci. China: Earth Sci. 2014, 44, 1634–1645. [Google Scholar]
- Pekel, J.F.; Cottam, A.; Gorelick, N.; Belward, A.S. High-resolution mapping of global surface water and its long-term changes. Nature 2016, 540, 418–422. [Google Scholar] [CrossRef]
- Abrams, M.; Crippen, R.; Fujisada, H. ASTER Global Digital Elevation Model (GDEM) and ASTER Global Water Body Dataset (ASTWBD). Remote Sens. 2020, 12, 1156. [Google Scholar] [CrossRef] [Green Version]
- Pickens, A.H.; Hansen, M.C.; Hancher, M.; Stehman, S.V.; Tyukavina, A.; Potapov, P.; Marroquin, B.; Sherani, Z. Mapping and sampling to characterize global inland water dynamics from 1999 to 2018 with full Landsat time-series. Remote Sens. Environ. 2020, 243, 111792. [Google Scholar] [CrossRef]
- Khandelwal, A.; Karpatne, A.; Marlier, M.E.; Kim, J.; Lettenmaier, D.P.; Kumar, V. An approach for global monitoring of surface water extent variations in reservoirs using MODIS data. Remote Sens. Environ. 2017, 202, 113–128. [Google Scholar] [CrossRef]
- Tortini, R.; Noujdina, N.; Yeo, S.; Ricko, M.; Birkett, C.M.; Khandelwal, A.; Kumar, V.; Marlier, M.E.; Lettenmaier, D.P. Satellite-based remote sensing data set of global surface water storage change from 1992 to 2018. Earth Syst. Sci. Data 2020, 12, 1141–1151. [Google Scholar] [CrossRef]
- Wang, S.; Li, J.; Zhang, W.; Cao, C.; Zhang, F.; Shen, Q.; Zhang, X.; Zhang, B. A dataset of remote-sensed Forel-Ule Index for global inland waters during 2000–2018. Sci. Data 2021, 8, 26. [Google Scholar] [CrossRef] [PubMed]
- Chen, F.; Zhang, M.; Guo, H.; Allen, S.; Kargel, J.S.; Haritashya, U.K.; Watson, C.S. Annual 30 m dataset for glacial lakes in High Mountain Asia from 2008 to 2017. Earth Syst. Sci. Data 2021, 13, 741–766. [Google Scholar] [CrossRef]
- Lu, S.; Ma, J.; Ma, X.; Tang, H.; Baig, M. Time series of the Inland Surface Water Dataset in China (ISWDC) for 2000–2016 derived from MODIS archives. Earth Syst. Sci. Data 2019, 11, 1099–1108. [Google Scholar] [CrossRef] [Green Version]
- Zou, Z.; Xiao, X.; Dong, J.; Qin, Y.; Doughty, R.B.; Menarguez, M.A.; Zhang, G.; Wang, J. Divergent trends of open-surface water body area in the contiguous United States from 1984 to 2016. Proc. Natl. Acad. Sci. USA 2018, 115, 3810–3815. [Google Scholar] [CrossRef] [Green Version]
- Puttinaovarat, S.; Khaimook, K.; Polnigongit, W.; Horkaew, P.; IEEE. Robust Water Body Extraction from Landsat Imagery by using Gradual Assignment of Water Index and DSM. In Proceedings of the IEEE 2015 International Conference on Signal and Image Processing Applications (ICSIPA), Kuala Lumpur, Malaysia, 19–21 October 2015; pp. 122–126. [Google Scholar]
- Ning, F.S.; Lee, Y.C. Combining Spectral Water Indices and Mathematical Morphology to Evaluate Surface Water Extraction in Taiwan. Water 2021, 13, 2774. [Google Scholar] [CrossRef]
- Yan, Z.; Jinwei, D. Remote Sensing of Land Surface Water Monitoring research progress. J. Geo-Inf. Sci. 2019, 21, 1768–1778. [Google Scholar]
- Huang, C.; Chen, Y.; Zhang, S.Q.; Wu, J.P. Detecting, Extracting, and Monitoring Surface Water From Space Using Optical Sensors: A Review. Rev. Geophys. 2018, 56, 333–360. [Google Scholar] [CrossRef]
- Gholizadeh, M.H.; Melesse, A.M.; Reddi, L. A Comprehensive Review on Water Quality Parameters Estimation Using Remote Sensing Techniques. Sensors 2016, 16, 1298. [Google Scholar] [CrossRef] [PubMed] [Green Version]
- Wang, Y.Q.; Yesou, H. Remote Sensing of Floodpath Lakes and Wetlands: A Challenging Frontier in the Monitoring of Changing Environments. Remote Sens. 2018, 10, 1955. [Google Scholar] [CrossRef] [Green Version]
- Su, L.; Li, Z.; Gao, F.; Yu, M. A review of remote sensing image water extraction. Remote Sens. Land Resour. 2021, 33, 9–19. [Google Scholar] [CrossRef]
- Lymburner, L.; Botha, E.; Hestir, E.; Anstee, J.; Sagar, S.; Dekker, A.; Malthus, T. Landsat 8: Providing continuity and increased precision for measuring multi-decadal time series of total suspended matter. Remote Sens. Environ. 2016, 185, 108–118. [Google Scholar] [CrossRef]
- Olmanson, L.G.; Brezonik, P.L.; Finlay, J.C.; Bauer, M.E. Comparison of Landsat 8 and Landsat 7 for regional measurements of CDOM and water clarity in lakes. Remote Sens. Environ. 2016, 185, 119–128. [Google Scholar] [CrossRef]
- Fetene, A.; Teshager, M.A. Watershed characteristics and physico-chemical analysis of lakes and reservoirs in North Western, Ethiopia. Sustain. Water Resour. Manag. 2020, 6, 98. [Google Scholar] [CrossRef]
- Wang, Z.F.; Liu, J.G.; Li, J.B.; Zhang, D.D. Multi-Spectral Water Index (MuWI): A Native 10-m Multi-Spectral Water Index for Accurate Water Mapping on Sentinel-2. Remote Sens. 2018, 10, 1643. [Google Scholar] [CrossRef] [Green Version]
- Shen, M.; Duan, H.T.; Cao, Z.G.; Xue, K.; Qi, T.C.; Ma, J.G.; Liu, D.; Song, K.S.; Huang, C.L.; Song, X.Y. Sentinel-3 OLCI observations of water clarity in large lakes in eastern China: Implications for SDG 6.3.2 evaluation. Remote Sens. Environ. 2020, 247, 17. [Google Scholar] [CrossRef]
- Wen, S.; Wang, Q.; Li, Y.-M.; Zhu, L.; Lu, H.; Lei, S.-H.; Ding, X.-L.; Miao, S. Remote Sensing Identification of Urban Black-Odor Water Bodies Based on High-Resolution Images:A Case Study in Nanjing. Huan Jing Ke Xue=Huanjing Kexue 2018, 39, 57–67. [Google Scholar] [CrossRef]
- Xu, J.; Gao, C.; Wang, Y.Q. Extraction of Spatial and Temporal Patterns of Concentrations of Chlorophyll-a and Total Suspended Matter in Poyang Lake Using GF-1 Satellite Data. Remote Sens. 2020, 12, 622. [Google Scholar] [CrossRef] [Green Version]
- Yan, W.; Liu, J.S.; Zhang, M.X.; Hu, L.J.; Chen, J.J. Outburst flood forecasting by monitoring glacier-dammed lake using satellite images of Karakoram Mountains, China. Quat. Int. 2017, 453, 24–36. [Google Scholar] [CrossRef]
- Gumma, M.K.; Mohammad, I.; Nedumaran, S.; Whitbread, A.; Lagerkvist, C.J. Urban Sprawl and Adverse Impacts on Agricultural Land: A Case Study on Hyderabad, India. Remote Sens. 2017, 9, 1136. [Google Scholar] [CrossRef] [Green Version]
- Gu, X.Z.; Qingwei, Z.; Hua, C.; Erxue, C.; Lei, Z.; Fei, Y.; Kuan, T. Study on water information extraction using domestic GF-3 image. J. Remote Sens. 2019, 23, 555–565. [Google Scholar] [CrossRef]
- Cian, F.; Marconcini, M.; Ceccato, P. Normalized Difference Flood Index for rapid flood mapping: Taking advantage of EO big data. Remote Sens. Environ. 2018, 209, 712–730. [Google Scholar] [CrossRef]
- Yu, G.; Yuqing, Y. Rapid extraction and change analysis of flood inundation area based on Sentinel-1 SAR image. In Proceedings of the Jiangsu Society of Surveying and Mapping, 2020 Annual Academic Meeting, Nanjing, China, 11 December 2020; p. 4. [Google Scholar]
- Mazur, A.K.; Wahlin, A.K.; Krezel, A. An object-based SAR image iceberg detection algorithm applied to the Amundsen Sea. Remote Sens. Environ. 2017, 189, 67–83. [Google Scholar] [CrossRef] [Green Version]
- Engram, M.; Arp, C.D.; Jones, B.M.; Ajadi, O.A.; Meyer, F.J. Analyzing floating and bedfast lake ice regimes across Arctic Alaska using 25 years of space-borne SAR imagery. Remote Sens. Environ. 2018, 209, 660–676. [Google Scholar] [CrossRef]
- Giustarini, L.; Hostache, R.; Matgen, P.; Schumann, G.J.; Bates, P.D.; Mason, D.C. A Change Detection Approach to Flood Mapping in Urban Areas Using TerraSAR-X. IEEE Trans. Geosci. Remote Sens. 2013, 51, 2417–2430. [Google Scholar] [CrossRef] [Green Version]
- Huadong, G.; Lu, Z. Sixty Years of Radar Remote Sensing: Four Phases of Development. J. Remote Sens. 2019, 23, 1023–1035. [Google Scholar] [CrossRef]
- Zhu, J.; Guo, H.; Fan, X.; Ding, C.; Ligang, L.; Yulong, L. High-resolution SAR image water detection based on texture and imaging knowledge. Water Sci. Prog. 2006, 17, 525–530. [Google Scholar] [CrossRef]
- Ying, D.; Hong, Z.; Chao, W.; Meng, L. Object-oriented combining texture and polarization decomposition Polarized SAR water extraction method. Remote Sens. Technol. Appl. 2016, 31, 714–723. [Google Scholar] [CrossRef]
- Horkaew, P.; Puttinaovarat, S. Entropy-Based Fusion of Water Indices and DSM Derivatives for Automatic Water Surfaces Extraction and Flood Monitoring. ISPRS Int. J. Geo-Inf. 2017, 6, 301. [Google Scholar] [CrossRef] [Green Version]
- Li, C.; Xue, D.; Zhang, L.; Su, L. Research on water extraction methods based on Sentinel-1A satellite SAR data. Geospat. Inf. 2018, 16, 37–40. [Google Scholar] [CrossRef]
- Wang, X.; Jin, R.; Lin, J.; Zeng, X.; Zhao, Z. Automatic algorithm for extracting lake boundaries in Qinghai-Tibet Plateau on Cloudy Landsat TM/OLI image and DEM. Remote Sens. Technol. Appl. 2020, 35, 882–892. [Google Scholar] [CrossRef]
- Xie, Q.; Zhang, J.; Lu, K.; Yunxiao, S.; Linlin, Z. Research and Application of Flood Submerged Information Precise Extraction Based on Typical Remote Sensing Image Fusion Method. Catastrophe 2017, 32, 183–186+204. [Google Scholar] [CrossRef]
- Xin, G. Water Change Detection Based on Pixel-Level Fusion of Optics and SAR Images. Master’s Thesis, China University of Mining and Technology, Xuzhou, China, 2019. [Google Scholar]
- Chang, T.; Kuo, C.J. Texture analysis and classification with tree-structured wavelet transform. IEEE Trans Image Process 1993, 2, 429–441. [Google Scholar] [CrossRef] [Green Version]
- Haralick, R.M.; Shanmugam, K.; Dinstein, I. Textural Features for Image Classification. Stud. Media Commun. 1973, 6, 610–621. [Google Scholar] [CrossRef] [Green Version]
- Jiang, H.; Feng, M.; Xiao, T.; Wang, C. A Narrow River Extraction Method Based on Linear Feature Enhancement in TM Image. Acta Geod. Et Cartogr. Sin. 2014, 43, 705–710. [Google Scholar] [CrossRef]
- Wang, B.; Fan, D. Research progress of deep learning in classification and recognition of remote sensing images. Bull. Surv. Mapp. 2019, 2, 99–102, 136. [Google Scholar] [CrossRef]
- Chen, Q.; Zheng, L.; Li, X.; Xu, C.; Wu, Y.; Xie, D.; Liu, L. Water Body Extraction from High-Resolution Satellite Remote Sensing Images Based on Deep Learning. Geogr. Geo-Inf. Sci. 2019, 35, 43–49. [Google Scholar] [CrossRef]
- Frazier, P.S.; Page, K.J. Water body detection and delineation with Landsat TM data. Photogramm. Eng. Remote Sens. 2000, 66, 1461–1467. [Google Scholar] [CrossRef]
- Bi, H.; Wang, S.; Zeng, J.; Zhao, Y.; Wang, H.; Yin, H. Comparison and Analysis of Several Common Water Extraction Methods Based on TM Image. Remote Sens. Inf. 2012, 27, 77–82. [Google Scholar] [CrossRef]
- Yu, R.; Chao, Z.; Tingxi, L. Application and Prospect of Remote Sensing Technology in Lake Water Extraction. In Proceedings of the National Water Resources Reasonable Allocation and Optimal Scheduling and Water Environment Pollution Prevention and Control Technology Exchange Seminar, Xining, Qinghai, China, 1 August 2011; p. 6. [Google Scholar]
- Cao, Y.; Liu, C. Study on flood monitoring using EnviSat ASAR data. Geogr. Geogr. Inf. Sci. 2006, 22, 13–15. [Google Scholar]
- Santoro, M.; Wegmuller, U.; Lamarche, C.; Bontemps, S.; Defoumy, P.; Arino, O. Strengths and weaknesses of multi-year Envisat ASAR backscatter measurements to map permanent open water bodies at global scale. Remote Sens. Environ. 2015, 171, 185–201. [Google Scholar] [CrossRef]
- Otsu, N. A Threshold Selection Method from Gray-Level Histograms. IEEE Trans. Syst. Man Cybern. 1979, 9, 62–66. [Google Scholar] [CrossRef] [Green Version]
- Li, J.; Shifeng, H.; Jiren, L. Research on extraction of water body from ENVISAT ASAR images:a modified Otsu threshold method. J. Nat. Disasters 2010, 19, 139–145. [Google Scholar] [CrossRef]
- Rister, M. Superoxide anion and superoxide dismutase activity in arthritic conditions. Agents Actions Suppl. 1981, 8, 137–143. [Google Scholar] [CrossRef]
- Du, Y.Y.; Zhou, C.H. Automatically Extracting Remote Sensing Information for Water Bodies. J. Remote Sens. 1998, 2, 264–269. [Google Scholar]
- Duong, N.D. Water Body Extraction From Multi Spectral Image By Spectral Pattern Anakysis. In Proceedings of the 22nd Congress of the International-Society-for-Photogrammetry-and-Remote-Sensing, Melbourne, Australia, 25 August–1 September 2012; pp. 181–186. [Google Scholar]
- Ouma, Y.O.; Tateishi, R. A water index for rapid mapping of shoreline changes of five East African Rift Valley lakes: An empirical analysis using Landsat TM and ETM+ data. Int. J. Remote Sens. 2006, 27, 3153–3181. [Google Scholar] [CrossRef]
- Yan, P.; Zhang, Y. A Study on Information Extraction of Water System in Semi-arid Regions with the Enhanced Water Index (EWI) and GIS Based Noise Remove Techniques. Remote Sens. Inf. 2007, 6, 62–67. [Google Scholar]
- Feng, D. A New Method for Fast Information Extraction of Water Bodies Using Remotely Sensed Data. Remote Sens. Technol. Appl. 2009, 24, 167–171. [Google Scholar]
- Zhu, X.; Ding, J.; Xia, N.; Guo, J.; Zhang, S.; Yang, T.; Wang, J.; Li, X. Temperature vegetation water index: A novel stabilized threshold method for lake surface water mapping. Resour. Sci. 2019, 41, 790–802. [Google Scholar] [CrossRef]
- Feyisa, G.L.; Meilby, H.; Fensholt, R.; Proud, S.R. Automated Water Extraction Index: A new technique for surface water mapping using Landsat imagery. Remote Sens. Environ. 2014, 140, 23–35. [Google Scholar] [CrossRef]
- Jia, S.; Xue, D.; Chengrao, L.I.; Zheng, J.; Wanqiu, L.I. Study on new method for water area information extraction based on Sentinel-1 data. Yangtze River 2019, 50, 213–217. [Google Scholar] [CrossRef]
- Rao, P.; Wang, J. Water Extraction Based on the Optimal Subregion and the Optimal Indexes Combined. J. Geo-Inf. Sci. 2017, 19, 702–712. [Google Scholar] [CrossRef]
- Wen, Z.F.; Zhang, C.; Shao, G.F.; Wu, S.J.; Atkinson, P.M. Ensembles of multiple spectral water indices for improving surface water classification. Int. J. Appl. Earth Obs. 2021, 96, 102278. [Google Scholar] [CrossRef]
- Vapnik, V.N. The Nature of Statistical Learning Theory; The Nature of Statistical Learning Theory; University of Minnesota: Minneapolis, MN, USA, 1995. [Google Scholar]
- Liu, Q.; Huang, C.; Shi, Z.; Zhang, S. Probabilistic River Water Mapping from Landsat-8 Using the Support Vector Machine Method. Remote Sens. 2020, 12, 1374. [Google Scholar] [CrossRef]
- Tehrany, M.S.; Pradhan, B.; Jebur, M.N. Flood susceptibility mapping using a novel ensemble weights-of-evidence and support vector machine models in GIS. J. Hydrol. 2014, 512, 332–343. [Google Scholar] [CrossRef]
- Zhang, H.; Wang, D.; Gao, Y.; Gong, W. A study of extraction method of mountain surface water based on OLI data and decision tree method. Eng. Surv. Mapp. 2017, 26, 45. [Google Scholar] [CrossRef]
- Hay, G.J.; Niemann, K.O. Visualizing 3-D texture: A three-dimensional approach to model forest texture. Can. J. Remote Sens. 1994, 20, 90–101. [Google Scholar]
- Tang, L.; Liu, W.; Yang, D.; Chen, L.; Yangmei, S.U.; Xianli, X.U. Flooding Monitoring Application Based on the Object-oriented Method and Sentinel-1A SAR Data. J. Geo-Inf. Sci. 2018, 20, 377–384. [Google Scholar]
- Gao, R.; Ouyang, J.; Chen, L.; Yang, J. SPOT7 image classification of Hedi reservoir. Sci. Surv. Mapp. 2019, 44, 90–99. [Google Scholar] [CrossRef]
- Hinton, G.E.; Osindero, S.; Teh, Y.W. A fast learning algorithm for deep belief nets. Neural Comput. 2006, 18, 1527–1554. [Google Scholar] [CrossRef] [PubMed]
- Li, Y.; Zhang, H.; Xue, X.; Jiang, Y.; Shen, Q. Deep learning for remote sensing image classification: A survey. WIREs Data Min. Knowl. Discov. 2018, 8, e1264. [Google Scholar] [CrossRef] [Green Version]
- Liu, D.; Han, L.; Han, X. High Spatial Resolution Remote Sensing Image Classification Based on Deep Learning. Acta Opt. Sin. 2016, 36, 0428001. [Google Scholar]
- Liang, Z.; Wu, Y.; Yang, H.; YAO, X. Full-automatic Water Extraction Method for Remote Sensing Imagery Based on Densely Connected Fully Convolutional Neural Network. Remote Sens. Inf. 2020, 35, 68–77. [Google Scholar] [CrossRef]
- Fang, H.; Jiang, Y.; Yuntao, Y.E.; Cao, Y. River Extraction from High-Resolution Satellite Images Combining Deep Learning and Multiple Chessboard Segmentation. Acta Sci. Nat. Univ. Pekin. 2019, 55, 692–698. [Google Scholar] [CrossRef]
- Gorelick, N.; Hancher, M.; Dixon, M.; Ilyushchenko, S.; Thau, D.; Moore, R. Google Earth Engine: Planetary-scale geospatial analysis for everyone. Remote Sens. Environ. 2017, 202, 18–27. [Google Scholar] [CrossRef]
- Zhou, H.; Ye, H.P.; Wei, X.H. Comparative study on water extraction methods based on Sentinel-1/2: A case study of small water body in Sri Lanka. J. Univ. Chin. Acad. Sci. 2019, 36, 794–802. [Google Scholar] [CrossRef]
- Kaplan, G.; Avdan, U. Object-based water body extraction model using Sentinel-2 satellite imagery. Eur. J. Remote Sens. 2017, 50, 137–143. [Google Scholar] [CrossRef] [Green Version]
- Kim, W.; Kim, C. Spatiotemporal Saliency Detection Using Textural Contrast and Its Applications. IEEE Trans. Circuits Syst. Video Technol. 2014, 24, 646–659. [Google Scholar] [CrossRef]
- Yang, X.H.; Li, Y.; Wei, Y.; Chen, Z.L.; Xie, P. Water Body Extraction from Sentinel-3 Image with Multiscale Spatiotemporal Super-Resolution Mapping. Water 2020, 12, 2605. [Google Scholar] [CrossRef]
- Zhang, B.; Li, J.S.; Wu, Y.H.; Zhang, F.F. Recent research progress on long time series and large scale optical remote sensing of inland water. Natl. Remote Sens. Bull. 2021, 25, 37–52. [Google Scholar] [CrossRef]
- Gong, P.; Mu, L. Error Detection through Consistency Checking. Ann. GIS 2000, 6, 188–193. [Google Scholar] [CrossRef] [Green Version]
- Hao, B.; Han, X.; Mingguo, M.; Shiwei, L. Research Progress on the Application of Google Earth Engine in Geoscience and Environmental Sciences. Remote Sens. Technol. Appl. 2018, 33, 600–611. [Google Scholar] [CrossRef]
- Deng, Y.; Jiang, W.G.; Tang, Z.H.; Ling, Z.Y.; Wu, Z.F. Long-Term Changes of Open-Surface Water Bodies in the Yangtze River Basin Based on the Google Earth Engine Cloud Platform. Remote Sens. 2019, 11, 2213. [Google Scholar] [CrossRef] [Green Version]
- Liu, Y.; Tian, T.; Zeng, P.; Zhang, X.-Y.; Che, Y. Surface water change characteristics of Taihu Lake from 1984–2018 based on Google Earth Engine. Ying Yong Sheng Tai Xue Bao = J. Appl. Ecol. 2020, 31, 3163–3172. [Google Scholar] [CrossRef]
Figure 1.
The diagram to illustrate the water extraction using the normalized differenced water index (NDWI) and threshold.
Figure 1.
The diagram to illustrate the water extraction using the normalized differenced water index (NDWI) and threshold.

Figure 2.
Water extraction results of several methods in the HuaiHe River Basin. (a) original image; (b) NDWI; (c) SVM; (d) CART; (e) Object-Oriented; (f) Deep Learning.
Figure 2.
Water extraction results of several methods in the HuaiHe River Basin. (a) original image; (b) NDWI; (c) SVM; (d) CART; (e) Object-Oriented; (f) Deep Learning.

Figure 3.
Water extraction results of several methods in Nam Co (a) original image; (b) NDWI; (c) SVM;(d) CART; (e) Object-Oriented; (f) Deep Learning.
Figure 3.
Water extraction results of several methods in Nam Co (a) original image; (b) NDWI; (c) SVM;(d) CART; (e) Object-Oriented; (f) Deep Learning.

Figure 4.
Superimposed comparison of different methods and NDWI water extraction results in some basins of Huai River. (a) SVM; (b) CART; (c) Object-Oriented; (d) Deep Learning (the water distribution obtained by the four methods of SVM, CART, object-oriented, and deep learning are superimposed with the NDWI extraction results. X represents the extraction result of the method used in this figure and N represents the extraction result of NDWI. The four pixel types will be generated: X water N water, X water N non-water, X non-water N water, and X non-water N non-water.).

Figure 5.
Superimposed comparison of different methods and NDWI water extraction results in Nam Co (a) SVM; (b) CART; (c) Object-Oriented; (d) Deep Learning.
Figure 5.
Superimposed comparison of different methods and NDWI water extraction results in Nam Co (a) SVM; (b) CART; (c) Object-Oriented; (d) Deep Learning.

Table 1.
Several typical water remote sensing products.
| Name | Time Span | Research Area | Spatial Resolution | References |
|---|---|---|---|---|
| Global Land 30-water | 2000, 2010 | Globe | 30 m | [20] |
| Global Surface Water Data | 1984–2015 | Globe | 30 m | [21] |
| ASTER Global Water Body Dataset | 2000–2013 | Globe | 30 m | [22] |
| Global surface water dynamics | 1999–2018 | Globe | 30 m | [23] |
| 500 m 8-day Water Classification Maps | 2000–2015 | Globe | 500 m | [24] |
| Global Lake/Reservoir Surface Inland Water Extent Mask Time Series | 1992–2018 | Globe | 500 m | [25] |
| Global Lakes Forel-Ule Index Dataset | 2000–2018 | Globe | 500 m | [26] |
| High Mountain Asia Glacial Lake Inventory database | 2008–2017 | Asia | 30 m | [27] |
| Inland Surface Water Dataset in China | 2000–2016 | China | 500 m | [28] |
| Open-surface Water Body Area in the contiguous United States | 1984–2016 | USA | 30 m | [29] |
Table 4.
Common kernel functions.
| Kernel Functions | Formula |
|---|---|
| Linear Kernel Function | |
| Polynomial Kernel Function | |
| Radial Basis Function | |
| Sigmoid Kernel Functions |
Table 5.
Evaluation of the accuracy of Nam Co water extraction results.
| Nam Co | NDWI | CART | SVM | Object- Oriented | Deep Learning |
|---|---|---|---|---|---|
| Overall Accuracy | 0.9951 | 0.9937 | 0.9963 | 0.9464 | 0.9878 |
| Kappa | 0.9898 | 0.9869 | 0.9924 | 0.8905 | 0.9746 |
Table 6.
Evaluation of the accuracy of Huaihe River Basin water extraction results.
| Huai River Basin | NDWI | CART | SVM | Object- Oriented | Deep Learning |
|---|---|---|---|---|---|
| Overall Accuracy | 0.9735 | 0.9788 | 0.9788 | 0.9788 | 0.9023 |
| Kappa | 0.9466 | 0.9576 | 0.9576 | 0.9576 | 0.8065 |
Publisher’s Note: MDPI stays neutral with regard to jurisdictional claims in published maps and institutional affiliations. |
© 2022 by the authors. Licensee MDPI, Basel, Switzerland. This article is an open access article distributed under the terms and conditions of the Creative Commons Attribution (CC BY) license (https://creativecommons.org/licenses/by/4.0/).
Share and Cite
MDPI and ACS Style
Li, J.; Ma, R.; Cao, Z.; Xue, K.; Xiong, J.; Hu, M.; Feng, X. Satellite Detection of Surface Water Extent: A Review of Methodology. Water 2022, 14, 1148. https://doi.org/10.3390/w14071148
AMA Style
Li J, Ma R, Cao Z, Xue K, Xiong J, Hu M, Feng X. Satellite Detection of Surface Water Extent: A Review of Methodology. Water. 2022; 14(7):1148. https://doi.org/10.3390/w14071148
Chicago/Turabian StyleLi, Jiaxin, Ronghua Ma, Zhigang Cao, Kun Xue, Junfeng Xiong, Minqi Hu, and Xuejiao Feng. 2022. "Satellite Detection of Surface Water Extent: A Review of Methodology" Water 14, no. 7: 1148. https://doi.org/10.3390/w14071148
Note that from the first issue of 2016, this journal uses article numbers instead of page numbers. See further details here.