
The Water Footprint of Biodiesel Produced from Sunflower in South Africa


Department of Agricultural Economics, University of the Free State, Bloemfontein 9301, South Africa
*
Author to whom correspondence should be addressed.
Water 2022, 14(7), 1141; https://doi.org/10.3390/w14071141
Submission received: 28 January 2022
/
Revised: 22 March 2022
/
Accepted: 25 March 2022
/
Published: 1 April 2022
(This article belongs to the Section Water Resources Management, Policy and Governance)
Abstract
:The use of feedstock crops for the production of biodiesel suggests that biodiesel production may have a major impact on the scarce freshwater resource in South Africa. This paper aimed to assess the green plus blue water footprints (WFgreen+blue) of biodiesel produced from sunflower in South Africa using the Global Water Footprint Standard approach. The green (WFgreen) and blue water footprint (WFblue) at the farm level were assessed for sunflower grown under the rain-fed and irrigation production system respectively. The results show that 2617 m3 and 2477 m3 are required to produce 1 ton of rain-fed and irrigated sunflower respectively. At the processing level, about 7.12 L of blue water is required to produce 1 L of biodiesel from sunflower. The WFblue at the processing stage of biodiesel produced from irrigated sunflower was 1.01 m3/GJ, compared to 1.15 m3 m3/GJ from rain-fed sunflower. The WFgreen+blue of biodiesel produced from irrigated and rainfed sunflower was 2477 and 2617 m3/ton, respectively. WFgreen was the largest, accounting for about 59% and 99% for biodiesel produced from irrigated and rain-fed sunflower, respectively. It was further found that water consumption at the farm level accounted for about 99% of the WFgreen+blue of biodiesel in both production systems. Management practices that improve water use efficiency at the farm level may help to lower the WFgreen+blue of biodiesel. Interestingly, the WFgreen+blue is lower for biodiesel produced from irrigated sunflower than for rainfed sunflower. The blue water scarcity assessment showed that blue water scarcity is low during the period when sunflower requires water. As such, purely from a water use perspective, irrigated sunflower production in the Orange Riet Irrigation Scheme may be considered sustainable.
1. Introduction
Water is an invaluable resource that is required for all life forms, and it is necessary for civilization. However, water is a globally scarce resource, and it is estimated that humanity will at some point struggle to attain adequate water to sustain their needs [1,2,3]. Therefore, it is necessary to assess and detail the water footprints in all sectors of the economy. Water footprint assessment has in recent years been recognized as a significant sustainability indicator within the agricultural and biofuels sector [4,5]. The water footprint concept takes cognisance of the total volume of freshwater consumed in the production of a product, and it is measured throughout the entire value chain right from the stage of producing the inputs until the final product reaches the consumer [6,7,8]. Aldaya, Chapagain, Hoekstra, and Mekonnen [8] categorize water footprint measured along the entire value chain into blue, green, and grey. The blue water footprint is the surface and groundwater consumed along the value chain, including the water that was evaporated and water that was incorporated into the product. The green water footprint refers to all the rainwater that is consumed by the crop, excluding water that becomes run-off. The grey component of water footprints is the volume of freshwater required to assimilate pollutants to accepted quality standards. The water footprint concept is elaborated in the Water footprint Assessment Manual described by Aldaya, Chapagain, Hoekstra, and Mekonnen [8]. Water footprint assessment has gained prominent attention in the agricultural and biofuel sectors (more significantly first-generation biofuels) because the majority of the global water resources are used within the agricultural sector; therefore, sustaining current agricultural conditions and exploring further activities such as biofuel production within the agricultural sector requires adequate approaches for the sustainable use of the limited water resources [5,9]. Biodiesel is a form of biofuel produced from oil crops such as sunflower, amongst others, and its production process and the respective amounts of water used in the biodiesel production process have been evaluated worldwide. For instance, various assessments have been conducted in Italy, Greece Argentina, the USA, and South Africa looking into the viability of sunflower as a biodiesel feedstock with several comparisons to other oil crops such as algae, canola, and soy beans [9,10,11]. Water footprint assessments have been conducted in various parts of the world such as Tuscany, Spain, South Africa, etc., to estimate the volumes of water that are used to grow sunflower as a feedstock and volumes of water used throughout the entire sunflower-biodiesel production process [2,5,10,12]. Furthermore, the sustainability of feedstock production has been observed worldwide [5,8]. There is a plethora of information related to biodiesel production from various feedstock crops worldwide. However, in South Africa, this body of information is typically focused on the water requirements of the crops, usually fixated on crop irrigation and the volumes of water required to optimize yield, without much consideration of consumptive water use throughout the entire production process and green water stress. Even though Mekonnen and Hoekstra [13] estimated the water footprint of biodiesel produced in South Africa, this was mainly based on global average data, whilst the water footprint assessments of biodiesel production performed by Pahlow, Snowball, and Fraser [5] for South Africa, were based upon data ranging from 1996 to 2005 derived from Mekonnen and Hoekstra [13]. There have not been any recent assessments of the water footprint of biodiesel in the country. Therefore, little information is available to help inform and guide policymakers in formulating policies for sustainable water use and management in the process of producing biodiesel from feedstock crops in the current era. South Africa is a water-scarce country, ranked as the 30th driest country in the world. It has 22 water source areas that are primarily fed by rainfall. However, about 60% of the national river ecosystems are threatened, whilst approximately 23% are critically endangered and only about 16% of the water sources are protected as nature reserves or parks [14]. It is therefore important to monitor, restore, maintain, and manage water resources to secure and sustain the available water supplies and to protect these water sources. Furthermore, the majority of these scarce water resources are used within the agricultural sector, which consumes about 60%, whilst contributing about 2% to the national GDP [15]. In addition, embarking on further agricultural activities to incorporate biodiesel production requires an agricultural feedstock crop that does not impose any further adverse effects on water resources.
Due to its low water use characteristics and high tolerance to drought conditions, the sunflower crop has been endorsed as a biodiesel feedstock crop in South Africa [16,17]. Furthermore, sunflower is largely available nationally, and it constitutes about 70% of the national oilseeds [18]. Additionally, fossil fuel prices are rapidly increasing, and for South Africa, this poses a socio-economic threat for the population at large, and this instigates for the nation to delve into the production and use of alternative fuels such as biodiesel. Thus considering that sunflower can be produced across almost all provinces of South Africa and at adequate volumes, it is therefore important to provide ample attention on the production of sunflower as a biodiesel feedstock, more significantly in line with its water use throughout the entire biodiesel value chain. So as to attain a better understanding of the potential effects and the impact of sustainable productivity on water resources and potential paths for the efficient use of water resources in the production of biodiesel from sunflower. Therefore, this current paper embarks on assessing the water footprint of producing biodiesel from sunflower grown under rain-fed and irrigated production systems in South Africa. The irrigation system provides supplementary irrigation to meet the rainfall shortfall of the crop water requirement. In addition, the impact of sunflower feedstock on local water stress and sustainability at the local river basin was also assessed.
2. Methodology
2.1. Study Location
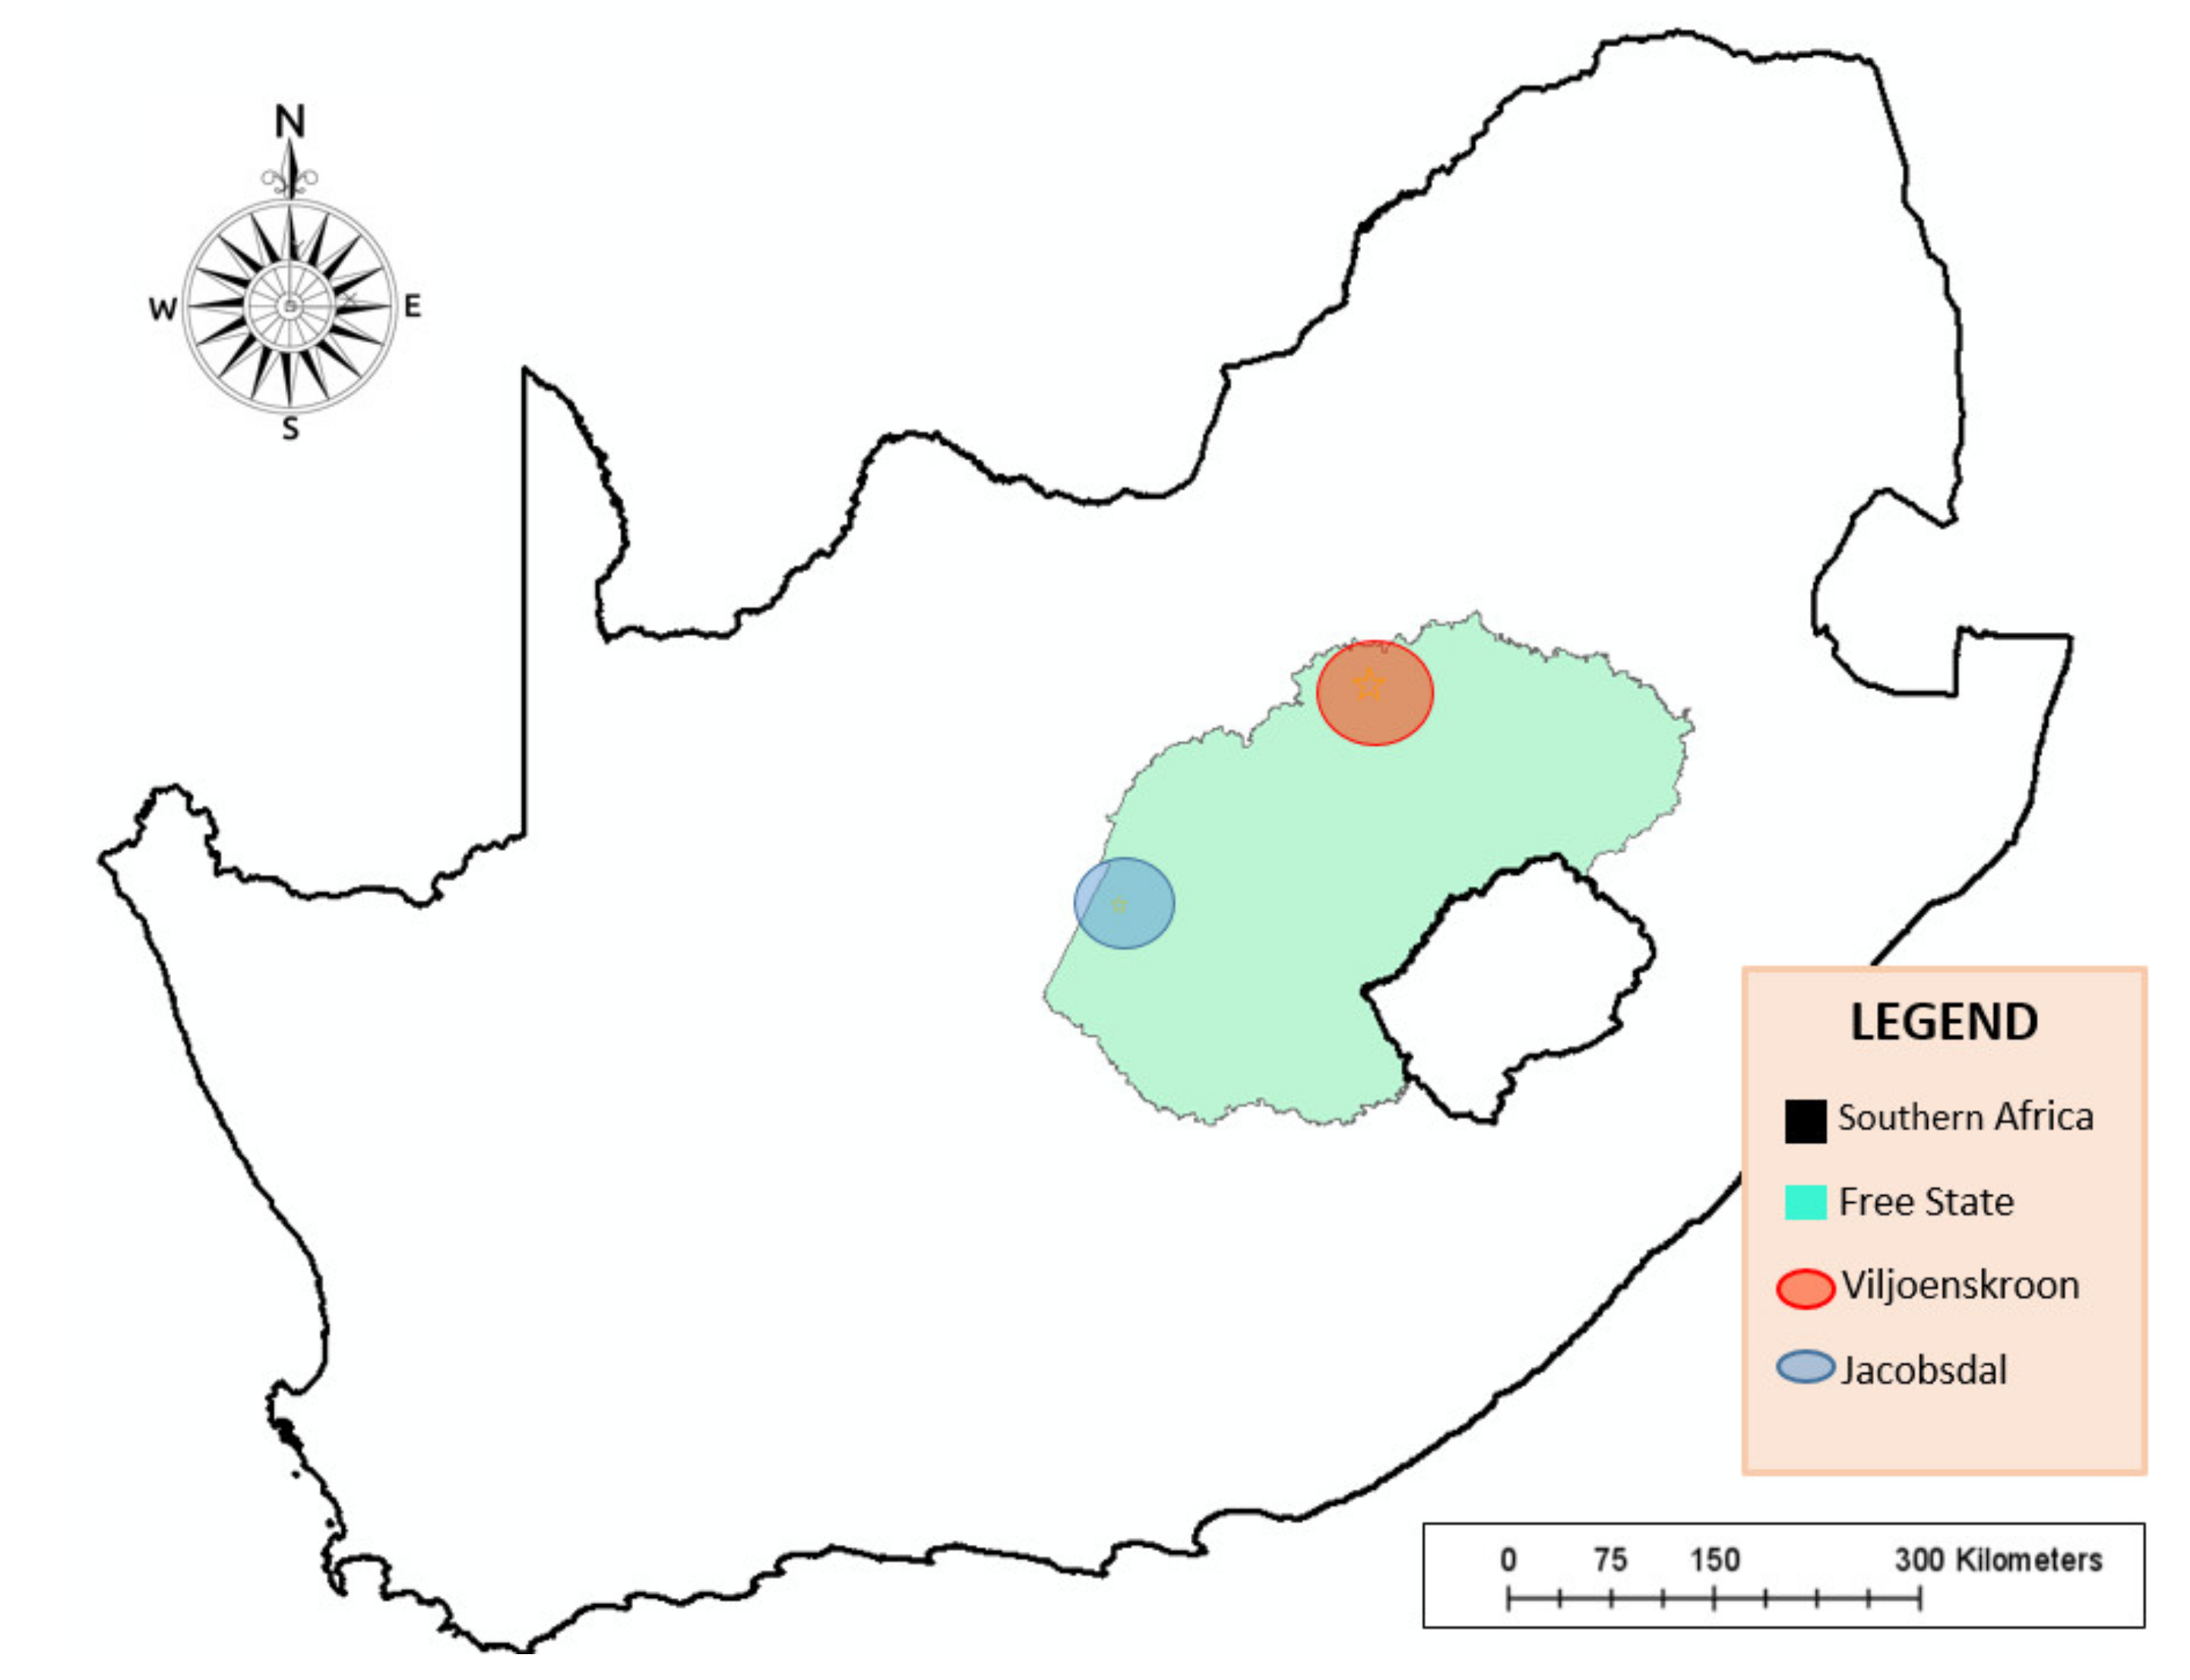
This paper considered rain-fed and irrigation production systems for the water footprint assessment of the feedstock crop growth at the farm level, of which Sunflower was the biodiesel feedstock crop of interest. The Viljoenskroon town and Orange Riet Irrigation Scheme were identified as the areas of study for rain-fed and irrigated sunflower, respectively. Both areas are in the Free State province of South Africa. The Free State province is the third largest province in South Africa, and it is dominated by agricultural activities. It contributes significantly to the agricultural economy of the nation, mainly producing maize and sunflower, being the largest producer of sunflower in South Africa [17,18]. Agriculture in this province is mainly rain fed, with less than 10% of the arable land being under irrigation [19]. The province receives an average of approximately 600 mm rainfall annually, of which 70% is received from September to April, with the average temperature ranging between 8.3–22.7 °C [20].
For rain-fed sunflower, the research was conducted at the Huntersvlei farm in Viljoenskroon. The Huntersvlei farm that was used as a case study was selected because it is one of the main sunflower-producing farms in the province and has been farming for over 100 years. Moreover, the data against which the WF assessment can be conducted, were available. The Orange Riet Irrigation Scheme used as the study location for irrigated sunflower sources its water from the Orange River and the Riet River. Figure 1 is a map showing the location of the study area in the Free State Province of South Africa. The Orange Riet Irrigation Scheme is represented by Jacobsdal in Figure 1. Jacobsdal is a town nearest to the irrigation scheme.
2.2. Biodiesel Production Cycle
Biodiesel is a renewable fuel that is produced from animal fats or vegetable oils through the transesterification of free fatty acids/glycerides in the presence of a catalyst to form Fatty acid methyl esters (FAME) [21,22,23]. Generally, the vegetable oil used is attained from crops that are grown as feedstock crops such as the sunflower crop in this current study. Wherein, the sunflower oil (crude sunflower oil) is physically or chemically extracted from the sunflower seeds, and this crude sunflower oil is reacted with an alcohol such as anhydrous methanol and a catalyst such as fatty acid methyl ester in a chemical reaction process referred to as transesterification [23,24,25]. Following this, a separation and purification process occurs, wherein glycerol (which is a by-product of biodiesel production) is separated from the reaction mixture, and alcohol is recovered through distillation, any glycerol, free fatty acids, and remaining catalysts are removed from the ester (it is important to note that the glycerol by-product was not processed any further in the simulation of this current study, and therefore no water usage was evaluated for this by-product) and then the remaining ester is washed with clean water (for this study, this was the water assessed in the processing stage) then dried and ultimately, purified biodiesel is obtained [25,26,27].
2.3. Water Footprint Estimation
2.3.1. Farm Level
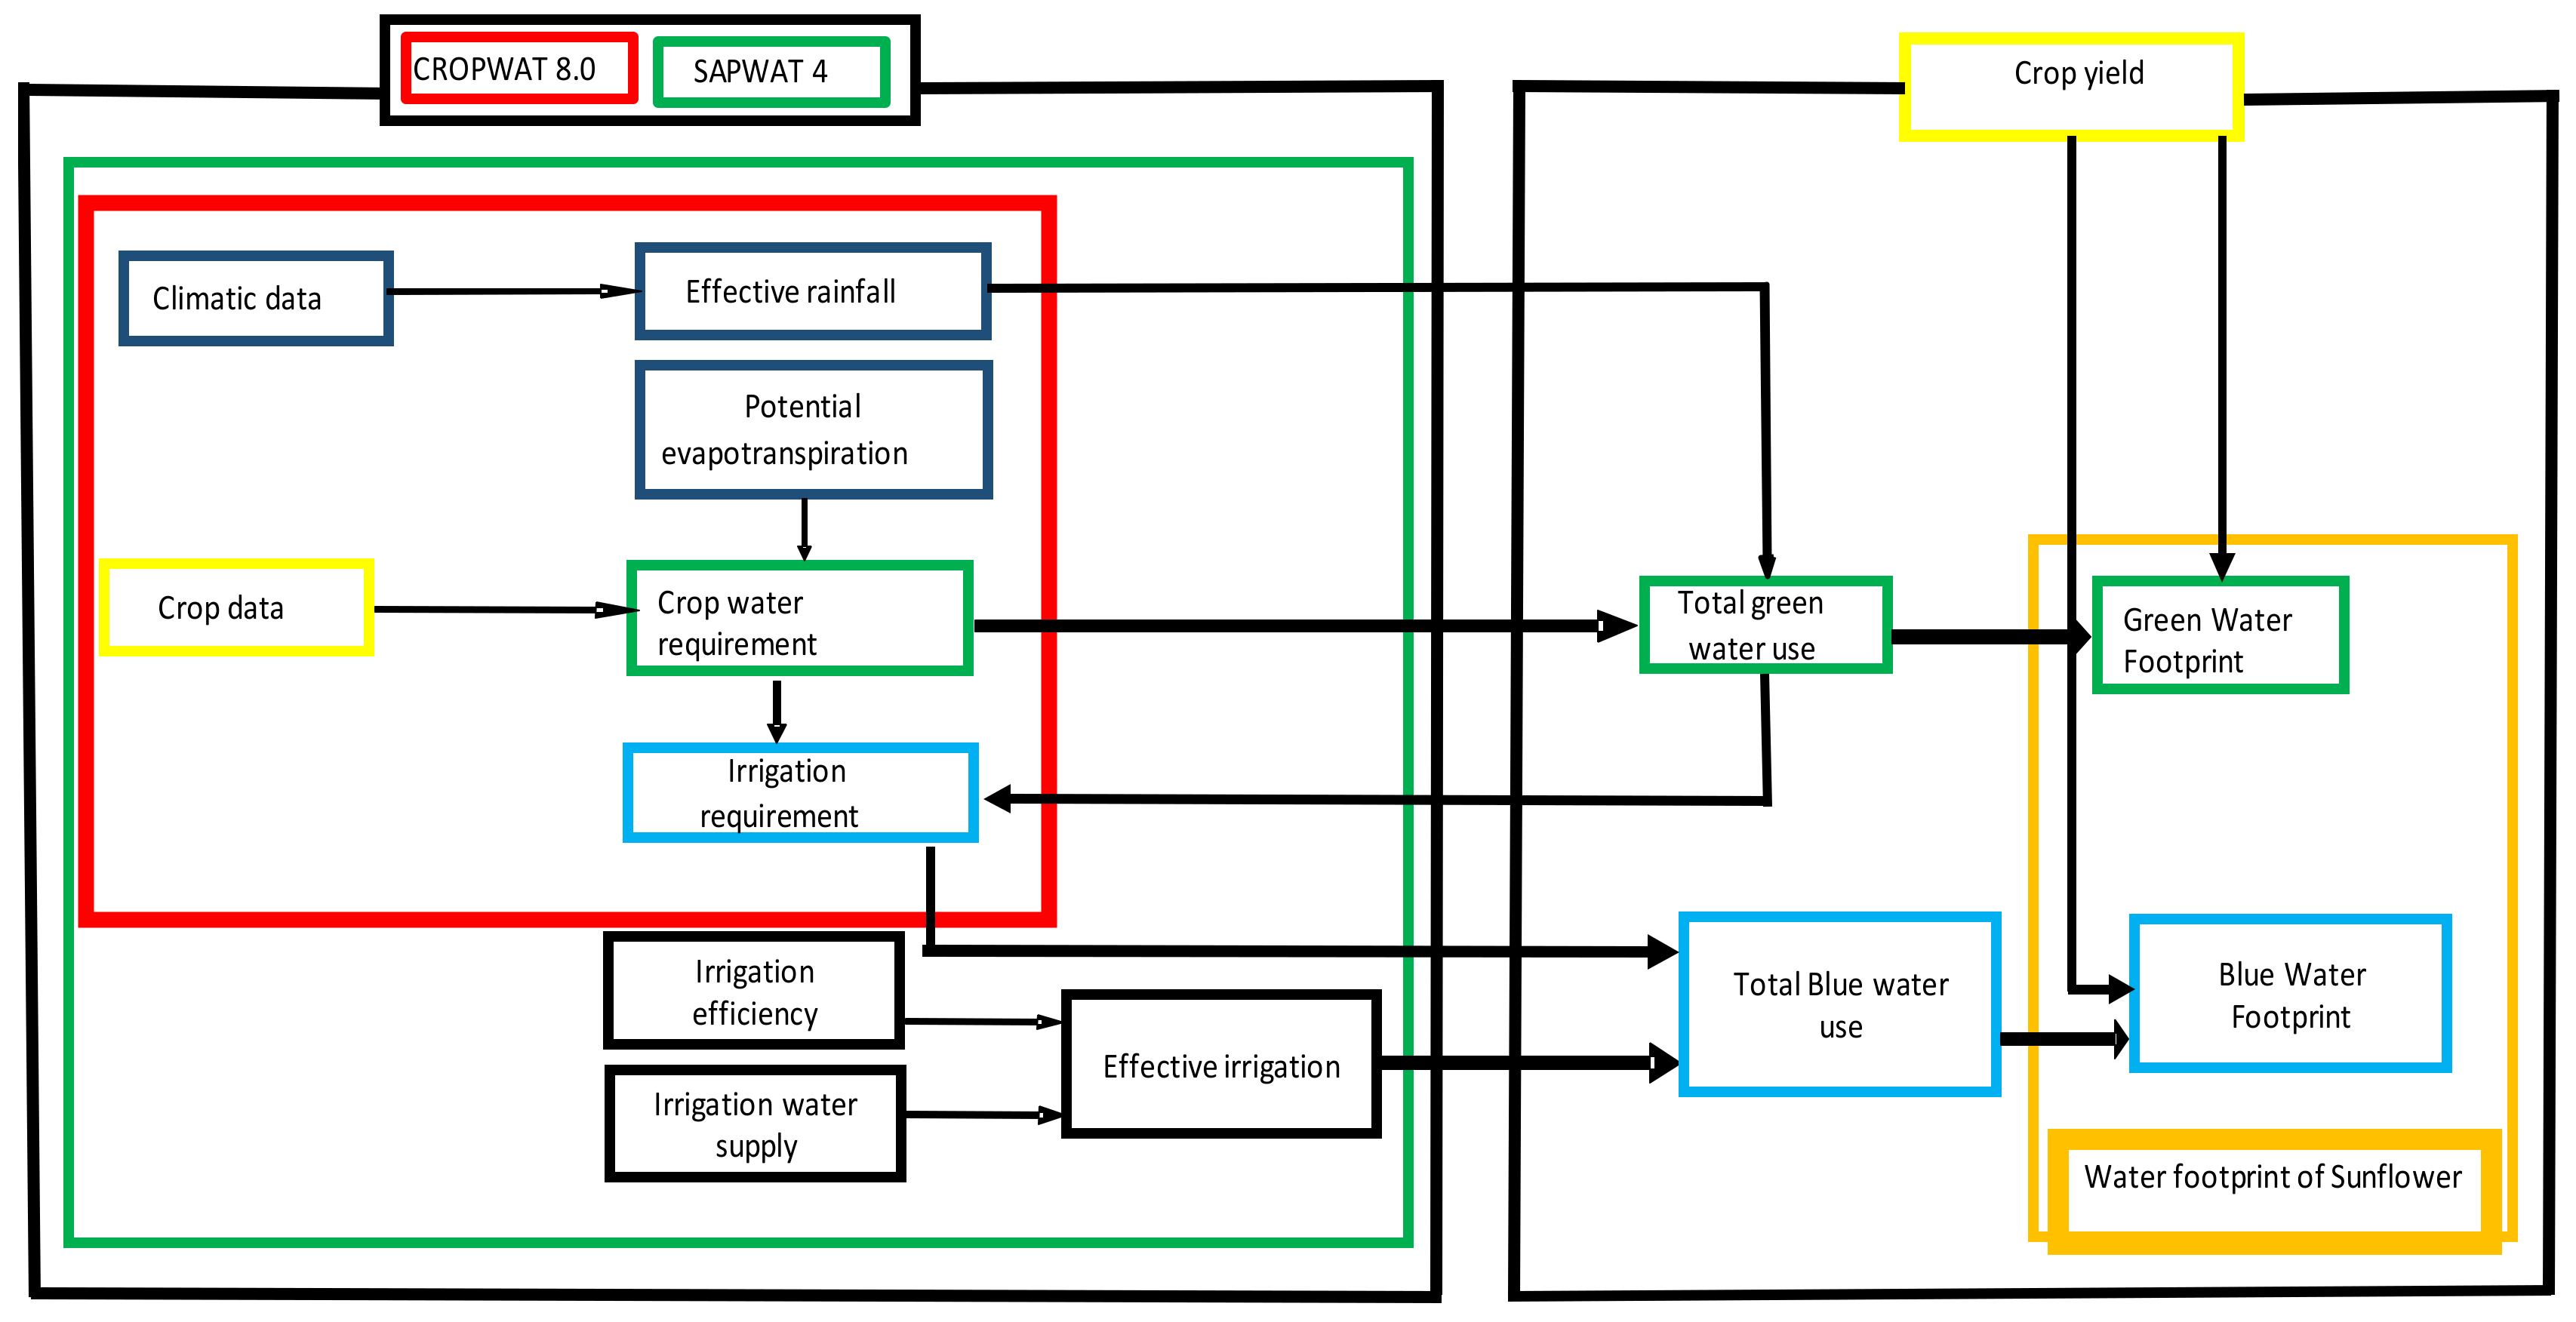
The global water footprint standard approach by Aldaya, Chapagain, Hoekstra, and Mekonnen [8] was used to assess the water footprints of rain-fed and irrigated sunflower feedstock in this current study. The step-by-step method followed to estimate the crop evapotranspiration (ETcrop) into the blue and green water footprint in this current study is depicted in Figure 2 and detailed below:
- Calculate the evapotranspiration for sunflower grown under each production system (rain-fed and irrigated)
- Calculating the effective rainfall for both rain-fed and irrigated sunflower and the effective irrigation for irrigated sunflower only
- Calculate the green crop water use for both rain-fed and irrigated sunflower and the blue crop water use for the irrigated sunflower only
- For rain-fed sunflower, if ET is greater than the effective rainfall, then CWU = ET
Calculate the green water footprint of rain-fed and irrigated sunflower and the blue water footprint of irrigated sunflower only.
Using Hoekstra’s method, only the green water footprint (WFgreen) and blue water footprint (WFblue) were considered in this study, wherein, to evaluate the green and blue water footprint, the crop (sunflower) evapotranspiration (ET) was estimated from the crop coefficient (Kc), reference crop evapotranspiration (ETo) and the water stress coefficient (Ks). The attained ET was used to determine the crop water use (CWU), wherein, the ET and CWU were calculated using Equations (1) and (2) below:
Evapotranspiration is a combination of the water lost from the surface through evaporation and from the crop by transpiration, and the ETcrop represents the crop evapotranspiration, ET0 represents the reference Penman-Monteith crop evapotranspiration, and the Ks indicated the soil water stress in which a Ks < 1 indicates soil water limiting condition; and Ks = 1 when there is no soil water stress [2,28]. Equation (2) shows the general formula for estimating the crop water use in which the green crop water use (CWUgreen) and blue crop water footprint (CWUblue) are estimated to obtain the corresponding water footprint, i.e., green water footprint (WFgreen) and blue water footprint (WFblue), respectively. The CWU is multiplied by a factor of 10 to convert the water depth in millimetres into volume of water per land surface (m3/ha). The summation of the reference crop evapotranspiration is carried out throughout the crop growth period from day of planting to day of harvest, which is represented by lgp (length of growing period). It follows that the water footprints are calculated by dividing the respective CWU with the crop yield attained, using the equations below:
2.3.2. Processing Level
At the processing level, the sunflower oil is extracted from the sunflower seeds and used to produce biodiesel through the transesterification process, which is a chemical process in which the oil is reacted with an alcohol which results in an alkyl ester of the fatty acid [28,29]. To assess the water footprint at the processing level, the method by Velázquez Martí [30] coupled with the formulae by Gerbens, Hoekstra, and Van der Meer [2] were used. The water footprint of biodiesel produced from sunflower (m3/GJ) was calculated by dividing the water footprint of the crop yield (m3/ton) (from each production system separately) by the biodiesel yield (GJ/ton), and this was calculated using the formulae below:
where wublue is the volume of blue water used for conversion (m3) and calculated using the equation:
is the amounts of blue water used each process step of the entire conversion process. Only the blue water used is calculated as there is no green water used in the processing level. The attained conversion water footprint (WFconversion) is divided by the amount of biodiesel energy to obtain the water footprint of biodiesel. This is evaluated using the equation below:
The water footprint of biodiesel is therefore calculated as:
= the amount of energy obtained/extracted from the sunflower feedstock. The amount of energy (obtained is calculated using the formula by Gerbens, Hoekstra, and Van der Meer [2] which indicates:
where:
2.3.3. Total Water Footprint of Biodiesel
The blue and green water footprints were calculated for sunflower growth at the farm level for each production system and the water footprints at the processing level were added up for each respective production system to provide the total water footprint of biodiesel produced from irrigated and rain-fed sunflower (separately).
2.4. Water Scarcity in the Sunflower Production Areas
Comparisons of water footprints of biodiesel produced from a feedstock crop grown from different production systems alone do not portray the actual burden of water use; the water scarcity levels also need to be taken into account. To reveal the competitive pressure of biodiesel production on the water resource, this study assessed the blue water scarcity in the production area. Blue water scarcity is expressed as a water scarcity index, which is the ratio of the total blue water footprint (agriculture, domestic plus industrial) to the blue water availability in the river basin under consideration. The blue water availability in a catchment at a particular time is the difference between the natural run-off in the catchment and the environmental flow requirement [9]. The environmental flow requirement (EFR) indicates the volume and timing of water flows required to maintain freshwater ecosystems and human livelihood [6] and is assumed at 80% of natural runoff. A WS bigger than 100% implies that water use is such that there is not sufficient water left to meet the EFR.
Aldaya, Chapagain, Hoekstra, and Mekonnen [8] list four different levels of water scarcity based on the WS. Water scarcity is considered low if WS is smaller than 100%. A WS between 100% and 150% implies moderate water scarcity, while a WS between 150% and 200% implies significant water scarcity. Water scarcity is considered severe if the WS is bigger than 200%. Thus, purely from a water use perspective, the blue water used in biodiesel production would be rendered unsustainable if the blue water footprint exceeds the blue water availability in the catchment [31,32], or if the WS is bigger than 100%.
2.5. Data
The data used in this paper consist of both primary and secondary data. At the farm level, data pertaining to the cultivated area, soil type and crop yields were obtained, wherein, the data associated with rain-fed sunflower growth was collected through a questionnaire with a sunflower farm manager for the 2019 production year. Data on irrigated sunflower production were taken from the Orange Riet Irrigation Scheme database. The sunflower growth period/season observed was the November to April period. Detailed information pertaining to water use at the processing level was taken from the relevant literature [33,34,35], and for the sustainability assessment, secondary data pertaining to water availability in the Orange River Basin were taken from [36] who reported water footprints and runoff for the major river basins.
The SAPWAT4 and CROWAT 8.0 models were used to reinforce the data obtained for irrigated and rain-fed sunflower, respectively [4,30]. Meteorological data were obtained from the nearest and best representative weather station in the Free State as extracted from CLIMWAT 2.0 and incorporated into the SAPWAT4 and CROPWAT 8.0 models [37]. SAPWAT is an irrigation planning and water management aid tool that is supported by an extensive climate and crop database of South Africa. It was developed based on CROPWAT and is used to evaluate irrigation water requirements for crops. Since its inception, SAPWAT is now extensively applied in South Africa, and it has been accepted nationally as the model for use in the calculations of irrigation requirements for the purposes of registration and licensing of water use rights by the South African Department of Water Affairs and Forestry [38]. CROPWAT is a tool globally used for the calculation of crop water requirements and irrigation requirements based on soil, climate and crop data and it is also used to evaluate farmers’ irrigation practices and to estimate crop performance under both rain-fed and irrigated conditions [37,39]. Both the SAPWAT and CROPWAT models are not crop growth models and they do not provide real-time scheduling advice; however, they both assist in procedures for making decisions regarding the estimation of crop water requirements [4]. The CROPWAT and SAPWAT models both have a no irrigation option for simulation of rain-fed crops; however, this option is not recommended for use on the SAPWAT model, as it was not designed for this purpose and the accuracy of the rain-fed crops function was not adequately tested [3]. On the contrary, the rain-fed option on the CROPWAT model has been vigorously tested and is widely used worldwide [39,40,41]. Both the CROPWAT and SAPWAT models were used in this study due to that (i) both irrigated and rain-fed sunflower were assessed in this study and that (ii) SAPWAT is based on national climate and crop database, with a reinforced and widely tested irrigated crop modelling option; and (iii) the CROPWAT’s rain-fed option is supported and globally utilised.
3. Results and Discussion
3.1. Water Usage in Sunflower Production (Farm Level)
The sunflower water footprint calculations in this study were based on two different production systems for sunflower production, i.e., irrigated production and rainfed. For the irrigated production system, supplementary irrigation is applied to meet rainfall shortfall in crop water requirement. The November and December planting date was considered for irrigated and rain-fed sunflower, respectively. The irrigated sunflower growth stage was about 144 days long and the rain-fed sunflower was approximately 130 days long. In each sunflower growth stage, the sunflower water use was found to have varied distinctively across all stages. Table 1 shows that the initial growth stage for irrigated and rain-fed sunflower occurred for about 27 days and 25 days, consuming about 62 mm and 59 mm of water, respectively.
Most of the water used in this stage was required to retain soil moisture to enable proper seed germination and the low levels of water used are attributed to the small size of the sunflower crop at this stage. As the sunflowers developed, their water use increased accordingly, and it was found that irrigated sunflower used about 183 mm, whilst the rain-fed sunflower utilized about 161 mm of water throughout, for 39 days and 35 days, respectively. A maximum level of water use was observed for both irrigated and rain-fed sunflower at the mid-stage with optimal consumption of 277 mm and 203 mm, respectively. This stage was about 50 days for irrigated sunflower and 45 days long for rain-fed sunflower. At the end stage, the least amounts of water were consumed at 60 mm and 48 mm for irrigated and rain-fed sunflower, respectively. At this stage, the sunflowers matured fully, harvesting occurred, and this stage was about 28 and 25 days. This implies that irrigation and longer growth periods have an influence on evapotranspiration (ETc) of sunflower, because the irrigated sunflower had a longer growing season at 14 more days as compared to the 130 days for rain-fed sunflower, and the resulting ETc for irrigated sunflower was found to be 110 mm higher than the relative rain-fed sunflower ETc of 471 mm. The findings of this study concur with that of Hoekstra and Mekonnen [42] who analysed the influence of irrigation on the evapotranspiration of sunflower in Bulgaria and that of Amigun and Von Blottnitz [43] who quantified the consumptive water use and crop coefficients of irrigated sunflower during two growing seasons in Central Spain. Wherein, it was observed in both the referred studies (similarly to this current study) that irrigated sunflower with longer growing periods as compared to rain-fed sunflower resulted in a higher ETc value.
Table 2 exhibits the overall water use of both the rain-fed and irrigated sunflower feedstock. The results indicate that the sunflower grown under irrigation had a crop evapotranspiration of (ET) of 581 mm, effective rainfall (ER) of 325 mm, and effective irrigation (EI) of 220 mm. The rain-fed sunflower had a crop evapotranspiration (ET) of 471 mm, and effective rainfall (ER) of 336 mm.
The results indicate that irrigated sunflower has a higher level of water use, at about an overall 545 mm as compared to 336 mm of rain-fed sunflower, and this variation can be attributed to that irrigated sunflower uses both blue and green water whilst rain-fed sunflower uses green water only. This implies that there is a large variation in water use for similar crops, and this depends on the agricultural production system used and the climatic conditions of the production area. Furthermore, the ET of rain-fed sunflower was found to be higher than the ER, and therefore, the resulting CWU was found to be 4710 m3/ha, with a yield of 1.8 ton/ha and this resulted in a green water footprint of about 2617 m3/ton, with no blue water footprint as no blue water is used for rain-fed sunflower. Irrigated sunflower was found to have a 2.2 ton/ha yield, with a blue crop water use and green crop water use of approximately 2200 m3/ha and 3250 m3/ha, respectively. Yielding a total water footprint of 2477 m3/ton. This indicates that higher sunflower yields are obtainable under irrigation, and even though both green and blue water are used in the irrigation production system, the resulting WFgreen+blue is lower than that of sunflower grown under the rain-fed production system, and this can be attributed to the higher yield levels. In addition, a large volume of green water was found to be used for irrigated sunflower, accounting for about 60% of the overall water footprint of growing sunflower under irrigation. This indicates that sunflower growth is largely dependent on green water and then followed by blue water.
3.2. Water Use and Water Footprint at Processing Level
Table 3 shows the amount of biodiesel attainable per unit of sunflower feedstock, and it was found that t about 213 litres of biodiesel can be obtained per ton of sunflower. This was estimated from an 85% dry mass fraction, 0.22 g of fat per gram of sunflower dry mass, 1 g of biodiesel per gram of fat, an HHV of 7.05 kJ per ton, with a density of 0.88 kg per litre. For a 200 ha farm size of this current study, this yields about 76,690 L and 93,720 L of biodiesel produced from rain-fed and irrigated sunflower, respectively. The large volume of biodiesel attained from irrigated sunflower was due to the higher sunflower yields obtained under irrigation.
Table 4 and Table 5 present the water footprint of converting sunflower into biodiesel. The results show that regardless of the sunflower production system, about 0.00712 m3 (7.12 L) of blue water is required to produce 1 L of biodiesel. A volume of about 667 m3 water was used to convert irrigated sunflower into biodiesel as compared to about 546 m3 of water used to convert rain-fed sunflower into biodiesel. However, the resulting water footprint per ton of biodiesel produced was found to be relatively lower for biodiesel produced from irrigated sunflower at about 7.1 m3/ton, which translated to a total water footprint of approximately 1.01 m3/GJ. Whilst, biodiesel converted from rain-fed sunflower was estimated to use about 8.09 m3 of water per ton of biodiesel, which is about 1.15 m3 of water per GJ of biodiesel. Even though biodiesel produced from irrigated sunflower had a larger total water footprint, the resulting water footprint per unit of biodiesel was relatively lower and this stemmed from the higher volume of biodiesel obtained from irrigated sunflower. This implies that higher feedstock yields result in higher biodiesel products, and even though the feedstock uses larger volumes of water the resulting unit water footprint is relatively low.
3.3. Total Water Footprint of Biodiesel (Sunflower to Biodiesel Value Chain)
The total water footprint throughout the entire sunflower to biodiesel value chain is presented in Table 6. The results show that about 2625 m3/ton is needed to produce one ton of biodiesel under the rain-fed production system, whilst about 2484 m3/ton of water was required to produce one ton of biodiesel under the irrigation production system. This reveals that about 3% more water was used to produce biodiesel from rain-fed sunflower. The resulting lower water footprint per ton of biodiesel produced from irrigated sunflower stems from the higher volume of biodiesel produced due to the larger yield of sunflower obtained under the irrigation production system. This concurs with the previous findings by Gerbens, Hoekstra, and Van der Meer [2] who found that there was a large variation in water footprints of similar crops. Furthermore, the water footprint at the farm level (under each production system) accounted for about 99% of the total water footprint in the entire value chain. This provides support for the findings of Huang, Wang, Xie and Zhang [44] who found that a larger volume of water was consumed for biofuel feedstock growth.
While the relatively lower WFgreen+blue for the irrigated scenario, compared to the rainfed scenario, may lead to a conclusion that one should rather use irrigated sunflower in the production of the biodiesel, it is noted that the impact of blue water on the environment is bigger than what is the case with green water. An assessment of the water scarcity situation in the production area, where water use is interpreted in the context of water availability, will allow for more accurate and better-informed recommendations. The results from the blue water scarcity assessment in the production area are presented and discussed next.
3.4. Blue Water Scarcity Assessment
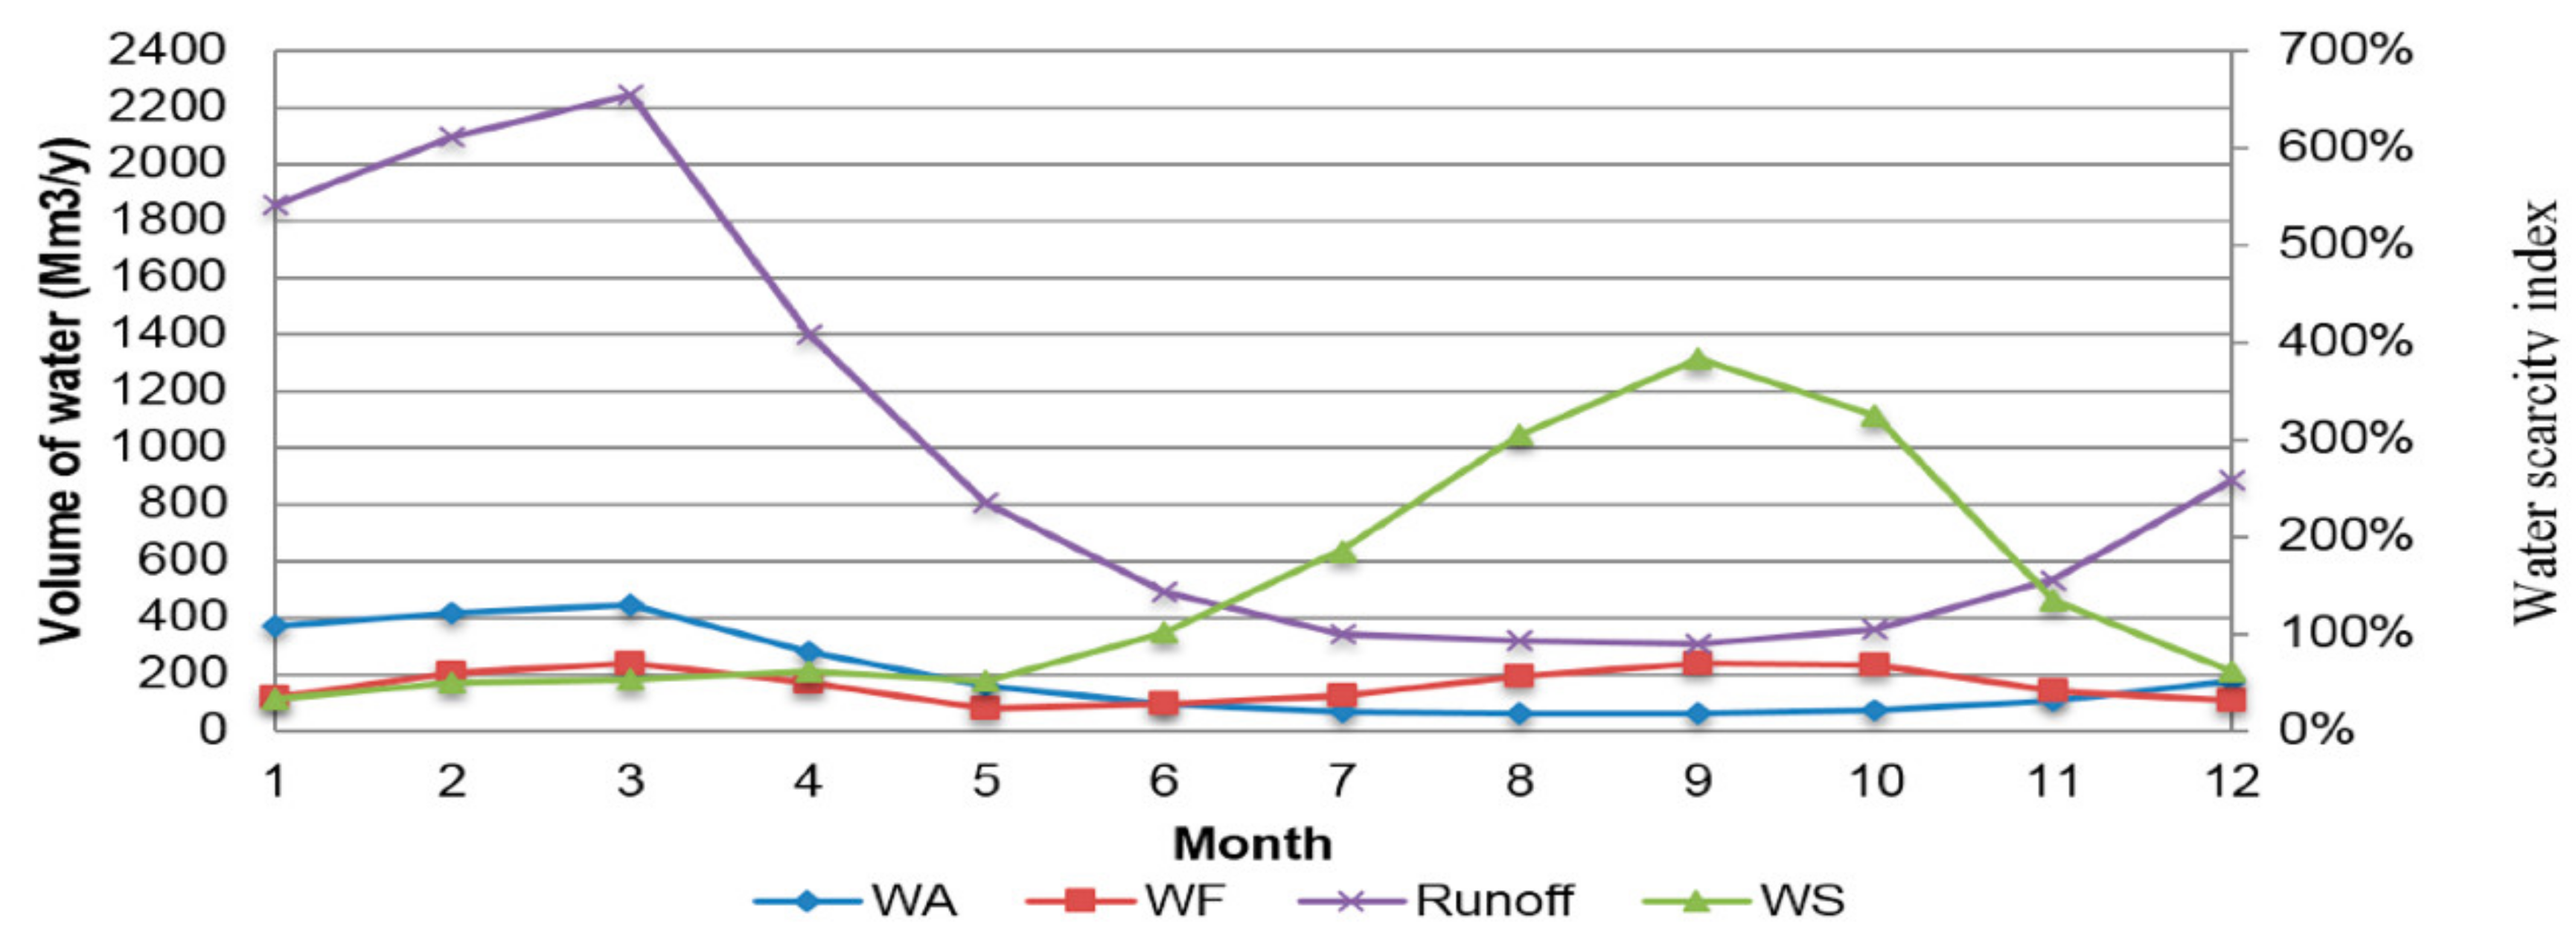
The results from the blue water scarcity assessment in the Orange River Basin are presented in Figure 3. A blue water scarcity index (WS) was calculated for the different months of the year, starting with January (#1), and ending with December (#12). WS is the ratio of WF (the total volume of water that was consumed in the basin through all of the different uses of blue water) to WA (water availability that was calculated as 20% of the natural runoff).
Figure 3 shows that the Orange River Basin does experience severe blue water scarcity for about 3 months in a year, from August to October. On the contrary, the blue water scarcity is low in the months of January, February, March, April, and then again in December. A low blue water scarcity implies that sufficient water is available to meet the demand for water from agricultural, domestic and industrial water users, as well as the water that is needed to meet the environmental flow requirement. The growing period of irrigated sunflower is December to April/May in the Orange Riet Irrigation Scheme, thus it corresponds with the period when water scarcity is low. Purely from a water use perspective, the production of irrigated sunflower in the Orange Riet Irrigation Scheme may be considered sustainable since the EFR is still met after all of the other water users used the water they require.
4. Conclusions
This present study assessed the WFgreen+blue of producing biodiesel using sunflower grown under rain-fed and irrigation production systems in South Africa. In order to make more sense of the calculated water footprints, the blue water scarcity in the Orange River Basin was also assessed. The blue water scarcity assessment provided insight into the water availability during the period when sunflowers require water. The study employed the Global Water Footprint Standard approach described in the Water footprint assessment manual to calculate the WFgreen+blue. The findings showed that the water consumption was the largest at the farm level, accounting for about 99% of the total WFgreen+blue throughout the entire sunflower to biodiesel value chain. Initiatives to decrease the water footprint of biodiesel produced from sunflower will be well advised to focus on water use at the farm level. Management practices that improve the water use efficiency of sunflowers may contribute towards decreasing the water footprint of biodiesel produced from sunflowers.
Irrigated sunflower consumed more water, but also obtained a larger yield, as compared to rain-fed sunflower. The larger yield resulted in the WFgreen+blue being smaller for irrigated sunflower than for rainfed sunflower. While the smaller WFgreen+blue of irrigated sunflower may have led to the conclusion that it may be better, from a water use perspective, to use irrigated sunflower for the production of biodiesel, it was noted that blue water has a bigger impact on the environment than green water. The blue water scarcity assessment showed that the Orange River Basin experience severe water scarcity in 3 out of 12 months (August, September, and October) in a year. The growing period of sunflower, however, corresponds with the period of low water scarcity in the Orange River Basin. As such, sufficient blue water is available to meet the requirements of all of the different users, as well as the environmental flow requirement. Purely, from a water use perspective, growing sunflower under irrigated conditions in the Orange River Basin may be considered sustainable. It is noted, though, that judging sunflower production as to be sustainable is much more complex. Further research is needed to conduct a comprehensive assessment of the sustainability of using irrigated and rain-fed sunflower for the production of biodiesel. It is recommended that such research should also use local data, rather than data from global studies, to ensure that the results and subsequent recommendations are based on accurate, local and context-specific data.
It is noted that biodiesel production from sunflower can also be expected to have a grey water footprint because of fertiliser use at the farm level and other pollution that happens in the processing of biodiesel. Further research is necessary to also include a grey water footprint to obtain a more complete indication of the water footprint of producing biodiesel from sunflower.
Author Contributions
Conceptualization, H.J. and K.N.; methodology, H.J. and K.N.; formal analysis, K.N.; investigation, H.J. and K.N.; resources, H.J.; writing—original draft preparation, K.N.; writing—review and editing, H.J.; supervision, H.J.; project administration, H.J.; funding acquisition, H.J. All authors have read and agreed to the published version of the manuscript.
Funding
This research project was initiated, managed and funded by the Water Research Commission through Project K5//2553//4.
Institutional Review Board Statement
Not applicable.
Informed Consent Statement
Not applicable.
Data Availability Statement
Data is available from the authors upon request.
Conflicts of Interest
The authors declare no conflict of interest.
References
- Tewelde, A.G. Evaluating the Economic Water Productivity underfull and deficit irrigation the case of sesamecrop (Sesumum indicum L.) in woreda Kafta-Humera, Tigrai-Ethiopia. Water Sci. 2019, 33, 75–83. [Google Scholar] [CrossRef] [Green Version]
- Gerbens-Leenesa, W.; Hoekstraa, A.Y.; van der Meerb, T.H. The water footprint of bioenergy. Proc. Natl. Acad. Sci. USA 2009, 106, 10219–10223. [Google Scholar] [CrossRef] [PubMed] [Green Version]
- Van Heerden, P.S. Improvement of SAPWAT as an Irrigation Planning Tool. Ph.D. Thesis, University of the Free State, Bloemfontein, South Africa, 2015. [Google Scholar]
- Van der Laan, M.; Jarmain, C.; Bastidas-Obando, E.; Annandale, J.; Fessehazion, M.; Haarhoff, D. Are water footprints accurate enough to be useful? A case study for maize (Zea mays L.). Agric. Water Manag. 2019, 213, 512–520. [Google Scholar] [CrossRef]
- Pahlow, M.; Snowball, J.; Fraser, G. Water footprint assessment to inform water management and policy making in South Africa. Water SA 2015, 41, 300–313. [Google Scholar] [CrossRef] [Green Version]
- Gerbens-Leenes, W.; Hoekstra, A. Water footprint quantification of energy at a global level. In Bioenergy and Water; Dallemand, J.F., Gerbens-Leenes, P.W., Eds.; Joint Research Centre: Ispra, Italy, 2013; pp. 61–76. [Google Scholar]
- Jiang, Y.; May, H.D.; Lu, L.; Liang, P.; Huang, X.; Ren, Z.J. Carbon dioxide and organic waste valorization by microbial electrosynthesis and electro-fermentation. Water Res. 2019, 149, 42–55. [Google Scholar] [CrossRef]
- Aldaya, M.M.; Chapagain, A.K.; Hoekstra, A.Y.; Mekonnen, M.M. The Water Footprint Assessment Manual: Setting the Global Standard; Routledge: Oxfordshire, UK, 2012. [Google Scholar]
- Scheepers, M.E.; Jordaan, H. Assessing the blue and green water footprint of lucerne for milk production in South Africa. Sustainability 2016, 8, 49. [Google Scholar] [CrossRef] [Green Version]
- Blackshaw, R.; Johnson, E.; Gan, Y.; May, W.; McAndrew, D.; Barthet, V.; McDonald, T.; Wispinski, D. Alternative oilseed crops for biodiesel feedstock on the Canadian prairies. Can. J. Plant Sci. 2011, 91, 889–896. [Google Scholar] [CrossRef]
- Deo, K.; Mishra, S.R.; Singh, A.K.; Mishra, A.N.; Singh, A. Water requirement of wheat crop for optimum production using CROPWAT model. J. Med. Plants 2017, 5, 338–342. [Google Scholar]
- Brennan, L.; Owende, P. Biofuels from microalgae—A review of technologies for production, processing, and extractions of biofuels and co-products. Renew. Sustain. Energy Rev. 2010, 14, 557–577. [Google Scholar] [CrossRef]
- Mekonnen, M.M.; Hoekstra, A.Y. The green, blue and grey water footprint of crops and derived crop products. Hydrol. Earth Syst. Sci. 2011, 15, 1577–1600. [Google Scholar] [CrossRef] [Green Version]
- Colvin, C.; Muruven, D.; Lindley, D.; Gordon, H.; Schachtschneider, K. Water Facts and Futures: Rethinking South Africa’s Water Future. Water Facts Futures 2016, 2–96. [Google Scholar]
- Zwane, E.M. Impact of climate change on primary agriculture, water sources and food security in Western Cape, South Africa. Jàmbá J. Disaster Risk Stud. 2019, 11, 1–7. [Google Scholar] [CrossRef] [Green Version]
- Kaya, M.D.; Kolsarici, O. Seed yield and oil content of some sunflower (Helianthus annuus L.) hybrids irrigated at different growth stages. Afr. J. Biotechnol. 2011, 10, 4591–4595. [Google Scholar]
- Mzezewa, J.; van Rensburg, L.D. Risk assessment of Sunflower Production Using In-Field Rainwater Harvesting on Semi-Arid Ecotope in South Africa. In Soil Management and Plant Nutrition for Sustainable Crop Production; IntechOpen: London, UK, 2019. [Google Scholar]
- Kunz, R.; Mengistu, M.; Steyn, J.; Doidge, I.; Gush, M.; du Toit, E.; Davis, N.; Jewitt, G.; Everson, C. Assessment of Biofuel Feedstock Production in South; Synthesis Report on Estimating Water Use Efficiency of Biofuel Crops; Water Research Commission: Pretoria, South Africa, 2015. [Google Scholar]
- Moeletsi, M.; Walker, S. Rainy season characteristics of the free state province of south africa with reference to rain-fed maize production. Water SA 2012, 38, 775–782. [Google Scholar] [CrossRef] [Green Version]
- Moeletsi, M.E.; Walker, S.; Landman, W.A. ENSO and implications on rainfall characteristics with reference to maize production in the Free State Province of South Africa. Phys. Chem. Earth Parts A/B/C 2011, 36, 715–726. [Google Scholar] [CrossRef] [Green Version]
- Rathinam, N.K.; Sani, R. Biovalorisation of Wastes to Renewable Chemicals and Biofuels; Elsevier: Amsterdam, The Netherlands, 2019. [Google Scholar]
- Bautista, L.F.; Vicente, G.; Rodriguez, R.; Pacheco, M. Optimisation of FAME production from waste cooking oil for biodiesel use. Biomass Bioenergy 2009, 33, 862–872. [Google Scholar] [CrossRef]
- Pasha, M.K.; Dai, L.; Liu, D.; Guo, M.; Du, W. An overview to process design, simulation and sustainability evaluation of biodiesel production. Biotechnol. Biofuels 2021, 14, 129. [Google Scholar] [CrossRef]
- Knothe, G.; Krahl, J.; Van Gerpen, J. The Biodiesel Handbook; Elsevier: Amsterdam, The Netherlands, 2015. [Google Scholar]
- Ma, F.; Hanna, M.A. Biodiesel production: A review. Bioresour. Technol. 1999, 70, 1–15. [Google Scholar] [CrossRef]
- Aníbal Sorichetti, P.; Romano, S.D. Water consumption in biodiesel production: Optimization through measurement of electrical properties. Environ. Res. J. 2012, 6, 3. [Google Scholar]
- Ortiz Lechuga, E.G.; Rodríguez Zúñiga, M.; Arévalo Niño, K. Efficiency Evaluation on the Influence of Washing Methods for Biodiesel Produced from High Free Fatty Acid Waste Vegetable Oils through Selected Quality Parameters. Energies 2020, 13, 6328. [Google Scholar] [CrossRef]
- Gude, V.G. Desalination and water reuse to address global water scarcity. Rev. Environ. Sci. Bio/Technol. 2017, 16, 591–609. [Google Scholar] [CrossRef]
- Levi, K.L.; Dorothy, M. Assessment of the effect of mixing pig and cow dung on biogas yield. Agric. Eng. Int. CIGR J. 2009, 11, 1–7. [Google Scholar]
- Van Heerden, P.; Crosby, C.T.; Crosby, C. Using SAPWAT to Estimate Water Requirements of Crops in Selected Irrigation Areas Managed by the Orange-Vaal and Orange-Riet Water User Associations; Water Research Commission: Pretoria, South Africa, 2001. [Google Scholar]
- Velázquez Martí, B. Aprovechamiento de la biomasa para uso energético; Editorial Universitat Politècnica de València: Valencia, Spain, 2018. [Google Scholar]
- Hoekstra, A.Y.; Chapagain, A.K.; Aldaya, M.M.; Mekonnen, M.M. Water footprint manual. State Art 2009, 1–131. [Google Scholar]
- Iriarte, A.; Rieradevall, J.; Gabarrell, X. Life cycle assessment of sunflower and rapeseed as energy crops under Chilean conditions. J. Clean. Prod. 2010, 18, 336–345. [Google Scholar] [CrossRef]
- Iriarte, A.; Villalobos, P. Greenhouse gas emissions and energy balance of sunflower biodiesel: Identification of its key factors in the supply chain. Resour. Conserv. Recycl. 2013, 73, 46–52. [Google Scholar] [CrossRef]
- De Marco, I.; Miranda, S.; Riemma, S.; Iannone, R. Biodiesel production from sunflower: An environmental study. Chem. Eng. Trans. 2016, 49, 331–336. [Google Scholar]
- Hoekstra, A.Y.; Mekonnen, M.M.; Chapagain, A.K.; Mathews, R.E.; Richter, B.D. Global monthly water scarcity: Blue water footprints versus blue water availability. PLoS ONE 2012, 7, e32688. [Google Scholar] [CrossRef]
- Muñoz, G.; Grieser, J. Climwat 2.0 for CROPWAT. Water Resour. Dev. Manag. Serv. 2006, 1–5. Available online: http://www.juergen-grieser.de/downloads/CLIMWAT_2.pdf (accessed on 10 January 2022).
- Van Heerden, P.S.; Walker, S. Upgrading of SAPWAT3 as a Management tool to Estimate the Irrigation Water Use of Crops Revised Edition SAPWAT4; Water Research Commission: Pretoria, South Africa, 2016. [Google Scholar]
- Clarke, D.; Smith, M.; El-Askari, K. CropWat for Windows: User Guide; IHE: Oak Brook, IL, USA, 2001. [Google Scholar]
- Hess, T. Estimating green water footprints in a temperate environment. Water 2010, 2, 351–362. [Google Scholar] [CrossRef]
- Zeng, W.; Cao, X.; Huang, X.; Wu, M. Water resource use and driving forces analysis for crop production in China coupling irrigation and water footprint paradigms. Environ. Sci. Pollut. Res. 2022, 1–14. [Google Scholar] [CrossRef]
- Hoekstra, A.Y.; Mekonnen, M.M. The water footprint of humanity. Proc. Natl. Acad. Sci. USA 2012, 109, 3232–3237. [Google Scholar] [CrossRef] [PubMed] [Green Version]
- Amigun, B.; Von Blottnitz, H. Size Optimization of Biodiesel Processing Plant; Cape Town, Environmental Process Engineering, University of Cape Town: Cape Town, South Africa, 2004. [Google Scholar]
- Xie, X.; Zhang, T.; Wang, L.; Huang, Z. Regional water footprints of potential biofuel production in China. Biotechnol. Biofuels 2017, 10, 95. [Google Scholar] [CrossRef] [PubMed]
Figure 1.
Map showing the location of the study area in the Free State Province of South Africa.

Figure 2.
Systematic framework used or water footprint evaluation. Source: Authors’ depiction.

Figure 3.
Water scarcity in the Orange River Basin.


Table 1.
Sunflower water use (mm/stage) at various sunflower growth stages (monthly periods).
| Production System | Growing Period | |||
|---|---|---|---|---|
| Initial | Development | Mid | End | |
| mm/Period | mm/Period | mm/Period | mm/Period | |
| Irrigated | 62 | 183 | 277 | 60 |
| Rainfed | 59 | 161 | 203 | 48 |
Source: authors’ calculation.
Table 2.
Water use for sunflower production.
| Crop | Yield | ET | ER | EI | ER + EI | CWUgreen | CWUblue | WFgreen | WFblue | WFgreen + green |
|---|---|---|---|---|---|---|---|---|---|---|
| ton | mm | mm | mm | mm | m3/ha | m3/ha | m3/ton | m3/ton | m3/ton | |
| Rain-fed sunflower | 1.8 | 471 | 336 | 0 | 336 | 4710 | 0 | 2617 | 0 | 2617 |
| Irrigated sunflower | 2.2 | 581 | 325 | 220 | 545 | 3250 | 2200 | 1477 | 1000 | 2477 |
Table 3.
Biodiesel characteristics.
| Oil Crop | Dry Mas Fraction | Fraction of Fat in Dry Mass | Biodiesel Per Unit of Fat | HHV | Energy Yield | Density | Biodiesel Yield |
|---|---|---|---|---|---|---|---|
| (%) | g/g | g/g | kJ/g | gj/ton | Kg/L | L/ton | |
| Sunflower | 85 | 0.22 | 1 | 37.7 | 7.05 | 0.88 | 213 |
Source: Mekonnen and Hoekstra [13] and authors’ calculations.
Table 4.
Water footprint of biodiesel (processing level).
| Product | Feedstock Crop | Amount of Water | WFgreen | WFblue | WFgreen+blue | |
|---|---|---|---|---|---|---|
| m3/L | m3 | m3/ton | m3/ton | m3 /ton | ||
| Rain-fed sunflower | 0.00712 | 546 | 0 | 8.09 | 8.09 | |
| Biodiesel | ||||||
| Irrigated sunflower | 0.00712 | 667 | 0 | 7.1 | 7.1 | |
Source: Adapted from [36].
Table 5.
Water footprint per GJ of biodiesel (processing level).
| Product | Feedstock Crop | WFgreen | WFblue | WFgreen+blue |
|---|---|---|---|---|
| m3/GJ | m3/GJ | m3/GJ | ||
| Rain-fed sunflower | 0 | 1.15 | 1.15 | |
| Biodiesel | ||||
| Irrigated sunflower | 0 | 1.01 | 1.01 |
Table 6.
Total water footprint throughout the sunflower-biodiesel value chain.
| Feedstock | Product | Farm Level | Processing Level | Sunflower-Biodiesel Value Chain |
|---|---|---|---|---|
| WFgreen+blue | WFgreen+blue | WFgreen+blue | ||
| m3/ton | m3/ton | m3/ton | ||
| Rain-fed sunflower | Biodiesel | 2617 | 8.09 | 2625 |
| Irrigated sunflower | 2477 | 7.1 | 2484 |
Source: Authors’ calculations.
Publisher’s Note: MDPI stays neutral with regard to jurisdictional claims in published maps and institutional affiliations. |
© 2022 by the authors. Licensee MDPI, Basel, Switzerland. This article is an open access article distributed under the terms and conditions of the Creative Commons Attribution (CC BY) license (https://creativecommons.org/licenses/by/4.0/).
Share and Cite
MDPI and ACS Style
Netshifhefhe, K.; Jordaan, H. The Water Footprint of Biodiesel Produced from Sunflower in South Africa. Water 2022, 14, 1141. https://doi.org/10.3390/w14071141
AMA Style
Netshifhefhe K, Jordaan H. The Water Footprint of Biodiesel Produced from Sunflower in South Africa. Water. 2022; 14(7):1141. https://doi.org/10.3390/w14071141
Chicago/Turabian StyleNetshifhefhe, Khwathiso, and Henry Jordaan. 2022. "The Water Footprint of Biodiesel Produced from Sunflower in South Africa" Water 14, no. 7: 1141. https://doi.org/10.3390/w14071141
Note that from the first issue of 2016, this journal uses article numbers instead of page numbers. See further details here.