
Study on the Relationship between River Water and Groundwater under Different Aquifer Mediums


College of Earth Science and Engineering, Shandong University of Science and Technology, Qingdao 266590, China
*
Author to whom correspondence should be addressed.
Water 2022, 14(7), 1134; https://doi.org/10.3390/w14071134
Submission received: 11 February 2022
/
Revised: 26 March 2022
/
Accepted: 30 March 2022
/
Published: 1 April 2022
(This article belongs to the Section Hydrogeology)
Abstract
:There is a strong river water–groundwater hydraulic connection, particularly in arid and semi-arid regions in which rivers are the main source of groundwater recharge. Therefore, a study of this relationship is of great practical significance. This study investigated this relationship for three kinds of homogeneous sand with different particle sizes using sandbox experiments. Consistent with previous studies, as the moisture of the sand decreased, the discharged water level continued to decline and the hydraulic connection between river water and groundwater was gradually lost. Discharged flow increased as the discharge level decreased and stabilized after reaching a maximum threshold. However, inconsistent with the results of previous studies, the thickness of the inverted saturation zone was not always equal to the river water depth. In addition, the maximum discharge flow resulting from cutting off the river and groundwater was different from that noted in previous studies. A coarse sand water-bearing medium resulted in a thickness of a suspended saturated zone of 15–20 cm, for 18.5 cm river water depth and 5–10 cm for 10 cm river water depth. The results for medium sand with a thickness of 5–10 cm (18.5 cm river water depth) was the disappearance of the suspended saturated water zone (10 cm river water depth), as it was for a fine sand thickness of 15–20 cm (18.5 cm river water depth), and a thickness of 10–15 cm (10 cm river water depth). The results indicated that the thickness of the inverted saturation zone formed by the separation of the connection between the river and the groundwater is not only related to the depth of the river, but also affected by various physical parameters of the aquifer. An empirical formula for calculating the thickness of the inverted saturation band is given based on the experimental results.
1. Introduction
The main source of groundwater recharge in arid and semi-arid regions is usually surface water from a river [1]. As the supply of river surface water gradually declines, the hydraulic connection between the river and groundwater weakens, and eventually a disconnect occurs. Studies of the interaction between rivers and groundwater over the past decade have mainly focused on their hydraulic connection under a saturated state. The earliest study used two-dimensional integral equations to simulate groundwater-surface water interactions, demonstrating that the presence of an unsaturated zone below the riverbed results in the rapid flow of water into the aquifer [2]. This flow preferentially travels laterally through the high-infiltration zone of the riverbank. Understanding the relationship between river water and groundwater and its evolution can facilitate the sustainable utilization, management, and protection of regional groundwater resources, particularly in arid and semi-arid regions in which the main source of groundwater recharge is river seepage [3,4]. Research on the relationship between river water and groundwater has for a long time mainly focused on their hydraulic connection under saturated conditions [5]. Human demand for water is increasing with rapid human development. Consequently, there is increasing focus on understanding the relationship between river water and groundwater. There has been a gradual realization that groundwater levels will continue to decline as groundwater extraction increases. This decline in groundwater levels will lead to the loss of the hydraulic connection between river water and the groundwater under a saturated condition [6,7]. A disconnection between the river and groundwater results in the formation of an inverted saturated zone and an unsaturated zone under the river and between the inverted groundwater table and the groundwater table, respectively [6,8,9].
The interaction between river water and groundwater is complex and is affected by many factors, including river morphology, riverbed composition, river hydrodynamic conditions, and human activities [2,10,11,12,13]. The interactions between river water and groundwater have been extensively studied using analytical, numerical, and experimental methods [1,5,8,9,14,15,16,17,18]. Using sandbox experiments, Riviere et al. [19] studied the dynamic evolution of the relationship between river water and groundwater under conditions ranging from saturated to a complete disconnection. The results showed that the groundwater infiltration rate is regulated by the hydraulic gradient during the river and groundwater truncation process and tends to stabilize at a maximum value as the truncation stage completes. The results by Rivière [19] are consistent with the relationship between the groundwater infiltration rate and river water level proposed by Fox and Durnford [6] and Brunner et al. [10]. A disconnect between river water and groundwater can only occur in partially connected rivers since fully connected rivers remain in a state of hydraulic connection under saturated conditions [4]. In addition, the low permeability of a riverbed has a significant impact on the river water infiltration. Fox and Durnford [6] and Brunner et al. [10] studied the law of seepage between river water and aquifers and proposed that the development of a low-permeability layer in the riverbed is a necessary precondition for a disconnection between river water and groundwater. However, a study based on laboratory sandbox experiments by Wang et al. [9] concluded that regardless of the presence of an aquitard at the bottom of the riverbed, the hydraulic connection between the river and groundwater will be broken under certain conditions. Wang et al. [17] concluded that the thickness of the inverted saturation zone that develops under the riverbed is always equal to the depth of the river. However, this was contradictory to the results of Xie et al. [18]. In addition, Xie et al. [18] found that a large groundwater depth would develop in the absence of a barrier layer and only under a very shallow river water depth and narrow river channel.
Recent research has provided an increased understanding of the conditions under which the hydraulic connection between river water and groundwater under a saturated condition breaks as well as the corresponding laws of river infiltration. Xi’an et al. [20] found that lateral flow resulting from capillary action or heterogeneity plays an important role in the relationship between river water and aquifers. They also found that the lowest point of the inverted water table can develop at the bottom of the riverbed. Xian et al. [21] developed a bio-clogging model integrating saturated flow, microbial growth, and biogeochemical reactions to study the feedback relationship between nutrient transport and microbial growth during river and groundwater evolution and its control on soil infiltration.
The relationship between river water and groundwater is complex and affected by many factors. Therefore, the conditions under which the connection between river water and groundwater breaks remain unclear. Identifying the hydraulic connection between river water and groundwater can facilitate the sustainable utilization of regional groundwater resources and the protection of water resources. The predecessors put forward the theory that the recharge capacity of rivers to groundwater is limited, and rivers “recharge groundwater by vertical leaching during the flat and dry seasons and only recharge groundwater in a short period of time by means of uniform infiltration surface infiltration. When there is no obvious aquifer under the riverbed, under certain conditions, the groundwater level and the river will be “disconnected”. There is no doubt that the inverted saturated zone relates to the river water. Both the river water and the water in the inverted saturated zone show continuity and conduction of water pressure. Therefore, when exposed, the water in the inverted saturated zone can be discharged naturally and continuously under the action of gravity. In addition, the water in the inverted saturated zone is dynamic. The continuous downward leakage of water in the river results in the formation of an inverted saturated zone under the riverbed. In other words, the inverted saturated zone disappears when the river is not cut off or downward leakage no longer occurs.
The present study designed a laboratory sandbox experiment using three types of sand with different particle sizes. The aim of the present study was to identify the hydraulic connection between river water and groundwater under different aquifer mediums.
2. Materials and Methods
2.1. Experimental Facility
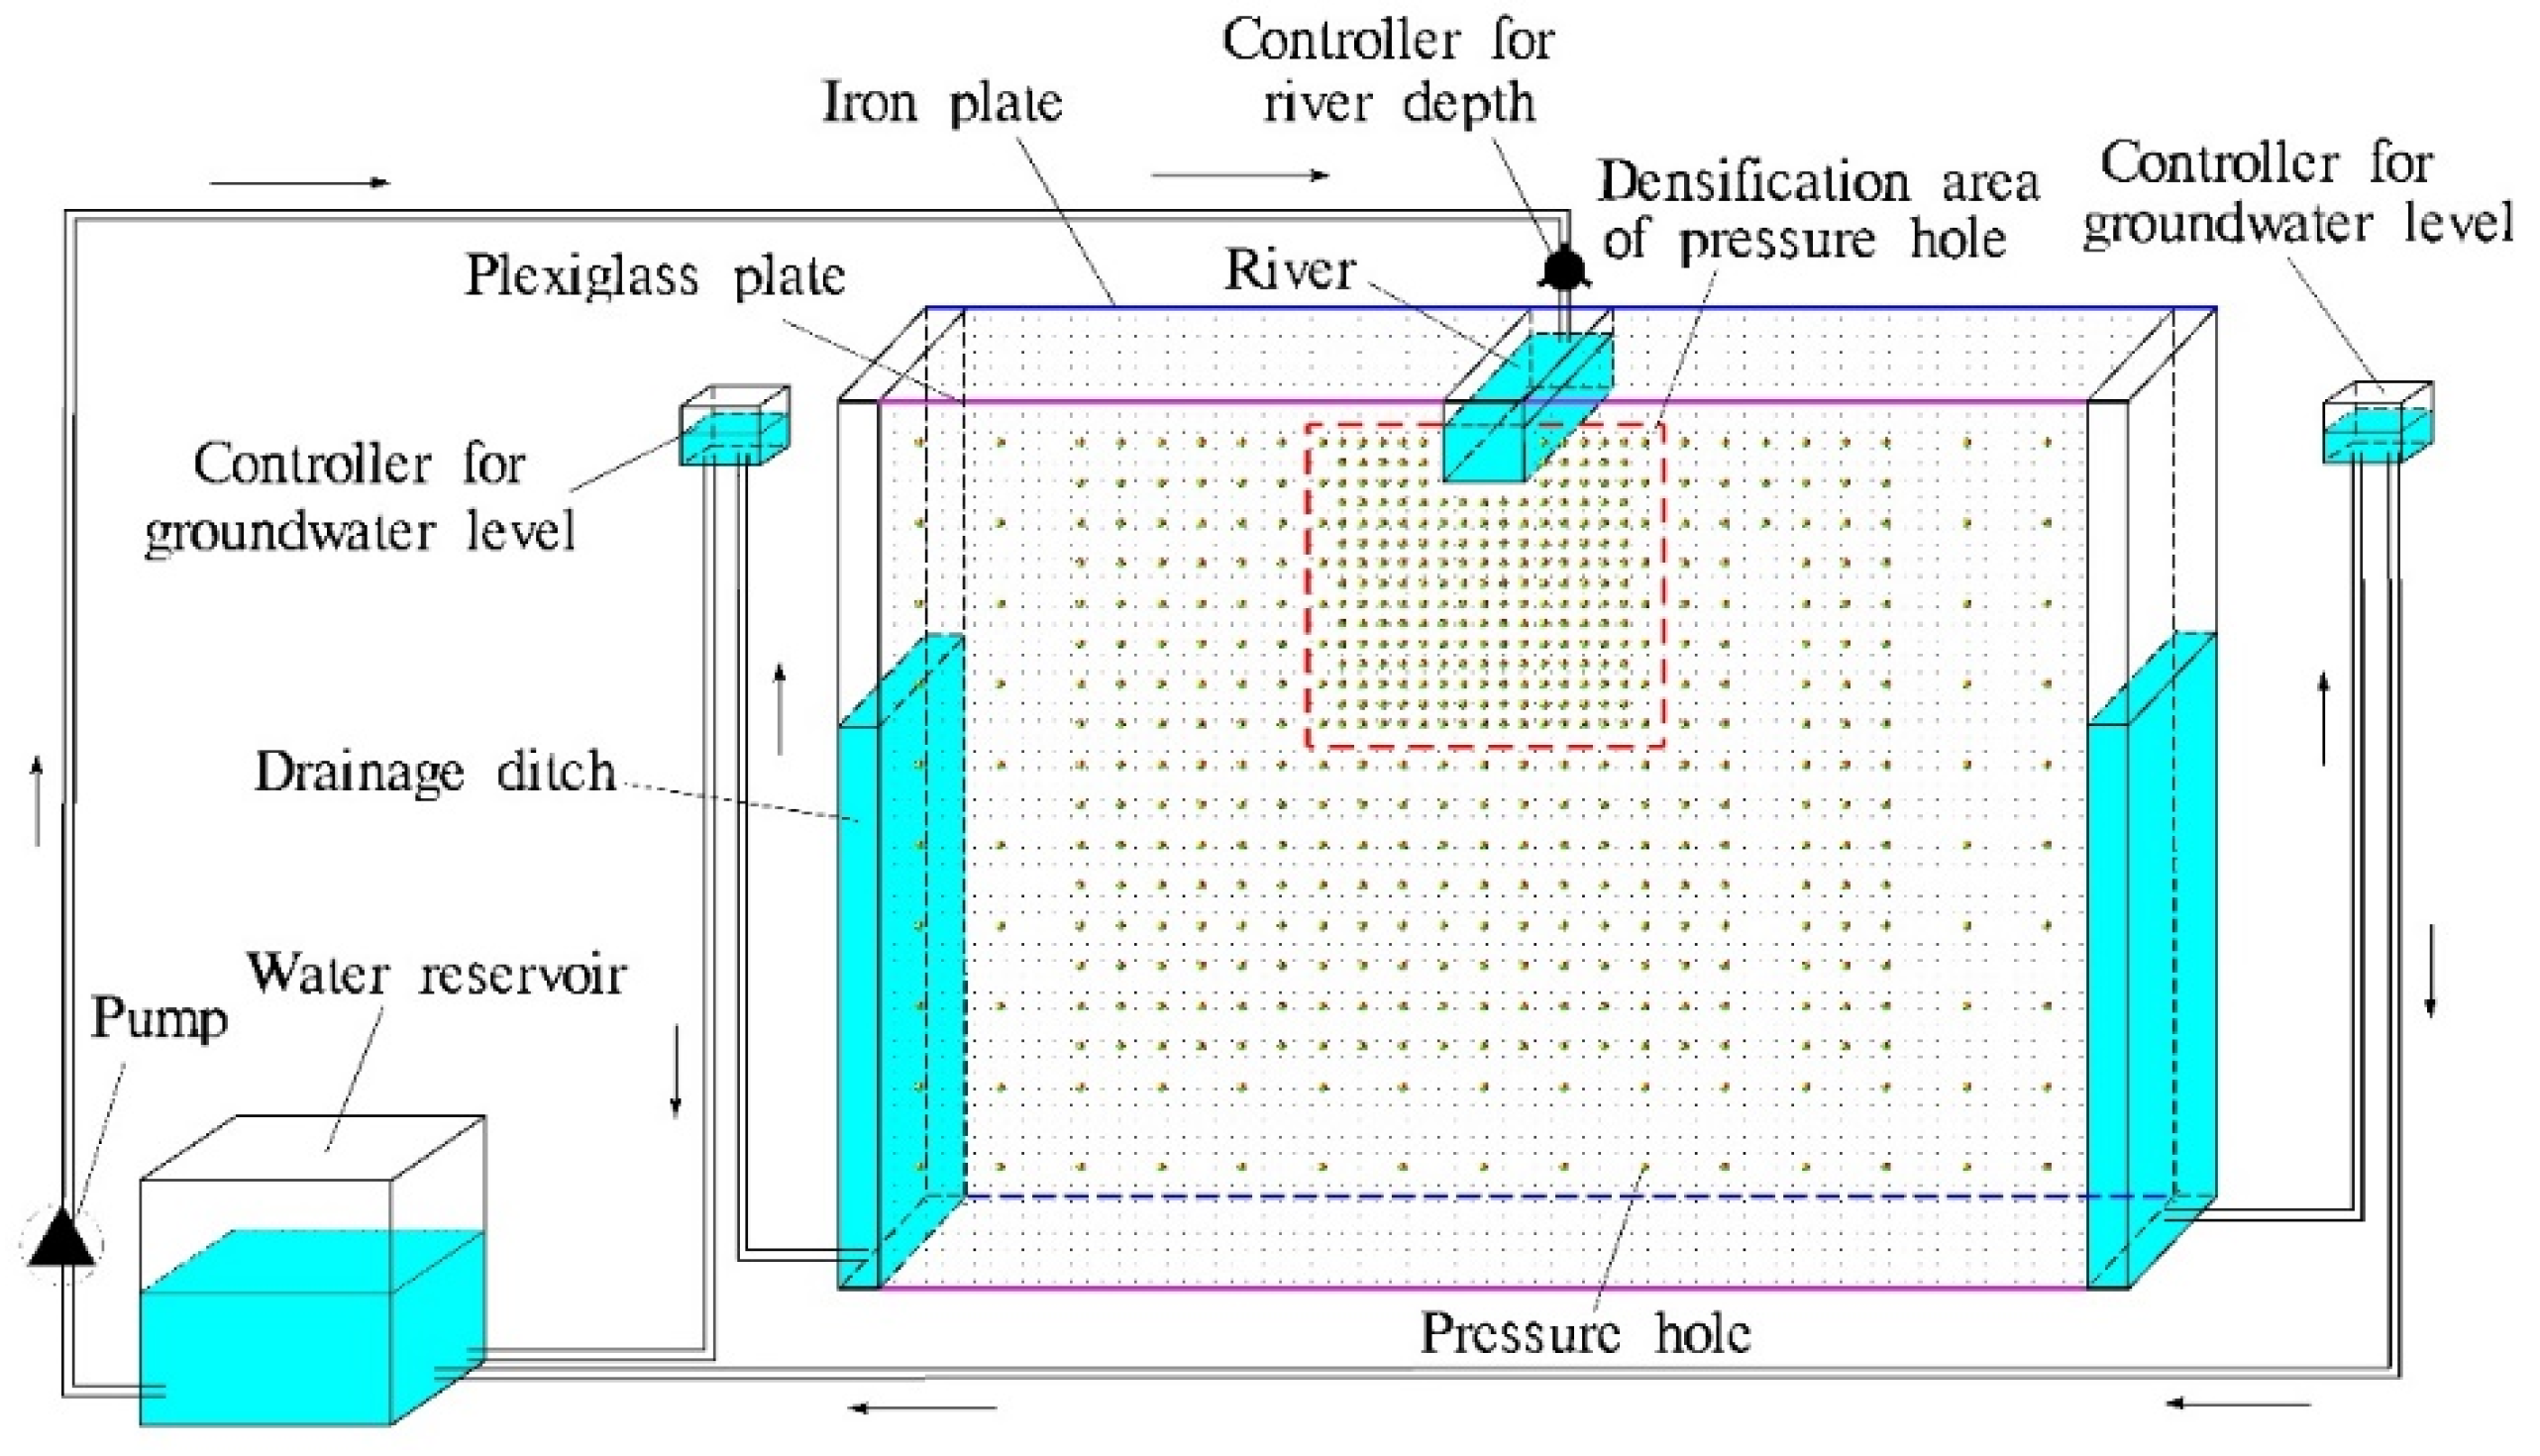
Figure 1 shows the design of the sandbox model constructed in the present study. The main body of the model is a rectangular sandbox with a height, width, and length of 2.2 m, 0.4 m, and 3 m, respectively. A river channel was simulated in the middle of the upper part of the sandbox, with the depth regulated using a river level controller. A drainage ditch was established on each side of the river and a water control device was set to regulate the groundwater level. The front and back sides of the sandbox were constructed of a transparent plexiglass plate and an iron plate. Pressure taps numbering 552 were established on one side of the plexiglass, with a denser distribution below the river. The present study simulated the relationship between river and groundwater by controlling the depth of river water and regulating the groundwater level.
2.2. Experimental Method
Before the experiment, the sandbox was filled with sand and saturated with water in consecutive layers of 10–20 cm up until the sandbox was full. After completing filling, a medium-density sand structure was achieved by repeated drainage and filling with water. Before each experiment, the sandbox was filled with quartz sand and water, and all bubbles in the pressure pipe were discharged.
The depth of the river was regulated at a stable level at the beginning of the experiment and the groundwater table was reduced by reducing the level of discharge water on both sides. At a stable depth of water and zero flow rate, the groundwater, after achieving a stable water level, having taken roughly 1 or 2 h, the flow discharged on both sides was recorded and the piezometer data were analyzed. In addition, the action of gravity allowed water in the saturated zone to freely flow out of the pressure tap. Therefore, after recording pressure tap data, the plastic hose connected to the pressure tap was removed and the size of the inverted saturation zone under the river was measured by observing the free flow of water. Two different water depths were implemented for each sand treatment, namely 10.5 cm and 18.5 cm. During the test, the discharge water level is controlled by controlling the moving water tanks on the east and west sides of the device. The transparent water tanks on the east and west sides are designed with fixed water heads, that is, an overflow device is set on the left side of the water tank to ensure a constant water head, and the water tank can be moved up and down. At the same time, the water tanks on both sides were lowered by 10 cm to achieve a state where the discharge water level was continuously lowered by 10 cm. The discharged water level was consecutively decreased by 10 cm and the recording of data was completed after stabilization. The experiment was then repeated under a different discharged water level. After each experiment, the sand in the sandbox was replaced, and the experiment was repeated.
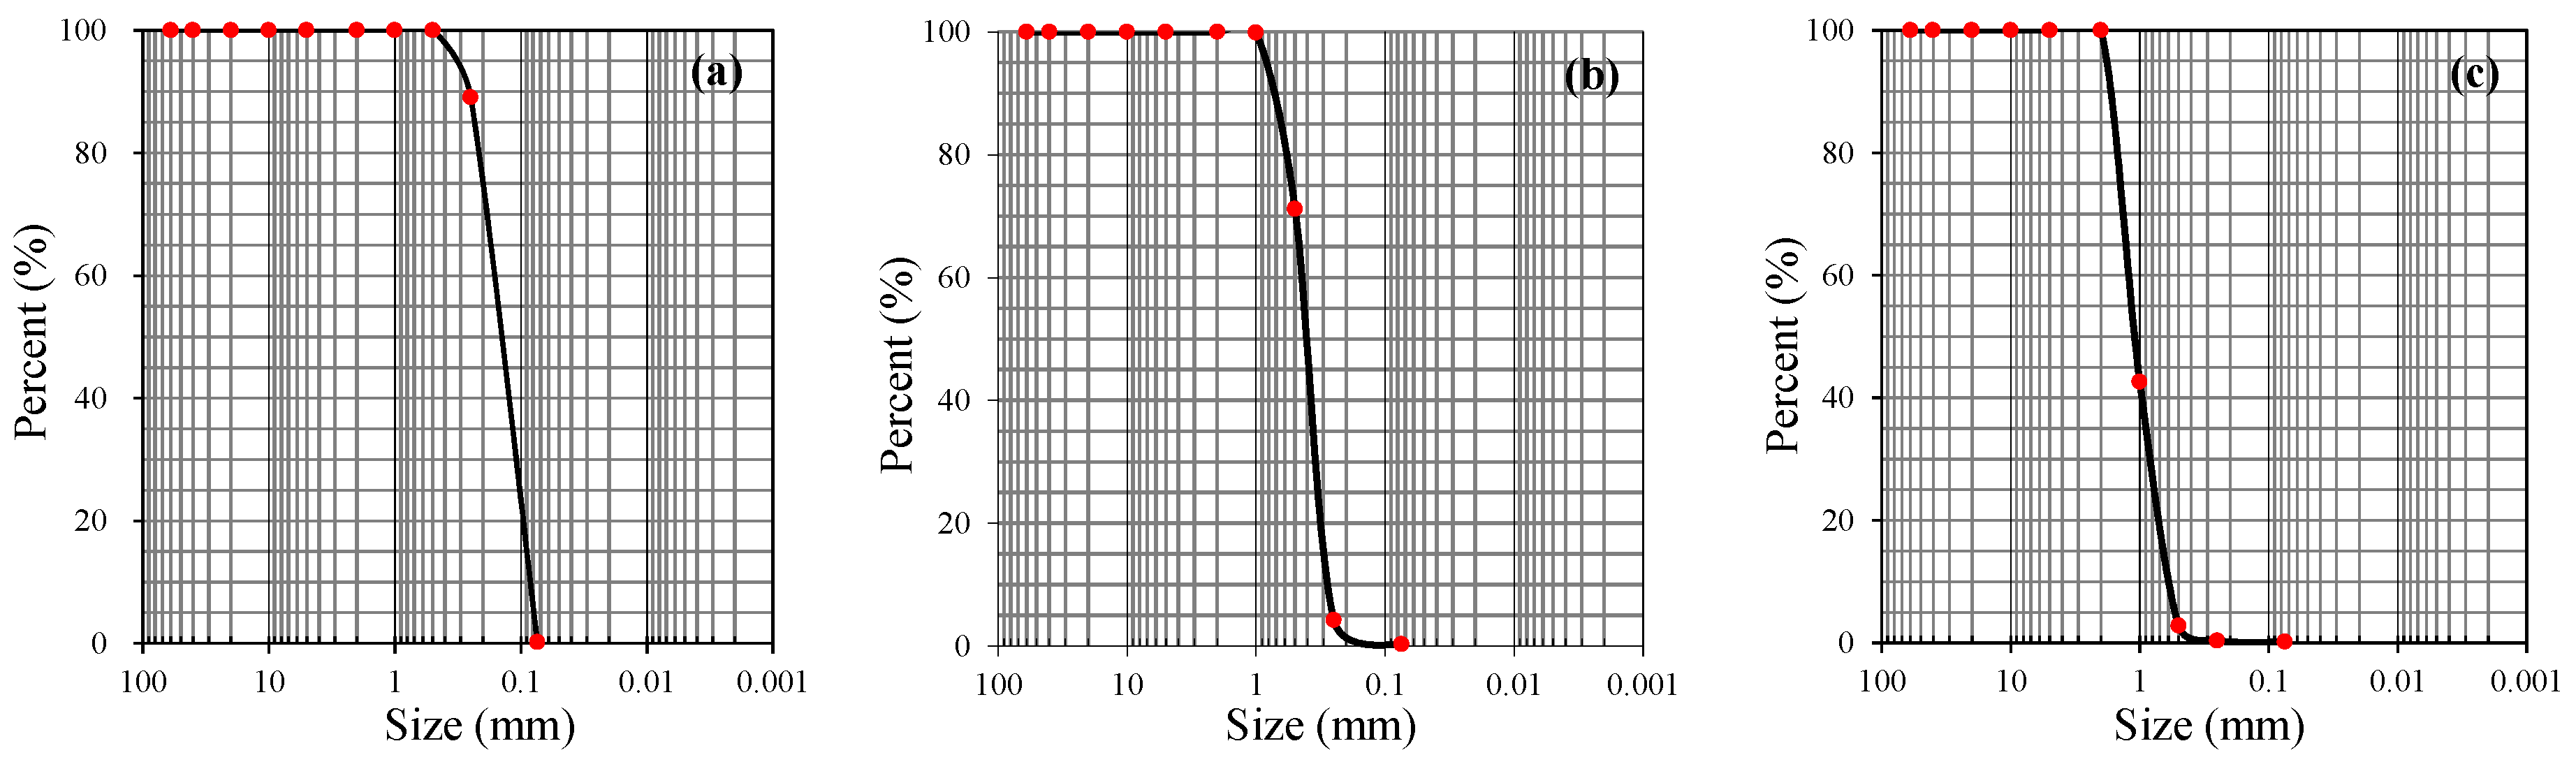
Three kinds of homogeneous sands, A (0.088–0.125 mm), B (0.22–0.45 mm), and C (0.45–0.9 mm), were selected for this experiment. A group of experiments was conducted for each of the three homogeneous sand types (Figure 2). The physical parameters of the sand types, as shown in Table 1, were obtained by using a sieve, Darcy tester, water content tester, and capillary rise height tester. The experiments were conducted under two river water depths: 10 cm and 18.5 cm. The particle size of sand C (0.45–0.9 mm) used in the present study was close to that of a sand studied by Wang et al. (2011) of 0.5–1.0 mm.
3. Results
The results of the sandbox experiment conducted in the present study were similar to those of previous studies. The sandbox experiments investigated three water bearing media, sand A, sand B, and sand C, and in each experiment, the river water depth was regulated at 18.5 cm and 10 cm. Figure 3, Figure 4, Figure 5, Figure 6, Figure 7, Figure 8, Figure 9, Figure 10 and Figure 11 show the results of the change in the relationship between river and groundwater. In general, the hydraulic connection between river water and groundwater was gradually lost with the continuous decrease in discharged water level. This resulted in the formation of the river, inverted saturation zone, unsaturated zone, and saturation zone from top to bottom.
3.1. Sand C
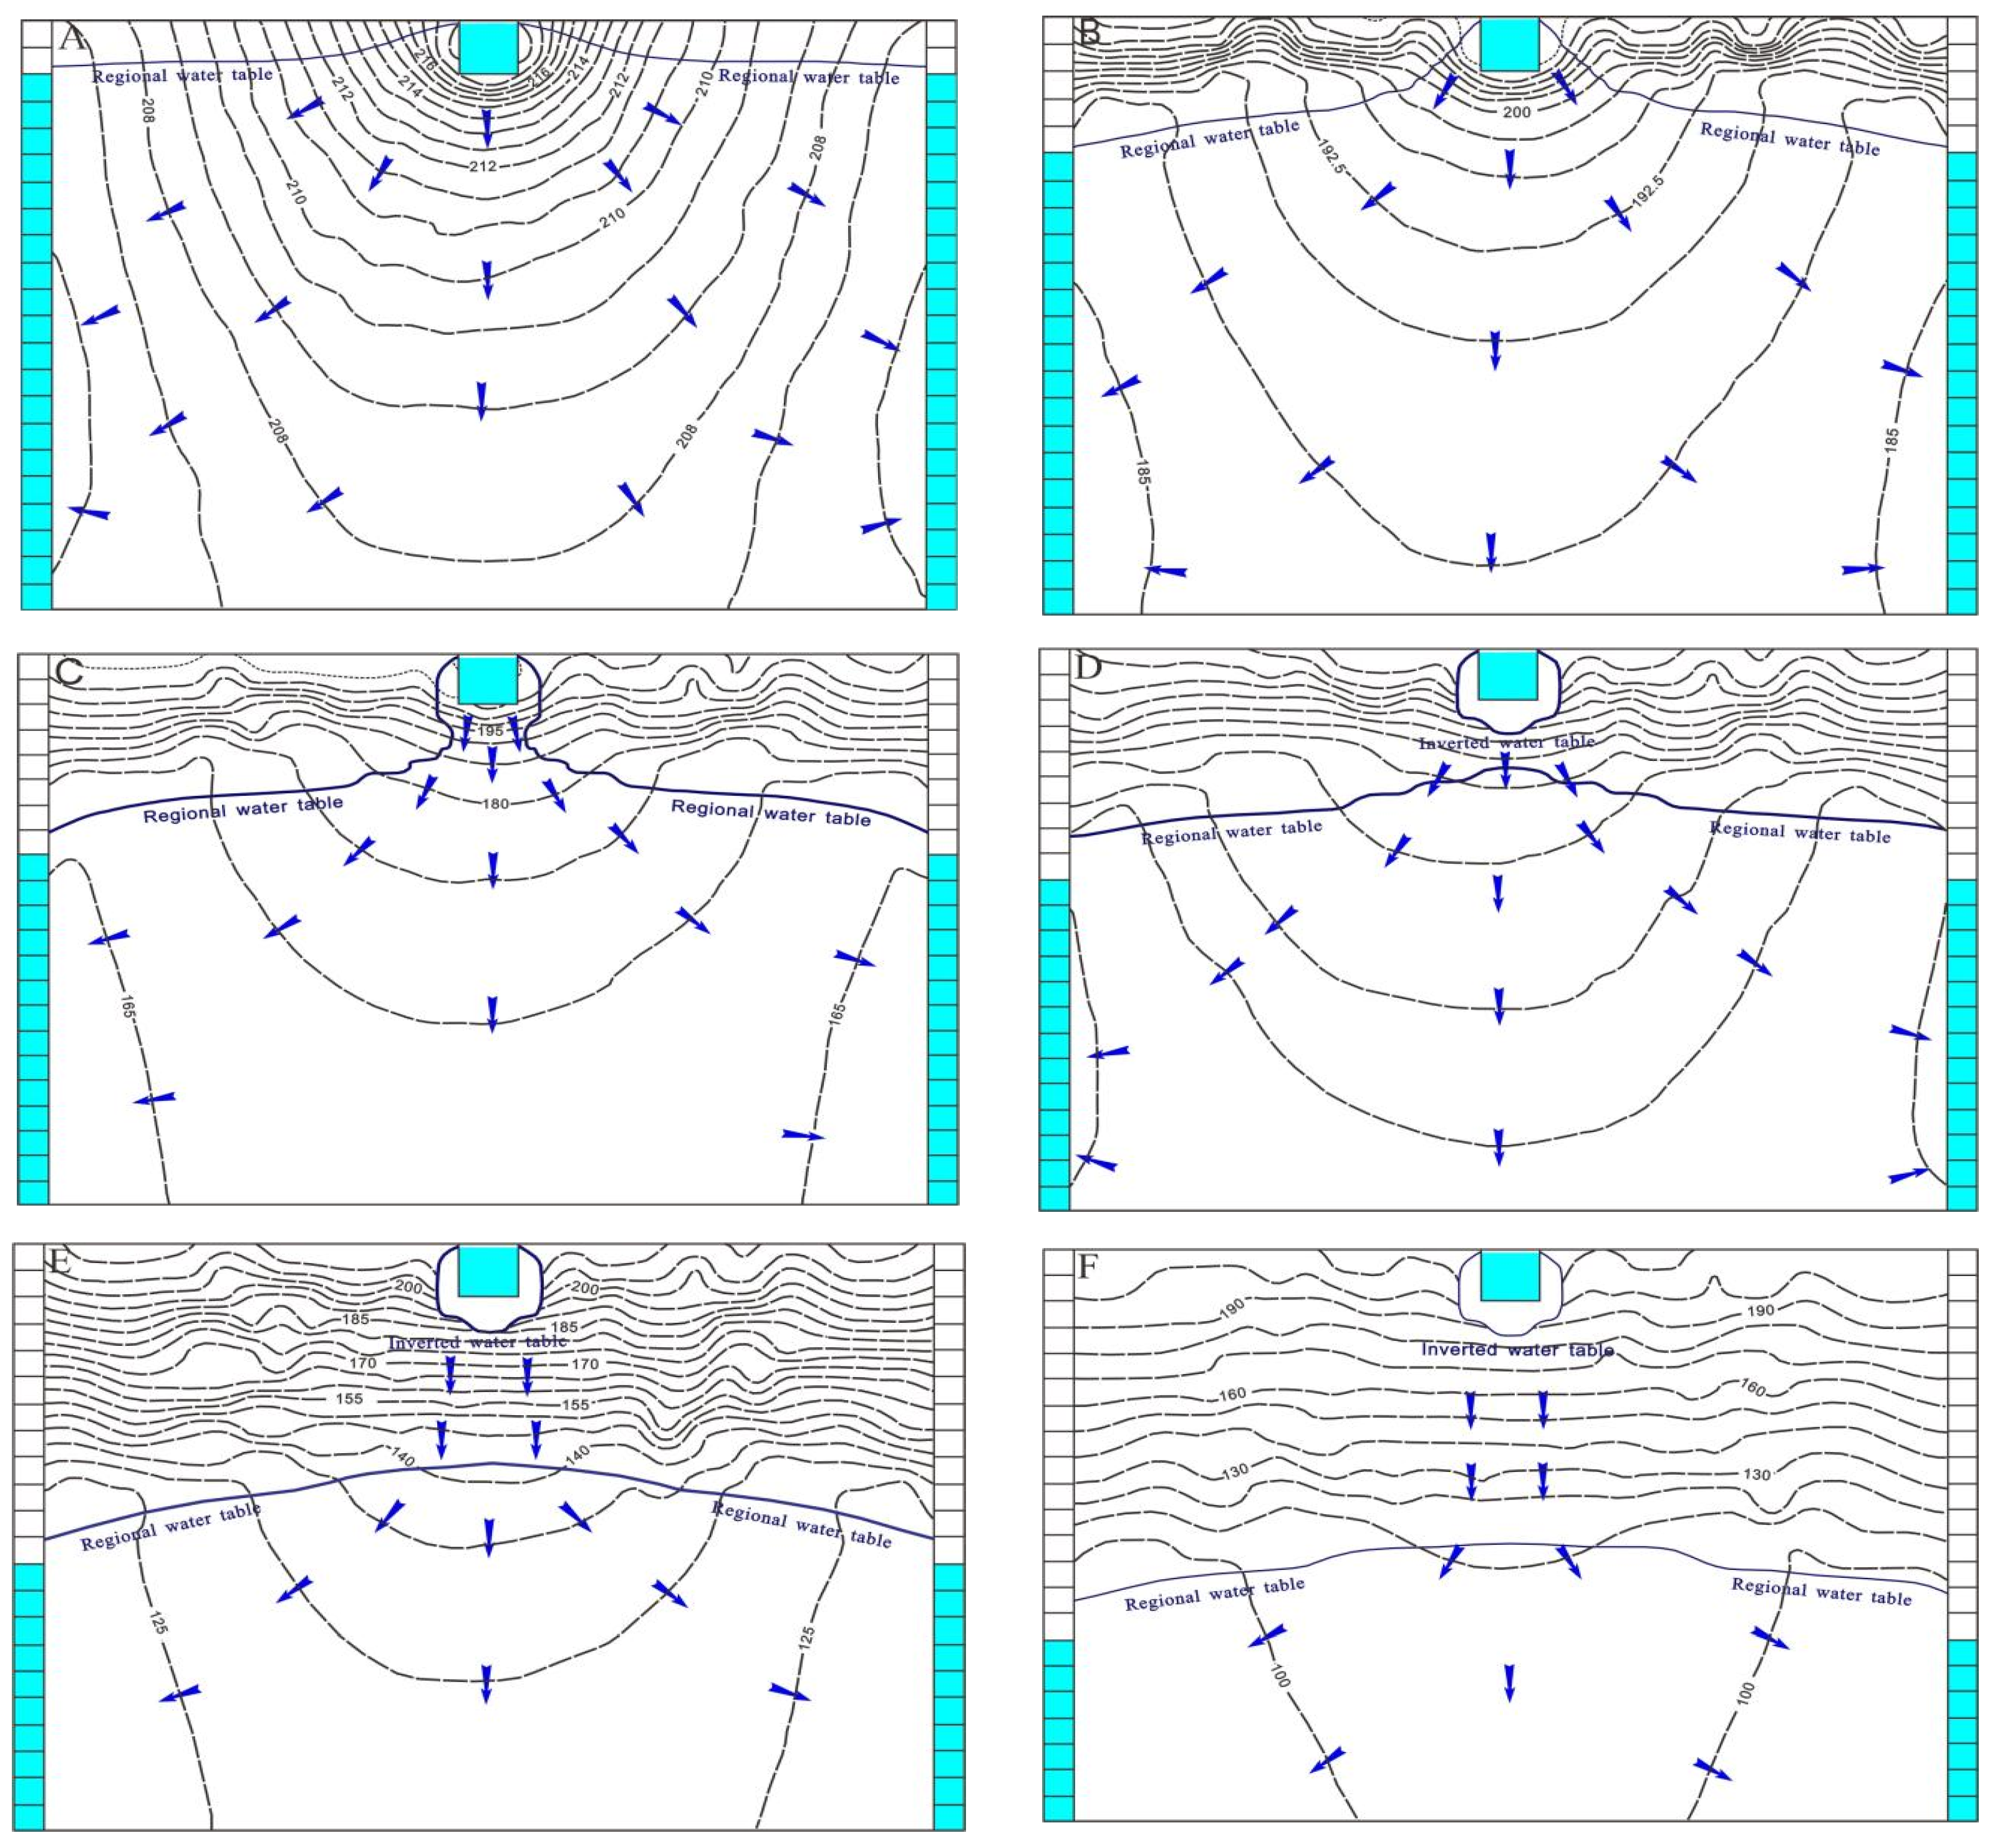
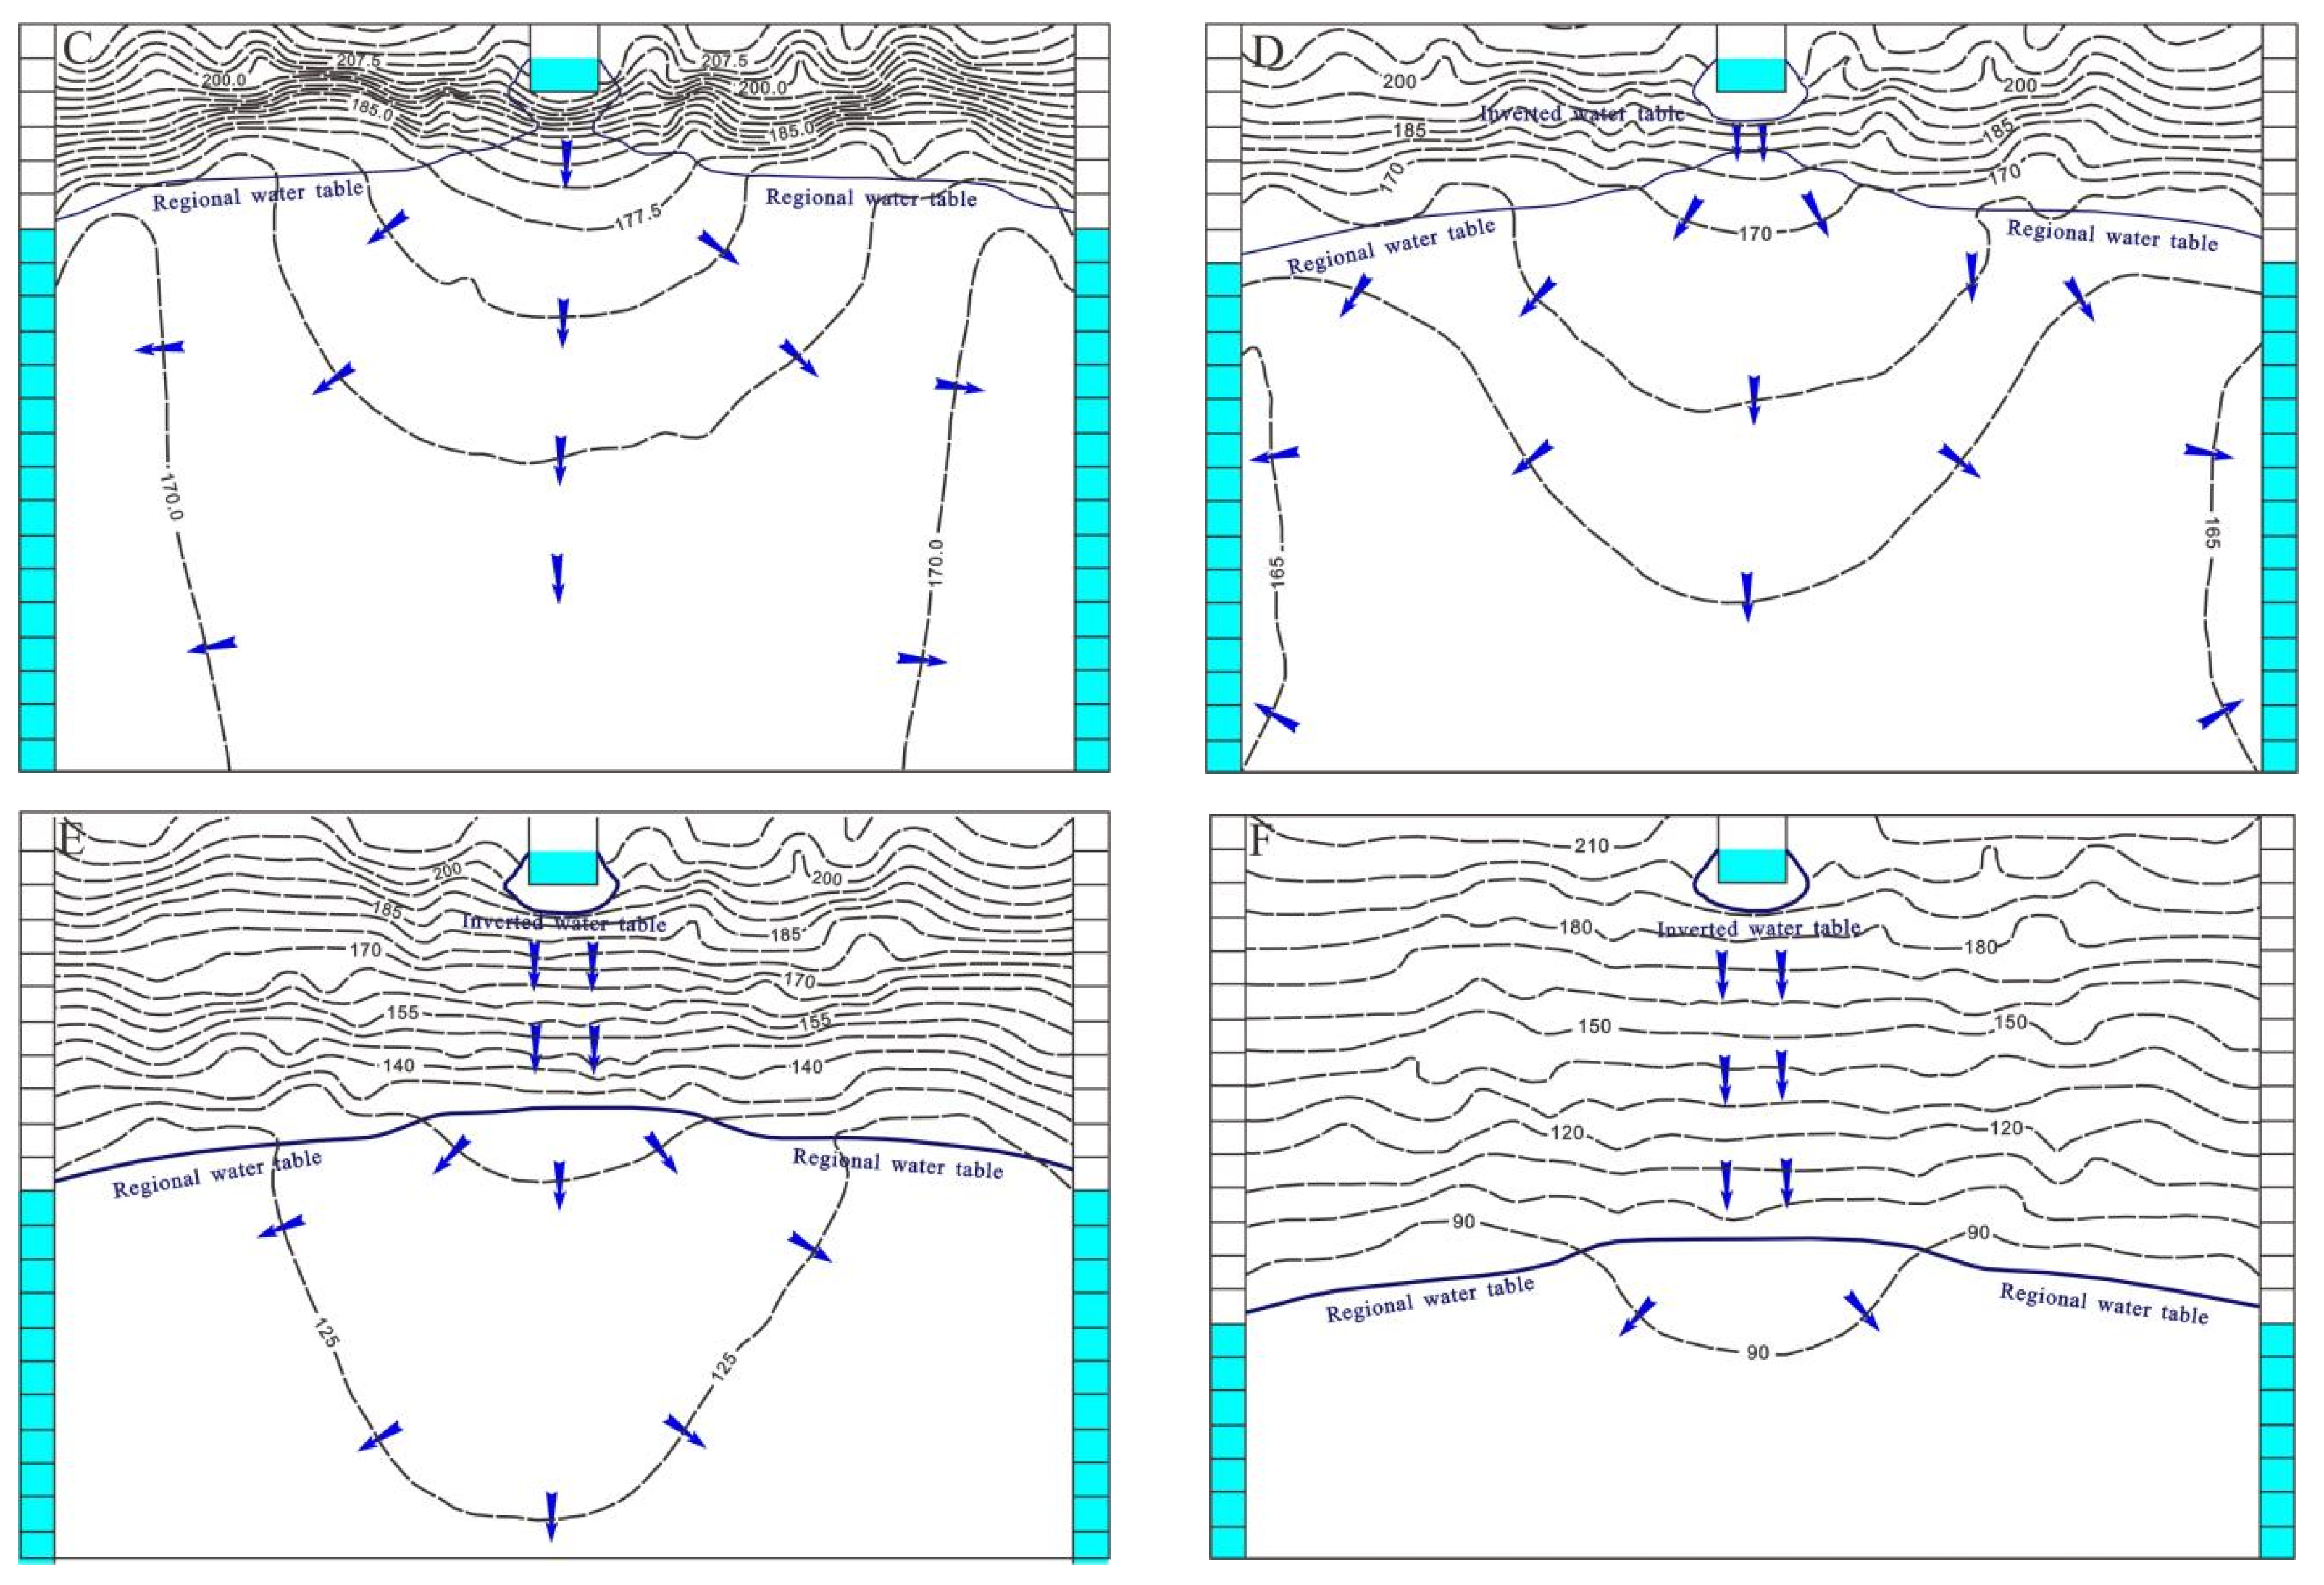
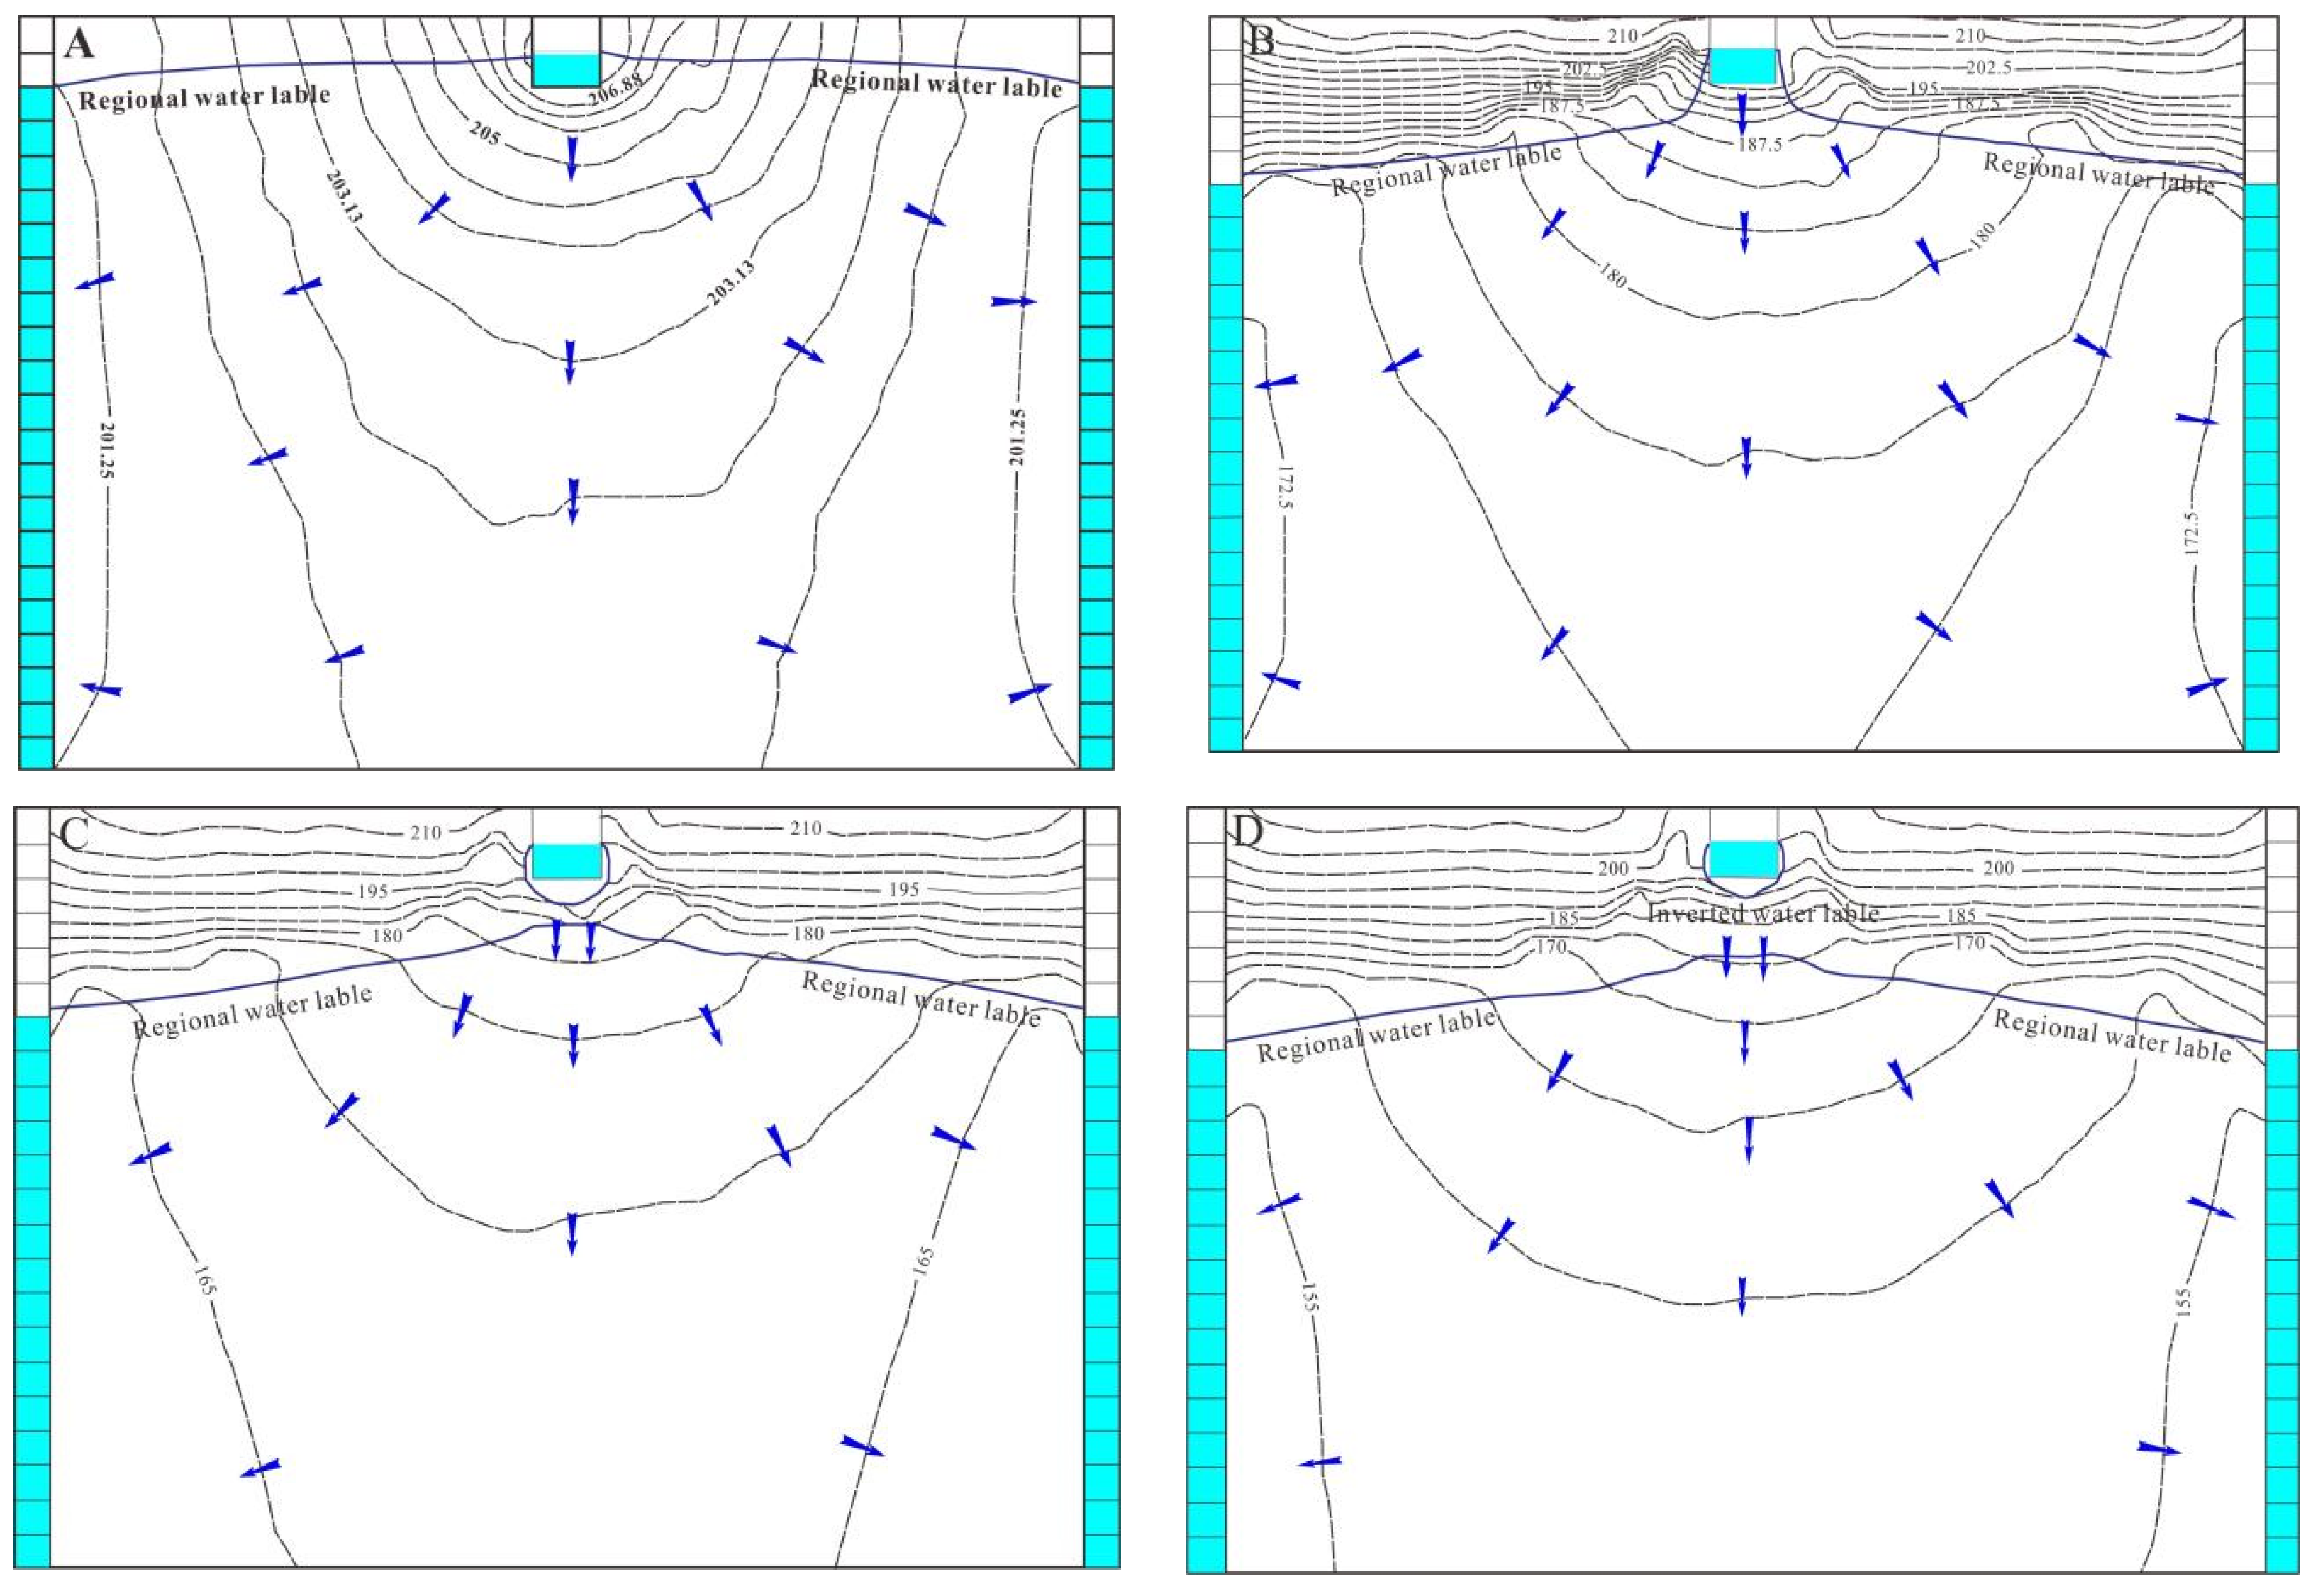
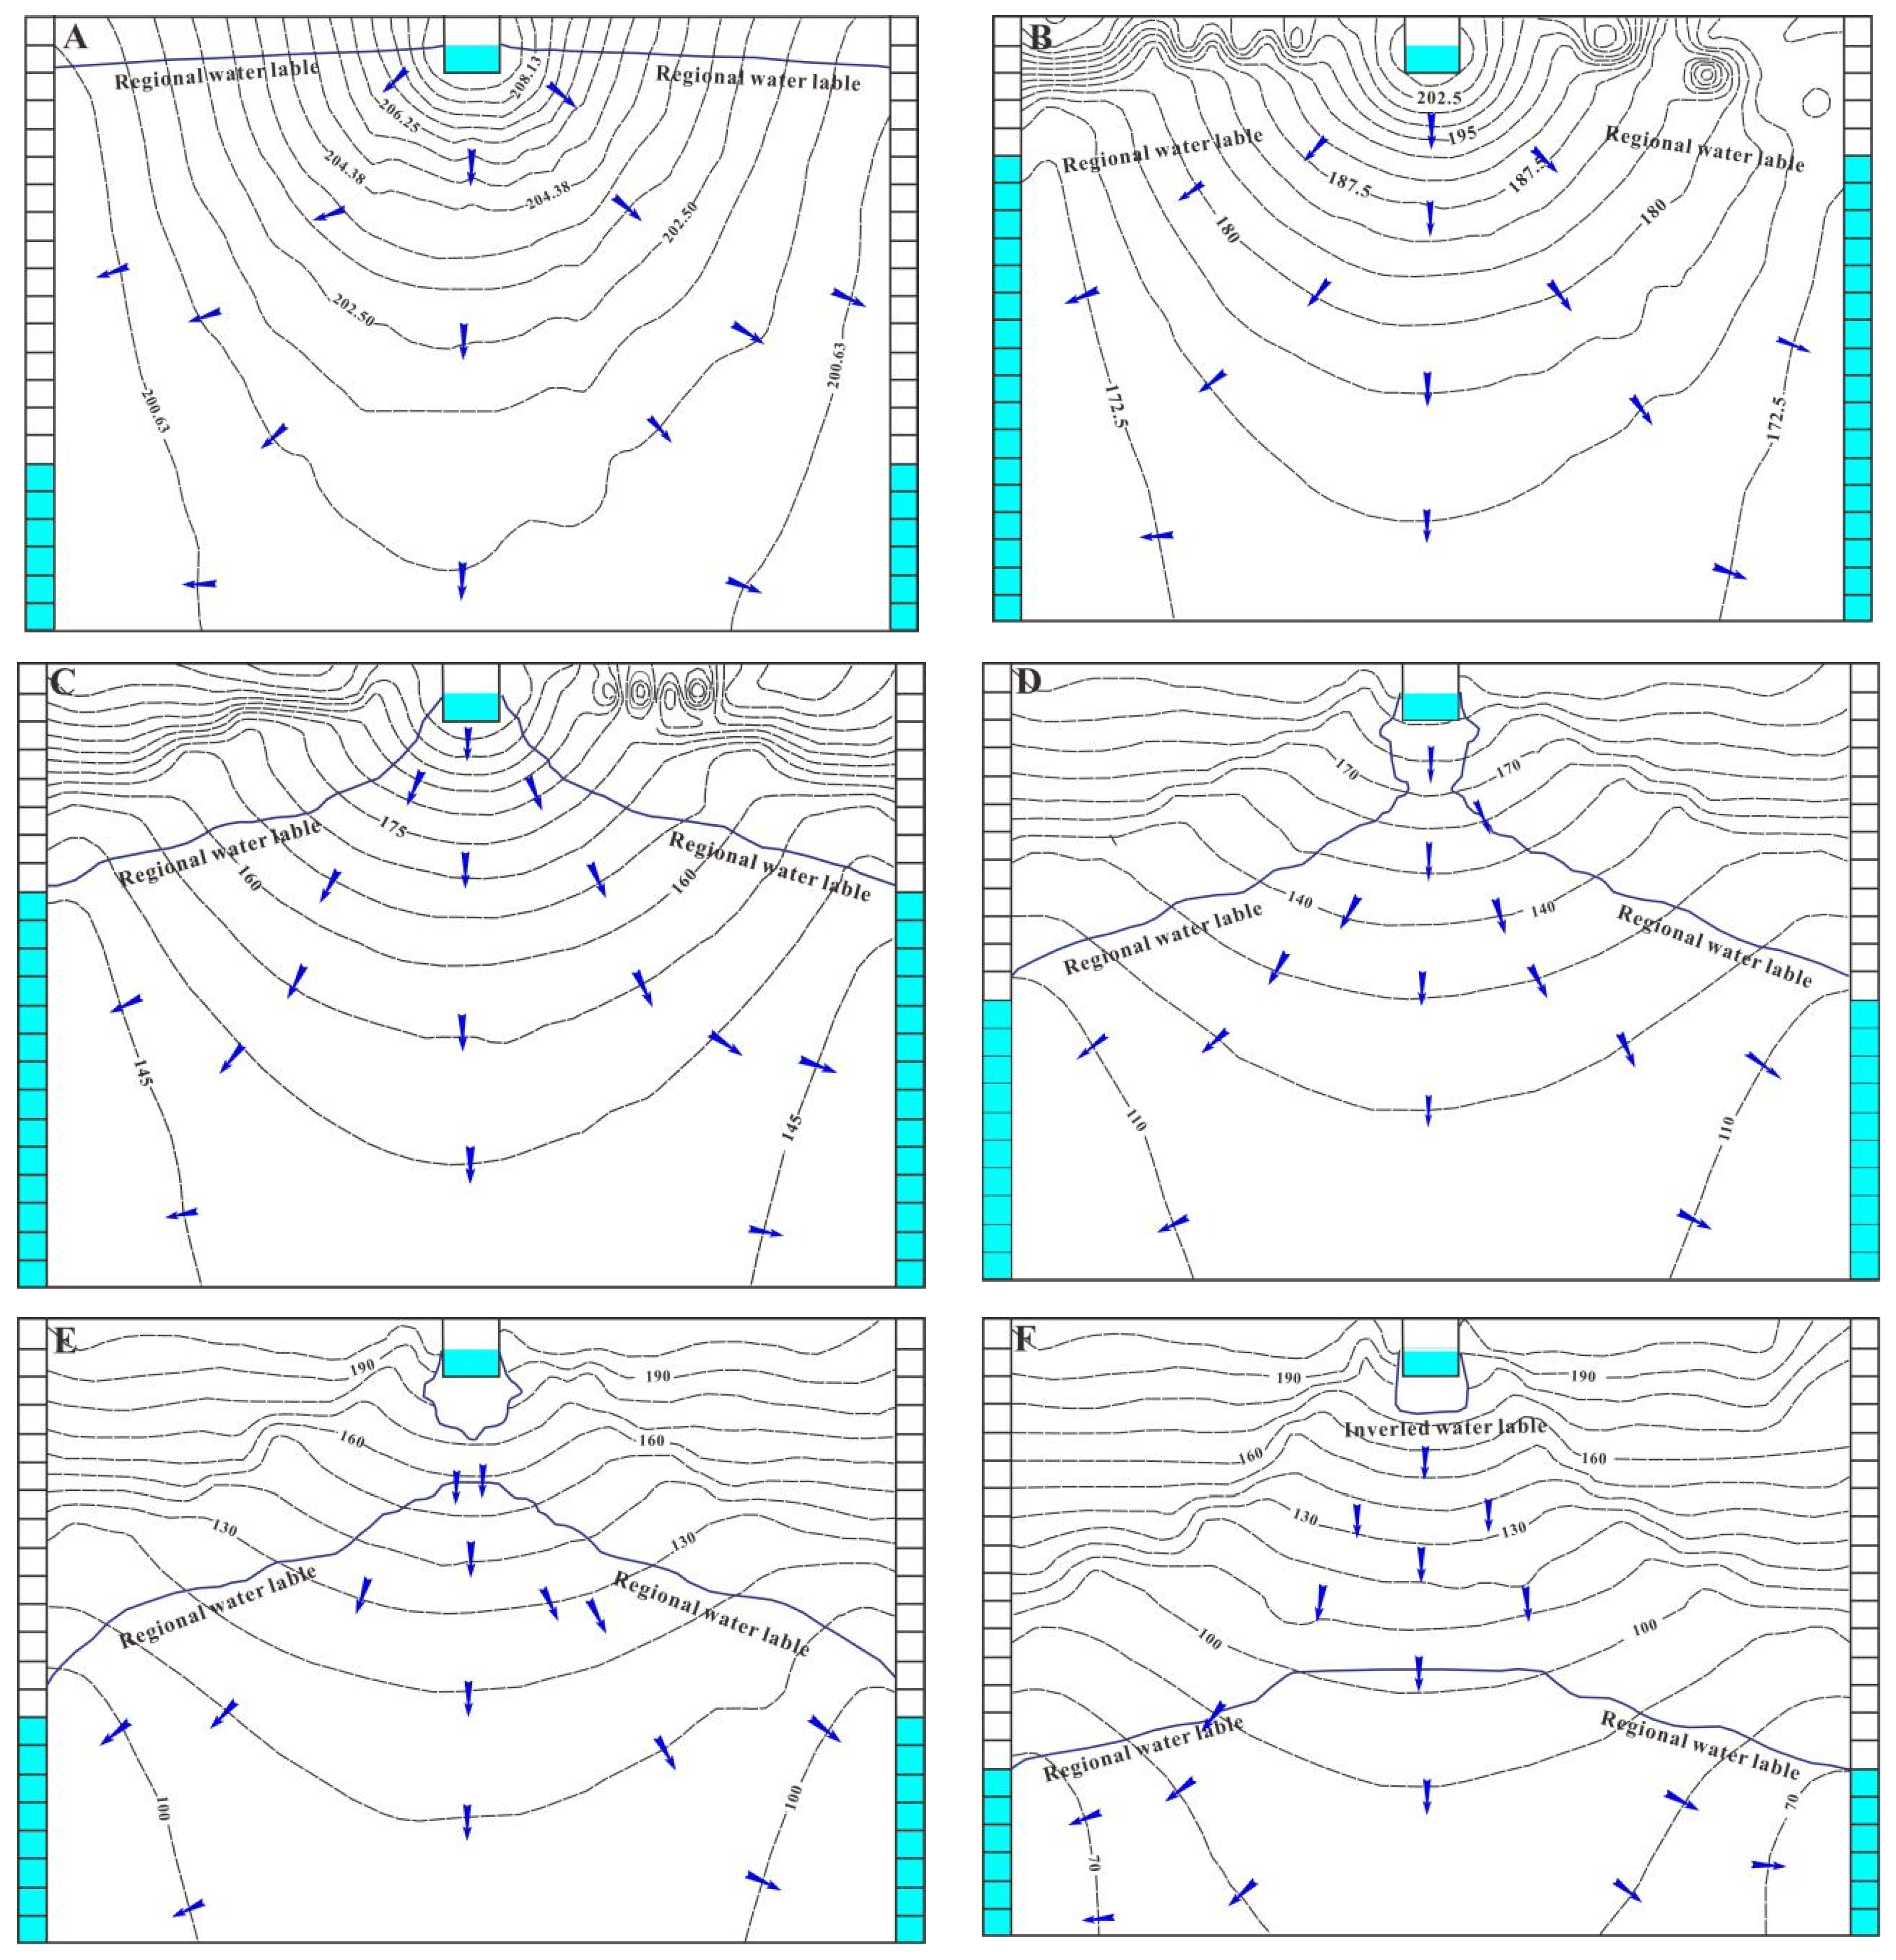
Figure 3 shows the results of the sandbox experiment under sand C and a river water depth of 18.5 cm. Under a high discharged water level, the river and groundwater showed a uniform water table curve and a hydraulic connection under saturated conditions was maintained between them, with river water directly recharging groundwater. A decline in the level of discharge water to 140 cm resulted in the water table curve shrinking to the lower part of the river, with a tendency towards breaking the hydraulic connection. This result indicates that the relationship between the river and groundwater entered a disconnected transition stage. The hydraulic connection between groundwater and river water was lost at a discharge level of 130 cm, resulting in the formation of an inverted saturated zone with a thickness of 15–20 cm. However, the thickness of the inverted saturated zone stabilized with continuing reduction in the discharged water level.
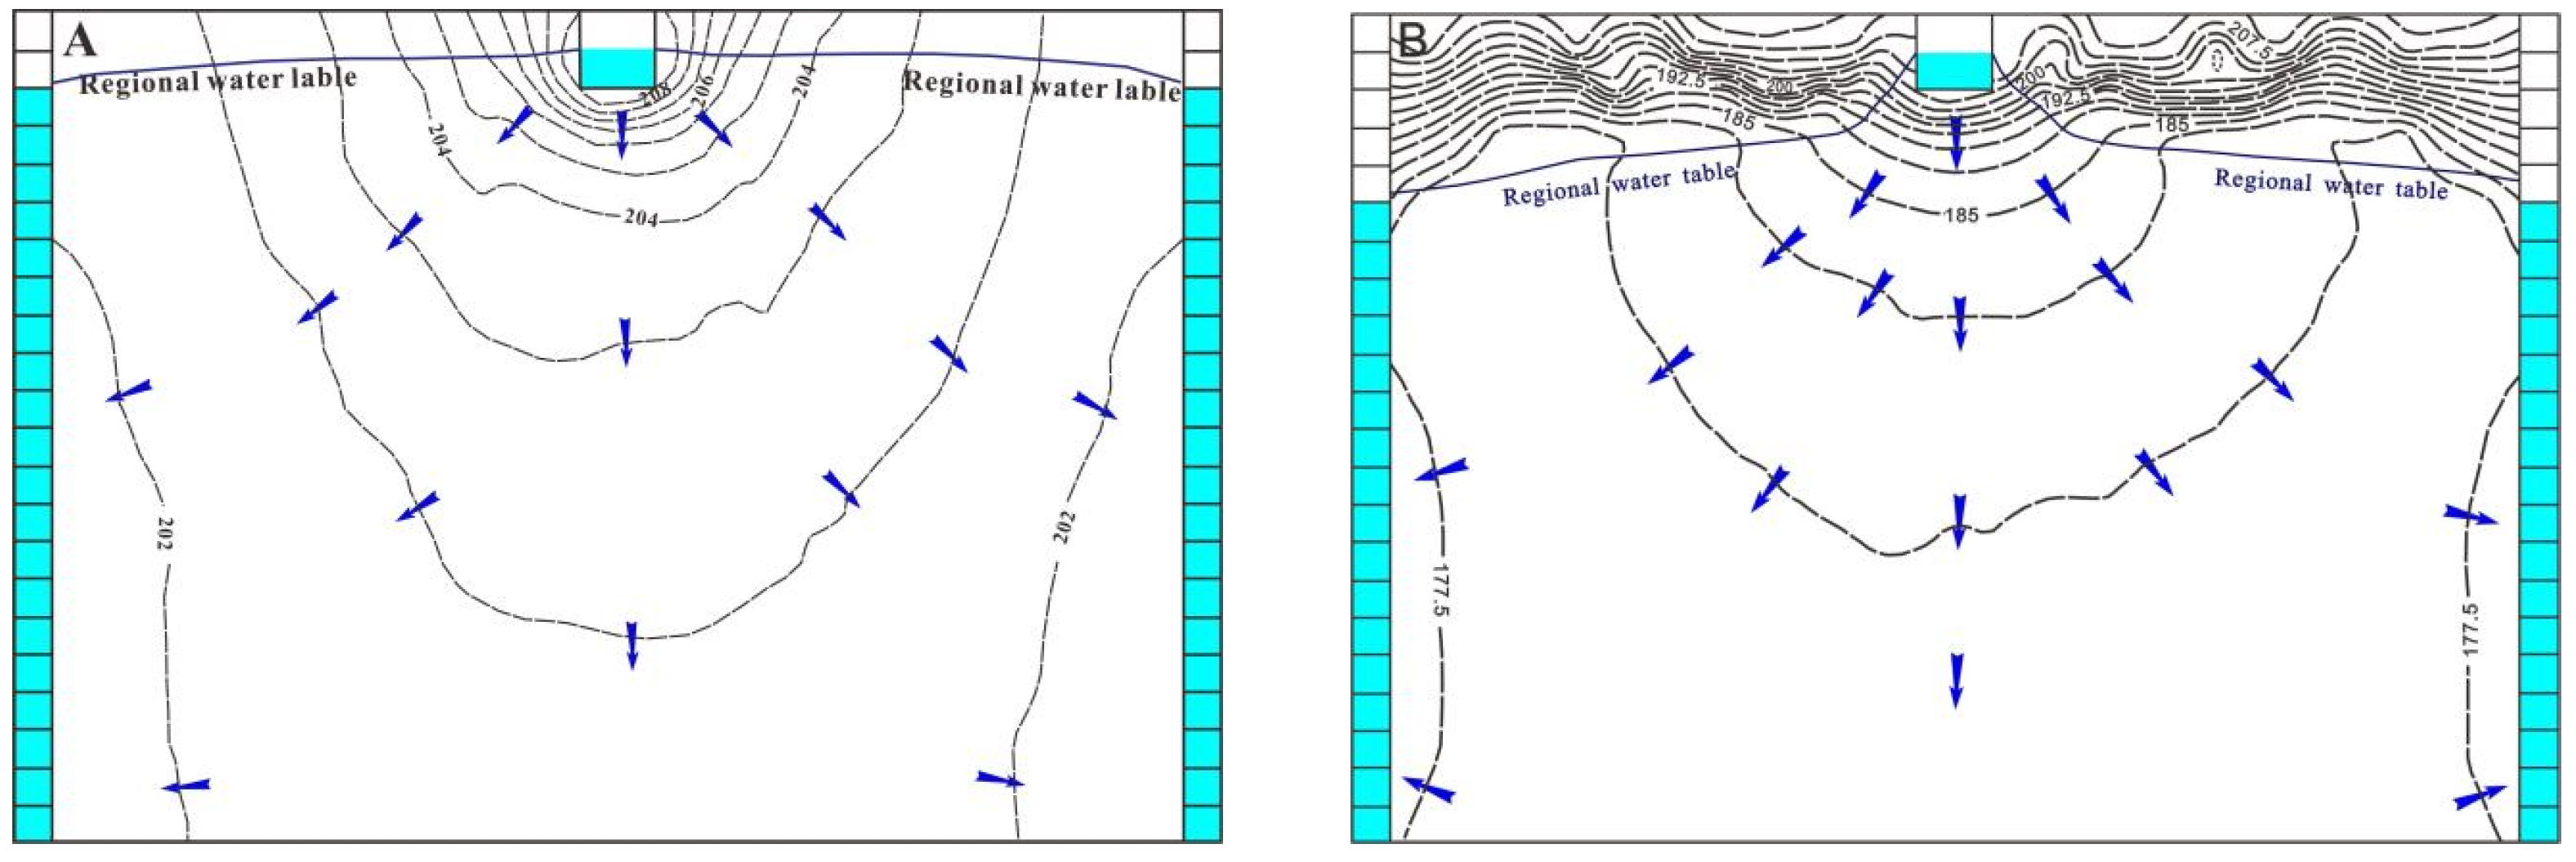
The river level controller was adjusted to reduce the river water depth to 10 cm, after which the experiment was repeated. The results are shown in Figure 4. In general, the hydraulic connection between river water and groundwater gradually weakened with a declining level of discharged water. There was a clear bend in the water table curve when the level of water discharged reached 160 cm, indicating a trend of disconnection of the hydraulic connection. There was a complete disconnect between river water and groundwater at a level of discharged water of 150 cm. An inverted water-saturated zone with a thickness of 5–10 cm was formed directly below the riverbed.
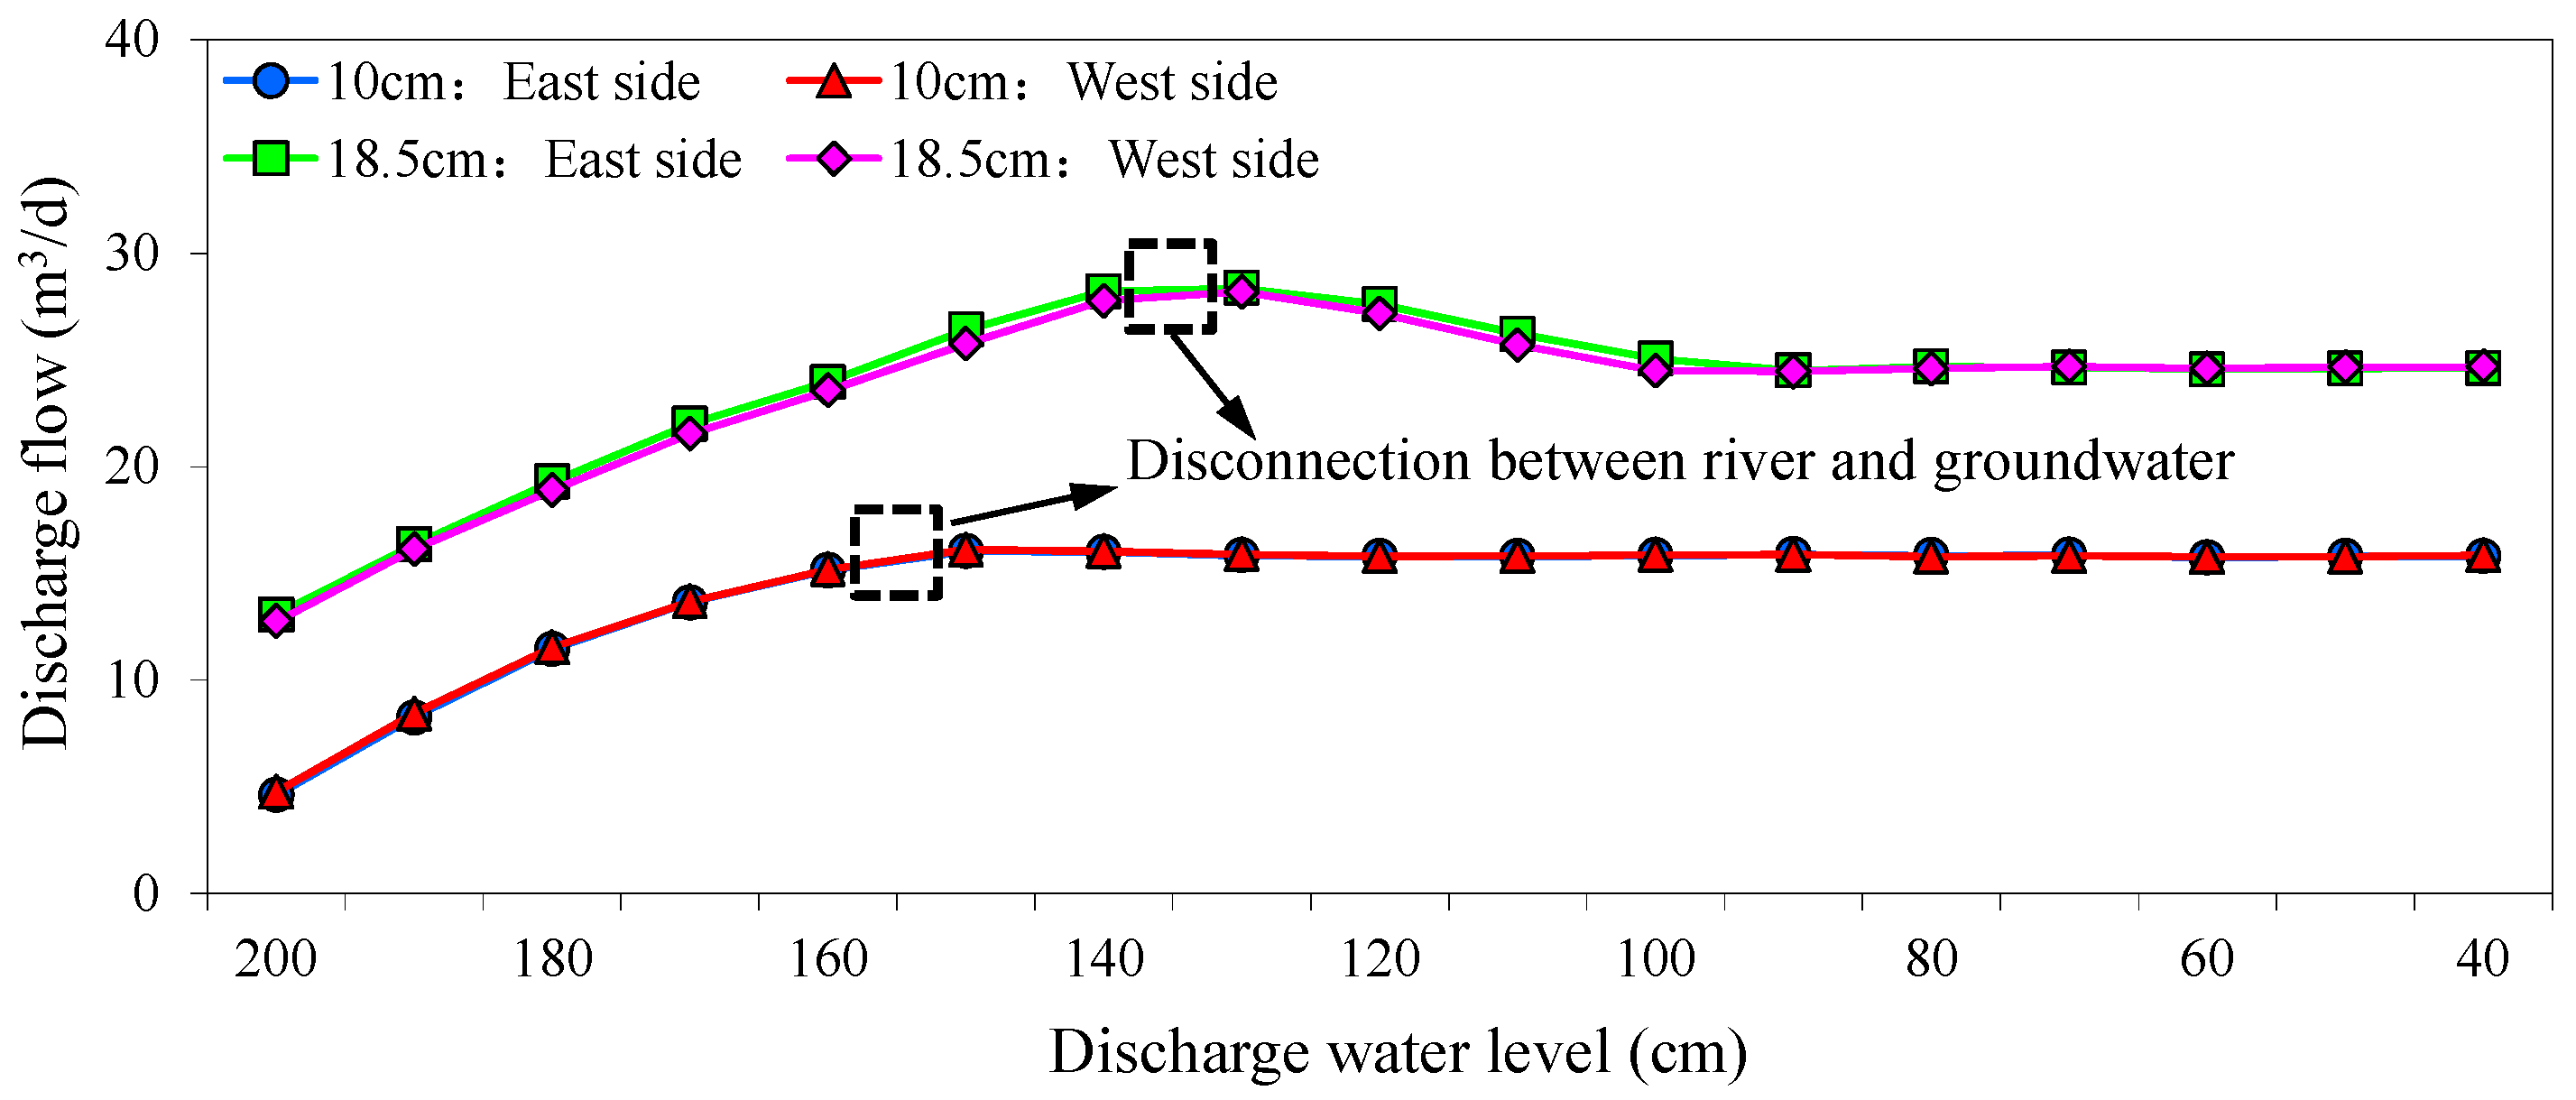
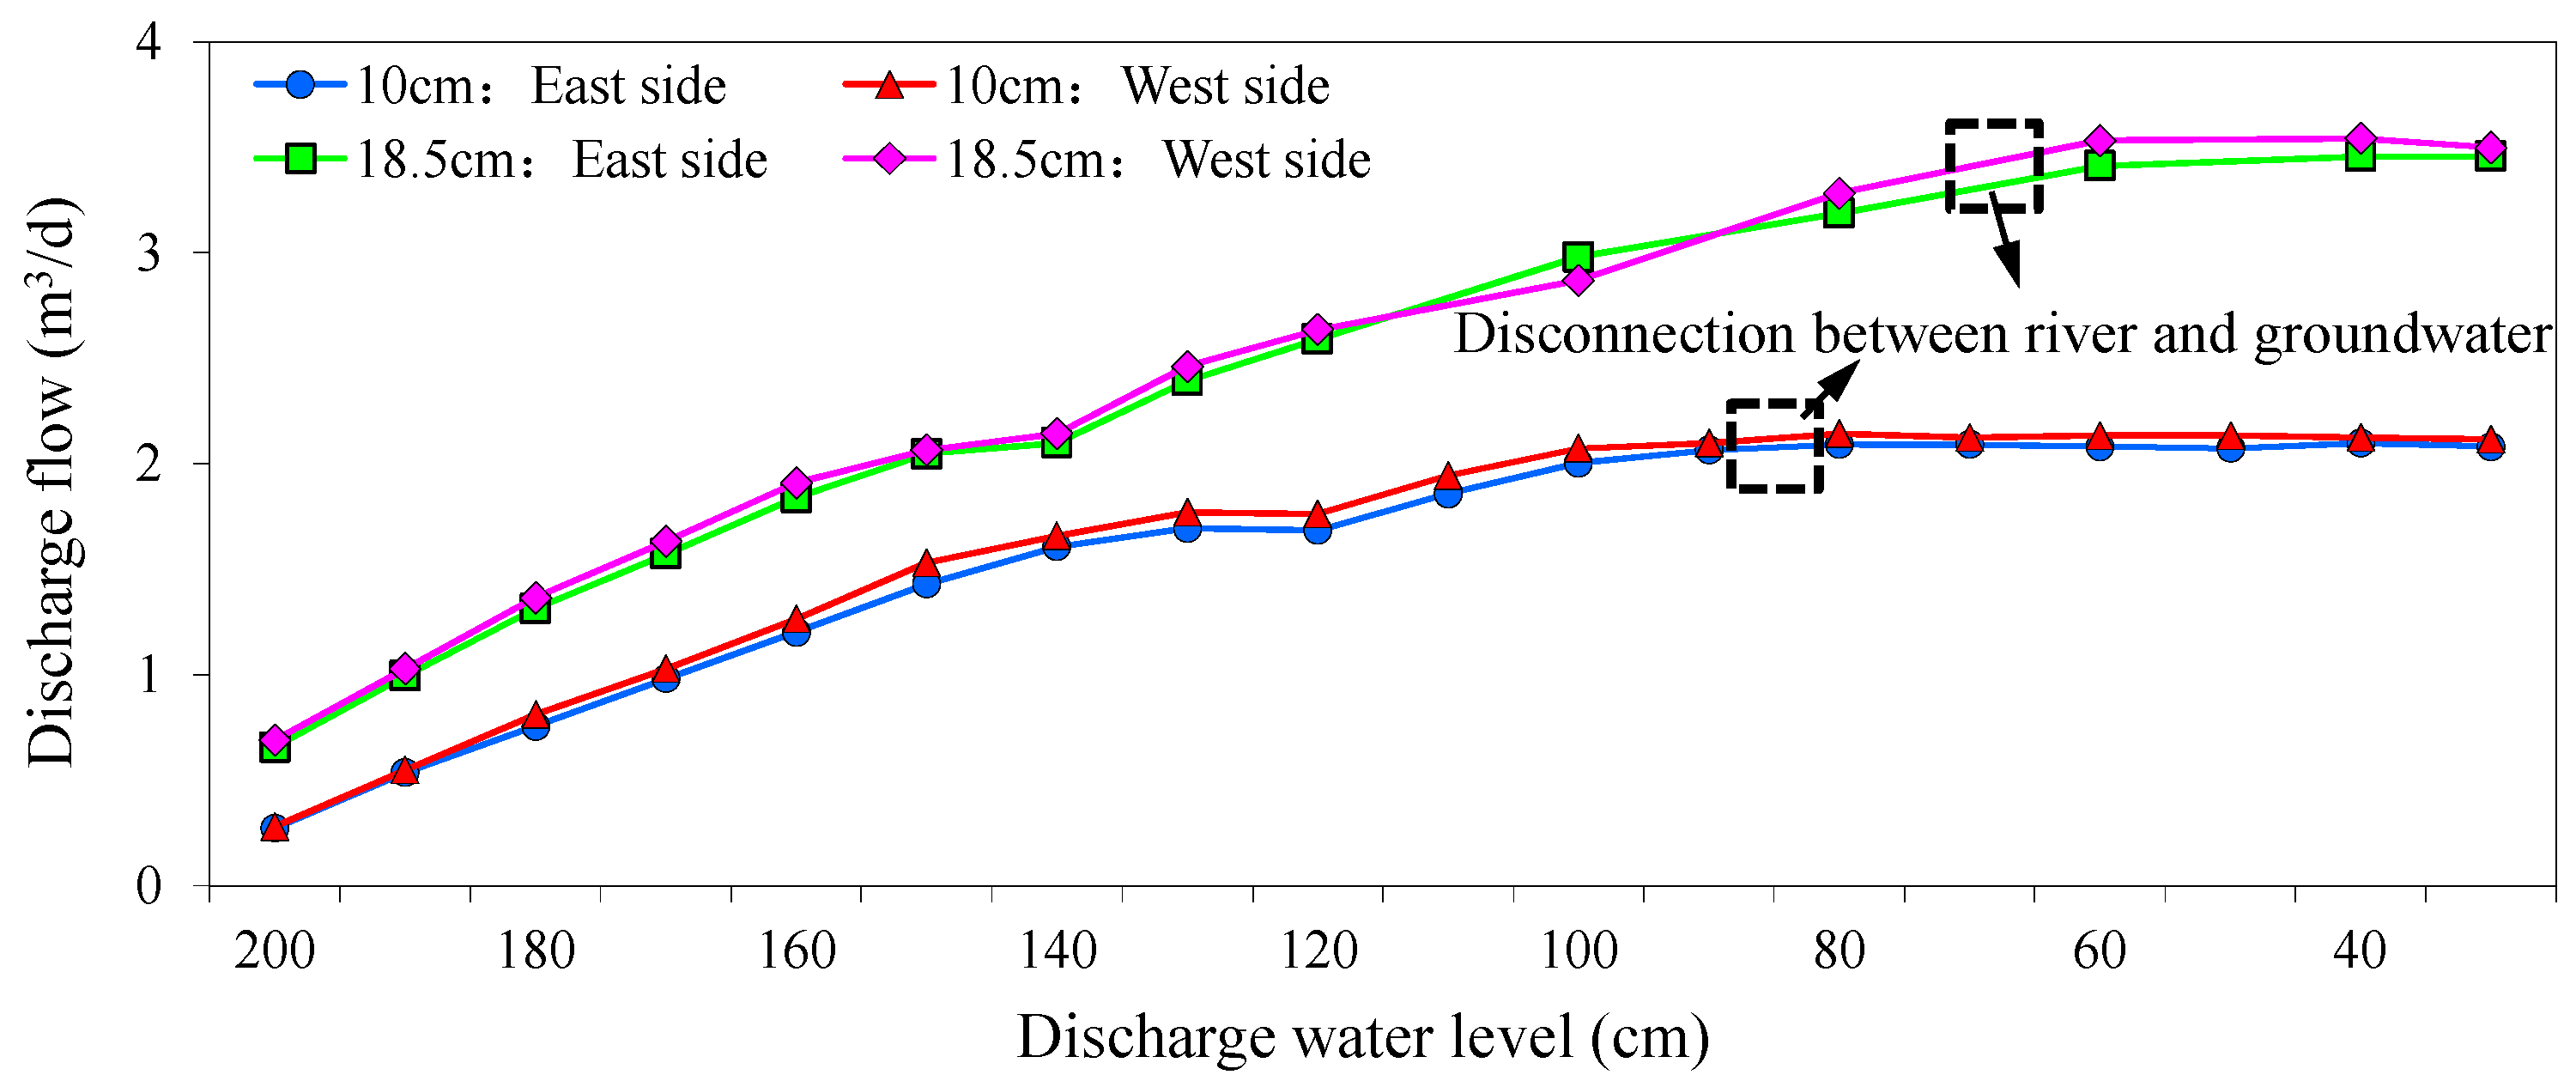
As shown in Figure 5, discharge flow during stabilization was measured on both sides of the sandbox. The discharge flow under a river depth of 18.5 cm clearly exceeded that under a depth of 10 cm. This indicates that discharged flow showed a positive relationship with river depth. The discharged flow on both sides of the sandbox increased continuously with a decreasing level of discharged water under a hydraulic connection between the river and groundwater under saturated conditions. However, the discharged flow showed a slight decline followed by stabilization when this hydraulic connection was broken. This result indicates that recharge of groundwater by river water reaches a maximum after the hydraulic connection between the river and groundwater is broken.
3.2. Sand B
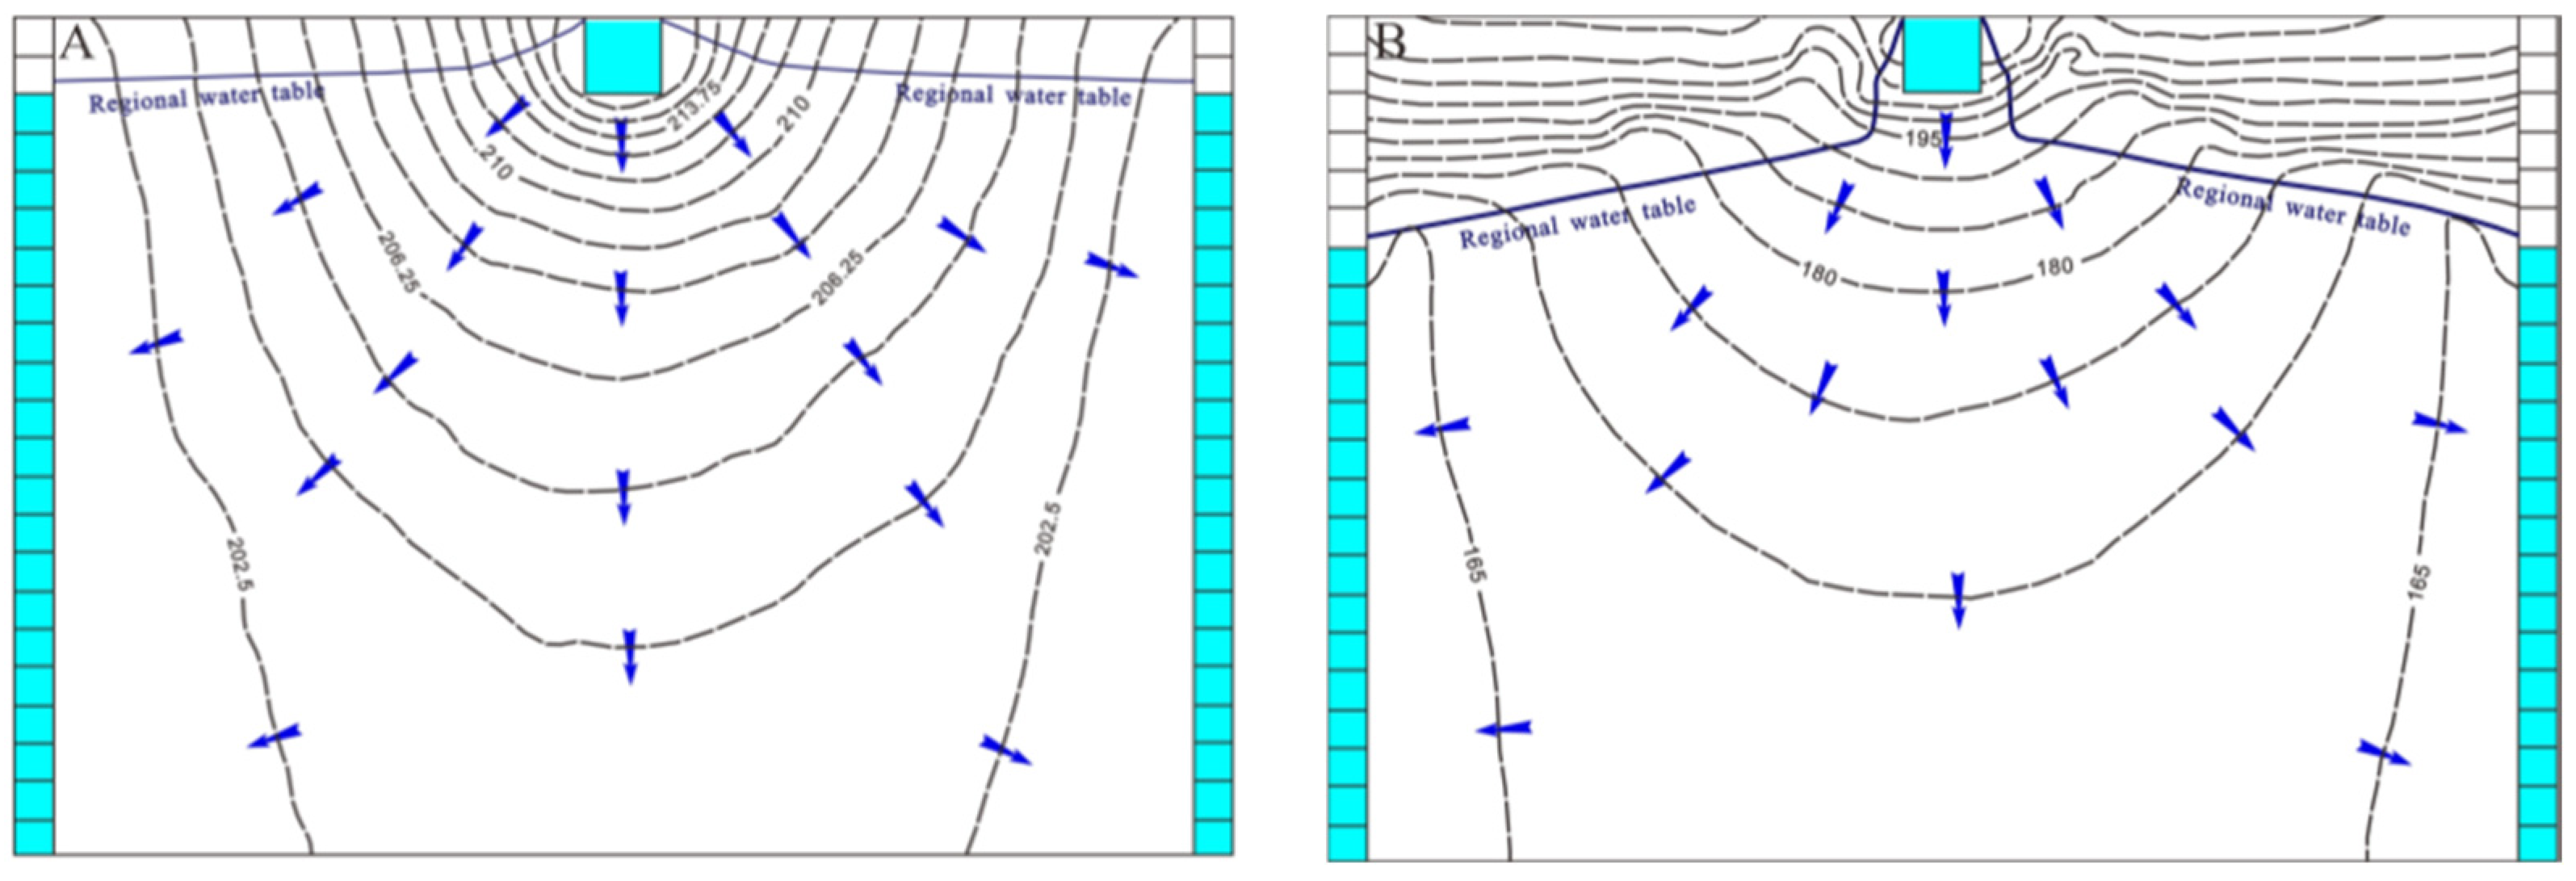
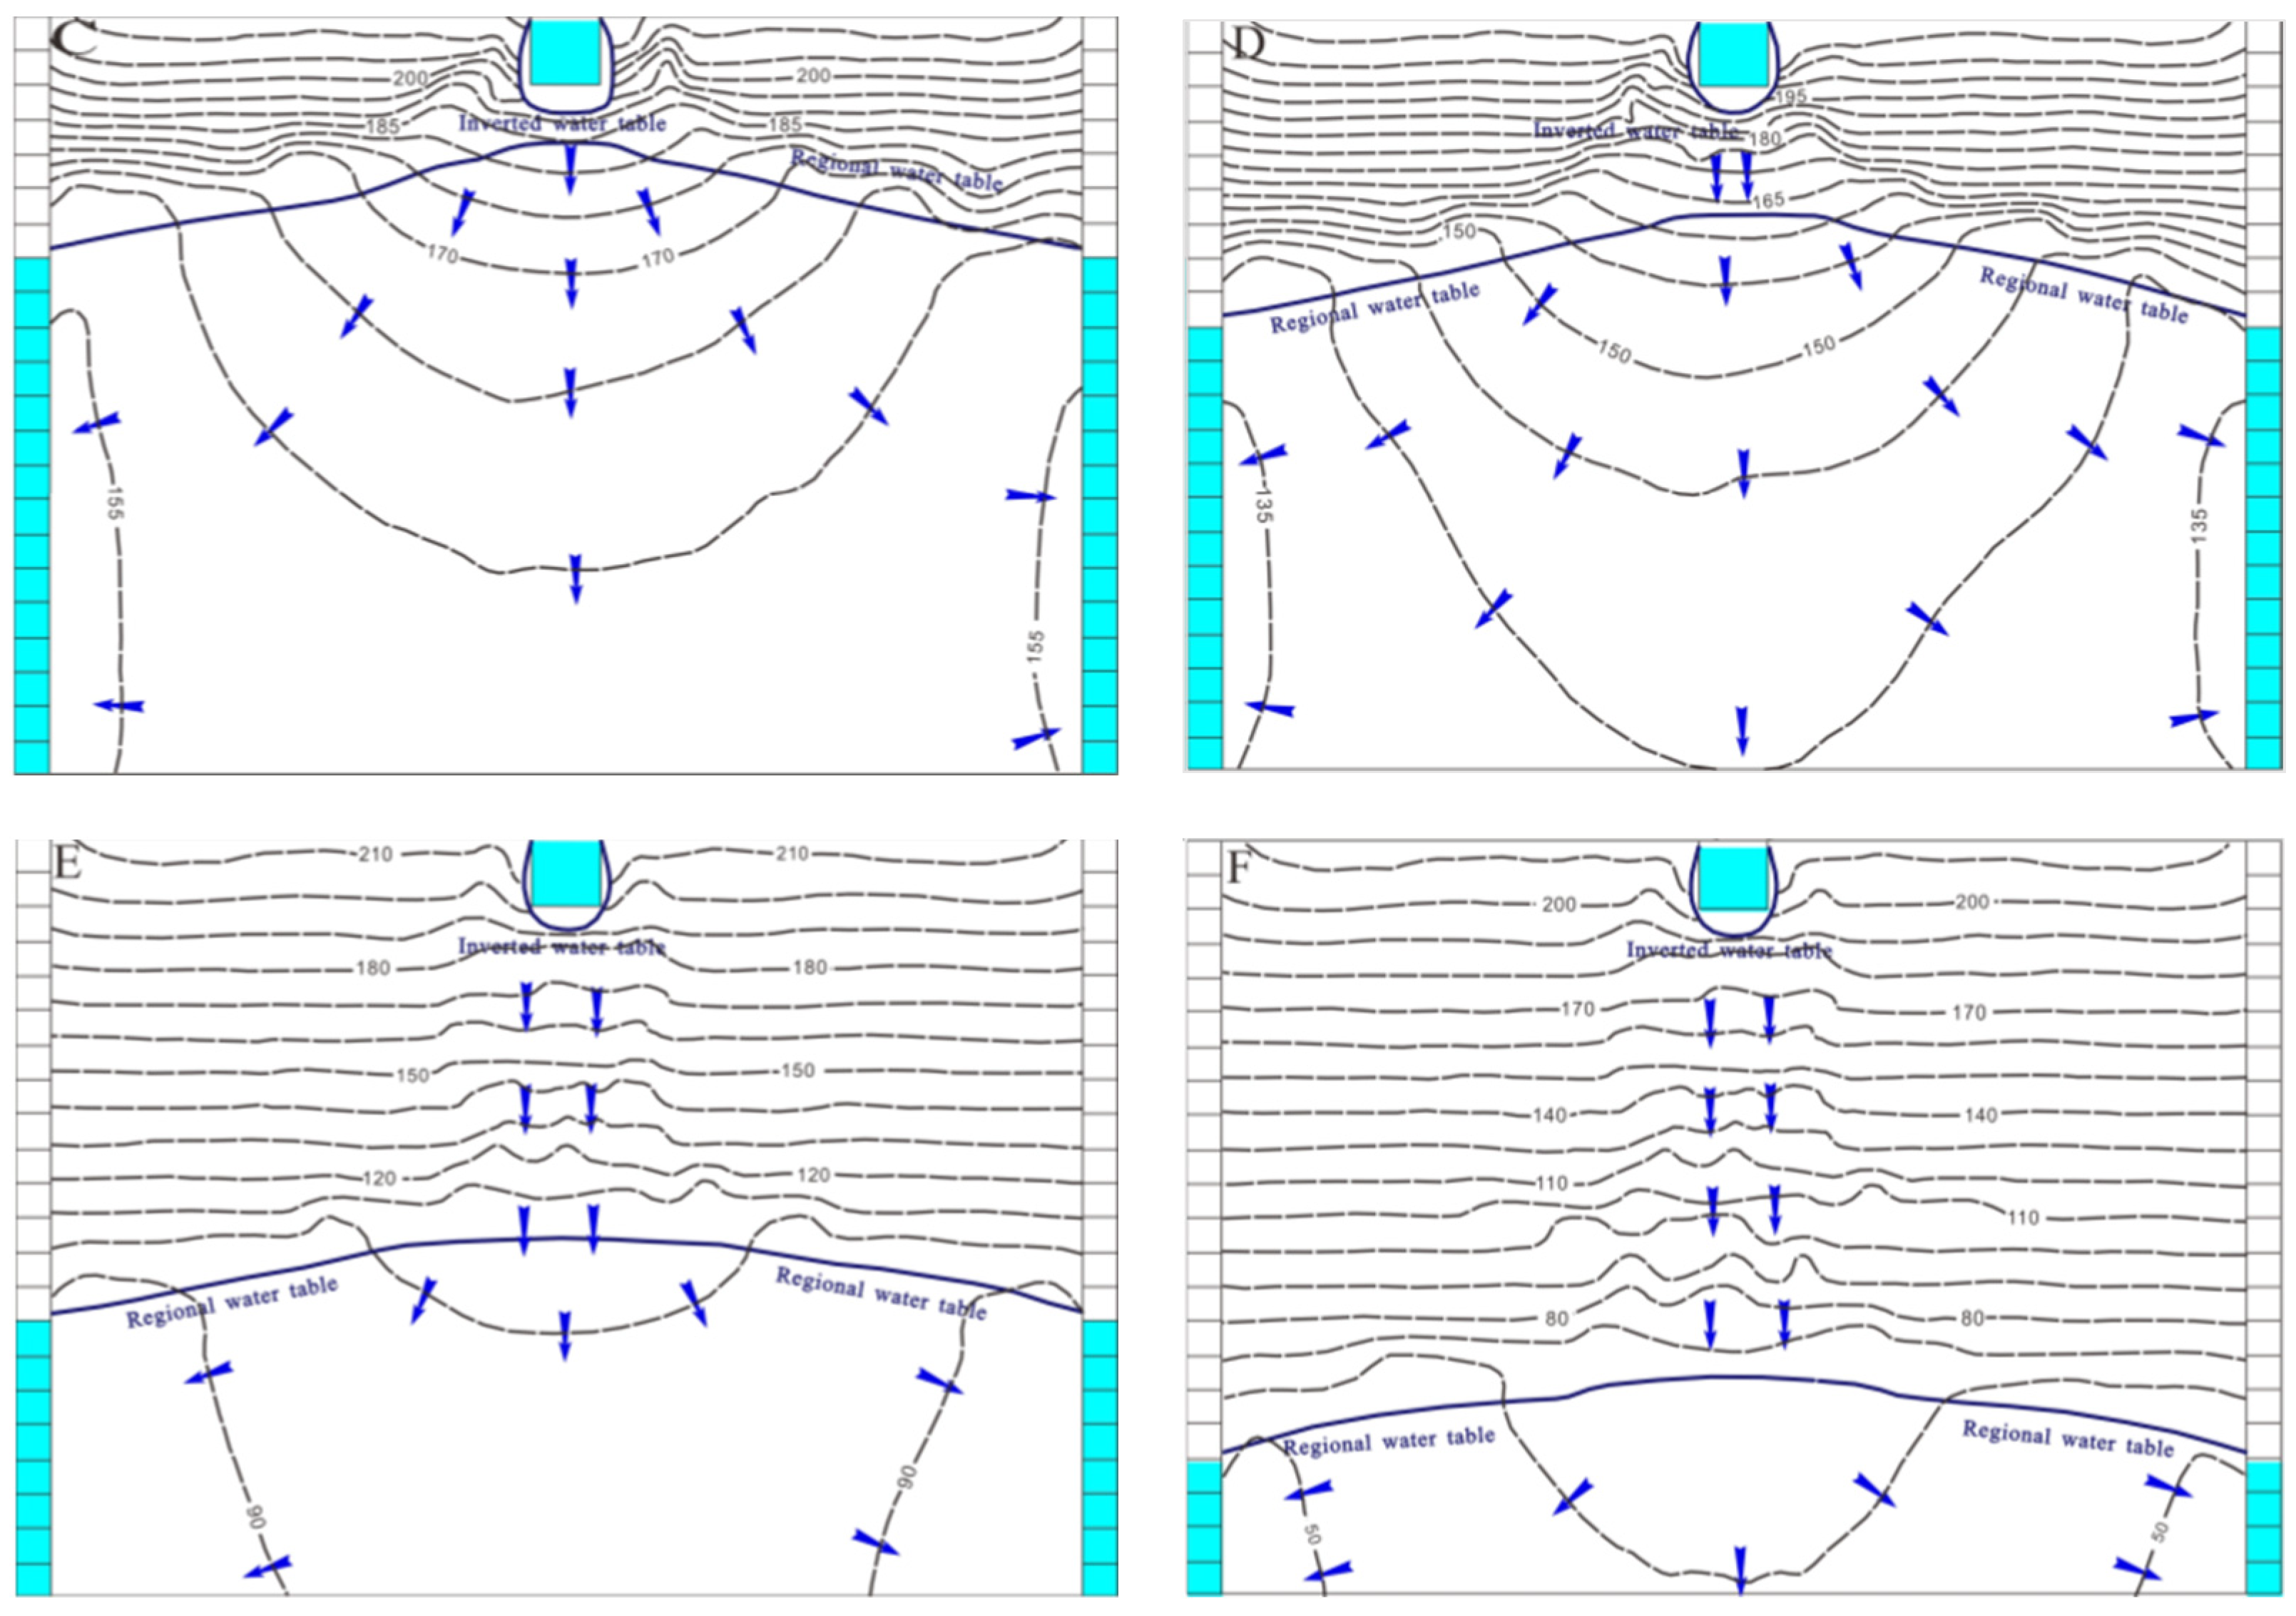
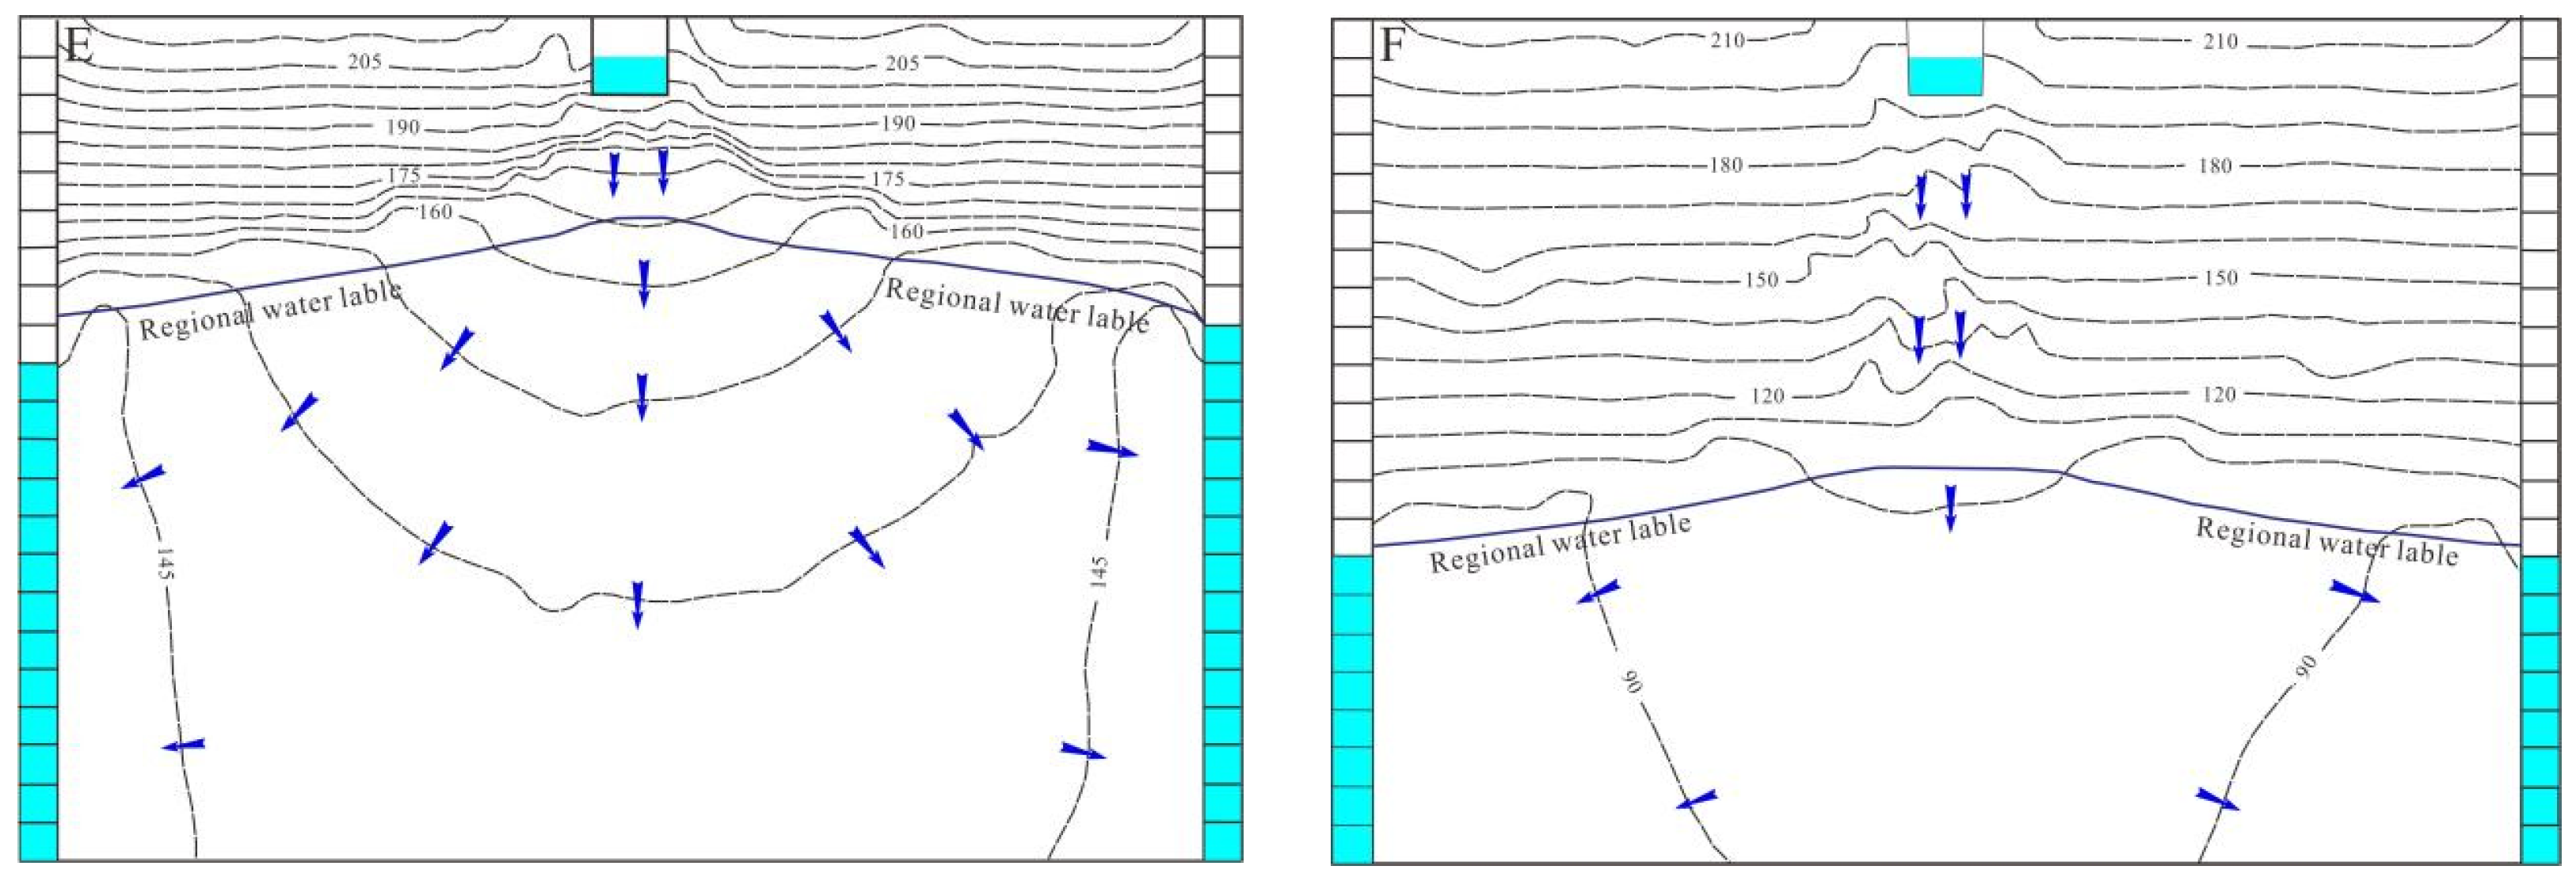
Figure 6 shows the results of the sandbox experiments under the aquifer medium sand B. When controlling the river water level at 18.5 cm, the hydraulic connection between the river and groundwater was maintained under a high level of discharged water, and the unsaturated zone only appeared on the left- and right-hand sides of the river at the upper part of the sandbox. The range of the unsaturated zone gradually expanded with a decline in the level of discharged water, and the water curve gradually extended to the lower part of the riverbed. The water table curve disconnected and the hydraulic connection between groundwater and the river was broken when the discharged water level was reduced to 150 cm. The thickness of the inverted saturated zone under the riverbed was 5 cm–10 cm. The size of the inverted saturated zone decreased slightly with the decline in the discharged water level to 140 cm. However, the maximum thickness of the inverted, saturated zone remained stabilized at 5–10 cm.
Reducing the depth of the river water to 10 cm resulted in the gradual loss of the connection between the river water and groundwater with a decreasing level of water discharge, and the connection finally breaking (Figure 7) at a discharge level of 160 cm. At the period of hydraulic disconnection, the thickness of the inverted saturated zone was 5–10 cm. However, the size of the inverted saturation zone gradually decreased and disappeared within the continuing decrease in the level of discharged water. The size of the suspension-saturated belt could not be determined by the sandbox device (thickness of the suspension saturated belt < 5 cm) when the discharged water level reached 140 cm.
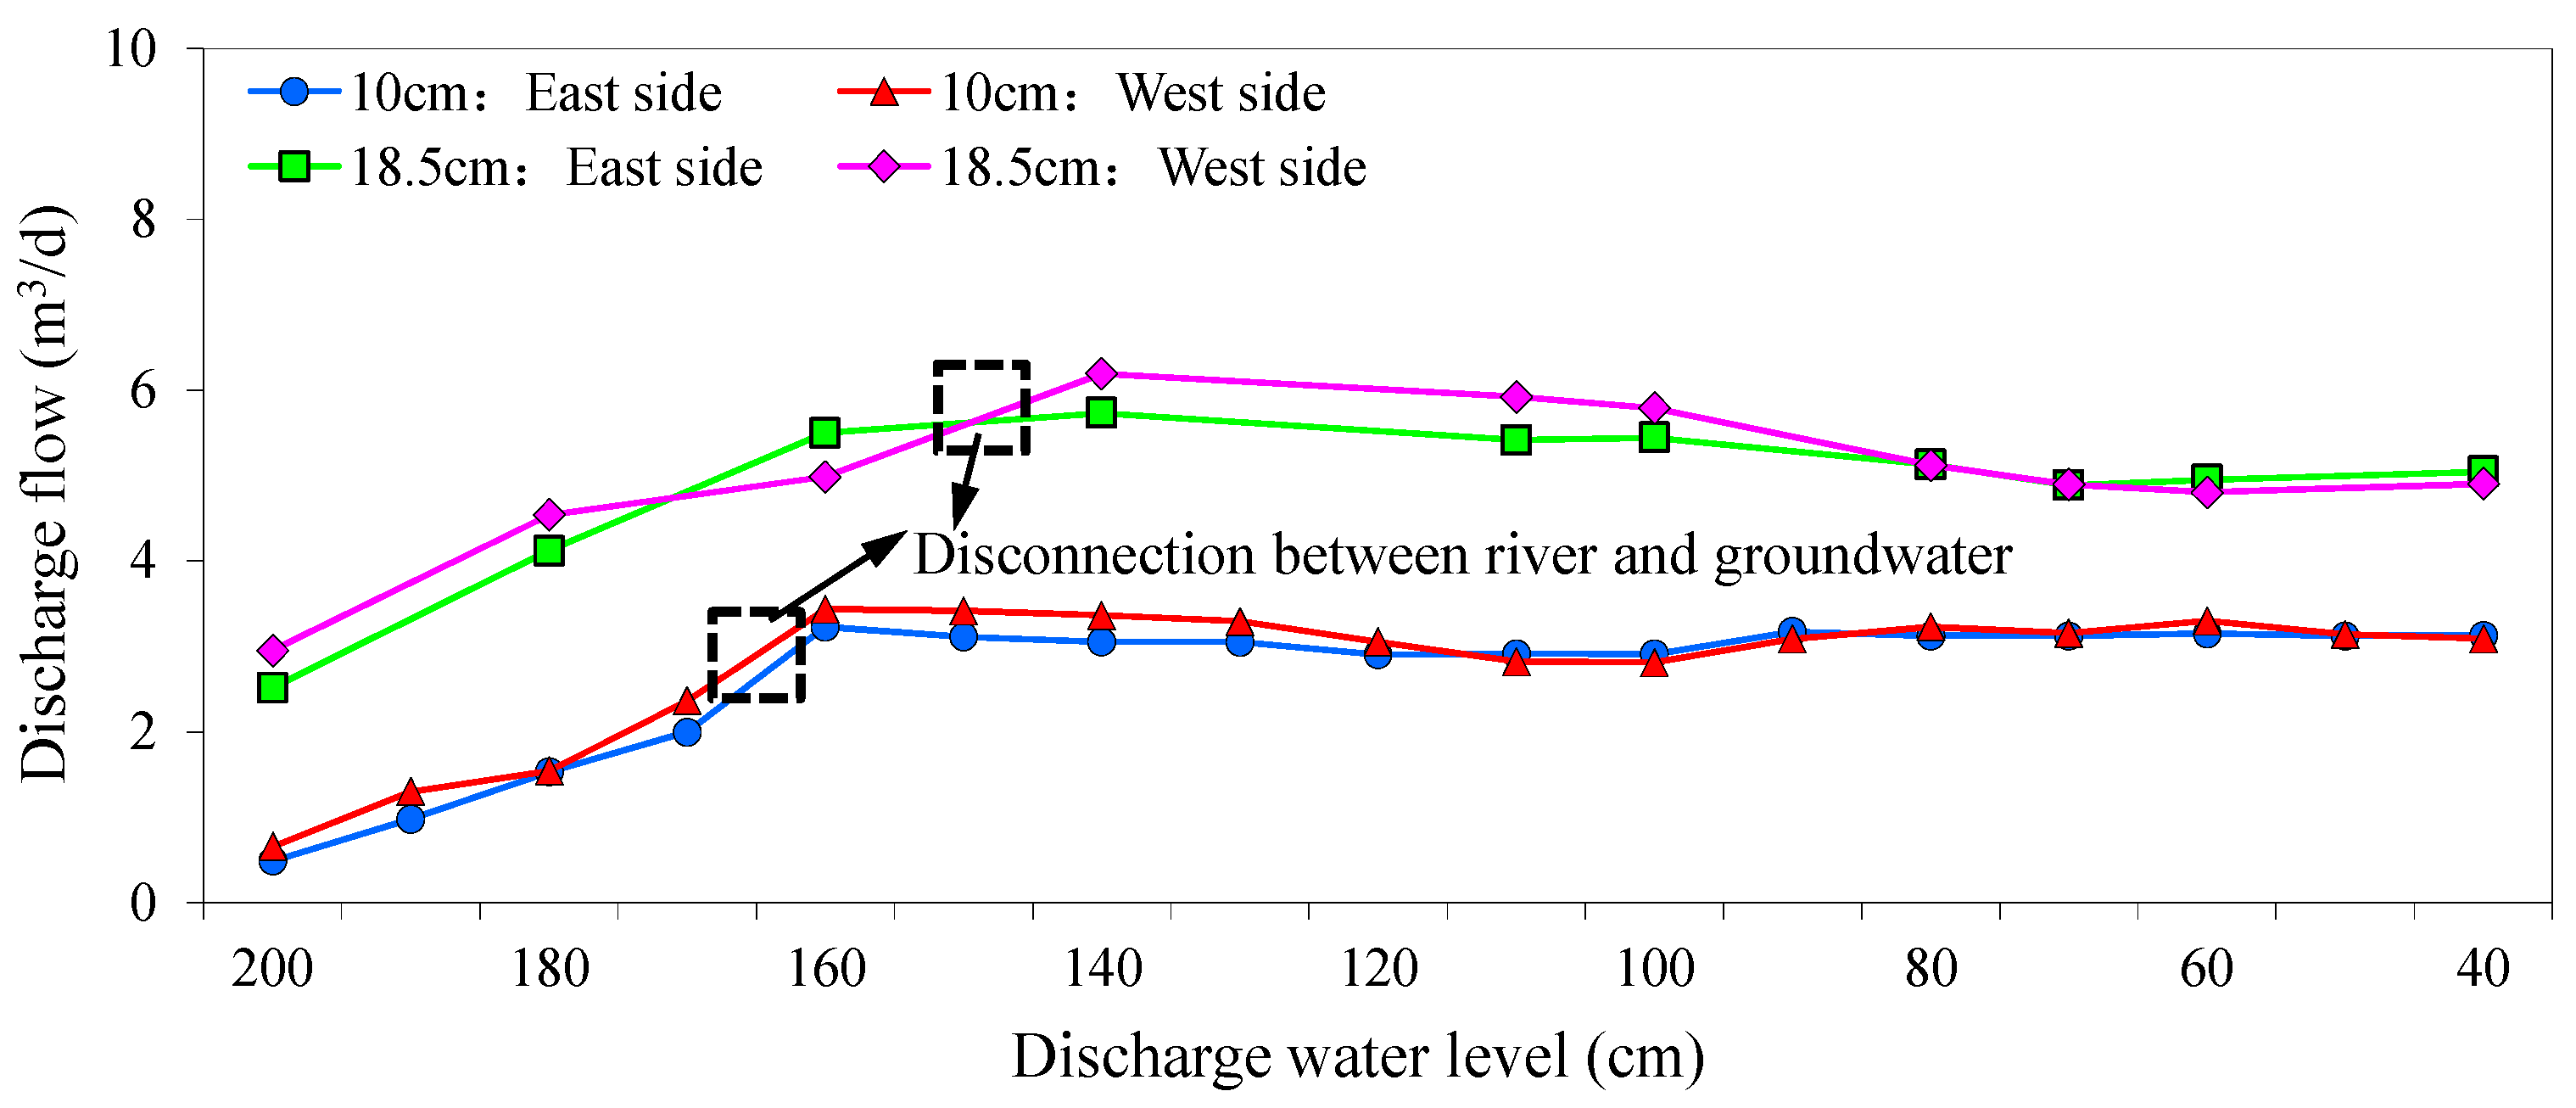
Figure 8 shows the relationship between discharge flow and discharge water level on both sides of the sand tank. The result indicated a gradual increase in discharged flow on both sides with decreasing discharged water level. The discharged flow eventually reached an extreme value, at which point the hydraulic connection between the river water and groundwater was broken. After this, the level of discharge continued to decline, whereas the discharged flow decreased and stabilized. In addition, under the same discharged water level, there was a positive correlation between the depth of river water and the discharge.
3.3. Sand A
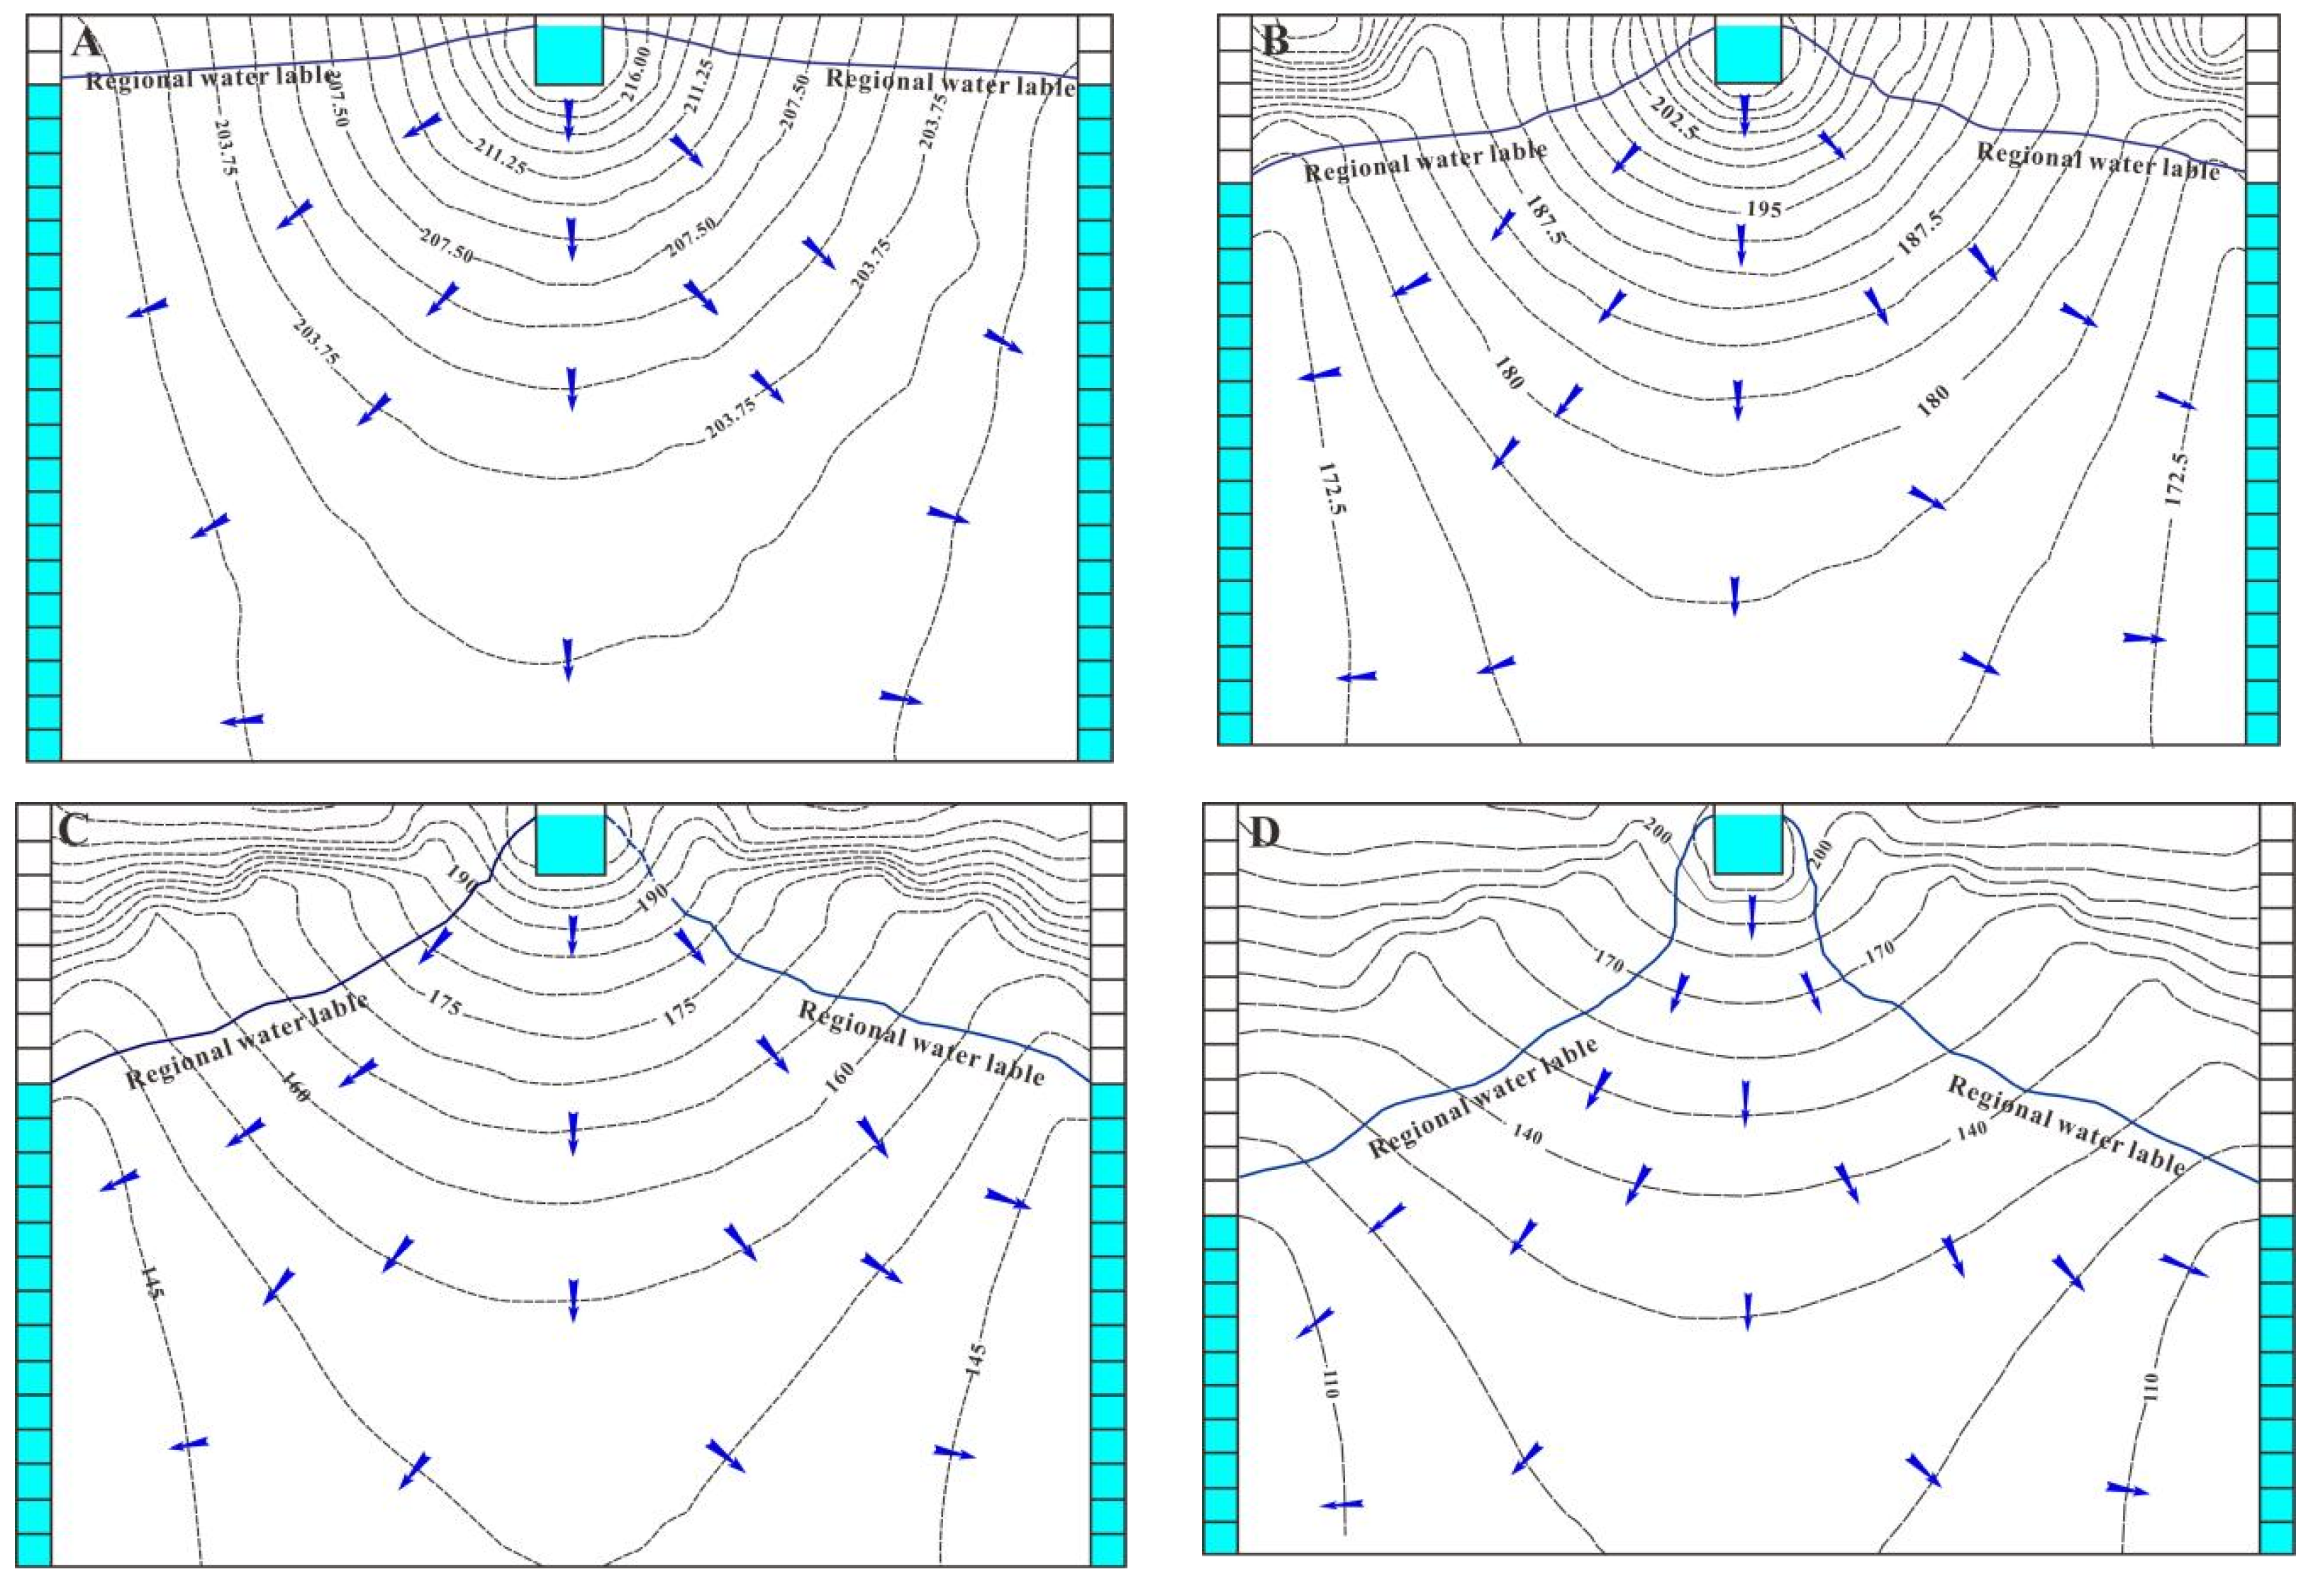
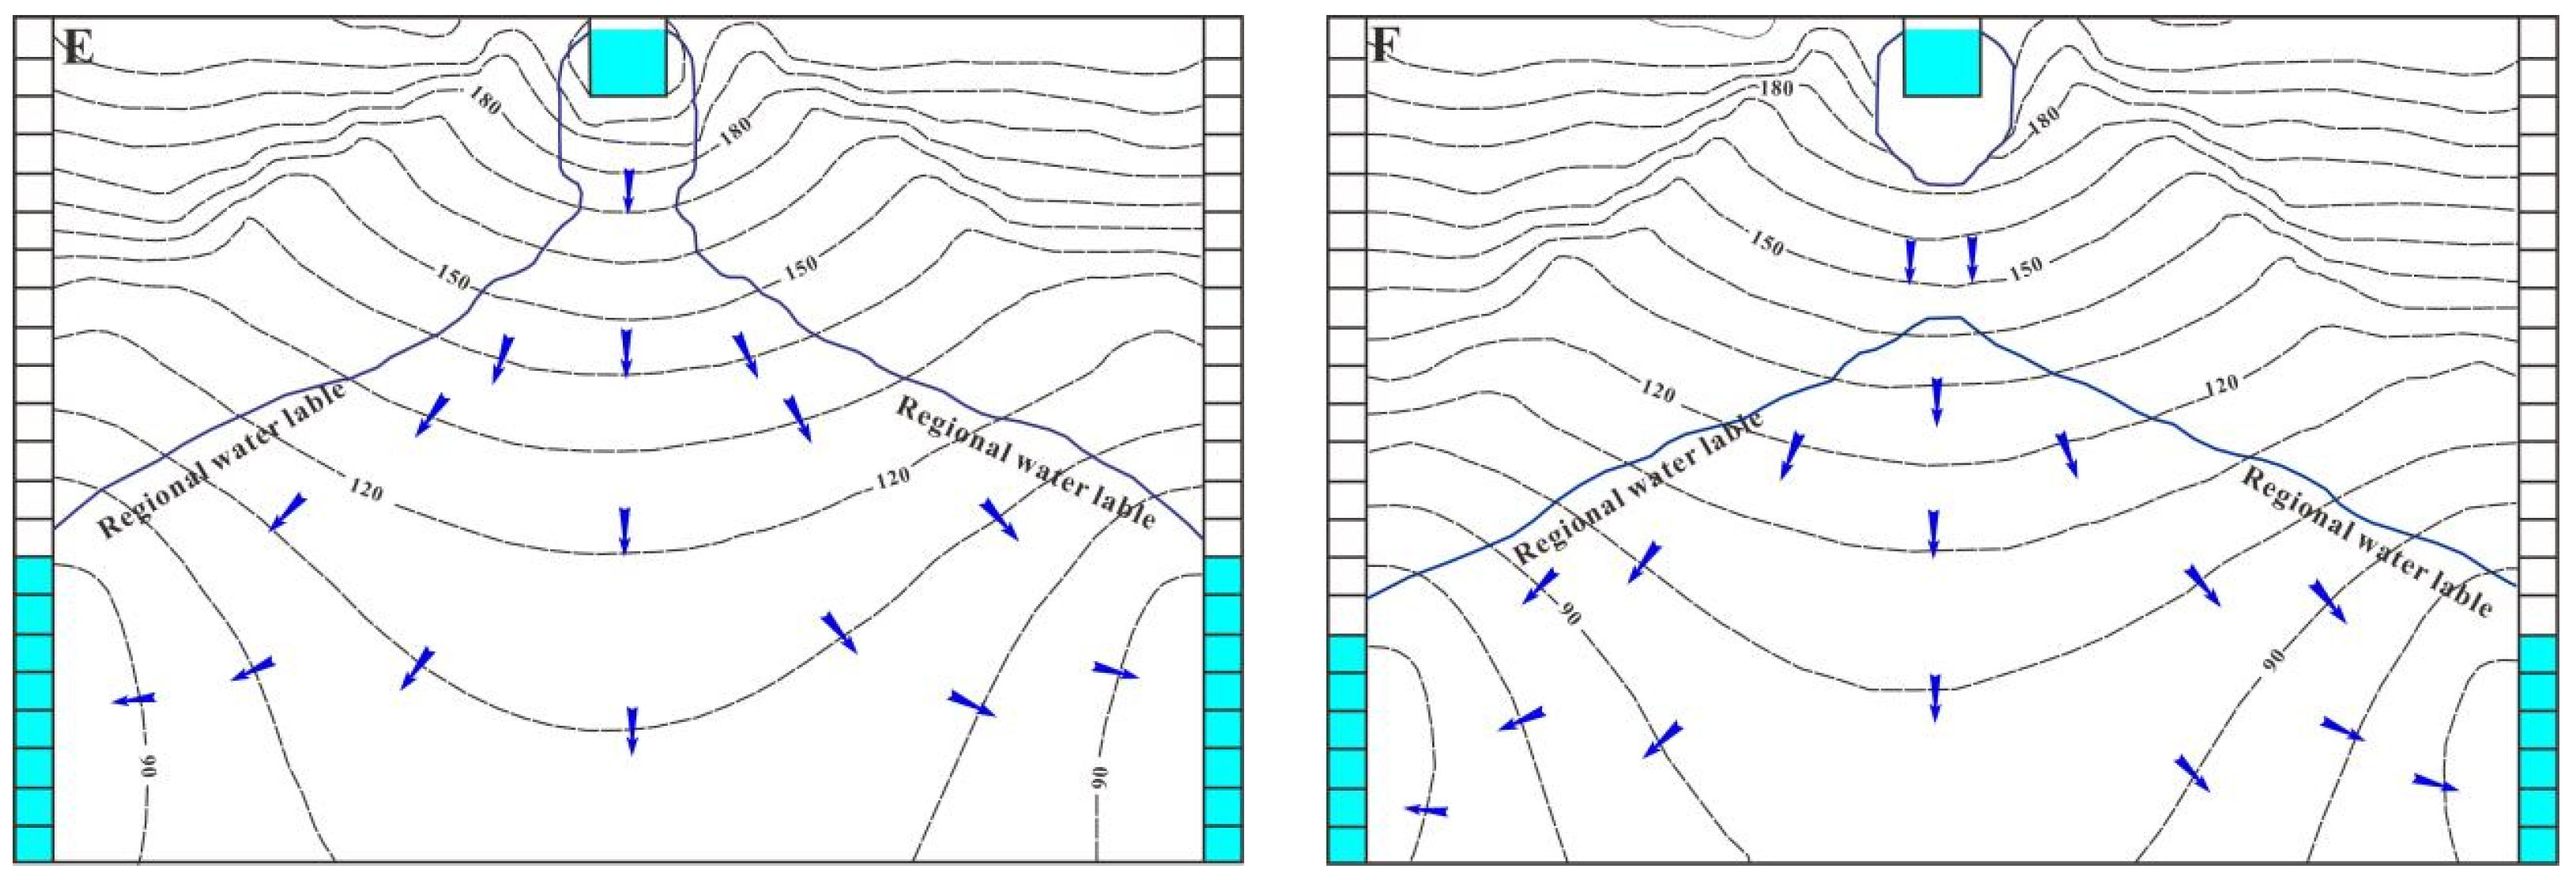
Figure 9 shows the results of the experiment under water-bearing medium sand A and a river water depth of 18.5 cm. The results were consistent with those under sand B and sand C. Under a high level of discharged water, the hydraulic connection between the river and groundwater was maintained and a unified water table curve was noted. The range of the unsaturated zone gradually increased with a decreasing level of discharged water, and gradually expanded directly below the riverbed. The water table curve in the lower part of the riverbed showed clear shrinkage and narrowing when the drainage water level reached 80 cm and the hydraulic connection showed a weakening tendency. The hydraulic connection between the river and groundwater was in a state of transition. The river and groundwater no longer showed a uniform water table curve as the level of discharged water continued to decline to 60 cm, and the hydraulic connection was broken. An inverted saturated zone was then formed under the riverbed with a thickness of 15–20 cm.
Under a river water depth of 10 cm and a level of discharged water exceeding 140 cm, the hydraulic connection between the river and groundwater was maintained and the unsaturated zone only appeared on the left- and right-hand sides of the river (Figure 10). The scope of the unsaturated zone gradually increased with a continuing decline in the level of discharged water. The water table curve under the riverbed began to contract when the level of discharged water dropped to 140 cm. This result indicated that there was a weakening of the hydraulic connection between the river water and groundwater. This hydraulic connection was broken when the level of discharged water reached 90 cm; the water table curve was disconnected, and an inverted saturated zone was formed under the riverbed. The thickness of the inverted saturated zone was then 20 cm–25 cm (Figure 10). However, the size of the inverted saturated zone changed with a continued decline in the level of discharged water, decreasing to 10 cm–15 cm. The level of discharged water continued to decrease, and the groundwater table gradually decreased. However, the size of the inverted water saturation zone stabilized.
Explain that the three different sand discharge water levels are different and irregular. During the experiment, under the steady state of stable river water depth and zero flow, the authors lowered the water tank with a constant water head on the east and west sides of the discharge water level by 10 cm each time and observed the suspended saturated water zone of the river and groundwater surface, until the suspended saturated zone of the river becomes “disconnected” from the groundwater surface, i.e., loses hydraulic connection. Next, the discharge water level was increased to speed up the experiment, dropping 40 cm each time and observed the connection between the saturated water zone of the river and the groundwater surface. Take Sand B as an example; when the river water depth is 18.5 cm and the stabilization time exceeds 1 h, the discharge water level (movable water tanks on the east and west sides) stabilizes at 200 cm for the first time, and the pressure measurement and discharge data connected to the sand box are read. The water level of the second discharge is stable at 190 cm, and the pressure measurement and discharge data are read again, and so on, until the movable water tanks on the east and west sides are stable at 160 cm, and the river suspension saturated zone and the groundwater surface are about to be disconnected, that is, the connection surface between the river and the groundwater begins to shrink. When the discharge water level stabilizes at 150 cm, the river and groundwater are disconnected. In order to speed up the progress of the experiment again, the water tank controlling the discharge water level was lowered to 130 cm, and the pressure measurement discharge was observed again in the shape of the saturated zone. In order to express the experimental results concisely, all the data before the disconnection between the river and the groundwater are not drawn, and only the three sets of data in the middle are selected. Similarly, when the water depth of the river is 10 cm, the contact surface between the river and groundwater tends to decrease when the discharge water level of Sand B is 170 cm, and the disconnection occurs when the discharge water level is 140 cm. This set of experiments is the disconnection between the river and groundwater. For the group with denser former data, these groups of data are selected and drawn into the state diagram before disjointedness. The state of the last set of discharge water levels of 80 cm is selected to be compared with the state of the same discharge water level of a river water depth of 18.5 cm, and the last set of data of these experiments is when it drops to 80 cm.
Figure 11 shows the relationship between discharged flow and discharge water level as well as river water depth under sand A. Under the same discharge water level, the depth of the river water was proportional to the discharged water. Under the same river and groundwater water table curve, the level of discharged water was inversely proportional to discharged flow. However, the discharged flow stabilized after the hydraulic connection between the river and groundwater was broken. This result was consistent with the overall trend in changing discharged flow with changing discharged water levels in the sand B and sand C experiments.
As shown in Figure 5, under river water depths of 18.5 cm and 10 cm and while the hydraulic connection between groundwater and river water was maintained, the discharge flow increased with a decreasing level of the discharged water level. The flow in the river showed a decreasing trend with a decreasing level of discharged water, which it stabilized with the same regularity on both sides of the river.
3.4. Discharge Flow
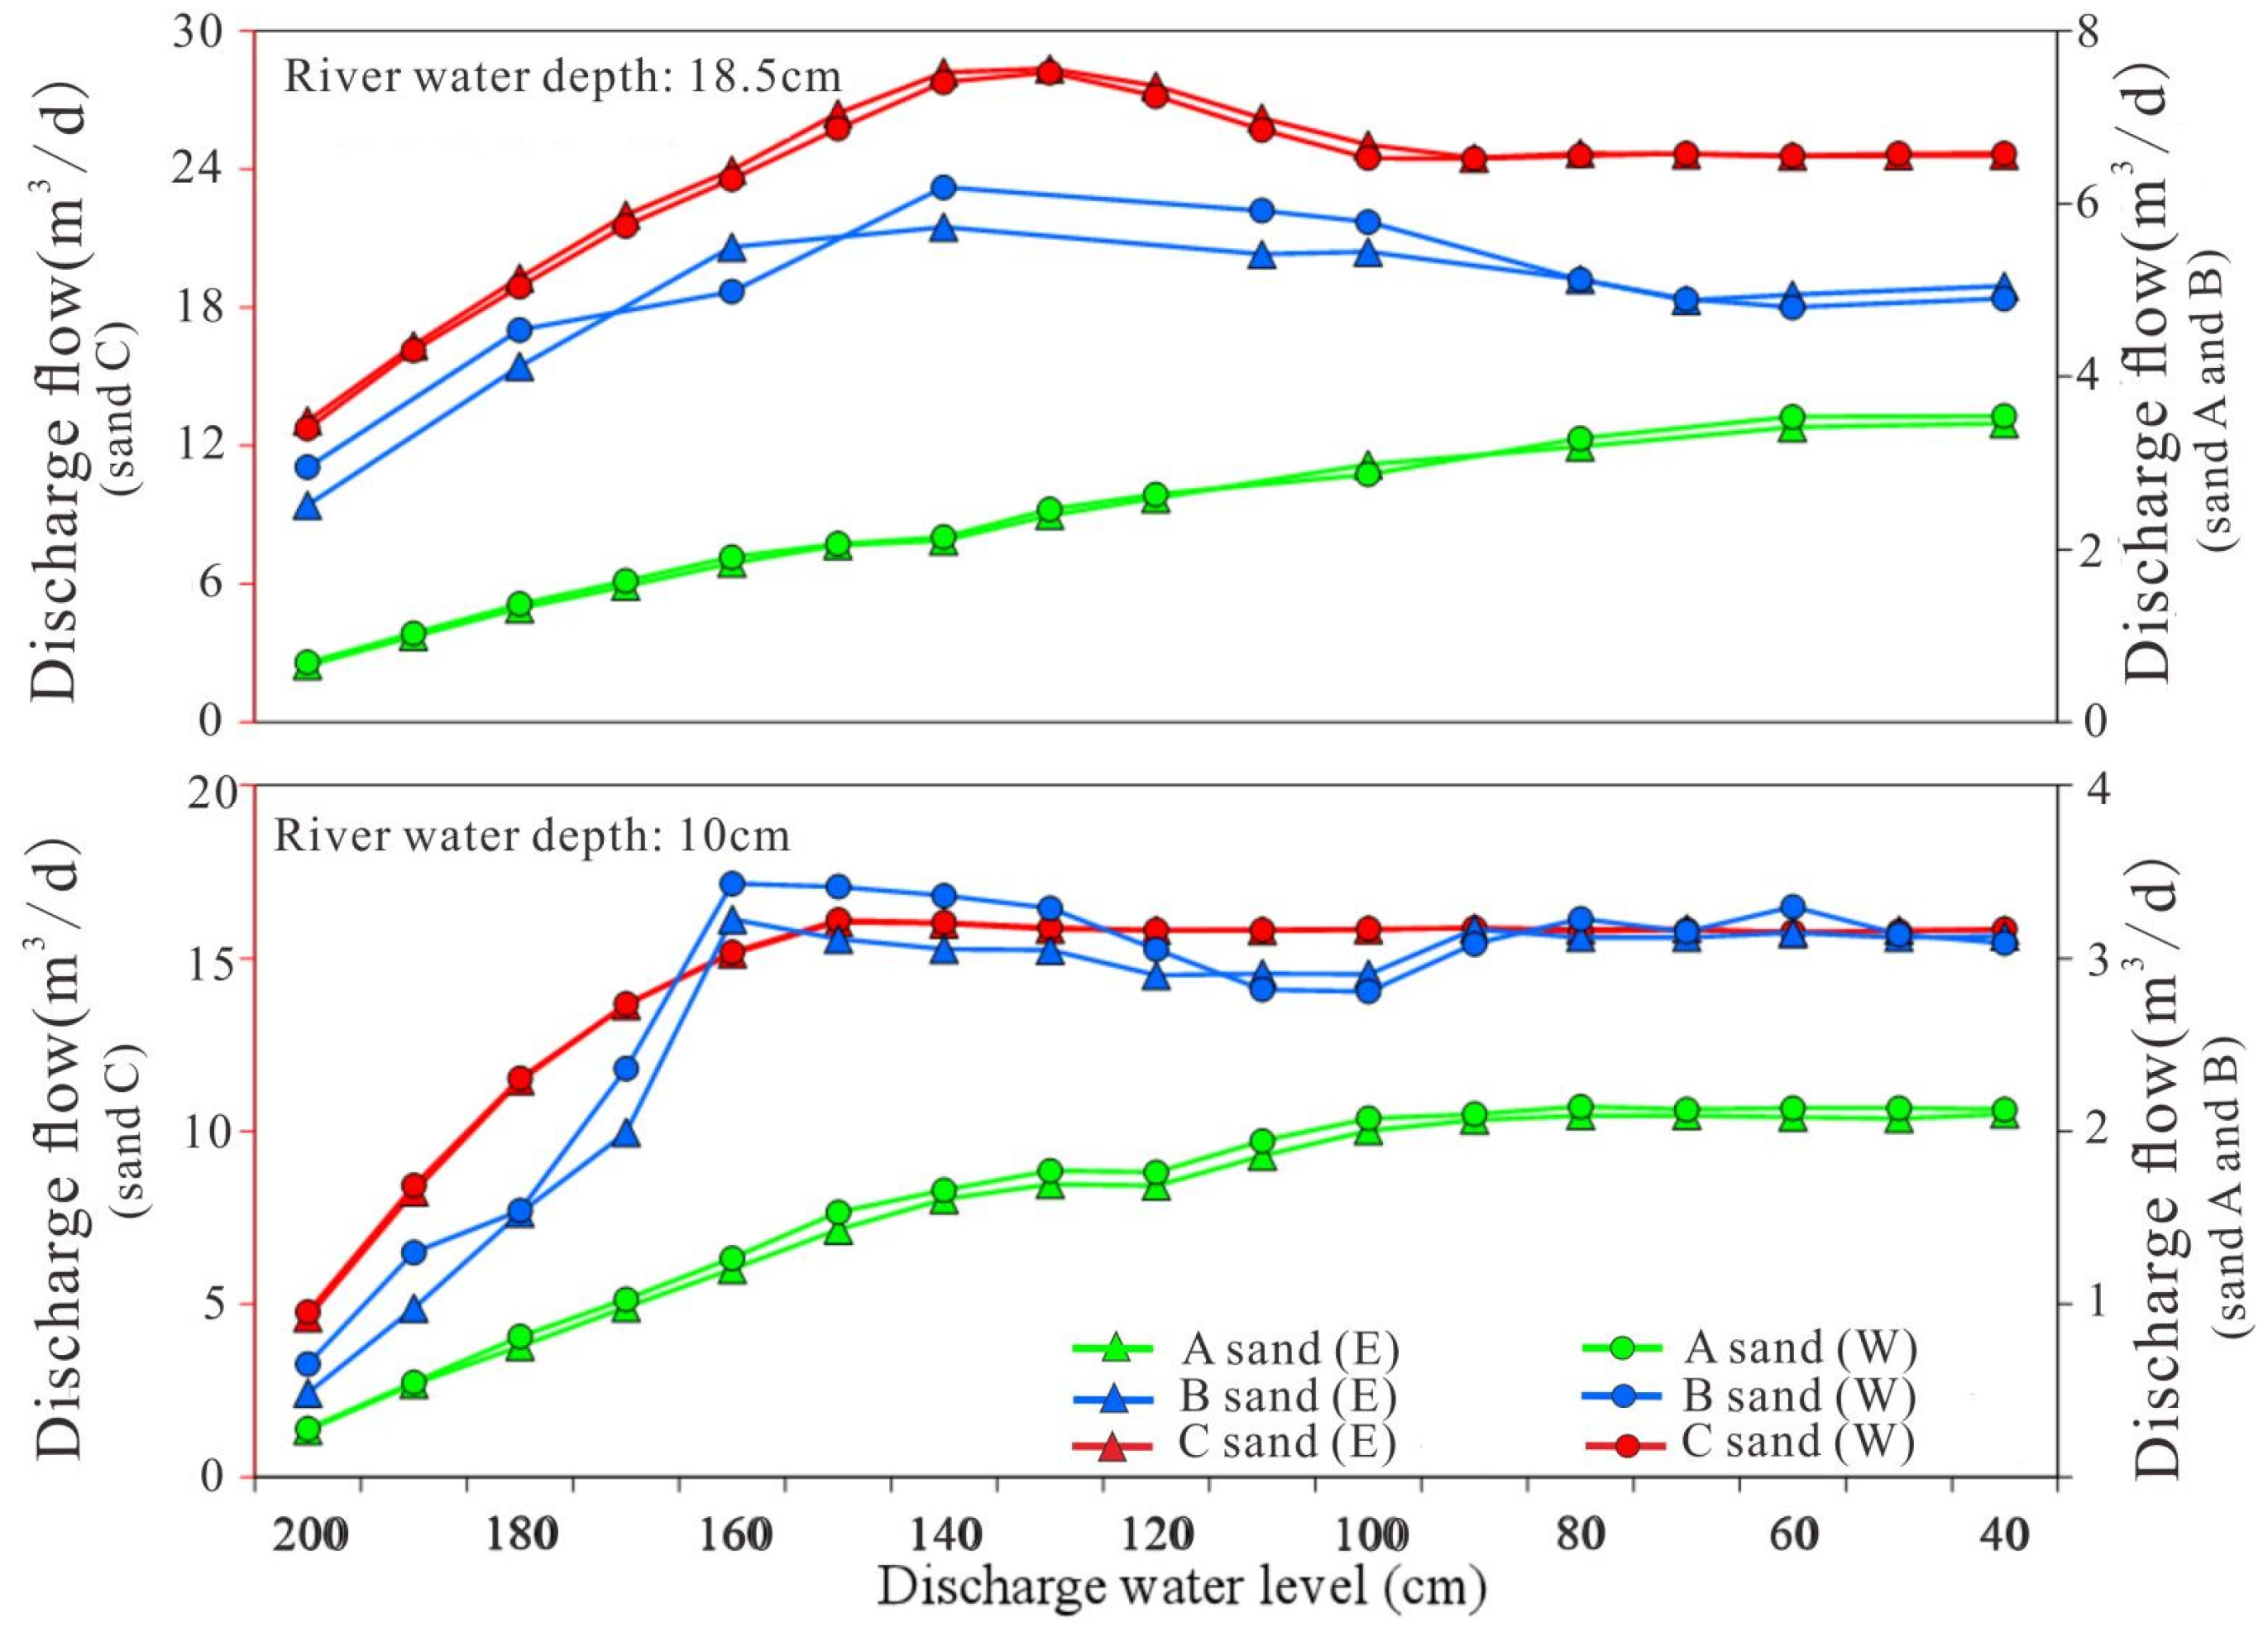
Figure 12 shows the relationship between discharged flow and discharge water level under the three types of aqueous media. Under the same river water depth and level of discharged water, the rank of the three sand treatments according to discharged flow was: sand C > sand B > sand A. This result corresponded with the permeability coefficients of the three sands (KC > KB > KA) (Table 1). The overall relationship between discharged flow and discharged water level noted in the present study was similar to that noted in previous studies, although some obvious differences were noted. Previous studies have shown that discharged flow reaches a maximum before the adjacent water level is reached, and the hydraulic connection between the river and groundwater is broken, and then slightly decreases and stabilizes. In addition, the results of the present study indicated that discharged flow reaches a maximum after the hydraulic connection between the river and groundwater is broken. However, previous studies [10] have shown that the maximum discharged flow occurs before the hydraulic connection between the river and groundwater is broken, at which point the flow decreases slightly and then stabilizes. The authors have suggested that this observation can be attributed to the area of the unsaturated zone during the period of no hydraulic connection exceeding that of the unsaturated zone during the period of connection. However, this explanation seems weak since the area of the unsaturated zone increases with the decreasing level of discharged water during the period of the hydraulic connection. Figure 12 shows the relationship between the discharged flow and discharged level of water at river water depths of 18.5 cm and 10 cm. The river was disconnected from the critical discharged water level of groundwater and the maximum discharged flow was reached. The discharged flow increased slightly after the hydraulic connection was broken, which then stabilized. The results under a river water depth of 18.5 cm were consistent with those under a river water depth of 10 cm.
In Figure 12, the X-axis represents the drainage water level, and the value range is 40–200 cm. The left Y-axis represents the discharge flow of coarse sand at different river depths. When the water depth of the river is large, the corresponding discharge flow is also large, so the value range of the discharge flow in the above figure is larger than that in the below graph; the Y-axis on the right represents the discharge flow of medium sand and fine sand, the discharge flows are much smaller than that of coarse sand, so the value range is correspondingly smaller. The experimental results of the three water-containing media are that the discharge flow reaches the maximum value at the critical discharge water level where the river and groundwater are disconnected. After the disconnection, the discharge flow decreases slightly and remains basically stable. There are some differences in the experimental results (Figure 12). In addition, in the experimental results of A sand and B sand, when the river water depth is 18.5 cm, the discharge flow reaches its maximum.
The degree of decline after the extreme value is greater than that when the river water depth is 10 cm, while the results of sand C are similar to the experimental results of sand A and sand B. When the water-containing medium is C sand, the discharge flow will not change after reaching the maximum value. Comparing the discharge flow of the three kinds of sand, it can be seen that under the same river water depth or discharge water level, the discharge flow of sand A is the smallest, followed by B sand, and then C sand, which has the largest discharge flow; that is, the greater the permeability coefficient, the greater the discharge flow.
4. Discussion
The present study assessed three kinds of sand with different particle sizes using a sandbox device. Although the results of the present study were similar to those of previous studies, some results were significantly different [10]. The results of the present study that were consistent with those of previous studies included: (1) The unified infiltration curve for river and groundwater gradually lost its unity with the continuous decline in discharge water level. This resulted in the hydraulic connection being lost. The characteristic river→inverted saturated zone→unsaturated zone→saturated zone structure was then formed from top to bottom. (2) Under the same water depth, the level of discharge increased with decreasing level of discharge, finally reaching an extreme value. After the breakdown in the hydraulic connection between the river and the groundwater, the volume of discharge decreased slightly, following which it stabilized. (3) Under the same level of discharged water, the depth of the river water was proportional to the discharged flow and the effort needed to break the hydraulic connection.
The novel results obtained in the present study included:
- (1).
- Discharge flow. A comparison of the discharge flow (the quantity of river water leakage) for the three sand types of different particle sizes under the same river water depth, and the discharged water level clearly showed that discharged flow was proportional to the diameter of the sand particles. The rank of the three sand types in terms of discharge flow was: coarse sand > medium sand > fine sand.
- (2).
- Inverted saturated zone. The discharged water level resulting in the breaking of the hydraulic connection between river water and groundwater under a river depth of 18.5 cm was lower than that under a river depth of 10 cm. In other words, the thickness of the inverted saturated zone was inversely proportional to the depth of river water. There were different heights of discharge water level and different thicknesses of inverted saturated zone among different river water depths.
Previous studies have shown that the thickness of the inverted saturated zone is equal to the depth of the river water during periods of separation of the hydraulic connection between the river and groundwater [10]. Under the same river water depth conditions, it seems unlikely that the inverted saturated zone formed in a gravel bed will have the same thickness that formed in a fine sand bed. In addition, the thickness of the inverted saturated zone under the river observed in the current study was not always equal to the depth of the river. For example, under a river water depth of 18.5 cm and the water-bearing medium sand C, the thickness of the inverted saturated zone was 10–15 cm, whereas that under water-bearing medium sand B was 5–10 cm and clearly smaller than the river water depth of 18.5 cm. The rank of the sand types according to the thicknesses of the inverted saturated zones under the same river water depth was sand A > sand C > sand B. Therefore, it is proposed that the thickness of the inverted saturated zone formed by the disconnection of the hydraulic link between the river and groundwater is not only affected by the depth of river water, but also related to the physical characteristics of the water-bearing medium.
The results showed that under the same conditions, the thickness of the inverted saturated zone changes with changing depth of the river water. The depth of the river water is proportional to the thickness of the suspended saturated zone. The inverted saturated zone under the river is unable to form when the depth of the river tends to 0. In addition, there is a large quantity of groundwater recharged by the river when the river depth is large. It results in the formation of the hydraulic connection between the river and the groundwater and will prevent the formation of the inverted saturated zone. Therefore, the thickness of the inverted saturated zone is related to river water depth, and within the critical range of river water depth, the thickness of the inverted saturated zone is directly proportion to river water depth.
The results show that under the same conditions, the thickness of the inverted saturation zone increases with the depth of the river. The depth of the river water is proportional to the thickness of the suspended saturation zone. When the river depth tends to 0, the river hardly infiltrates to recharge the groundwater, and the inverted saturation zone at the bottom of the river cannot be formed. In addition, when the river water depth is relatively large, a large amount of river water infiltrates to recharge groundwater, resulting in the formation of a hydraulic connection between the river and groundwater, and the formation of a suspended saturated zone. Therefore, the thickness of the inverted saturation zone is related to the river water depth, and within the critical range of the river water depth, the thickness of the inverted saturation zone is proportional to the river water depth (Figure 13).
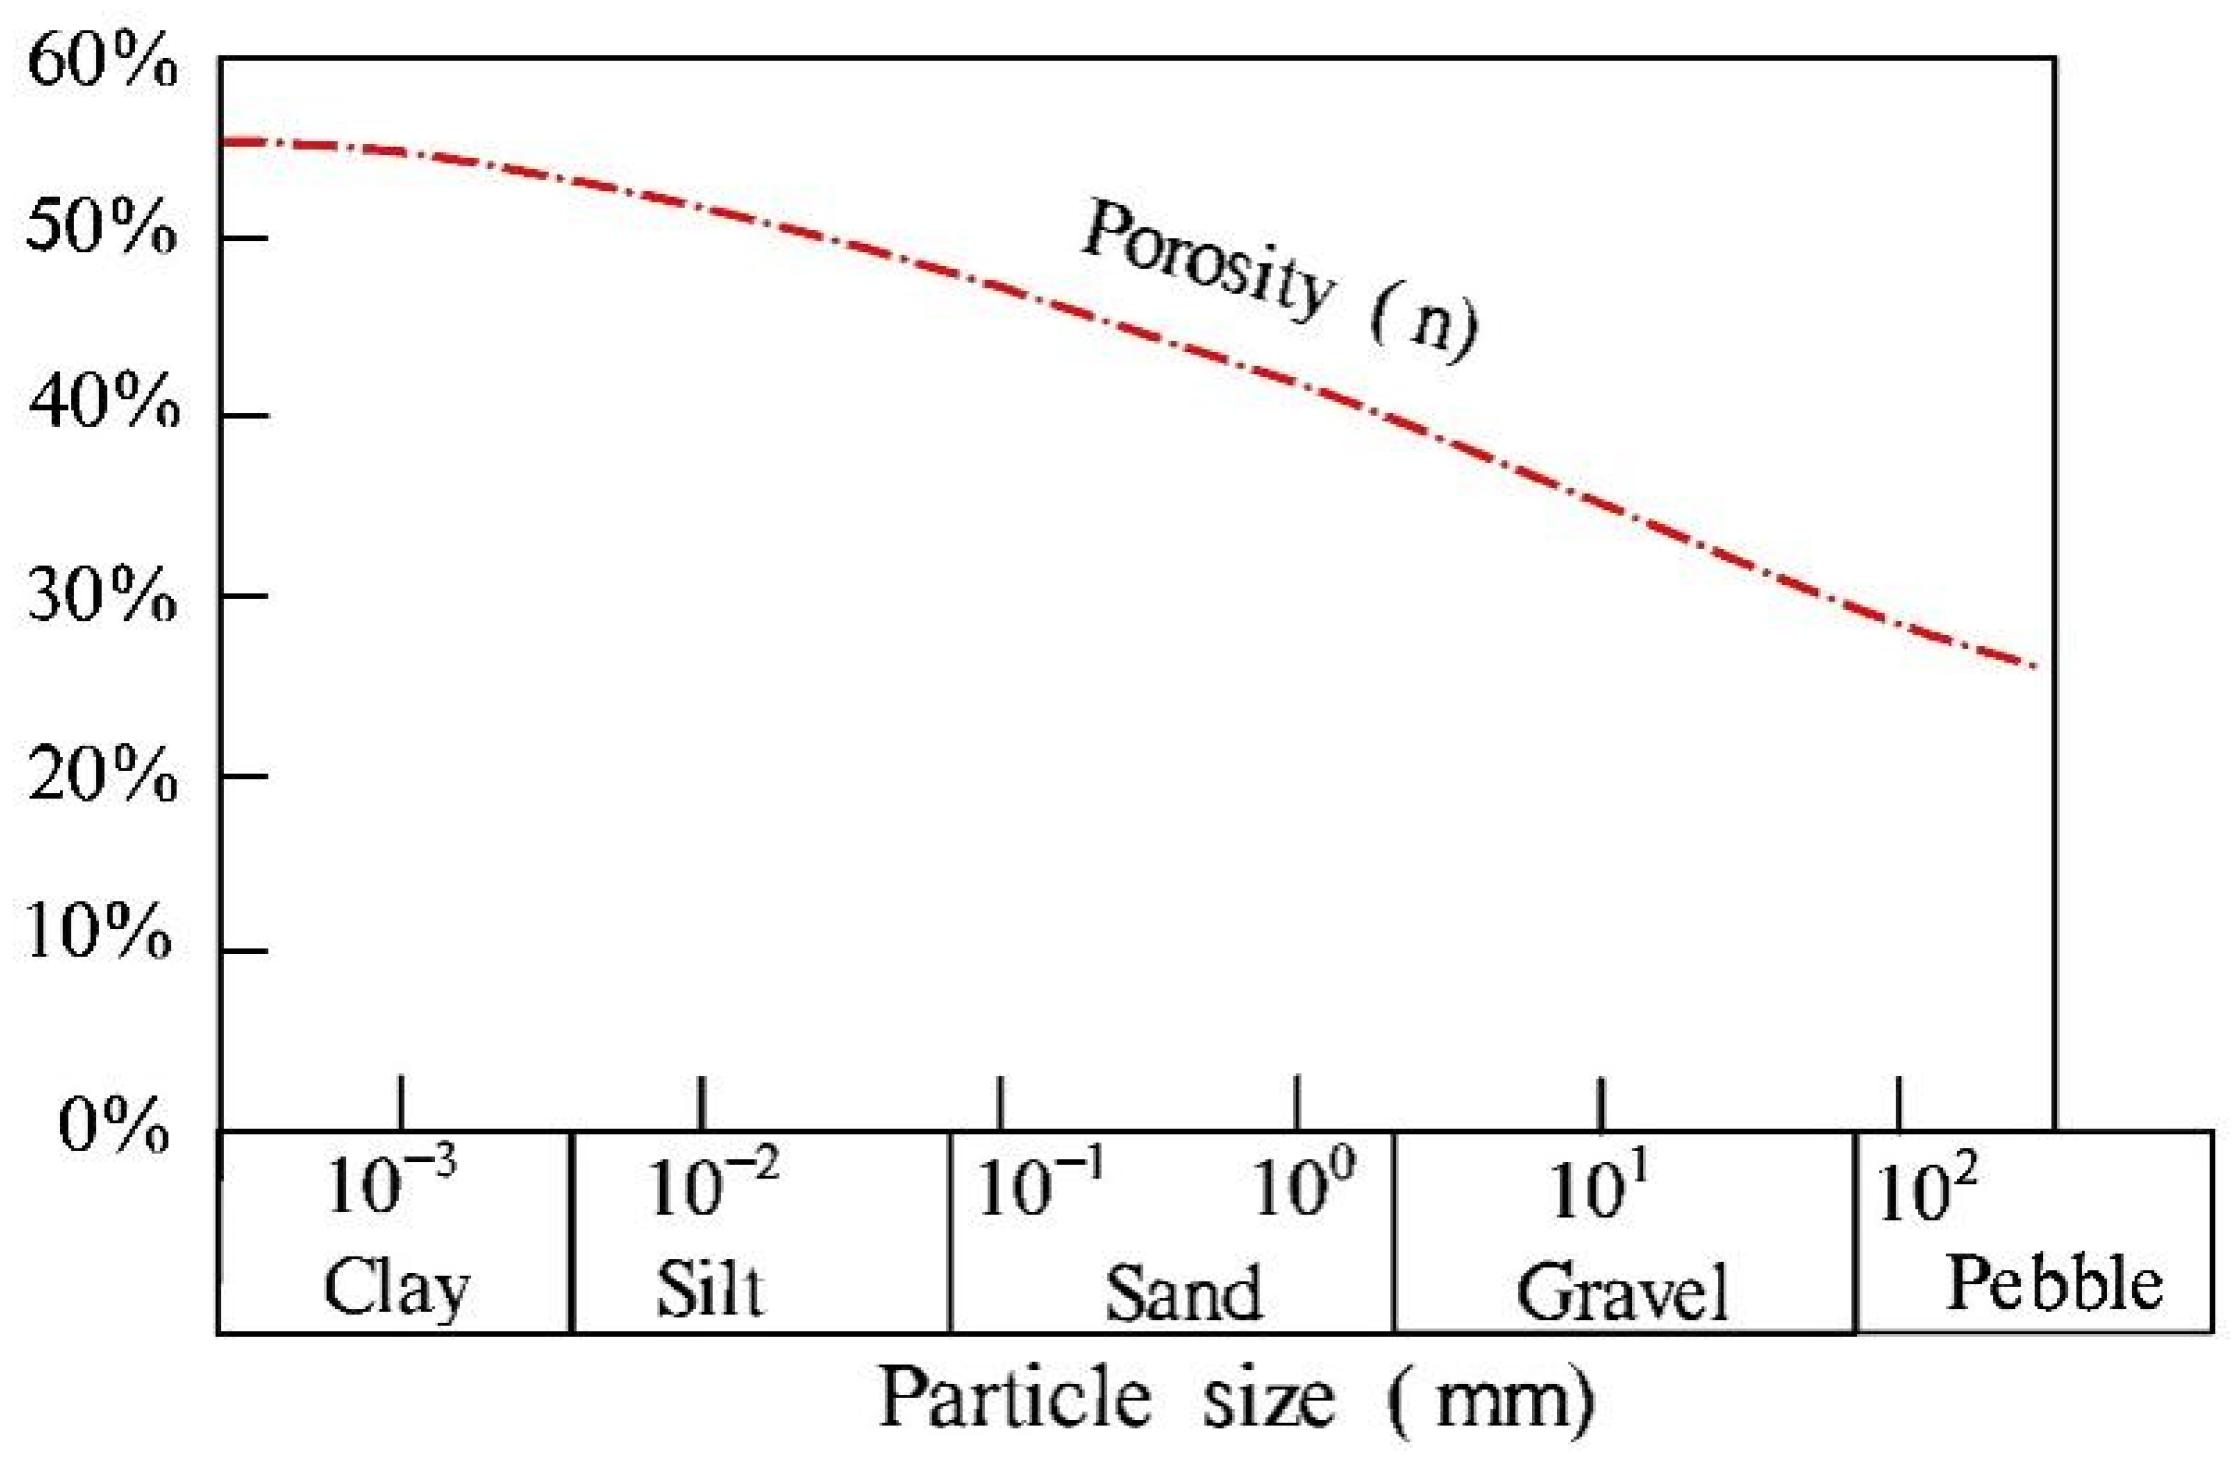
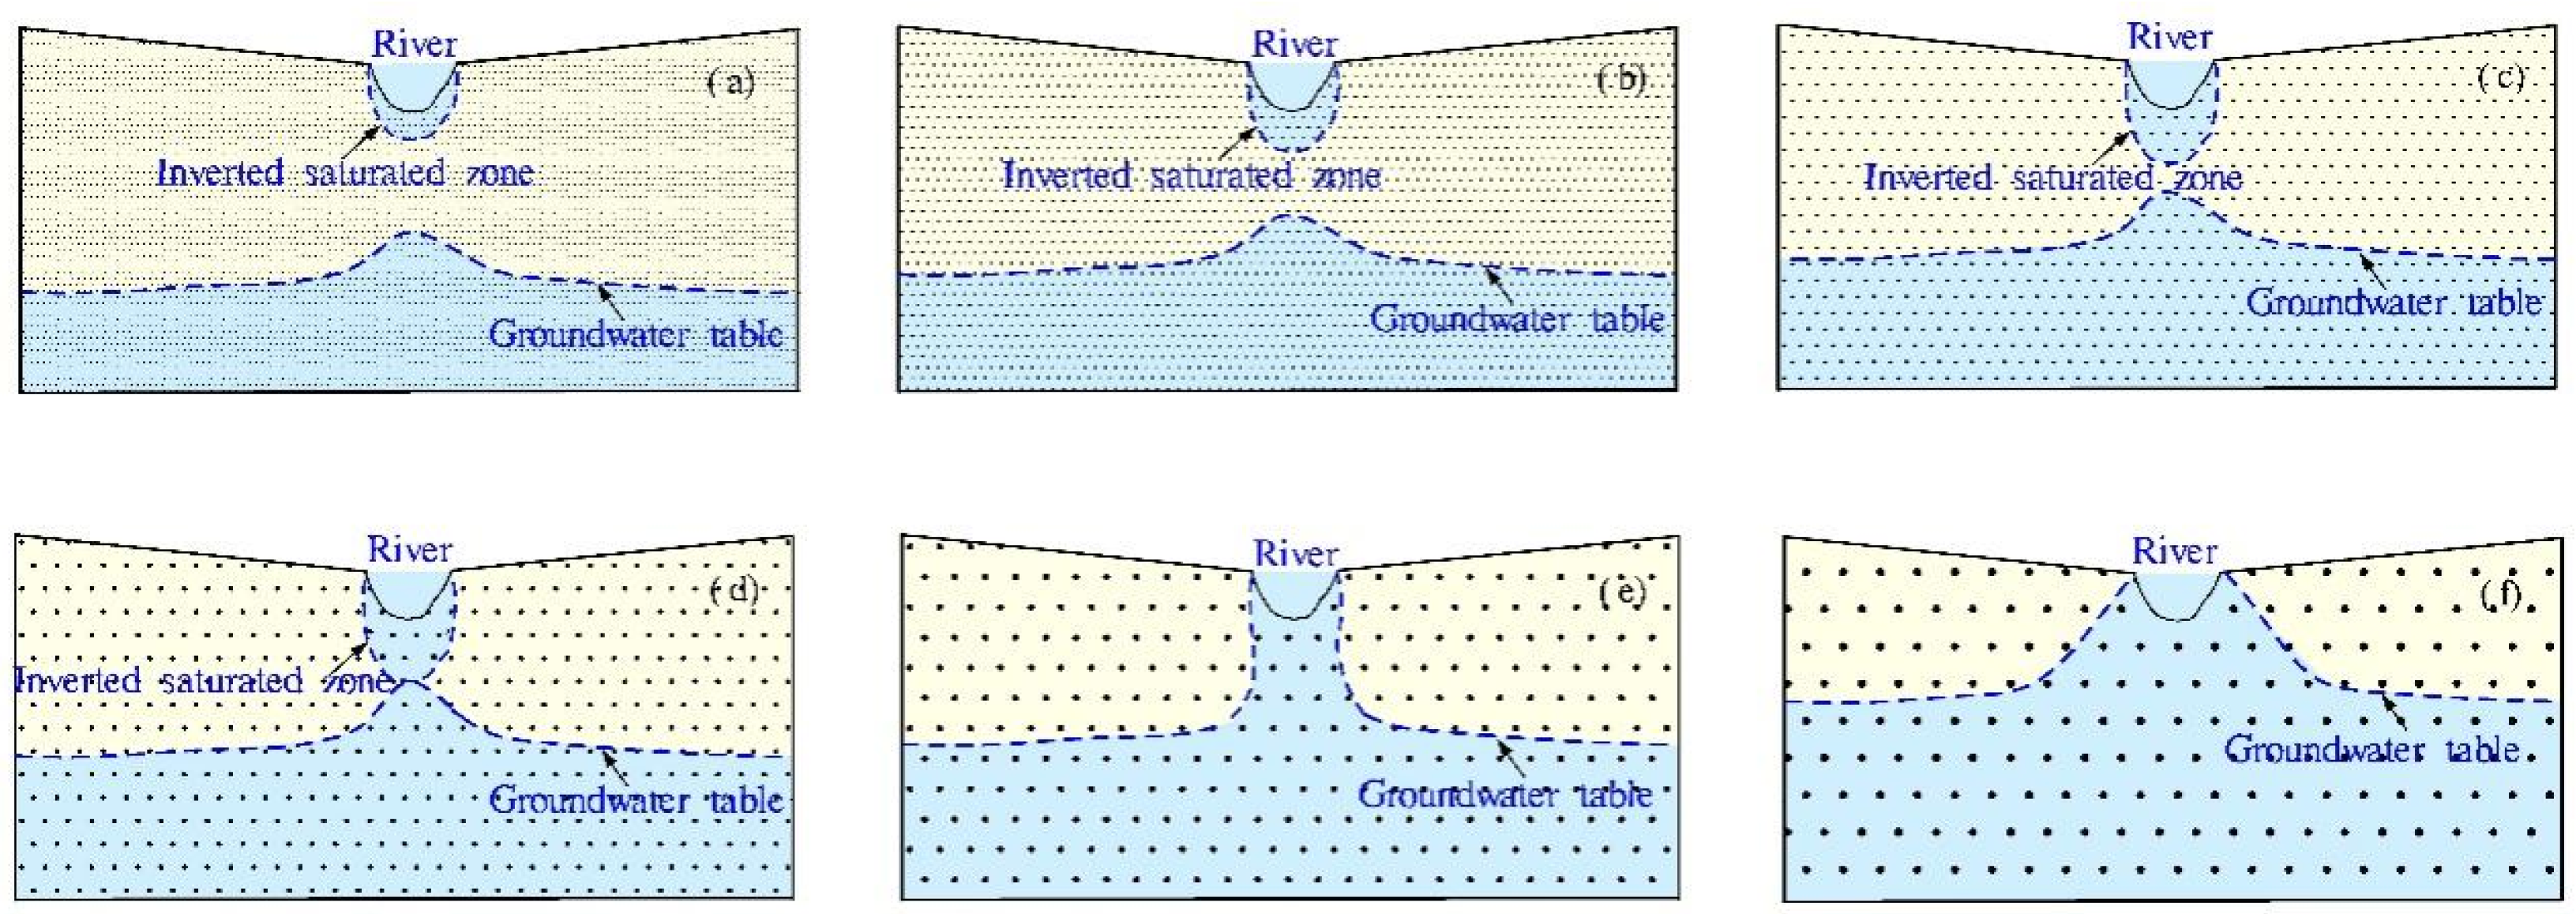
When the particles are very small, the permeable medium will become a weak permeable layer, thereby hindering the formation of a suspended saturated zone. When the particles are very small, the permeable medium will become a water-resisting layer, thereby hindering the formation of an inverted saturated zone. In contrast, when the particles are large, the water flow will directly pass through the water-bearing medium, thereby preventing the formation of an inverted saturated zone. Under certain conditions, an inverted saturated zone will be formed under the riverbed with increasing sand particle size. The inverted saturated zone will gradually increase with increasing sand particle size until the hydraulic connection between groundwater and the river is formed, at which point the inverted saturated zone will disappear. Therefore, within a certain critical condition, the thickness of the inverted saturated zone formed after the disconnection of the hydraulic connection between the river and groundwater is inversely proportional to porosity, while it is directly proportional to particle size (hydraulic conductivity), as shown in Figure 14.
The present study determined the range of the inverted saturated zone by observing whether water flowed freely from the pressure tap after removing the pressure tube. Therefore, the inverted water table was located between two pressure taps that flow freely and contained no water. The range of thickness of the inverted saturated zone after the hydraulic connection between the river and the groundwater was broken, and the different water-bearing media conditions are shown in Table 2. The present study assumed that the inverted water table obtained from the experiment was located in the middle of the two freely flowing pressure taps containing no water. The results suggested that the thickness of the inverted saturated zone was significantly correlated with porosity, as shown in Figure 15. The amount of data on the thickness of the suspended saturated zone of the river obtained in this experiment is too small (only three). If it is expressed by a polynomial, it cannot more intuitively reflect the relationship between the suspended saturated zone and the river water depth and the porosity of the water-containing medium. In addition to the high fitting degree, the power function is selected for fitting, and it is also considered that the definition domain of the power function is generally in the first quadrant, that is, the porosity is a number greater than 0, which is more in line with the actual conditions.
The results of the present study indicated that the thickness of the inverted saturated zone formed below the riverbed after the breaking of the hydraulic link between the river and groundwater was significantly correlated with both the river depth and porosity. An equation is given to estimate the thickness of the inverted saturated zone:
In Equation (1), M is the thickness of the inverted saturated zone, α is a constant (and different for each aquifer medium), H is the depth of river water, and n is the porosity.
Table 3 shows the thicknesses of the inverted saturated zone calculated using this formula. All of the calculated thicknesses were within the range of the experimental observations. It should be noted that the provided formula is based only on the results of the current study and may not reflect field conditions.
Future studies should obtain more data to further verify and improve the estimation formula.
The evolution of the hydraulic relationship between rivers and groundwater is very complex. There has not yet been a comprehensive study of the interaction between rivers and groundwater, and there remains no effective method to study the relationship in practice, and this should be a focus of future research. The experiments conducted in the present study are based on the theory of the disconnect of the hydraulic connection between rivers and groundwater by Liu et al. [22]. This theory states that the hydraulic connection between rivers and groundwater weakens and breaks during the dry season, and a suspended saturated zone is then formed. The results of a study by Feng et al., based on this theory, concluded that subsequent to the breaking of the hydraulic connection, the thickness of the suspended saturated zone is equal to the thickness of the river water layer [23]. The present study tested this theory using three kinds of sand with different particle sizes [24]. The results of the present study examined the distribution of negative pressure during the experiment and other conditions influencing the disconnect of the hydraulic connection between rivers and groundwater and the suspended saturated zone. The estimation formula proposed by the present study represents an advancement of understanding of these processes, although it requires further improvement.
5. Conclusions
The present study conducted sandbox experiments using three aqueous sand media with different particle sizes. Some aspects of the results were consistent with those of previous studies, whereas other results were different. The conclusions of the present study are summarized as follows:
- (1).
- Consistent with the conclusion by Wang et al. (2007), under the same conditions, the river level is inversely proportional to the critical water level at which a hydrological disconnect between the river and groundwater occurs, and discharge flow is proportional to the discharge water level. The rate of excretion first decreased and then gradually increased up until the extreme value under which the hydrological disconnect occurred, following which, the excretory flow stabilized.
- (2).
- Inconsistent with the results of previous studies, the results of the present study showed that following the breaking of the hydrological connection between the river and groundwater, the thickness of the suspended saturated zone was not always equal to the depth of the river.
- (3).
- The thickness of the suspended saturated zone was related not only to the depth of the river, but also to the physical properties of the aqueous medium. The results of the experiments showed that the thickness of the suspended saturated zone of the river was inversely correlated with porosity. The porosity is related to the type, particle size, roundness, and sorting of the sand in the water-containing medium. Therefore, the thickness of the river suspension saturated zone is related to the type, particle size, roundness, sorting, and porosity of the water-containing medium. related. In this paper, only the porosity and particle size curves of different types of sand are made. For other physical properties, such as water supply, water conductivity, roundness, and sorting of aqueous media, further experiments are needed to prove it. In the future, the authors will do experimental studies in this regard, which will be supplemented again. The results of this study can act as a reference for understanding the interaction between river water and groundwater. Future studies should conduct more comprehensive experiments, including investigating a greater range of aqueous sand media, to improve the formula for calculating the suspension saturation zone.
Author Contributions
Conceptualization, Z.G. and J.L.; Methodology, Z.G.; Software, Z.W.; Validation, W.L., Z.W. and S.W.; Formal Analysis, J.L.; Investigation, Z.W. and S.W.; Resources, W.L.; Data Management, S.W.; Writing—Manuscript Preparation, W.L.; Writing—Review and Editing, J.L.; Visualization, Z.W.; Supervision, S.W.; Project Management, Z.G.; Funding Acquisition, Z.G. All authors have read and agreed to the published version of the manuscript.
Funding
This research is accepted by the National Natural Science Foundation of China, and the project names and numbers are as follows: Research on the thermal driving mechanism of groundwater flow and its system differentiation. National Natural Science Foundation of China, No. 41641022.
Institutional Review Board Statement
Not applicable.
Informed Consent Statement
Not applicable.
Data Availability Statement
Not applicable.
Conflicts of Interest
The authors declare no conflict of interest.
References
- Fuchs, E.H.; King, J.P.; Carroll, K.C. Quantifying Disconnection of Groundwater from Managed-Ephemeral Surface Water During Drought and Conjunctive Agricultural Use. Water Resour. Res. 2019, 55, 5871–5890. [Google Scholar] [CrossRef] [Green Version]
- Brunner, P.; Therrien, R.; Renard, P.; Simmons, C.T.; Franssen, H.J.H. Advances in understanding river-groundwater interactions. Rev. Geophys. 2017, 55, 818–854. [Google Scholar] [CrossRef]
- Wang, W.K.; Li, J.T.; Wang, Z.; Feng, X.Z.; Xu, M.; Wang, W.M.; Yang, L.J. Evolution of the relationship between rivers and groundwater and some scientific issues. J. Jilin Univ. Earth Sci. Ed. 2007, 37, 231–238. [Google Scholar]
- Batlle-Aguilar, J.; Xie, Y.Q.; Cook, P.G. Importance of stream infiltration data for modelling surface water-groundwater interactions. J. Hydrol. 2015, 528, 683–693. [Google Scholar] [CrossRef]
- Jin, M.G.; Xian, Y.; Liu, Y.F. Research progress on the interaction between disconnected rivers and groundwater. Adv. Water Sci. 2017, 28, 149–160. [Google Scholar]
- Brunner, P.; Cook, P.G.; Simmons, C.T. Hydrogeologic controls on disconnection between surface water and groundwater. Water Resour. Res. 2009, 45, W01422. [Google Scholar] [CrossRef] [Green Version]
- Fox, G.A.; Durnford, D.S. Unsaturated hyporheic zone flow in stream/aquifer conjunctive systems. Adv. Water Resour. 2003, 26, 989–1000. [Google Scholar] [CrossRef]
- Liu, G.A.; Liu, J. Seepage laws in aquifer near a partially penetrating river with an intensive extraction of ground water. Sci. China Ser. E Technol. Sci. 1997, 40, 489–496. [Google Scholar] [CrossRef]
- Brunner, P.; Cook, P.G.; Simmons, C.T. Disconnected Surface Water and Groundwater: From Theory to Practice. Groundwater 2011, 49, 460–467. [Google Scholar] [CrossRef] [Green Version]
- Wang, W.; Li, J.; Feng, X.; Chen, X.; Yao, K. Evolution of stream-aquifer hydrologic connectedness during pumping—Experiment. J. Hydrol. 2011, 402, 401–414. [Google Scholar] [CrossRef]
- Brunner, P.; Simmons, C.T.; Cook, P.G. Spatial and temporal aspects of the transition from connection to disconnection between rivers, lakes and groundwater. J. Hydrol. 2009, 376, 159–169. [Google Scholar] [CrossRef] [Green Version]
- Cook, P.G. Quantifying river gain and loss at regional scales. J. Hydrol. 2015, 531, 749–758. [Google Scholar] [CrossRef]
- Doble, R.; Brunner, P.; McCallum, J.; Cook, P. An Analysis of River Bank Slope and Unsaturated Flow Effects on Bank Storage. Ground Water 2011, 50, 77–86. [Google Scholar] [CrossRef]
- Lackey, G.; Neupauer, R.M.; Pitlick, J. Effects of Streambed Conductance on Stream Depletion. Water 2015, 7, 271–287. [Google Scholar] [CrossRef] [Green Version]
- Dillon, P.J.; Liggett, J.A. An ephemeral stream-aquifer interaction model. Water Resour. Res. 1983, 19, 621–626. [Google Scholar] [CrossRef]
- Lamontagne, S.; Taylor, A.R.; Cook, P.G.; Crosbie, R.S.; Brownbill, R.; Williams, R.M.; Brunner, P. Field assessment of surface water-groundwater connectivity in a semi-arid river basin (Murray-Darling, Australia). Hydrol. Process. 2012, 28, 1561–1572. [Google Scholar] [CrossRef] [Green Version]
- Schmitz, G.H.; Edenhofer, J. Exact closed-form solution of the two-dimensional Laplace Equation for Steady Groundwater flow with nonlinearized free-surface boundary condition. Water Resour. Res. 2000, 36, 1975–1980. [Google Scholar] [CrossRef]
- Wang, W.K.; Dai, Z.X.; Zhao, Y.Q.; Li, J.T.; Duan, L.; Wang, Z.F.; Zhu, L. A quantitative analysis of hydraulic interaction processes in stream aquifer systems. Sci. Rep. 2016, 6, 19876. [Google Scholar] [CrossRef] [Green Version]
- Xie, Y.Q.; Cook, P.G.; Brunner, P.; Irvine, D.J.; Simmons, C.T. When Can Inverted Water Tables Occur Beneath Streams? Ground Water 2014, 52, 769–774. [Google Scholar] [CrossRef] [Green Version]
- Rivière, A.; Gonçalvès, J.; Jost, A.; Font, M. Experimental and numerical assessment of transient stream-aquifer exchange during disconnection. J. Hydrol. 2014, 517, 574–583. [Google Scholar] [CrossRef] [Green Version]
- Xian, Y.; Jin, M.; Liu, Y.; Si, A. Impact of lateral flow on the transition from connected to disconnected stream-Aquifer systems. J. Hydrol. 2017, 548, 353–367. [Google Scholar] [CrossRef]
- Hantush, M.S. Wells near streams with semipervious beds. J. Geophys. Res. Earth Surf. 1965, 70, 2829–2838. [Google Scholar] [CrossRef]
- Hunt, B. Unsteady Stream Depletion from Ground Water Pumping. Groundwater 1999, 37, 98–102. [Google Scholar] [CrossRef]
- Liu, G.; Ding, J.; Li, J. Experiment and simulation of the disconnection between groundwater and river water. Hydrology 1999, 40, 489–496. [Google Scholar]
Figure 1.
Schematic representation of the sandbox used in the experiment.

Figure 2.
Particle size analysis curve of (a) sand A, (b) sand B, and (c) sand C.

Figure 3.
The change in the relationship between river water and groundwater in the sandbox experiment under the water bearing medium sand C and a river water depth of 18.5 cm. Discharge water level (A): 200 cm, (B): 170 cm, (C): 140 cm, (D): 130 cm, (E): 100 cm, and (F): 70 cm.
Figure 3.
The change in the relationship between river water and groundwater in the sandbox experiment under the water bearing medium sand C and a river water depth of 18.5 cm. Discharge water level (A): 200 cm, (B): 170 cm, (C): 140 cm, (D): 130 cm, (E): 100 cm, and (F): 70 cm.

Figure 4.
The change in the relationship between river water and groundwater in the sandbox experiment under the water-bearing medium sand C and a river water depth of 10 cm. Discharge water level (A): 200 cm, (B): 170 cm, (C): 160 cm, (D): 150 cm, (E): 110 cm, and (F): 70 cm.
Figure 4.
The change in the relationship between river water and groundwater in the sandbox experiment under the water-bearing medium sand C and a river water depth of 10 cm. Discharge water level (A): 200 cm, (B): 170 cm, (C): 160 cm, (D): 150 cm, (E): 110 cm, and (F): 70 cm.


Figure 5.
The relationship between discharge flow and discharge water level and river water depth under the water-bearing medium sand C.
Figure 5.
The relationship between discharge flow and discharge water level and river water depth under the water-bearing medium sand C.

Figure 6.
The change in the relationship between river water and groundwater in the sandbox experiment under the water-bearing medium sand B and a river water depth of 18.5 cm. Discharge water level (A): 200 cm, (B): 160 cm, (C): 150 cm, (D): 130 cm, (E): 80 c m, and (F): 40 cm.
Figure 6.
The change in the relationship between river water and groundwater in the sandbox experiment under the water-bearing medium sand B and a river water depth of 18.5 cm. Discharge water level (A): 200 cm, (B): 160 cm, (C): 150 cm, (D): 130 cm, (E): 80 c m, and (F): 40 cm.


Figure 7.
The change in the relationship between river water and groundwater in the sandbox experiment under the water-bearing medium sand B and a river water depth of 10 cm. Discharge water level (A): 200 cm, (B): 170 cm, (C): 160 cm, (D): 150 cm, (E): 140 cm, and (F): 80 cm.
Figure 7.
The change in the relationship between river water and groundwater in the sandbox experiment under the water-bearing medium sand B and a river water depth of 10 cm. Discharge water level (A): 200 cm, (B): 170 cm, (C): 160 cm, (D): 150 cm, (E): 140 cm, and (F): 80 cm.


Figure 8.
The relationship between discharge flow and discharge water level and river water depth under the water-bearing medium sand B.
Figure 8.
The relationship between discharge flow and discharge water level and river water depth under the water-bearing medium sand B.

Figure 9.
The change in the relationship between river water and groundwater in the sandbox experiment under the water-bearing medium sand A and a river water depth of 18.5 cm. Discharge water level (A): 200 cm, (B): 170 cm, (C): 140 cm, (D): 100 cm, (E): 80 cm, and (F): 60 cm.
Figure 9.
The change in the relationship between river water and groundwater in the sandbox experiment under the water-bearing medium sand A and a river water depth of 18.5 cm. Discharge water level (A): 200 cm, (B): 170 cm, (C): 140 cm, (D): 100 cm, (E): 80 cm, and (F): 60 cm.


Figure 10.
The change in the relationship between river water and groundwater in the sandbox experiment under the water-bearing medium sand A and a river water depth of 10 cm. Discharge water level (A): 200 cm, (B): 170 cm, (C): 140 cm, (D): 100 cm, (E): 90 cm, and (F): 60 cm.
Figure 10.
The change in the relationship between river water and groundwater in the sandbox experiment under the water-bearing medium sand A and a river water depth of 10 cm. Discharge water level (A): 200 cm, (B): 170 cm, (C): 140 cm, (D): 100 cm, (E): 90 cm, and (F): 60 cm.

Figure 11.
The relationship between discharge flow and discharge water level and river water depth under water-bearing medium sand A.
Figure 11.
The relationship between discharge flow and discharge water level and river water depth under water-bearing medium sand A.

Figure 12.
The relationship between discharged flow of different water-bearing media, discharged water level, and river water depth.
Figure 12.
The relationship between discharged flow of different water-bearing media, discharged water level, and river water depth.

Figure 13.
Variation curves of porosity in different aqueous media.

Figure 14.
Schematic diagram of river and groundwater evolution under different particle sizes in aqueous media.
Figure 14.
Schematic diagram of river and groundwater evolution under different particle sizes in aqueous media.

Figure 15.
Relationship between inverted saturated zone thickness and porosity.


Table 1.
Physical parameters of sand used in the experiment.
| Sand | Porosity (n) | Average Grain Diameter (mm) | Hydraulic Conductivity K (cm/s) | Specific Yield (u) | Height of Capillary Rise (h) |
|---|---|---|---|---|---|
| C | 0.4 | 0.85 | 1.004 | 0.3 | 15 |
| B | 0.42 | 0.35 | 0.086 | 0.15 | 26 |
| A | 0.36 | 0.15 | 0.017 | 0.01 | 30 |
Table 2.
Thickness of the inverted saturated zone under different river depths and aqueous media.
| Thickness of the Hanging Water-Saturated Zone (M) | |||
|---|---|---|---|
| River Depth: 18.5 cm | River Depth: 10.0 cm | ||
| Coarse sand | 10–15 cm | Coarse sand | 5–10 cm |
| Medium sand | 5–10 cm | Medium sand | 0–5 cm |
| Fine sand | 15–20 cm | Fine sand | 10–15 cm |
Table 3.
Thicknesses of the inverted saturated zone calculated using a formula derived in the current study.
Table 3.
Thicknesses of the inverted saturated zone calculated using a formula derived in the current study.
| River Depths | α | Experiment Results | Calculated Values | |
|---|---|---|---|---|
| Sand C | 18.5 | 18 | 10–15 cm | 12.68 cm |
| 10 | 5–10 cm | 6.85 cm | ||
| Sand B | 18.5 | 22 | 5–10 cm | 8.10 cm |
| 10 | 0–5 cm | 4.38 cm | ||
| Sand A | 18.5 | 16 | 15–20 cm | 19.45 cm |
| 10 | 10–15 cm | 10.52 cm |
Publisher’s Note: MDPI stays neutral with regard to jurisdictional claims in published maps and institutional affiliations. |
© 2022 by the authors. Licensee MDPI, Basel, Switzerland. This article is an open access article distributed under the terms and conditions of the Creative Commons Attribution (CC BY) license (https://creativecommons.org/licenses/by/4.0/).
Share and Cite
MDPI and ACS Style
Gao, Z.; Liu, W.; Liu, J.; Wang, Z.; Wang, S. Study on the Relationship between River Water and Groundwater under Different Aquifer Mediums. Water 2022, 14, 1134. https://doi.org/10.3390/w14071134
AMA Style
Gao Z, Liu W, Liu J, Wang Z, Wang S. Study on the Relationship between River Water and Groundwater under Different Aquifer Mediums. Water. 2022; 14(7):1134. https://doi.org/10.3390/w14071134
Chicago/Turabian StyleGao, Zongjun, Wenyue Liu, Jiutan Liu, Zhenyan Wang, and Shu Wang. 2022. "Study on the Relationship between River Water and Groundwater under Different Aquifer Mediums" Water 14, no. 7: 1134. https://doi.org/10.3390/w14071134
Note that from the first issue of 2016, this journal uses article numbers instead of page numbers. See further details here.