Article

Trends of Rainfall Variability and Drought Monitoring Using Standardized Precipitation Index in a Scarcely Gauged Basin of Northern Pakistan

1
Department of Civil Engineering, College of Ocean Science, Jeju National University, 102 Jejudaehakro, Jeju 63243, Korea
2
Department of Geography, University of Gujrat, Gujrat 50700, Pakistan
3
State Key Laboratory of Information Engineering in Surveying, Mapping and Remote Sensing, Wuhan University, Wuhan 430079, China
4
Department of Geography, The Islamia University Bahawalpur, Lahore 63100, Pakistan
*
Author to whom correspondence should be addressed.
Water 2022, 14(7), 1132; https://doi.org/10.3390/w14071132
Submission received: 24 February 2022 / Revised: 23 March 2022 / Accepted: 24 March 2022 / Published: 1 April 2022

Abstract

:
This study focused on the trends of rainfall variability and drought monitoring in the northern region of Pakistan (Gilgit-Baltistan). Climate Hazards Group Infrared Precipitation with Stations (CHIRPS) model data were used for the period of 1981 to 2020. The Standardized Precipitation Index (SPI) was applied to assess the dry and wet conditions during the study period. The Mann–Kendall (MK) and Spearman’s rho (SR) trend tests were applied to calculate the trend of drought. A coupled model intercomparison project–global circulation model (CMIP5–GCMs) was used to project the future precipitation in Gilgit-Baltistan (GB) for the 21st century using a multimodel ensemble (MME) technique for representative concentration pathway (RCP) 4.5 and RCP 8.5. From the results, the extreme drought situations were observed in the 12-month SPI series in 1982 in the Diamir, Ghizer, and Gilgit districts, while severe drought in 1982–1983 was observed in Astore, Ghizer, Gilgit, Hunza-Nagar, and Skardu. Similarly, in 2000–2001 severe drought prevailed in Diamir, Ghanche, and Skardu. The results of MK and SR indicate a significant increasing trend of rainfall in the study area, which is showing the conversion of snowfall to rainfall due to climate warming. The future precipitation projections depicted an increase of 4% for the 21st century as compared with the baseline period in the GB region. The results of the midcentury projections depicted an increase in precipitation of about 13%, while future projections for the latter half of the century recorded a decrease in precipitation (about 9%) for both RCPs, which can cause flooding in midcentury and drought in the latter half of the century. The study area is the host of the major glaciers in Pakistan from where the Indus River receives its major tributaries. The area and volume of these glaciers are decreasing due to warming impacts of climate change. Therefore, this study is useful for proper water resource management to cope up with water scarcity in the future.

1. Introduction

Globally, the mean annual temperature is rising [1,2,3] and has resulted in variations in rainfall distribution, trend, and magnitude [3,4,5]. The variations in these climatic elements have put substantial impacts on a hydrological cycle [6,7]. Climate scientists are using varying spans of time series data to quantify changes in rainfall pattern and trend, which has resulted in flood and drought in different regions of the world [8]. Flood brings extensive damages and disruption in a short span of time in the areas of a river basin threatened by floods, well known as flood areas, and gets more attention worldwide as compared with drought. Drought causes significant socioeconomic and environmental impacts in a large area or in a region [9]. Droughts occur as a consequence of rainfall deficiency compared with the average for a season or years [10,11]. Less rainfall and high temperature lead to shortage of water and consequently result in drought, which causes severe impacts on the community and poses serious threats to the environment as well as economy [12,13,14]. It is hard to quantify the drought commencement and cessation because of its diverse nature, the topography of the area, and the spatial variability in rainfall as well as due to its slow-onset nature [15], and its aftermath can even be seen after the end of the drought event [16]. A decline in precipitation results in meteorological drought, and that ultimately leads to agricultural and hydrological drought [17,18,19]. Precipitation is the major factor that causes drought; however, an increase in temperature and a decrease in humidity also exacerbate the drought severity [20,21]. Moreover, the severity of drought can be more intense with less amount of soil moisture content and a longer duration of a dry period [17]. The direct impacts of drought are mortalities and malnutrition as it causes a shortage of water and food in a region [16]. More than 11 million people have lost their lives, and 2 billion people have been affected by drought in the 19th century, which is a substantial loss as compared with other natural hazards [22]. Drought also affects the agriculture sector and results in famine, socioeconomic loss, land degradation, and mass migration [15,20,23].
Droughts are divided into four types: meteorological, agricultural, hydrological, and socioeconomic [24,25]. Drought can be determined by its drastic effects; however, various methods are used to calculate the drought severity, occurrence, and frequency [26]. Information obtained about drought using various indices is valuable for drought monitoring, preparedness, and mitigation. Therefore, many methods/indices are developed by meteorologists and drought scientists (i.e., Standardized Precipitation Index (SPI) [27], Palmer drought severity index (PDSI) [28], Standardized Precipitation Evapotranspiration Index (SPEI) [29], Vegetation Cover Index (VCI) [30], Temperature Condition Index [31], and Precipitation Condition Index [32]. However, SPI is the simple and efficient method to calculate the drought and its intensity using precipitation data. Moreover, the significance of the SPI method is to estimate the possibility of drought occurrence regardless of the location, season, and climate of the area. For this reason, in this research, SPI is used to assess the drought occurrence, severity, and duration.
In 1900−2011, the precipitation in the eastern parts of North and South America, Northern Europe, and Northern and Central Asia increased, whereas in the Mediterranean, Southern Africa, and parts of Southern Asia, it decreased [33]. Various studies have analyzed rainfall trend with different techniques and historical climatic data. Khan et al., (2021) [14] assessed the precipitation and drought in Southwest Xinjiang, China, using SPI and MK tests. They observed that the study area faced a dry period from 1997–2015. The years 2001, 2011, and 2014 were reported as extremely dry periods. The MK test revealed the wet condition for a few met stations in north of the Tianshan Mountains. Rahman et al. (2021) [11] also assessed the rainfall pattern and drought condition in Khyber Pakhtunkhwa (KP) using the SR test and SPEI. The authors observed that 8 out of 15 met stations fall in a humid region, while 7 met stations fall in subhumid, semiarid, and arid regions. They observed dry conditions in all met stations during the study period, particularly in the northern and northeastern parts of the region, recording an increasing trend of drought. Rao [34] outlined substantial warming trends in the minimum, maximum, and mean temperatures in the Mahanadi River Basin (India). Salma et al. [35] estimated rainfall trends in the different climatic zones of Pakistan from 1976 to 2005 using the analysis of variance (ANOVA) method and Dennett T3 tests. They observed a decreasing trend of rainfall of −1.18 mm/decade throughout the country and revealed the adverse impact of decrease in rainfall in the form of drought. Raza et al. [36] used temperature data for the period of 1955–2010 for GB and concluded that temperature has increased in the recent decade (2001–2010) and become 0.33 °C warmer than in the period of 1955–2000. Khattak and Ali [37] carried out a detailed study to find trends in maximum monthly temperature and rainfall over Punjab Province using the MK test. They found increasing trends in both maximum monthly temperature (0.002 °C/year) and total annual rainfall (3.23 mm/year) over the region. Khan et al. (2020) [38] studied drought hazard assessment for the period of 2000–2015 using remote sensing and drought indices over a part of Punjab. The authors noted a meteorological drought spell in 2000–2002, 2004, 2009–2010, and 2012. They noticed multiple factors (temperature, precipitation, and soil moisture) involved in drought severity.
GCMs are the mathematical models widely used to project the future climate at the global scale [39]. Multiple GCMs have been developed to simulate coarse resolution CMIP5, which is a set of GCMs from the Intergovernmental Panel on Climate Change’s Fifth Assessment Report (IPCC AR5) [40]. CMIP5 has more than 50 GCM projections available for the global climate and has individual uncertainties for different regions. To overcome the issue of GCM uncertainties, multiple GCMs are coupled using MMEs to enhance the reliability of climate projections using different GCMs [41].
From the abovementioned literature, it is apparent that rainfall and temperature are the main driving factors of drought; thus, there is a dire need to assess the temperature and precipitation patterns of GB [36]. Many studies have been conducted on drought throughout Pakistan [11,14,20,38,42,43,44,45]; however, there is lack of drought and future prediction of rainfall studies in the mountainous region, especially in Gilgit-Baltistan. The GB region is part of the Upper Indus Basin (UIB), which is the source of water for the downstream region due to a nest of snow cover and glaciers. Therefore, this study has significance particularly in terms of proper water resource management. The shortage of water for the agriculture sector can lead to agriculture drought. Pakistan is an agroeconomic country and largely depends on snow and glacier melt water in the summer season. The aim of this study is to assess the temporal distribution of rainfall and meteorological drought, its severity, intensity, and frequency in Gilgit-Baltistan (GB) using Standardized Precipitation Index (SPI), and its trend was assessed using Spearman’s Rho and the Mann–Kendall trend method for the period of 1981–2020, and CMIP5 data were used for rainfall projection.

2. Materials and Methods
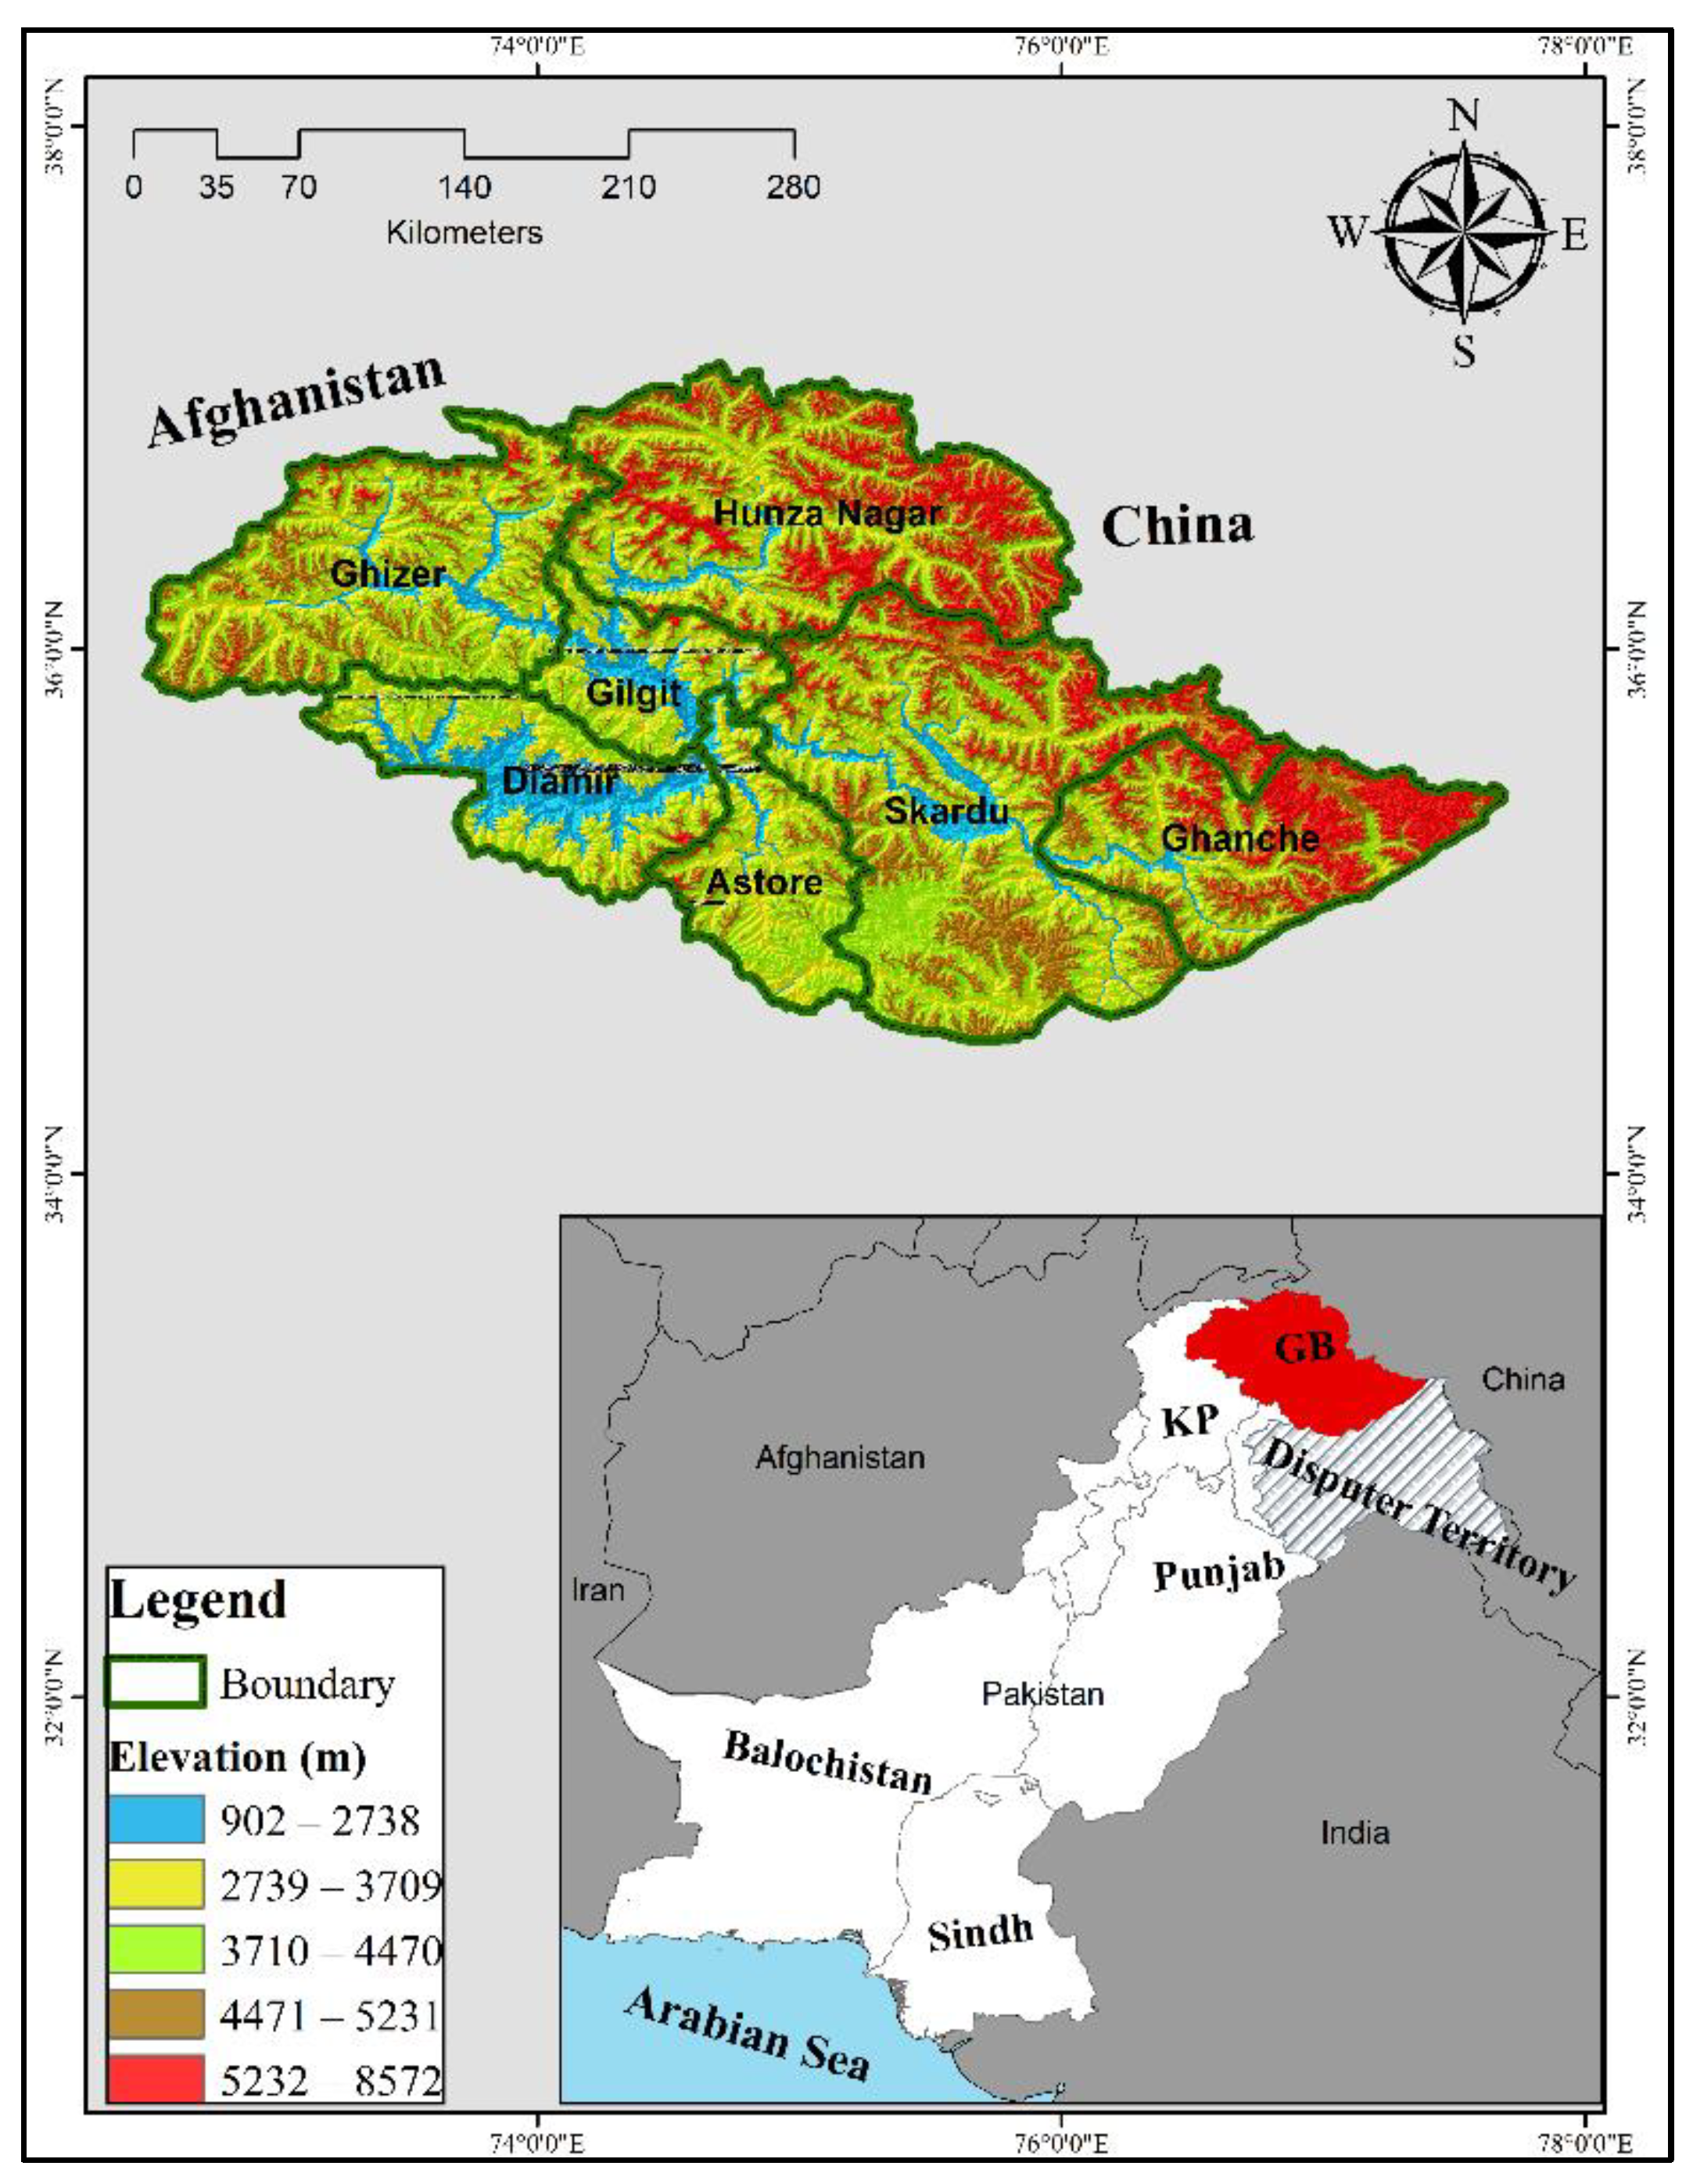
2.1. Study Area

Gilgit-Baltistan (GB) was formerly known as the Northern Areas of Pakistan. Geographically, GB lies between the latitudes of 34° N and 37° N and longitudes of 72° E to 77° E. GB is divided into seven administrative districts (Hunza-Nagar, Skardu, Astore, Gilgit, Diamir, Ghanche, and Ghizer). GB shares borders with China, Afghanistan, and India (Figure 1). GB covers the mountainous region of extreme North Pakistan, which includes the high-altitude areas of the Himalayas, Karakorum, and Hindu Kush ranges covering an area of 72,971 km2 [36]. The GB climate is hot in summer and cold in winter. GB has huge masses of snow, glaciers, and more than 50 peaks over 6500 m high, including 5 of the world’s 17 highest peaks. K2 is the highest peak (8611 m) in Pakistan and the second highest in the world, located in Gilgit-Baltistan. The region has more glacial ice than anywhere on earth outside the polar region, and thus, it is considered a third pole [46]. GB hosts more than 5000 glaciers, which include three longest glaciers (Biafo, Baltoro, and Batura) outside the polar regions [47]. The water flow in the Indus River is characterized by snow and glacier melt within GB, which is substantial in summers. Snowmelts in GB contribute 50% of the total water flow in the Indus River [48]. Indus is the largest river of Pakistan, and the country’s agriculture and hydropower production depend on it. GB also contains the nation’s most important natural forests, extensive mineral reserves, a wealth of biodiversity, and a rich cultural and archaeological heritage. In the mountains of GB, the occurrence of natural hazards, such as flash floods, avalanches, landslides, debris flows, and glacial lake outburst floods (GLOFs), are common [48]. Like other mountainous regions of the world, the climate of GB Province is also changing.

2.2. Methodology

The CHIRPS precipitation data were acquired from the CHIRPS website [49] for the period of 1981–2020 on a monthly basis. The gridded netcdf file (commonly known as network common data form, it has self-describing software libraries and machine independent data formats to create, access, and share the scientific data) was opened in a QGIS environment [50] and was extracted for the region of interest with an extract by a mask tool. The data were saved in a tiff format to obtain the monthly precipitation data. Eventually, the raster data were converted from raster to point data and further used for analysis. We calculated the descriptive statistics (standard deviation (SD), skewness, and kurtosis) in XLSTAT (XLSTAT is an add-on for Excel use for data analysis in Excel) Addinsoft in Excel [51]. In the next step, we evaluated the drought on a 1- and 12-month time scale using the SPI method. The drought trend was calculated using the MK and SR trend test methods. Drought characteristics are also calculated using run theory. Eventually, the rainfall future projection data were used to observe the pattern of rainfall in mid- and late century.

2.3. Source of Data

The gridded precipitation data of CHIRPS were used for the baseline period (1981–2020) with a spatial resolution of 0.05° × 0.05° [49]. The CHIRPS data were used due for the scarcity of meteorological stations in the study area. CHIRPS is a satellite-based precipitation product in combination with a ground-based gauge network that provides good correlation with the observed precipitation data [52]. The district wise annual and monthly precipitation data were extracted for GB. The monthly precipitation data for six GCMs were extracted from the IPCC data distribution center for the period of 2021–2100 (Table 1). The GCMs’ precipitation data were rescaled using a bilinear interpolation method to have similar resolution for the datasets [53].

2.4. Multimodel Ensembles (MMEs) for GCMs

MMEs are used for incorporating six GCMs’ precipitation data for the 21st century to reduce the uncertainties in the projections [40]. There are two approaches for MME (i.e., simple ensemble mean (SEM) and weighted ensemble mean (WEM) [60]. The SEM approach was applied, which is relatively simple, and its performance is better than the individual GCM on the rescaled GCMs [61]. SEM is calculated using simple arithmetic ensemble means for the precipitation of six GCMs for the study area (Equation (1)):
S E M = 1 n p = 1 n G C M p
where n is the number of GCMs used for the SEM, and G C M p refers to the precipitation simulations of GCMs for the future. The future precipitation projections are reclassified into midcentury (2021–2060) and late century (2061–2100) for each district of the study area.

2.5. Standardized Precipitation Index (SPI)

SPI solely depends on precipitation data for evaluating drought irrespective of any other hydrometeorological factors. The CHIRPS precipitation dataset covering the 1981–2020 temporal period was used for the calculation of SPI. The classification system of SPI defines the intensity of drought (Table 2). McKee et al. [27] created SPI in 1993. SPI is the number of standard deviations that can observe the deviation of rainfall from its mean and distribute it normally [27]. The SPI values range from −2 to 2. A value below zero indicates a drought condition, and a value above zero specifies a wet condition. SPI was designed to estimate the deficiency of rainfall at multiple time scales. It is the most efficient and reliable method for diverse topographical areas [62]. The mathematical formulation of SPI [27] is shown below.
S P I = X X ¯ σ  
Here, X is the monthly rainfall, X ¯ is the mean of the monthly rainfall, and σ represents the standard deviation. SPI was estimated using a drought indices calculator (DrinC) open-source software (it is developed by a center for the assessment of natural hazards and proactive planning and laboratory of reclamation works and water resource management, National University of Athens. It has a user-friendly interface to calculate meteorological, hydrological, and agricultural drought [63]. After calculation of SPI, the dry and wet conditions were categorized. The calculation can be made to evaluate drought events for short or long periods [64]. Short-term SPI is significant for agricultural purposes, whereas long-term SPI is for the study of water resources, such as groundwater supplies, surface water flow, and reservoir level. In this paper, the SPI results for 1 and 12 months were calculated and discussed.

2.6. Characterization of Drought

Drought was characterized using run theory to identify the drought events. Run theory is used on the basis of threshold values to identify the runs [65]. When the values are below or above the defined threshold level, the drought event will be defined accordingly. We defined a threshold value of −1 in XLSTAT Addinsoft. When the value goes below the defined threshold, it will be considered a drought, and a drought will be finished when the values surpass the threshold. Drought was characterized into drought duration, drought intensity, drought severity, and drought peak. The drought period starts when the SPI value is below −1, and the drought period is finished when the SPI value is above −1, which is defined as a drought duration and measure in months. Drought severity (DS) is a sum of negative SPI values for a drought duration. The average drought values in a drought period are drought intensity (DI), and the peak of the drought (DP) is the lowest value reached in a drought duration.
D S = K = 1 D D   i n d e x K
D I = D S D D
Drought severity can be calculated using Equation (3) and the intensity of a drought can be derived using Equation (4), where, K represents month, and SPI values represent indexK in K month.

2.7. The Mann–Kendall Trend Test

The World Meteorological Organization (WMO) endorses the MK trend test, which is a nonparametric trend test used to assess the presence of significant trends in variables using time-series data. According to the MK test, the null hypothesis infers that the variable is independent and identically distributed (no trend), with the alternative hypothesis being that a monotonic trend occurs over time. Thus, the statistical X variables tested are calculated as follows:
X = j = k m 1   k = j + 1 m   s g n ( y k y j ) ,  
where
s g n ( x k x j ) , = { + 1 , y k > y j 0 , x k = y j 1 , x k < x j }
X is normally distributed. If the mean is 0, then the variance is:
V a r ( S ) = 1 18 [ n ( n 1 ) ( 2 n + 5 ) p = 1 q t p ( t p 1 ) ( 2 t p + 5 ) ]  
Here, ‘t’ is the range of any node. When n > 10, ZMK joins a normal distribution and is computed as follows:
Z M K = { X 1 V a r ( X ) i f   X > 0 0 i f   X = 0 X + 1 V a r ( X ) i f   X < 0
The positive values of the X statistic specify a decreasing drought trend, while the negative ones specify an increasing drought trend. The null hypothesis of no trend is excluded if |ZMK| > [Z1-a/2] [20]. A comprehensive depiction of the test can be found elsewhere [66,67]. The MK test has two benefits: (1) it does not need the data to be normally distributed and (2) sensitivity is very low to break the data due to inhomogeneity.

2.8. Spearman’s Rho Test

Spearman’s Rho is a nonparametric method used for trend analysis because it is very easy and simple method. The ‘B’ statistic and standardized test statistics YB are shown below in Equation (9). This method was developed by Spearman in 1904 [68].
B = 1 6 i = 0 n [ J ( L i ) M ] 2 n ( n 2 1 )  
Y B = B n 2 1 B 2  
Here, J(Li) is used to rank the observations, and n indicates the length of the observations. The decreasing drought trend can be observed with positive values of YB and vice versa. The 95% of significance level was used in this study. When a positive or negative trend detects it, the null hypothesis is rejected.

3. Results and Discussion

3.1. Spatiotemporal Variability of Rainfall

The evaluation of rainfall variability in the seven districts of Gilgit-Baltistan was based on precipitation dataset of CHIRPS. According to the classification of rainfall regions, the Hunza-Nagar and Ghanche districts fall under cold arid region, while the rest of the districts fall under cold semiarid regions [69] (Table 3). The data were statistically evaluated to observe the mean, standard deviation, skewness, and kurtosis in the total annual precipitation for each district. The mean annual precipitation varies considerably over the study area, from 227.19 mm (Ghanche) to 551.54 mm in the Diamir district (Table 3). The standard deviation represents the variability in annual rainfall. The highest rainfall variability was observed in Astore (86.66 mm), followed by the Diamir (85.26 mm) and Skardu (61.67 mm) districts, while lowest rainfall variability was observed in the Ghanche district (42.40 mm), followed by Hunza-Nagar (44.02 mm), which represent the high rainfall variability in the region (Table 3). The data are considered normally distributed if the skewness and kurtosis have the value of zero or near zero, respectively. The results revealed that the data are positively skewed for all the districts except Gilgit (Table 3), which indicates an increasing trend of precipitation from what is normal. The results revealed that all districts have negative kurtosis, which implies a flat peak near the mean.

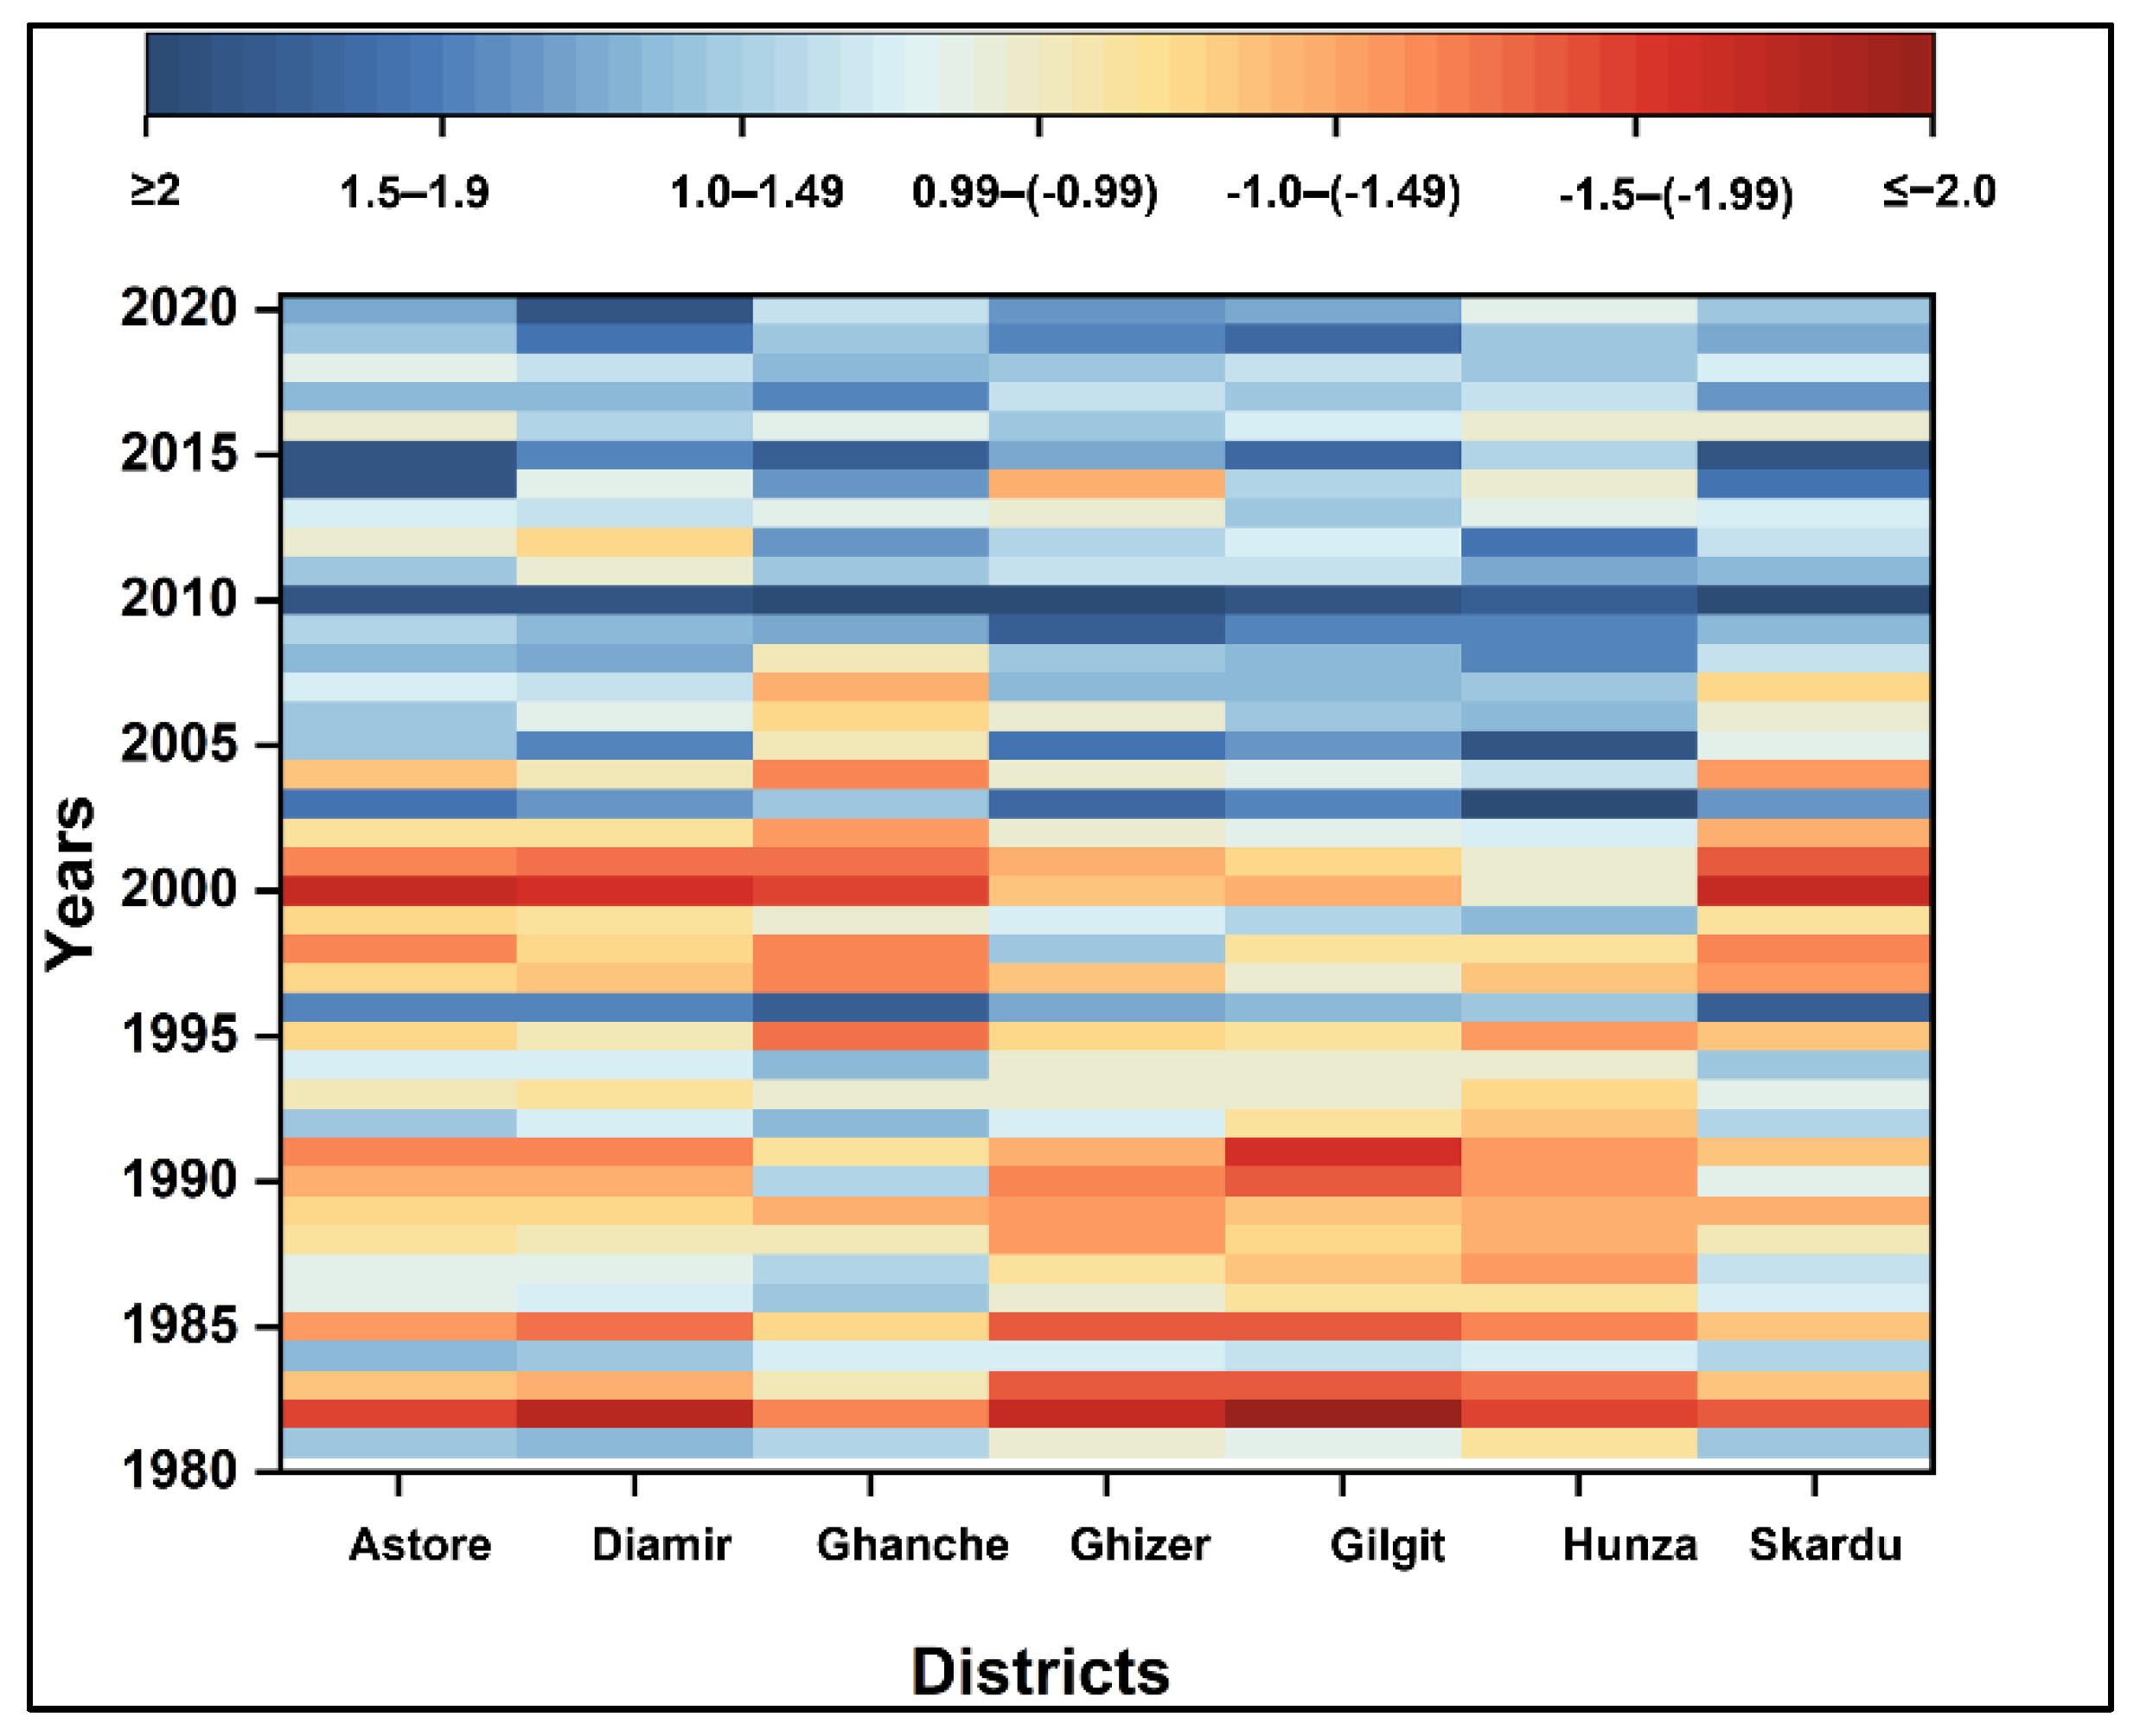
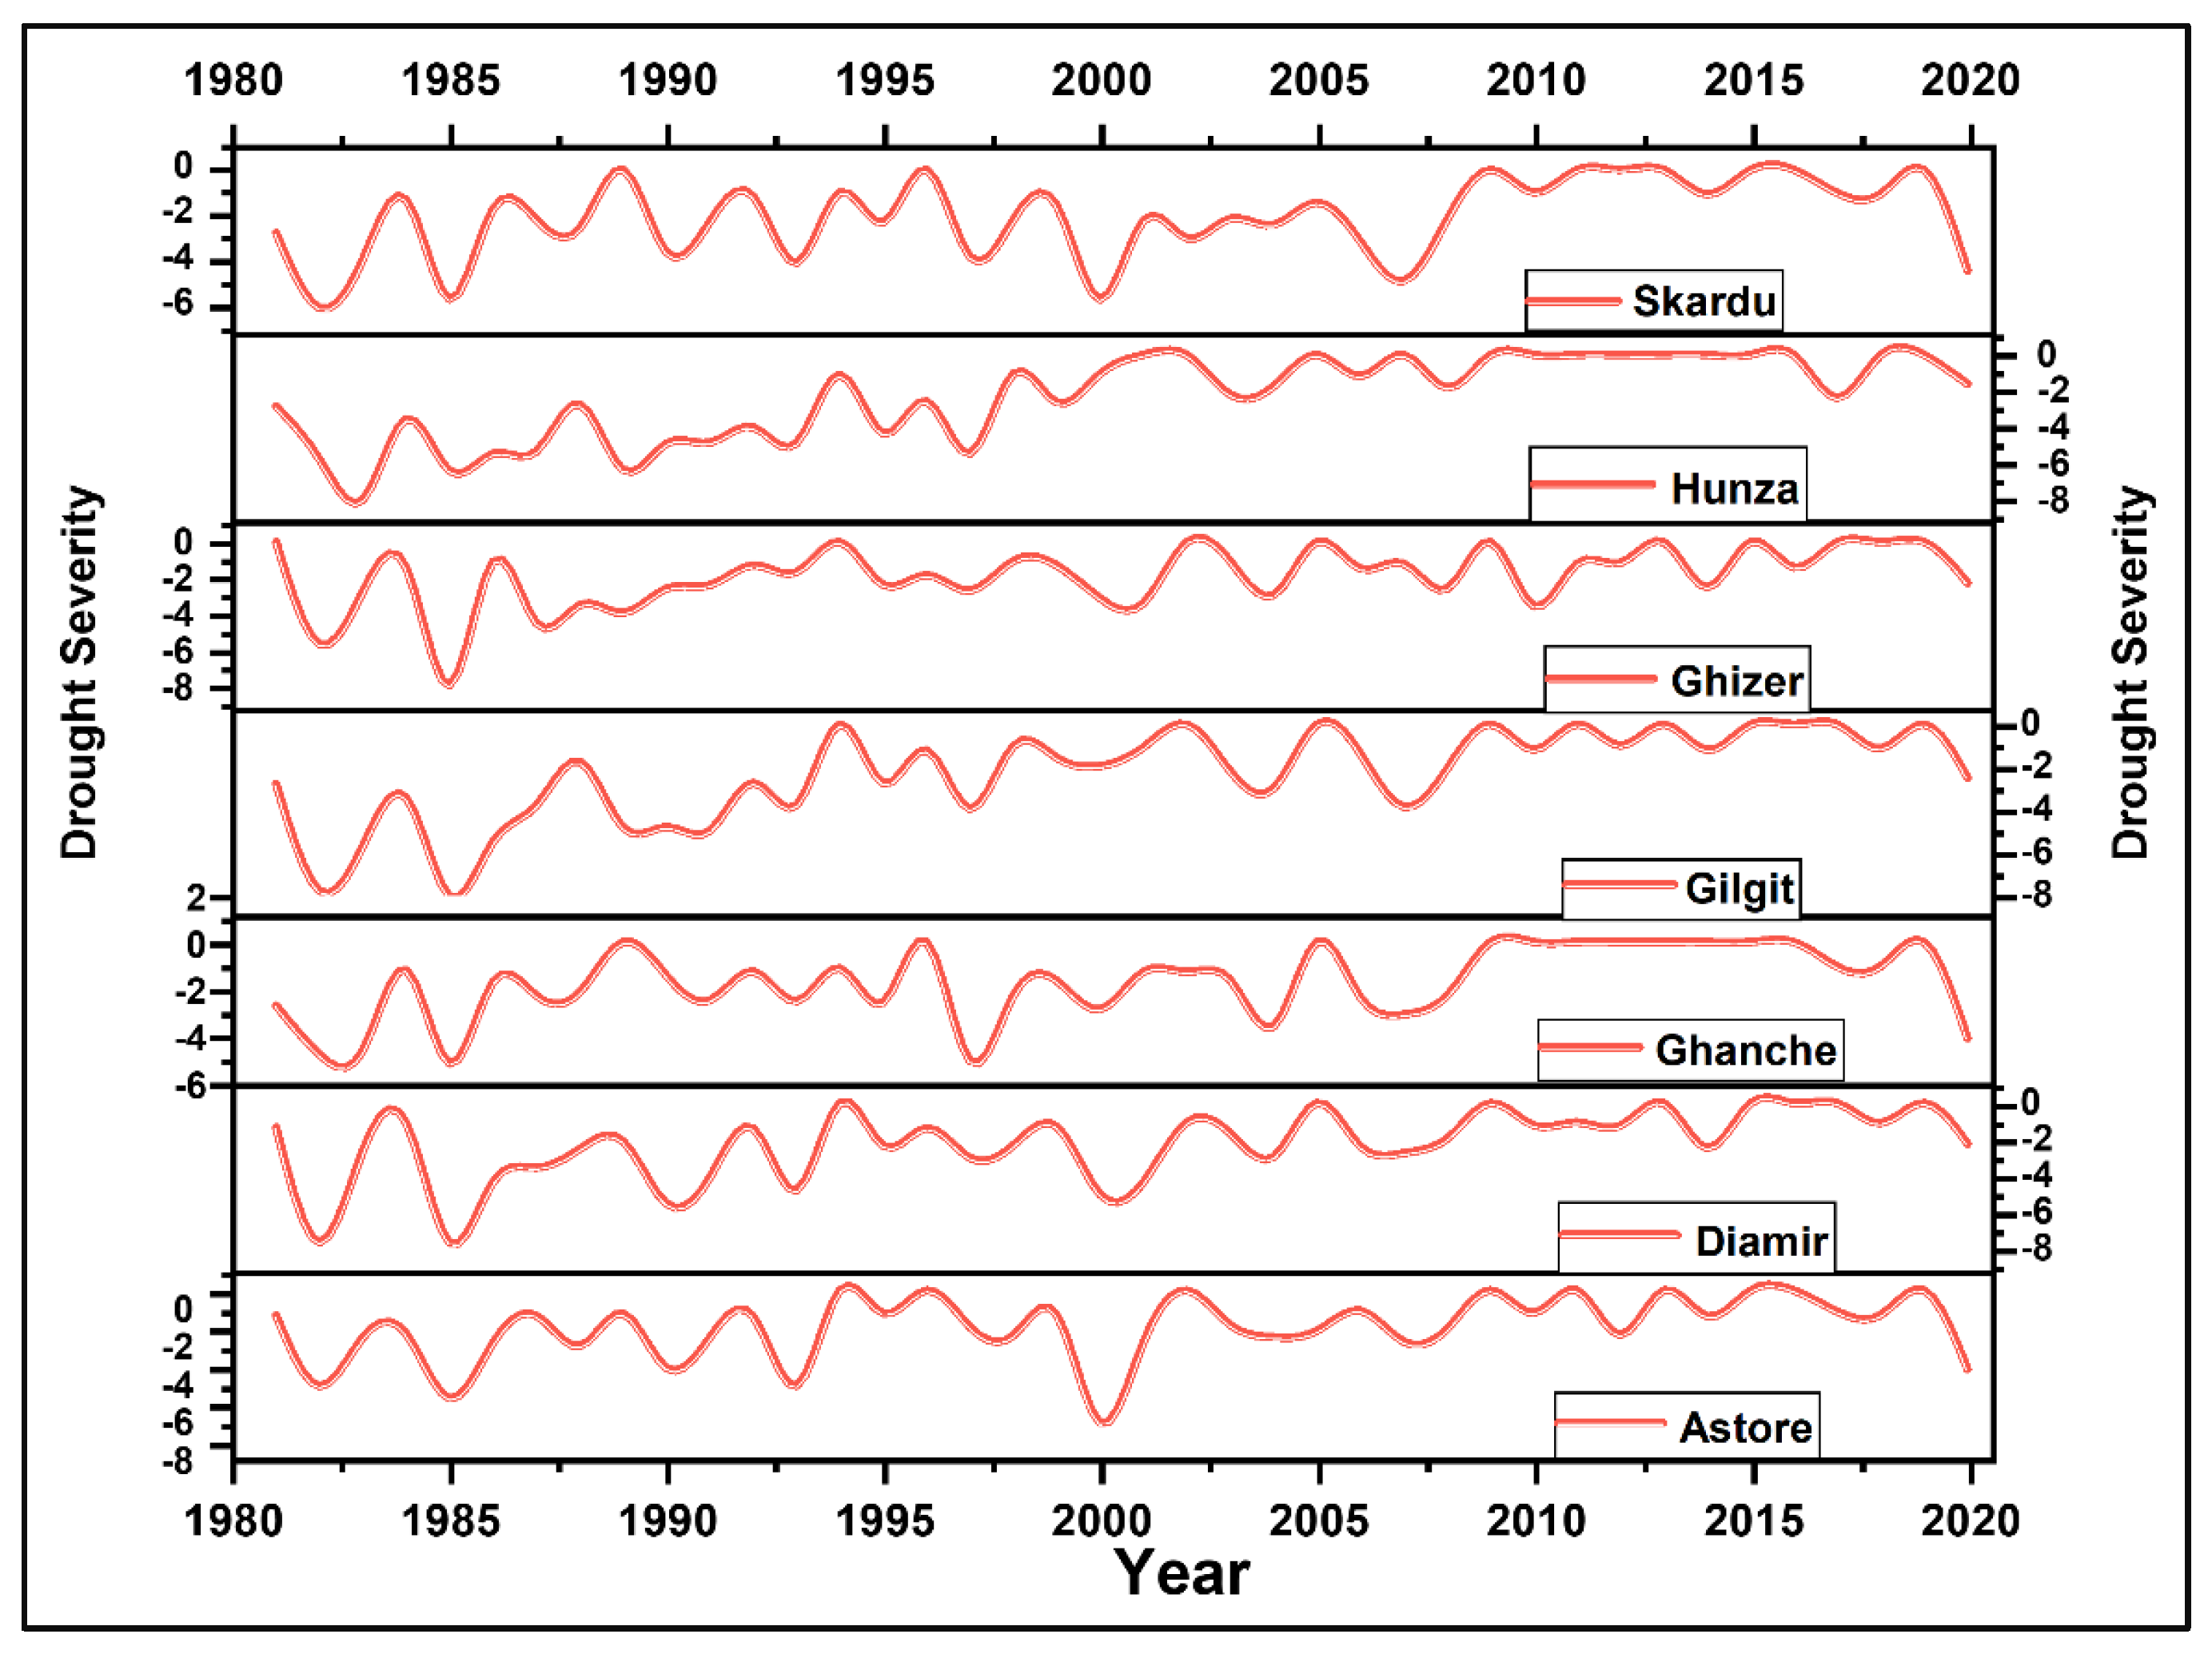
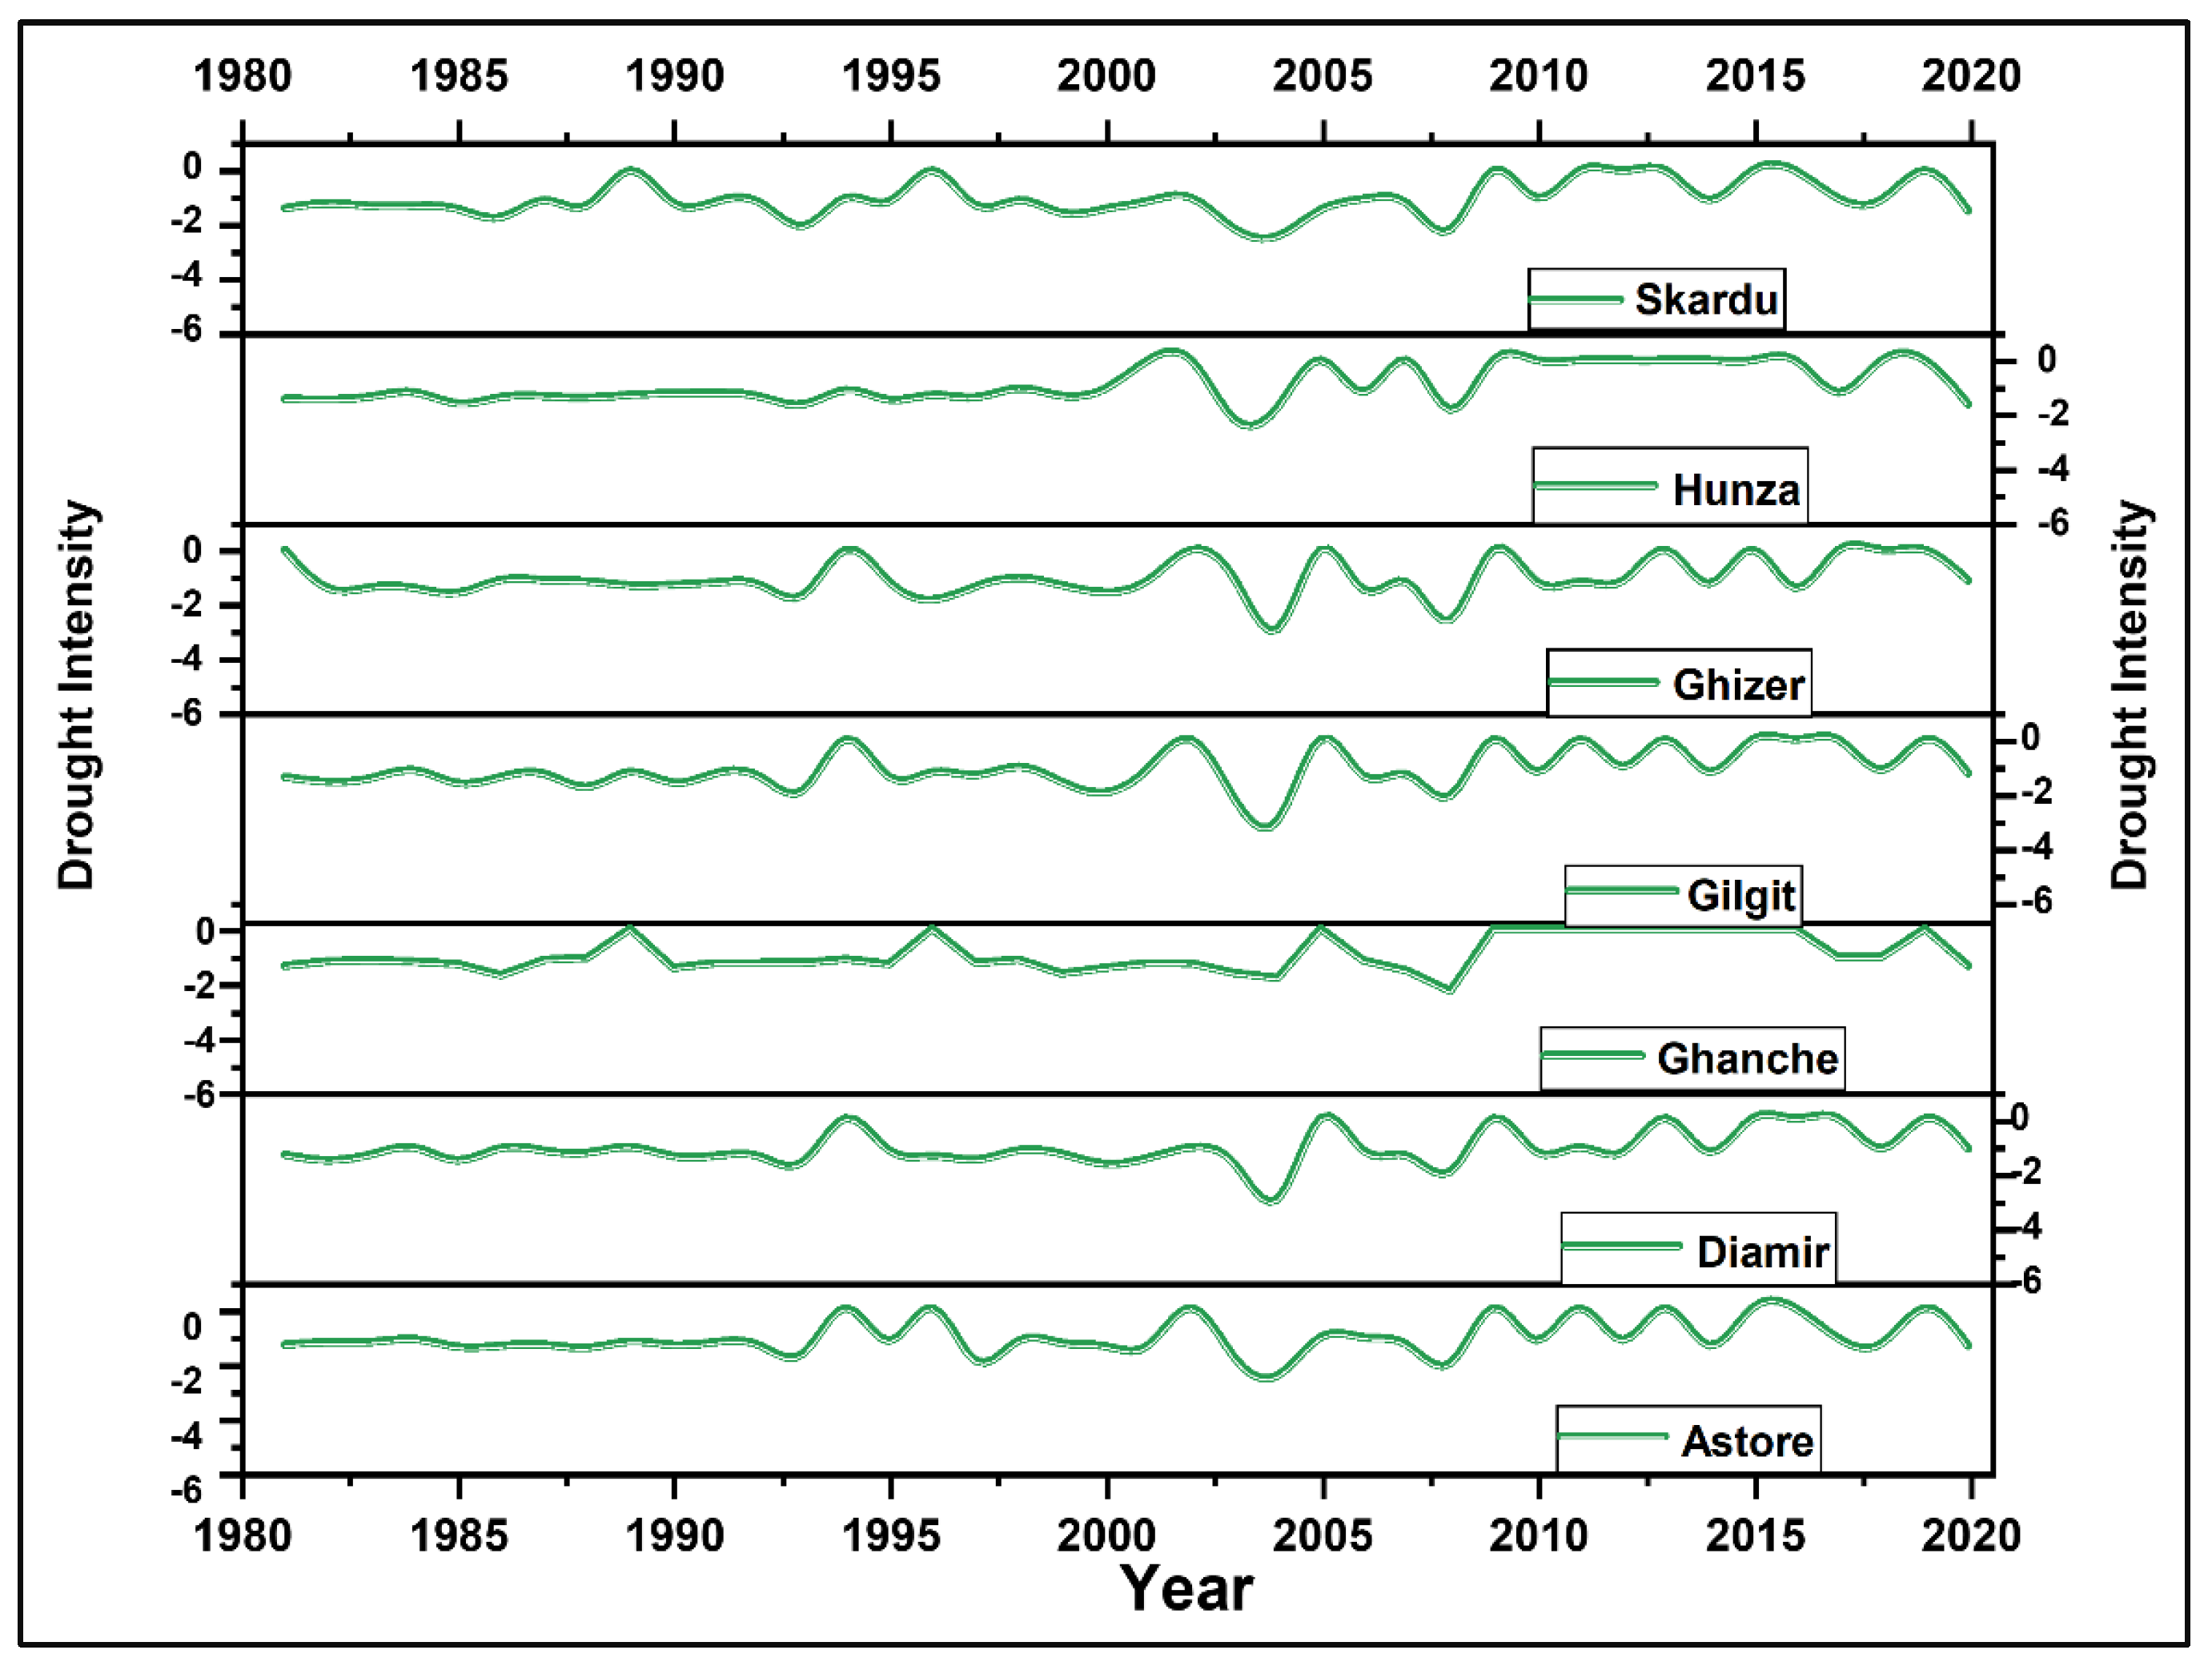
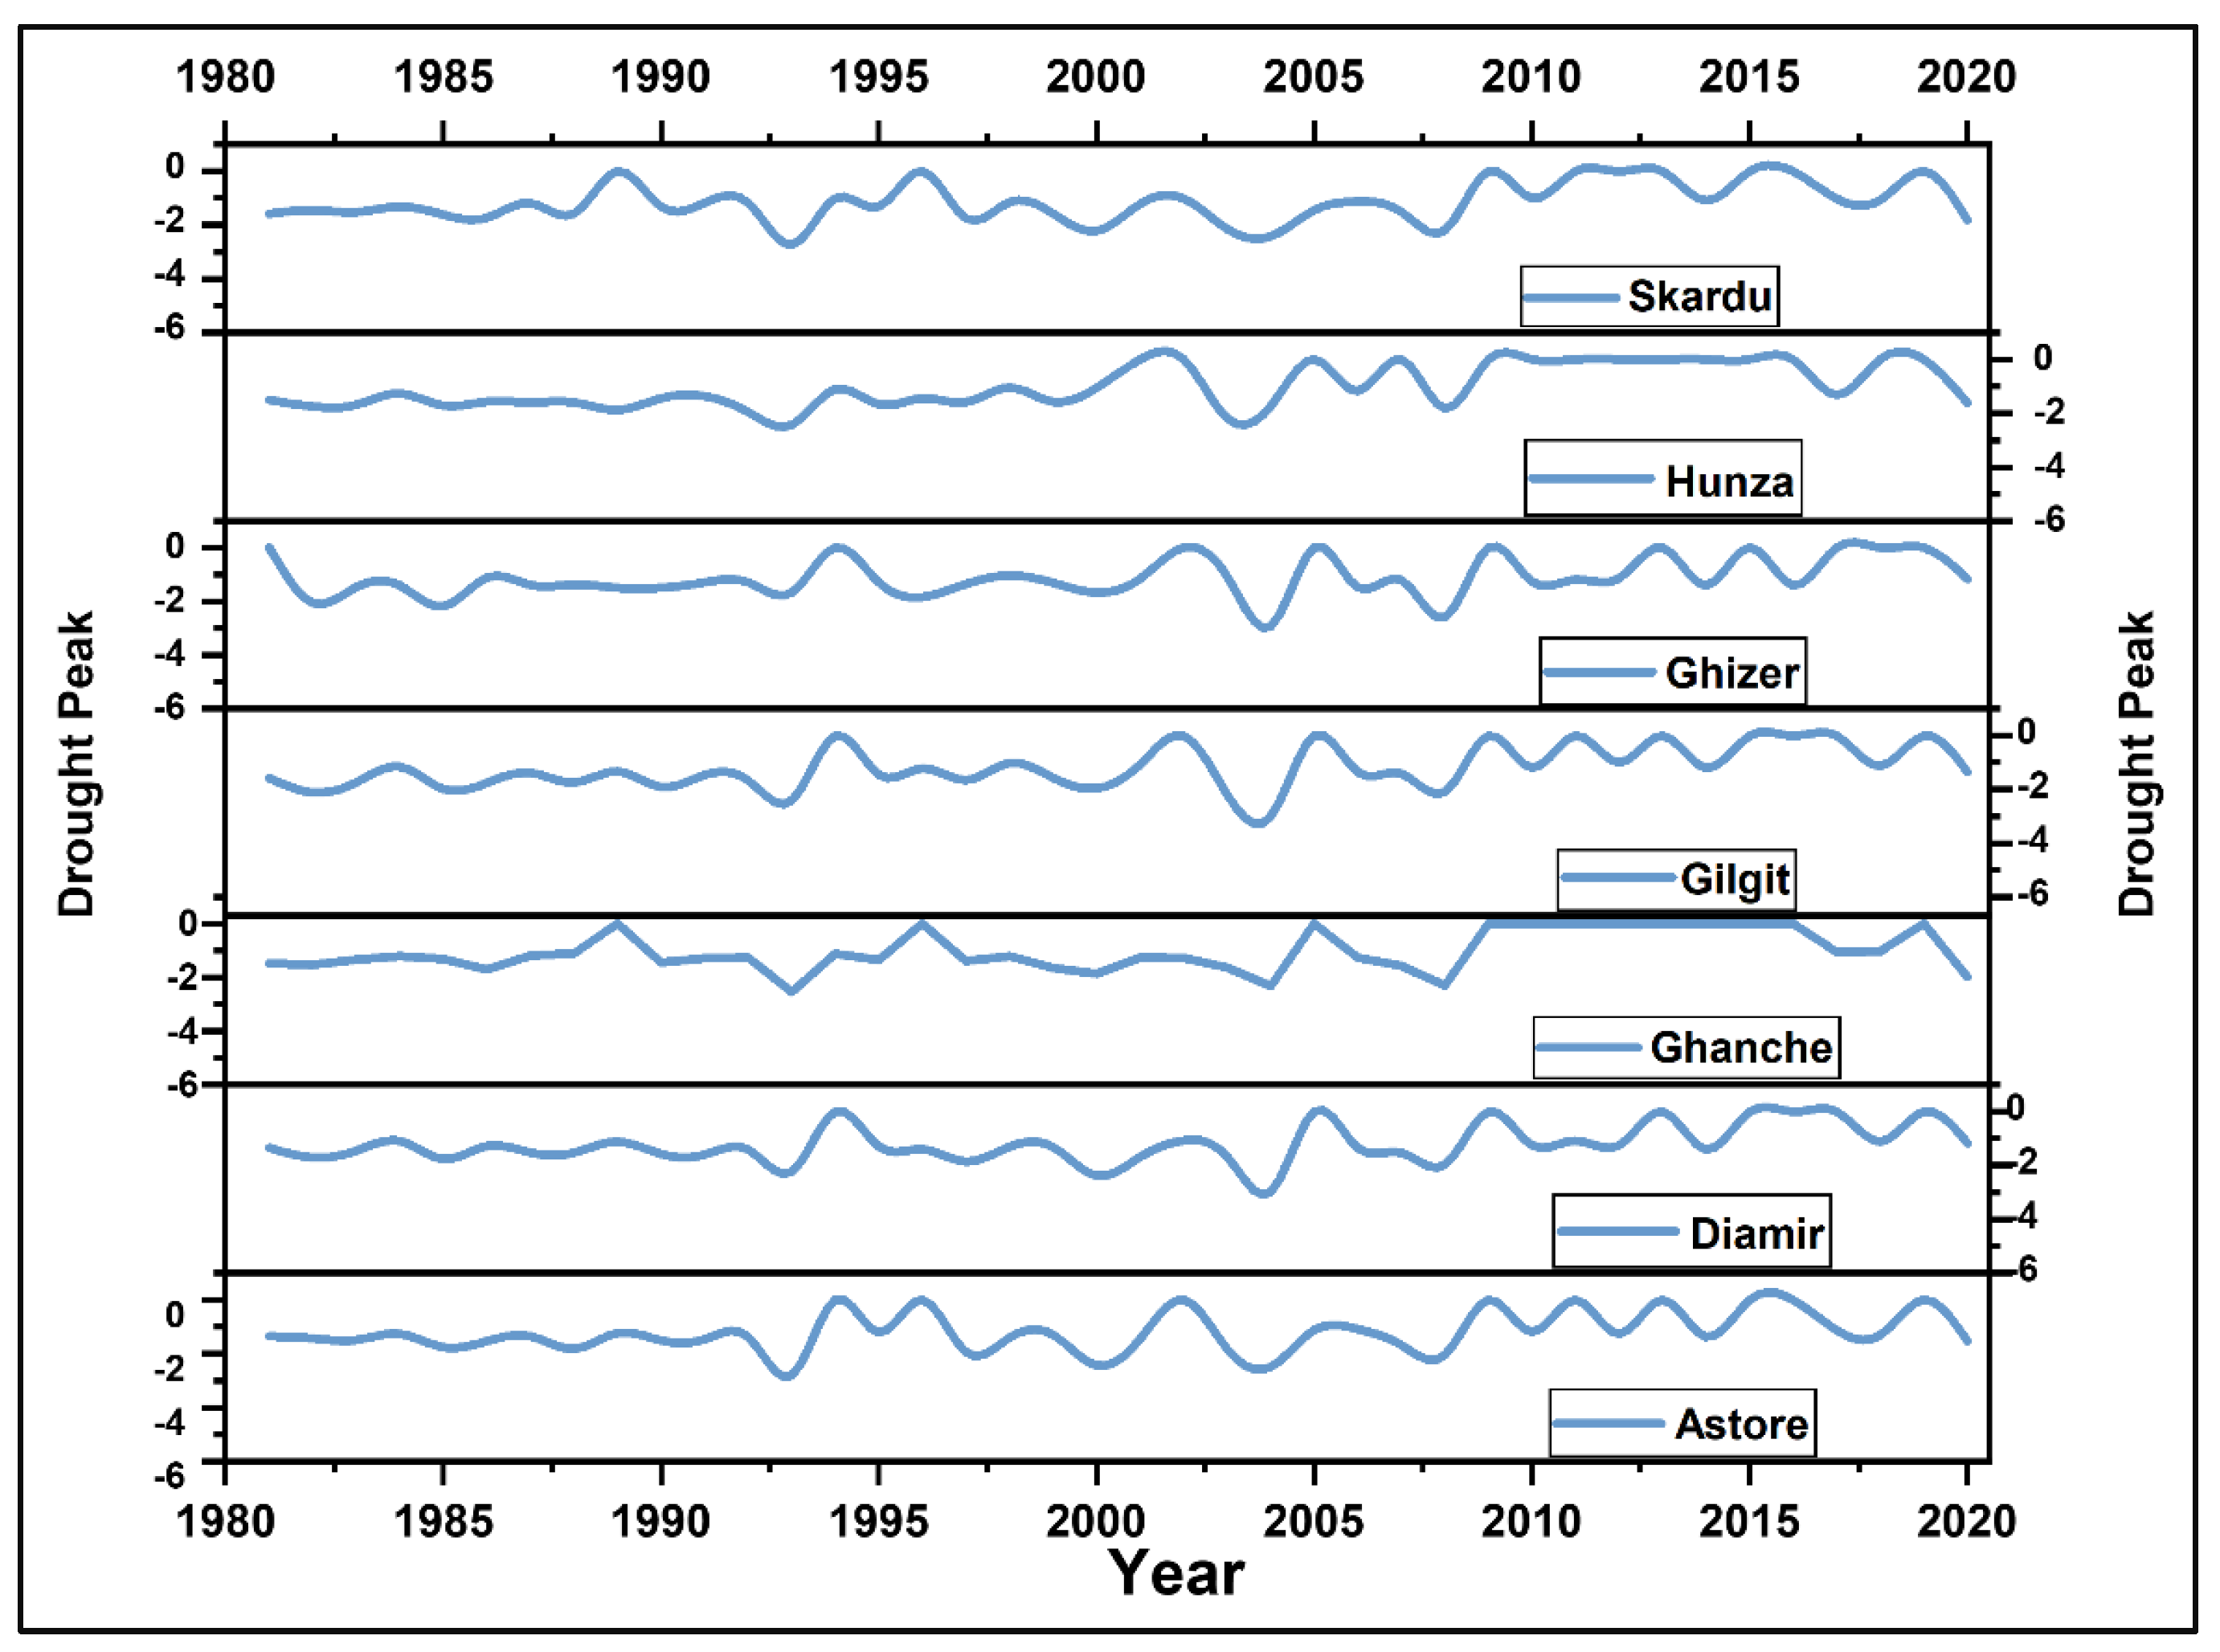
3.2. Temporal Analysis of SPI

The long-term SPI period is an integrated effect of short-term SPI; therefore, both 1-month and 12-month SPIs were calculated. The results of 12-month SPI is considered for the month of December, as presented in Figure 2. The results of 1-month and 12-month SPIs indicated drought and wet conditions for all districts during the study period. The 1-month SPI results revealed moderate to extreme drought in the period of 1981–2020 at different locations in Gilgit-Baltistan. In 1-month SPI, the Astore district witnessed 14 months of moderate drought and 6 months of severe drought from 1981 to 1990. It was observed that after the year of 1990 (1991–2020), the Astore district experienced 5 months of extreme drought, 25 months of moderate drought, and 3 months of severe drought (Table 4). The Diamir district went through 2 months of extreme drought, 11 months of severe drought, and 33 months of moderate drought in the period of 1981–2000; however, in the 21st century the number of drought months decreased, and the district witnessed 13 months of moderate drought, 6 months of severe drought, and 1 month of extreme drought (Table 4). The Ghanche district experienced 37 months of moderate drought, and 7 and 3 months of severe and extreme droughts, respectively, in the period of 1981–2020. The Ghizer district suffered 47 months of moderate drought, 5 months of severe drought, and 4 months of extreme drought conditions during the period of 1981–2020.
It was examined that the Gilgit district faced 30 months of moderate drought, 11 months of severe drought, and 2 months of extreme drought in 1981–1995. The dry condition prevailed in Gilgit in 1996–2020, and the district experienced 15 months of moderate drought, 3 months of severe drought, and 2 months of extreme drought (Table 4). Moreover, the Skardu district faced 64% of the moderate drought events in the first half of the study period (1981–2000), while 36% of the moderate drought events occurred in the period of 2001–2020. Similarly, the district went through 77% of the severe drought events in the period of 1981–2000, and only 23% (2) of the drought events happened in 2001–2020. However, it was determined that extreme drought events were high (60%) in 2001–2020 as compared with the period of 1981–2000 (40%) (Table 4). As compared with the Skardu district, Hunza-Nagar witnessed 93% of the moderate drought events in 1981–2000, while only 7% of the moderate drought events occurred in the period of 2001–2020. Additionally, 85% of the severe and 50% of the extreme dry spells occurred in 1981–2000, while the rest happened in the period of 2001–2020 (Table 4). The highest number of extreme drought events in 1-month SPI was experienced by Astore, Gilgit, and Skardu. The lowest number of severe drought events was observed in the Ghizer district, followed by Skardu and Astore. On the other hand, the highest number of moderate drought events was examined in Skardu, followed by Ghizer. The highest number of total drought months was observed in the Hunza-Nagar district (67), followed by Diamir (65) and Gilgit (64), and the lowest drought months were observed in the Ghanche district (47), followed by Astore (53) and Ghizer (56) in 1-month SPI.
From Figure 2, it can be clearly observed that GB faced various dry spells in the study period. The 12-month SPI results revealed severe to extreme drought conditions from 1982 to 1983 in almost all districts of GB (Figure 2). Another extreme drought spell started in 1989 and was finished in 1991 in all districts of GB except Ghanche. The dry spell was followed by a wet condition in 1996, while in 1998, a moderate drought event occurred in the Astore, Ghanche, and Skardu districts. The Astore, Diamir, Ghanche, and Skardu districts suffered from severe to extreme drought conditions in the year of 2000 and 2001; similarly, Gilgit and Hunza-Nagar went through a moderate drought condition (2000–2001). The results revealed three dry spells: first from 1982 to 1983, second from 1989 to 1991, and third from 1997 to 2002 (Table 5). The highest frequency of severe drought was observed in Gilgit, followed by Ghizer, Hunza-Nagar, and Skardu. On the other hand, highest number of moderate drought events was examined in the Hunza-Nagar and Ghanche districts, followed by Diamir, Astore, and Ghizer. The overall highest drought events were found in the Hunza-Nagar district, followed by Ghanche, Diamir, and Ghizer (Figure 3).

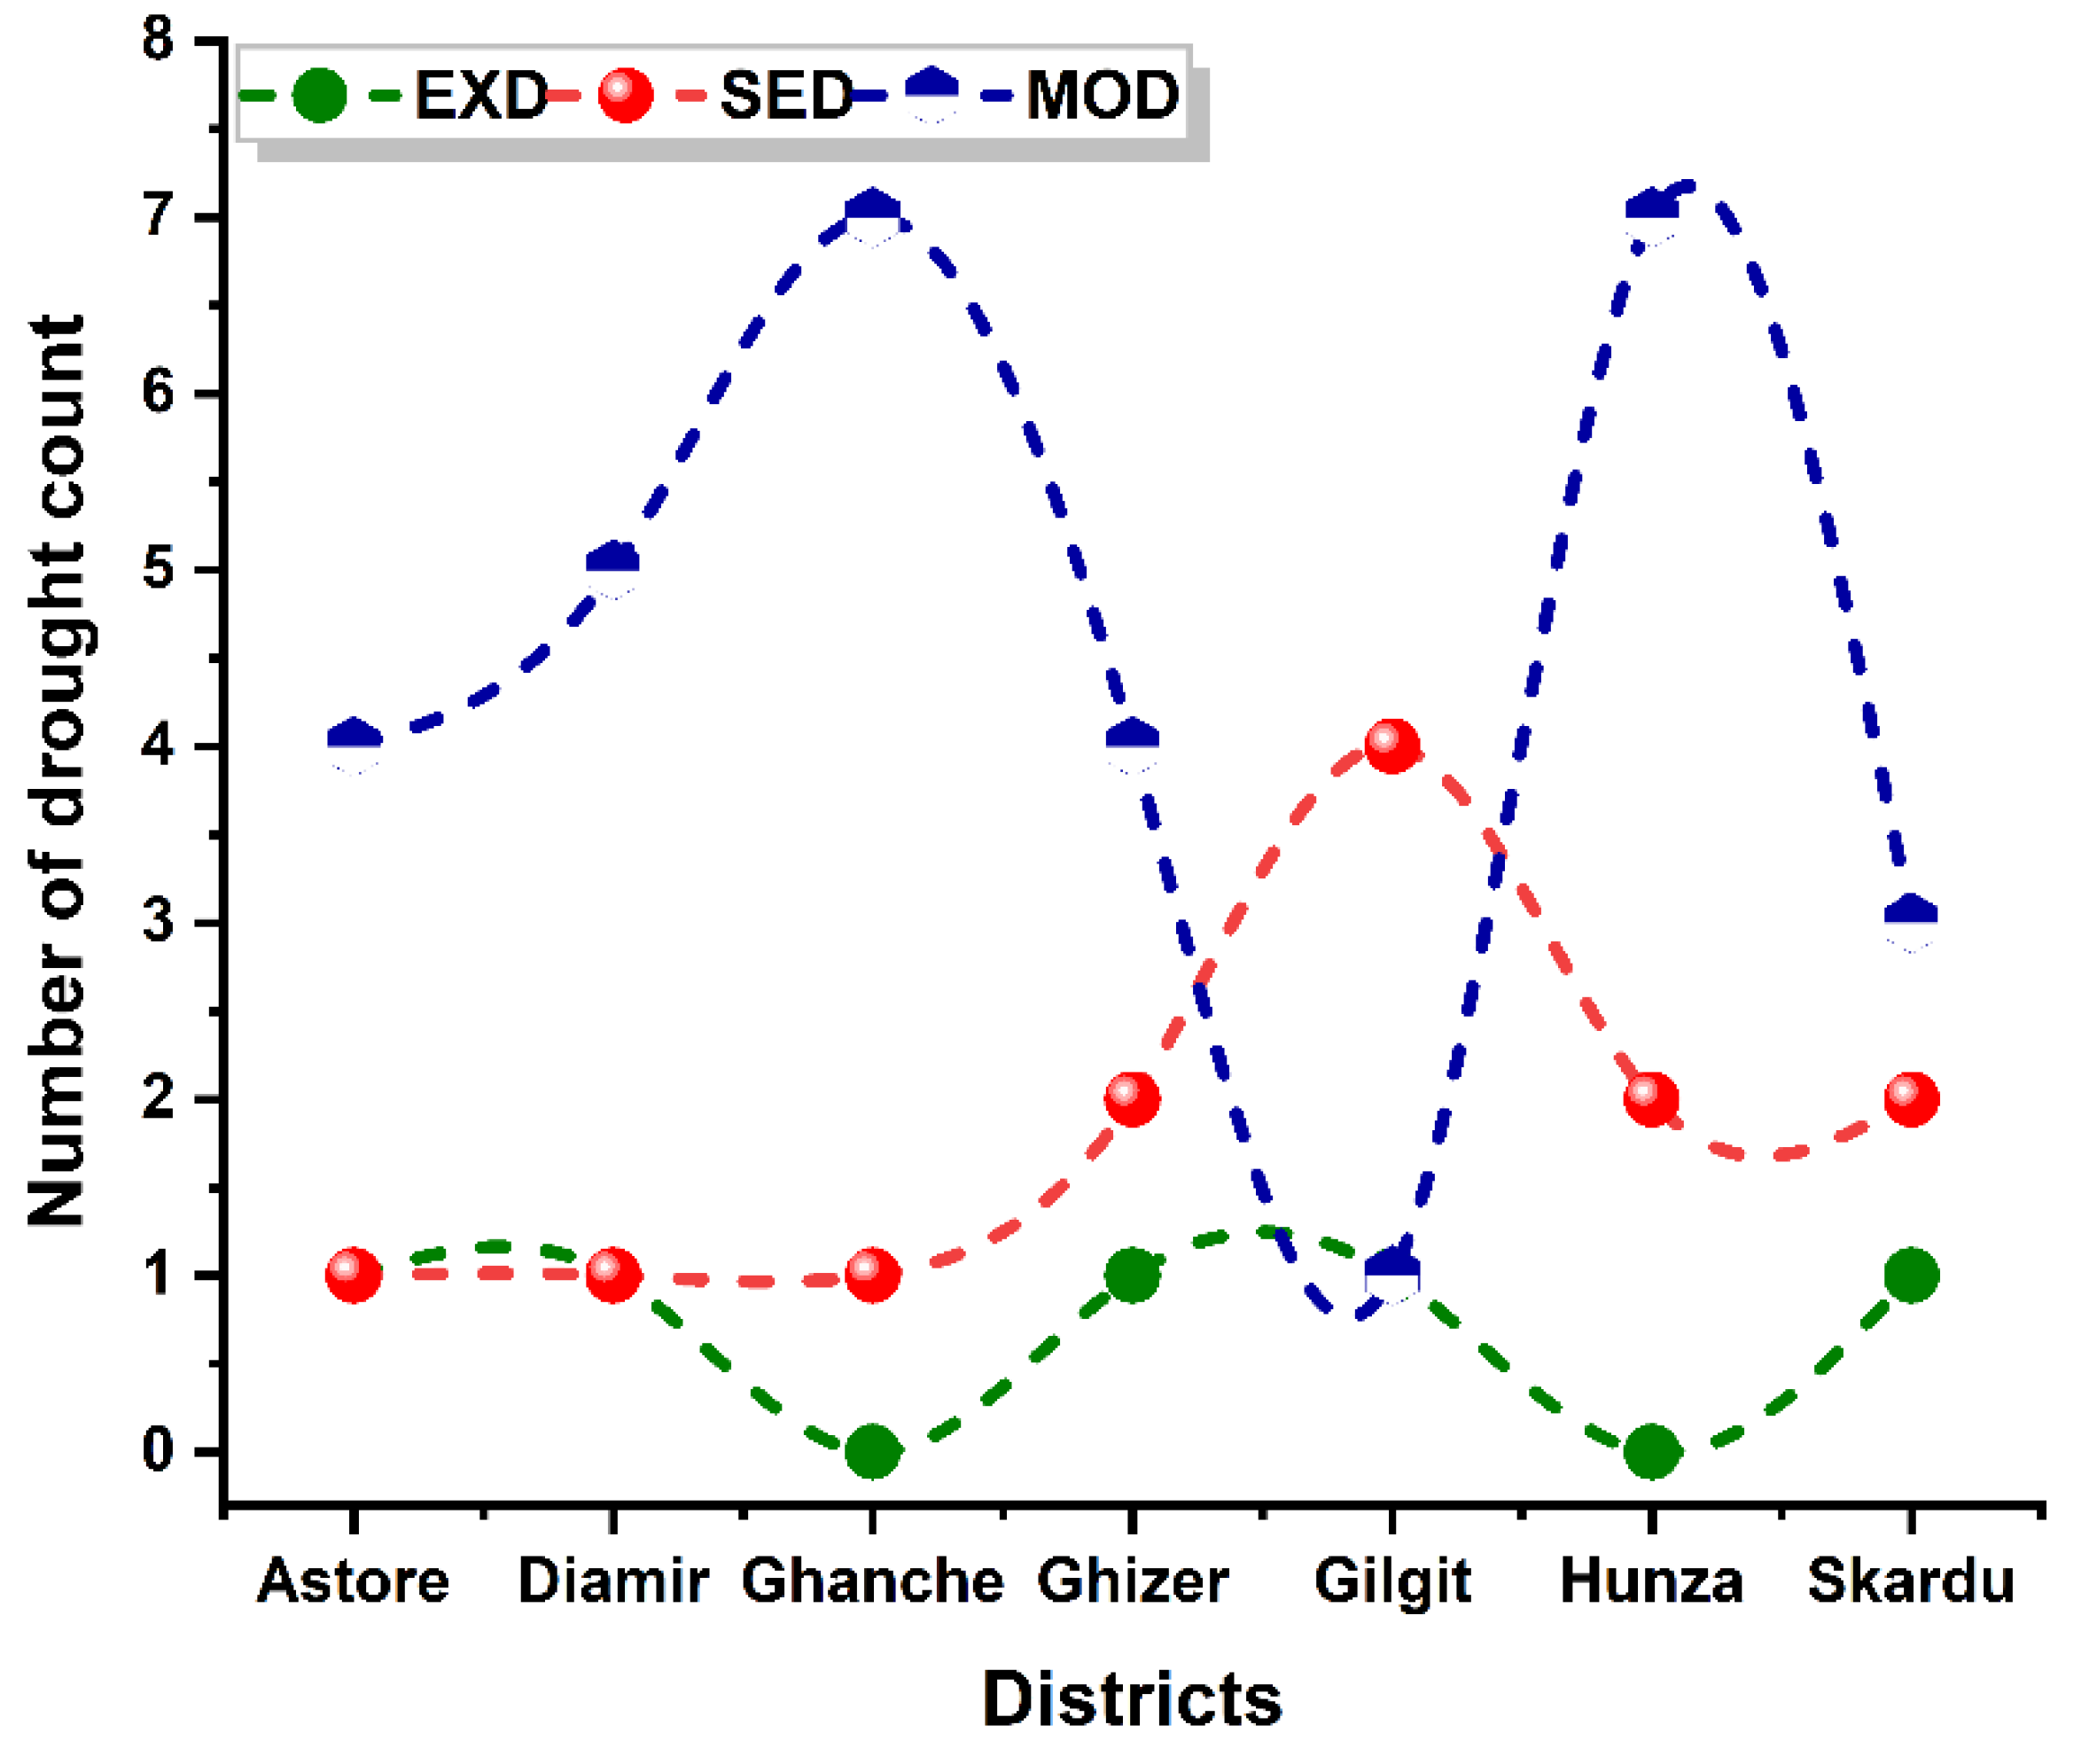
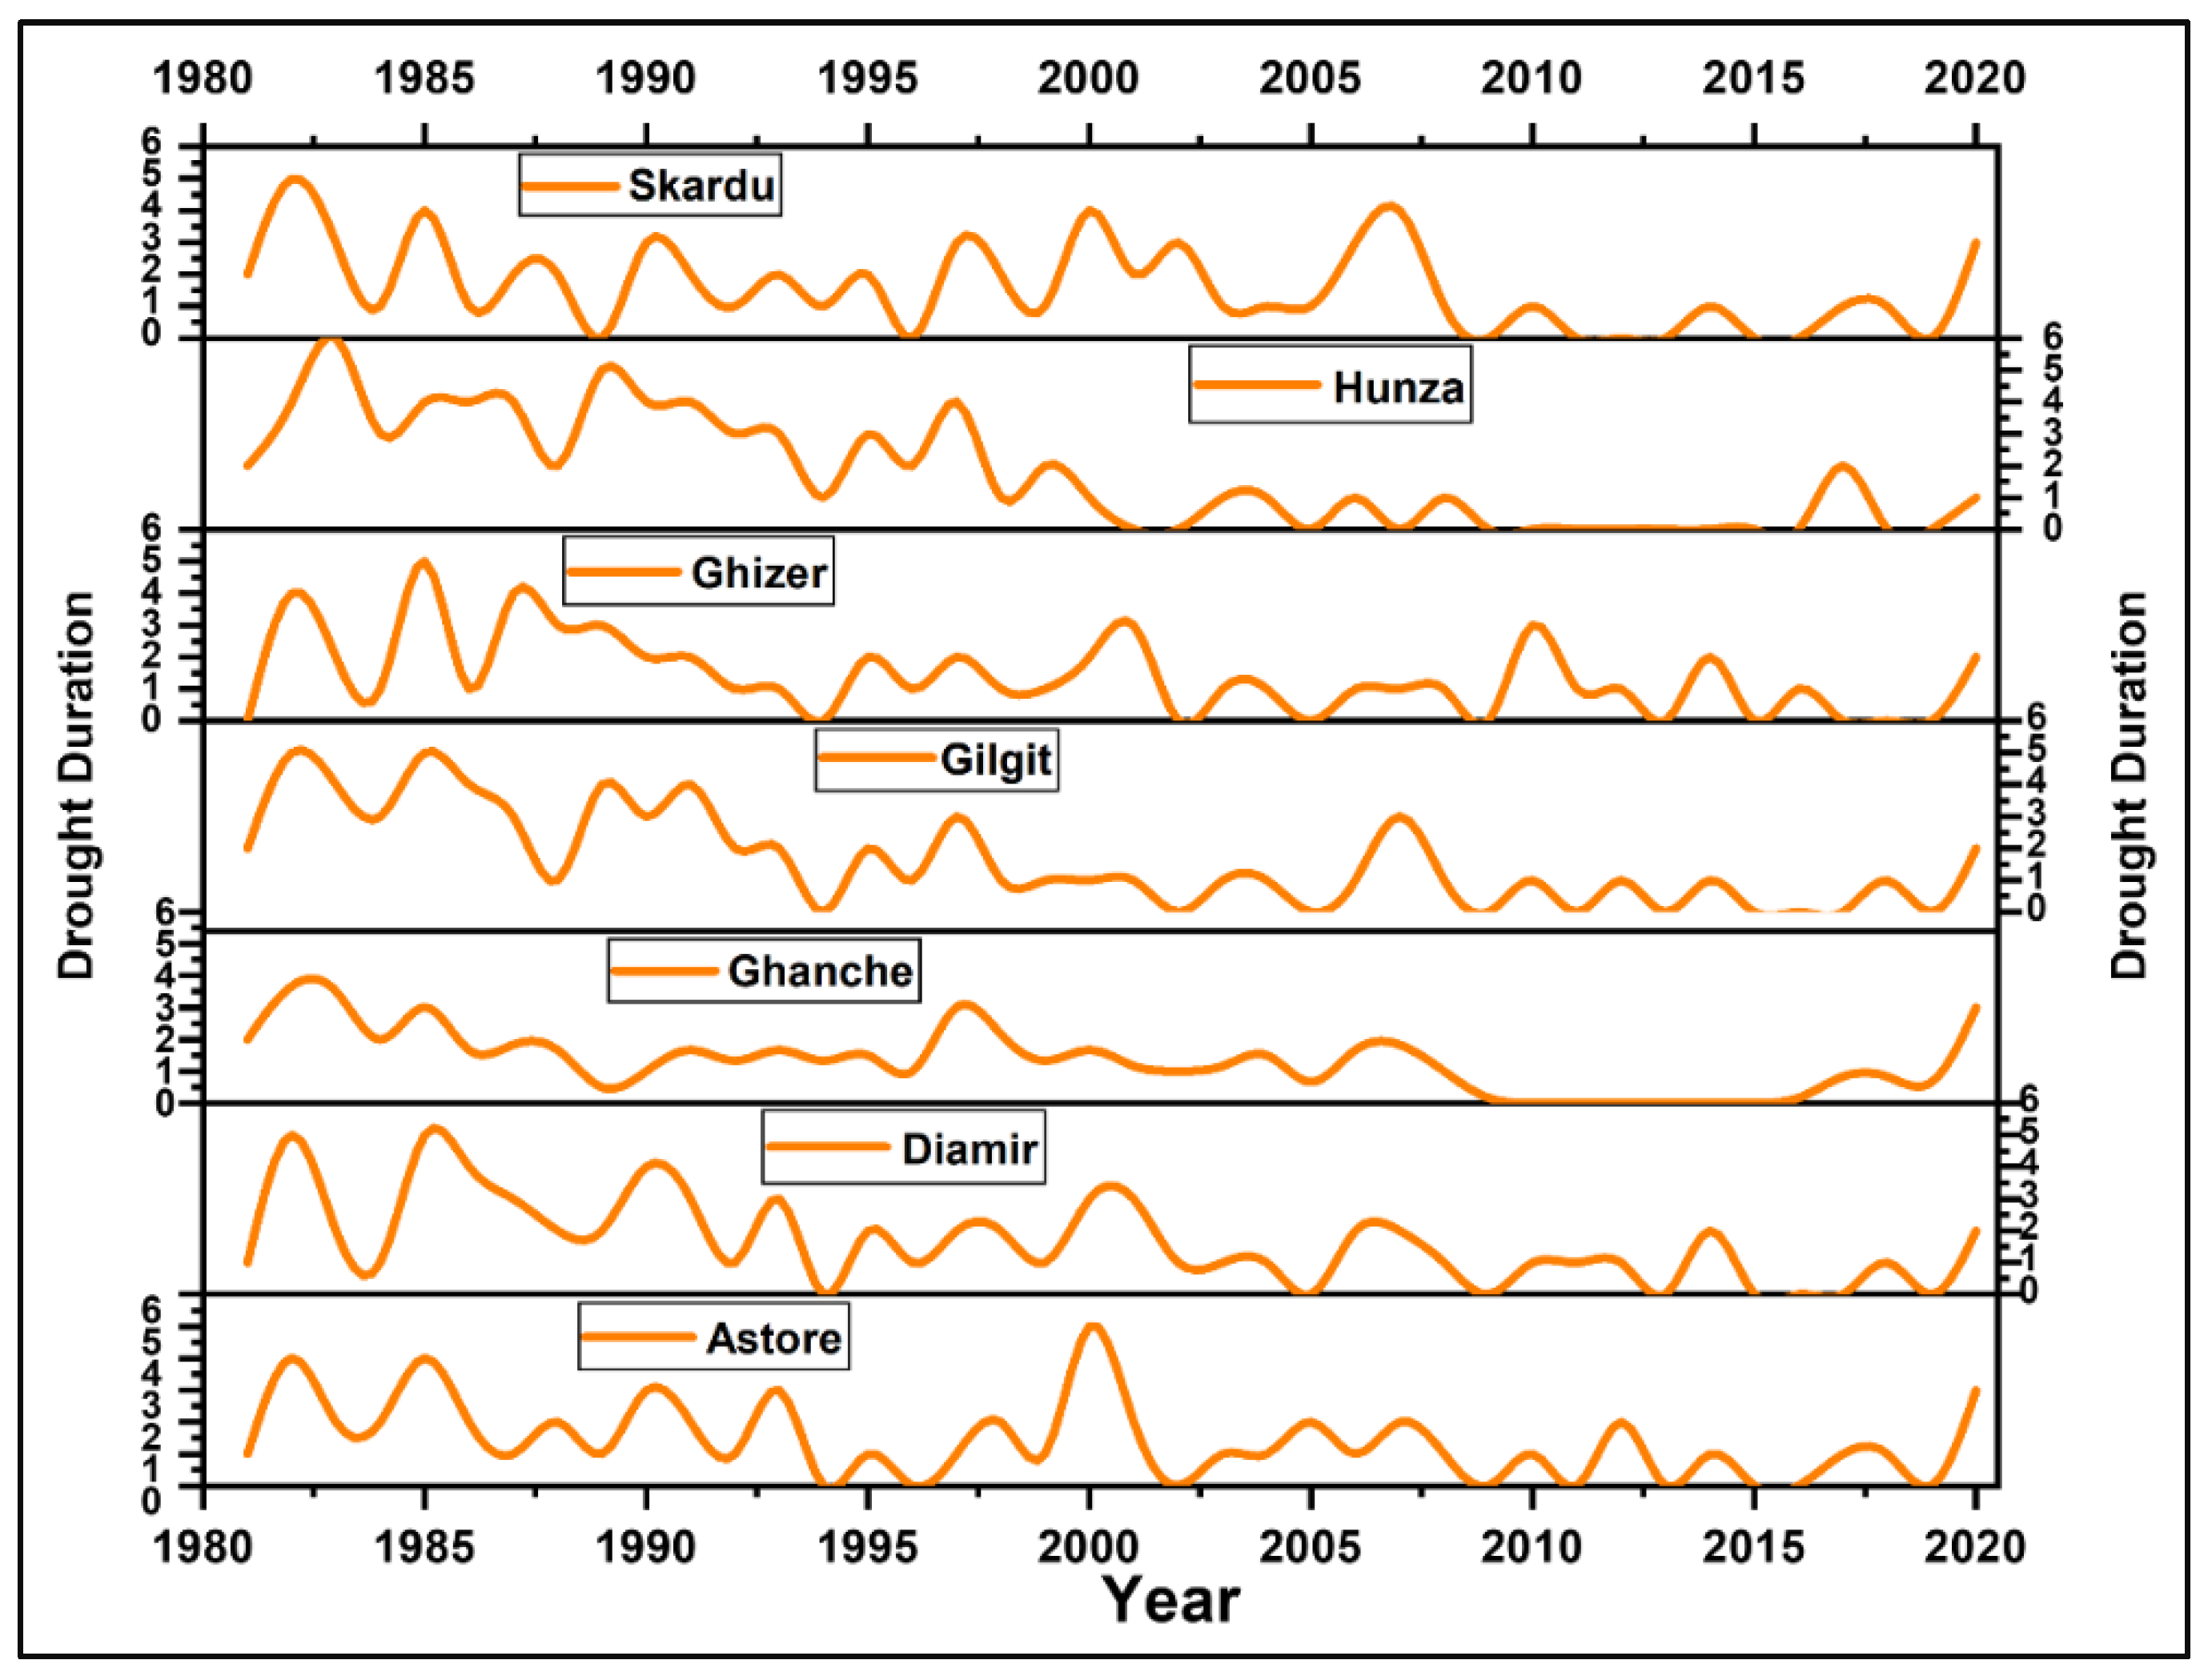
3.3. Characteristics of Drought

The longest duration of drought was observed in the Astore district in the year of 2000 with a drought severity (intensity) of −7.01 (−1.40). The Astore district witnessed another 4 months of drought period in the year of 1982 and 1985 with drought severities of −5.07 and −5.73, respectively (Figure 4, Figure 5 and Figure 6). The Diamir district went through 5 months of drought in 1982 and 1985 with drought severities (intensity) of −7.71 (−1.54) and −7.73 (−2.1), respectively (Figure 4, Figure 5 and Figure 6). The peak drought values were −1.7 and −1.76 in 1982 and 1985, respectively (Figure 7). The results revealed that the Ghanche district witnessed the longest drought duration in 1982 and 1983 with severities (intensity) of −4.81 (−1.2) and −4.65 (−1.6), respectively. However, the drought peak was observed in the year of 1992 with a value of −2.54 (Figure 7), and its intensity was −1.27 (Figure 6). From Figure 4, it can be examined that the Gilgit district witnessed the longest duration of drought in the years of 1982 and 1985 for 5 months each with a severity (intensity) of −7.79 (−1.55) and −8.04 (−1.63), respectively (Figure 5, Figure 6 and Figure 7).
The drought peak in Gilgit (−2.99) was observed in 2004 with an intensity of −2.99 (Figure 6 and Figure 7). Similarly, the highest drought severity was −7.94 in the Ghizer district in 1985 (Figure 5) when the district went through 5 months of dry spell (Figure 4). Four and 6 months of dry spell were observed in the Hunza-Nagar district in 1983 and 1989 (Figure 4) with severities (intensity) of −8.03 (−1.33) and −6.37 (−1.22), respectively (Figure 5 and Figure 6). The peak droughts in the Hunza-Nagar district were −1.69 and −1.88 in 1983 and 1989, respectively (Figure 7). The highest drought severity in the Skardu district (−6.06) was observed in the year of 1982 (Figure 5) with an intensity of −1.2 (Figure 6) with a dry spell of 5 months (Figure 4). The results of this study are in line with those of previous studies [45,70,71].

3.4. Mann–Kendall and Spearman’s Rho Trend Test of SPI

The Mann–Kendall and Spearman’s Rho trend tests were applied to 1- and 12-month SPI results, and the trend was evaluated with a 95% significance level. The results of the MK and SR tests are presented in Table 6. The MK and SR values for 1-month SPI revealed a significant positive trend in the months of September and November for all districts. Similarly, except Skardu and Ghanche, other districts had a significantly decreasing drought trend in the month of April. In January only, Ghanche, Gilgit, and Hunza-Nagar experienced a significant positive trend. The months of March, July, and December did not have any significant positive or negative trend. The results revealed that most of the districts experienced an increase in the amount of rainfall. The increasing amount of rainfall is due to a decreasing snowfall in the winter season, which is creating an alarming situation throughout Pakistan. Similarly, the 12-month SPI results indicate a significant positive trend for all districts. The highest significant trend was observed for the Gilgit, Hunza-Nagar, and Ghizer districts. The increasing rainfall in the area is not a positive sign as it is just because of the warming effect of the climate, which transforms the form of precipitation from snowfall to rainfall. Not only will the decreasing snowfall and increasing rainfall create issues of water shortage in Gilgit-Baltistan, but also it will affect the agriculture sector in the whole country.

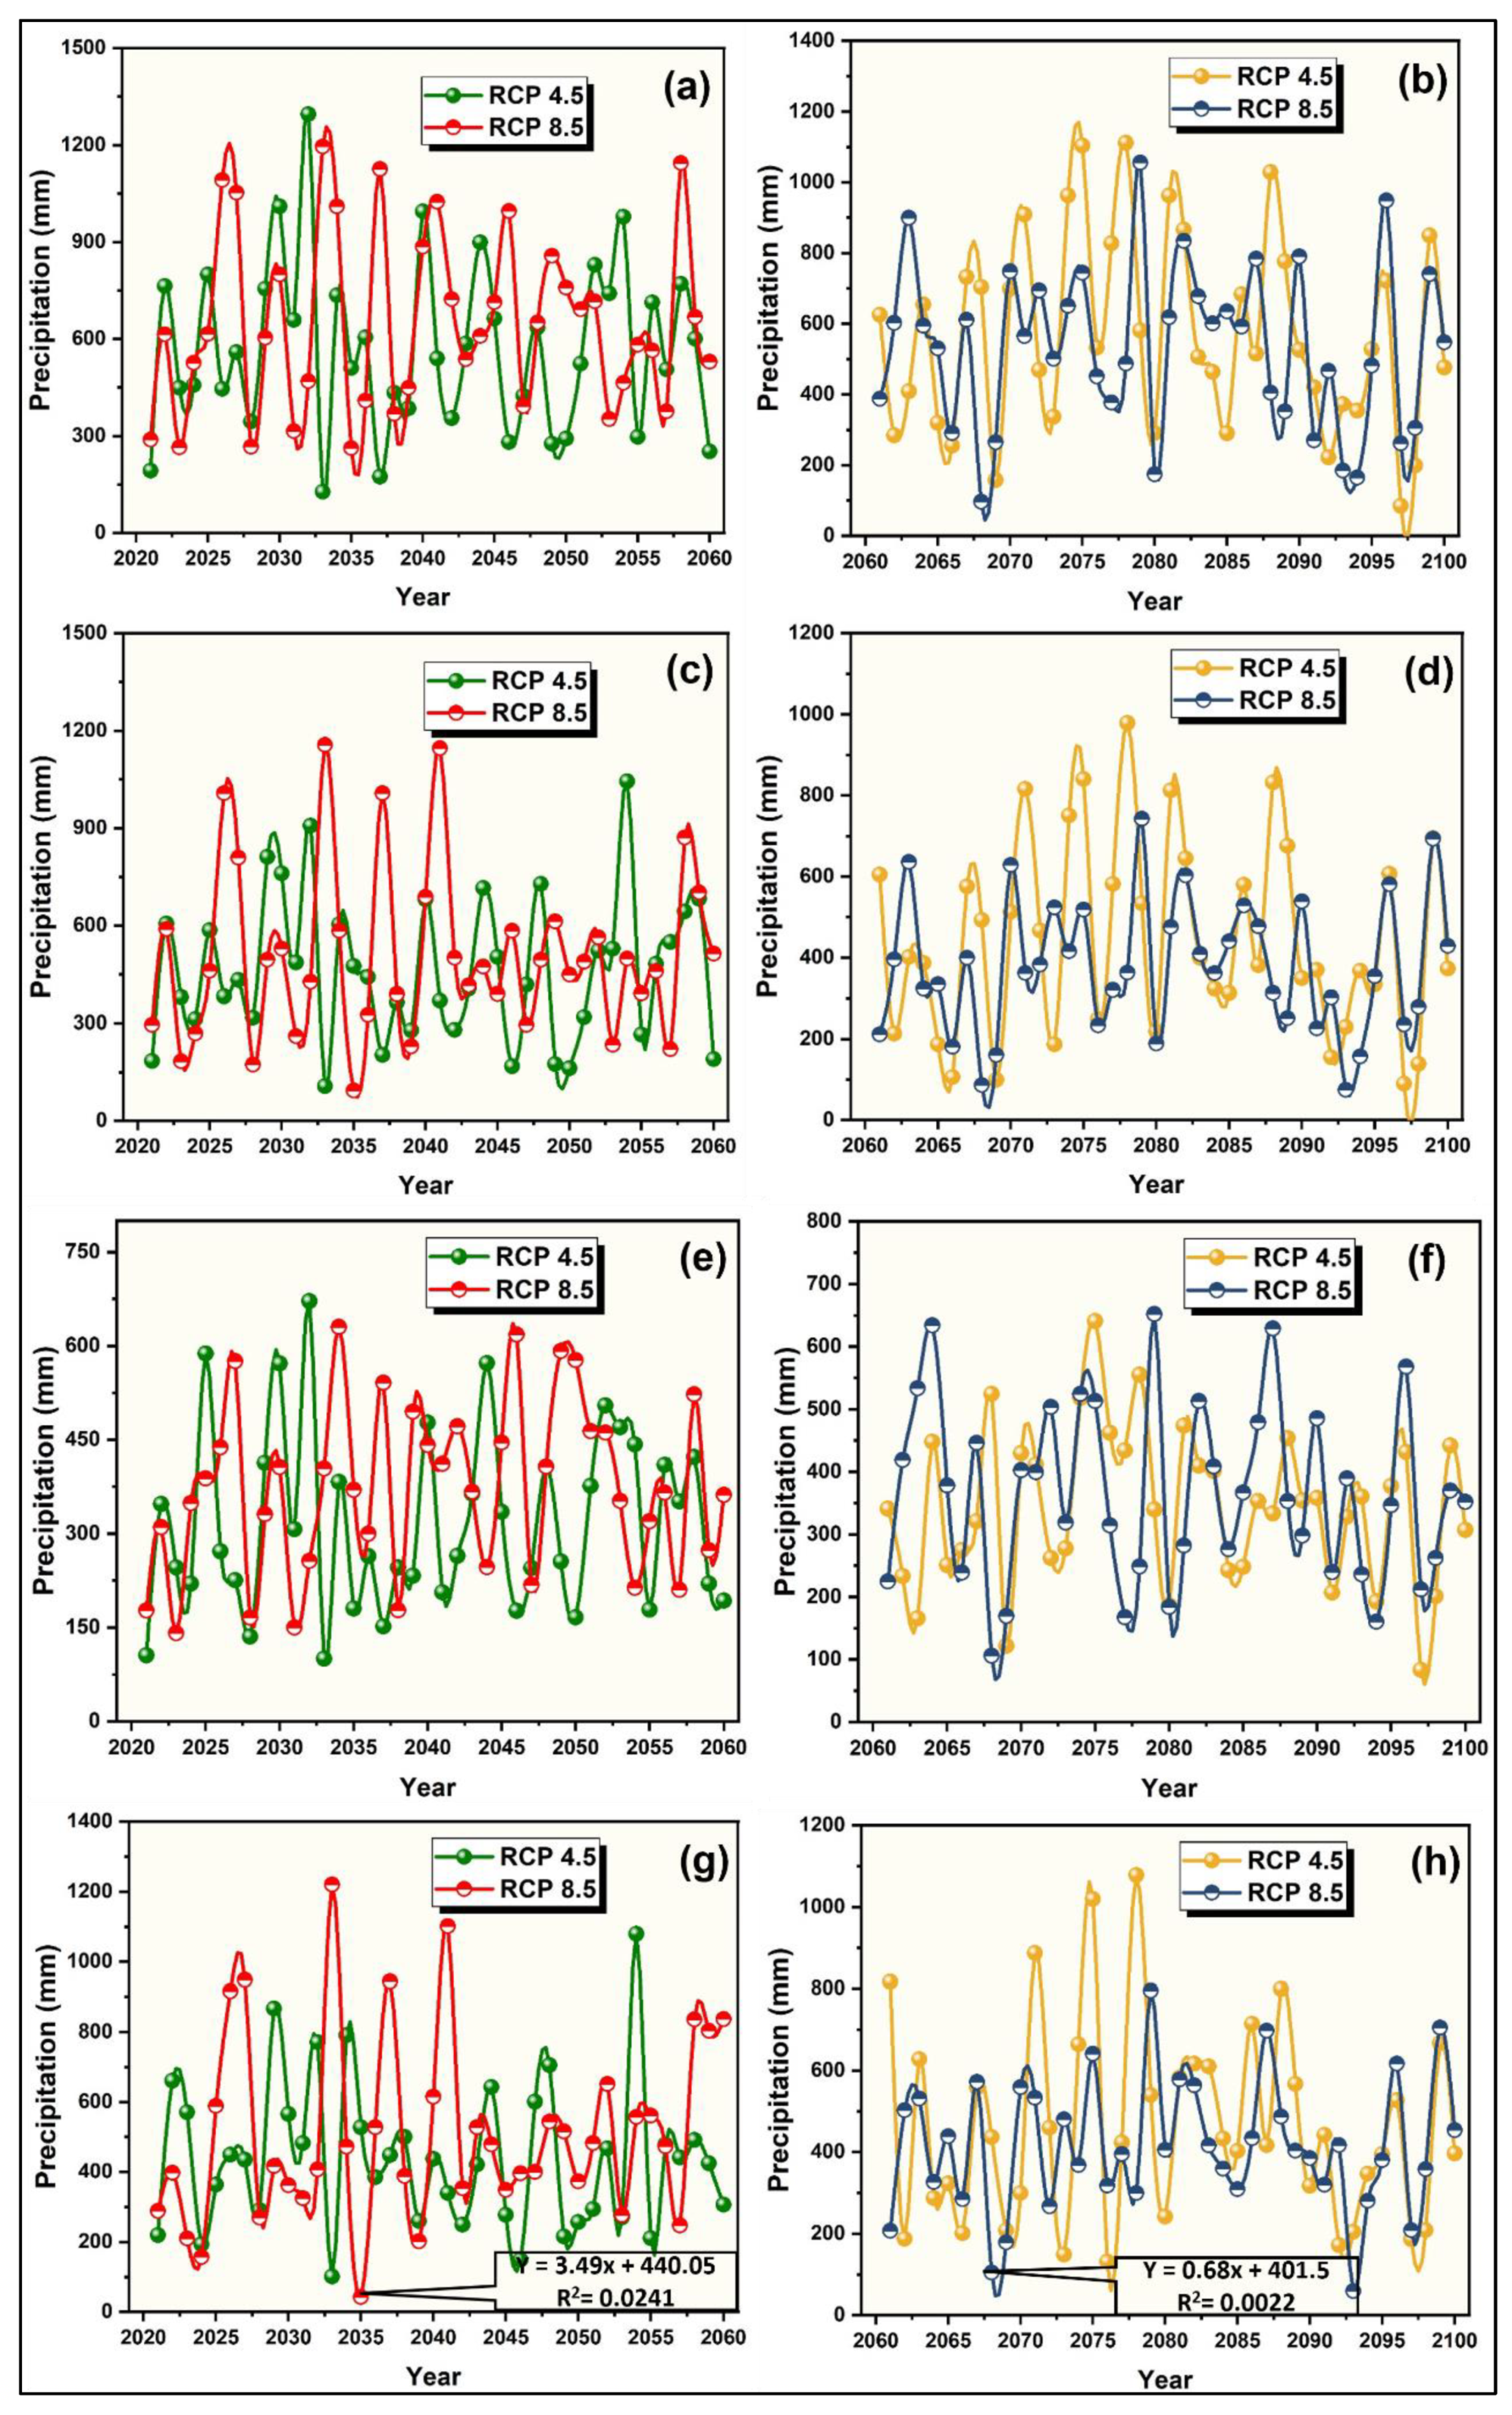
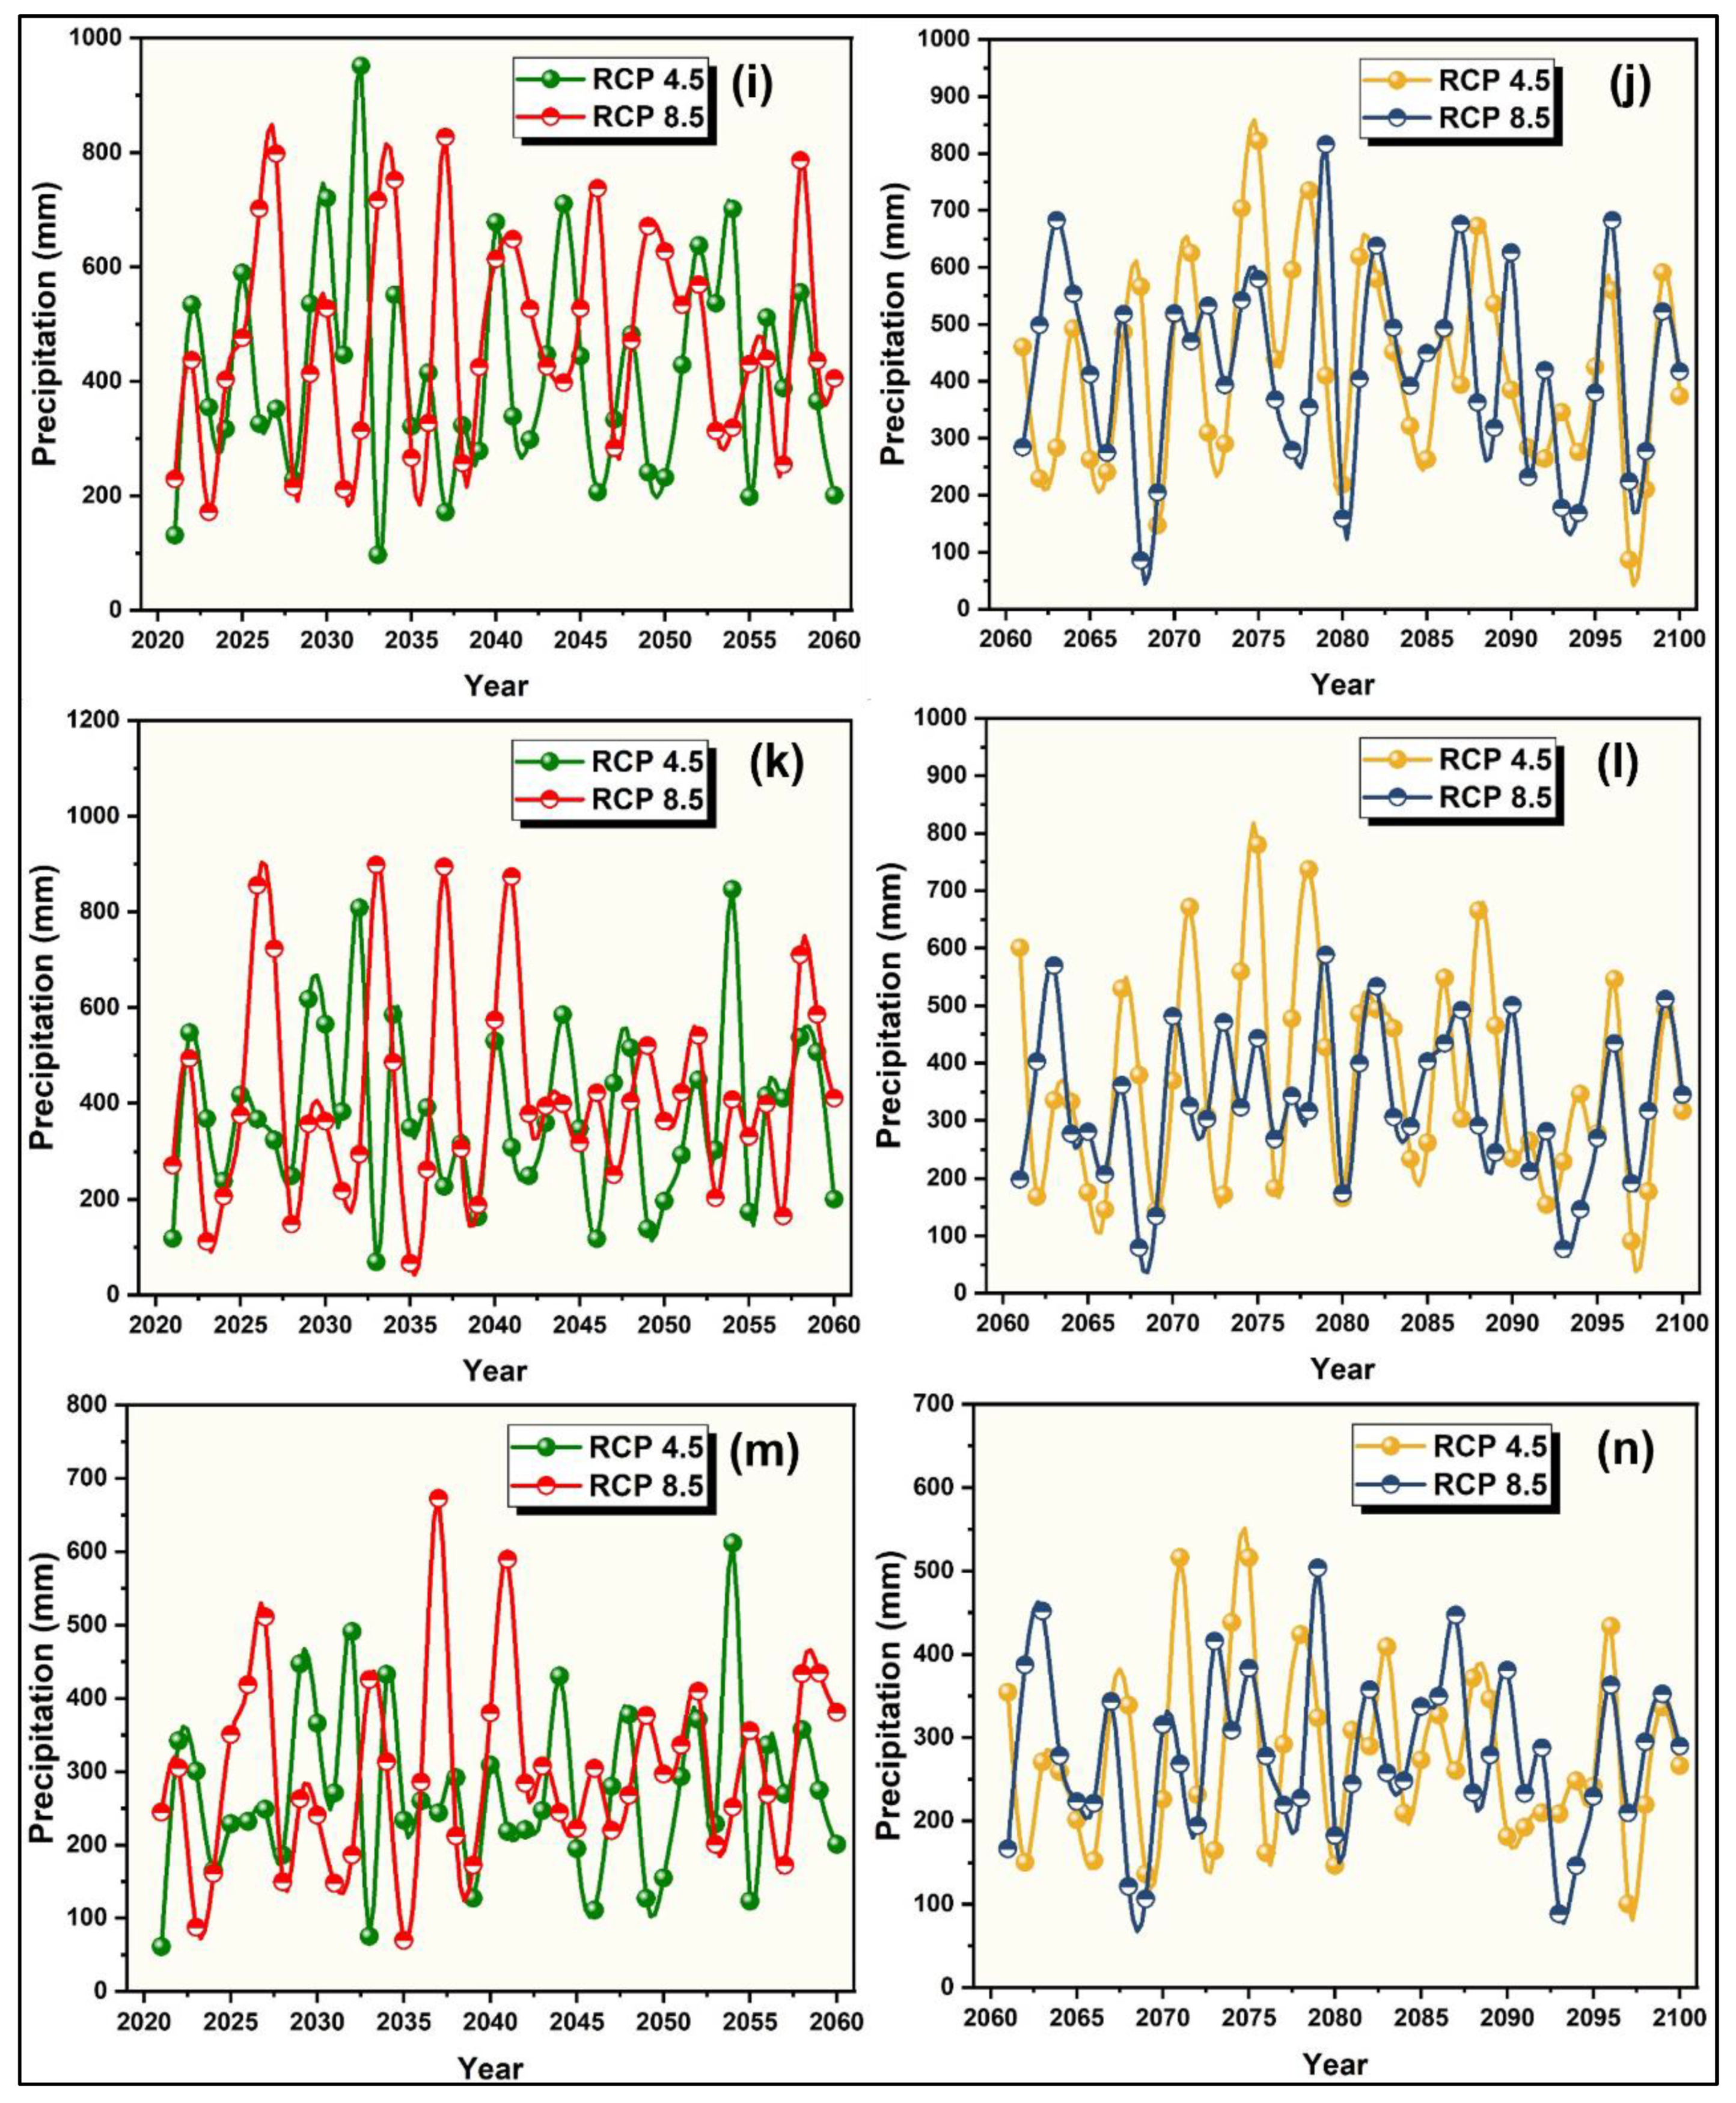
3.5. Future Precipitation Projections for 21st Century

Future projections of rainfall for each district of GB are classified and plotted into the midcentury (2021–2060) and late-century (2061–2100) projections (Figure 8). Rainfall is a complex climatic process, and its projections are also complex on spatiotemporal basis especially for mountainous regions such as GB. The temperature projections mostly endorse the storyline of RCPs predicting a smaller temperature rise under RCP 4.5 as compared with severe changes under RCP 8.5 [39]. Overall, the GB region rainfall projections depicted an increase of 4% for the 21st century as compared with the baseline period of 1981–2020. To analyze the spatial and temporal variability of rainfall, the projections are divided into midcentury and late century for each district (Figure 8). The scenario of RCP 4.5 projected a slight increase of 1.9%, while the scenario of RCP 8.5 depicted a robust increase of 11.8% for the midcentury period, which may cause excessive flow of surface water in the region for this time (Figure 8).
The future projection model depicted a severe decrease in rainfall for the latter half of the century under RCP 4.5 (7.2%) and RCP 8.5 (2.39%), which can cause scarcity of water in the region in the latter half of the century (Figure 8). GB has a diverse and unique topography that has impacted the rainfall projections of each district under both RCPs (Figure 8). The future projection data of rainfall were divided into two timelines (i.e., midcentury (2020–2060) and late-century (2061–2099) projections). The correlation coefficient of precipitation projections is weak for both RCPs because of its complex phenomena. It was observed that in some decades, the precipitation has increasing trend, while in others, a decreasing trend was examined. The Astore, Ghizer, Gilgit, and Skardu districts have a severe decreasing trend under both RCPs, particularly in the latter half of the century. On the other hand, the Diamir, Ghanche, and Hunza-Nagar districts projected a slight increase in precipitation under both RCPs especially in the midcentury regime (Figure 8a–n). Overall, GB depicted an increasing trend for the midcentury projections and a decreasing trend for the latter half of the century, which can cause floods in midcentury and a drought in the latter half of the century. The GB region is a major and a significant source of water supply for the whole country; therefore, the variation in rainfall projections will have severe impacts on the hydrological dynamics of the country. To efficiently deal with the rainfall variation projection in the upcoming decades, it is necessary to make better water management policies for a sustainable future of the country.

3.6. Discussion

The CHIRPS precipitation data for the period of 1981–2020 were used for the scarcely gauged area (GB) to quantify the drought conditions based on 1- and 12-month time scales using SPI. CHIRPS data have good agreement with station data over Pakistan and for the northern mountainous region [72,73]. The results of this study revealed that all districts of GB experienced short- and long-term drought ranging from moderate to extreme intensity. Extreme drought events were found in the year of 1982 and 2000, while severe droughts were mostly found in 1982, 1983–1985, 1990–1991, and 2000 for the 12-month time scale; moreover, moderate drought events were also found and classified into the groups of 1982–1983, 1985–1989, 1990–1991, 1997–1998, 2000–2002, and 2004. Some of the drought events found in this study are in line with previous studies [43,71,74,75,76]. Jamro et al. (2019) [71] also revealed three drought periods (i.e., 1946–1953, 1984–1989, and 1998–2002) in GB. Severe drought conditions were found in Asia during the period of 1999–2002 [70], which was also witnessed in this study for GB. Interseasonal rainfall variability due to atmospheric circulation is one of the possible reasons of drought and floods in Pakistan [77,78,79,80]. Rainfall variability defines droughts in Pakistan particularly in the cropping season; however, changes in monsoon and westerlies influence rainfall due to global warming, which can intensify the drought severity in Pakistan [78]. A shifting pattern of rainfall in the monsoon season due to global warming in South Asian countries will have severe impacts on the ecosystem in the 21st century [79]. It is expected that rainfall-dependent regions will face famine due to prolonged drought episodes as a result of climate variability [43,81]. The drought episodes of 1997–1998 and 2000–2002 in the region were influenced by a strong ENSO event for 5 years in South Asia. The possible reason for the lengthened drought episode (1998–2002) could be the warm ocean water, although in 1999 a cold wet episode occurred due to the influence of La Nina. This complex mechanism is defined by scientists as regional and large-scale climatic variability [82,83]. Due to longer-period drought episodes in 1997–1998 and 2000–2002 in the region, the agriculture sector of the country had a −2.6% growth rate. Adnan and Ullah (2020) [42] revealed that the GB Province receives 78% of its annual precipitation in the monsoon season. Ahmed et al. (2017) [44] observed a significant increasing trend of rainfall in the northern region of Pakistan; however, Bhatti et al. (2020) [84] found that the mean rainfall in the northern mountainous region is decreasing with rates of 0.17 and 0.8 mm with 95% and 99% percentile, respectively. However, glacier ice melt acts as a drought-resilient source of water in the northern mountainous region and reduces drought vulnerability for a larger population [85]. The results of the present research are consistent with the findings of some of the previous studies conducted in Pakistan.
The southern and central parts of Pakistan are considered to be more vulnerable to drought as compared with other regions of the country [78,86,87]. However, Ahmed et al. (2017) [44] and Ullah et al. (2018) [88] observed significant drought conditions in the mountainous region of Pakistan due to rainfall variability. Meteorological and agricultural drought conditions were also observed in the period of 2000–2018 for the Chitral Kabul River Basin [45]. It was observed by various researchers that the northern mountainous region of Pakistan was affected by moderate drought conditions during period of 1951–2010 [73,88,89]. A recent study also found drought conditions in the northern part of Pakistan due to the impact of less-than-normal rainfall [38]. The Khyber Pakhtunkhwa region experienced the worst drought event in 2000–2001 due to rainfall deficiency as compared to its normal rainfall [42].
We incorporated GCMs’ precipitation projections for the GB region under RCP 4.5 and RCP 8.5 to predict the precipitation condition in the future, which may help to adopt mitigation strategies to cope with future water dynamics in the region. The results revealed that during midcentury (2021–2060), the precipitation will increase by 1.9% and 11.8% under RCP 4.5 and RCP 8.5, respectively. However, in the latter half of the century (2061–2100) the climatic models showed a decreasing trend of precipitation with 7.2% and 2.39% under RCP 4.5 and RCP 8.5 respectively. Previously, there were no studies that specifically dealt with precipitation projections of the GB region using RCPs for the 21st century. Ali et al. (2017) [90] incorporated a precipitation projection of GB while studying the precipitation projections of Pakistan for the 21st century using old emission-based scenarios. The findings for the GB region depicted an overall increasing trend in precipitation for the 21st century. However, this recent study depicted the precipitation projection trends for each district of the region for the 21st century using multiple GCMs to avoid biases for a particular GCM under recent concentration pathways. This study is useful to national and provincial disaster management authorities, policymakers, water resource management departments, and farmers. It is necessary to monitor and assess long-term drought-affected areas for better water resource management. This study gives information about the future precipitation and provides a basis to properly manage water resources. To study the climatic variability, it is necessary to use a longer period of data; however, lack of long-period data and adequately spatially distributed meteorological station data is a big hindrance in the mountainous region. We planned to study the extreme climate indices of the region with respect to cryosphere changes because the downstream region is highly dependent on snow cover and glaciers nested in the Upper Indus Basin.

4. Conclusions

This study investigated the precipitation variability and assessed drought patterns in the northern mountainous region of Pakistan using a CHIRPS gridded dataset. The results of SPI indicated extreme to severe droughts in the years of 1982–1983, 1985, 1990–1991, 2000–2001, while the moderately dry years were 1977, 1984, 2007, 2014–2015, and 2017–2018 in the GB region. Overall, the results of the MK and SR trend tests deduced the increasing rainfall trend in historical data (1981–2020). The MMEs’ precipitation projections depicted an overall increase of 4% for the 21st century under both RCPs of the GB region. The increasing rainfall trend is dominant for the midcentury projections as compared with the latter half of the century. The district wise precipitation projections depicted an increasing trend for the northern districts of the region, while the southern districts of GB depicted a declining trend in precipitation for the 21st century. The increase in the amount of rainfall in the study area, especially in January, February, and March, indicates a shift of precipitation from snowfall to rainfall, which will increase the threat of dryness in the future, especially in the summer seasons in the Indus River Basin.

Author Contributions

M.F.U.M. and G.R., conceptualization, methodology; M.F.U.M., G.R. and S.M., formal analysis, investigation; A.T. investigation, Q.S., S.M., A.T. and G.R., data curation; M.F.U.M., G.R. and S.M., writing—original draft preparation; G.R. and B.-G.L., writing—review and editing; M.F.U.M., and A.T. visualization; B.-G.L., supervision. All authors have read and agreed to the published version of the manuscript.

Funding

This research was supported by Basic research program through the National Research Foundation (NRF) funded by the Ministry of Education (2019R1A6A1A10072987).

Institutional Review Board Statement

Not applicable.

Informed Consent Statement

Not applicable.

Data Availability Statement

The data used in this research can be obtained from online sources. CHIRPS data can be downloaded here: https://data.chc.ucsb.edu/products/CHIRPS-2.0/ (20 December 2021), and GCMs can extracted from this website: https://www.ipcc-data.org/sim/gcm_monthly/AR5/Reference-Archive.html (10 January 2022).

Acknowledgments

The principal author is thankful to Waleed Akbar (Department of Computer Engineering, Jeju National University, Korea) for helping in data curation from netcdf files. The author is also thankful to three anonymous reviewers for their insightful review and constructive comments for improving the scientific integrity of the manuscript.

Conflicts of Interest

The authors declare no conflict of interest.

References

  1. Locke, H.; Mackey, B. The nature of climate change. Int. J. Wilderness 2009, 15, 7–14. [Google Scholar]
  2. Parry, M.L.; Canziani, O.; Palutikof, J.; Van der Linden, P.; Hanson, C. Climate Change 2007-Impacts, Adaptation and Vulnerability: Working Group II Contribution to the Fourth Assessment Report of the IPCC; Cambridge University Press: London, UK, 2007; Volume 4. [Google Scholar]
  3. Pachauri, R.K.; Allen, M.R.; Barros, V.R.; Broome, J.; Cramer, W.; Christ, R.; Church, J.A.; Clarke, L.; Dahe, Q.; Dasgupta, P. Climate Change 2014: Synthesis Report. Contribution of Working Groups I, II and III to the Fifth Assessment Report of the Intergovernmental Panel on Climate Change; IPCC: London, UK, 2014. [Google Scholar]
  4. Panthi, J.; Dahal, P.; Shrestha, M.L.; Aryal, S.; Krakauer, N.Y.; Pradhanang, S.M.; Lakhankar, T.; Jha, A.K.; Sharma, M.; Karki, R. Spatial and temporal variability of rainfall in the Gandaki River Basin of Nepal Himalaya. Climate 2015, 3, 210–226. [Google Scholar] [CrossRef] [Green Version]
  5. Xu, H.; Taylor, R.; Xu, Y. Quantifying uncertainty in the impacts of climate change on river discharge in sub-catchments of the Yangtze and Yellow River Basins, China. Hydrol. Earth Syst. Sci. 2011, 15, 333–344. [Google Scholar] [CrossRef] [Green Version]
  6. Ceppi, P.; Scherrer, S.C.; Fischer, A.M.; Appenzeller, C. Revisiting Swiss temperature trends 1959–2008. Int. J. Climatol. 2012, 32, 203–213. [Google Scholar] [CrossRef] [Green Version]
  7. Arnell, N.W. Climate change and global water resources. Global Environ. Chang. 1999, 9, S31–S49. [Google Scholar] [CrossRef]
  8. Mondal, A.; Kundu, S.; Mukhopadhyay, A. Rainfall trend analysis by Mann-Kendall test: A case study of north-eastern part of Cuttack district, Orissa. Int. J. Earth Sci. 2012, 2, 70–78. [Google Scholar]
  9. Rahman, G.; Rahman, A.U.; Anwar, M.M.; Dawood, M.; Miandad, M. Spatio-temporal analysis of climatic variability, trend detection, and drought assessment in Khyber Pakhtunkhwa, Pakistan. Arab. J. Geosci. 2021, 15, 81. [Google Scholar] [CrossRef]
  10. Vicente-Serrano, S.M.; Domínguez-Castro, F.; Camarero, J.J.; El Kenawy, A. Chapter 9—Droughts. In Water Resources in the Mediterranean Region; Zribi, M., Brocca, L., Tramblay, Y., Molle, F., Eds.; Elsevier: Amsterdam, The Netherlands, 2020; pp. 219–255. [Google Scholar] [CrossRef]
  11. Rahman, G.; Rahman, A.-U.; Ullah, S.; Dawood, M.; Moazzam, M.F.U.; Lee, B.G. Spatio-temporal characteristics of meteorological drought in Khyber Pakhtunkhwa, Pakistan. PLoS ONE 2021, 16, e0249718. [Google Scholar] [CrossRef] [PubMed]
  12. Bonaccorso, B.; Bordi, I.; Cancelliere, A.; Rossi, G.; Sutera, A. Spatial variability of drought: An analysis of the SPI in Sicily. Water Resour. Manag. 2003, 17, 273–296. [Google Scholar] [CrossRef]
  13. Umran Komuscu, A. Using the SPI to analyze spatial and temporal patterns of drought in Turkey. Drought Netw. News (1994–2001) 1999, 11, 49. [Google Scholar]
  14. Khan, A.A.; Zhao, Y.; Rahman, G.; Rafiq, M.; Moazzam, M.F.U. Spatial and Temporal Analysis of Rainfall and Drought Condition in Southwest Xinjiang in Northwest China, Using Various Climate Indices. Earth Syst. Environ. 2021, 5, 201–216. [Google Scholar] [CrossRef]
  15. Sivakumar, M.V.K. Impacts of natural disasters in agriculture, rangeland and forestry: An overview. In Natural Disasters and Extreme Events in Agriculture: Impacts and Mitigation; Sivakumar, M.V.K., Motha, R.P., Das, H.P., Eds.; Springer: Berlin, Germany, 2005; pp. 1–22. [Google Scholar]
  16. Rahman, G.; Rahman, A.U.; SamiUllah; Dawood, M. Spatial and temporal variation of rainfall and drought in Khyber Pakhtunkhwa Province of Pakistan during 1971–2015. Arab. J. Geosci. 2018, 11, 1–13. [Google Scholar] [CrossRef]
  17. Sönmez, F.K.; Koemuescue, A.U.; Erkan, A.; Turgu, E. An analysis of spatial and temporal dimension of drought vulnerability in Turkey using the standardized precipitation index. Nat. Hazards 2005, 35, 243–264. [Google Scholar] [CrossRef]
  18. Wilhite, D.A. Chapter 1 Drought as a Natural Hazard: Concepts and Definitions. In Drought: A Global Assessment; Wilhite, D.A., Ed.; Routledge Publishers: London, UK, 2000; Volume 1, pp. 3–18. [Google Scholar]
  19. Ullah, I.; Yuanjie, Z.; Ali, S.; Rahman, G. Rainfall and drought variability in spatial and temporal context in Lop Nor region, South Xinjiang, China, during 1981–2018. Arab. J. Geosci. 2020, 13, 1–13. [Google Scholar] [CrossRef]
  20. Ashraf, M.; Routray, J.K. Spatio-temporal characteristics of precipitation and drought in Balochistan Province, Pakistan. Nat. Hazards 2015, 77, 229–254. [Google Scholar] [CrossRef]
  21. Khadr, M. Temporal and spatial analysis of meteorological drought characteristics in the upper Blue Nile river region. Hydrol. Res. 2016, 48, 265–276. [Google Scholar] [CrossRef]
  22. Gopalakrishnan, C. Water and disasters: A review and analysis of policy aspects. Int. J. Water Resour. Dev. 2013, 29, 250–271. [Google Scholar] [CrossRef]
  23. Kostopoulou, E.; Giannakopoulos, C.; Krapsiti, D.; Karali, A. Temporal and spatial trends of the standardized precipitation index (SPI) in Greece using observations and output from regional climate models. In Perspectives on Atmospheric Sciences; Springer: Berlin/Heidelberg, Germany, 2017; pp. 475–481. [Google Scholar]
  24. Maity, R.; Suman, M.; Verma, N.K. Drought prediction using a wavelet based approach to model the temporal consequences of different types of droughts. J. Hydrol. 2016, 539, 417–428. [Google Scholar] [CrossRef]
  25. Zarei, A.R.; Moghimi, M.M.; Koohi, E. Sensitivity Assessment to the Occurrence of Different Types of Droughts Using GIS and AHP Techniques. Water Resour. Manag. 2021, 35, 3593–3615. [Google Scholar] [CrossRef]
  26. Vicente-Serrano, S.M.; Beguería, S.; Lorenzo-Lacruz, J.; Camarero, J.J.; López-Moreno, J.I.; Azorin-Molina, C.; Revuelto, J.; Morán-Tejeda, E.; Sanchez-Lorenzo, A. Performance of drought indices for ecological, agricultural, and hydrological applications. Earth Interact. 2012, 16, 1–27. [Google Scholar] [CrossRef] [Green Version]
  27. McKee, T.B.; Doesken, N.J.; Kleist, J. The relationship of drought frequency and duration to time scales. In Proceedings of the 8th Conference on Applied Climatology, Anaheim, CA, USA, 17–22 January 1993; pp. 179–183. [Google Scholar]
  28. Palmer, W.C. Meteorological Drought; US Department of Commerce, Weather Bureau: Washington, DC, USA, 1965; Volume 30.
  29. Vicente-Serrano, S.M.; Beguería, S.; López-Moreno, J.I. A multiscalar drought index sensitive to global warming: The standardized precipitation evapotranspiration index. J. Clim. 2010, 23, 1696–1718. [Google Scholar] [CrossRef] [Green Version]
  30. Kogan, F.; Gitelson, A.; Zakarin, E.; Spivak, L.; Lebed, L. AVHRR-based spectral vegetation index for quantitative assessment of vegetation state and productivity. Photogramm. Eng. Remote Sens. 2003, 69, 899–906. [Google Scholar] [CrossRef]
  31. Singh, R.P.; Roy, S.; Kogan, F. Vegetation and temperature condition indices from NOAA AVHRR data for drought monitoring over India. Int. J. Remote Sens. 2003, 24, 4393–4402. [Google Scholar] [CrossRef]
  32. Kogan, F. A typical pattern of vegetation conditions in southern Africa during El Nino years detected from AVHRR data using three-channel numerical index. Int. J. Remote Sens. 1998, 19, 3688–3694. [Google Scholar] [CrossRef]
  33. Ali, S.; Ajmal, M.; Khan, M.S.; Shah, S.U. Assessment of precipitation trends in Gilgit Baltistan (Pakistan) for the period 1980–2015: An indicator of climate change. J. Himal. Earth Sci. 2017, 50, 66–75. [Google Scholar]
  34. Rao, P.G. Climatic changes and trends over a major river basin in India. Clim. Res. 1993, 2, 215–223. [Google Scholar] [CrossRef]
  35. Salma, S.; Rehman, S.; Shah, M. Rainfall trends in different climate zones of Pakistan. Pak. J. Meteorol. 2012, 9, 37–47. [Google Scholar]
  36. Raza, M.; Hussain, D.; Rasul, G.; Akbar, M.; Raza, G. Variations of surface temperature and precipitation in Gilgit-Baltistan (GB), Pakistan from 1955 to 2010. J. Biodivers Environ. Sci. 2015, 6, 67–73. [Google Scholar]
  37. Khattak, M.S.; Ali, S. Assessment of temperature and rainfall trends in Punjab province of Pakistan for the period 1961–2014. J. Himal. Earth Sci. 2015, 48, 42. [Google Scholar]
  38. Khan, I.; Waqas, T.; Ullah, S. Precipitation variability and its trend detection for monitoring of drought hazard in northern mountainous region of Pakistan. Arab. J. Geosci. 2020, 13, 1–18. [Google Scholar] [CrossRef]
  39. Munawar, S.; Tahir, M.N.; Baig, M.H.A. Twenty-first century hydrologic and climatic changes over the scarcely gauged Jhelum river basin of Himalayan region using SDSM and RCPs. Environ. Sci. Pollut. Res. 2022, 29, 11196–11208. [Google Scholar] [CrossRef]
  40. Ahmed, K.; Sachindra, D.A.; Shahid, S.; Demirel, M.C.; Chung, E.-S. Selection of multi-model ensemble of general circulation models for the simulation of precipitation and maximum and minimum temperature based on spatial assessment metrics. Hydrol. Earth Syst. Sci. 2019, 23, 4803–4824. [Google Scholar] [CrossRef] [Green Version]
  41. Ahmed, K.; Sachindra, D.; Shahid, S.; Iqbal, Z.; Nawaz, N.; Khan, N. Multi-model ensemble predictions of precipitation and temperature using machine learning algorithms. Atmos. Res. 2020, 236, 104806. [Google Scholar] [CrossRef]
  42. Adnan, S.; Ullah, K. Development of drought hazard index for vulnerability assessment in Pakistan. Nat. Hazards 2020, 103, 2989–3010. [Google Scholar] [CrossRef]
  43. Adnan, S.; Ullah, K.; Shuanglin, L.; Gao, S.; Khan, A.H.; Mahmood, R. Comparison of various drought indices to monitor drought status in Pakistan. Clim. Dyn. 2018, 51, 1885–1899. [Google Scholar] [CrossRef]
  44. Ahmed, K.; Shahid, S.; Chung, E.-S.; Ismail, T.; Wang, X.-J. Spatial distribution of secular trends in annual and seasonal precipitation over Pakistan. Clim. Res. 2017, 74, 95–107. [Google Scholar] [CrossRef]
  45. Baig, M.H.A.; Abid, M.; Khan, M.R.; Jiao, W.; Amin, M.; Adnan, S. Assessing meteorological and agricultural drought in Chitral Kabul river basin using multiple drought indices. Remote Sens. 2020, 12, 1417. [Google Scholar] [CrossRef]
  46. Krishnan, R.; Shrestha, A.B.; Ren, G.; Rajbhandari, R.; Saeed, S.; Sanjay, J.; Syed, M.; Vellore, R.; Xu, Y.; You, Q. Unravelling climate change in the Hindu Kush Himalaya: Rapid warming in the mountains and increasing extremes. In The Hindu Kush Himalaya Assessment; Springer: Berlin/Heidelberg, Germany, 2019; pp. 57–97. [Google Scholar]
  47. Zamir, U.B.; Masood, H. GIS and RS Based Approach for Monitoring the Snow Cover Change in Gilgit Baltistan. J. Sci. Ind. Res. 2018, 61, 91–95. [Google Scholar] [CrossRef]
  48. Ali, K.; Bajracharya, R.M.; Sitaula, B.K.; Raut, N.; Koirala, H.L. Morphometric analysis of Gilgit river basin in mountainous region of Gilgit-Baltistan Province, Northern Pakistan. J. Geosci. Prot. 2017, 5, 70. [Google Scholar] [CrossRef] [Green Version]
  49. CHIRPS. Climate Hazard Group Infrared Precipitation with Stations; University of California: Santa Barbara, CA, USA; Available online: https://www.chc.ucsb.edu/data/chirps (accessed on 20 December 2021).
  50. QGIS. QGIS Geographic Information System. QGIS Association. 2022. Available online: https://qgis.org/en/site/ (accessed on 31 December 2021).
  51. Moazzam, M.F.U.; Rahman, G.; Munawar, S.; Farid, N.; Lee, B.G. Spatiotemporal Rainfall Variability and Drought Assessment during Past Five Decades in South Korea Using SPI and SPEI. Atmosphere 2022, 13, 292. [Google Scholar] [CrossRef]
  52. Katsanos, D.; Retalis, A.; Tymvios, F.; Michaelides, S. Analysis of precipitation extremes based on satellite (CHIRPS) and in situ dataset over Cyprus. Nat. Hazards 2016, 83, 53–63. [Google Scholar] [CrossRef]
  53. Banerjee, A.; Chen, R.; Meadows, M.E.; Singh, R.; Mal, S.; Sengupta, D. An analysis of long-term rainfall trends and variability in the uttarakhand himalaya using google earth engine. Remote Sens. 2020, 12, 709. [Google Scholar] [CrossRef] [Green Version]
  54. NCAR. National Center for Atmospheric Research. Available online: https://ncar.ucar.edu/ (accessed on 20 December 2021).
  55. Collins, M.; Tett, S.; Cooper, C. The internal climate variability of HadCM3, a version of the Hadley Centre coupled model without flux adjustments. Clim. Dyn. 2001, 17, 61–81. [Google Scholar] [CrossRef]
  56. Griffies, S.M.; Winton, M.; Donner, L.J.; Horowitz, L.W.; Downes, S.M.; Farneti, R.; Gnanadesikan, A.; Hurlin, W.J.; Lee, H.-C.; Liang, Z.; et al. The GFDL CM3 Coupled Climate Model: Characteristics of the Ocean and Sea Ice Simulations. J. Clim. 2011, 24, 3520–3544. [Google Scholar] [CrossRef]
  57. Yukimoto, S.; Adachi, Y.; Hosaka, M.; Sakami, T.; Yoshimura, H.; Hirabara, M.; Tanaka, T.Y.; Shindo, E.; Tsujino, H.; Deushi, M. A new global climate model of the Meteorological Research Institute: MRI-CGCM3—Model description and basic performance. J. Meteorol. Soc. Japan. Ser. II 2012, 90, 23–64. [Google Scholar] [CrossRef] [Green Version]
  58. Chylek, P.; Li, J.; Dubey, M.; Wang, M.; Lesins, G. Observed and model simulated 20th century Arctic temperature variability: Canadian earth system model CanESM2. Atmos. Chem. Phys. 2011, 11, 22893–22907. [Google Scholar]
  59. Wu, T.; Song, L.; Li, W.; Wang, Z.; Zhang, H.; Xin, X.; Zhang, Y.; Zhang, L.; Li, J.; Wu, F. An overview of BCC climate system model development and application for climate change studies. J. Meteorol. Res. 2014, 28, 34–56. [Google Scholar] [CrossRef]
  60. Wang, B.; Zheng, L.; Liu, D.L.; Ji, F.; Clark, A.; Yu, Q. Using multi-model ensembles of CMIP5 global climate models to reproduce observed monthly rainfall and temperature with machine learning methods in Australia. Int. J. Climatol. 2018, 38, 4891–4902. [Google Scholar] [CrossRef]
  61. Dong, T.-Y.; Dong, W.-J.; Guo, Y.; Chou, J.-M.; Yang, S.-L.; Tian, D.; Yan, D.-D. Future temperature changes over the critical Belt and Road region based on CMIP5 models. Adv. Clim. 2018, 9, 57–65. [Google Scholar] [CrossRef]
  62. Fuchs, B.A.; Svoboda, M.D.; Wilhite, D.A.; Hayes, H. Drought indices for drought risk assessment in a changing climate. In Handbook of Engineering Hydrology: Modeling, Climate Change and Variability; Tylor & Francis Group: Oxfordshire, UK, 2014; pp. 217–231. [Google Scholar]
  63. Tigkas, D.; Vangelis, H.; Tsakiris, G. DrinC: A software for drought analysis based on drought indices. Earth Sci. Inform. 2015, 8, 697–709. [Google Scholar] [CrossRef]
  64. Wang, H.; Chen, Y.; Pan, Y.; Li, W. Spatial and temporal variability of drought in the arid region of China and its relationships to teleconnection indices. J. Hydrol. 2015, 523, 283–296. [Google Scholar] [CrossRef]
  65. Yevjevich, V.M. An Objective Approach to Definitions and Investigations of Continental Hydrologic Droughts; Colorado State University, Libraries: Fort Collins, CO, USA, 1967. [Google Scholar]
  66. Burn, D.H.; Cunderlik, J.M.; Pietroniro, A. Hydrological trends and variability in the Liard River basin/Tendances hydrologiques et variabilité dans le basin de la rivière Liard. Hydrol. Sci. J. 2004, 49, 53–67. [Google Scholar] [CrossRef] [Green Version]
  67. Yue, S.; Pilon, P. A comparison of the power of the t test, Mann-Kendall and bootstrap tests for trend detection/Une comparaison de la puissance des tests t de Student, de Mann-Kendall et du bootstrap pour la détection de tendance. Hydrol. Sci. J. 2004, 49, 21–37. [Google Scholar] [CrossRef]
  68. Spearman, C. The proof and measurement of association between two things. Am. J. Psych. 1904, 15, 72–101. [Google Scholar] [CrossRef]
  69. Khan, F.K. Pakistan Geography Economy and People, 4th ed.; Oxford University Press: Oxford, UK, 2015. [Google Scholar]
  70. Malik, K.M.; Taylor, P.A.; Szeto, K.; Khan, A.H. Characteristics of central southwest Asian water budgets and their impacts on regional climate. Atmos. Clim. Sci. 2013, 3, 30799. [Google Scholar] [CrossRef] [Green Version]
  71. Jamro, S.; Dars, G.H.; Ansari, K.; Krakauer, N.Y. Spatio-temporal variability of drought in Pakistan using standardized precipitation evapotranspiration index. Appl. Sci. 2019, 9, 4588. [Google Scholar] [CrossRef] [Green Version]
  72. Nawaz, M.; Iqbal, M.F.; Mahmood, I. Validation of CHIRPS satellite-based precipitation dataset over Pakistan. Atmos. Res. 2021, 248, 105289. [Google Scholar] [CrossRef]
  73. Ullah, W.; Wang, G.; Ali, G.; Tawia Hagan, D.F.; Bhatti, A.S.; Lou, D. Comparing multiple precipitation products against in-situ observations over different climate regions of Pakistan. Remote Sens 2019, 11, 628. [Google Scholar] [CrossRef] [Green Version]
  74. Lee, J.E.; Azam, M.; Rehman, S.U.; Waseem, M.; Anjum, M.N.; Afzal, A.; Cheema, M.; Mehtab, M.; Latif, M.; Ahmed, R. Spatio-temporal variability of drought characteristics across Pakistan. Paddy Water Environ. 2022, 20, 117–135. [Google Scholar] [CrossRef]
  75. Niaz, R.; Zhang, X.; Iqbal, N.; Almazah, M.; Hussain, T.; Hussain, I. Logistic Regression Analysis for Spatial Patterns of Drought Persistence. Complexity 2021, 2021, 3724919. [Google Scholar] [CrossRef]
  76. Abbas, S.; Kousar, S. Spatial analysis of drought severity and magnitude using the standardized precipitation index and streamflow drought index over the Upper Indus Basin, Pakistan. Environ. Dev. Sustain. 2021, 23, 15314–15340. [Google Scholar] [CrossRef]
  77. Muslehuddin, M.; Mir, H.; Faisal, N. Sindh summer (June–September) monsoon rainfall prediction. Pak. J. Meteorol. 2005, 2. [Google Scholar]
  78. Ahmed, K.; Shahid, S.; Nawaz, N. Impacts of climate variability and change on seasonal drought characteristics of Pakistan. Atmos. Res. 2018, 214, 364–374. [Google Scholar] [CrossRef]
  79. Hanif, M.; Khan, A.H.; Adnan, S. Latitudinal precipitation characteristics and trends in Pakistan. J. Hydrol. 2013, 492, 266–272. [Google Scholar] [CrossRef]
  80. Hina, S.; Saleem, F. Historical analysis (1981–2017) of drought severity and magnitude over a predominantly arid region of Pakistan. Clim. Res. 2019, 78, 189–204. [Google Scholar] [CrossRef]
  81. Stocker, T. Climate Change 2013: The Physical Science Basis: Working Group I Contribution to the Fifth Assessment Report of the Intergovernmental Panel on Climate Change; Cambridge University Press: London, UK, 2014. [Google Scholar]
  82. Barlow, M.; Cullen, H.; Lyon, B. Drought in central and southwest Asia: La Niña, the warm pool, and Indian Ocean precipitation. J. Clim. 2002, 15, 697–700. [Google Scholar] [CrossRef] [Green Version]
  83. Barlow, M.; Zaitchik, B.; Paz, S.; Black, E.; Evans, J.; Hoell, A. A review of drought in the Middle East and southwest Asia. J. Clim. 2016, 29, 8547–8574. [Google Scholar] [CrossRef]
  84. Bhatti, A.S.; Wang, G.; Ullah, W.; Ullah, S.; Fiifi Tawia Hagan, D.; Kwesi Nooni, I.; Lou, D.; Ullah, I. Trend in extreme precipitation indices based on long term in situ precipitation records over Pakistan. Water 2020, 12, 797. [Google Scholar] [CrossRef] [Green Version]
  85. Pritchard, H.D. Asia’s shrinking glaciers protect large populations from drought stress. Nature 2019, 569, 649–654. [Google Scholar] [CrossRef]
  86. Ahmed, K.; Shahid, S.; Wang, X.; Nawaz, N.; Khan, N. Spatiotemporal changes in aridity of Pakistan during 1901–2016. Hydrol. Earth Syst. Sci. 2019, 23, 3081–3096. [Google Scholar] [CrossRef] [Green Version]
  87. Ullah, I.; Ma, X.; Yin, J.; Saleem, F.; Syed, S.; Omer, A.; Habtemicheal, B.A.; Liu, M.; Arshad, M. Observed changes in seasonal drought characteristics and their possible potential drivers over Pakistan. Int. J. Climatol. 2022, 42, 1576–1596. [Google Scholar] [CrossRef]
  88. Ullah, S.; You, Q.; Ullah, W.; Ali, A. Observed changes in precipitation in China-Pakistan economic corridor during 1980–2016. Atmos. Res. 2018, 210, 1–14. [Google Scholar] [CrossRef]
  89. Ullah, S.; You, Q.; Ullah, W.; Ali, A.; Xie, W.; Xie, X. Observed changes in temperature extremes over China–Pakistan Economic Corridor during 1980–2016. Int. J. Climatol. 2019, 39, 1457–1475. [Google Scholar] [CrossRef]
  90. Ali, S.; Khattak, M.S.; Khan, D.; Sharif, M.; Khan, H. Predicting future temperature and precipitation over Pakistan in the 21st century. J. Eng. Appl. Sci. 2017, 35. [Google Scholar] [CrossRef]
Figure 1. Location map of the Gilgit-Baltistan area. Note: Khyber Pakhtunkhwa (KP).
Water 14 01132 g001
Figure 2. Heatmap of 12–month SPI series in Gilgit-Baltistan for all districts.
Water 14 01132 g002
Figure 3. Frequency of drought at 12-month time scale.
Water 14 01132 g003
Figure 4. Drought duration for all districts.
Water 14 01132 g004
Figure 5. Drought severity for all districts.
Water 14 01132 g005
Figure 6. Intensity of drought for all districts.
Water 14 01132 g006
Figure 7. Peak drought for all districts.
Water 14 01132 g007
Figure 8. Future projection rainfall under RCPs 4.5 and 8.5 for midcentury (left) and latter century (right) in (a,b) Astore, (c,d) Diamir, (e,f) Ghanche, (g,h) Ghizer, (i,j) Skardu, (k,l) Gilgit, and (m,n) Hunza-Nagar.
Water 14 01132 g008aWater 14 01132 g008b
Table 1. Selected GCMs from CMIP5.
Modelling CenterGCMResolution
National Center for Atmospheric Research, USA [54]CCSM40.9° × 1.25°
Meteorological Office, UK [55]HadCM32.5° × 3.75°
Geophysical Fluid Dynamics Laboratory, USA [56]GFDL-CM32° × 2.5°
National Institute for Environmental Studies, Japan [57]MRI-CGCM31.12° × 1.12°
Canadian Centre for Climate Modelling and Analysis, Canada [58]CanESM22.79° × 2.8°
Beijing Climate Center, China [59]BCC-CSM1–12.81° × 2.81°
Table 2. SPI index classification system [27].
SPI ValueCategoryAbbreviation
≥2Extreme wet condition EXW
1.5 to 1.99Severe wet conditionVEW
1.0 to 1.49Moderate wet conditionMOW
−0.99 to 0.99Near normal conditionN
−1.0 to −1.49Moderate drought conditionMOD
−1.5 to −1.99Severe drought conditionSED
≤−2.0Extreme drought conditionEXD
Table 3. Statistics of annual rainfall at the district level.
StationMin Rainfall (mm) Max Rainfall (mm) Mean Rainfall (mm) SDSkewnessKurtosis
Astore329.47674.92497.3686.660.28−0.47
Diamir376.78730.41551.5485.260.08−0.52
Ghanche157.25326.67227.1942.400.33−0.55
Ghizer182.63395.46279.4351.420.27−0.55
Gilgit190.43391.20299.4946.50−0.19−0.32
Hunza-Nagar172.48343.13244.3744.020.48−0.49
Skardu214477.35332.5561.670.34−0.26
Table 4. Frequency of drought for 1-month SPI.
DistrictExtreme Dryness
(<−2.0)
Severe Dryness
(−1.5 to −1.99)
Moderate Dryness
(−1 to −1.49)
Astore5939
Diamir31746
Ghanche3737
Ghizer4547
Gilgit51445
Hunza-Nagar22045
Skardu5950
Table 5. Frequency of drought for 12-Month SPI.
DistrictsExtreme DroughtSevere DroughtModerate Drought
Astore200019821985, 1991, 1998. 2001
Diamir198220001983, 1985, 1990, 1991, 2001
Ghanche 20001982, 1995, 1997, 1998, 2001, 2002, 2004
Ghizer19821983, 19851988, 1989, 1990, 2001
Gilgit19821983, 1985, 1990, 19912000
Hunza-Nagar 1982, 19831985, 1987, 1988, 1989, 1990, 1991, 1995
Skardu20001982, 20011997, 1998, 2004
Table 6. SPI trend for 1 month and 12 months in Gilgit-Baltistan using MK and SR. Note: ZMK, Mann–Kendall; ZSR, Spearman’s Rho.
AstoreDiamirGhancheGhizerGilgitHunza-NagarSkardu
ZMKZSRZMKZSRZMKZSRZMKZSRZMKZSRZMKZSRZMKZSR
January1.031.511.031.011.681.821.41.571.691.772.312.681.261.39
February1.361.461.011.041.061.22.032.092.22.222.712.851.731.77
March−0.6−0.6−0.8−0.860.10.0020.320.36−0.020.0021.711.92−0.24−0.27
April2.152.251.751.841.591.642.082.212.082.232.292.941.892.02
May2.522.672.22.390.520.612.142.412.692.822.482.662.312.36
June1.431.331.922.012.11.951.9521.961.871.091.171.261.12
July−0.8−0.80.010.005−1.21−1.011.631.51.822.11.171.43−0.68−0.51
August0.80.880.890.940.40.490.09−0.012.382.251.81.891.061.1
September2.242.383.554.353.23.633.764.463.584.483.483.982.993.43
October0.960.871.451.320.940.772.662.751.421.271.961.891.10.88
November1.681.831.821.772.93.412.542.762.412.533.083.392.052.19
December−0.7−0.6−0.99−1.050.40.3−0.9−0.94−0.22−0.220.570.610.080.06
Annual2.833.443.343.781.992.134.295.424.766.54.465.872.272.64
Note: The bold values indicate the existence of a significant trend in SPI results with a 95% significance level.
Publisher’s Note: MDPI stays neutral with regard to jurisdictional claims in published maps and institutional affiliations.

