
Evaluation of IMERG and ERA5 Precipitation-Phase Partitioning on the Global Scale


1
Institute of Remote Sensing and Geographic Information System, School of Earth and Space Sciences, Peking University, Beijing 100871, China
2
National Experimental Teaching Demonstrating Center of Earth Sciences, Peking University, Beijing 100871, China
3
Centre for Hydrology, University of Saskatchewan Canmore, Canmore, AB T1W 3G1, Canada
*
Author to whom correspondence should be addressed.
Water 2022, 14(7), 1122; https://doi.org/10.3390/w14071122
Submission received: 3 March 2022
/
Revised: 27 March 2022
/
Accepted: 29 March 2022
/
Published: 31 March 2022
(This article belongs to the Section Hydrology)
Abstract
:The precipitation phase (i.e., rain and snow) is important for the global hydrologic cycle and climate system. The objective of this study is to evaluate the precipitation-phase partitioning capabilities of remote sensing and reanalysis modeling methods on the global scale. Specifically, observation data from the National Centers for Environmental Prediction (NCEP) Automated Data Processing (ADP), from 2000 to 2007, are used to evaluate the rain–snow discrimination accuracy of the Integrated Multi-Satellite Retrievals for Global Precipitation Measurement (IMERG) and the fifth-generation reanalysis product of the European Centre for Medium Range Weather Forecasts (ERA5). The results show that: (1) the ERA5 performs better than the IMERG at distinguishing rainfall and snowfall events, overall. (2) The ERA5 has high accuracy in all continents except for South America, while the IMERG performs well only in Antarctica and North America. (3) Compared with the IMERG, the ERA5 can more effectively capture snowfall events at high latitudes but shows worse performance at mid-low latitude regions. Both the IMERG and ERA5 have lower accuracy for rain–snow partitioning under heavy precipitation. Overall, the results of this study provide references for the application and improvement of global rain–snow partitioning products.
1. Introduction
The precipitation phase is important for the global hydrologic cycle, weather forecasts, and climate system because snowfall and rainfall have distinct effects on land surface water and energy fluxes [1,2]. Snow accumulation increases surface albedo and delays the transfer of precipitation to surface snowmelt runoff, infiltration, and streamflow. Rain increases soil moisture and evaporation, resulting in runoff [3]. In some snow-dominated mountain areas, snowfall is an important water resource as a large amount of water is stored as snow in the cold season and then released as the snow melts in the warm season [4].
Global warming has been reported to increase the frequency and intensity of rain-on-snow events [5], leading to a reduction in snow equivalent accumulation and an acceleration of ice melt [6]. It has also led to warmer winter temperatures and resulted in more rainfall instead of snowfall [7]. In addition, this decrease in snowfall and increase in rainfall may lead to a decrease in surface albedo and an accelerated rise in surface temperatures [6,8,9]. The change of temperature also leads to the heterogeneity of precipitation on the global scale. In their study, Shi and Liu [7] showed that trends vary among different regions and the ratio of the number of snowfall events to precipitation events is decreasing in the middle and low latitudes, while increasing at the high latitudes in the Northern Hemisphere. Therefore, accurately discriminating the precipitation phase is vital for understanding the land hydrological processes, water resource management, and climate change [10].
Ground observations, remote sensing, and reanalysis models are the three major ways to obtain precipitation phase information. The surface precipitation phase is mainly related to near-surface air temperature and atmospheric moisture [11], which are measured using both land and ocean observational instruments. The discrimination of the precipitation phase has been widely studied using ground observations of variables such as near-surface air temperature [3,12,13], dewpoint temperature, and wet-bulb temperature [14,15,16,17,18]. Previous work has shown that, in general, the wet-bulb temperature—which accounts for the effects of the air moisture content—exhibits better performance than air temperature [15,19]. Jennings et al. [2] suggest that the precipitation phase could be better classified using air temperature and air humidity, rather than by using air temperature-only methods for large-scale land surface models. Additionally, surface pressure appears to influence the precipitation phase in some lower-pressure regions, yet the extent of this influence on the global scale is still not clear [3,15].
Satellite remote sensing is currently the only means for observing the precipitation phase on the global scale, as the coverage from meteorological stations, ocean-based buoys, and weather radars is limited [15]. Precipitation is one of the most difficult hydrological variables to estimate due to its high spatiotemporal heterogeneity [20]. Rain gauges and ocean-based ships and buoys are the traditional tools used to measure precipitation at point or regional scales [21]. However, they cannot provide continuous precipitation phase data on the global scale because of the uneven spatial distribution, low station density, and measurement uncertainty [22]. With the rapid development of remote sensing technologies, satellite-based precipitation data show greater potential in measuring precipitation phases on the global scale. Globally, precipitation phase products rely mainly on data from microwave (MW) sensors on board low-earth-orbit satellites [23,24]. Both active and passive microwave sensors can provide direct and accurate liquid and solid precipitation measurements due to their sensitivity to rain and ice particles [19,24]. However, the accuracy of the precipitation-phase partitioning of MW products is still low, especially in the high latitudes [16]. This is because the related snowfall-estimate algorithms are still immature [25,26,27,28].
The launch of the Global Precipitation Measurement (GPM) satellite has improved the quality of global liquid and solid precipitation estimates [27,28,29]. The Integrated Multi-Satellite Retrievals for GPM (IMERG) [30,31] algorithm adopts the parameterization-scheme method, developed by Sims and Liu [15], to estimate the precipitation phase. The near-real-time and non-real-time IMERG products use the reanalysis meteorological data (i.e., wet-bulb temperature and atmospheric moisture) produced by the Japan Meteorological Administration (JMA) and the European Centre for Medium-Range Weather Forecasts (ECMWF) to distinguish the precipitation phases based on the temperature threshold method [30]. So far, the IMERG is the only satellite product that realizes global precipitation phase distinction. However, the IMERG products lack reliable precipitationphase partitioning performance, which is mainly due to a lack of ground observation data [31].
Reanalysis products can provide spatiotemporal estimates of precipitation phases and snowfall amounts over the globe, which is particularly meaningful for ungauged areas. They distinguish the precipitation phases at different spatial scales using data assimilation systems and numerical weather models, which are characterized by strong physical mechanisms [32]. For example, the fifth-generation reanalysis product of the European Centre for Medium Range Weather Forecasts (ECMWF), the ERA5, is used to determine variations in precipitation at global or regional scales [33,34,35,36,37]. Compared with its predecessor, the ERA-Interim, the ERA5 has a more advanced assimilation system and higher spatiotemporal resolution [38,39]. With the above advantages, ERA5 products are widely used in snowfall estimation. For example, Liu et al. [40] compared the ERA5 daily snowfall product with automatic weather stations (AWSs) and synoptic CloudSat snowfall data and showed that the ERA5 can capture extreme snowfall events effectively over the Antarctic. Nouri and Homaee [41] assessed snowfall days to rainfall days (SDWD) using the ERA5 snowfall dataset in mountainous, data-scarce areas of Iran, and found that SDWD decreased negligibly in the regions that had an average air temperature below −2.8 °C, and that ERA5 had a reliable performance in analyzing snow-related metrics. However, recently, several studies have shown that the ERA5 reanalysis precipitation-event estimates have uncertainties [42,43,44] and its precipitation-phase partitioning accuracy on a global scale is still unclear. Moreover, to our knowledge, no study has evaluated the direct precipitation-phase partitioning dataset of the ERA5 reanalysis products and the accuracy of these applications. The IMERG can represent rain–snow classification based on the temperature-threshold method [15], and the ERA5 can represent rain–snow classification based on numerical models with atmospheric physics. The comparison of the IMERG and ERA5 products can resolve the uncertainties of the different precipitation-phase partitioning methods and help researchers determine the most appropriate rain–snow partitioning method for local and large-scale studies.
The objectives of this study are as follows: (1) to evaluate the rain–snow partitioning ability of the IMERG and ERA5 precipitation phase products against the National Centers for Environmental Prediction (NCEP) Automated Data Processing (ADP) observation dataset, from 2000 to 2007, on the global scale; and (2) to compare the IMERG and ERA5 precipitation phase products on different spatiotemporal scales, air temperatures, and precipitation intensities, to explore the performance and differences between satellite-based methods and reanalysis models in different regions and climate conditions. The rest of the paper is organized as follows. The gauge data, the IMERG, the ERA5, sample preparation, and statistical metrics are briefly introduced in Section 2. The rain–snow partitioning performance of the IMERG and ERA5 products at different spatiotemporal scales are evaluated in Section 3, and their sensitivities to precipitation and air temperature are compared. The discussion and conclusions are presented in Section 4 and Section 5, respectively.
2. Materials and Methods
2.1. Gauge Data
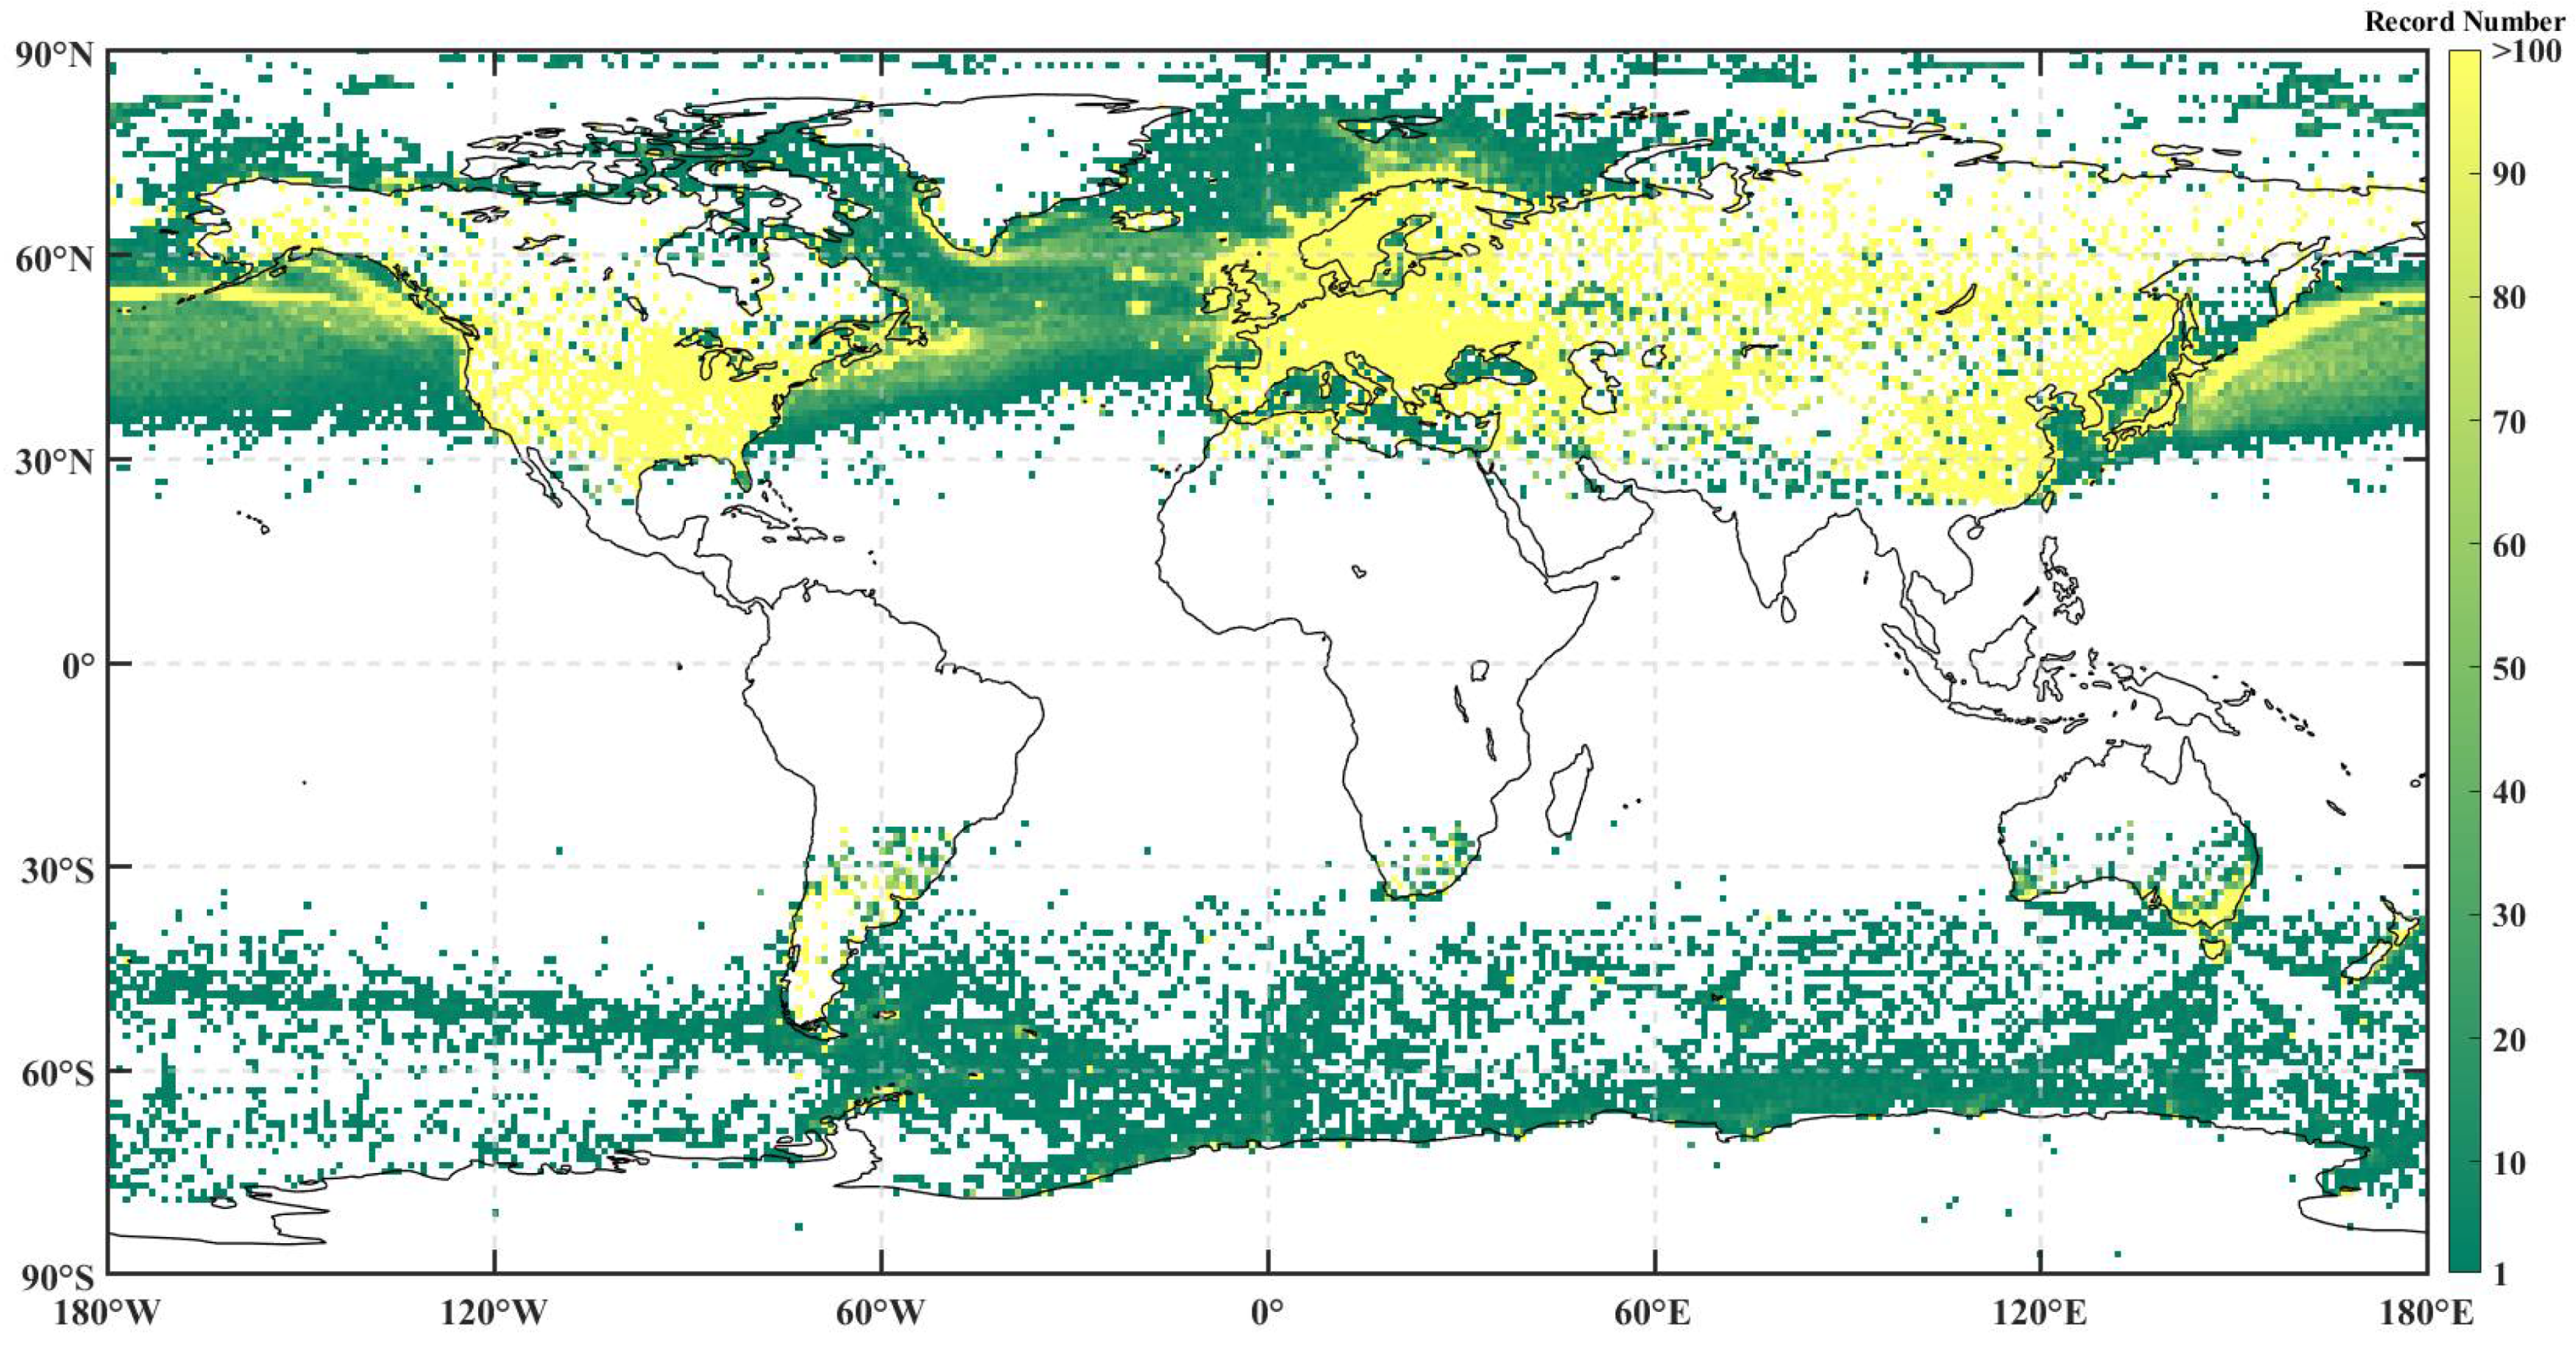
The NCEP ADP observation data are from April 1978 through to February 2007 with more than 14,000 stations [45]. NCEP ADP data reports were collected from the Global Telecommunication System (GTS) during time slots centered on the 3-hourly and 6-hourly analysis times of their global and regional models. There are two types of data in NCEP ADP dataset: (1) data from land stations, including Surface Synoptic Observations (SYNOP), Meteorological Terminal Aviation Routine Weather Reports (METAR), and beginning in the mid-1990s, Automatic Weather Observation System (AWOS) and Automated Surface Observing System (ASOS) reports; and (2) data from moving ships, fixed ships, Meteorological Archival and Retrieval Systems (MARS) (moving and fixed), and buoys (moored and drifting). This study used both land stations and ocean ship/buoy observations for land and ocean precipitation phase estimations. The NCEP ADP data contain 14,737 land stations and ocean stations, which include 47.9 million and 1.4 million precipitation records, respectively. Figure 1 shows the global distribution of NCEP ADP station precipitation records which are gridded into 1 × 1° grids (refer to Section 2.4).
The precipitation phases were classified as rain and snow according to the World Meteorological Organization’s (WMO) present weather codes [3]. Following Sims and Liu [15], the observation records with present weather codes 60–99 were classified as rainfall, except for those with codes 70–79, 85, and 86, which were classified as snowfall.
2.2. IMERG
The IMERG is the Level 3 multi-satellite precipitation product of GPM, which combines intermittent precipitation estimates from all constellation microwave sensors, IR-based precipitation estimates from geosynchronous satellites, and monthly gauge precipitation data [29]. This study used the IMERG Final run product at the 0.1° and 30 min resolutions from 2001 to 2007, downloaded from the PMM website (http://pmm.nasa.gov/data-access/downloads/gpm accessed on 1 March 2021). Two kinds of IMERG precipitation estimate data were used here—the total amount of precipitation and precipitation phases. IMERG computed a simple probability-of-liquid phase, which was a fraction between 0 and 100%. The probability of liquid precipitation indicates a probability that the precipitation phase is liquid [31].
Empirically, there are two ways to achieve rain–snow classification for IMERG: (1) a precipitation event is classified as snowfall (or rainfall) if the probability of liquid precipitation is lower than (or higher than) 50%; and (2) the snowfall amount is calculated as the product of the solid probability (i.e., 1—probability of liquid precipitation) and the total precipitation amount. This study chose to use the first method because the probability of liquid/solid precipitation is designed for binary classification instead of amount division.
2.3. ERA5
The ERA5 is the latest atmospheric reanalysis product at the 0.25° and 1 h resolutions, which can be downloaded from the Climate Data Store (CDS; https://cds.climate.copernicus.eu/#!/search?text=ERA5&type=dataset, accessed on 1 March 2021). Four variables are used in this study, including precipitation type, total precipitation, snowfall, and 2 m air temperature. Two ways to distinguish the ERA5 precipitation phase were compared. The first method is to classify snowfall and rainfall using the precipitation-type variable and the WMO Code Table 4.201 (https://apps.ecmwf.int/codes/grib/format/grib2/ctables/4/201 accessed on 1 March 2021). Precipitation types 1 and 5 represented rainfall and snowfall, respectively. Other precipitation type codes, i.e., 3 (freezing rain), 6 (wet snow), and 7 (mixture of rain and snow), were not considered in this study due to their scarcity. The second method is to divide the snowfall by the total precipitation amount and choose a snowfall ratio threshold to determine the precipitation phase. In order to reduce the numerous tiny precipitation events of ERA5, the hourly precipitation event threshold was set to 0.01 mm/h. The comparison shows that the two methods have similar performance in rain–snow partitioning. This study chose the precipitation-type code method (the first method) because the NCEP ADP weather observation data and ERA5 precipitation type data are both instantaneous, while the snowfall and precipitation amount data of ERA5 are cumulative.
2.4. Sample Preparation
To better reveal the performance of IMERG and ERA5 in rain–snow partitioning, precipitation samples were selected based on three criteria.
- (1)
- When the air temperature exceeded 10 °C or was lower than −10 °C, there was no difficulty in distinguishing between rainfall and snowfall. Therefore, the data with air temperatures below −10 °C and above 10 °C were deleted. This resulted in 46.3% of the dataset being eliminated.
- (2)
- Gauge observations with relative humidity (RH) lower than 10% or greater than 100% were excluded. This is because RH in nature rarely drops below 10% and cannot exceed 100%, as observed by Jennings et al. [2]. The excluded samples comprise about 0.1% of the dataset.
- (3)
- Almost all snowfall events occurred in the middle (60–90° NS) and high latitudes (30–60° NS), so the observation data for 23.5° N–23.5° S were deleted.
After filtering the dataset, there were a total of 21.4 million precipitation phase observations, including 21.1 million records over land and 0.3 million records over ocean. Previous studies by Sims and Liu [15] and Tamang et al. [18] show that land and ocean have different rain–snow partitioning temperature thresholds. As such, the rain–snow partitioning products were evaluated for land and ocean separately. In order to match IMERG products (June 2000 to February 2007), the NCEP ADP data for the period from June 2000 to February 2007 were used as the validation dataset for IMERG and ERA5. ERA5 precipitation phase data (June 2000 to February 2007) were downscaled from 0.25 to 0.1° using the nearest-neighbor method. A total of 13.5 million (land) and 0.07 million (ocean) NCEP ADP dataset records were retained for evaluation.
2.5. Statistical Metrics
Three categorical metrics were used to evaluate the performance of different rain–snow partitioning methods, including the probability of detection (POD), the false alarm ratio (FAR), and the critical success index (CSI) [46,47,48]. POD represents the fraction of correctly captured snowfall events of the target dataset. FAR represents the fraction of falsely reported snowfall events. CSI is a more balanced index, combining the characteristics of both false alarms and missed events from POD and FAR.
where represents the number of snowfall events observed by both the reference dataset (NCEP ADP) and the target dataset (IMERG, or ERA5), represents snowfall events observed by the target dataset but not observed by the reference dataset, and represents snowfall events observed by the reference dataset but not observed by the target dataset. The three metrics all vary between zero and one. The perfect value is one for POD and CSI, and zero for FAR.
This study only included samples that NCEP ADP indicated as being either rainfall or snowfall, because non-precipitation events are dominant in number and are not suitable for calculating the categorical metrics. All metrics were calculated at the 6-hourly scale since NCEP ADP has both 3-hourly and 6-hourly observations.
3. Results and Discussion
3.1. Spatial Analysis
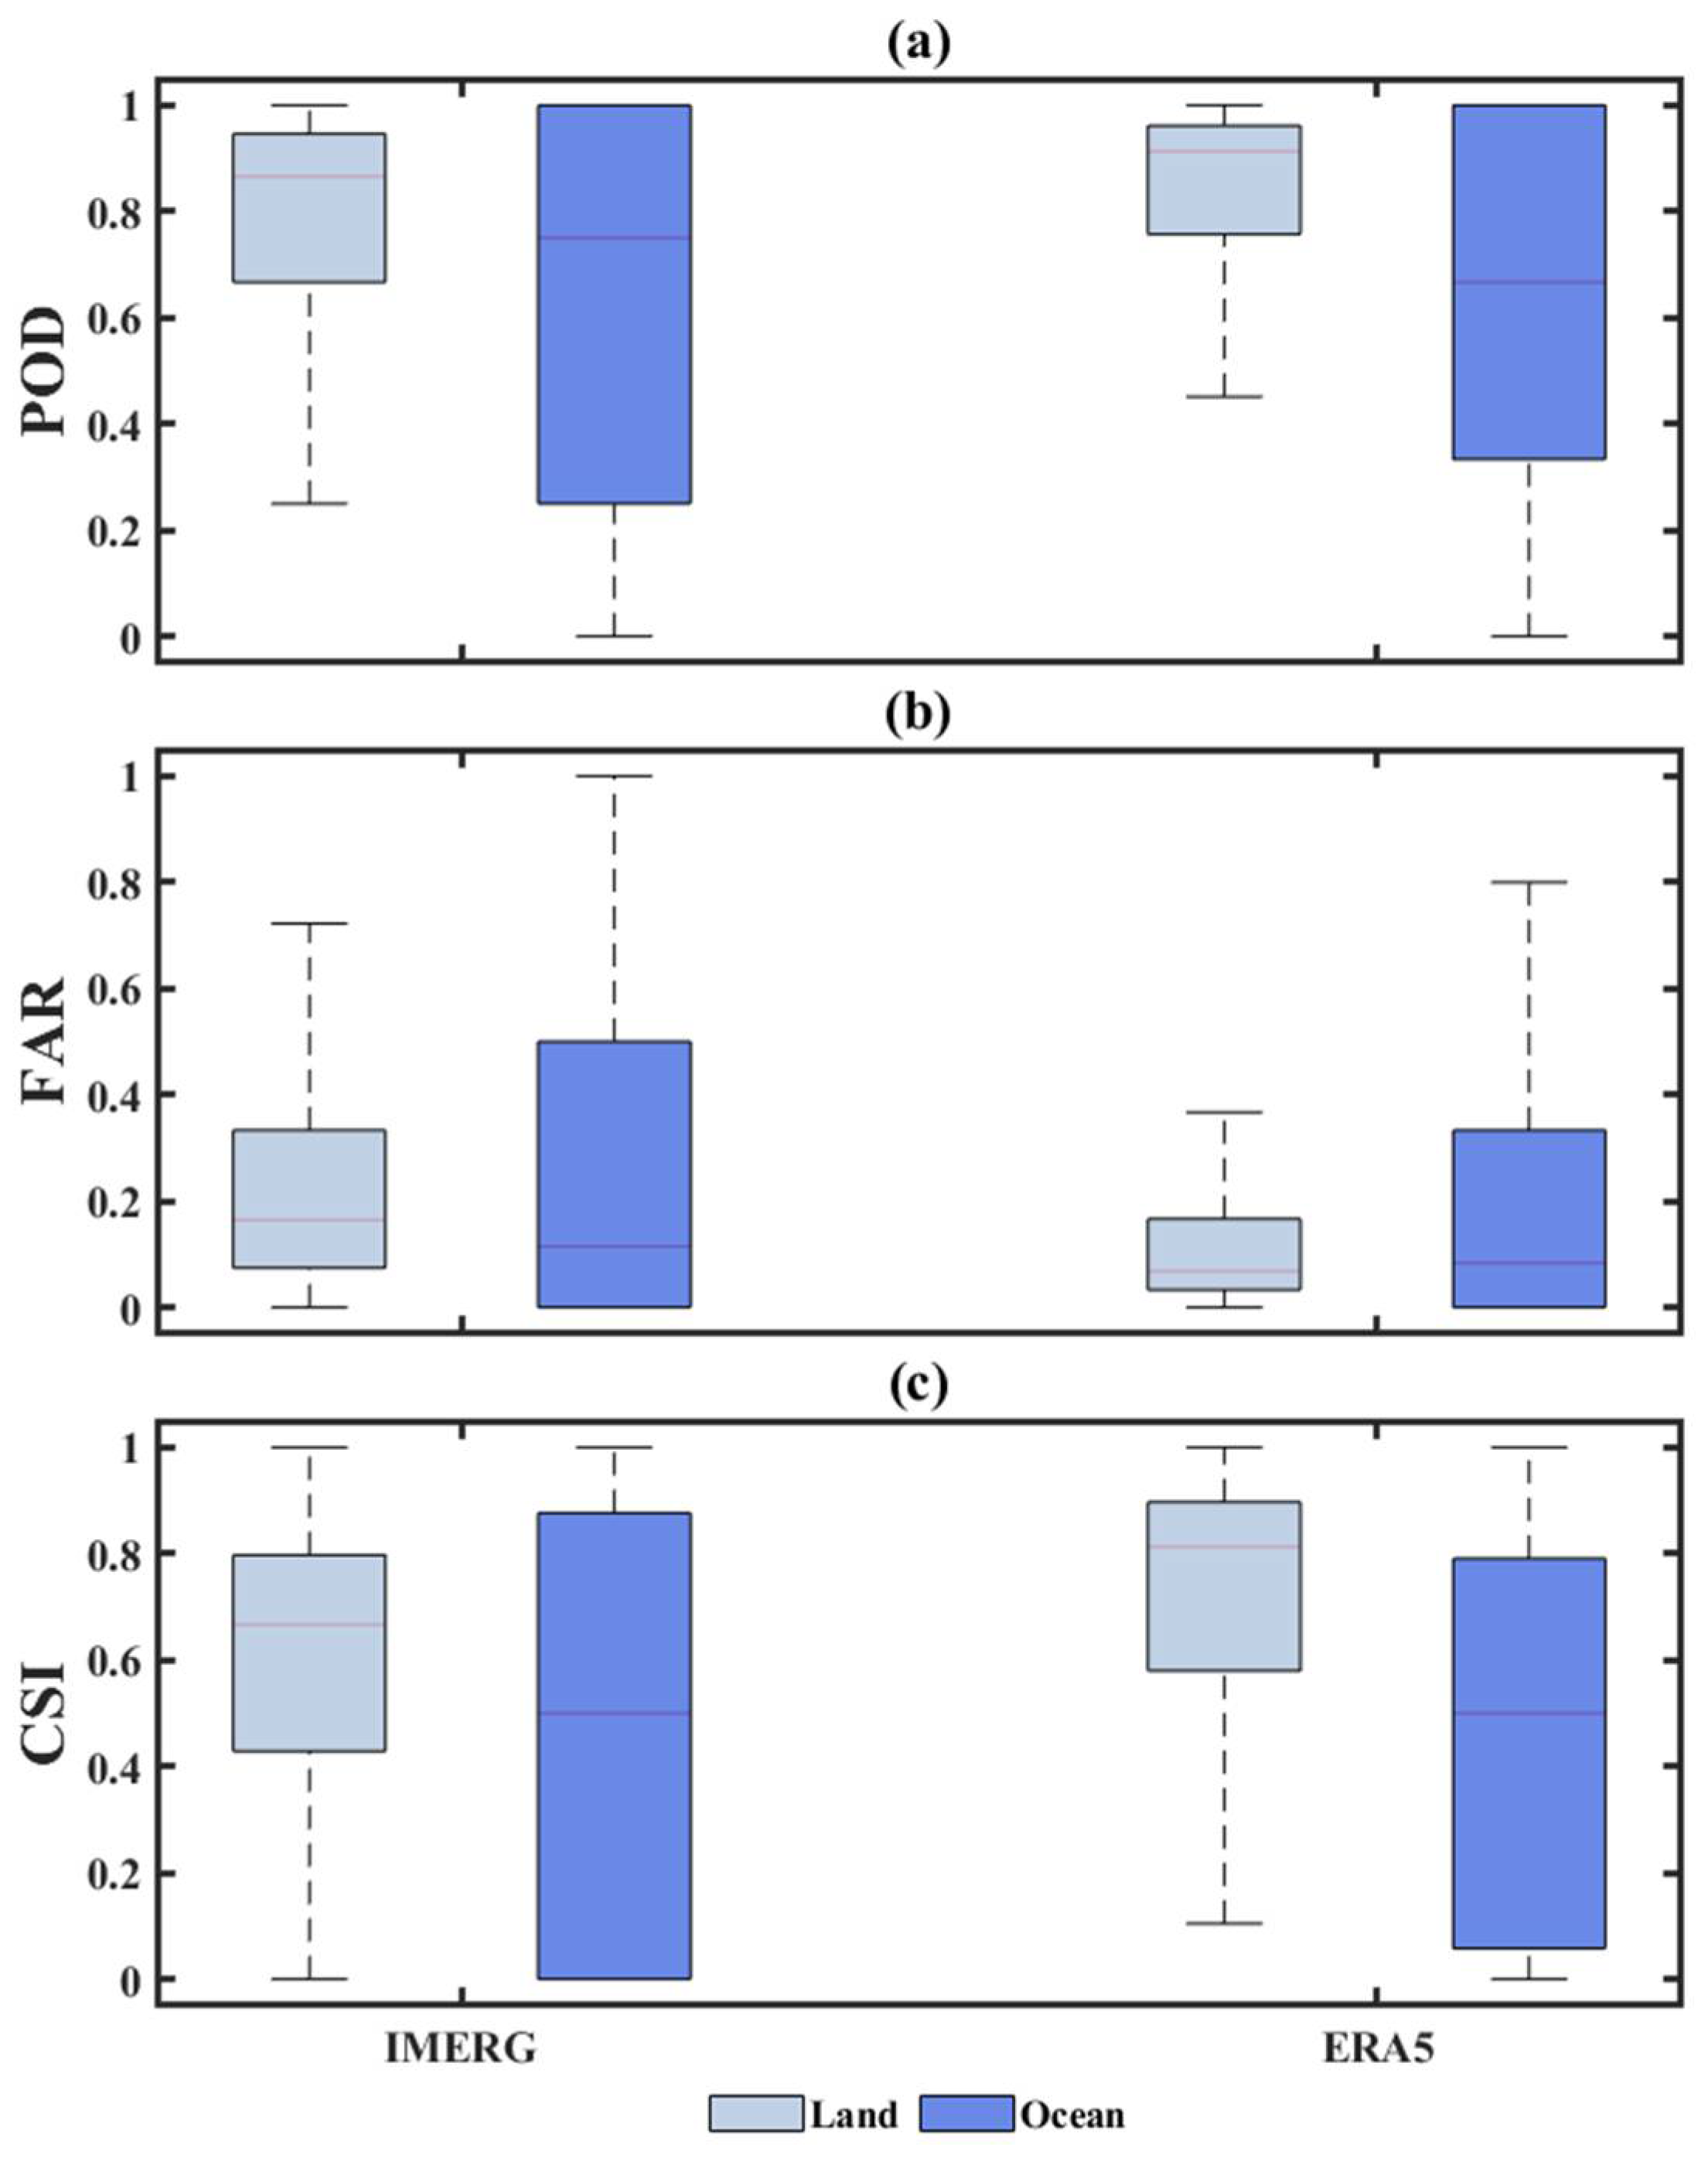
Figure 2 shows the boxplots of three metrics of ERA5 and IMERG over land and ocean. The median POD values of ERA5 and IMERG over land were 0.96 and 0.91, respectively. As for FAR and CSI, IMERG was significantly worse than ERA5. The median CSI values of ERA5 and IMERG over land and ocean were 0.82 and 0.78, respectively. Based on the metrics above, it is assumed that IMERG overestimates the number of snowfall events compared to ERA5.
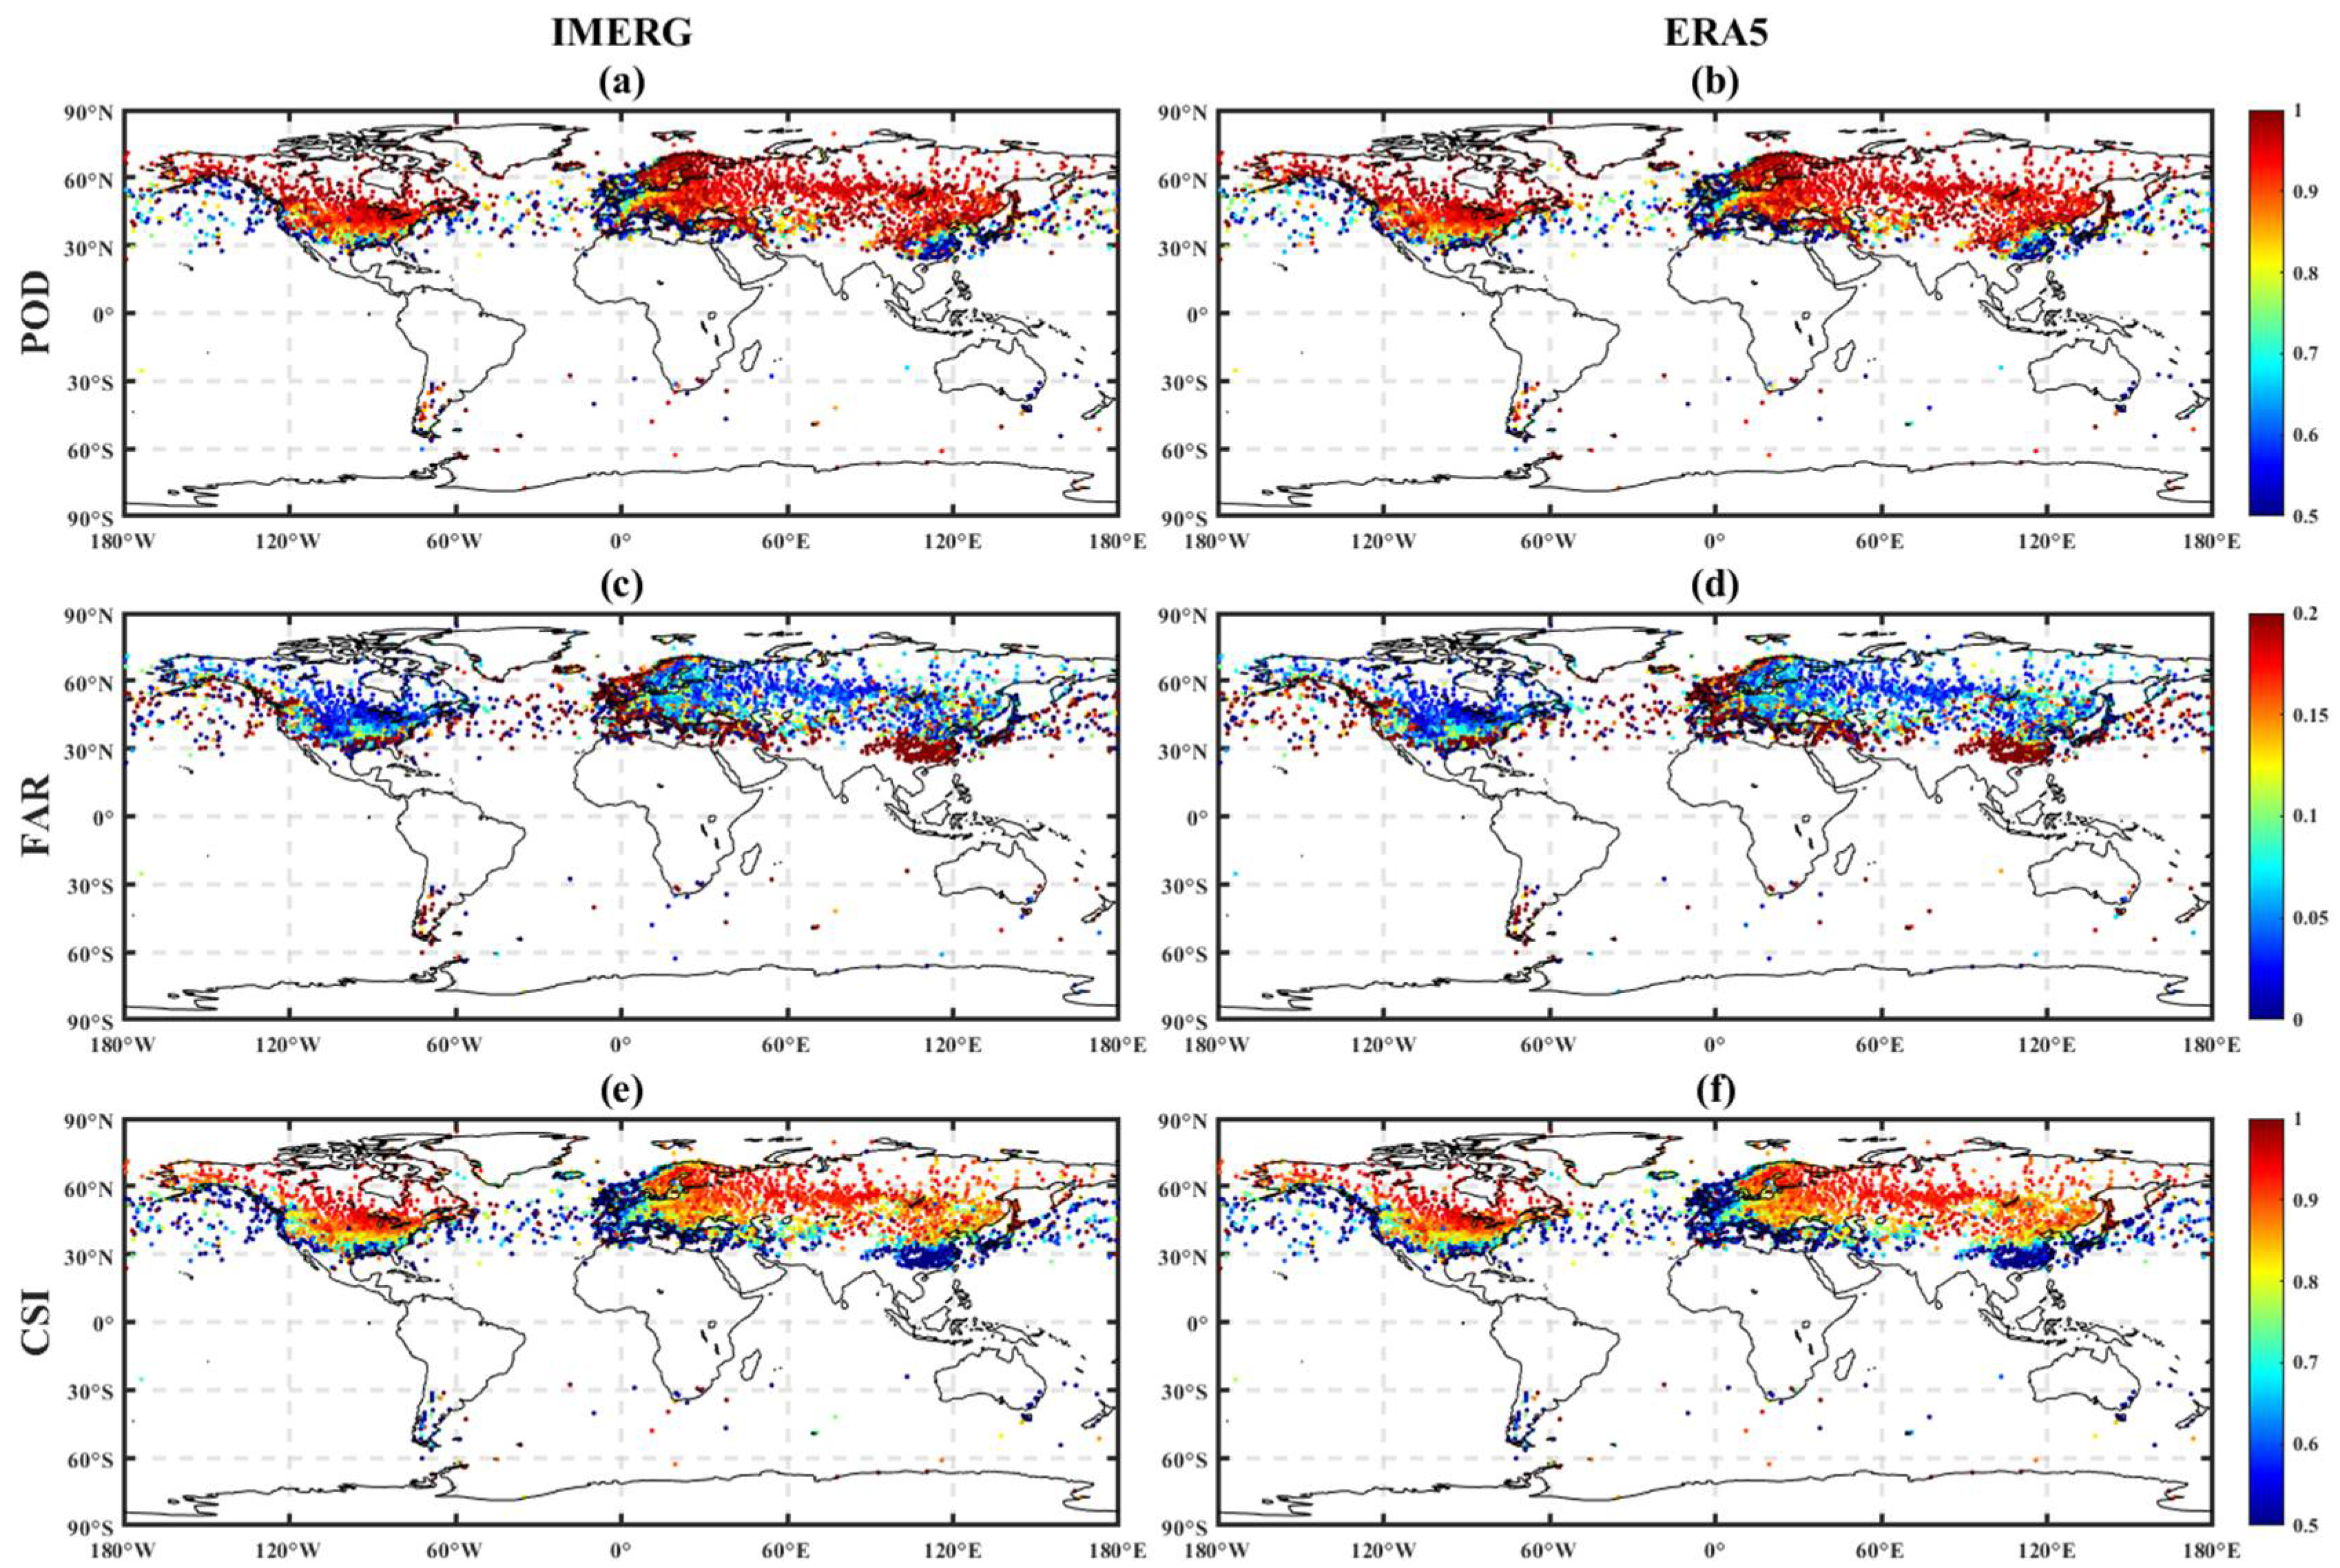
Figure 3 shows the spatial distributions of metrics for ERA5 and IMERG products globally. The spatial distributions of ERA5 and IMERG metrics were similar overall, but there were some slight differences: (1) POD, FAR, and CSI of ERA5 were better than IMERG overall, and the same was true over the ocean; and (2) IMERG performed better than ERA5 in mid-latitude land areas (about 35–50° N), where the POD of IMERG was about 0.9 and the POD of ERA5 was about 0.85.
Similar to Figure 2, Figure 3 shows that ERA5 and IMERG performed significantly worse over ocean than over land. The sparse ocean gauge networks and fewer observation records are an important reason for this problem, and the quality of ERA5 and IMERG need to be improved further to provide more accurate rain–snow partitioning over the ocean.
3.2. Seasonal and Regional Analysis
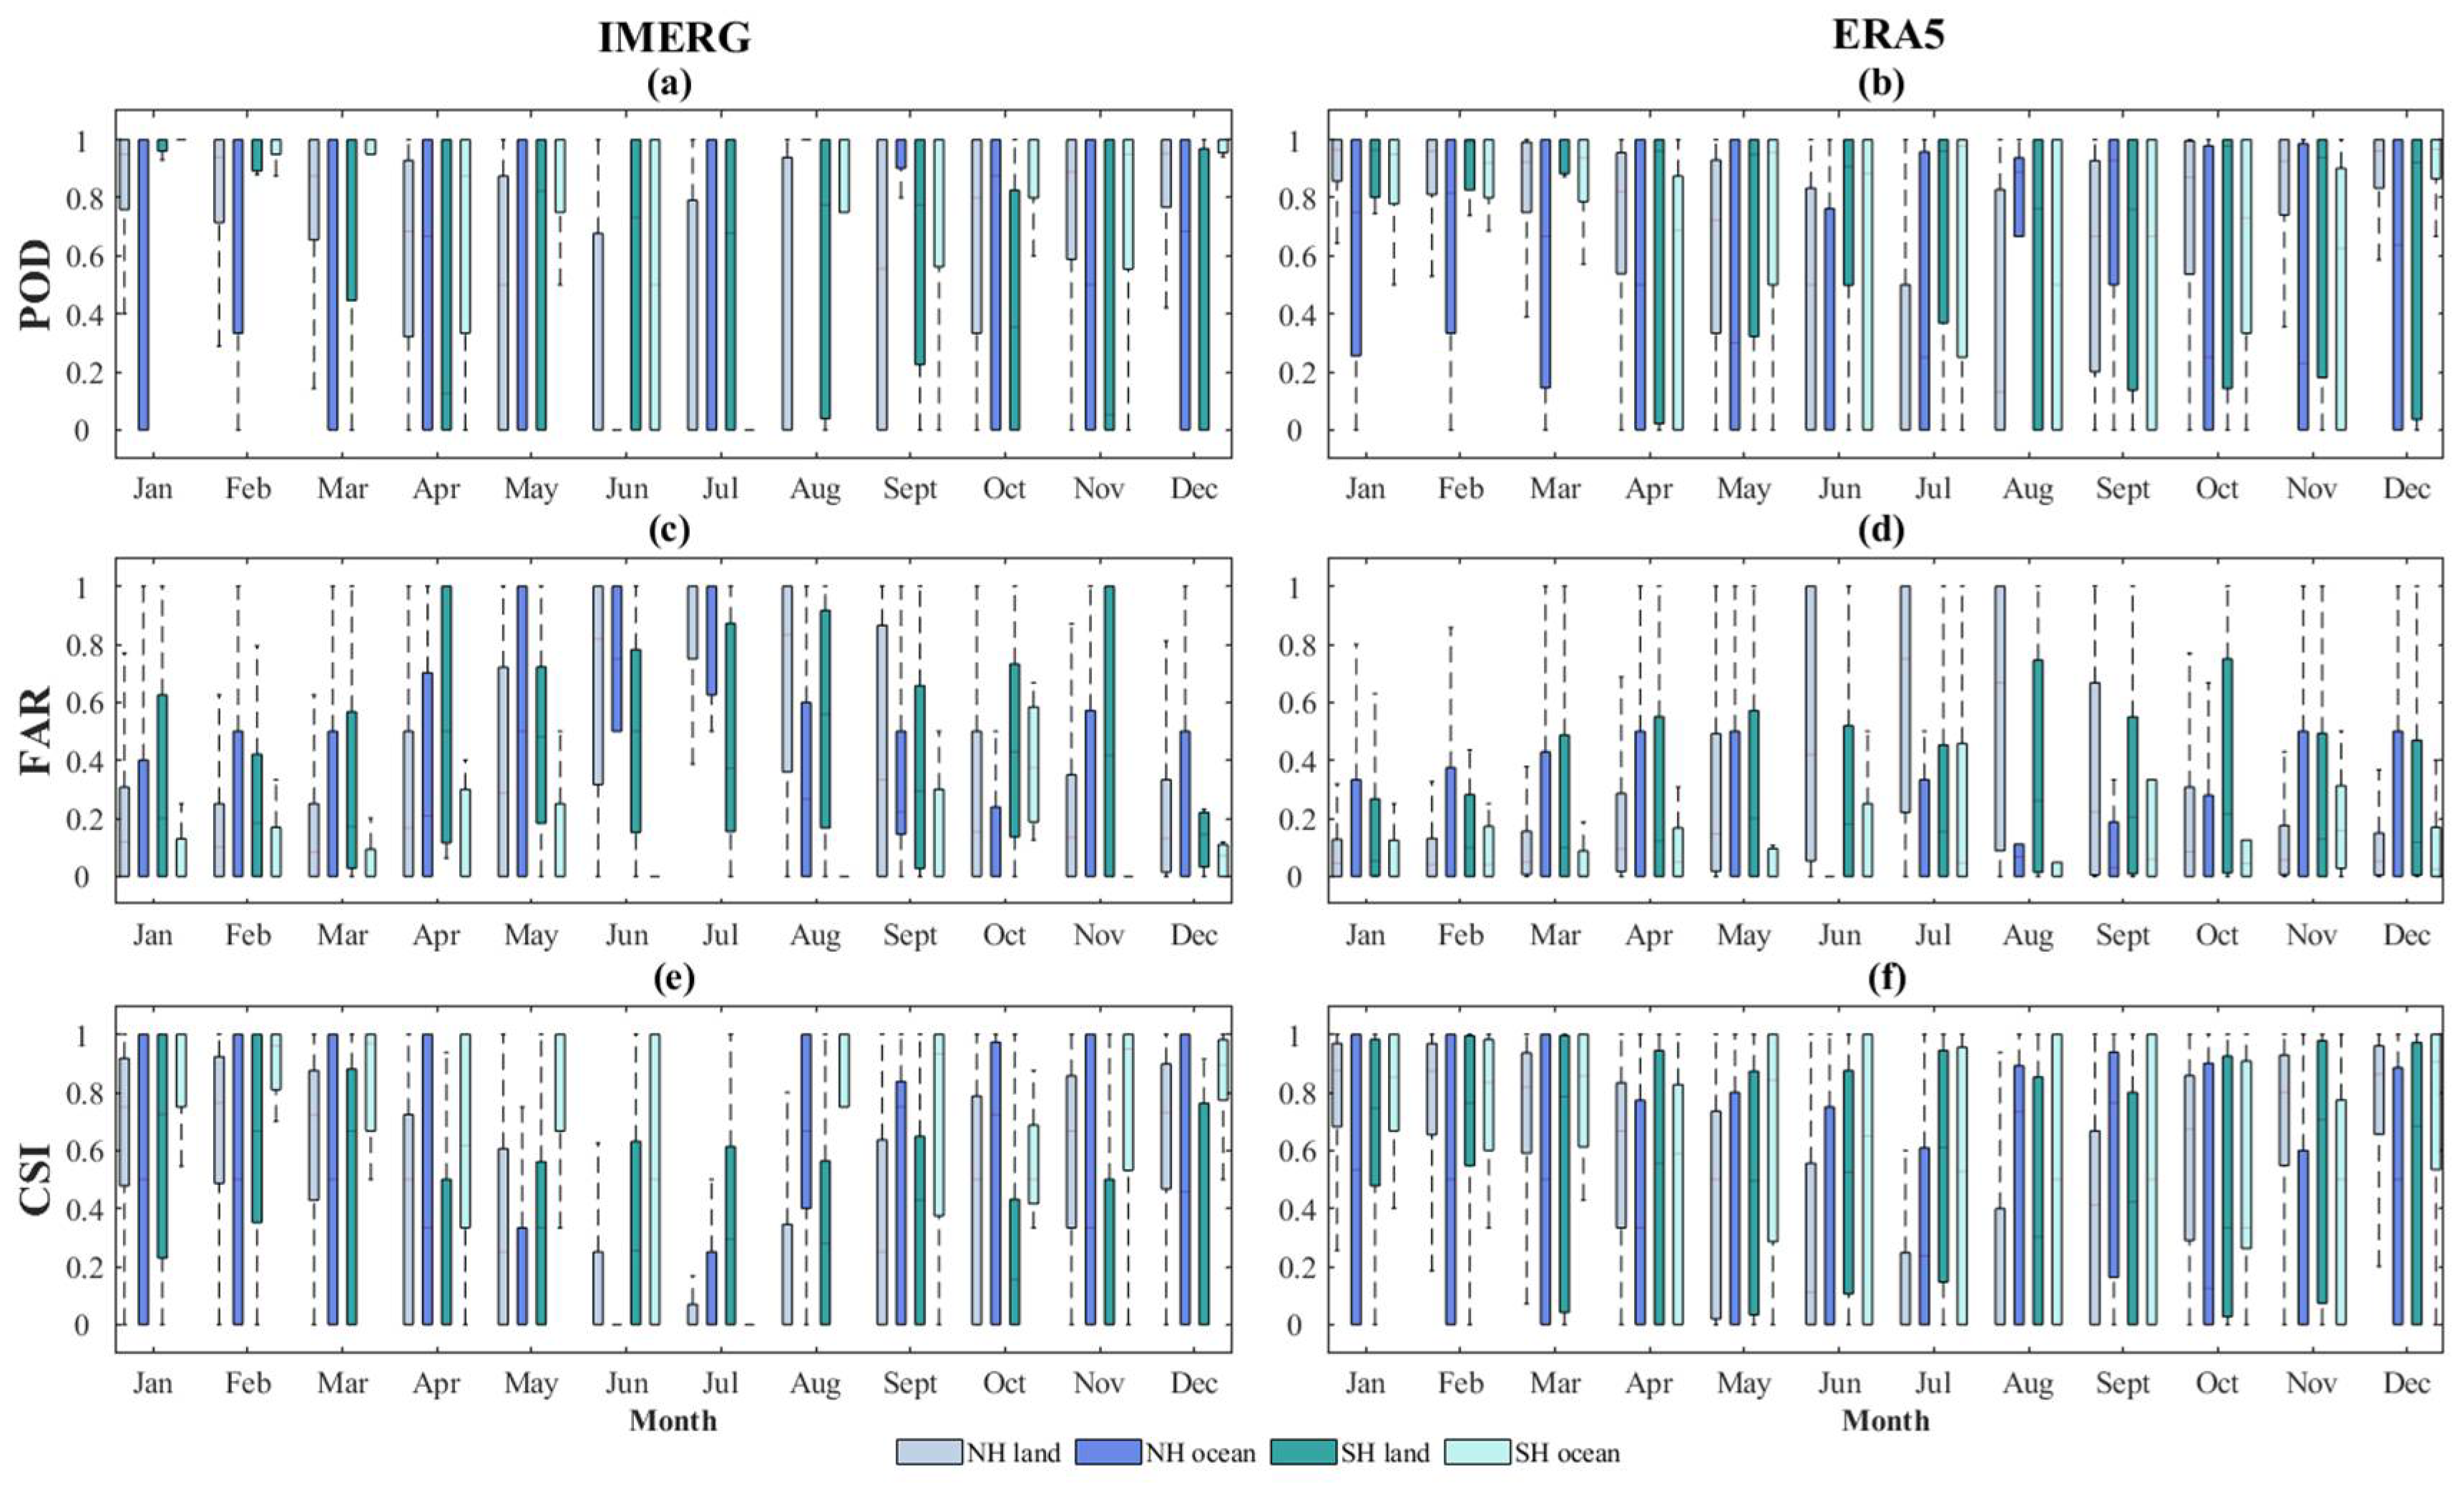
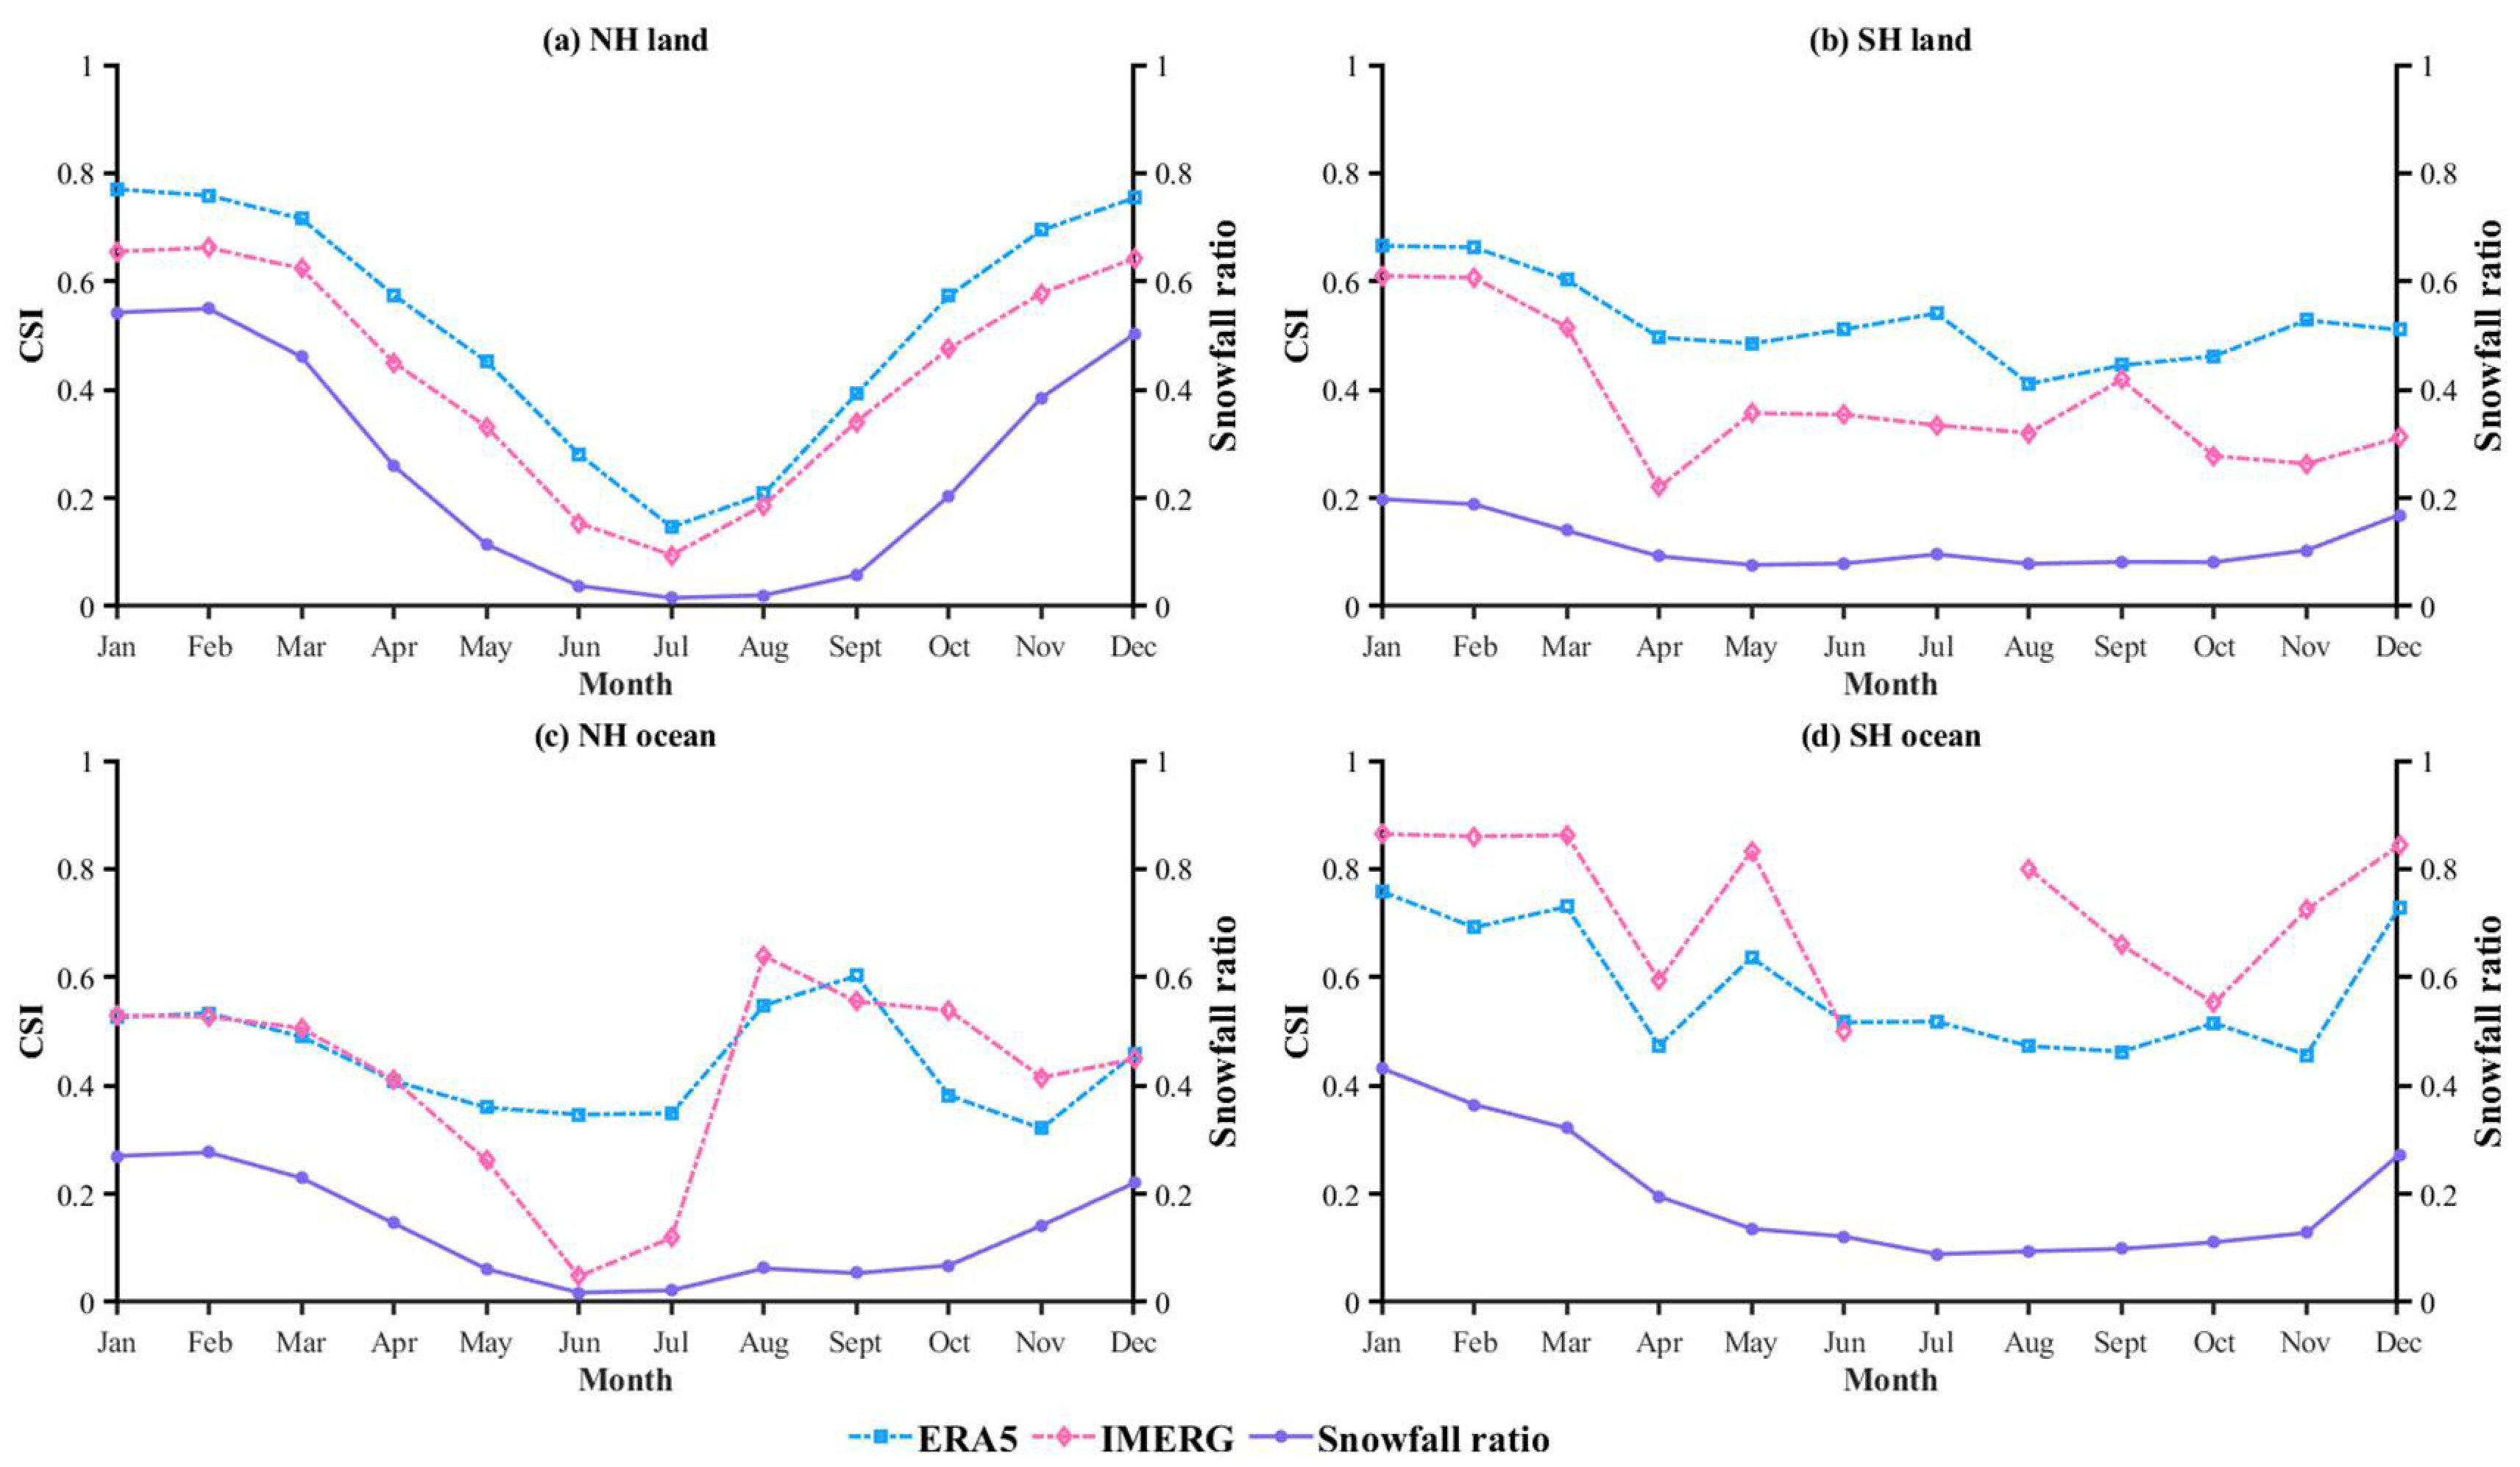
Figure 4 shows the boxplots of POD for the twelve months for ERA5 and IMERG over global land and oceans, from 2000 to 2007. Figure 5 shows the mean snowfall ratio and CSI for the twelve months for ERA5 and IMERG over global land and oceans, from 2000 to 2007. This study defined the seasons as spring (March–May), summer (June–August), fall (September–November), and winter (December–February) for the Northern Hemisphere (NH); and spring (September–November), summer (December–February), fall (March–May), and winter (June–August) for the Southern Hemisphere (SH). ERA5 and IMERG performed better over the NH land in fall and winter than in spring and summer, especially from November to March, when the median value of POD was about 0.95. The performance of IMERG and ERA5 deteriorated with the decrease of snowfall ratio, especially in the summer of the NH land. As the seasons changed, all products showed a similar trend in the NH. That is, when the seasonal temperature rose, the POD fell, and when the seasonal temperature fell, the POD rose. This implies that it is difficult to detect snowfall in warmer seasons. ERA5 and IMERG products still showed poor performance over the NH oceans.
Compared to the NH, ERA5 and IMERG products performed better in May to July over SH land and oceans. However, these products showed significant improvement from January to March, which was even better than in the NH. Furthermore, the POD over oceans was still weaker than over land in the SH. The quality of ocean rain–snow partitioning needs to be improved further to provide more accurate precipitation phase results.
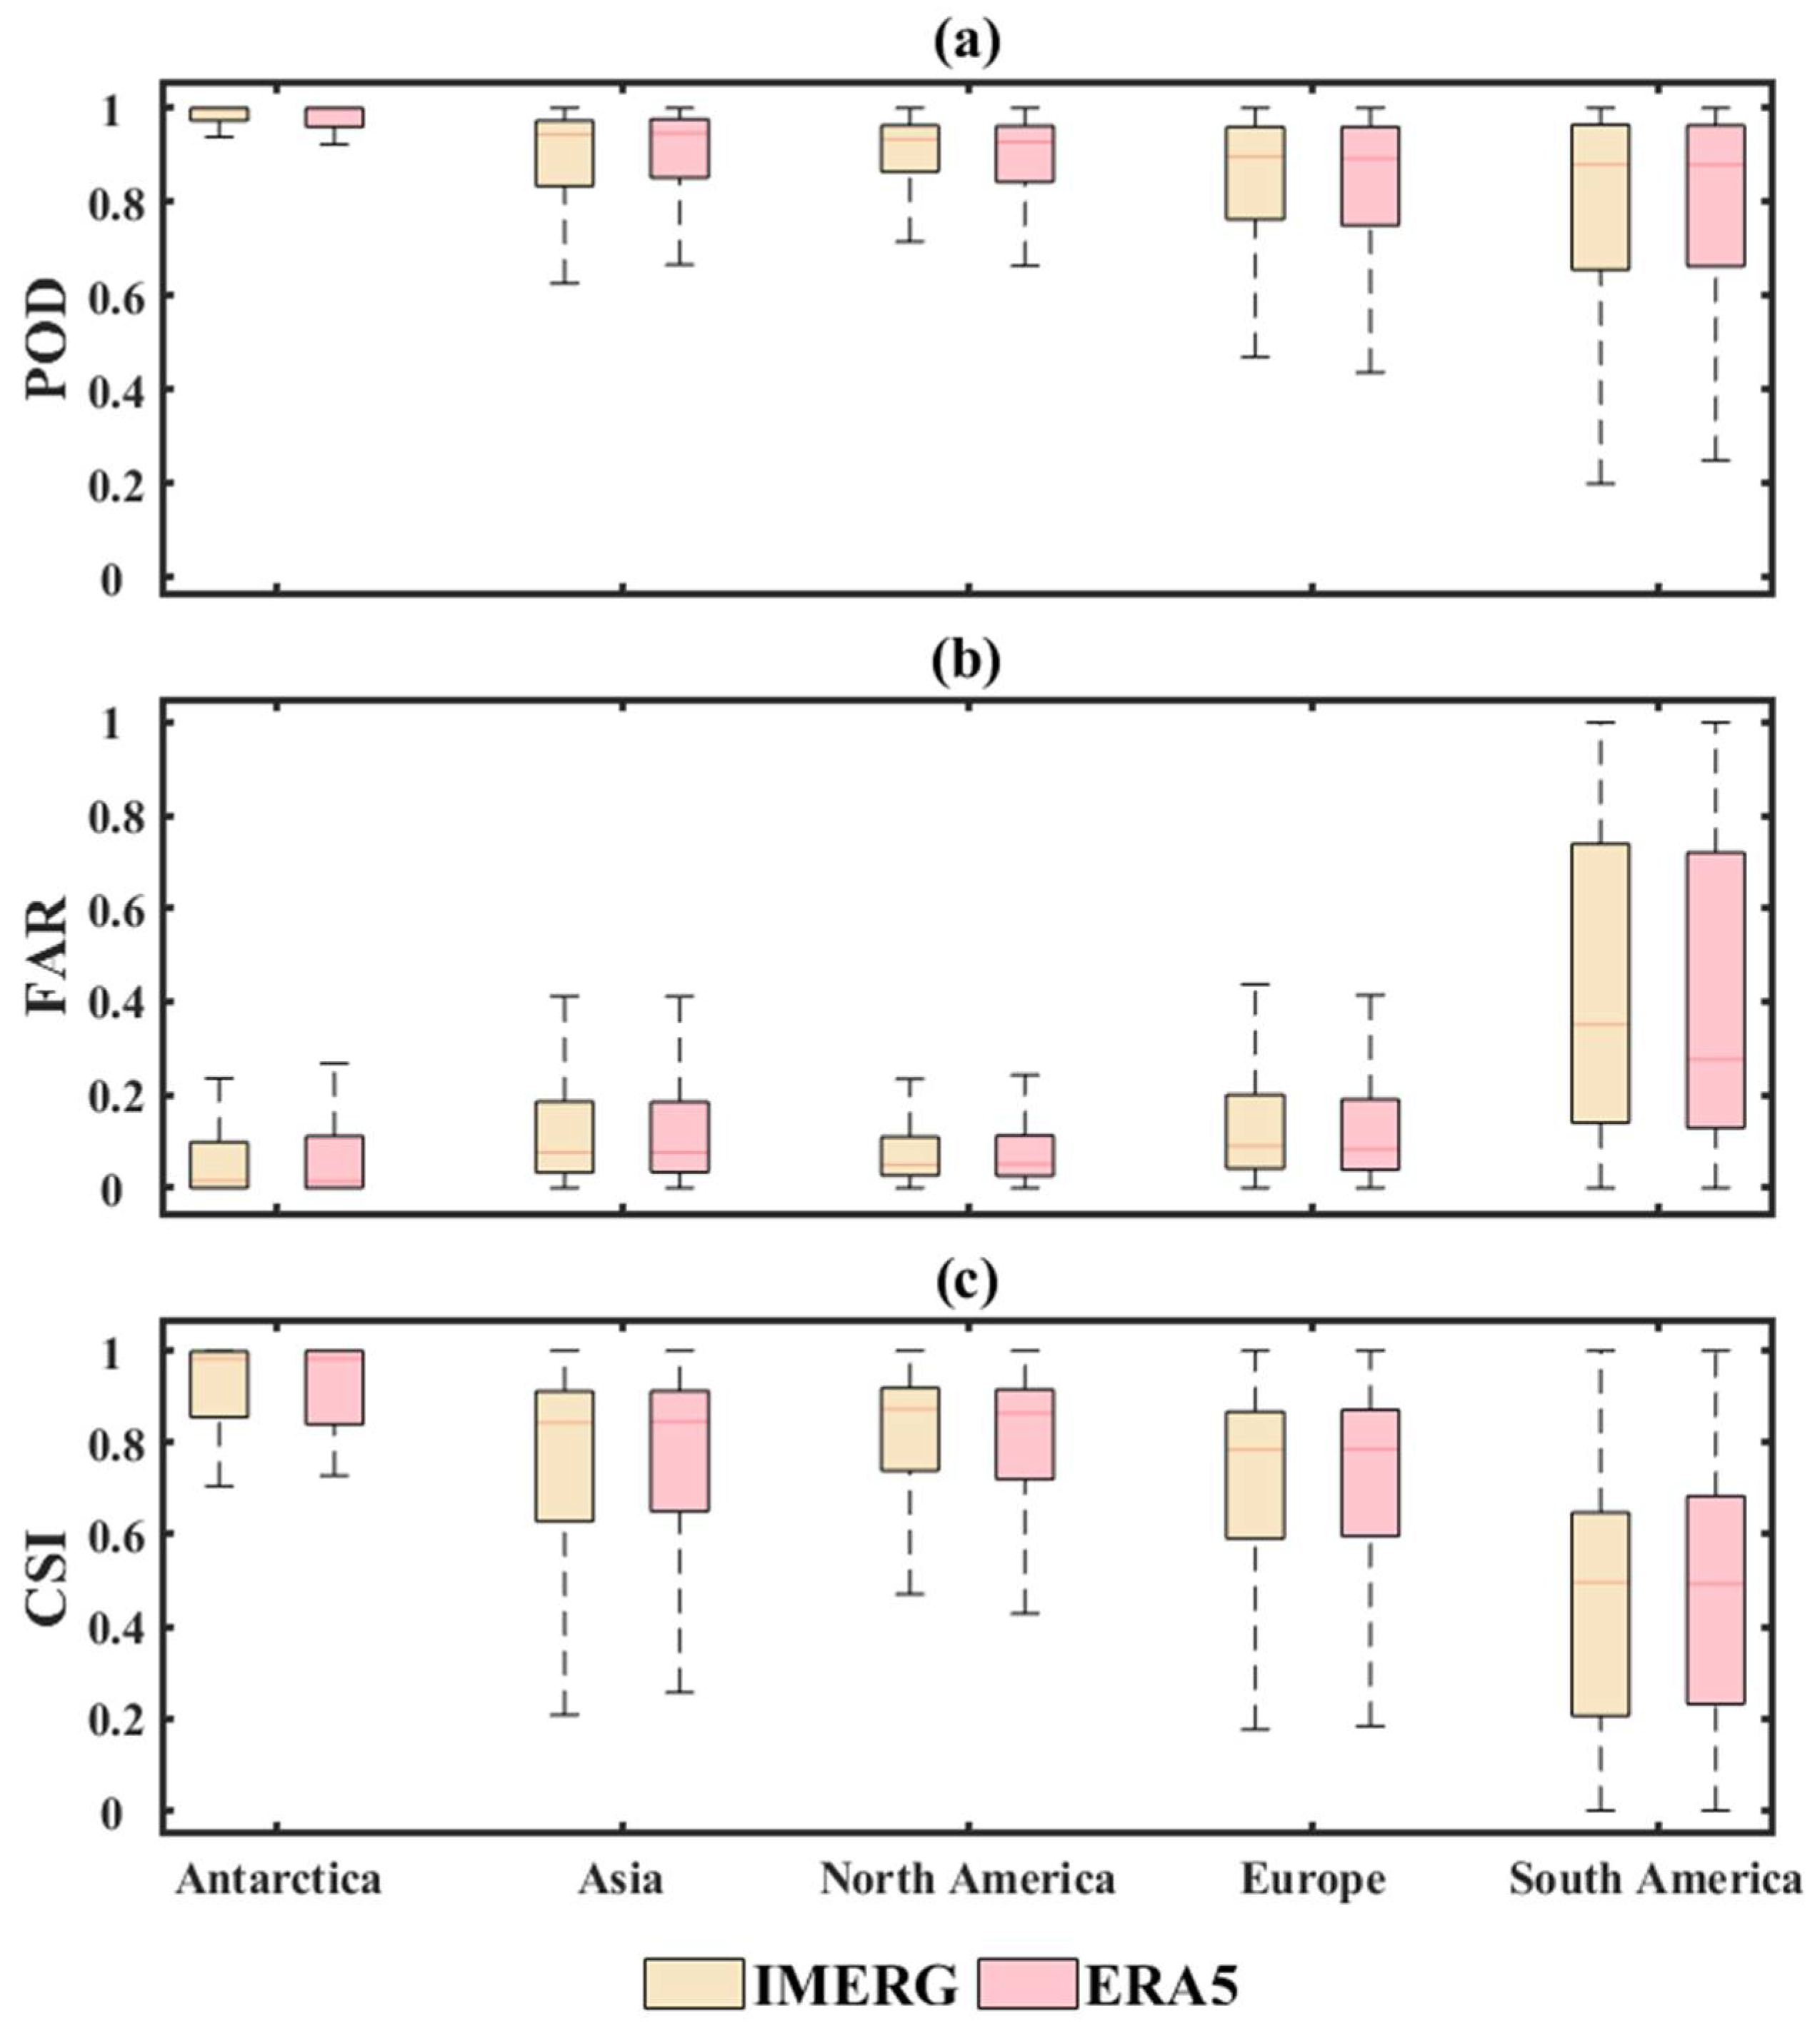
Figure 6 shows the boxplots of the three metrics of ERA5 and IMERG in five continents. It is noted that there were relatively few samples in Antarctica, and most of them came from coastal areas close to Antarctica. Both ERA5 and IMERG products performed best in Antarctica, while performing worst in the South America. This implies that there is a significant challenge in discriminating between rain and snow under circumstances of complex terrain and warm temperatures. ERA5 and IMERG products showed similar performance for the POD in Antarctica, Asia, North America, and Europe. However, the FAR results of ERA5 and IMERG products were worse in Asia, Europe, and South America. This indicates that ERA5 and IMERG have many falsely classified snowfall events in these continents. Overall, ERA5 demonstrates a more stable performance than IMERG.
3.3. Sensitivity to Precipitation and Temperature
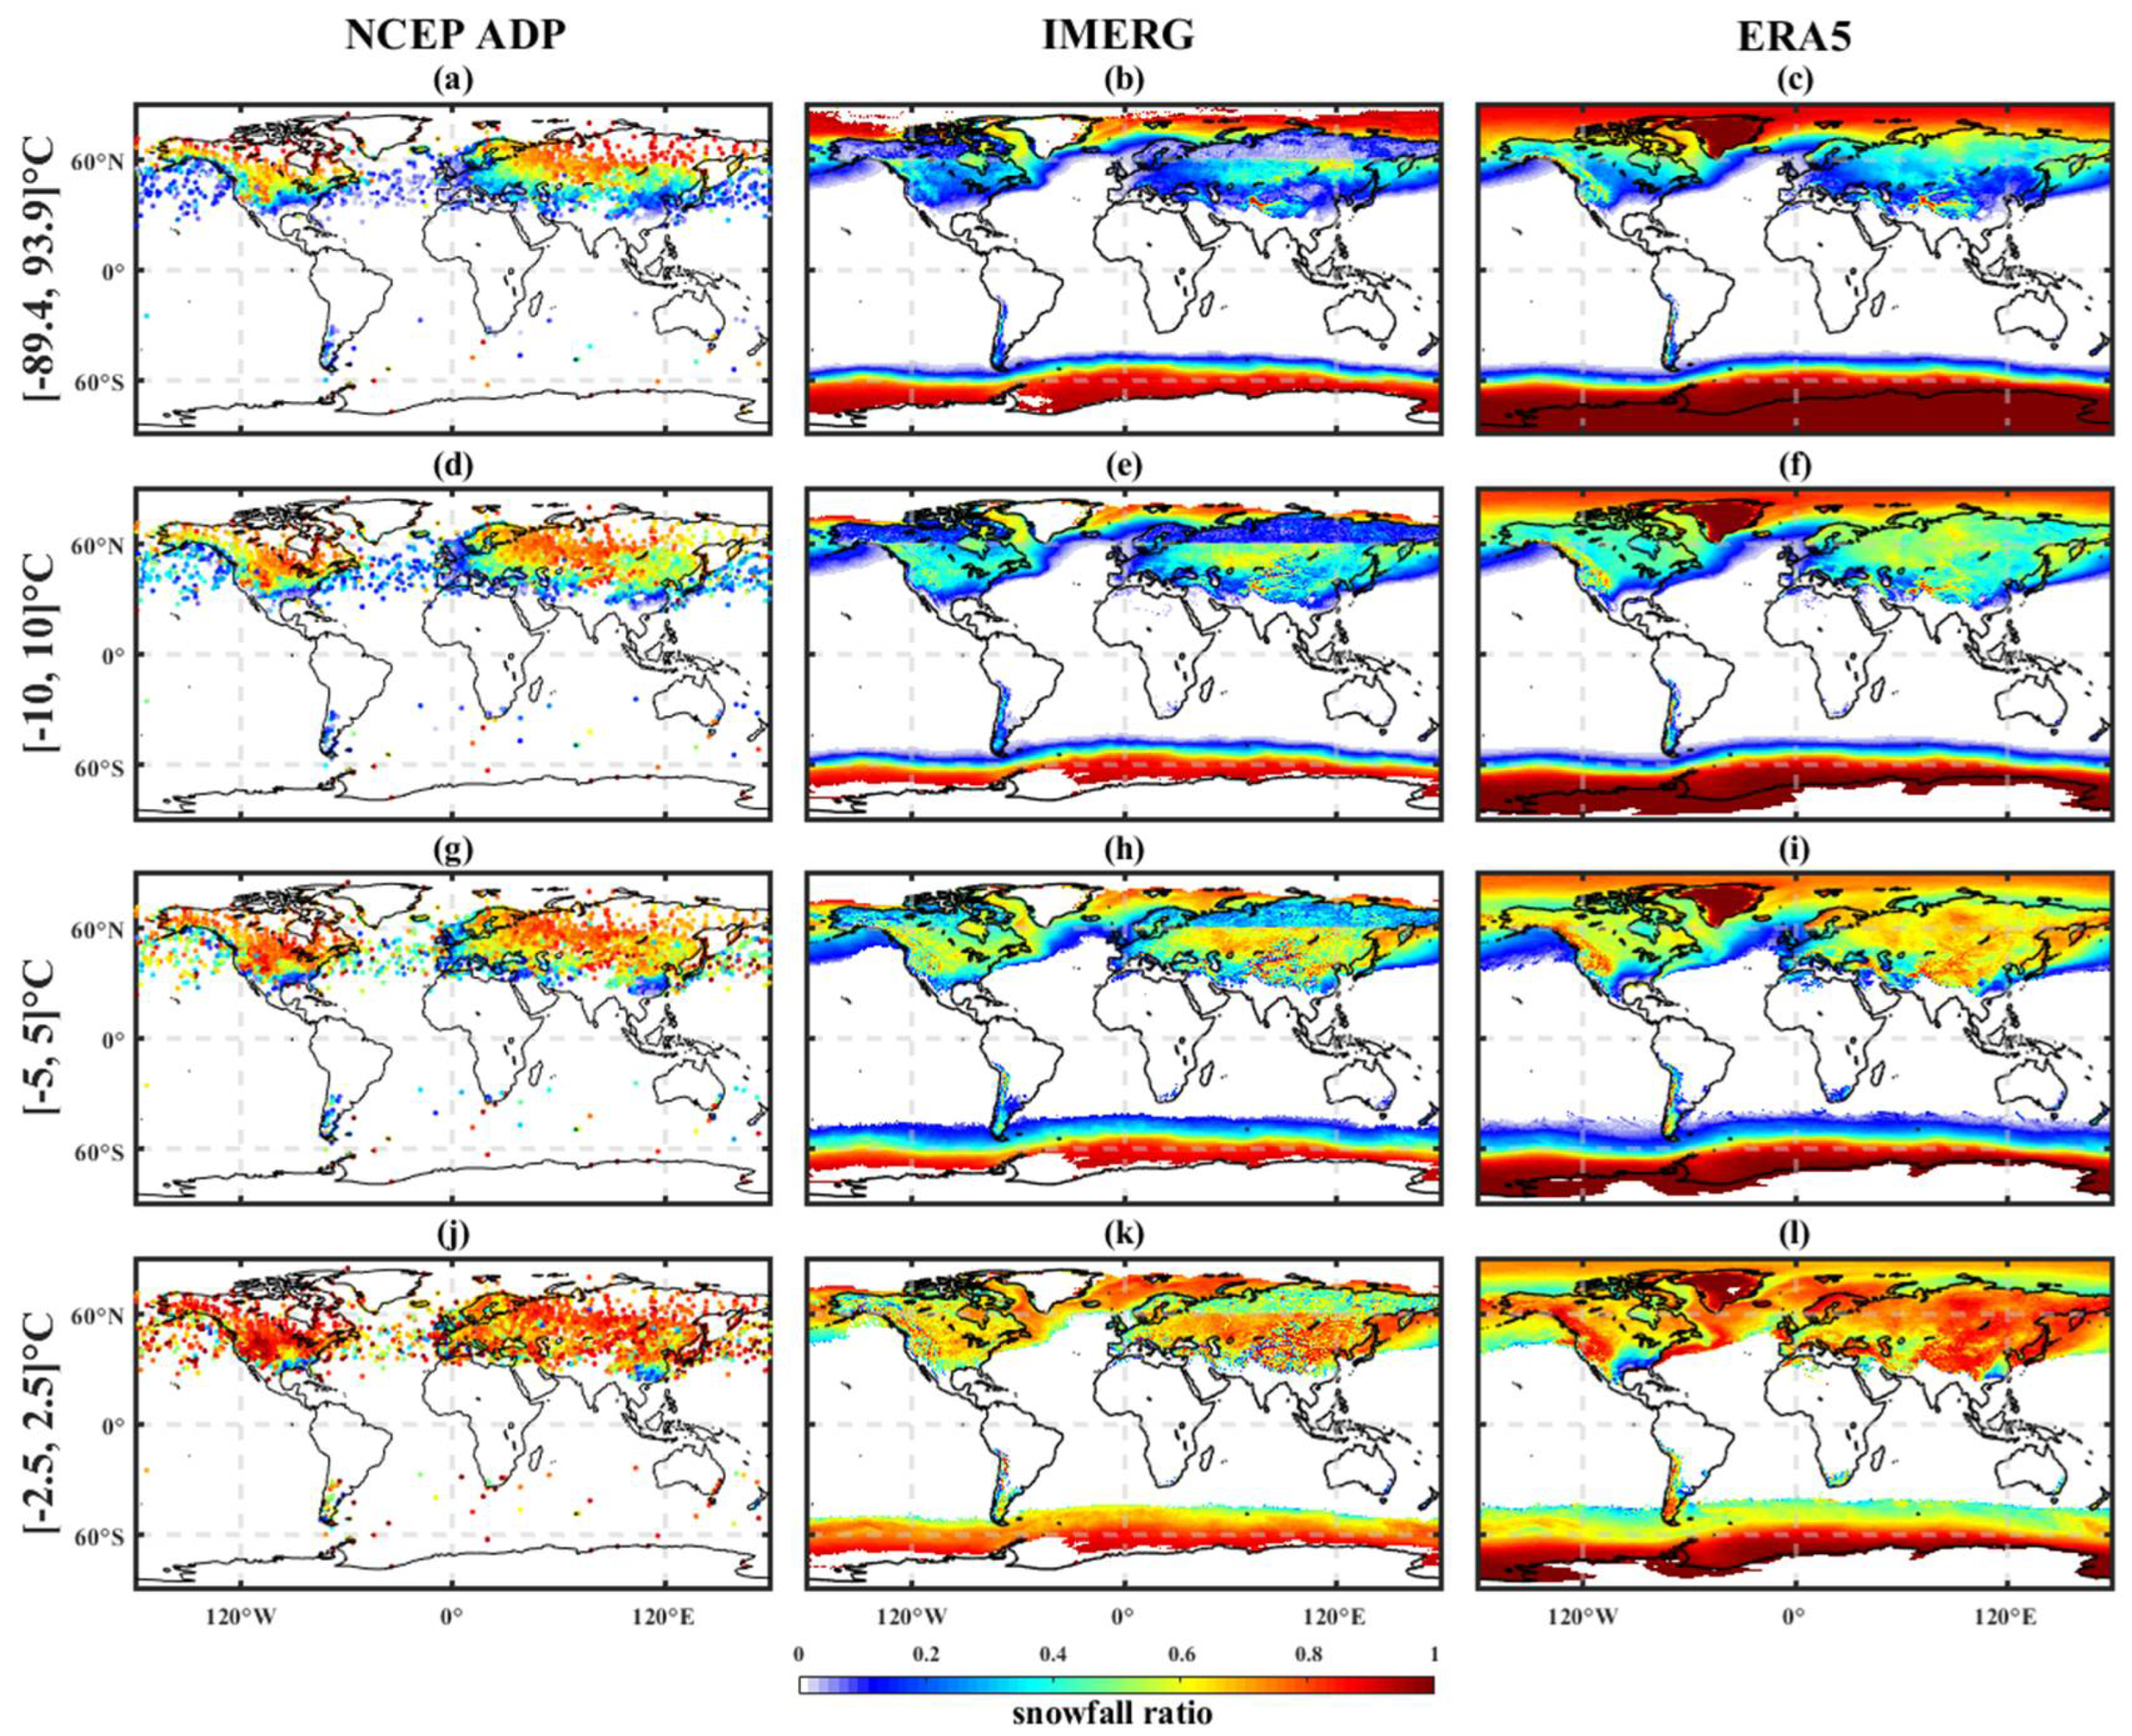
In order to analyze the sensitivity of ERA5 and IMERG products to the precipitation total amount, mean air temperature, and snowfall ratio, the CSI and snowfall event numbers of IMERG and ERA5 were calculated under different precipitation and temperature conditions. Figure 7 shows the spatial distribution of the snowfall ratio under different air temperature ranges for NCEP ADP, IMERG, and ERA5. Overall, the highest snowfall ratio was outside the temperature ranges of −2.5 to 2.5 °C, between which the snowfall ratio was more than 0.6 in most areas and reached to about 0.9 at high latitudes. The snowfall probability of all products increased as the temperature range decreased. Compared to the NCEP ADP and ERA5, the IMERG products underestimated the snowfall ratio at high latitudes under all temperature limits. This phenomenon explains why IMERG products show a worse POD performance than ERA5 in high latitudes (Figure 3). The ERA5 slightly underestimated the snowfall ratio at middle latitudes from −10 to 10 °C and −5 to 5 °C but had comparable results with NECP ADP between −2.5 and 2.5 °C. Moreover, the ERA5 and IMERG products both overestimated the snowfall ratio in the south of South America, probably due to the complex terrain and warm temperature circumstances.
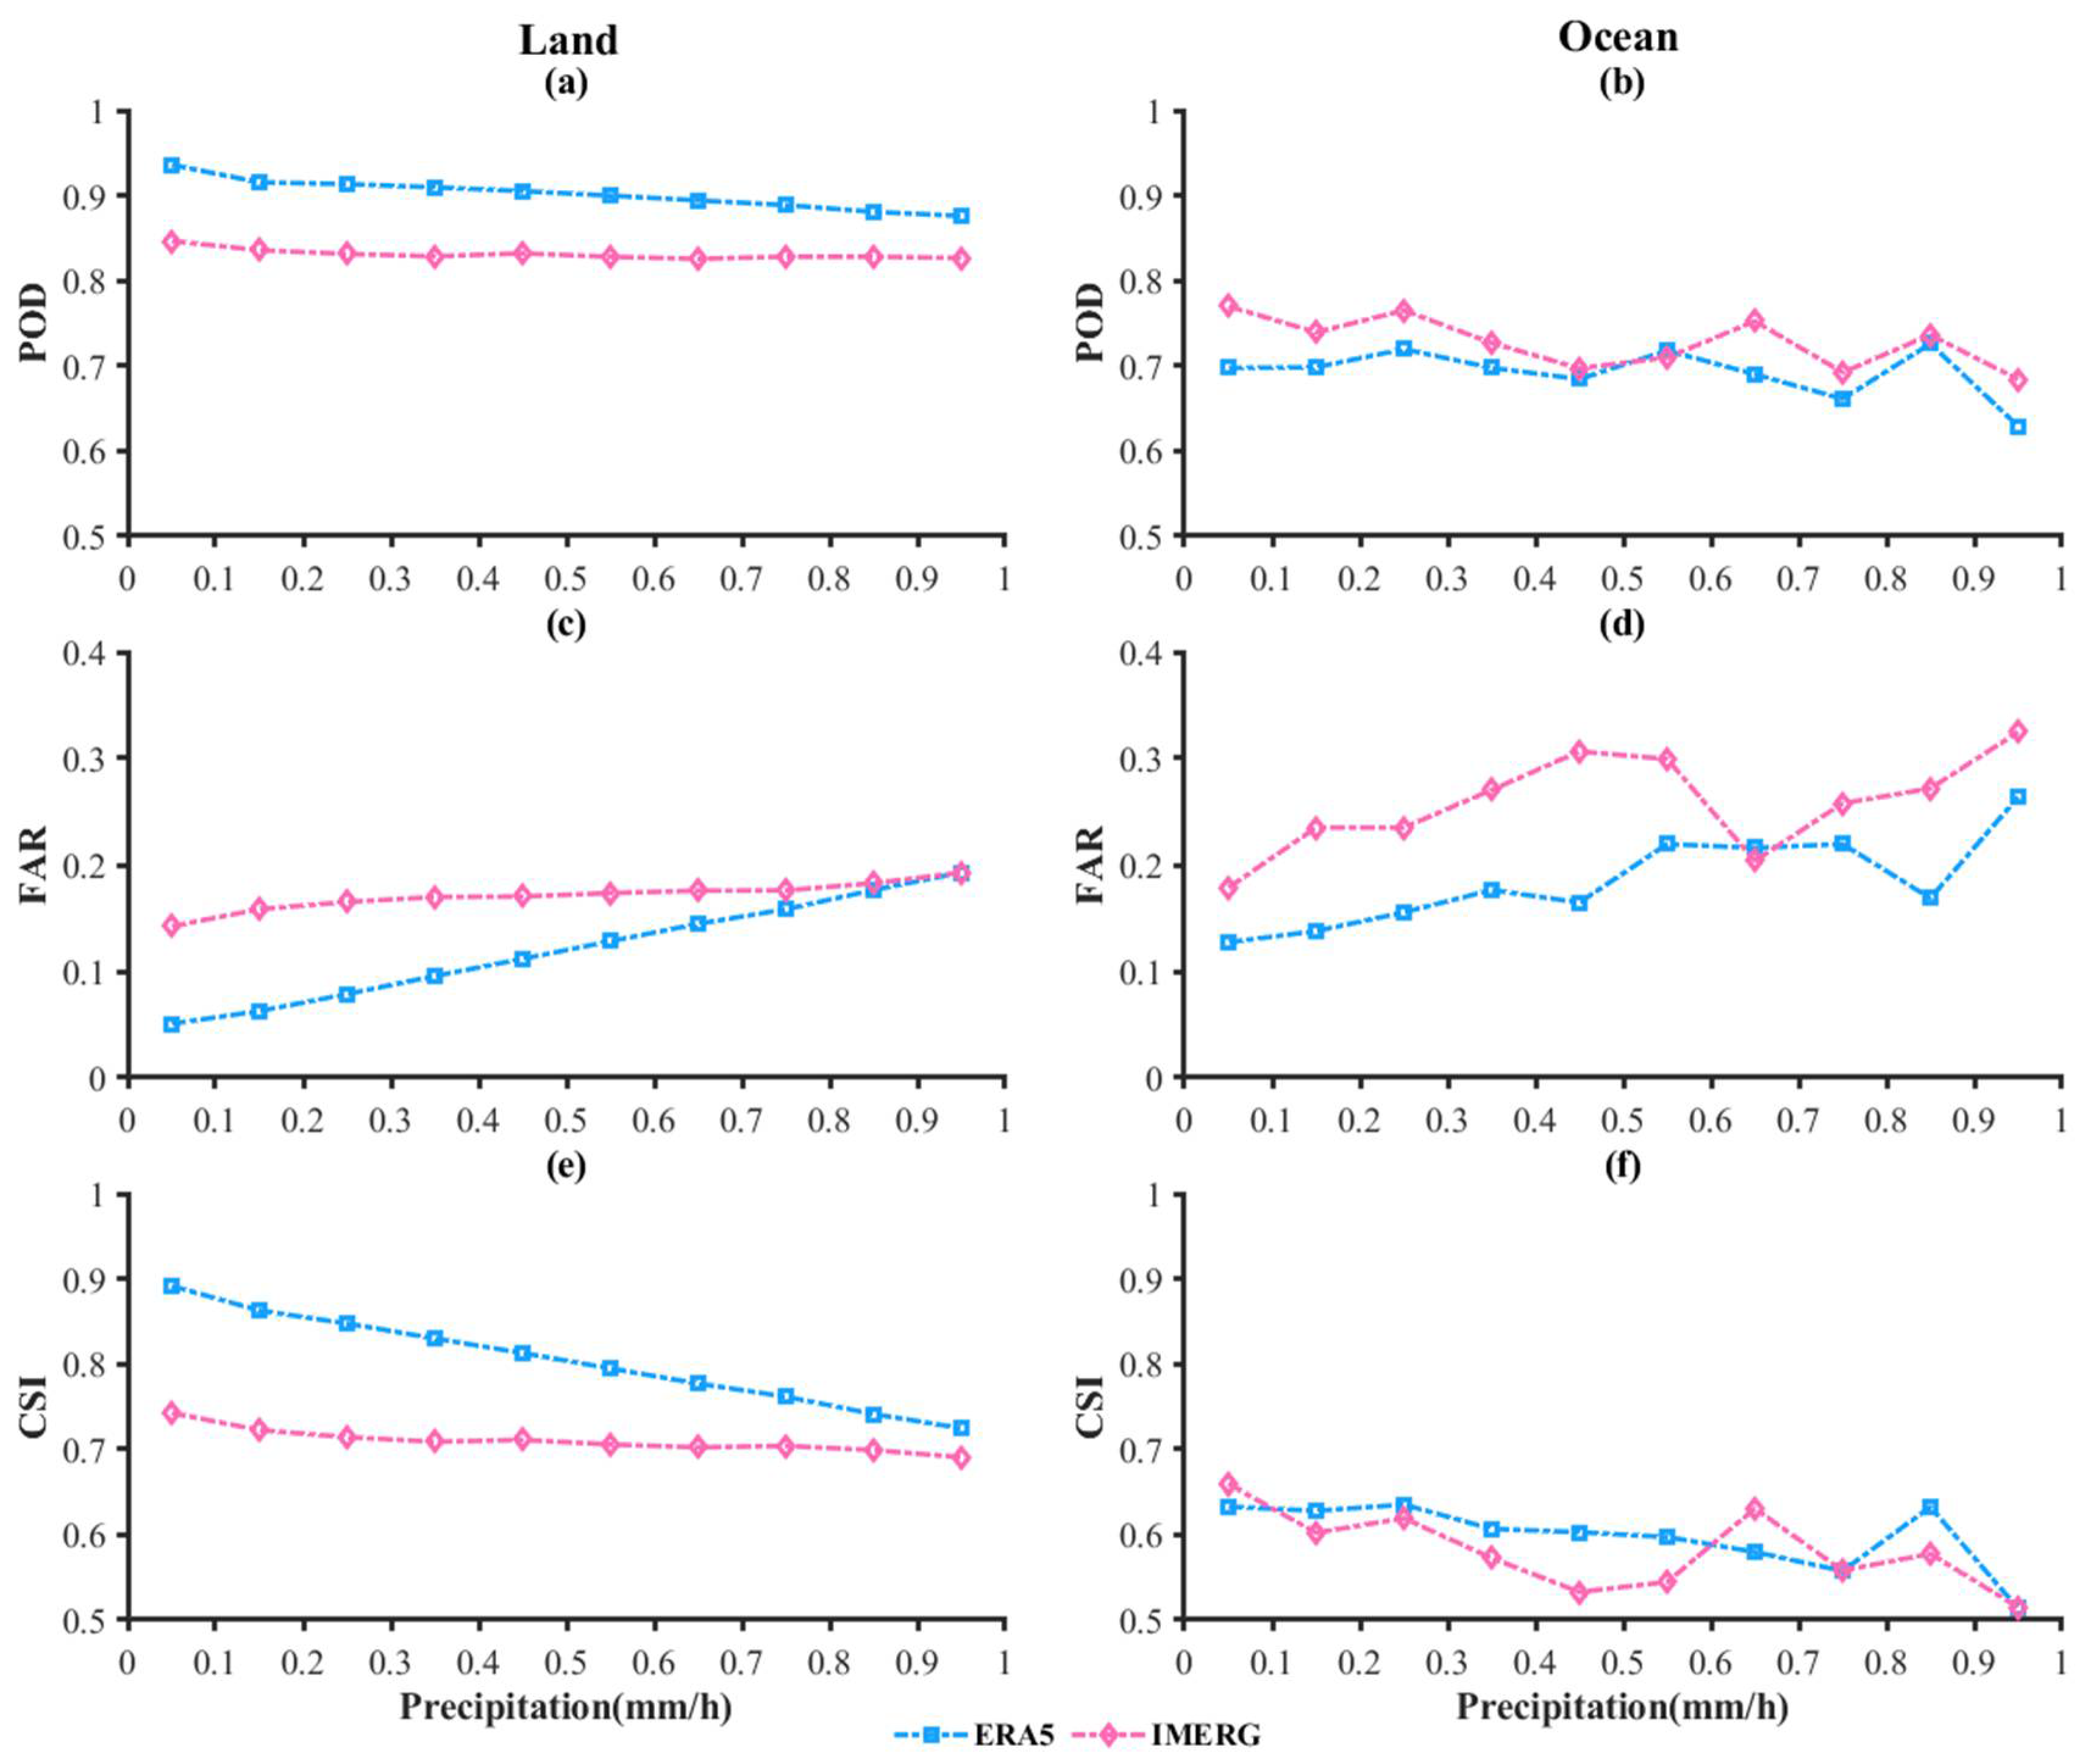
Figure 8 shows that the metrics for ERA5 and IMERG products with different precipitation intensities over global land and oceans. Overall, the ability of IMERG and ERA5 products to distinguish phases of rainfall and snowfall events tended to weaken with the increase of precipitation intensity. Over land, the POD of ERA5 was relatively higher than IMERG under the same precipitation intensity. However, while the FAR of ERA5 increased steadily, the FAR of IMERG fluctuated with the increase in precipitation intensity. This implies that IMERG and ERA5 have lower accuracy for rain–snow partitioning under heavy precipitation. The performance of ERA5 and IMERG over oceans was similar to over land.
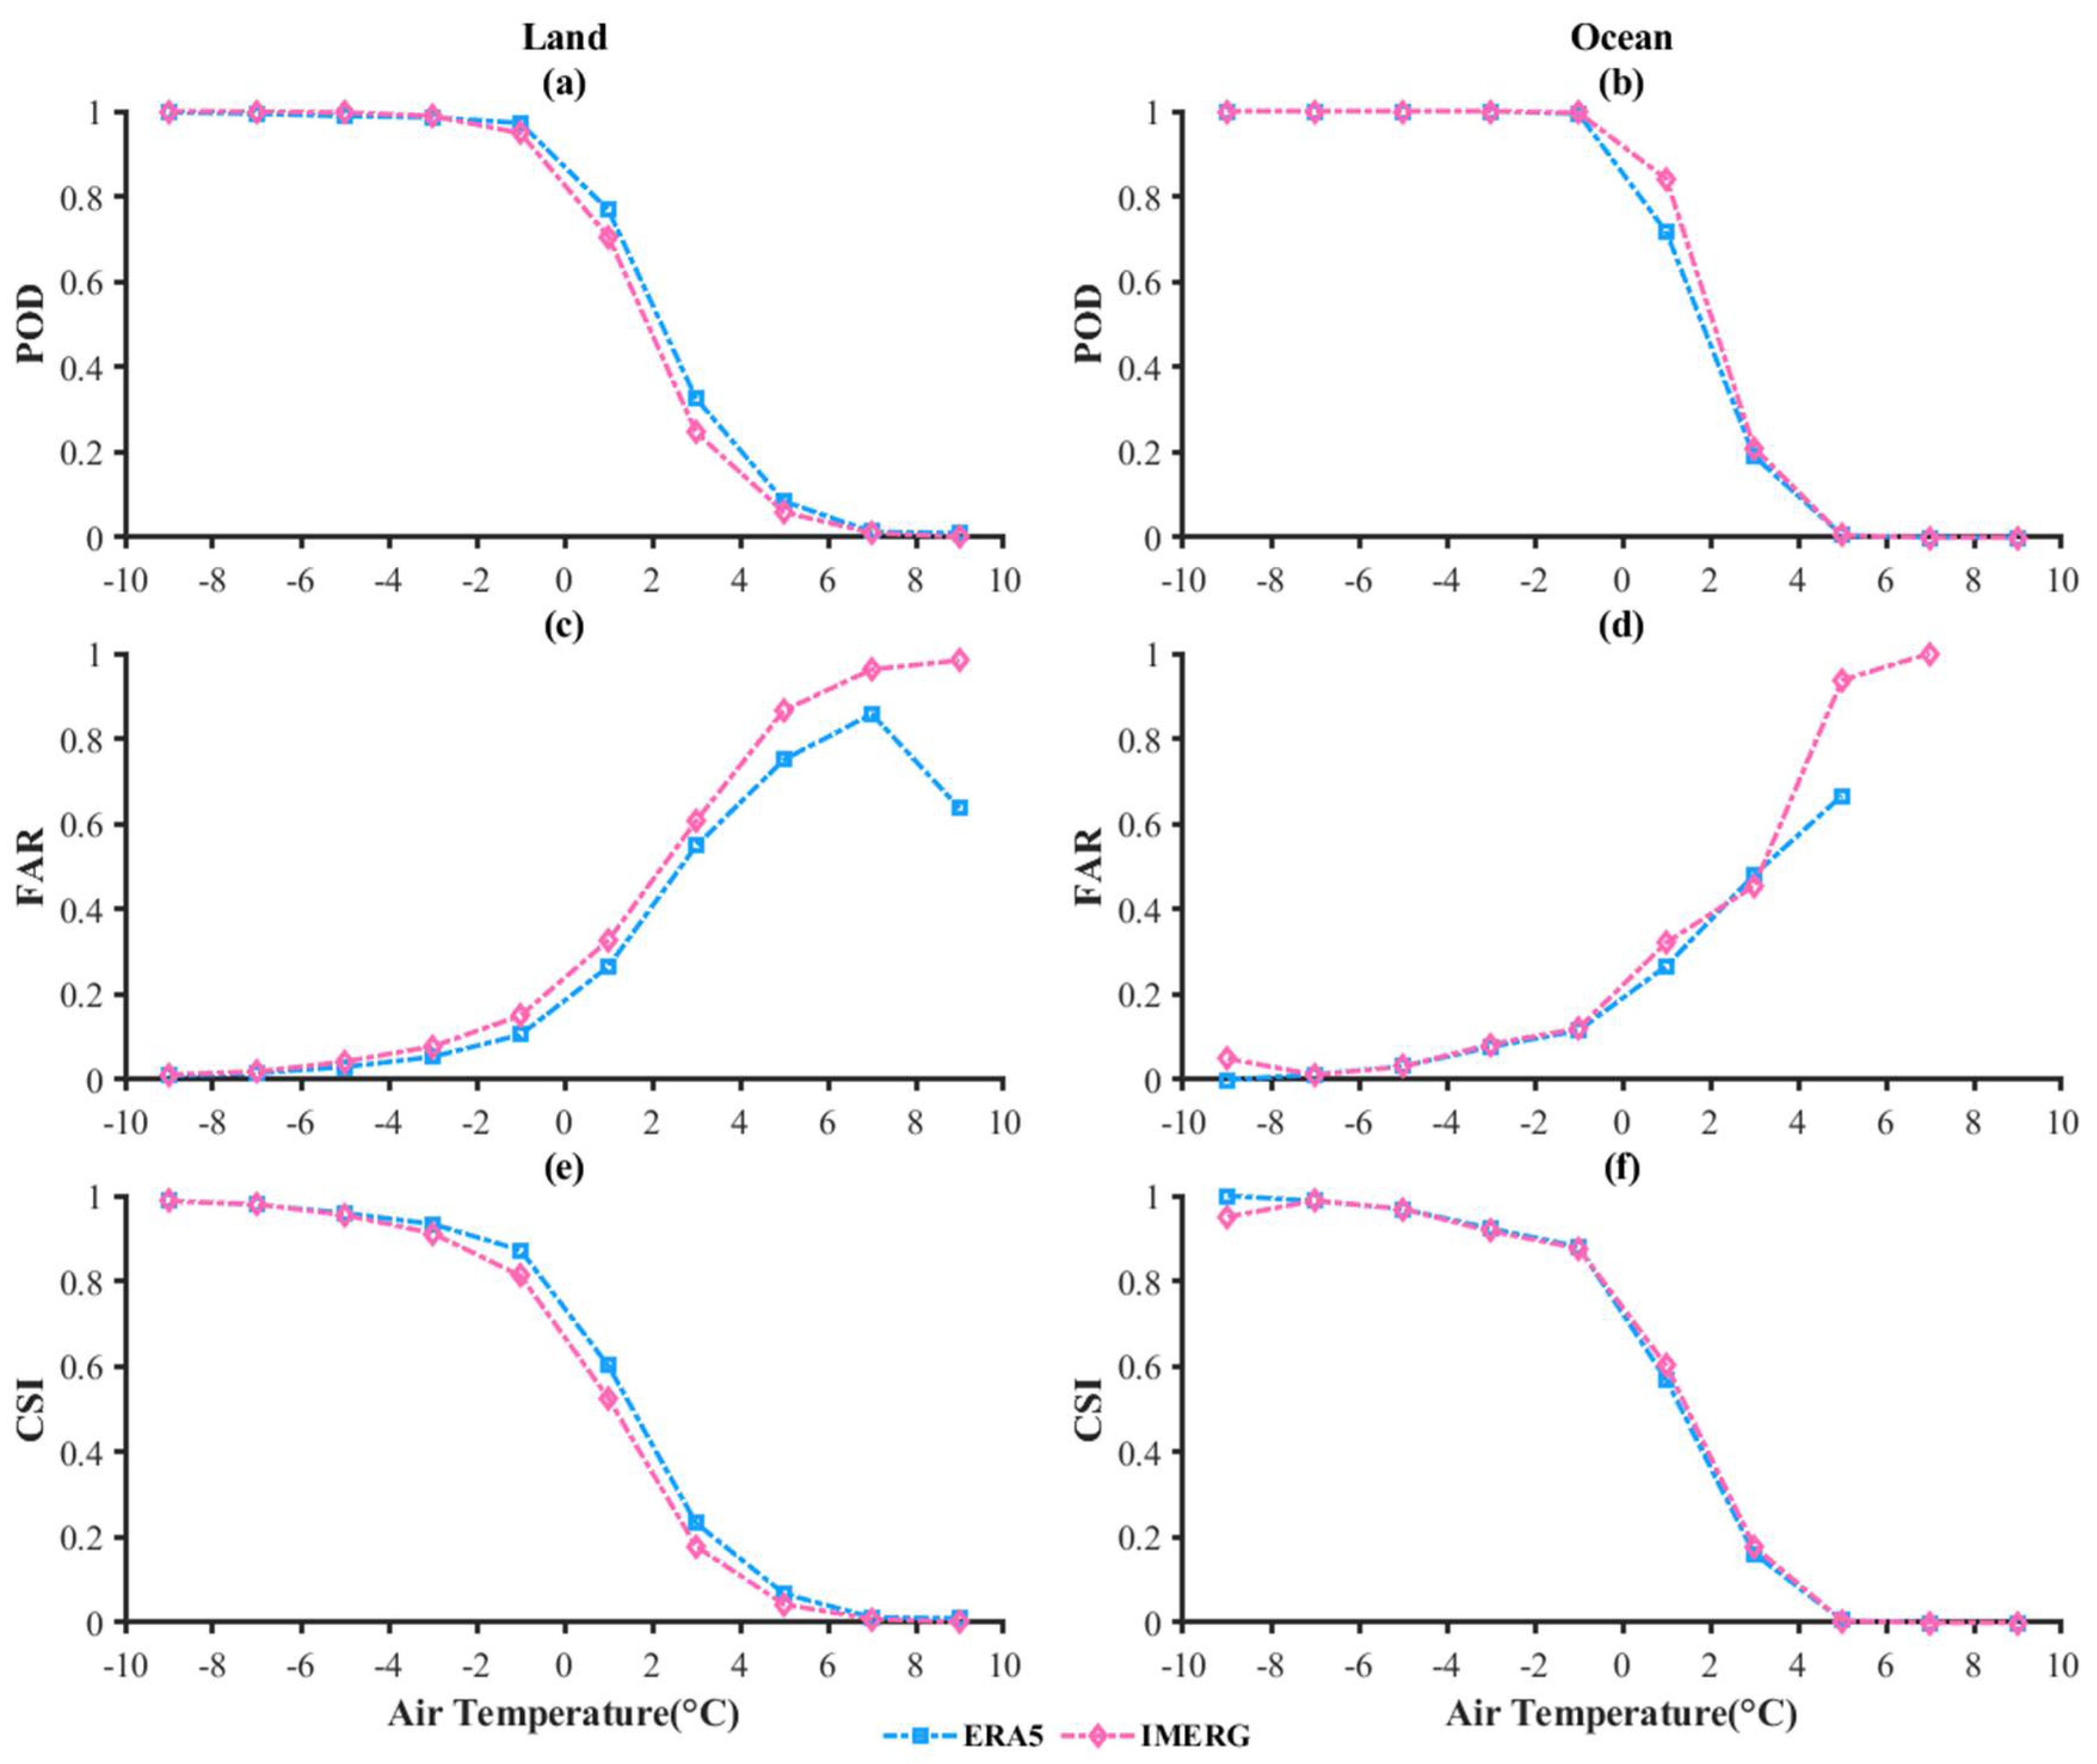
Figure 9 shows the metrics for ERA5 and IMERG products with different air temperatures over global land and oceans. According to Equations (1)–(3), a drop in the POD is caused by a decrease of (the number of snowfall events observed by both the reference NCEP ADP and the target dataset) or an increase of (snowfall events observed by the NCEP ADP but not observed by the target dataset). PODs dropped to almost zero, indicating fewer snowfall events and more rainfall events in the range of 6 to 10 °C. this was similar to the FAR and CSI. The rain–snow discrimination ability of ERA5, and IMERG decreased with the increase of air temperature, especially around 0 °C. The performance of all products decreased significantly in the range of −1 to 3 °C over land and 0 to 3 °C over ocean.
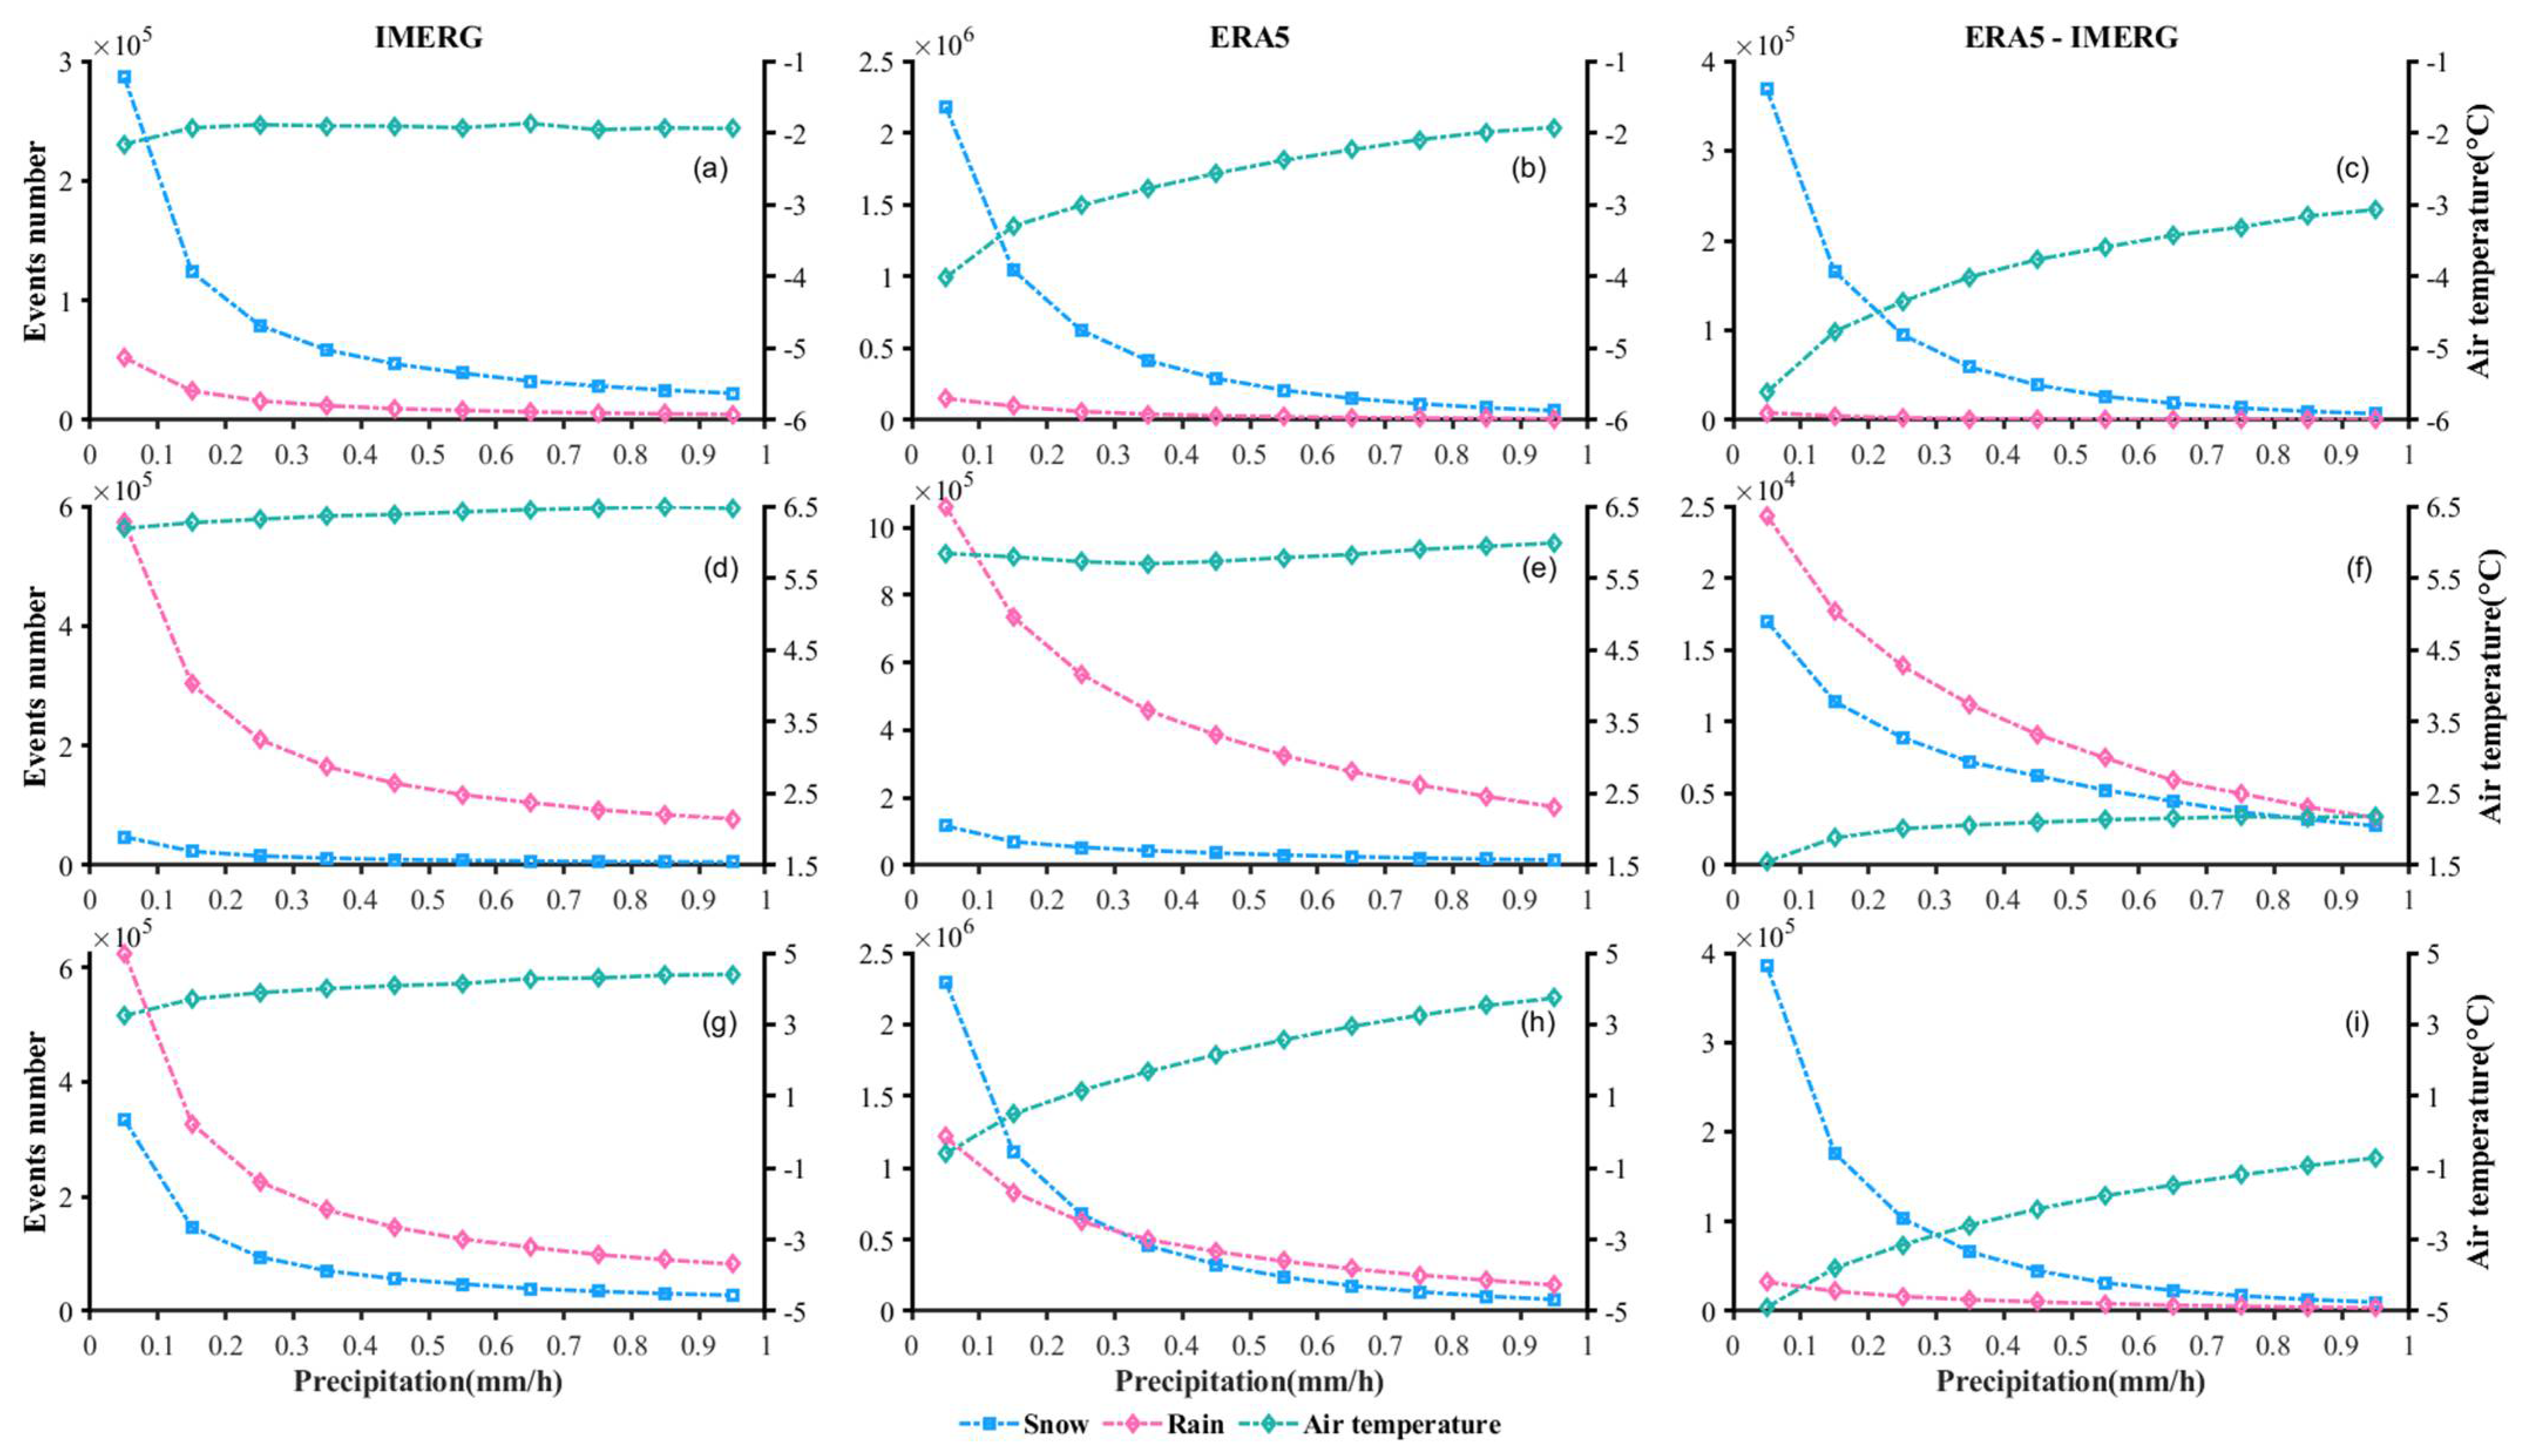
Figure 10 shows the snowfall events, rainfall events, and mean air temperature of IMERG and ERA5 products with different precipitation intensities on the global scale. The snowfall and rainfall events of IMERG and ERA5 both gradually decreased while the mean air temperature rose. ERA5 showed more non-precipitation events than IMERG, somehow indicating that the IMERG products can detect more light precipitation events. As shown in Figure 10, the IMERG and ERA5 products have similar snowfall event ratios. However, the mean temperature of ERA5 is obviously lower than IMERG precipitation intensity between 0.1–0.5 mm/h. The possible reasons for this phenomenon are: (1) the IMERG products overestimate the air temperature for light precipitation; (2) the missing lower temperature records of IMERG for light precipitation.
4. Discussion
4.1. Comparison between IMERG and ERA5
The quality of IMERG and ERA5 in rain–snow partitioning on different temporal and spatial scales was assessed in this study. According to the metrics, the IMERG and ERA5 products show basically the same performance in terms of POD, whereas the IMERG is significantly worse than the ERA5 over land and ocean for the FAR and CSI. This indicates that the IMERG tends to overestimate snowfall events when compared with the ERA5 on the whole. The likely reason for this problem is that the IMERG used a globally uniform temperature threshold to discriminate snowfall and rainfall events [31].
It was observed that the IMERG and ERA5 products both have a significantly worse performance over ocean than over land. On one hand, the lack of observation data samples from the ocean probably contributes to the poor performance of the ERA5 and IMERG, as the precipitation record number (each grid box) for the majority of ships/buoys is less than 20, especially in the SH (Figure 1). Compared with terrestrial regions, the lack of observation samples could directly lead to the decline of the POD and CSI metrics of both the ERA5 and IMERG products over the oceans. On the other hand, the phenomenon could be explained by the inability of such datasets (i.e., ERA5 and IMERG) to effectively partition precipitation phases over oceans, as compared with terrestrial regions. More specifically, the assumptions and modeling frameworks considered in these surrogates may fail in the oceanic environments.
4.2. Performance over Mountainous Areas
It is especially important to distinguish the precipitation phases accurately in mountainous areas. Previous studies [51,52,53] have shown that the special geographical and climatic conditions have an impact on the rain–snow partitioning over mountainous areas. Therefore, the interactions between precipitation intensity and precipitation phases over mountainous regions are also discussed here.
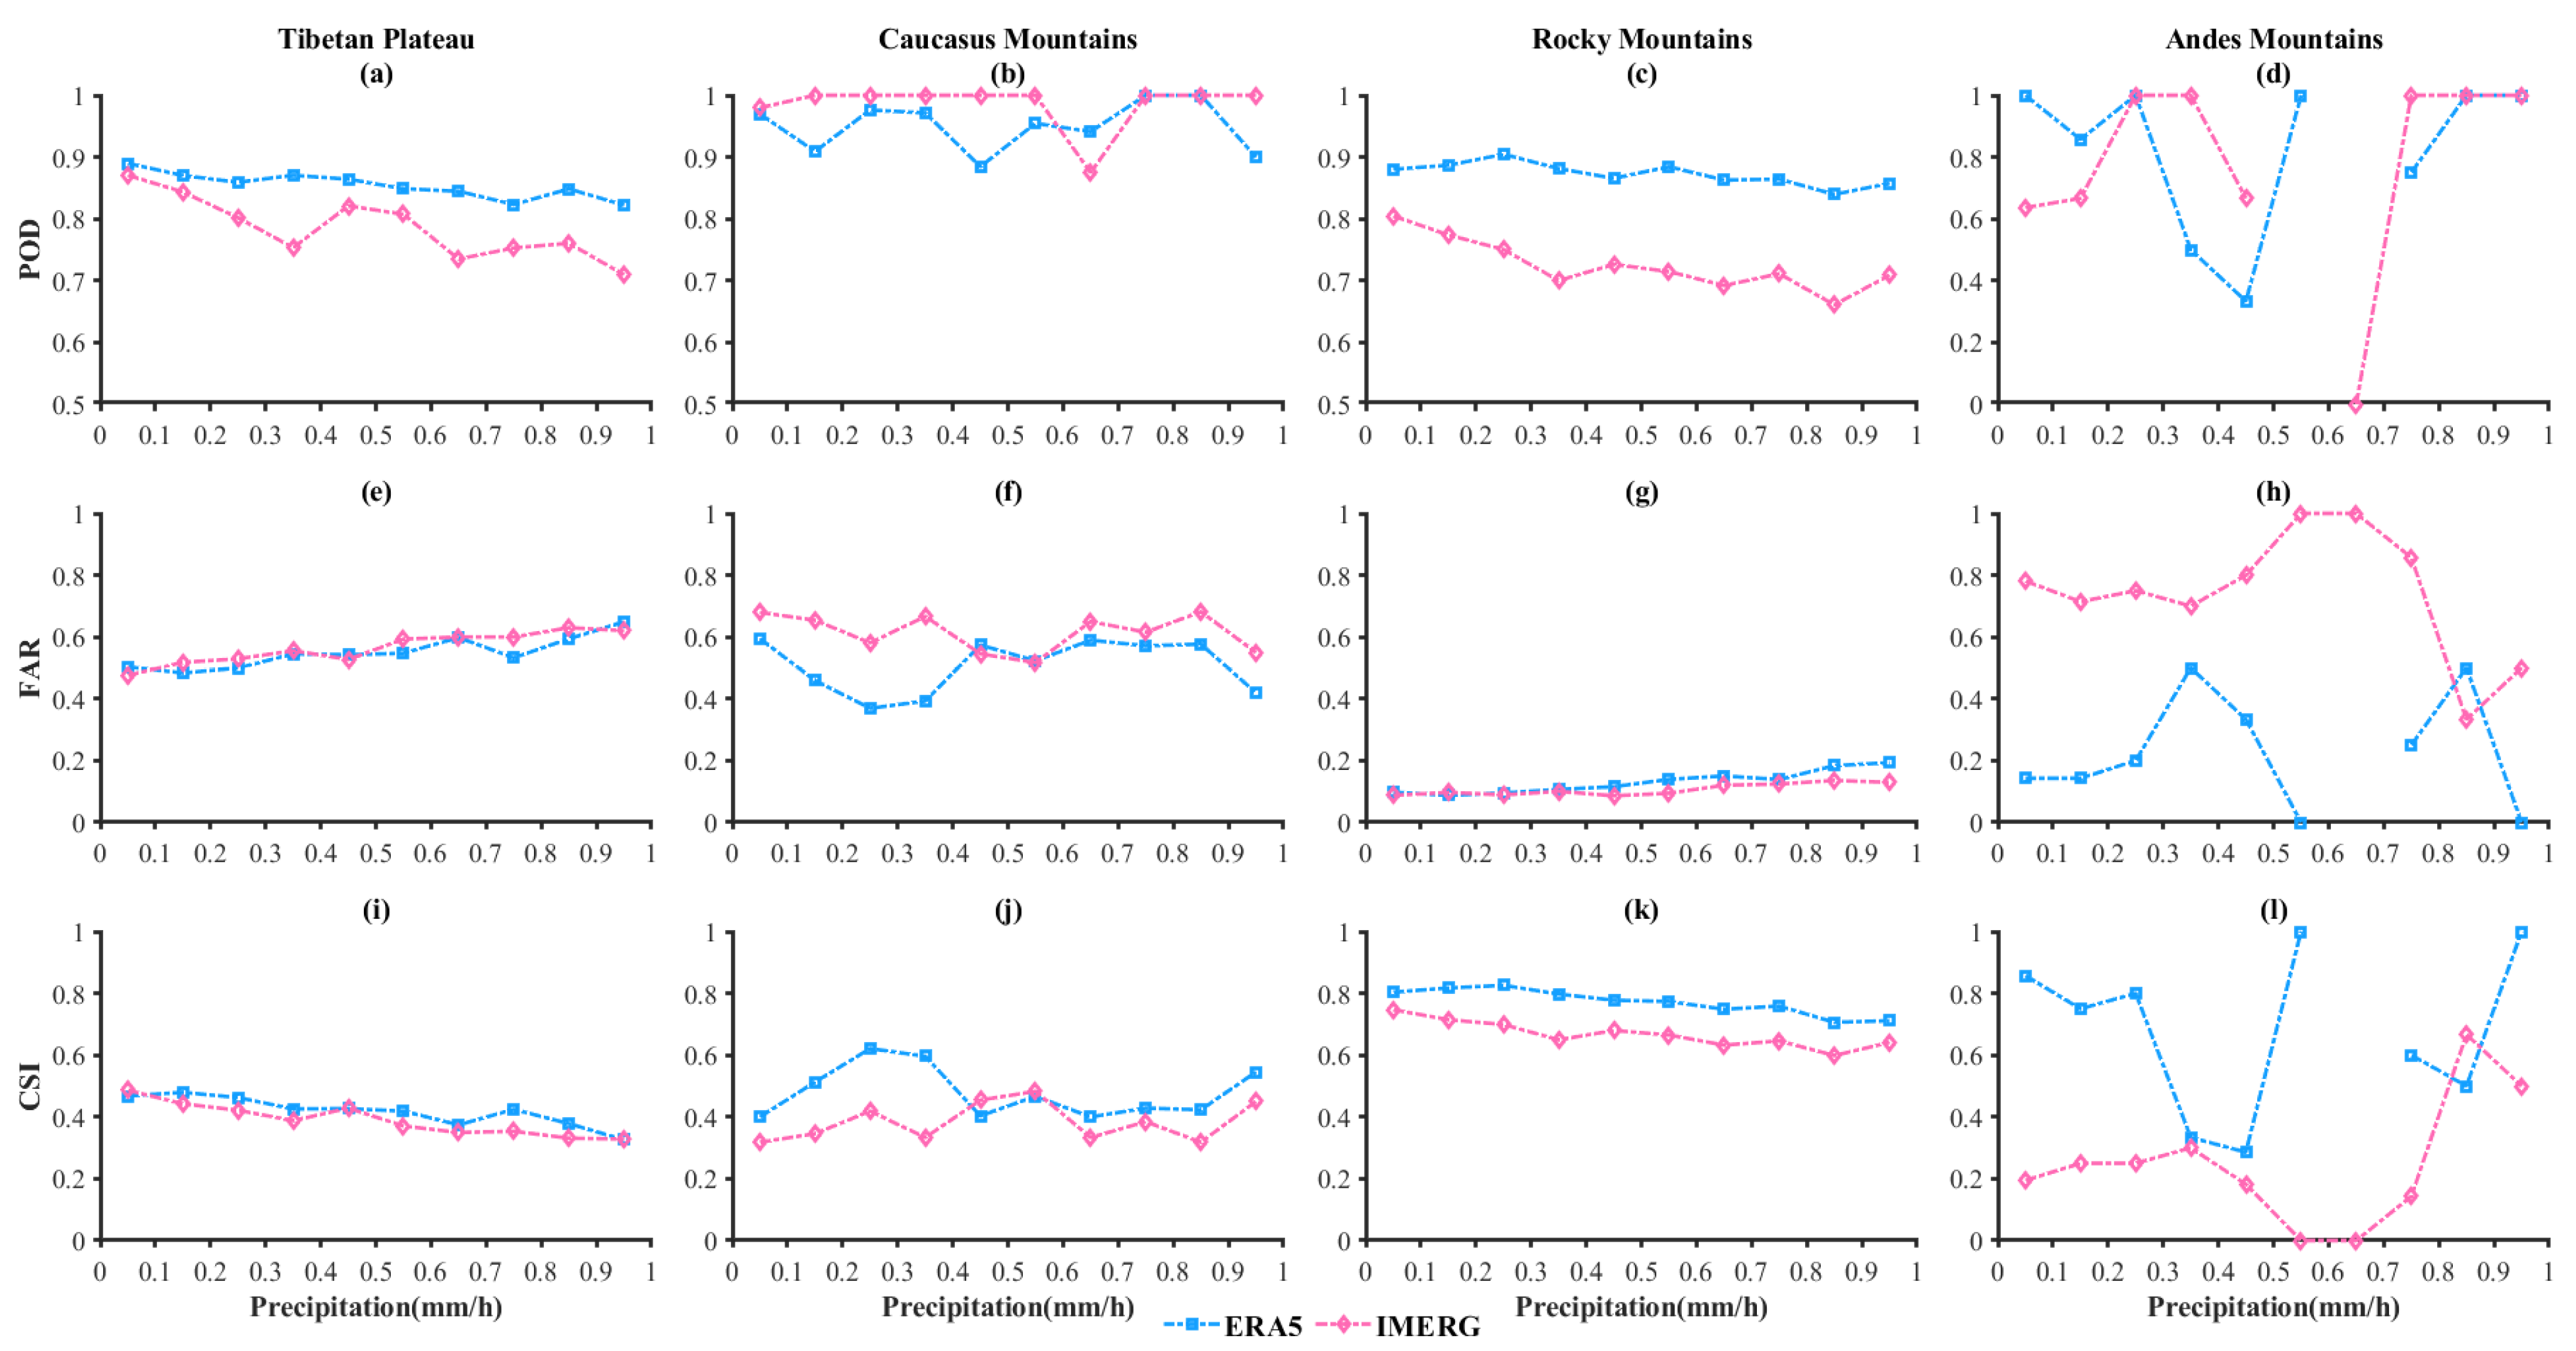
Figure 11 shows the POD, FAR, and CSI metrics for the ERA5 and IMERG products at different precipitation intensities over some important mountainous areas on the globe, i.e., the Tibetan Plateau, the Caucasus Mountains, the Rocky Mountains, and the Andes Mountains. Overall, the ability of the IMERG and ERA5 products to distinguish the phases of rainfall and snowfall events over mountains tends to weaken with the increase of precipitation intensity. This finding is consistent over global land and oceans. However, compared with Figure 8, the rain–snow partitioning performance of the IMERG and ERA5 products over mountains decreases significantly, with the FAR of both products increasing to ~0.6 and CSI decreasing to ~0.4 over the Tibetan Plateau and Caucasus Mountains. According to Equations (1)–(3), increased PODs and FARs indicate that the ERA5 and IMERG falsely classified rainfall events as snowfall events, which significantly underestimated the rainfall events in the Tibetan Plateau and Caucasus Mountain areas. The ERA5 and IMERG perform well in rain–snow partitioning over the Rocky Mountains (CSI is ~0.8 and ~0.7, respectively) and the ERA5 has a better performance than the IMERG when precipitation intensity increases. The performance of the ERA5 and IMERG products over the Andes Mountains changes dramatically with the increase of precipitation intensity. There are two possible reasons: (1) the complex terrain and warmer temperature circumstances have an impact on the rain–snow partitioning of the ERA5 and IMERG; and (2) the lack of snowfall event samples and the inability of the precipitation dataset could result in uncertainty in precipitation evaluation.
However, it is complicated and challenging to accurately distinguish precipitation phases over mountainous areas with complex terrain and variable climate conditions. Further studies are required to explore the rain–snow partitioning ability of satellite-based products and reanalysis models over the important mountainous areas of the globe.
5. Conclusions
This study evaluated the performance of the IMERG and ERA5 products in precipitation and rain–snow partitioning at the global scale, using the three-hourly and six-hourly precipitation observation data from over 14,000 gauges, from 2000 to 2007. The IMERG and ERA5 precipitation phase estimates were compared at different spatiotemporal scales to examine the capability of detecting snowfall and rainfall events. The performance of different methods was also investigated under different precipitation intensities and temperature ranges. The main conclusions are given as follows:
- (1)
- The ERA5 results show better overall performance in distinguishing rainfall and snowfall events than the IMERG. The median CSI values of the IMERG and ERA5 are 0.78, and 0.82, respectively.
- (2)
- Both the IMERG and ERA5 perform well in winter, but worse in summer. The ERA5 shows good accuracy on all continents except for South America. Both products demonstrated poor performance in South America, likely due to complex terrain and warm temperature circumstances.
- (3)
- Compared with the IMERG, the ERA5 is more sensitive to snowfall events at high latitudes but shows worse performance at mid-low latitude regions. A possible reason for this phenomenon is that due to the ERA5 having a coarser resolution (0.25 × 0.25°) and a simulation based on physical mechanisms, it is more difficult for the ERA5 than the IMERG to accurately capture the complex precipitation phase in low- and medium-dimensional regions. Moreover, the IMERG performs better than the ERA5 at middle latitude regions. Both the IMERG and ERA5 have lower accuracy in rain–snow partitioning under heavy precipitation.
The IMERG represents the temperature-threshold-based method and the ERA5 represents the atmospheric-model-based method. Therefore, this study provides a comprehensive view on the capabilities of existing methods in distinguishing rainfall and snowfall. Moreover, it is necessary to generate gauge datasets with higher quality and better spatiotemporal consistency to verify the accuracy of satellite and model datasets in distinguishing precipitation phases.
Author Contributions
All authors contributed to the work presented in this paper. W.X. and G.T. developed the concept and methodology; W.X. performed precipitation phase evaluation and wrote the initial paper; W.X. contributed to the subject of research and the NCEP ADP data; G.T. contributed to the analysis of the study data and the optimization of the figures; G.T. and T.W. improved the content and structure of the final paper; Z.M. and W.W. contributed to the writing of the paper. All authors have read and agreed to the published version of the manuscript.
Funding
This research was supported by the Key Research and Development Program of the Ministry of Science and Technology (grant number 2018YFC1506500) and the Undergraduate Teaching Reform Program of Peking University (grant number 2020JG7100901184).
Institutional Review Board Statement
Not applicable.
Informed Consent Statement
Not applicable.
Data Availability Statement
The NCEP ADP data can be download from http://rda.ucar.edu/datasets/ds464.0/ (accessed on 1 March 2021). The IMERG data can be download from the PMM website (http://pmm.nasa.gov/data-access/downloads/gpm accessed on 1 March 2021). The ERA5 data can be download from the Climate Data Store website (https://cds.climate.copernicus.eu/cdsapp#!/dataset/reanalysis-era5-single-levels?tab=form accessed on 1 March 2021).
Conflicts of Interest
The authors declare no conflict of interest.
References
- Harpold, A.A.; Kaplan, M.L.; Klos, P.Z.; Link, T.; McNamara, J.P.; Rajagopal, S.; Schumer, R.; Steele, C.M. Rain or snow: Hydrologic processes, observations, prediction, and research needs. Hydrol. Earth Syst. Sci. 2017, 21, 1–22. [Google Scholar] [CrossRef] [Green Version]
- Jennings, K.S.; Winchell, T.S.; Livneh, B.; Molotch, N.P. Spatial variation of the rain–snow temperature threshold across the Northern Hemisphere. Nat. Commun. 2018, 9, 1148. [Google Scholar] [CrossRef] [PubMed] [Green Version]
- Dai, A. Temperature and pressure dependence of the rain-snow phase transition over land and ocean. Geophys. Res. Lett. 2008, 35, L12802. [Google Scholar] [CrossRef]
- Lynn, E.; Cuthbertson, A.; He, M.; Vasquez, J.P.; Anderson, M.L.; Coombe, P.; Abatzoglou, J.T.; Hatchett, B.J. Technical note: Precipitation-phase partitioning at landscape scales to regional scales. Hydrol. Earth Syst. Sci. 2020, 24, 5317–5328. [Google Scholar] [CrossRef]
- McCabe, G.J.; Wolock, D.M. Long-term variability in Northern Hemisphere snow cover and associations with warmer winters. Clim. Chang. 2009, 99, 141–153. [Google Scholar] [CrossRef]
- Sun, F.; Chen, Y.; Li, Y.; Li, Z.; Duan, W.; Zhang, Q.; Chuan, W. Incorporating relative humidity improves the accuracy of precipitation phase discrimination in High Mountain Asia. Atmos. Res. 2022, 271, 106094. [Google Scholar] [CrossRef]
- Shi, S.; Liu, G. The latitudinal dependence in the trend of snow event to precipitation event ratio. Sci. Rep. 2021, 11, 18112. [Google Scholar] [CrossRef]
- Ding, M.; Yang, D.; Broeke, M.V.D.; Allison, I.; Xiao, C.; Qin, D.; Huai, B. The Surface Energy Balance at Panda 1 Station, Princess Elizabeth Land: A Typical Katabatic Wind Region in East Antarctica. J. Geophys. Res. Atmos. 2019, 125, 1–19. [Google Scholar] [CrossRef]
- You, Q.; Wu, T.; Shen, L.; Pepin, N.; Zhang, L.; Jiang, Z.; Wu, Z.; Kang, S.; AghaKouchak, A. Review of snow cover variation over the Tibetan Plateau and its influence on the broad climate system. Earth-Sci. Rev. 2020, 201, 103043. [Google Scholar] [CrossRef]
- Tang, G.; Long, D.; Behrangi, A.; Wang, C.; Hong, Y. Exploring Deep Neural Networks to Retrieve Rain and Snow in High Latitudes Using Multisensor and Reanalysis Data. Water Resour. Res. 2018, 54, 8253–8278. [Google Scholar] [CrossRef] [Green Version]
- Harpold, A.A.; Rajagopal, S.; Crews, J.B.; Winchell, T.; Schumer, R. Relative Humidity Has Uneven Effects on Shifts from Snow to Rain Over the Western U.S. Geophys. Res. Lett. 2017, 44, 9742–9750. [Google Scholar] [CrossRef]
- Kienzle, S.W. A new temperature based method to separate rain and snow. Hydrol. Process. 2008, 22, 5067–5085. [Google Scholar] [CrossRef]
- Ye, H.; Cohen, J.; Rawlins, M. Discrimination of Solid from Liquid Precipitation over Northern Eurasia Using Surface Atmospheric Conditions. J. Hydrometeorol. 2013, 14, 1345–1355. [Google Scholar] [CrossRef] [Green Version]
- Ding, B.; Yang, K.; Qin, J.; Wang, L.; Chen, Y.; He, X. The dependence of precipitation types on surface elevation and meteorological conditions and its parameterization. J. Hydrol. 2014, 513, 154–163. [Google Scholar] [CrossRef]
- Sims, E.M.; Liu, G. A Parameterization of the Probability of Snow–Rain Transition. J. Hydrometeorol. 2015, 16, 1466–1477. [Google Scholar] [CrossRef]
- Wayand, N.E.; Clark, M.P.; Lundquist, J.D. Diagnosing snow accumulation errors in a rain-snow transitional environment with snow board observations. Hydrol. Process. 2016, 31, 349–363. [Google Scholar] [CrossRef]
- Rajagopal, S.; Harpold, A. Testing and Improving Temperature Thresholds for Snow and Rain Prediction in the Western United States. JAWRA J. Am. Water Resour. Assoc. 2016, 52, 1142–1154. [Google Scholar] [CrossRef]
- Tamang, S.; Ebtehaj, A.M.; Prein, A.F.; Heymsfield, A.J. Linking Global Changes of Snowfall and Wet-Bulb Temperature. J. Clim. 2019, 33, 39–59. [Google Scholar] [CrossRef]
- Behrangi, A.; Yin, X.; Rajagopal, S.; Stampoulis, D.; Ye, H. On distinguishing snowfall from rainfall using near-surface atmospheric information: Comparative analysis, uncertainties and hydrologic importance. Q. J. R. Meteorol. Soc. 2018, 144, 89–102. [Google Scholar] [CrossRef] [Green Version]
- Beck, H.E.; Pan, M.; Roy, T.; Weedon, G.P.; Pappenberger, F.; van Dijk, A.I.J.M.; Huffman, G.J.; Adler, R.F.; Wood, E.F. Daily evaluation of 26 precipitation datasets using Stage-IV gauge-radar data for the CONUS. Hydrol. Earth Syst. Sci. 2019, 23, 207–224. [Google Scholar] [CrossRef] [Green Version]
- Tang, G.; Clark, M.P.; Papalexiou, S.M. SC-Earth: A Station-Based Serially Complete Earth Dataset from 1950 to 2019. J. Clim. 2021, 34, 6493–6511. [Google Scholar] [CrossRef]
- Zhang, L.; Li, X.; Zheng, D.; Zhang, K.; Ma, Q.; Zhao, Y.; Ge, Y. Merging multiple satellite-based precipitation products and gauge observations using a novel double machine learning approach. J. Hydrol. 2021, 594, 125969. [Google Scholar] [CrossRef]
- Levizzani, V.; Laviola, S.; Cattani, E. Detection and Measurement of Snowfall from Space. Remote Sens. 2011, 3, 145–166. [Google Scholar] [CrossRef] [Green Version]
- Tang, G.; Wen, Y.; Gao, J.; Long, D.; Ma, Y.; Wan, W.; Hong, Y. Similarities and differences between three coexisting spaceborne radars in global rainfall and snowfall estimation. Water Resour. Res. 2017, 53, 3835–3853. [Google Scholar] [CrossRef]
- Behrangi, A.; Andreadis, K.; Fisher, J.; Turk, F.J.; Granger, S.; Painter, T.; Das, N. Satellite-Based Precipitation Estimation and Its Application for Streamflow Prediction over Mountainous Western U.S. Basins. J. Appl. Meteorol. Clim. 2014, 53, 2823–2842. [Google Scholar] [CrossRef] [Green Version]
- Behrangi, A.; Guan, B.; Neiman, P.J.; Schreier, M.; Lambrigtsen, B. On the Quantification of Atmospheric Rivers Precipitation from Space: Composite Assessments and Case Studies over the Eastern North Pacific Ocean and the Western United States. J. Hydrometeorol. 2015, 17, 369–382. [Google Scholar] [CrossRef]
- Harpold, A.; Brooks, P.; Rajagopal, S.; Heidbüchel, I.; Jardine, A.; Stielstra, C. Changes in snowpack accumulation and ablation in the intermountain west. Water Resour. Res. 2012, 48, W11501. [Google Scholar] [CrossRef] [Green Version]
- Skofronick-Jackson, G.; Hudak, D.; Petersen, W.; Nesbitt, S.W.; Chandrasekar, V.; Durden, S.; Gleicher, K.J.; Huang, G.-J.; Joe, P.; Kolliaset, P.; et al. Global precipitation measurement cold season precipitation experiment (GCPEX): For measurement’s sake, let it snow. Bull. Am. Meteorol. Soc. 2015, 96, 1719–1741. [Google Scholar] [CrossRef]
- Hou, A.Y.; Kakar, R.K.; Neeck, S.; Azarbarzin, A.A.; Kummerow, C.D.; Kojima, M.; Oki, R.; Nakamura, K.; Iguchi, T. The global precipitation measurement mission. Bull. Am. Meteorol. Soc. 2014, 95, 701–722. [Google Scholar] [CrossRef]
- Kirschbaum, D.B.; Huffman, G.; Adler, R.F.; Braun, S.; Garrett, K.; Jones, E.; McNally, A.; Skofronick-Jackson, G.; Stocker, E.; Wu, H.; et al. NASA’s Remotely Sensed Precipitation: A Reservoir for Applications Users. Bull. Am. Meteorol. Soc. 2017, 98, 1169–1184. [Google Scholar] [CrossRef]
- Huffman, G.J.; Stocker, E.F.; Bolvin, D.T.; Nelkin, E.J.; Tan, J. IMERG Final Precipitation L3 Half Hourly 0.1 Degree × 0.1 Degree V06, Greenbelt, MD, Goddard Earth Sciences Data and Information Services Center (GES DISC). Available online: https://storm.pps.eosdis.nasa.gov/storm/ (accessed on 25 March 2021).
- Bengtsson, L.; Hagemann, S.; Hodges, K.I. Can climate trends be calculated from reanalysis data? J. Geophys. Res. Earth Surf. 2004, 109, D11111. [Google Scholar] [CrossRef] [Green Version]
- Tarek, M.; Brissette, F.P.; Arsenault, R. Evaluation of the ERA5 reanalysis as a potential reference dataset for hydrological modelling over North America. Hydrol. Earth Syst. Sci. 2020, 24, 2527–2544. [Google Scholar] [CrossRef]
- Huang, D.-Q.; Zhu, J.; Zhang, Y.-C.; Huang, Y.; Kuang, X.-Y. Assessment of summer monsoon precipitation derived from five reanalysis datasets over East Asia. Q. J. R. Meteorol. Soc. 2015, 142, 108–119. [Google Scholar] [CrossRef]
- Lin, R.; Zhou, T.; Qian, Y. Evaluation of Global Monsoon Precipitation Changes based on Five Reanalysis Datasets. J. Clim. 2014, 27, 1271–1289. [Google Scholar] [CrossRef]
- Tang, G.; Clark, M.P.; Papalexiou, S.M.; Newman, A.J.; Wood, A.W.; Brunet, D.; Whitfield, P.H. EMDNA: An Ensemble Meteorological Dataset for North America. Earth Syst. Sci. Data 2021, 13, 3337–3362. [Google Scholar] [CrossRef]
- Tang, G.; Clark, M.P.; Papalexiou, S.M. EM-Earth: The Ensemble Meteorological Dataset for Planet Earth. Bull. Am. Meteorol. Soc. 2022; published online ahead of print. [Google Scholar] [CrossRef]
- Hersbach, H.; Bell, B.; Berrisford, P.; Hirahara, S.; Horanyi, A.; Muñoz-Sabater, J.; Nicolas, J.; Peubey, C.; Radu, R.; Schepers, D.; et al. The ERA5 global reanalysis. Q. J. R. Meteorol. Soc. 2020, 146, 1999–2049. [Google Scholar] [CrossRef]
- Karl, H.; Michela, G. What is ERA5. 2019. Available online: https://confluence.ecmwf.int/display/CKB/What+is+ERA5 (accessed on 11 February 2020).
- Liu, Y.; Li, F.; Hao, W.; Barriot, J.-P.; Wang, Y. Evaluation of Synoptic Snowfall on the Antarctic Ice Sheet Based on CloudSat, In-Situ Observations and Atmospheric Reanalysis Datasets. Remote Sens. 2019, 11, 1686. [Google Scholar] [CrossRef] [Green Version]
- Nouri, M.; Homaee, M. Spatiotemporal changes of snow metrics in mountainous data-scarce areas using reanalyses. J. Hydrol. 2021, 603, 126858. [Google Scholar] [CrossRef]
- Amjad, M.; Yilmaz, M.T.; Yucel, I.; Yilmaz, K.K. Performance evaluation of satellite- and model-based precipitation products over varying climate and complex topography. J. Hydrol. 2020, 584, 124707. [Google Scholar] [CrossRef]
- Beck, H.E.; Wood, E.F.; Pan, M.; Fisher, C.K.; Miralles, D.G.; van Dijk, A.I.J.M.; McVicar, T.R.; Adler, R.F. MSWEP V2 Global 3-Hourly 0.1° Precipitation: Methodology and Quantitative Assessment. Bull. Am. Meteorol. Soc. 2019, 100, 473–500. [Google Scholar] [CrossRef] [Green Version]
- Roussel, M.-L.; Lemonnier, F.; Genthon, C.; Krinner, G. Brief communication: Evaluating Antarctic precipitation in ERA5 and CMIP6 against CloudSat observations. Cryosphere 2020, 14, 2715–2727. [Google Scholar] [CrossRef]
- National Centers for Environmental Prediction/National Weather Service/NOAA/U.S. Department of Commerce (1980): NCEP ADP Operational Global Surface Observations, February 1975–February 2007. Research Data Archive at the National Center for Atmospheric Research, Computational and Information Systems Laboratory. Available online: https://rda.ucar.edu/datasets/ds464.0/ (accessed on 1 March 2021).
- Lyu, F.; Tang, G.; Behrangi, A.; Wang, T.; Tan, X.; Ma, Z.; Xiong, W. Precipitation Merging Based on the Triple Collocation Method Across Mainland China. IEEE Trans. Geosci. Remote Sens. 2020, 59, 3161–3176. [Google Scholar] [CrossRef]
- Jiang, Q.; Li, W.; Fan, Z.; He, X.; Sun, W.; Chen, S.; Wen, J.; Gao, J.; Wang, J. Evaluation of the ERA5 reanalysis precipitation dataset over Chinese Mainland. J. Hydrol. 2020, 595, 125660. [Google Scholar] [CrossRef]
- Tang, G.; Ma, Y.; Long, D.; Zhong, L.; Hong, Y. Evaluation of GPM Day-1 IMERG and TMPA Version-7 legacy products over Mainland China at multiple spatiotemporal scales. J. Hydrol. 2016, 533, 152–167. [Google Scholar] [CrossRef]
- Kubecka, P. A possible world record maximum natural ground surface temperature. Weather 2001, 56, 218–221. [Google Scholar] [CrossRef]
- Gleason, B. Global Daily Climatology Network, V1.0, Natl. Clim. Data Cent., Asheville, N.C. 2002. Available online: https://citeseerx.ist.psu.edu/viewdoc/download?doi=10.1.1.195.9580&rep=rep1&type=pdf (accessed on 1 March 2021).
- Orsolini, Y.; Wegmann, M.; Dutra, E.; Liu, B.; Balsamo, G.; Yang, K.; de Rosnay, P.; Zhu, C.; Wang, W.; Senan, R.; et al. Evaluation of snow depth and snow cover over the Tibetan Plateau in global reanalyses using in situ and satellite remote sensing observations. Cryosphere 2019, 13, 2221–2239. [Google Scholar] [CrossRef] [Green Version]
- Norris, J.; Carvalho, L.M.V.; Jones, C.; Cannon, F. Warming and drying over the central Himalaya caused by an amplification of local mountain circulation. Npj Clim. Atmos. Sci. 2020, 3, 1. [Google Scholar] [CrossRef] [Green Version]
- Casellas, E.; Bech, J.; Veciana, R.; Pineda, N.; Rigo, T.; Miró, J.R.; Sairouni, A. Surface precipitation phase discrimination in complex terrain. J. Hydrol. 2020, 592, 125780. [Google Scholar] [CrossRef]
Figure 1.
The spatial distribution of NCEP ADP precipitation samples at 1° × 1° resolution from 1978 to 2007. For each grid box, the value represents the total number of positive precipitation events from land stations or ocean ships/buoys. Only samples after quality control (refer to Section 2.4) are used.

Figure 2.
Boxplots of POD, FAR, and CSI metrics for ERA5 and IMERG (2000–2007) over land and ocean. (a) POD. (b) FAR. (c) CSI.
Figure 2.
Boxplots of POD, FAR, and CSI metrics for ERA5 and IMERG (2000–2007) over land and ocean. (a) POD. (b) FAR. (c) CSI.

Figure 3.
Spatial distributions of POD, FAR, and CSI metrics for IMERG and ERA5. The subplots (a,c,e) refer to the POD, FAR, and CSI metrics for IMERG. The subplots (b,d,f) refer to the POD, FAR, and CSI metrics for ERA5.
Figure 3.
Spatial distributions of POD, FAR, and CSI metrics for IMERG and ERA5. The subplots (a,c,e) refer to the POD, FAR, and CSI metrics for IMERG. The subplots (b,d,f) refer to the POD, FAR, and CSI metrics for ERA5.

Figure 4.
Boxplots of metrics for ERA5 and IMERG (2000–2007) over NH land, NH ocean, SH land and SH ocean, separately. The subplots (a,c,e) refer to the POD, FAR, and CSI metrics for IMERG from January to December. The subplots (b,d,f) refer to the POD, FAR, and CSI metrics for ERA5 from January to December.

Figure 5.
Plots of mean snowfall ratio and CSI of ERA5 and IMERG products during different months. The subplots (a,c) refer to the CSI metric for IMERG over NH land and NH ocean. The subplots (b,d) refer to the CSI metric for ERA5 over SH land and SH ocean.
Figure 5.
Plots of mean snowfall ratio and CSI of ERA5 and IMERG products during different months. The subplots (a,c) refer to the CSI metric for IMERG over NH land and NH ocean. The subplots (b,d) refer to the CSI metric for ERA5 over SH land and SH ocean.

Figure 6.
Boxplots of POD, FAR, and CSI metrics of main global areas for ERA5 and IMERG products. (a) POD. (b) FAR. (c) CSI.
Figure 6.
Boxplots of POD, FAR, and CSI metrics of main global areas for ERA5 and IMERG products. (a) POD. (b) FAR. (c) CSI.

Figure 7.
Snowfall ratio under different air temperature of NCEP ADP (a,d,g,j), IMERG (b,e,h,k), and ERA5 (c,f,i,l). The air temperature range (−89.4~93.9 °C) of NCEP ADP refers to Kubecka [49] and Gleason [50].

Figure 8.
The POD, FAR, and CSI metrics for ERA5 and IMERG products for different precipitation intensities (mm/h) over global land and ocean. The subplots (a,c,e) refer to land, and the subplots (b,d,f) refer to ocean.
Figure 8.
The POD, FAR, and CSI metrics for ERA5 and IMERG products for different precipitation intensities (mm/h) over global land and ocean. The subplots (a,c,e) refer to land, and the subplots (b,d,f) refer to ocean.

Figure 9.
The POD, FAR, and CSI metrics for ERA5 and IMERG products at different air temperatures over global land and ocean. The subplots (a,c,e) refer to land, and the subplots (b,d,f) refer to ocean.
Figure 9.
The POD, FAR, and CSI metrics for ERA5 and IMERG products at different air temperatures over global land and ocean. The subplots (a,c,e) refer to land, and the subplots (b,d,f) refer to ocean.

Figure 10.
The snowfall events, rainfall events, and mean air temperature of IMERG and ERA5 products with different precipitation intensities on the global scale (including NH and SH land and oceans). Panels (a–c) are snowfall events only; (d–f) are rainfall events only; and (g–i) are snowfall and rainfall events.

Figure 11.
The POD, FAR, and CSI metrics for ERA5 and IMERG products with different precipitation intensities (mm/h) over four mountainous regions. The panels (a,e,i) are the Tibetan Plateau (75–105° E, 25–40° N); the panels (b,f,j) are the Caucasus Mountains (40–47° E, 41–43° N); the panels (c,g,k) are the Rocky Mountains (32–63° N, 105–125° N); and the panels (d,h,l) are the southern Andes Mountains (68–76° W, 24–55° S).

Publisher’s Note: MDPI stays neutral with regard to jurisdictional claims in published maps and institutional affiliations. |
© 2022 by the authors. Licensee MDPI, Basel, Switzerland. This article is an open access article distributed under the terms and conditions of the Creative Commons Attribution (CC BY) license (https://creativecommons.org/licenses/by/4.0/).
Share and Cite
MDPI and ACS Style
Xiong, W.; Tang, G.; Wang, T.; Ma, Z.; Wan, W. Evaluation of IMERG and ERA5 Precipitation-Phase Partitioning on the Global Scale. Water 2022, 14, 1122. https://doi.org/10.3390/w14071122
AMA Style
Xiong W, Tang G, Wang T, Ma Z, Wan W. Evaluation of IMERG and ERA5 Precipitation-Phase Partitioning on the Global Scale. Water. 2022; 14(7):1122. https://doi.org/10.3390/w14071122
Chicago/Turabian StyleXiong, Wentao, Guoqiang Tang, Tsechun Wang, Ziqiang Ma, and Wei Wan. 2022. "Evaluation of IMERG and ERA5 Precipitation-Phase Partitioning on the Global Scale" Water 14, no. 7: 1122. https://doi.org/10.3390/w14071122
Note that from the first issue of 2016, this journal uses article numbers instead of page numbers. See further details here.