
Study on the Matching Method of Agricultural Water and Land Resources from the Perspective of Total Water Footprint

1
School of Forestry, Northeast Forestry University, Harbin 150040, China
2
School of Water Conservancy & Civil Engineering, Northeast Agricultural University, Harbin 150030, China
*
Author to whom correspondence should be addressed.
Water 2022, 14(7), 1120; https://doi.org/10.3390/w14071120
Submission received: 23 February 2022
/
Revised: 26 March 2022
/
Accepted: 29 March 2022
/
Published: 31 March 2022
(This article belongs to the Special Issue Water and Soil Resources Management in Agricultural Areas)
Abstract
:The matching status of agricultural water and land resources is a prerequisite for grain production. The influence of gray water footprint has not been paid attention to in the study of agricultural water and land resources matching based on water footprint. To measure the matching status of agricultural water and land resources more comprehensively, the total water footprint (including blue, green and gray water footprint) and the cultivated land area was taken as the characterization parameters of water and land resources, respectively. The Gini coefficient model, and the agricultural water and land resources matching coefficient model were constructed to calculate the matching degree of agricultural water and land resources in a cold region (Heilongjiang Province) of China. Based on the amount of agricultural water consumption, the equivalent coefficient model was used to evaluate the degree of agricultural water and land resources shortage or to be developed. The result of agricultural water and land resources matching coefficient model showed that the matching degree of agricultural water and land resources in Heilongjiang Province is getting better year by year, which is consistent with the calculations determined from the Gini coefficient. The result of the equivalent coefficient method based on agricultural water consumption was consistent with the result of the Gini coefficient method based on total water footprint, which is verified that it is scientific and reasonable to take the total water footprint as the characterization parameter of water resource. The findings may provide implications for the spatial optimal allocation of regional agricultural water and land resources.
1. Introduction
Agricultural water and land resources are important agricultural production resources. The quantity and utilization of water resources directly affect the production capacity of cultivated land resources, and the reclamation degree of cultivated land resources also restricts the development and utilization of water resources [1,2]. Therefore, the matching degree of agricultural water and land resources is related to the level of regional agricultural development [3]. Northeast black soil area in China is one of the three black soil zones in the world. Heilongjiang Province has nearly 12.08 million hm2 of black soil farmland, accounting for about 44% of the total area of northeast black soil area [4]. Due to excessive reclamation and predatory management, as well as unreasonable farming and fertilization, farmland soil has been degraded year by year, the black soil layer has become thinner and soil quality has decreased, which seriously restricts the food production. Therefore, analyzing the temporal and spatial matching degree of agricultural water and land resources in Heilongjiang Province has scientific guiding significance for the rational development and utilization of water resources and cultivated land resources, and it is also the foundation of the spatial optimal allocation of water and land resources.
At present, water and land resources matching is mainly estimated by the Gini coefficient method [5] and the amount of water resources per unit area of cultivated land [6,7]. Although the matching of water and land resources can be studied from the overall macro scale, the effects of climate and regional planting structure changes on the utilization of water and land resources are not fully considered, so it is difficult to reflect the temporal and spatial changes of the potential of regional agricultural water and land resources. Hoekstra put forward the concept of water footprint, which is used to measure the total amount of water needed for product production in a country or region in a certain period of time, and total water footprint is the sum of the blue water, green water and gray water footprints [8]. The gray water footprint refers to the amount of water resources diluted by pollutants in the process of crop growth. Studies show that about 90% of the water footprint of human consumption comes from agricultural products [9]. Agricultural pollution has replaced industrial pollution as the largest source of pollution in China. China’s agricultural water consumption has long accounted for more than 1/2 of the country’s total water supply, and agricultural pollution has aggravated China’s water pollution [10]. Heilongjiang Province, as the main grain producing area in China, accounts for 89% of agricultural water consumption, and the heavy use of chemical fertilizers and pesticides has polluted agricultural water resource [11]. In order to alleviate agricultural water pollution, it is necessary to take the gray water footprint as a necessary water consumption in agricultural production, so as to promote the green development of agriculture. Yet, to the authors’ knowledge, the gray water footprint has been less considered in the research on the agricultural water and land resources matching. Therefore, the establishment of agricultural water and land resources matching method from the perspective of total water footprint of crop production can not only fully take into account the impact of crop types and climatic conditions, but also provides a new perspective for the optimal allocation of water and land resources.
In recent years, with the improvement of the water footprint theory on the basis of virtual water theory and the concept of ecological footprint [12,13], the water and land resources matching from the perspective of water footprint has gradually become a research hotspot. Liu et al. constructed a refined index for measuring the regional matching characteristics between water and land resources, the results showed introducing the broadly defined agricultural water resources into the established models as the characteristic parameter of water resource quantity is scientific and reasonable [14]. Cao et al. used the calculation method of generalized agricultural water and land resources matching coefficient to analyze the matching characteristics of water and land resources during the growth period of spring maize in Liaoning Province from 1985 to 2018 based on the perspective of water footprint of crop production, the results showed that the future adjustment of maize planting structure in Liaoning Province should be based on the matching characteristics of agricultural water and land resources in different regions [15]. Qin used the Gini coefficient and agricultural water and land resources matching model to analyze agricultural water and land resources matching coefficient in broad sense and narrow sense, the results showed the study, in a broad sense, can better reflect the actual matching pattern of agricultural water and land resources [9]. Fan and Fu discussed the situation of water footprint in the process of crop production in the Yangtze River economic belt of China and calculated the matching degree of agricultural water and land resources on this basis, the results showed that the introduction of virtual water into the matching degree analysis of water and land resources was closer to the actual situation [16]. Despite research efforts on the agricultural water and land resources matching, few studies have been oriented from a total water footprint (including gray water) footprint perspective, whereas a lack of a total water footprint (including gray water footprint) may lead to a biased view development and utilization of agricultural water and land resources.
This paper attempts to introduce the gray water footprint as an indispensable part of crop production water consumption into the total water footprint, take the total water footprint as the characterization parameter of water resources, and explore the matching degree of agricultural water and land resources from the perspective of crop production. The objectives of this research are to: (1) calculate the total water footprint as the characterization index of agricultural water resources in Heilongjiang Province; (2) construct the Gini coefficient model to study the matching pattern of water and land resources based on total water footprint and cultivated land area; (3) construct the matching coefficient model of water and land resources to study spatiotemporal matching patterns between water and land resources; and (4) use the equivalent coefficient model to confirm the rationality of improved index. It is expected to more comprehensively characterize the amount of water resources in agricultural production through the total water footprint, in order to provide effective management and policy making for the green development of agriculture.
2. Case Study and Data Sources
2.1. Study Area
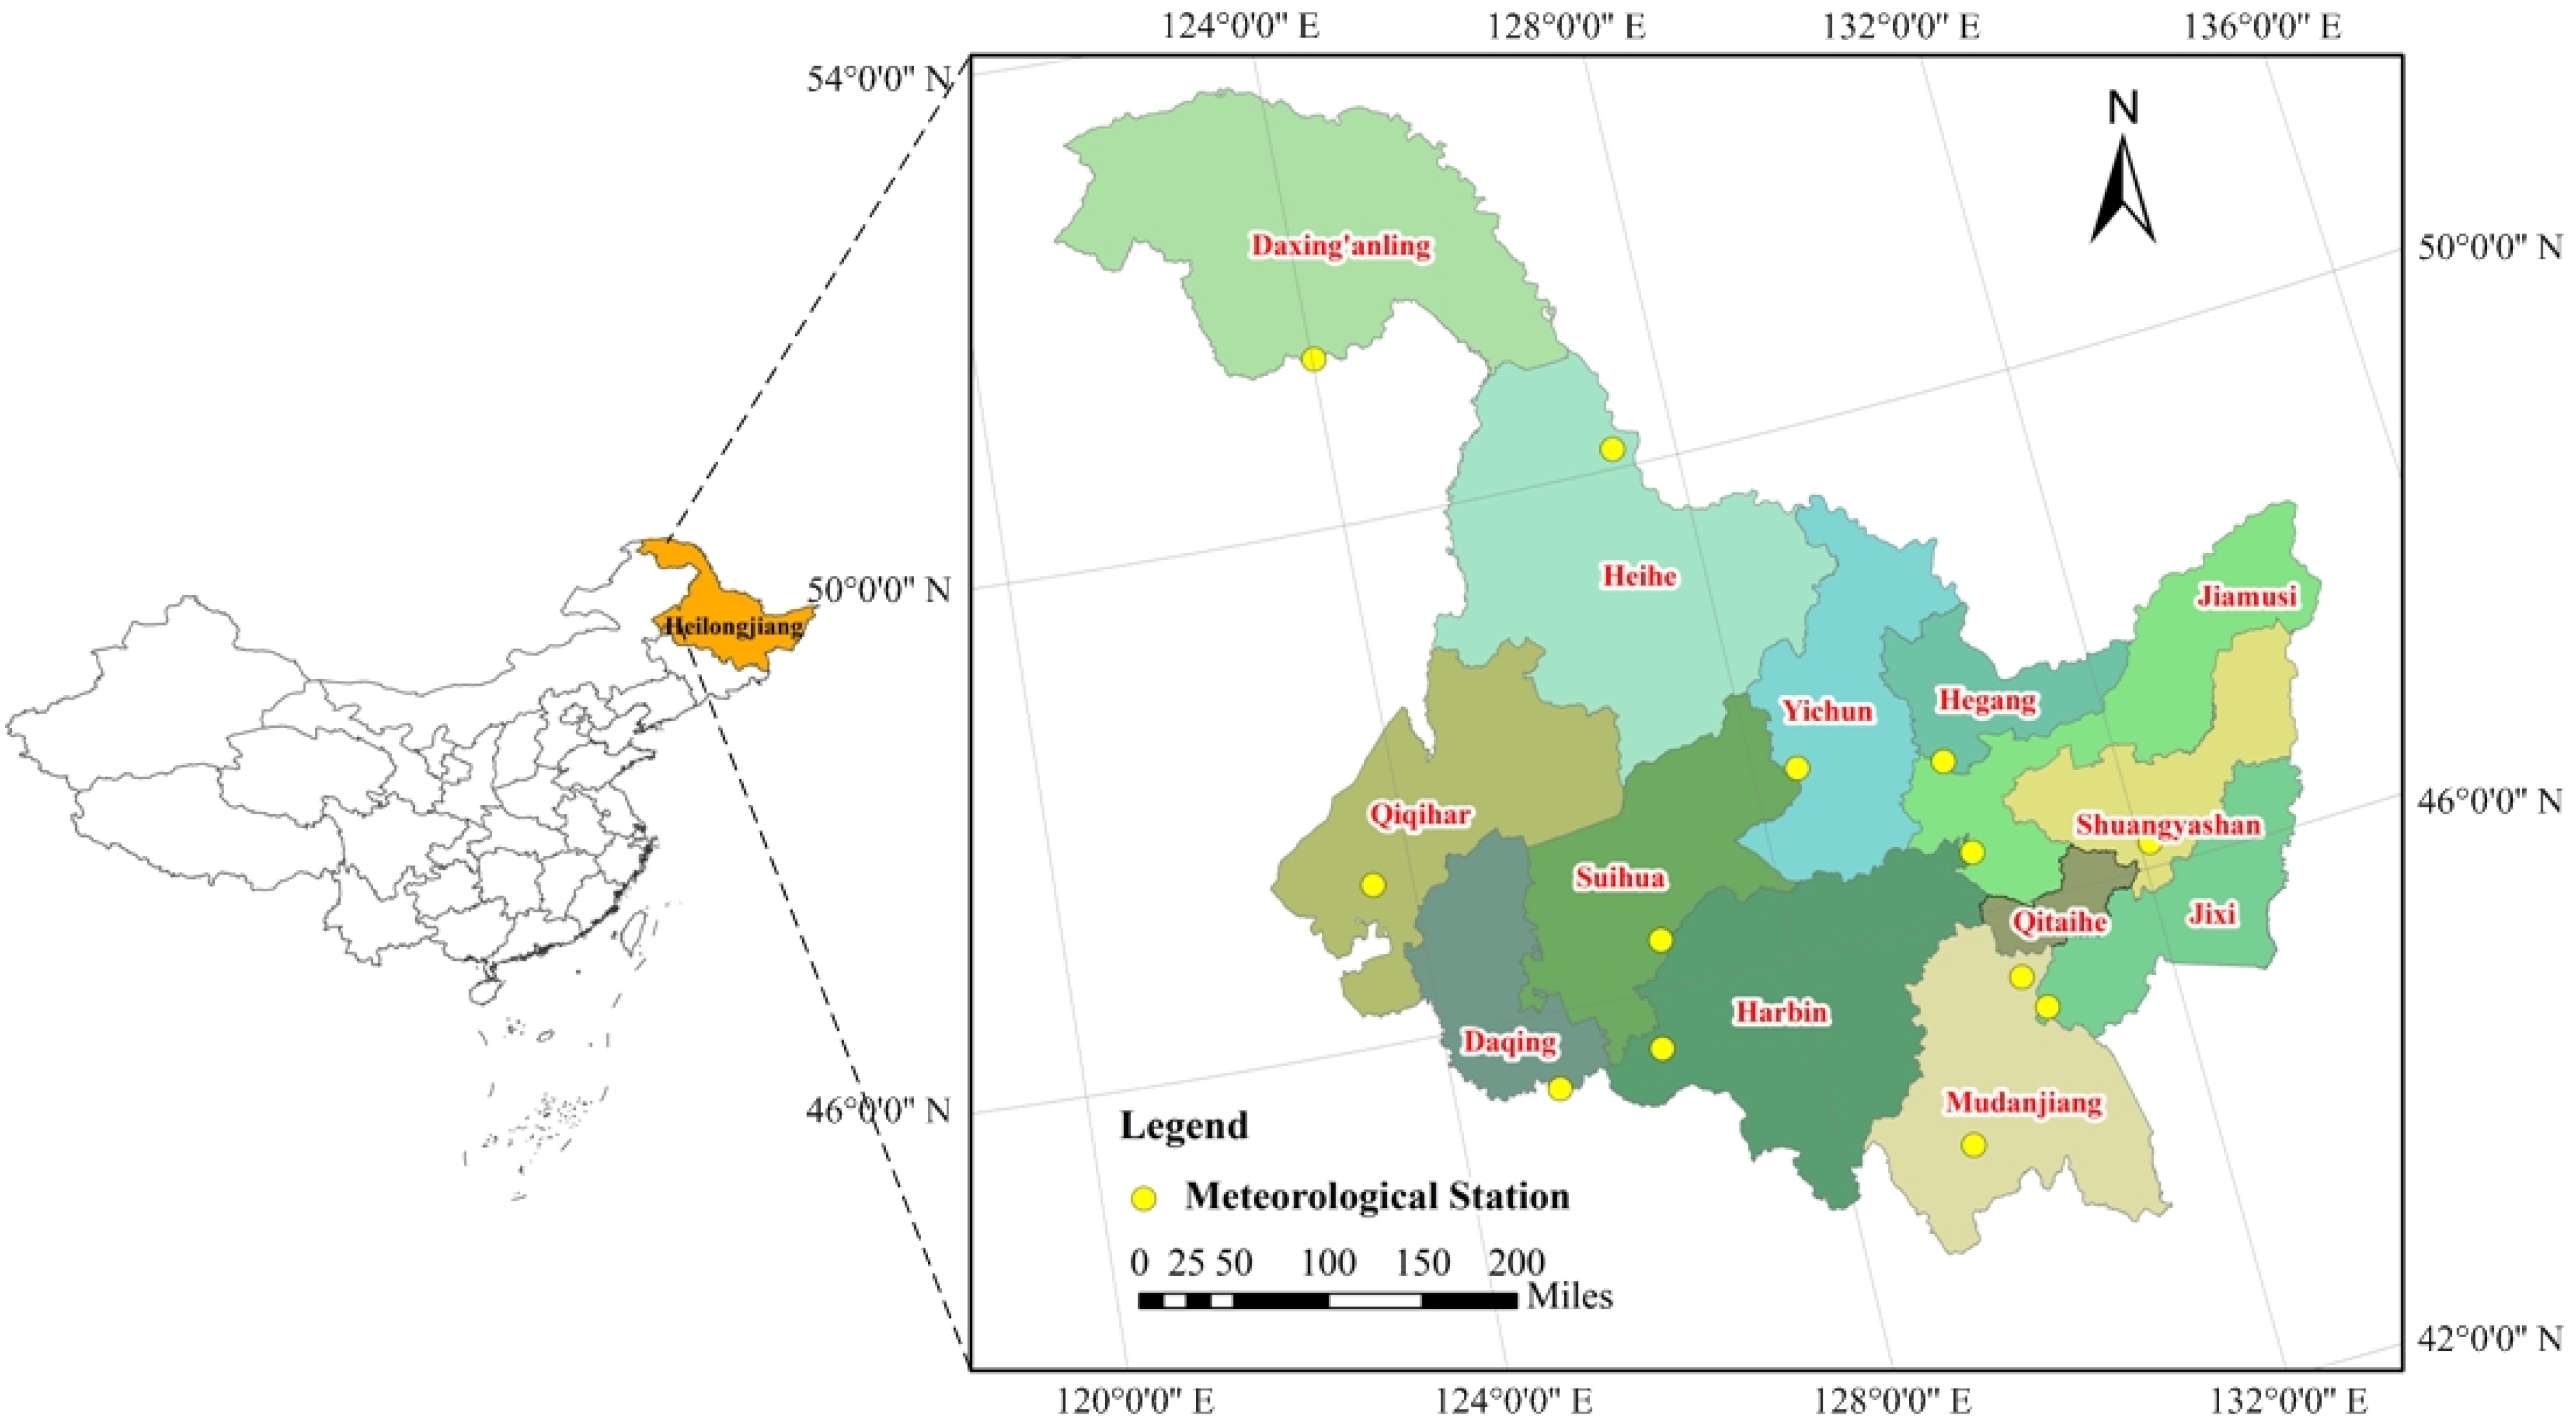
Heilongjiang Province is located in northeast China, 43°26′~53°33′ N, 121°11′~135°05′ E (Figure 1). The total area of Heilongjiang Province is approximately 47.3 × 10⁴ km2, and the area of cultivated land is approximately 16.02 × 10⁴ km2. Heilongjiang Province governs Harbin, Qiqihar, Daqing, Suihua, Heihe, Yichun, Hegang, Jiamusi, Qitaihe, Mudanjiang, Jixi, Shuangyashan and Daxing’anling. The annual average temperature is −5~5 °C; the average precipitation is 400~600 mm, and the water resources per capita are 2114 m3, slightly higher than the national average. It has four water systems that include Heilongjiang and the Songhua, Wusuli and Suifen Rivers. In space, water resources are less prevalent in the West, more prevalent in the East. Owing to the influence of the temperate continental monsoon climate, the annual precipitation is distributed unevenly, and the interannual variation is large. The precipitation in flood season comprises >65% of the annual precipitation, and there is less precipitation in the winter and spring. Although the total amount of water resources is relatively rich, the water resources of cultivated land is only 5520 m3/hm2, less than 1/3 of the national average level, which seriously affects the improvement in agricultural production capacity.
2.2. Data Sources
In this study, the total amount of water resources, cultivated land area, land area and other data related to agricultural water and land resources from 2008 to 2018 in the cities of Heilongjiang Province were used. The data came from the Heilongjiang Statistical Yearbook, Heilongjiang Water Resources Bulletin and Heilongjiang Water Conservancy Statistical Yearbook. The meteorological parameters, such as relative humidity, wind speed, sunshine hours, precipitation, average maximum temperature and average minimum temperature, are from the China Meteorological Data Network (http://data.cma.cn (accessed on 1 May 2021)).
3. Methods
3.1. Total Water Footprint of Crop Production
Allan introduced the concept of virtual water in 1993 [17], and Hoekstra proposed the concept of “water footprint” on the basis of virtual water [18]. A water footprint studies the problem of water shortage from the perspective of consumption. This helps to better understand the occupation of freshwater resources by human activities, so as to provide policy suggestions to formulate appropriate virtual water strategy and alleviate the pressure on regional water resources. The definition of a water footprint is as follows: the water footprint of production crops in a country or region is the sum of the green water, blue water and gray water footprints. The green water footprint primarily refers to the total evaporation of rainwater during the crop growth period, the blue water footprint primarily refers to the evaporation of water resources, such as irrigation water and surface lakes, and the gray water footprint refers to the amount of water resources diluted by pollutants in the process of crop growth. The specific calculation formula is as follows:
where TWF is the total water footprint of crop production, m3; GWF, BWF and HWF are the green water footprint, blue water footprint and gray water footprint, respectively, m3.
where GWi is the green water consumption per unit area of crop i, m3/hm2; BWi is the amount of blue water consumed per unit area of crop i, m3/hm2, and Ai is the planting area of crop i, hm2.
The green water and blue water resources consumed by crops per unit area are calculated according to the following formula [19,20]:
where GW is the evapotranspiration of green water, m3/hm2; BW is the evapotranspiration of crop blue water, mm; ETc is the crop evapotranspiration, mm; Pe is the effective precipitation during the whole growth period, mm; 10 is the unit conversion factor, and the unit of water depth (mm) is converted to the unit area water volume (m3/hm2).
The formula to calculate ETc is as follows:
where Kc is the crop coefficient, and ET0 is the reference crop evapotranspiration, mm.
The ET0 was calculated using CROPWAT8.0, and the meteorological data were obtained from meteorological stations in different regions (Figure 1). Based on the relevant research results [21], the grain crop growth period and grain crop coefficient are shown in Table 1 and Table 2.
The effective precipitation is calculated using the method proposed by the Soil Conservation Bureau of the United States Department of Agriculture:
The gray water footprint refers to the maximum amount of fresh water needed to dilute the pollutants in crop production [22]. The main fertilizer used in agricultural production is nitrogen fertilizer [23]. Therefore, this study chose nitrogen fertilizer as the water pollutant. The gray water footprint of crop production is as follows:
where HWF is the gray water footprint of crop production, m3; is the leaching rate of nitrogen fertilizer, %; AR is the rate of application of nitrogen fertilizer, kg; Cmax is the maximum allowable concentration of nitrogen in the environment, kg/m3, and Cnat is the natural background concentration of pollutants, kg/m3.
Referring to the existing research [24], the rate of leaching of nitrogen fertilizer is 10%. It is assumed that the concentration of nitrogen in natural water is 0 mg/L. Using the standards of the US Environmental Protection Agency, the maximum allowable concentration of nitrogen in the environment is 10 mg/L.
3.2. Gini Coefficient Model
The Gini coefficient introduced by the Italian economist Gini was first applied to the study of income disparity [25]. Because the distribution of water resources in areas also differs, the Gini coefficient is suitable for studying the matching pattern of water and land resources. The construction steps of the Gini coefficient model of regional agricultural water and land resources matching are as follows [14]:
Step 1: Calculate the amount of water resources per unit area of cultivated land in the 13 regions in Heilongjiang Province and sort the 13 regions in descending order according to the value;
Step 2: Calculate the proportion of water resources and cultivated land resources in each region, and calculate the cumulative proportion of two types of resources based on the order of Step 1;
Step 3: Taking the cumulative proportion of cultivated land area as the ordinate and the cumulative proportion of water resources as the abscissa, the Lorentz curve of spatial matching between the cultivated land area and water resources is drawn;
Step 4: Calculate the area between Lorentz curve and the 45° diagonal from 0 to 1. The area multiplied by 2 is the Gini coefficient G.
The smaller the G is, the better the matching level of agricultural water and land resources is, and the larger the G is, the worse the matching level of agricultural water and land resources is.
3.3. Agricultural Water and Land Resources Matching Coefficient Model
The Gini coefficient can only reflect the overall spatial matching degree of the water and land resources. Therefore, we introduce the agricultural water and land resources matching coefficient model to analyze the matching status. The calculation formula is as follows:
where R is the agricultural water and land resources matching coefficient, 104 m3/hm2; WF is the total water footprint of crop production, m3, and L is the cultivated land area, hm2.
4. Results
4.1. Analysis of the Characteristics of Total Water Footprint
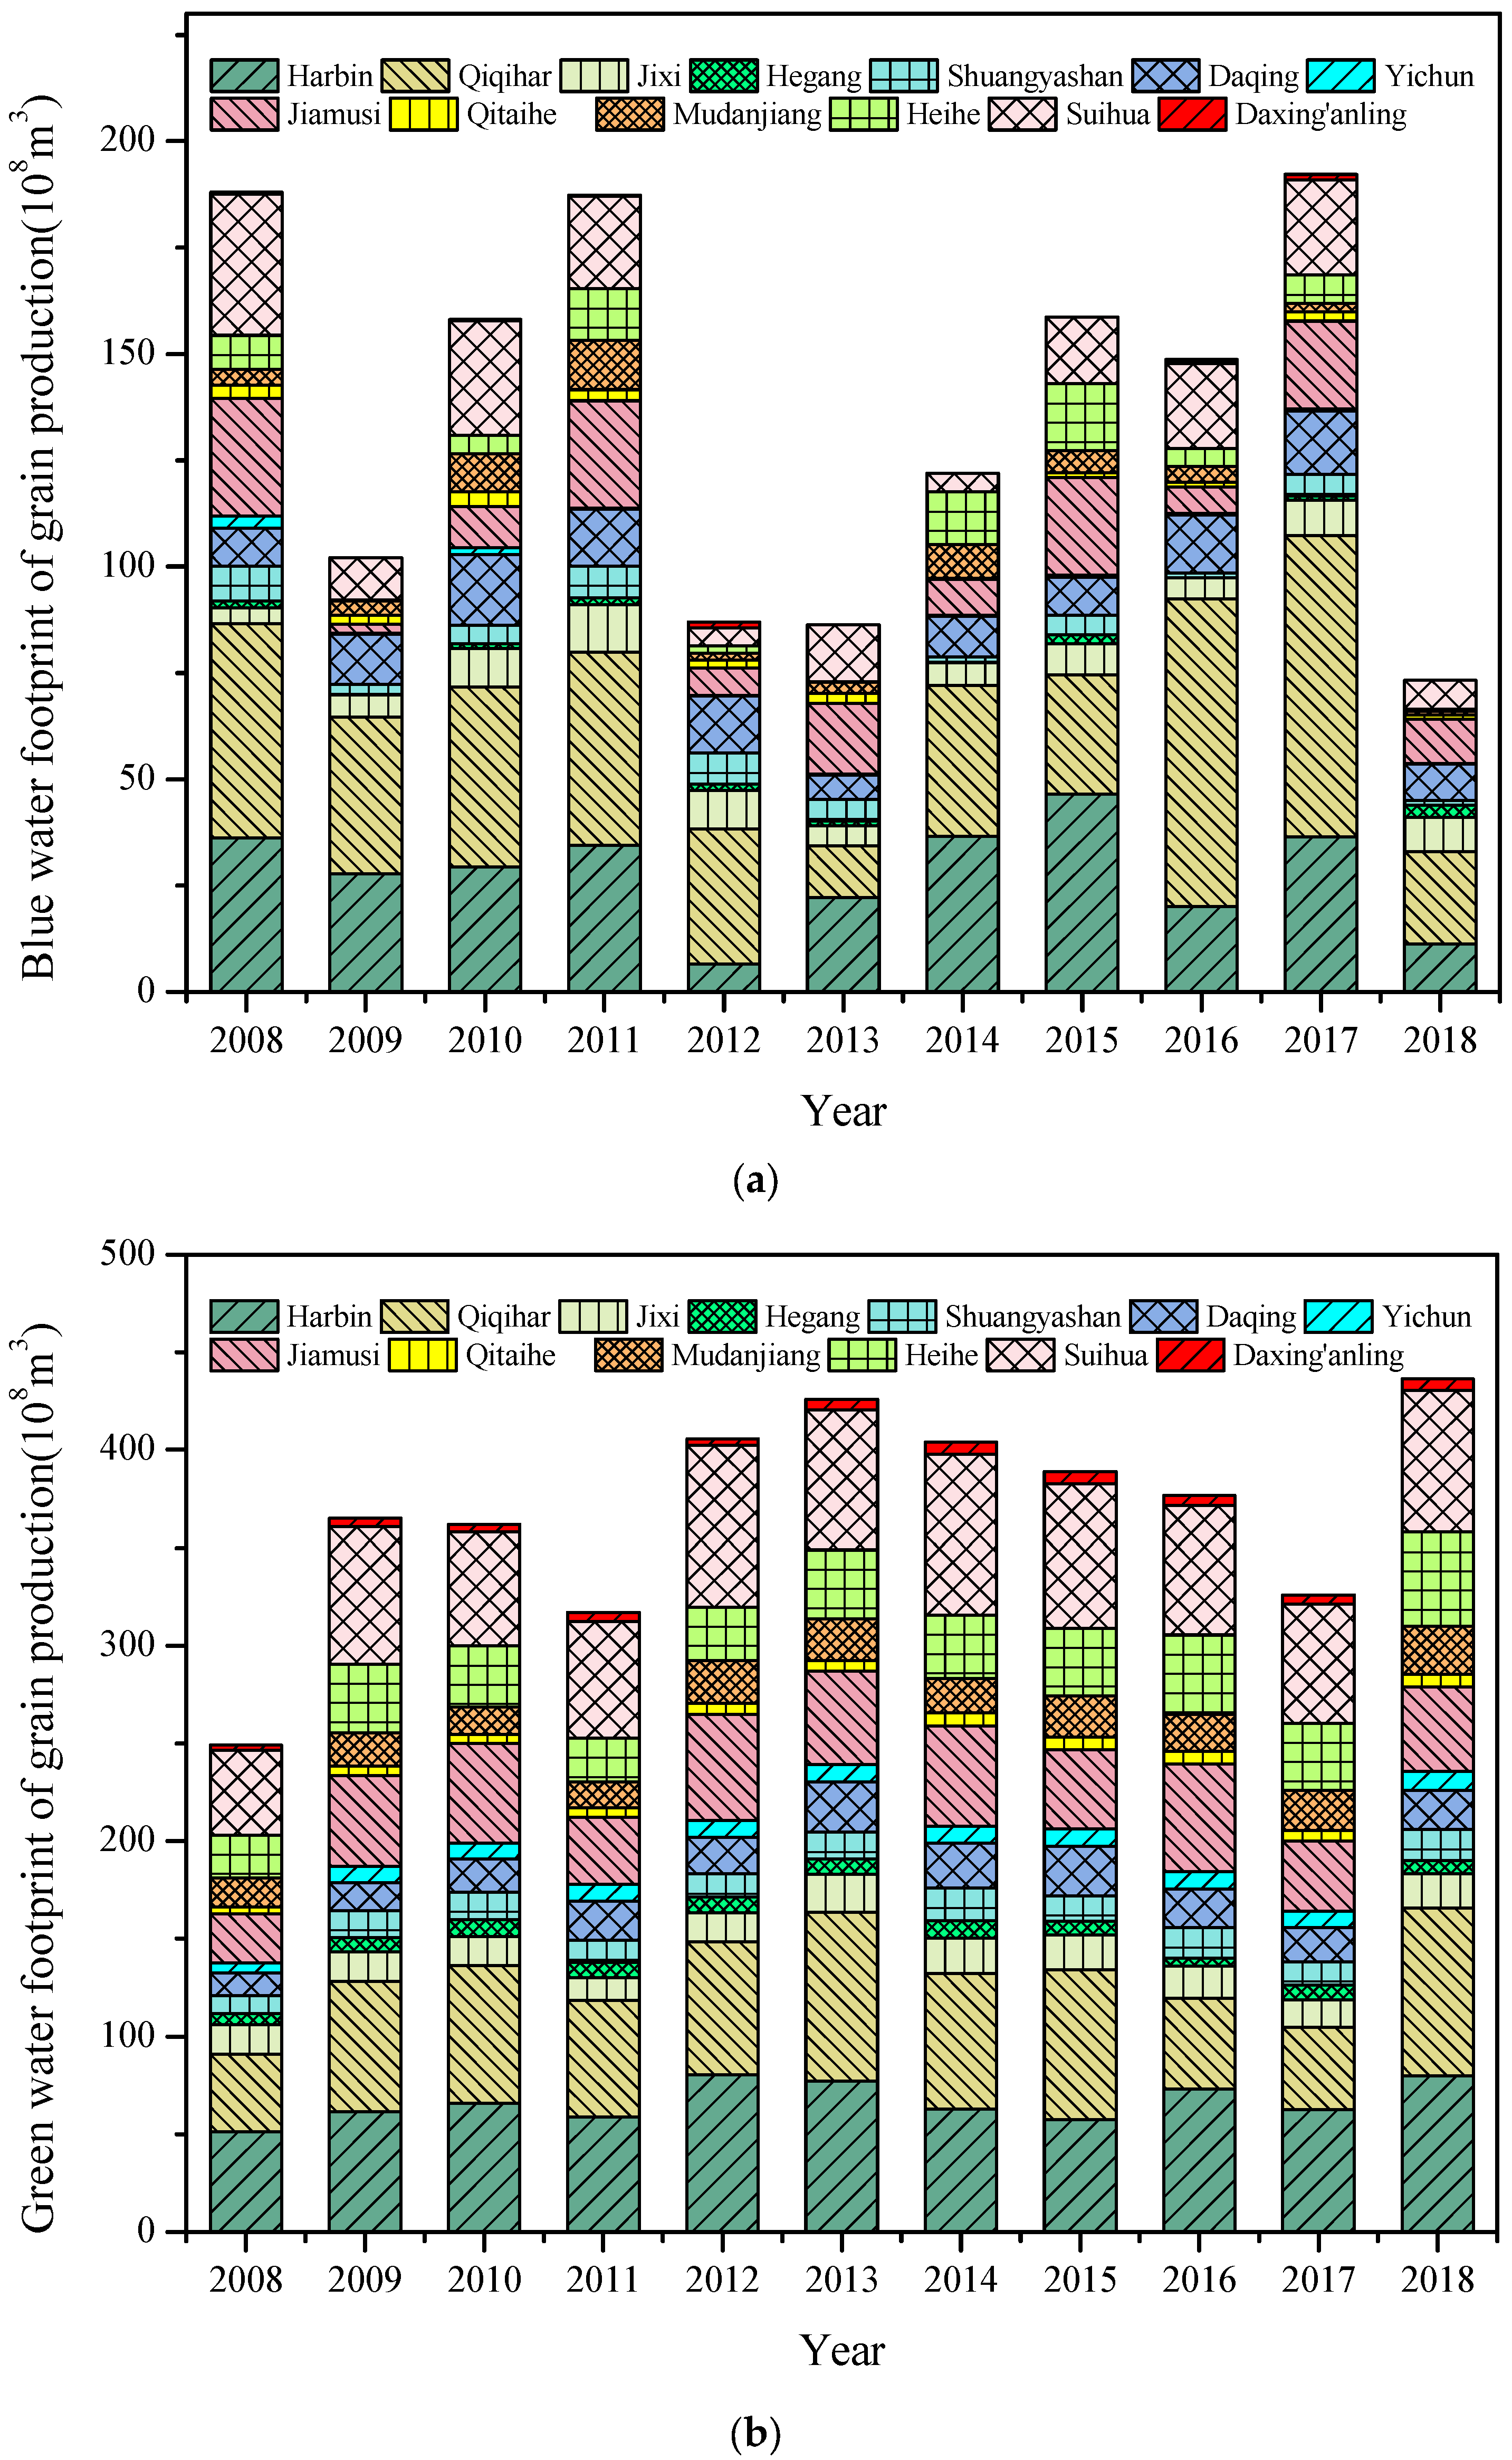
Rice, corn and soybean, as the main crops in Helongjiang Province, were selected to calculate the BWF and GWF based on the Formulas (2)–(7). HWF was calculated with the rate of application of nitrogen fertilizer based on the Formula (8), and TWF was calculated based on the Formula (1). The BWF, GWF, HWF and TWF of rice, corn and soybean in the whole growth period of 13 regions in Heilongjiang Province from 2008 to 2018 were shown in Figure 2.
The total amount of blue water footprint (Figure 2a) and green water footprint (Figure 2b) in Heilongjiang Province fluctuated from 2008 to 2018. On the whole, the blue water footprint displayed a wavy downward trend, while the green water footprint displayed a wavy upward trend. The total water footprint (Figure 2d) was primarily affected by the grain yield and the adjustment of planting structure. The gray water footprint (Figure 2c) firstly increased and then decreased from 2008 to 2018, which was the same as the change in trend of grain production [26]. With the increase of grain production (2008–2015), the agricultural pollution intensified, and the gray water footprint increased significantly. After the grain growth period (2016–2018), the agricultural pollution decreased, and the gray water footprint gradually decreased. The gray water footprint was primarily affected by the demand for chemical fertilizer and the zero-growth policy of chemical fertilizer.
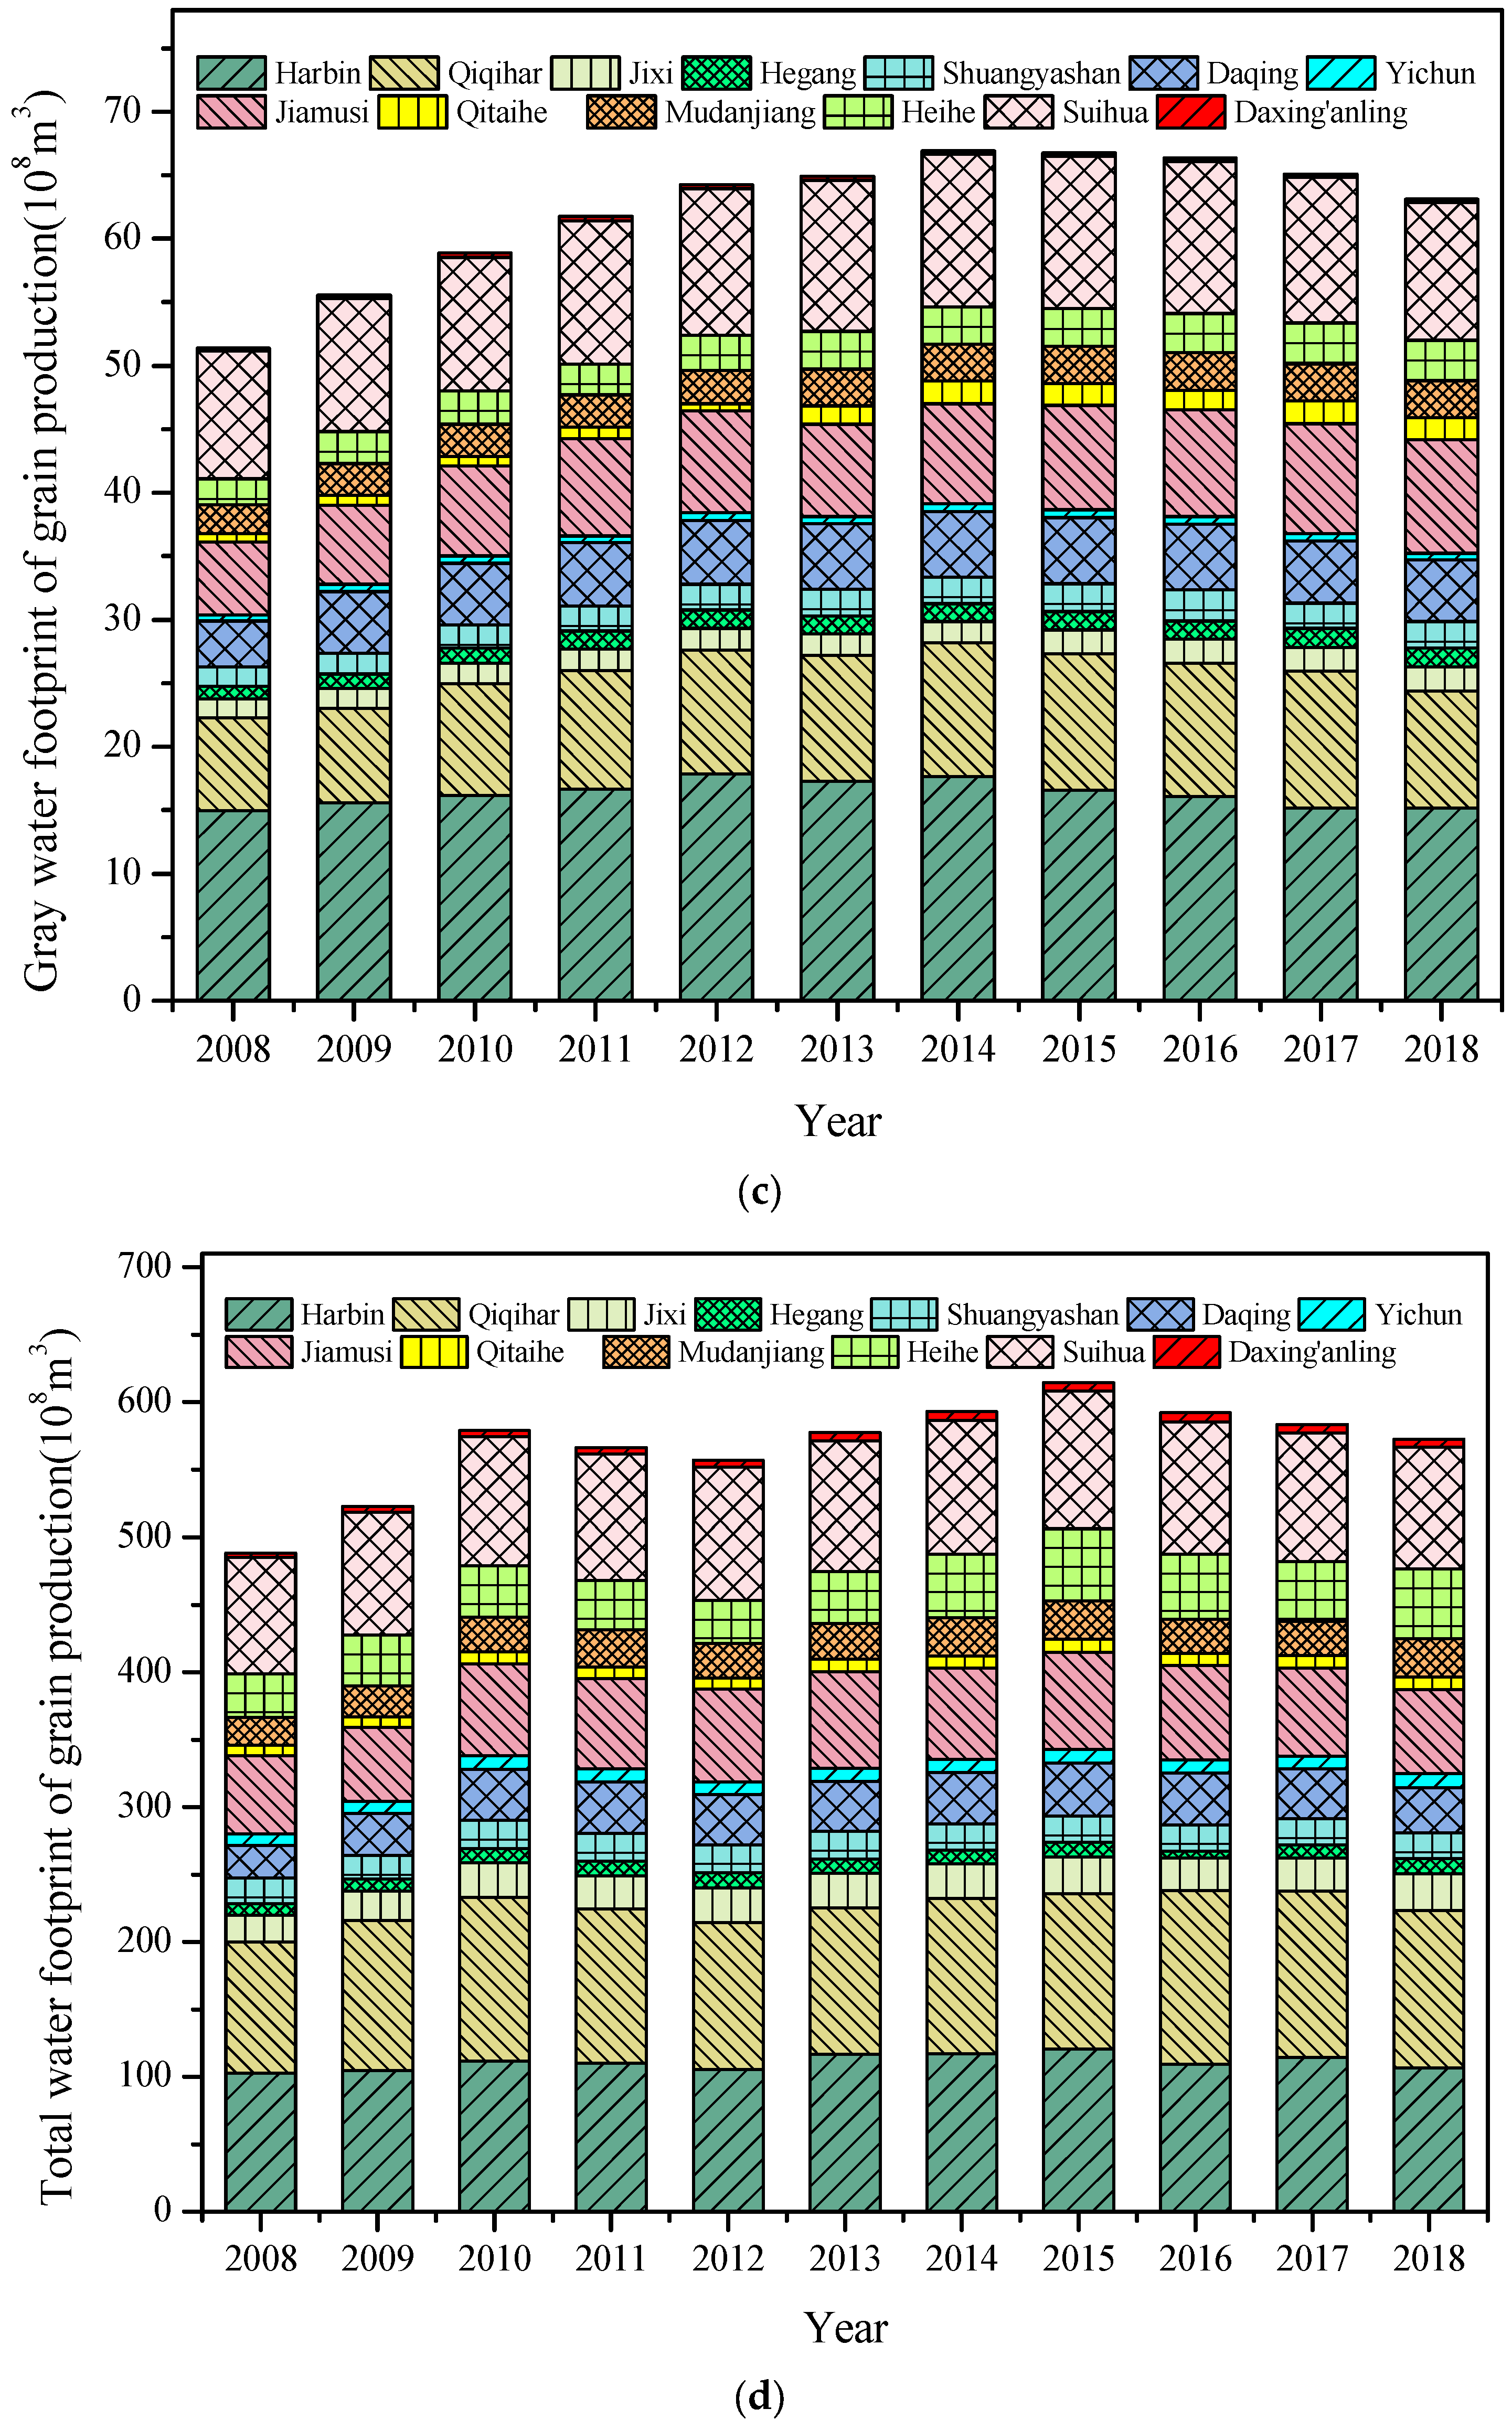
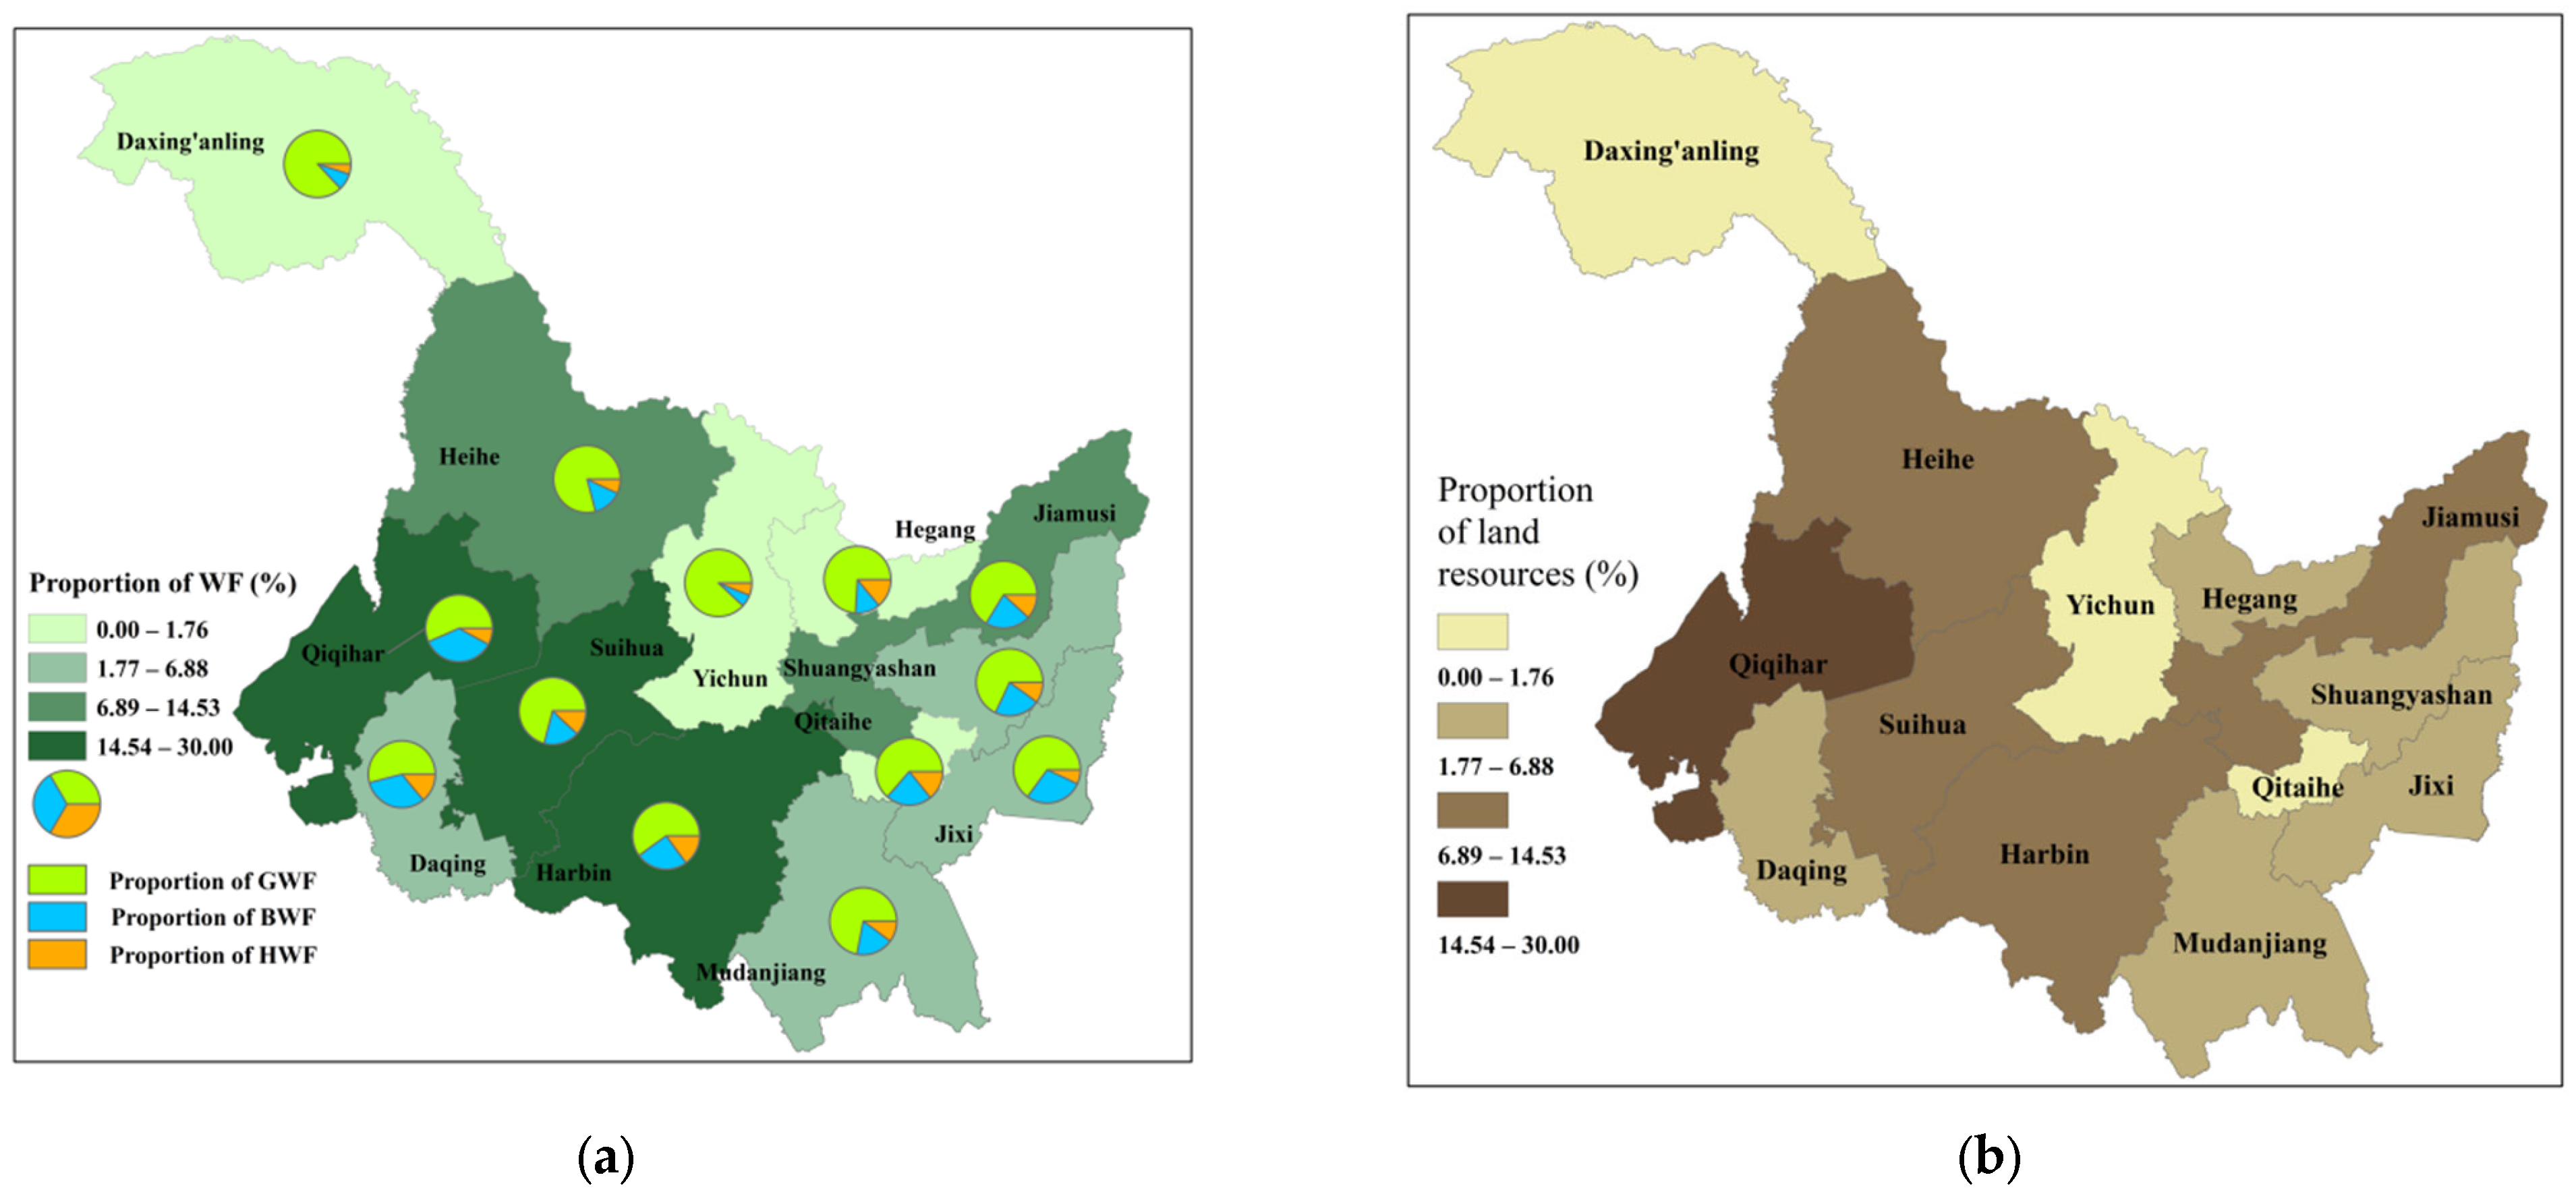
Simultaneously, the water footprint of crop production exhibited some spatial differences. Based on the 11-year average of the water footprint, the proportions of blue water footprint, green water footprint and gray water footprint were calculated and analyzed as shown in Figure 3a. Taking the percentage of cultivated land area as the measurement index, the percentage of cultivated land area in each region is calculated. The spatial distribution of land resources in Heilongjiang Province was shown in Figure 3b.
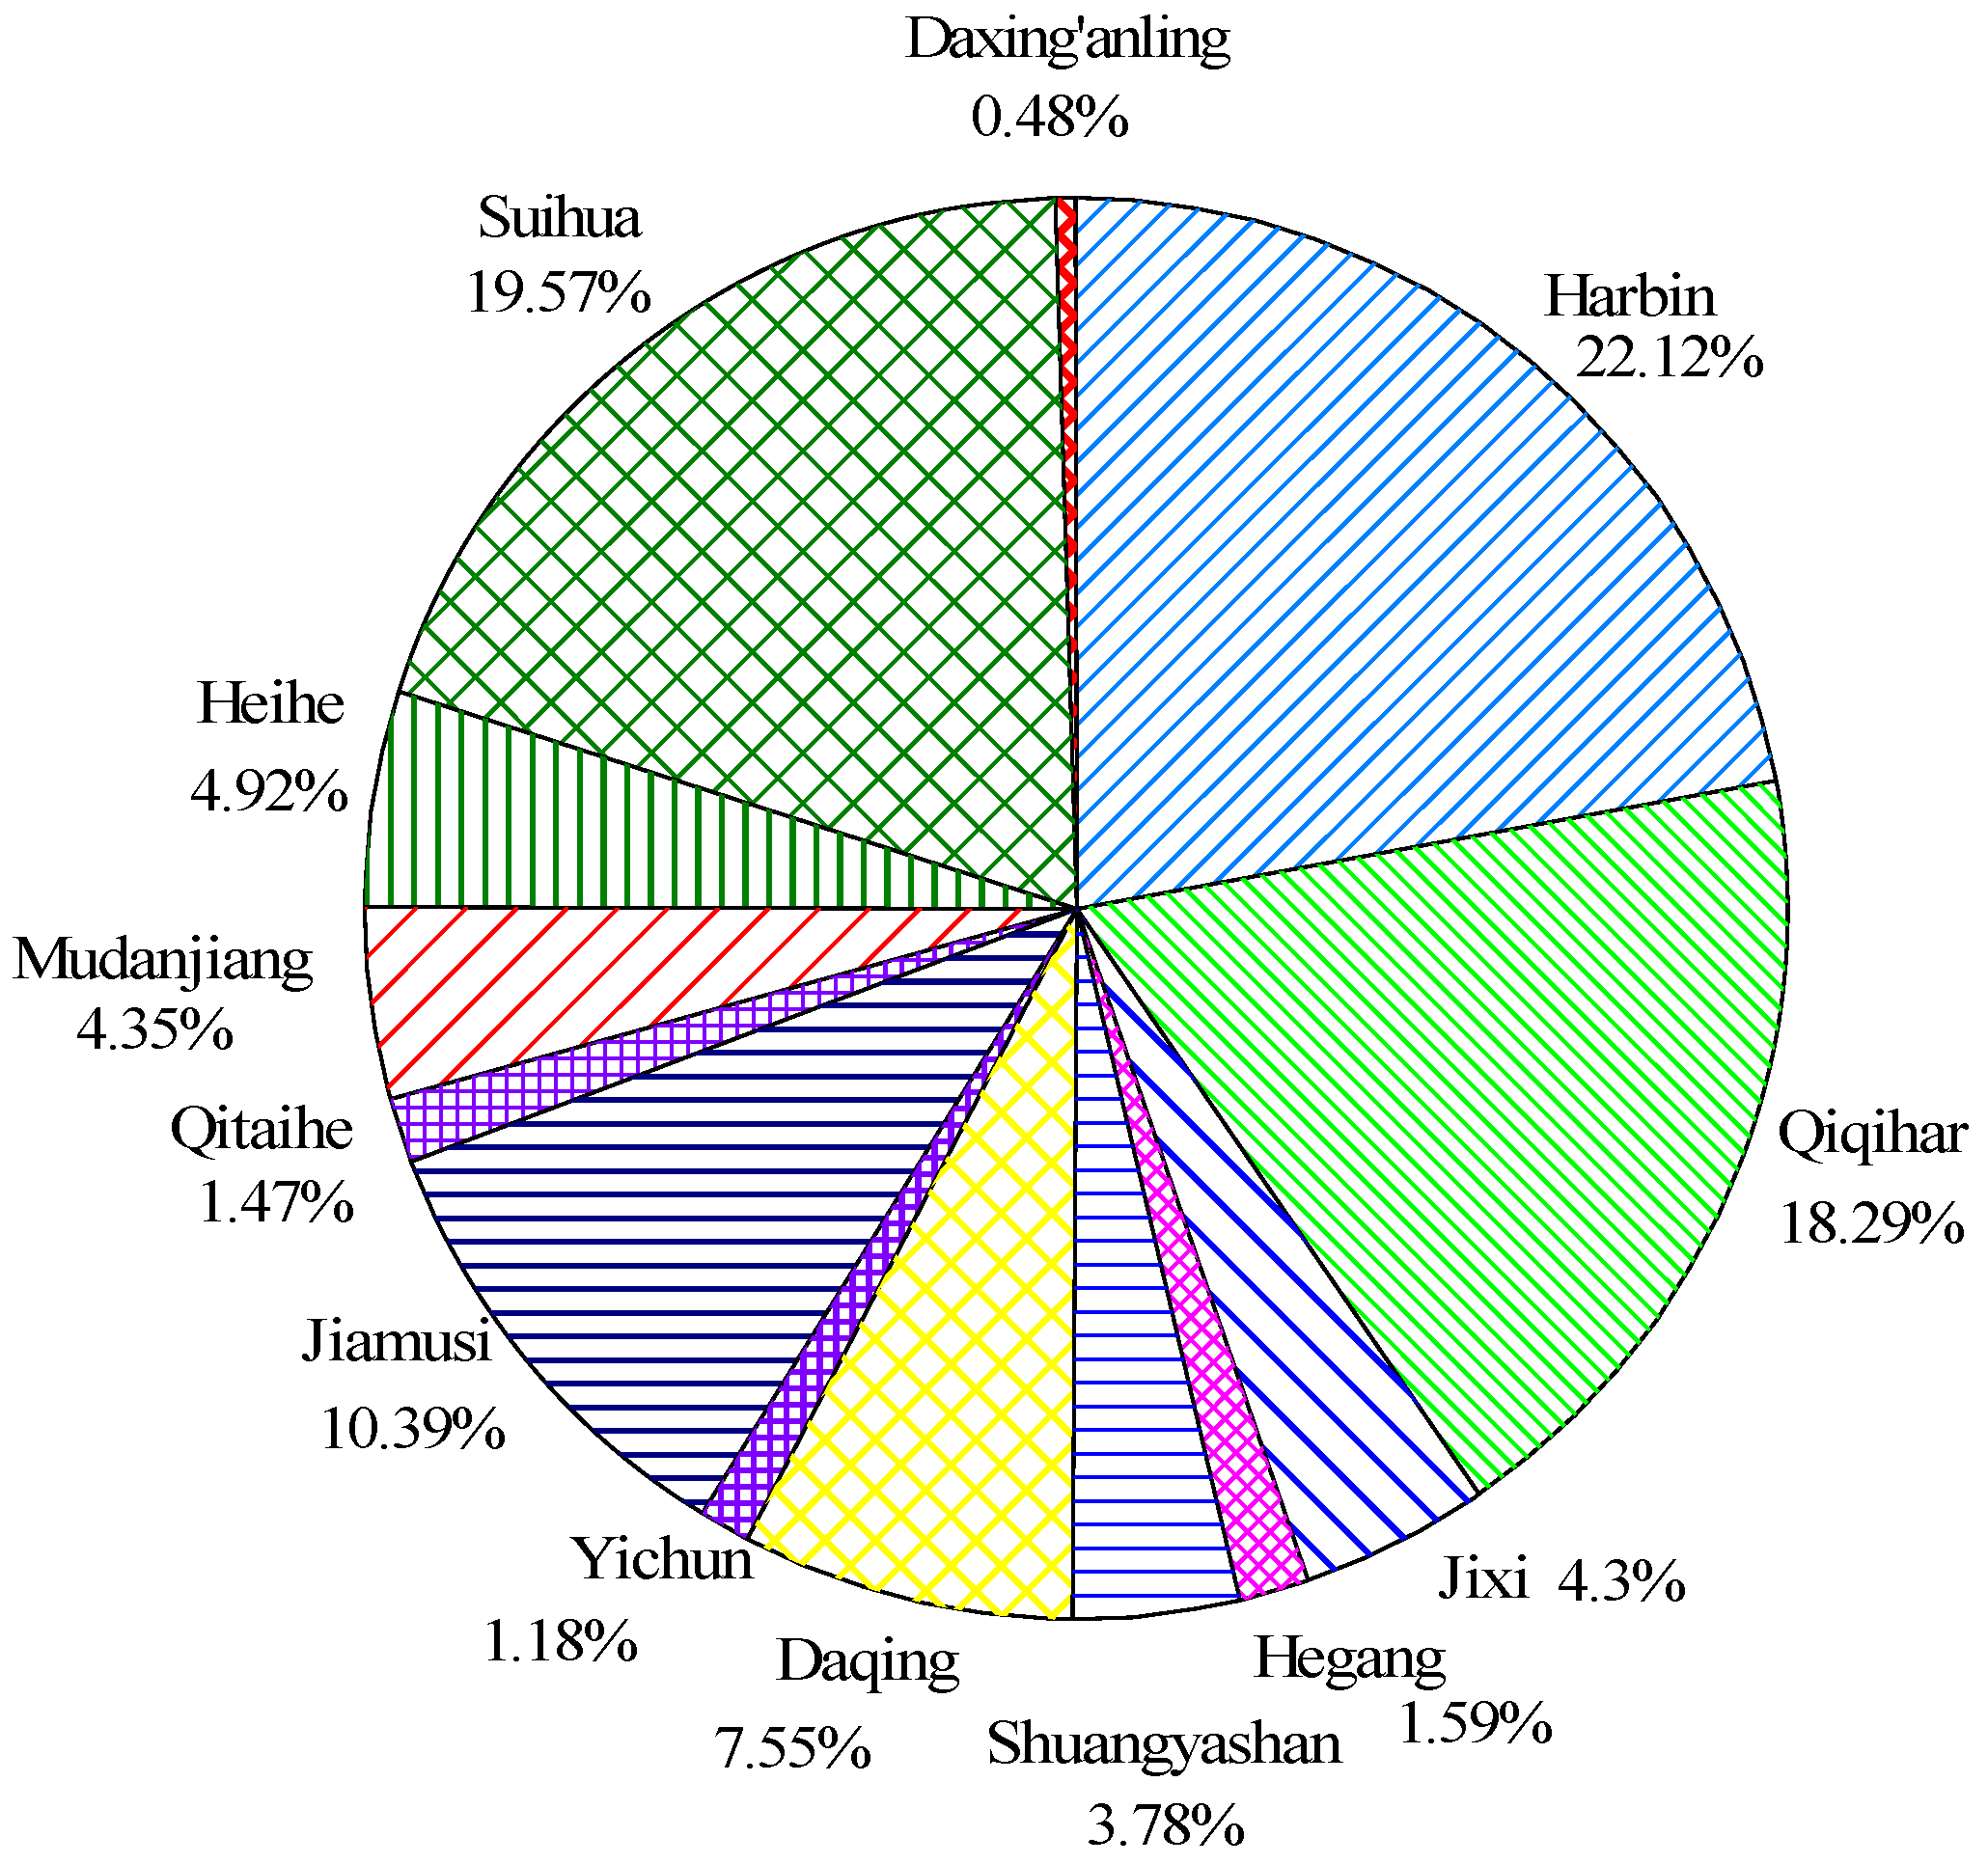
It can be seen from Figure 3a that the water footprint of crop production shows a certain spatial agglomeration, and the water footprint increases from the northeast to the southwest in space. The high value areas of water footprint were primarily distributed in Qiqihar, Suihua and Harbin, and their crop yields comprised of 18.29%, 19.57% and 22.12% (Figure 4). The low value areas of the water footprint were distributed in Yichun, Hegang, Qitaihe and Daxinganling, and their crop yields comprised 1.18%, 1.59%, 1.47% and 0.48% (Figure 4). The spatial distribution of crop production water footprint is highly consistent with that of crop yield.
It is apparent in Figure 3b that the spatial distribution of cultivated land resources in Heilongjiang Province also presents a certain regional law. The cultivated land area in Qiqihar is large, while that in Daxing’anling, Yichun and Qitaihe is less. The cultivated land area increases from the northeast to the southwest. As shown in Figure 3a,b, the spatial distribution of water footprint and cultivated land resources is highly consistent.
4.2. Matching Pattern between Agricultural Water and Land Resources Based on the Gini Coefficient Model
Taking total water footprint as the characterization parameter of water resources and the cultivated land area as the characterization parameter of land resources, the Gini coefficient model of agricultural water and land resources matching was constructed. Based on the construction method mentioned in Section 3.2, the Gini coefficient of agricultural water and land resources matching in Heilongjiang Province from 2008 to 2018 was calculated as shown in Table 3.
As shown in Table 3, the maximum value of the Gini coefficient of agricultural water and land resources matching was 0.2920; the minimum value was 0.0382, and the average value was 0.1745.
It is apparent from Table 3 and Table 4 [6] that the agricultural water and land resources in Heilongjiang Province are in a highly matching state.
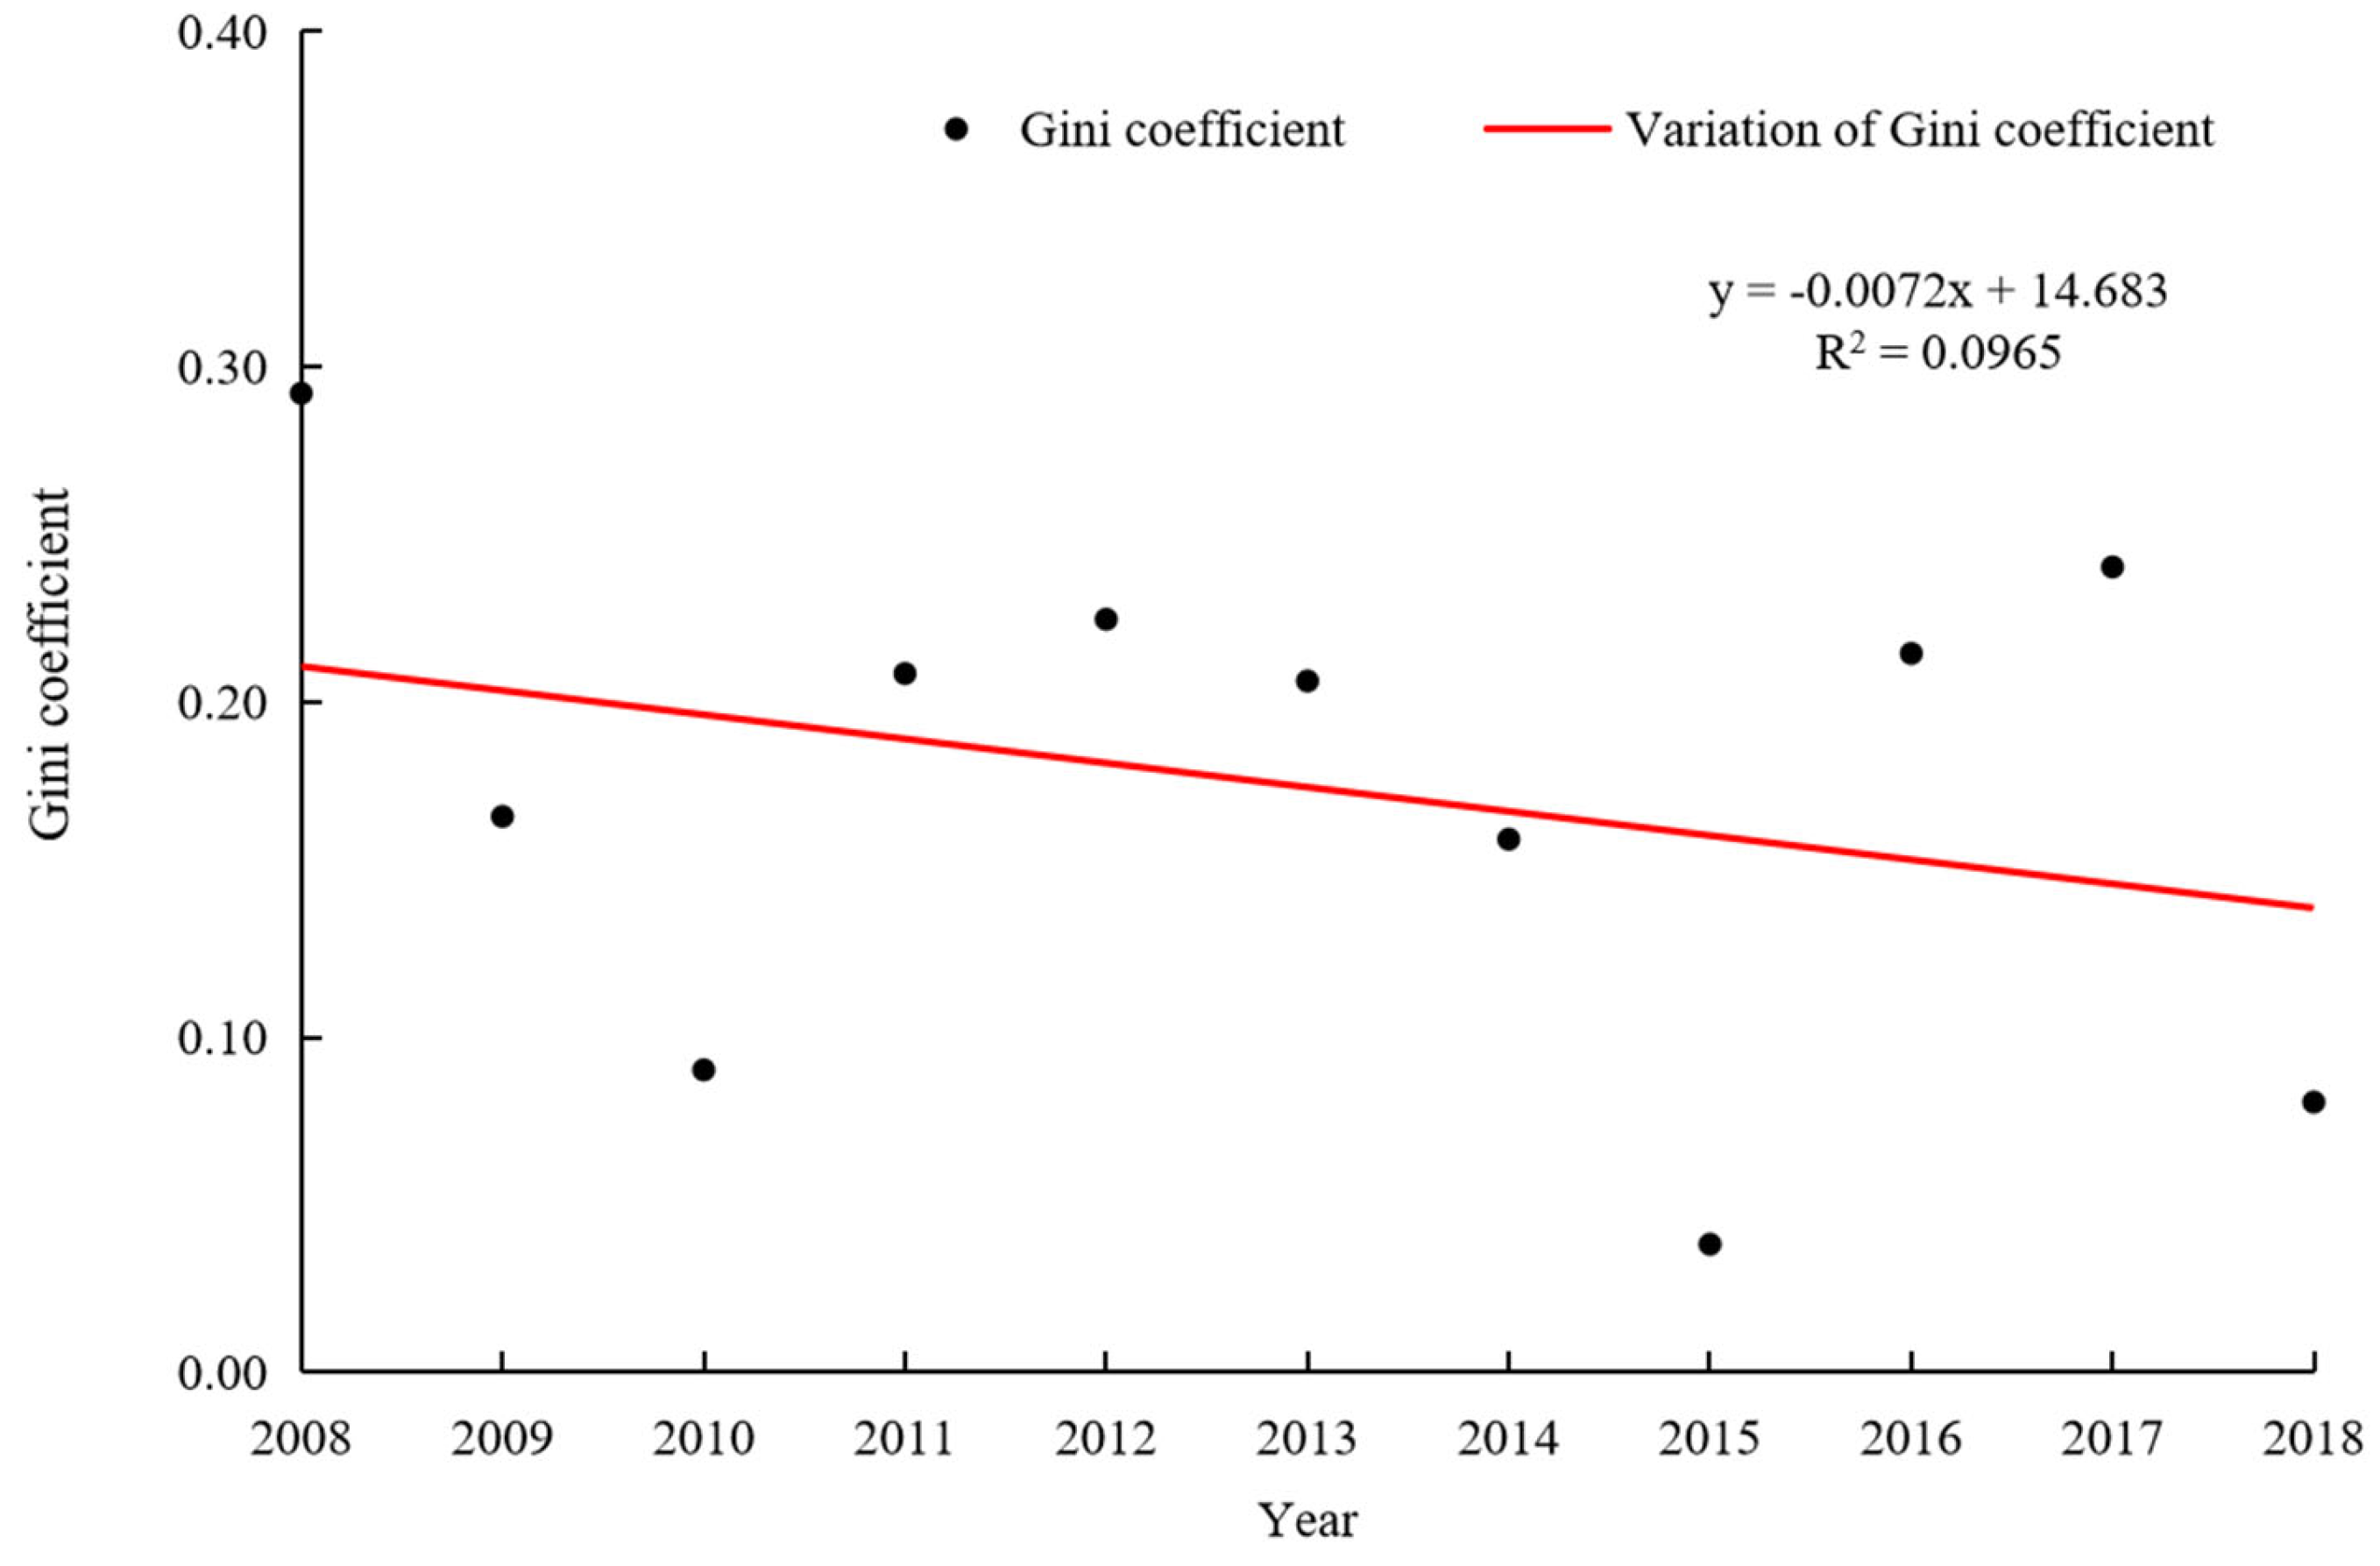
In order to more clearly express the change of the Gini coefficient with time, a plot of the dynamic change curve of the Gini coefficient is shown in Figure 5.
As shown in Figure 5, the Gini coefficient of agricultural water and land resources matching in different years has a certain fluctuation, but the fluctuation is not large, and the difference between the maximum and minimum values is only 0.1745.
It can also be found that the Gini coefficient has a periodic trend with time. The Gini coefficient is mainly affected by factors such as crop type, cultivated land area and precipitation. The years 2009 and 2010 were relatively abundant water years, the effective precipitation during the growth period was as high as 355.74 mm and 324.62 mm, and the total water footprint increased during the abundant period. During the study period, the administrative department adjusted the planting structure to continuously improve the efficiency of water use.
4.3. Matching Pattern between Agricultural Water and Land Resources Based on Agricultural Water and Land Resources Matching Coefficient Model
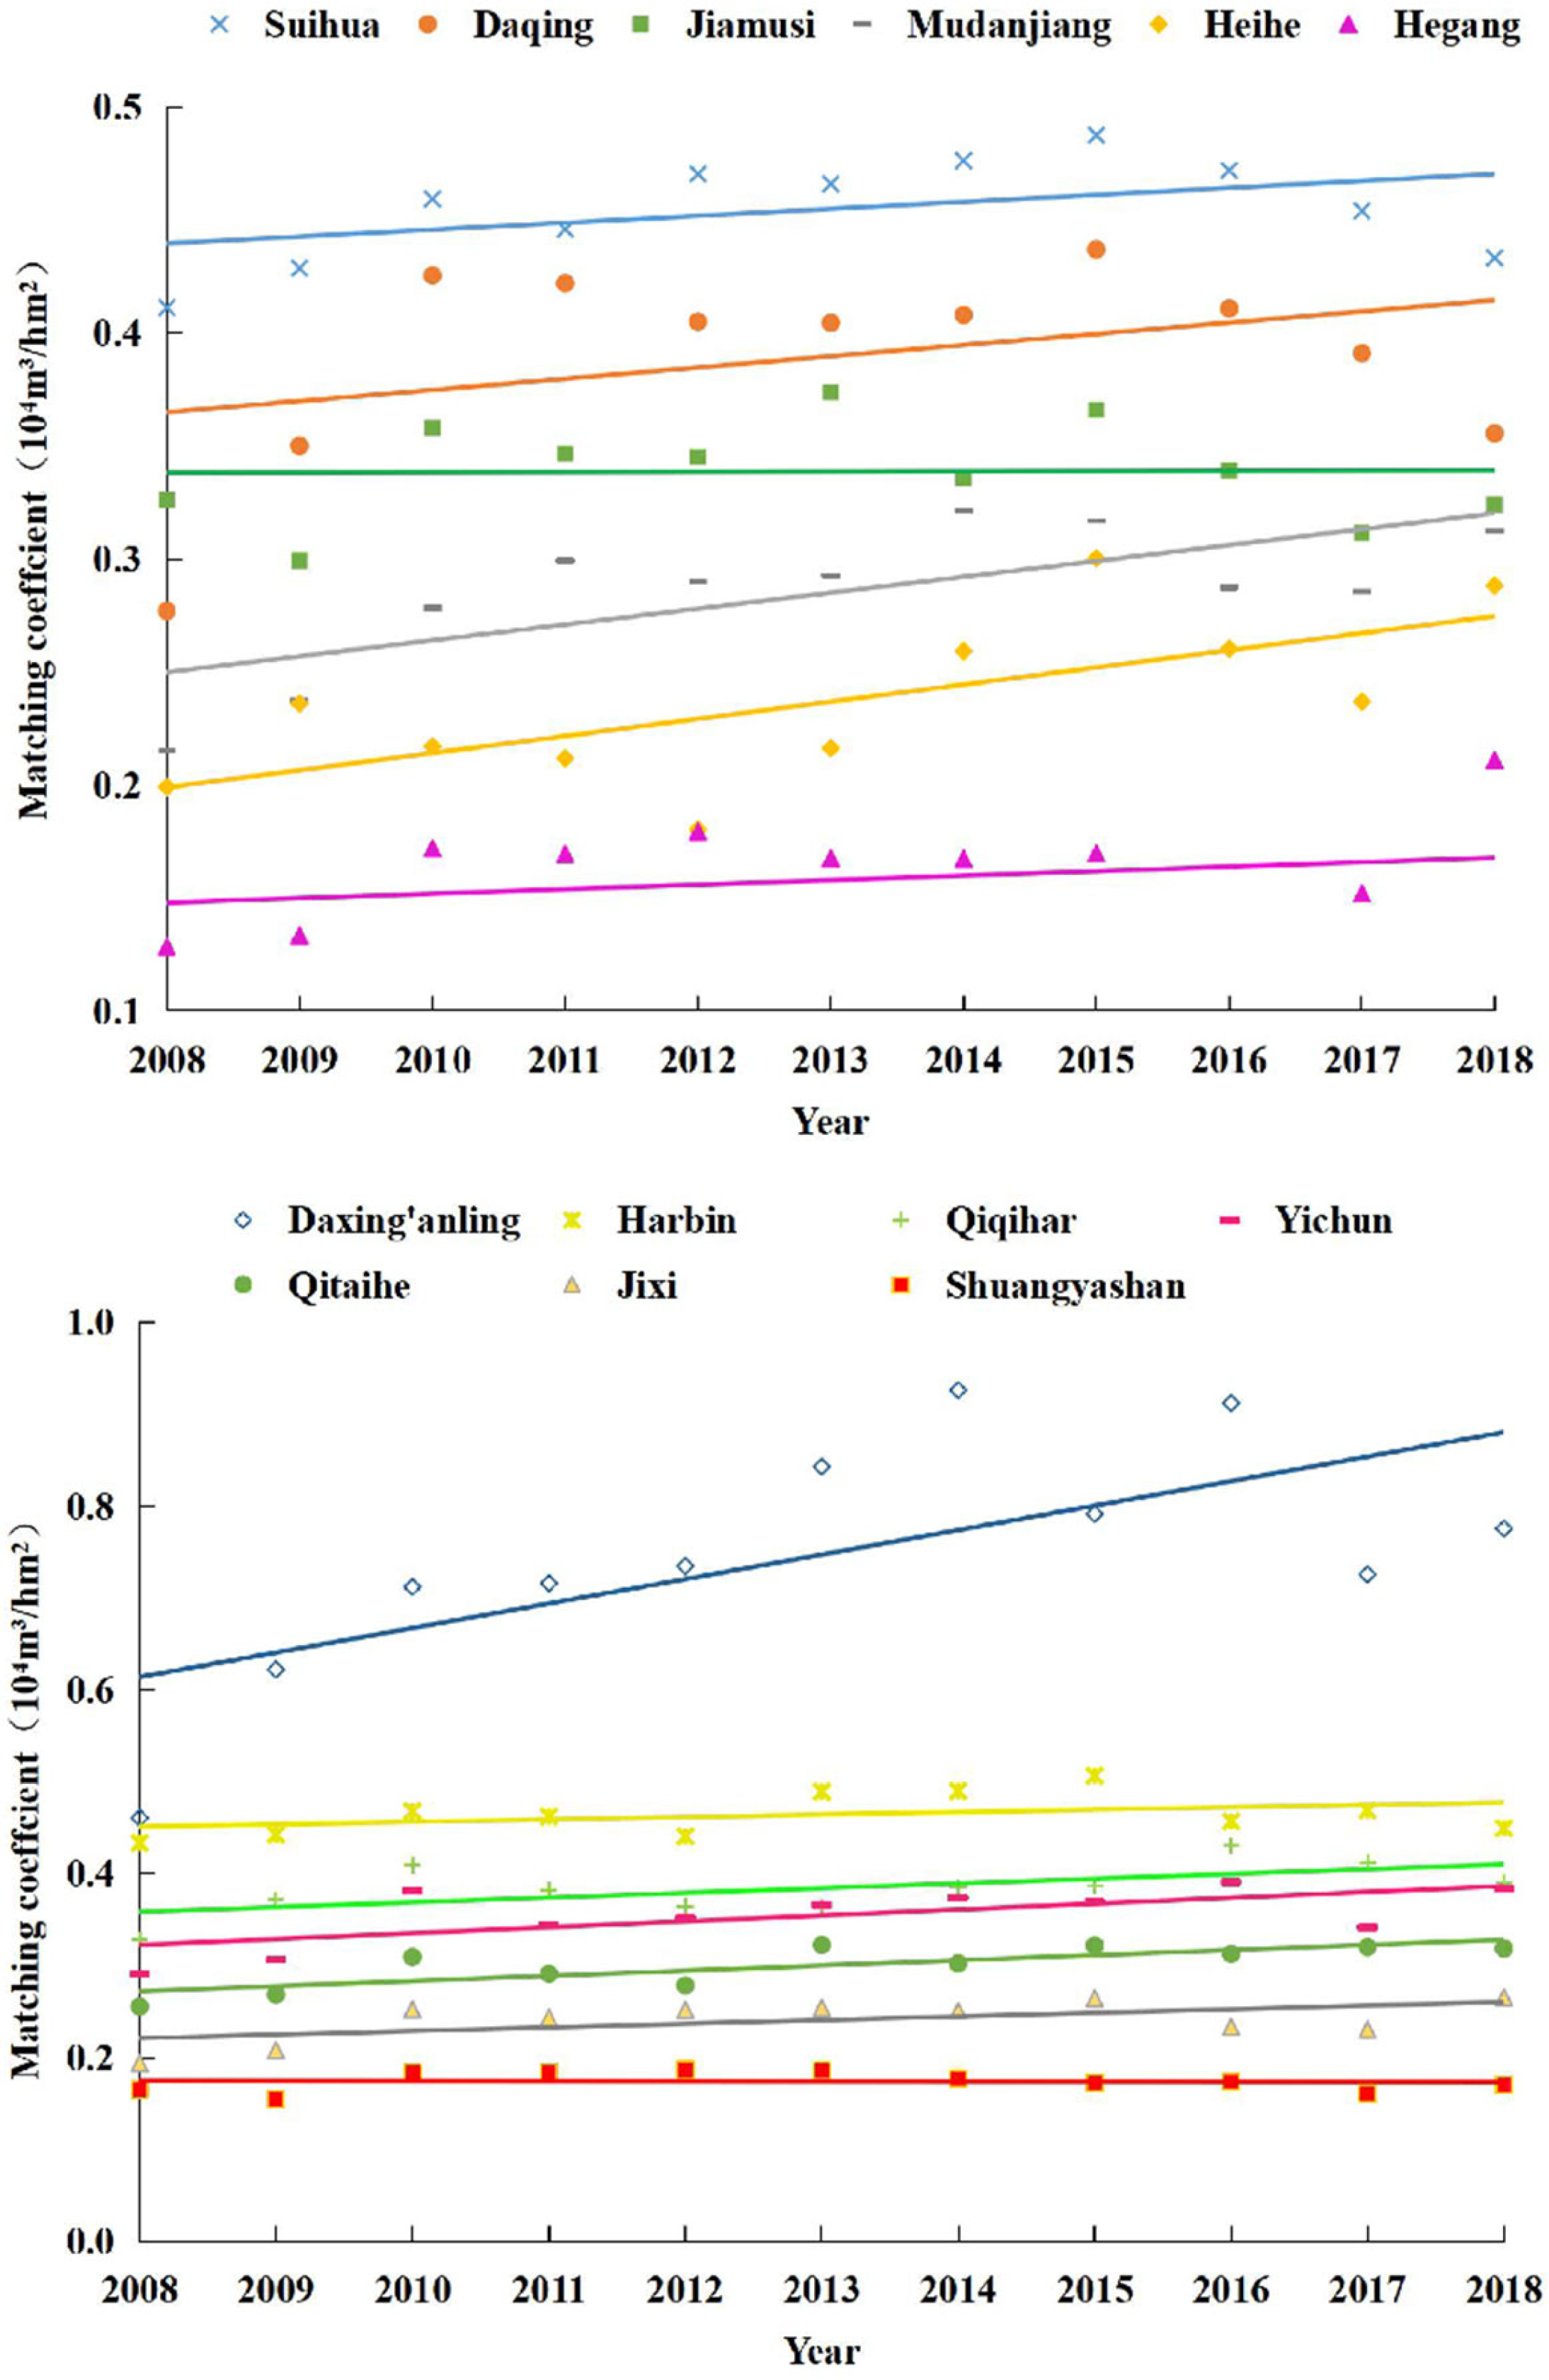
Based on the agricultural water and land resources matching coefficient model mentioned in Section 3.3, the water and land resources matching coefficients in Heilongjiang Province from 2008 to 2018 was calculated based on the Formula (9). The linear trendline of water and land resources matching coefficient in various regions of Heilongjiang Province were drawn (Figure 6), and the parameters of the linear trendline and R2 were shown in Table 5.
Seen from Figure 6, the matching degree of agricultural water and land resources in various regions exhibits a slight fluctuating variation, and a significant periodic trend can also be observed with some scatterplots in Figure 6, which is consistent with the calculations determined from the Gini coefficient.
Seen from Table 5, the slopes of the linear trendline in different regions were close to 0, indicating that the matching coefficient was in a stable state as a whole during the study period. The value of R2 is between 0.0012 and 0.6294, which showed that the significance of the matching coefficient with time is not obvious.
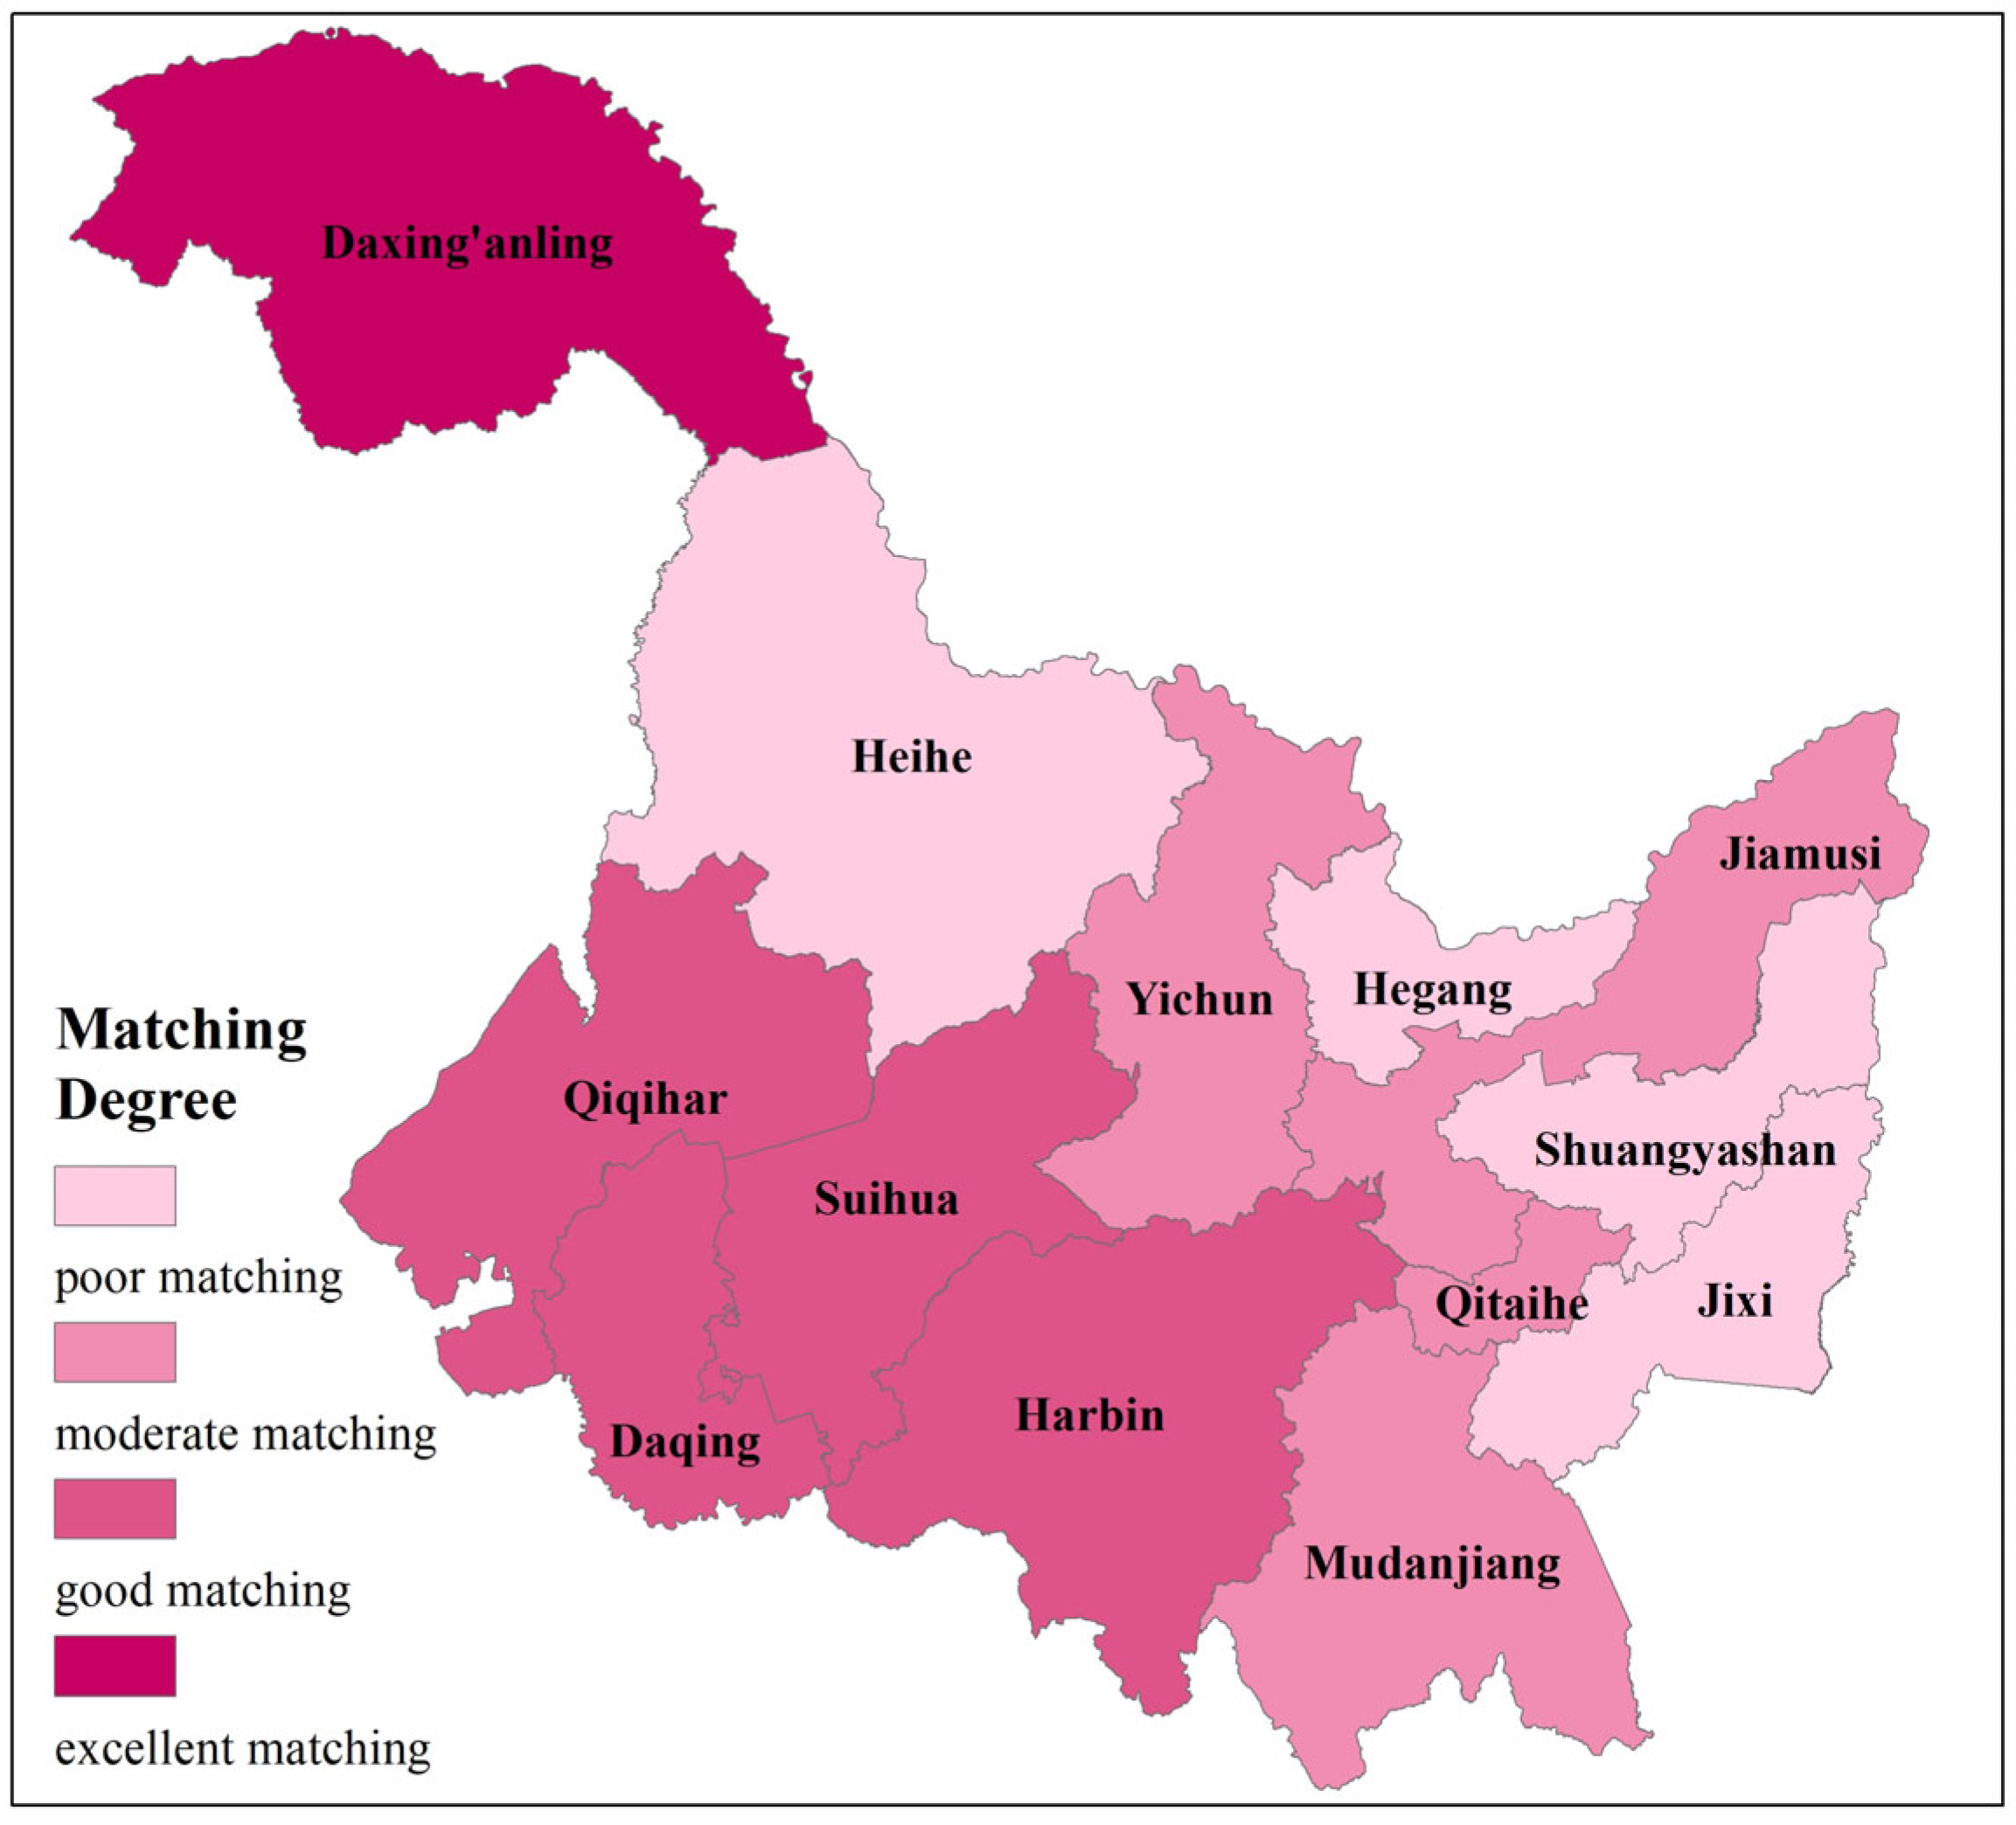
Based on the clustering and discrete differentiation characteristics of the agricultural water and land resources matching coefficient, the Jenks natural fracture point method was used to classify it in four categories as follows: the matching condition was poor (0.16 ≤ R ≤ 0.24); the matching condition was moderate (0.25 ≤ R ≤ 0.35); the matching condition was good (0.36 ≤ R ≤ 0.46), and the matching condition was excellent (0.47 ≤ R ≤ 0.75). The matching patterns of agricultural water and land resources in Heilongjiang Province as shown in Figure 7.
As shown in Figure 7, the matching coefficient gradually increased from the northeast to the southwest. The excellent matching area of agricultural water and land resources was Daxing’anling, and the poor matching areas were Heihe, Hegang, Shuangyashan and Jixi.
In order to compare the matching differences, Moran’s I index was used to analyze the spatial differences of agricultural water and land resources matching in Heilongjiang Province. Moran’s I index method includes global and local Moran’s I index [27]. The global Moran’s I index is used to judge whether the research object has an agglomeration in the spatial position, and the local Moran’s I index is used to identify the specific agglomeration’s position [28]. Global Moran’s I index was calculated in Table 6.
According to Table 6, p < 0.05 (through the 95% confidence test) and z > 1.96 (excluding 2012 and 2013). The results indicated that there is a strong positive spatial autocorrelation in the agricultural water and land resources matching in different regions, which shows the characteristics of spatial aggregation on the whole.
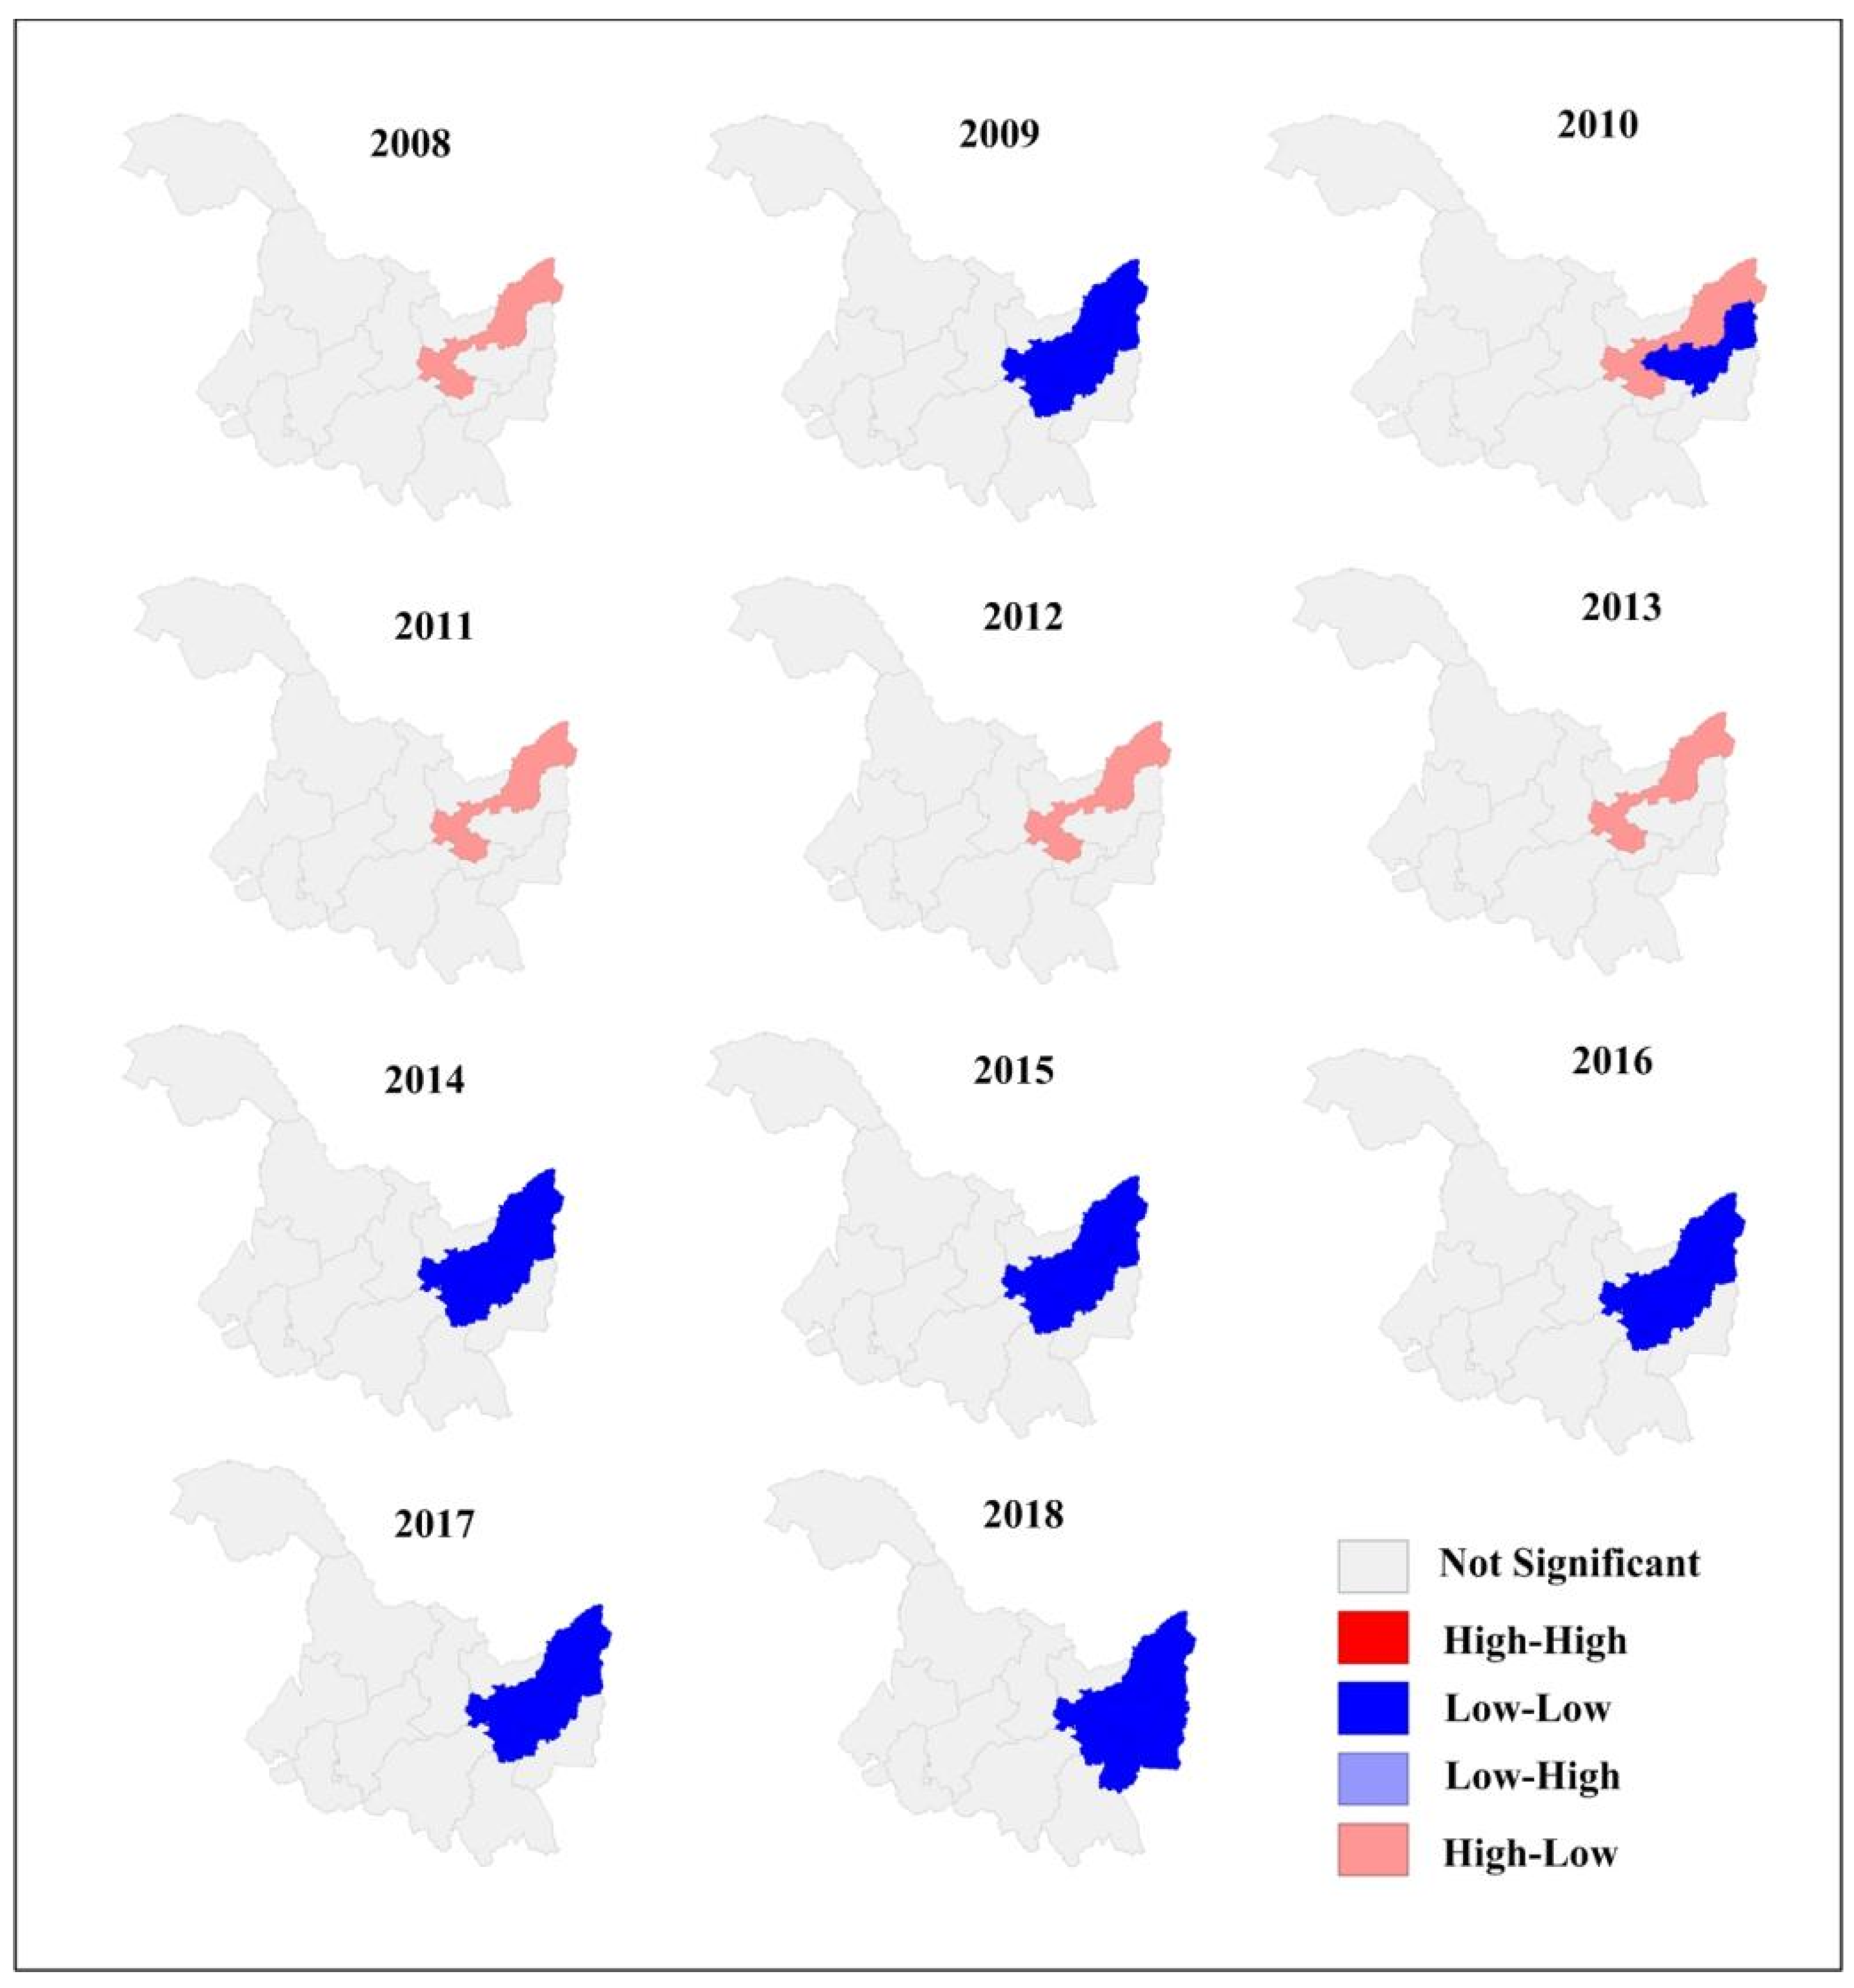
Based on the local Moran’s I index, the spatial agglomeration map of the agricultural water and land resources matching coefficient in Heilongjiang Province was drawn (Figure 8).
The results show that the local spatial agglomeration of the agricultural water and land resources matching coefficients from 2008 to 2018 were primarily high–low (HL) and low–low (LL) agglomerations. The increase in the number of agglomeration areas indicates that the spatial agglomeration of agricultural water resources and land resources matching in Heilongjiang Province is enhanced.
5. Discussion
Currently, most studies that characterize water resources utilize the total amount of water resources [26], irrigation water consumption [29], the available amount of water resources [30] or the blue–green amount of water [14]. However, with the development of agriculture, the use of chemical fertilizer is increasing, and the water resources are becoming polluted to some extent. In this study, the gray water footprint was introduced to study the matching of water and land resources. Not only were the agricultural irrigation water and the effective precipitation absorbed by crops considered, but also the freshwater resources used to dilute pollutants and enable the water quality to meet the standard are included in the water resources from the aspect of environmental protection.
In order to analyze whether it is reasonable to use the total water footprint as the characterization parameter of water resources, the equivalent coefficient method based on agricultural water consumption is used to verify it. The methods for calculation are as follows:
where I is the equivalent coefficient of agricultural water and land resources; Wa is the agricultural water consumption, m3; Lc is the area of cultivated land, hm2; Wt is the total amount of regional water resources, m3, and Lt is the total land area, km2. I > 1 indicates the urgency of water shortage will be higher, and I < 1 indicates that cultivated land resources are in a state of shortage compared with water resources.
The equivalent coefficient of agricultural water and land resources in Heilongjiang Province is 1.08, close to 1, reflecting the relative balance of agricultural water resources and land resources in Heilongjiang Province. The results of the equivalent coefficient model are basically consistent with those of the Gini coefficient model, indicating that it is scientific and reasonable to use the total water footprint as the characteristic parameter of water resources.
Hou et al. took the proportion of agricultural water consumption to calculate the agricultural water and land resources matching coefficient [31], the average matching coefficient from 2009 to 2018 in Heilongjiang Province was 3820 m3/hm2, and the average matching coefficients in the current study from 2009 to 2018 in Heilongjiang were 3548 m3/hm2. The statistics on agricultural water consumption include a portion of losses during water delivery, which cannot accurately reflect the actual water consumption of crop production. The agricultural water and land resources matching method from the perspective of the total water footprint takes into account the impact of crop types and climatic conditions on agricultural water and land resources matching patterns, and can express the actual situation of water consumption in agricultural production more accurately.
It should also be noted that Cao et al. pointed out that calculating total water footprint lacking field observations may be affected by the accuracy of certain parameters and the resulting uncertainty in essential assumptions [32], and the calculation of gray water footprint focuses on nitrogen loss only and failing to consider other pollution sources and water treatment in the proposed methodology. Therefore, the calculation of total water footprint from reliable measurements can be undertaken if possible. At the same time, measures such as strengthening the construction of water conservancy facilities, restricting and regulating the use of pesticides, and improving the efficiency of water resources should also be adopted.
6. Conclusions
The results of the Gini coefficient model indicated that the agricultural water and land resources in Heilongjiang Province matches well. The matching degree of agricultural water and land resources in different regions of Heilongjiang Province exhibited a fluctuating variation and increased gradually from the northeast to the southwest. Based on Moran’s I index, the matching coefficient of agricultural water and land resources in Heilongjiang Province has significant spatial correlation.
The results of equivalent coefficient model were consistent with the results of the Gini coefficient model, which demonstrated that using the total water footprint as the characteristic parameter of water resources is scientific and reasonable.
In order to reduce the impact of HWT and improve the utilization efficiency of chemical fertilizers, some measures, such as enhancing the farmers’ consciousness of scientific fertilization and accurate application of fertilizer based on planting crops, need to be adopted.
Author Contributions
Data collection, D.Z., Y.Z. and X.M.; writing—original draft preparation, D.Z.; writing—review and editing, D.Z., X.C. and Y.H.; funding support, Y.H. All authors have read and agreed to the published version of the manuscript.
Funding
This study is supported by the Chinese Natural Science Foundation (11802057).
Institutional Review Board Statement
Not applicable.
Informed Consent Statement
Not applicable.
Data Availability Statement
The data presented in this study are available on request from the corresponding author. The data are not publicly available due to privacy restriction.
Acknowledgments
The authors are extremely grateful to the editor and the anonymous reviewers for their insightful comments and suggestions.
Conflicts of Interest
The authors declare no conflict of interest.
References
- Makowski, D.; Hendrix, E.; Ittersum, M.; Rossing, W. A framework to study nearly optimal solutions of linear programming models developed for agricultural land use exploration. Ecol. Model. 2000, 131, 65–77. [Google Scholar] [CrossRef] [Green Version]
- Guo, R.Z.; Yang, M.H.; Shen, H.J. Evaluation for Ecological Security of Cultivated Land in Chang-Zhu-Tan Region. Trans. Chin. Soc. Agric. Mach. 2016, 47, 193–201. (In Chinese) [Google Scholar]
- Feng, M.Z.; Yang, Y.Z. Study on the Balance of Agricultural Water and Land Resources in Ningxia Plain. J. Arid. Land Resour. Environ. 2007, 21, 60–65. (In Chinese) [Google Scholar]
- Li, N.N.; Zhao, Y.S.; Zhu, L.J. The Present Management Situation, Difficulties and Countermeasures of Soil and Water Loss for Black Land in Heilongjiang Province. J. Agric. Mech. Res. 2015, 37, 259–263. (In Chinese) [Google Scholar]
- Li, H.; Zhou, W.B.; Zhuang, Y.; Ma, C.; Liu, B.Y. Agricultural water and soil resources matching patterns and carrying capacity in Yan’an City. Trans. CSAE 2016, 32, 156–162. (In Chinese) [Google Scholar]
- Wang, W.; Lv, N.J.; Wang, X.; Li, S. Study on spatial matching pattern of water and soil resources in Yellow River delta. J. Water Resour. Water Eng. 2014, 5, 66–70. (In Chinese) [Google Scholar]
- Zheng, J.Y.; Zhao, X.N.; Cao, X.C.; Sun, S.K.; Zhang, L.L. Study on spatiotemporal matching pattern of agricultural water and land resources in Hetao Irrigation District. Resour. Soil Water Conserv. 2015, 22, 13–136. (In Chinese) [Google Scholar]
- Hoekstra, A.; Hung, P.Q. Virtual water trade: A quantification of virtual water flows between nations in relation to international crop trade. Water Sci. Technol. 2002, 49, 203–209. [Google Scholar]
- Qin, Y.Q. Study on Matching of Agricultural Land and Water Resources in Henan Province from the Perspective of Water Footprint; Henan Polytechnic University: Jiaozuo, China, 2019. (In Chinese) [Google Scholar]
- Liu, G.P.; Zhou, Y.C.; Fang, Y.; Shang, Q.; Chen, J. Status of agricultural pollution in China and contermeasures. Stud. Int. Technol. Econ. 2006, 9, 17–21. (In Chinese) [Google Scholar]
- Jiang, B.; Han, Z.; Zhang, W.X. Discussion on Water Pollution Prevention of Agricultural Source and Living Sources in Heilongjiang Province. Environ. Sci. Manag. 2020, 45, 22–25. (In Chinese) [Google Scholar]
- Oki, T.; Kanae, S. Virtual water trade and world water resources. Water Sci. Technol. 2004, 49, 203–209. [Google Scholar] [CrossRef] [PubMed]
- Hoekstra, A.Y.; Chapagain, A.K. Water footprints of nations: Water use by people as a function of their consumption pattern. Water Resour. Manag. 2007, 21, 35–48. [Google Scholar] [CrossRef]
- Liu, D.; Liu, C.L.; Fu, Q.; Li, M.; Cui, S. Construction and application of a refined index for measuring the regional matching characteristics between water and land resources. Ecol. Indic. 2018, 91, 203–211. [Google Scholar] [CrossRef]
- Cao, Y.Q.; Zhang, R.N.; Feng, X.X. Matching characteristics of agricultural soil and water resources in Liaoning province based on spring corn water footprint. J. China Inst. Water Resour. Hydropower Res. 2021. (In Chinese) [Google Scholar] [CrossRef]
- Fan, H.L.; Fu, W.G. Analysis of water and soil resources matching and agricultural economic growth in china from the percepective of water footprint—Taking the Yangtze River economic belt as an example. Chin. J. Agric. Resour. Reg. Plan. 2020, 41, 198–203. (In Chinese) [Google Scholar]
- Allan, J.A. Fortunately there are substitutes for water: Otherwise our hydro-political futures would be impossible. Priorities Water Resour. Alloc. Manag. 1993, 26, 13–26. [Google Scholar]
- Hoekstra, A.Y. Virtual Water Trade: Proceedings of the International Expert Meeting on Virtual Water Trade; IHE: Delft, The Netherlands, 2003. [Google Scholar]
- Sun, S.K.; Wang, Y.B.; Liu, J.; Wu, P.T. Quantification and Evaluation of water footprint of major grain crops in China. J. Hydraul. Eng. 2016, 47, 1115–1124. (In Chinese) [Google Scholar]
- Wu, P.T.; Sun, S.K.; Wang, Y.B.; Li, X.L.; Zhao, X.N. Research on the quantification methods for water footprint of crop production. J. Hydraul. Eng. 2017, 48, 651–660, 669. [Google Scholar]
- Li, Y.; Mao, S.F.; Zhang, Y. Virtual water value of main agricultural products in Heilongjiang Province based on virtual water theory. J. Anhui Agric. Sci. 2016, 44, 244–247. (In Chinese) [Google Scholar]
- Fu, Y.H.; Liu, L.M.; Qi, X.X.; Yuan, C.C.; Liu, S.J. Environmental effects evaluation for grain production based on grey water footprint in Dongting Lake area. Trans. Chin. Soc. Agric. Eng. 2015, 31, 152–160. (In Chinese) [Google Scholar]
- Hui, X.; Chen, X.N.; Song, J.F. Assessing crop production eco-efficiency based on water footprint: The case of Shanxi Province. Acta Ecol. Sin. 2021, 41, 3078–3091. (In Chinese) [Google Scholar]
- Mekonnen, M.M.; Hoekstra, A.Y. The green, blue and gray water footprint of crops and derived crop products. Hydrol. Earth Syst. Sci. Discuss. 2011, 15, 1577–1600. [Google Scholar] [CrossRef] [Green Version]
- Gini, C. Measurement of Inequality of Income. J. Econ. Theory Econom. 1921, 31, 124–126. [Google Scholar] [CrossRef]
- Jiang, Q.X.; Li, X.Y.; Wang, Z.L.; Wu, X.Y.; Cao, L. Spatio-temporal distribution of agricultural water footprint and analysis of water use efficiency in Heilongjiang Province. J. Northeast. Agric. Univ. 2020, 51, 87–96. (In Chinese) [Google Scholar]
- Li, X.Y.; Hao, J.M.; Chen, A.Q. Time-space matching pattern and evaluation of agricultural water and soil resources in Shandong Province. J. China Agric. Univ. 2020, 25, 1–11. (In Chinese) [Google Scholar]
- Yuan, Y.; Cave, M.; Zhang, C. Using local Moran’s I to identify contamination hotspots of rare earth elements in urban soils of London. Appl. Geochem. 2017, 88, 167–178. [Google Scholar] [CrossRef]
- Sun, Z.; Jia, S.F.; Yan, J.B.; Zhu, W.B.; Liang, Y. Study on the Matching Pattern of Water and Potential Arable Land Resources in China. J. Nat. Resour. 2018, 33, 2057–2066. (In Chinese) [Google Scholar]
- Du, J.; Yang, Z.; Wang, H.; Yang, G.Y.; Li, S.Y. Spatial-Temporal Matching Characteristics between Agricultural Water and Land Resources in Ningxia, Northwest China. Water 2019, 11, 1460. [Google Scholar] [CrossRef] [Green Version]
- Hou, S.T.; Yuan, W.H.; Chen, J.L.; Wang, S.; Chen, Y.Q.; Li, Q.F. Matching Pattern and Regional Regulation of Agricultural Water and Land Resources in Heilongjiang Province. Bull. Soil Water Conserv. 2021. (In Chinese) [Google Scholar] [CrossRef]
- Cao, X.C.; Wu, M.Y.; Shu, R.; Zhuo, L.; Chen, D.; Shao, G.C.; Guo, X.P.; Wang, W.G.; Tang, S.H. Water footprint assessment for crop production based on field measurements: A case study of irrigated paddy rice in East China. Sci. Total Environ. 2017, 610, 84–93. [Google Scholar]
Figure 1.
The location of Heilongjiang Province in China.

Figure 2.
Results of the calculation of water footprint of Heilongjiang Province. (a) blue water footprint; (b) green water footprint; (c) gray water footprint; (d) total water footprint.
Figure 2.
Results of the calculation of water footprint of Heilongjiang Province. (a) blue water footprint; (b) green water footprint; (c) gray water footprint; (d) total water footprint.


Figure 3.
Spatial distribution map of water footprint and land resources (a) the proportions of blue water footprint, green water footprint and gray water footprint; (b) the spatial distribution of land resources in Heilongjiang Province.
Figure 3.
Spatial distribution map of water footprint and land resources (a) the proportions of blue water footprint, green water footprint and gray water footprint; (b) the spatial distribution of land resources in Heilongjiang Province.

Figure 4.
Proportion of crop yield in Heilongjiang Province.

Figure 5.
The variation curve of the Gini coefficient for agricultural water and land resources.

Figure 6.
The agricultural water and land resources matching coefficient and its changing trend in Heilongjiang Province from 2008 to 2018.
Figure 6.
The agricultural water and land resources matching coefficient and its changing trend in Heilongjiang Province from 2008 to 2018.

Figure 7.
Matching pattern of agricultural water and land resources in different regions.

Figure 8.
The local aggregation map of the agricultural water and land resources matching coefficient in Heilongjiang Province.
Figure 8.
The local aggregation map of the agricultural water and land resources matching coefficient in Heilongjiang Province.


Table 1.
Grain crop growth period.
| Crop | Start and End Date | Average Growth Period |
|---|---|---|
| Rice | 5.15~9.20 | 127 |
| Corn | 5.15~9.15 | 122 |
| Soybean | 5.20~9.25 | 127 |
Table 2.
Grain crop coefficient Kc.
| Month | Rice | Corn | Soybean |
|---|---|---|---|
| 5 | 0.85 | 0.47 | 0.45 |
| 6 | 1.33 | 0.95 | 0.89 |
| 7 | 1.48 | 1.15 | 1.1 |
| 8 | 1.36 | 1.10 | 0.92 |
| 9 | 0.95 | 0.57 | 0.55 |
| average | 1.31 | 0.90 | 0.85 |
Table 3.
Gini coefficient of agricultural water and land resources from 2008 to 2018.
| 2008 | 2009 | 2010 | 2011 | 2012 | 2013 | 2014 | 2015 | 2016 | 2017 | 2018 | |
|---|---|---|---|---|---|---|---|---|---|---|---|
| G | 0.2920 | 0.1658 | 0.0902 | 0.2084 | 0.2246 | 0.2062 | 0.1590 | 0.0382 | 0.2144 | 0.2402 | 0.0806 |
Table 4.
Correspondence between the Gini coefficient and evaluation results.
| Gini Coefficient | <0.2 | 0.2–0.3 | 0.3–0.4 | 0.4–0.5 | >0.5 |
|---|---|---|---|---|---|
| Evaluation result | Complete equilibrium | More balanced | Relative equilibrium | Less balanced | Seriously unbalanced |
Table 5.
The fitting line equation of matching coefficients of agricultural water and land resources.
Table 5.
The fitting line equation of matching coefficients of agricultural water and land resources.
| Regions | Slope | Intercept | R2 |
|---|---|---|---|
| Harbin | 0.0026 | −4.8634 | 0.1433 |
| Qiqihar | 0.0052 | −10.053 | 0.3819 |
| Jixi | 0.0039 | −7.6980 | 0.3309 |
| Hegang | 0.0020 | −3.8399 | 0.0412 |
| Shuangyashan | −0.0001 | 0.3938 | 0.0012 |
| Daqing | 0.0050 | −9.5914 | 0.1275 |
| Yichun | 0.0064 | −12.520 | 0.4398 |
| Jiamusi | 0.0001 | 0.1418 | 0.0002 |
| Qitaihe | 0.0056 | −11.028 | 0.6294 |
| Mudanjiang | 0.0070 | −13.866 | 0.5126 |
| Heihe | 0.0076 | −15.031 | 0.4593 |
| Suihua | 0.0031 | −5.7418 | 0.1953 |
| Daxing’anling | 0.0266 | −52.864 | 0.4548 |
Table 6.
Global Moran’s I index of agricultural water and land resources matching in Heilongjiang Province from 2008 to 2018.
Table 6.
Global Moran’s I index of agricultural water and land resources matching in Heilongjiang Province from 2008 to 2018.
| Year | Moran’s I | z | p | Year | Moran’s I | z | p |
|---|---|---|---|---|---|---|---|
| 2008 | 0.1989 | 1.9849 | 0.045 | 2014 | 0.1543 | 2.3260 | 0.015 |
| 2009 | 0.2577 | 2.6358 | 0.015 | 2015 | 0.1965 | 2.3541 | 0.020 |
| 2010 | 0.1897 | 2.1873 | 0.023 | 2016 | 0.1877 | 2.4653 | 0.013 |
| 2011 | 0.1552 | 2.0027 | 0.036 | 2017 | 0.2143 | 2.4623 | 0.017 |
| 2012 | 0.1327 | 1.8436 | 0.047 | 2018 | 0.1966 | 2.6456 | 0.010 |
| 2013 | 0.1135 | 1.8220 | 0.041 |
Publisher’s Note: MDPI stays neutral with regard to jurisdictional claims in published maps and institutional affiliations. |
© 2022 by the authors. Licensee MDPI, Basel, Switzerland. This article is an open access article distributed under the terms and conditions of the Creative Commons Attribution (CC BY) license (https://creativecommons.org/licenses/by/4.0/).
Share and Cite
MDPI and ACS Style
Zhao, D.; Chen, X.; Han, Y.; Zhao, Y.; Men, X. Study on the Matching Method of Agricultural Water and Land Resources from the Perspective of Total Water Footprint. Water 2022, 14, 1120. https://doi.org/10.3390/w14071120
AMA Style
Zhao D, Chen X, Han Y, Zhao Y, Men X. Study on the Matching Method of Agricultural Water and Land Resources from the Perspective of Total Water Footprint. Water. 2022; 14(7):1120. https://doi.org/10.3390/w14071120
Chicago/Turabian StyleZhao, Dan, Xiangwei Chen, Yanlong Han, Yikai Zhao, and Xiuli Men. 2022. "Study on the Matching Method of Agricultural Water and Land Resources from the Perspective of Total Water Footprint" Water 14, no. 7: 1120. https://doi.org/10.3390/w14071120
Note that from the first issue of 2016, this journal uses article numbers instead of page numbers. See further details here.