
A Study on the Determination Methods of Monitoring Point for Inundation Damage in Urban Area Using UAV and Hydrological Modeling


1
Department of Civil Engineering and Landscape Architectural, Daegu Technical University, Daegu 42734, Korea
2
Department of Aeronautics and Civil Engineering, Hanseo University, Seosan 31962, Korea
3
Department of Urban and Environmental and Disaster Management, Graduated School of Prevention, Kangwon National University, Chuncheon-si 25913, Korea
*
Author to whom correspondence should be addressed.
Water 2022, 14(7), 1117; https://doi.org/10.3390/w14071117
Submission received: 16 February 2022
/
Revised: 25 March 2022
/
Accepted: 29 March 2022
/
Published: 31 March 2022
(This article belongs to the Special Issue Hydrological Modelling and Hydrometeorological Extreme Prediction)
Abstract
:Recently, unmanned aerial vehicles (UAVs) have been used in various fields, such as military, logistics, transportation, construction, and agriculture, making it possible to apply the limited activities of humans to various and wide ranges. In addition, UAVs have been utilized to construct topographic data that are more precise than existing satellite images or cadastral maps. In this study, a monitoring point for preventing flood damage in an urban area was selected using a UAV. In addition, the topographic data were constructed using a UAV, and the flow of rainwater was examined using the watershed analysis in an urban area. An orthomosaic, a digital surface model (DSM), and a three-dimensional (3D) model were constructed for the topographic data, and a precision of 0.051 m based on the root mean square error (RMSE) was achieved through the observation of ground control points (GCPs). On the other hand, for the watershed analysis in the urban area, the point in which the flow of rainwater converged was analyzed by adjusting the thresholds. A monitoring point for preventing flood damage was proposed by examining the topographic characteristics of the target area related to the inflow of rainwater.
1. Introduction
Unmanned aerial vehicles (UAVs) have been rapidly developed and integrated in several areas, including civil engineering, agriculture, disasters, and logistics, due to the advancement of technologies [1]. In addition, autonomous UAV flights can be performed without human control, and UAVs can provide images with high spatial and temporal resolution. It is possible to implement precise orthomosaics and high-resolution three-dimensional (3D) models using the aerial photos taken by RGB, multi-spectral, thermal imaging, and light detection ranging (LiDAR) cameras by employing a software built with data collection and image processing technologies [2,3,4,5,6,7,8,9].
High-resolution 3D models based on UAVs extract points, representing the characteristics of overlapping images, can generate 3D points for each pixel and analyze topographic characteristics, which are used to produce orthomosaics, digital surface models (DSMs), and 3D models. In addition, these characteristics are employed to obtain high-precision topographic data using the ground control point (GCP) calibration. The root mean square error (RMSE) for the GCPs and 3D points are analyzed to obtain the accuracy of the topographic data. Moreover, DSM can identify the characteristics of the target area, such as topography, slope, altitude, and buildings, can be used to construct various infrastructures by creating 3D models, and can be employed for a multitude of applications, such as topographic surveying, monitoring, and watershed classification.
In the past, monitoring of urban areas was used to observe various pollutants, survey road traffic, and measure water levels for disaster reduction. Various surveillance and monitoring plans use UAVs due to the continuous advancement of smart cities in connection with the Internet of Things (IoT) [10]. The utilization of UAVs in smart cities includes standardization measures, which are extended to network communication infrastructures, surveillance, and monitoring [11,12].
1.1. Relative Work
In various fields, studies have been conducted to construct topographic data and improve the accuracy of UAVs. In many studies that used UAVs, image mapping of aerial photos was analyzed using software. Orthomosaics, DSMs, 3D models, mesh models, and point clouds were presented as the analysis results, and methods for setting and applying analysis methodologies were proposed [13,14,15,16,17,18,19]. Image mapping constructed topographic data using software, such as Pix4D Mapper, Photoscan, and ContextCapture, and presented the advantages and drawbacks of the analysis speed and measurement accuracy [15,20,21,22]. In particular, PhotoScan has a high processing speed and work convenience, while Pix4D Mapper facilitates data extraction with high accuracy of the topographic data [23,24,25,26].
Accuracy evaluations and applications of topographic data based on the parameter adjustment was also conducted for investigating the operation method and flight characteristics of UAVs. The topographic data were constructed by considering the UAV type, flight height, and camera performance, and accuracy was evaluated based on the parameter adjustment to propose the optimal flight plan [27,28,29]. In addition, they were calibrated using GCPs to improve the accuracy of the topographic data. An accuracy of 2 to 10 cm was secured after calibration, while an accuracy of approximately 20 cm was observed before calibrating topographic data using GCPs, making it possible to construct more precise topographic data [30,31,32]. Moreover, studies related to the construction and accuracy of topographic data have been conducted for target areas, such as cities, wetlands, mountains, vegetation, orchards, and rivers [33,34,35,36,37].
The construction of the topographic data using UAVs has been used in various areas, and it is necessary to apply an analysis method suitable for this purpose. This study attempted to apply a research method that uses a real-time kinematic (RTK)-compatible UAV, an RGB camera, and GCP surveying as a method for constructing the topographic data of an urban area.
Monitoring is utilized to observe, control, and verify phenomena that occur in various areas. Monitoring of urban areas has been performed for the purposes of observation and verification to prevent and respond to disasters in areas such as the atmosphere, rivers, and facilities. Moreover, the influence of land use, landscape patterns, and altitude on air pollution was quantified in Hong Kong [38,39,40,41,42,43]. In addition, monitoring methods for outdoor exposure and indoor penetration of air pollution have been proposed [44,45,46,47]. The concentration of air pollution in urban areas varies depending on the altitude for up to 35 m, and the concentration and influence decrease as the particle size increases [48,49,50,51,52,53].
In a study on water pollution in rivers in urban areas, an economical sampling frequency for monitoring and a method of selecting parameters were presented [54]. In addition, the selection of optimal locations and the influence of sensors were proposed considering fixed or moving monitoring points [55,56,57,58]. The selection of monitoring points is an important element that determines the performance or quality of the observation data.
It is possible to measure related parameters if a network capable of identifying the observation elements of monitoring is set for each point [59,60,61,62]. There are no studies focusing on the methodology for selecting monitoring points, despite a number of investigations involving urban area monitoring. In most studies, the monitoring points were set based on the empirical knowledge, and optimal points that can acquire various parameters were selected. In this study, a hydrological analysis method was applied to select the monitoring points.
The construction of precise topographic data using UAV was carried out by flooding, flood simulation, and flood mapping. That built a DSM using UAV and applied a simple flood fill operation to floodplain areas to evaluate the reliability of flood map creation [63,64]. In other studies, actual flood phenomena and flood modeling using DSM were reproduced, and limitations to be considered, such as trees and stones located near rivers, were suggested [65,66,67]. A comparison of DEM accuracy analysis, landslide, and flood simulation results among a UAV-derived DEM and global DEM products (GDEM2, AW3D30, and SRTM) was performed [68]. In some studies, DSM was constructed using LiDAR, and the limitation of resolution was suggested by the verification of topographic data after flood damage and the difference in altitude [69].
Flood damage research using UAV analyzed the extent of flood and the accuracy of flood modeling through the construction of topographical data, and suggested limitations. Most studies have been conducted to predict or verify flood damage, but research on flood damage prevention is insufficient. In addition, most of the target areas are rivers, and urban areas where major facilities are located in case of flood damage have not been studied.
1.2. Reseach Objective
In this study, we conducted a method for selecting monitoring points to prevent flood damage in urban areas using a UAV. Flood damages in urban areas occur because of the inability of pipes to drain as rainwater converges in low-lying areas. Most of the observation equipment to prevent flood damages in urban areas are installed and operated in areas where damage has occurred in the past. However, this equipment must be installed at the lowest points by distinguishing watersheds, where rainwater is introduced, and identifying the flow. Watersheds were distinguished by analyzing grids that are larger than 10 × 10 m or 30 × 30 m using a 1:5000 topographic map and STRM-1 for the construction of the topographic data before. Existing DEM can be used with one topographical altitude on a 10 m or 30 m grid. However, in order to select monitoring points, it is necessary to review the point where water flows from the basin by analyzing more precise topographical altitude. The use of UAVs makes it possible to construct high-definition DSMs with high precision and analyze watersheds.
The objectives of the article are as follows:
- (1)
- High-precision topographic data for an urban were constructed using a UAV, and the flow of rainwater in watersheds was analyzed.
- (2)
- Low-lying areas, where rainwater converged in the target area, were examined to select the optimal monitoring points for the installation of the observation equipment.
2. Materials and Methods
2.1. Analysis Method Using UAV
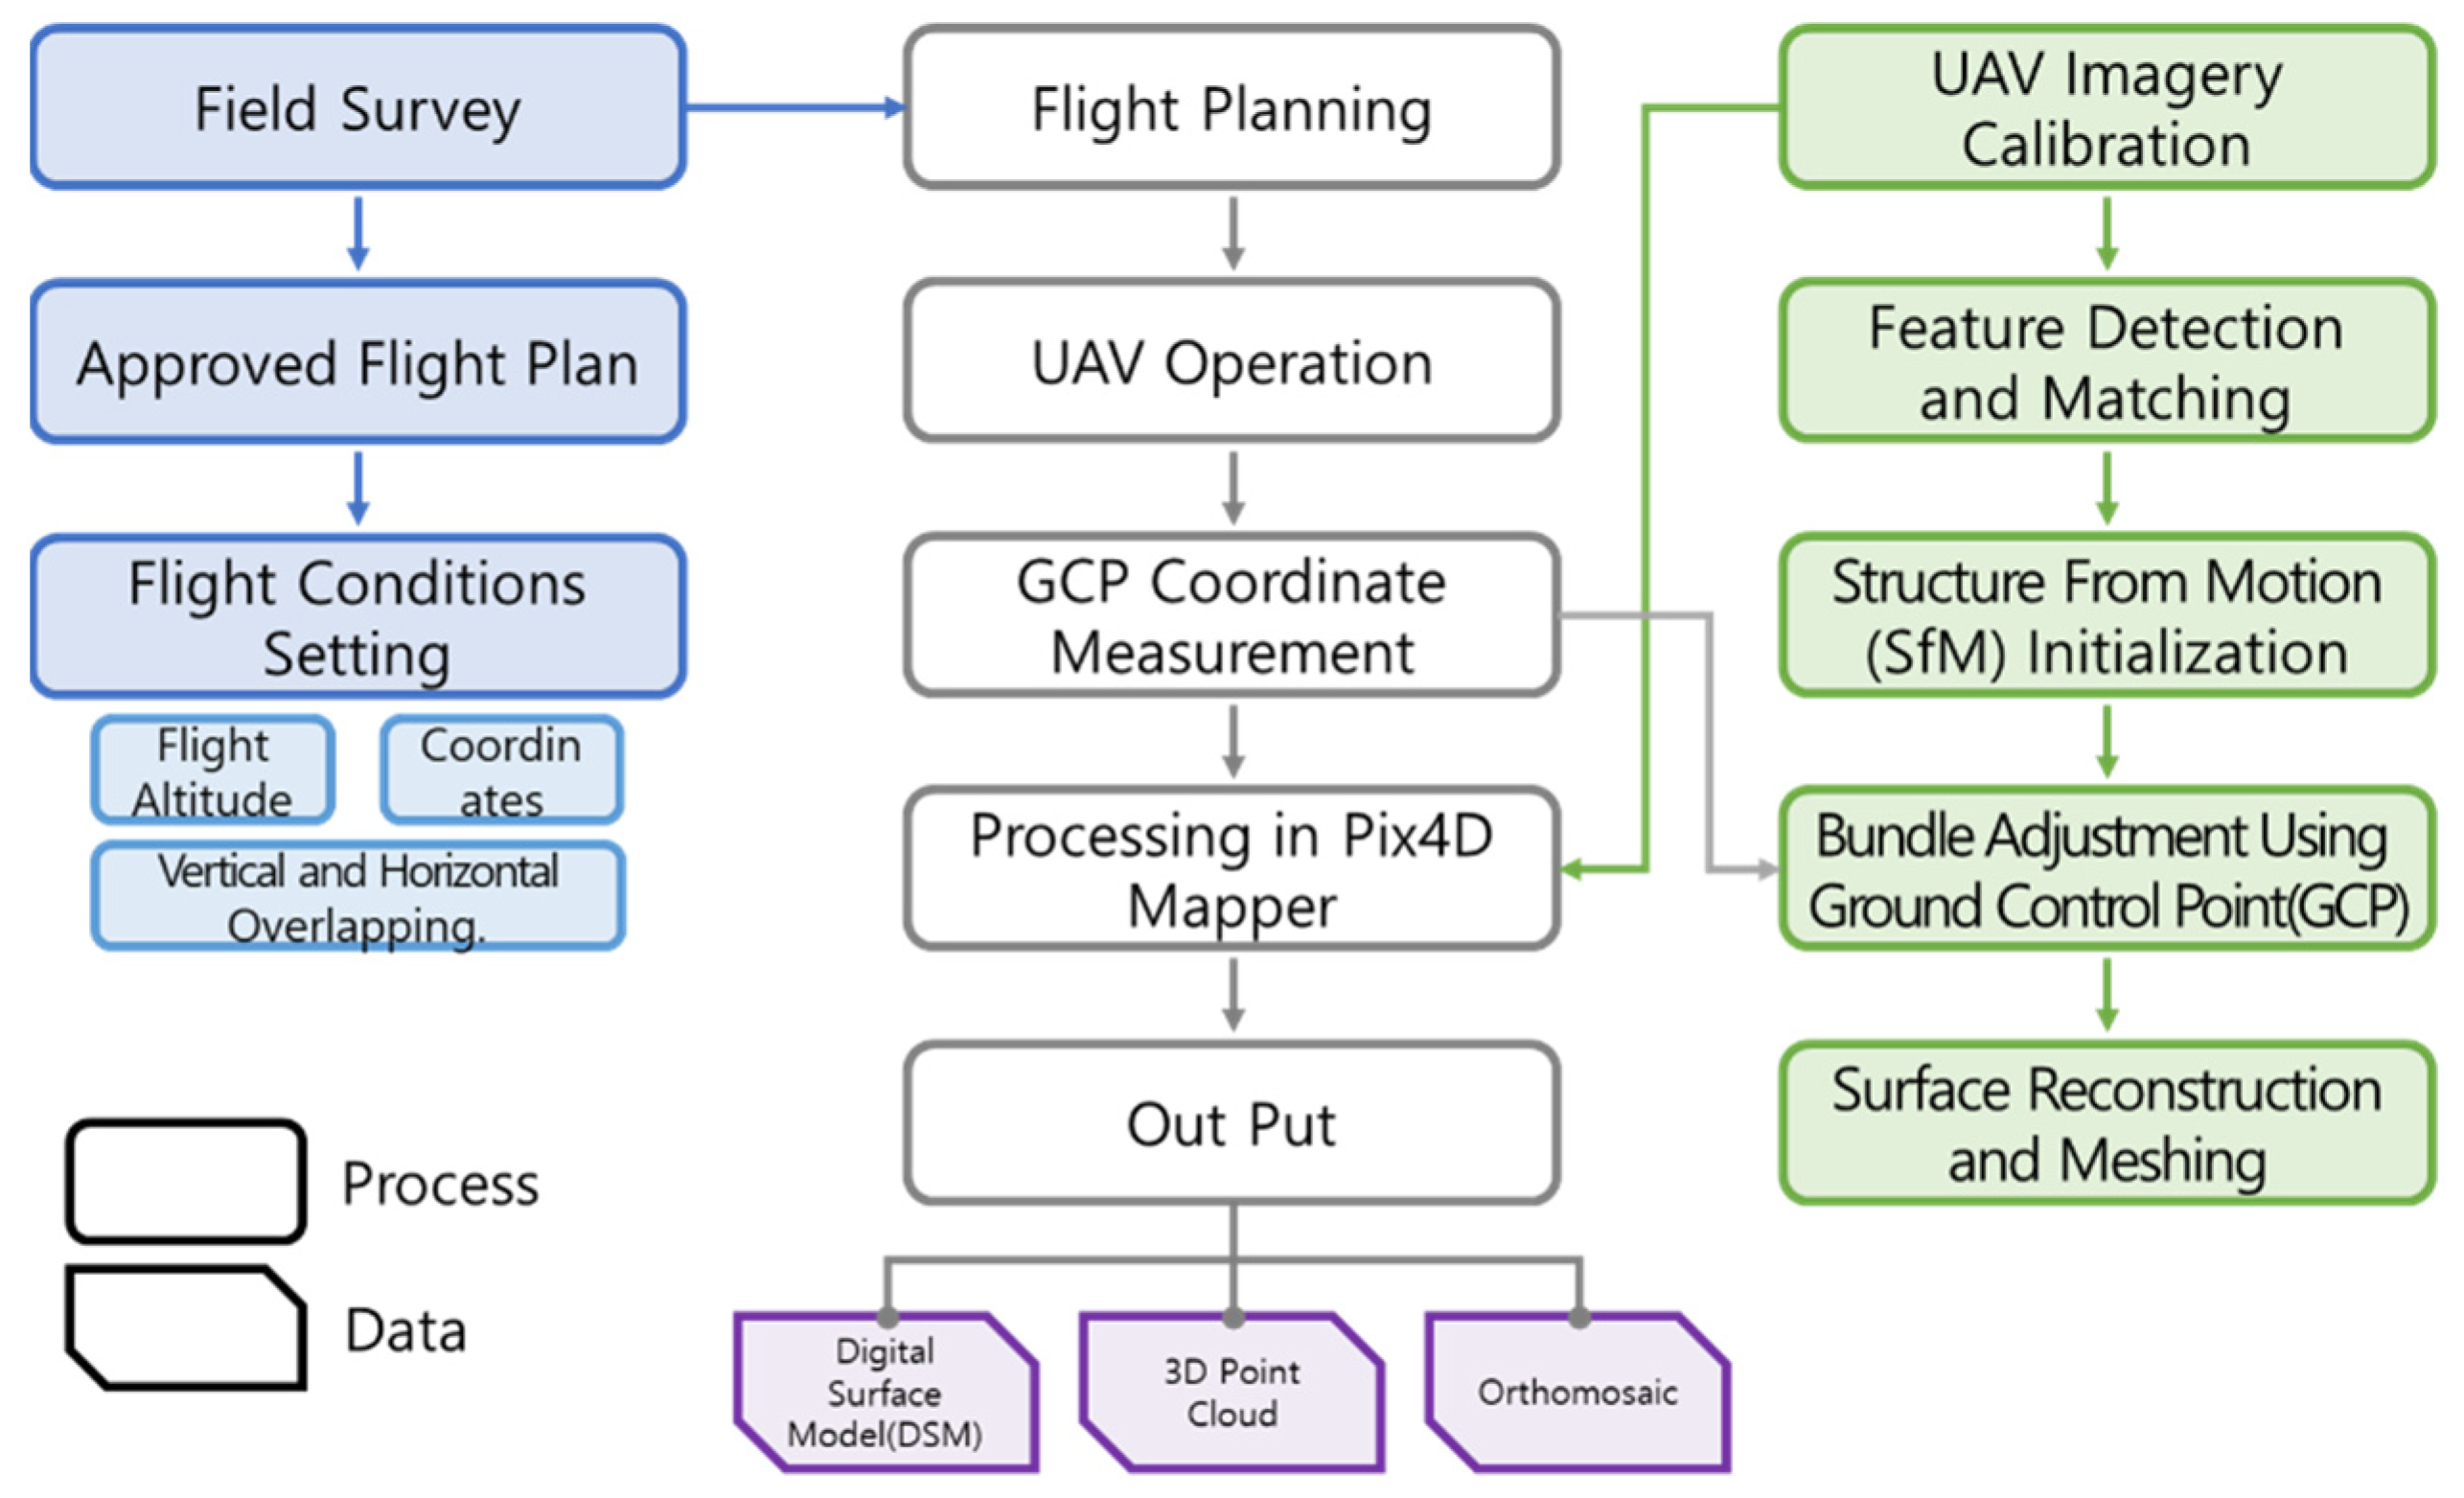
UAVs can produce high-resolution aerial images and image maps compared to satellite-obtained images for conventional aerial photos. In addition, UAVs have been utilized in various industrial areas in connection with technologies such as artificial intelligence (AI) and platforms. The precise aerial photography and the construction of topographic data are required for UAVs to be utilized in various areas. The process of constructing precise topographic data includes flight planning and analysis methods, aerial photography, image mapping, and topographic data calibration, as shown in Figure 1.
The analysis method that uses UAVs is performed in the following order: flight planning, UAV operation, GCP coordinate measurement, Pix4D Mapper processing, and output derivation. Flight planning considers the topographic characteristics, structure status, and weather conditions of the target area that were obtained through a field survey. After completing the field survey, the flight plan, which includes the flight period, flight range, and UAV type, is submitted for approval to the administrative agency. Finally, flight planning is completed by setting flight conditions, including the UAV flight altitude, coordinates, vertical and horizontal overlapping, and GCPs. GCPs are observed using the UAV operation in the target area and the global navigation satellite system (GNSS) based on the procedure of the flight plan. The aerial photos of the target area captured through the UAV operation were subjected to mapping analysis using Pix4D Mapper, which calibrates UAV images based on topographic coordinates. The calibrated images were matched and combined using the same images.
For the topographic data of images, a point cloud is generated through triangulation, and the initial settings for structure from motion (SfM) in the target area are analyzed. The topographic information of the point cloud in the X, Y, and Z directions reconstructed topographic information through bundle adjustment based on the observed GCPs. The reconstructed topographic information derives precise two-dimensional (2D) and 3D models by surface reconstruction and meshing in the target area. Moreover, the high-precision topographic data were constructed by aerial photography using UAV, aerial photo processing using Pix4D Mapper, and calibration using GCPs. Orthomosaics, DSMs, and 3D models are outputs of the analyzed topographic data. Furthermore, the topographic data, point cloud coordinates, and contour maps can be identified through various option settings.
2.2. Observation Equipment
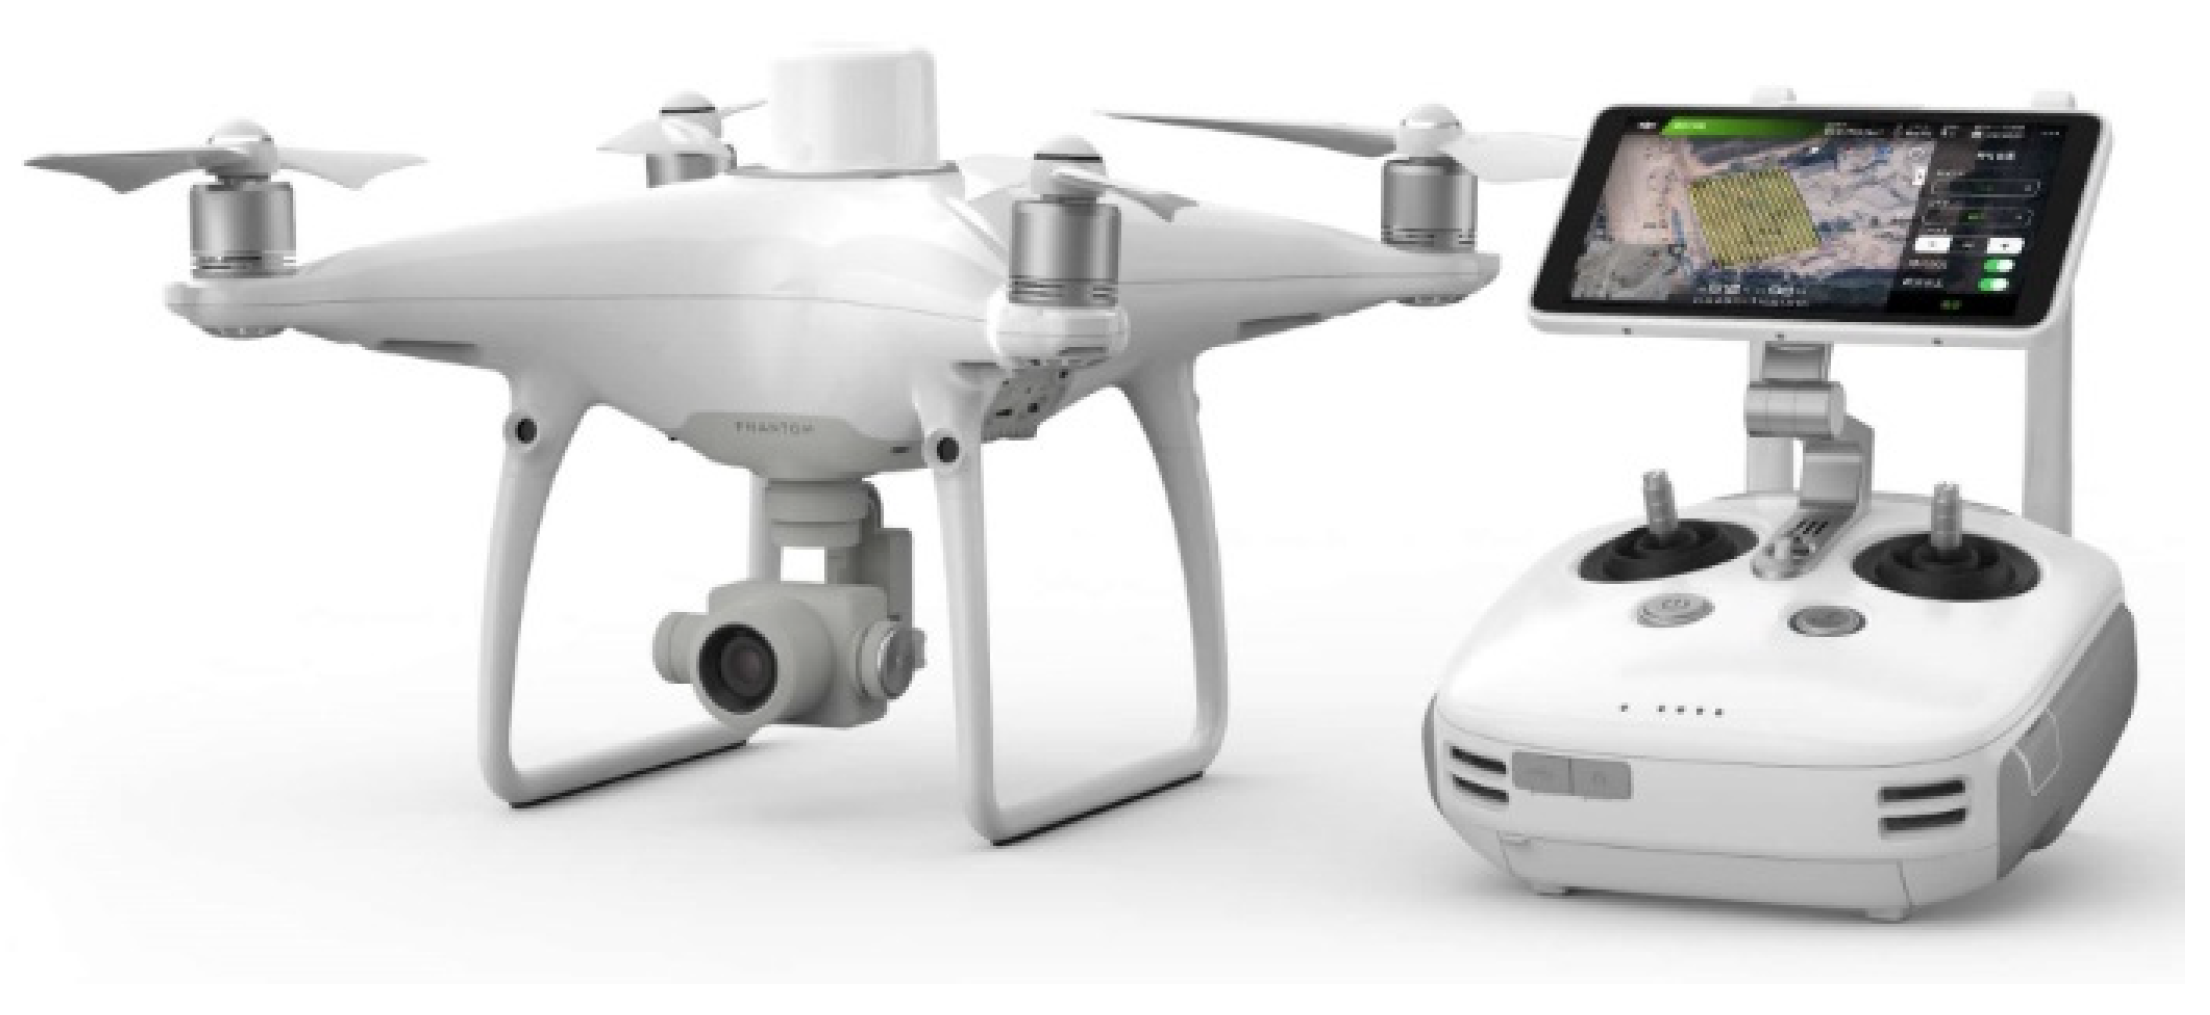
UAVs for aerial photography can be selected considering their weight, size, and performance depending on the purpose. UAVs that can consider camera image quality, topographic coordinate recognition, RTK, and safety are necessary to construct precise topographic data in consideration of topographic data, buildings, and infrastructure. In this study, we selected the Phantom 4 RTK from DJI as the UAV used for aerial photography, as shown in Figure 2. Phantom 4 RTK can perform mapping using automatic flight and capture images without distortion of the camera during the flight. Moreover, GPS can also be calibrated by receiving the location information of the virtual reference station (VRS) for hundreds of electronic reference points in real-time during aerial photography.
Phantom 4 RTK satisfies both performance and portability with a weight of 1.4 kg, a diagonal length of 35 cm, a field of view (FOV) of 8.8 mm, F2.8-11, and a flight time of approximately 30 min. In addition, Phantom 4 RTK can be operated in an area of approximately 30 ha or less, although the flight time varies depending on the altitude setting and mapping method. In addition, the camera lens enables high-resolution aerial photography since it has a focal length of 24 mm based on a 35 mm film camera. Table 1 lists the detailed specifications of the Phantom 4 RTK.
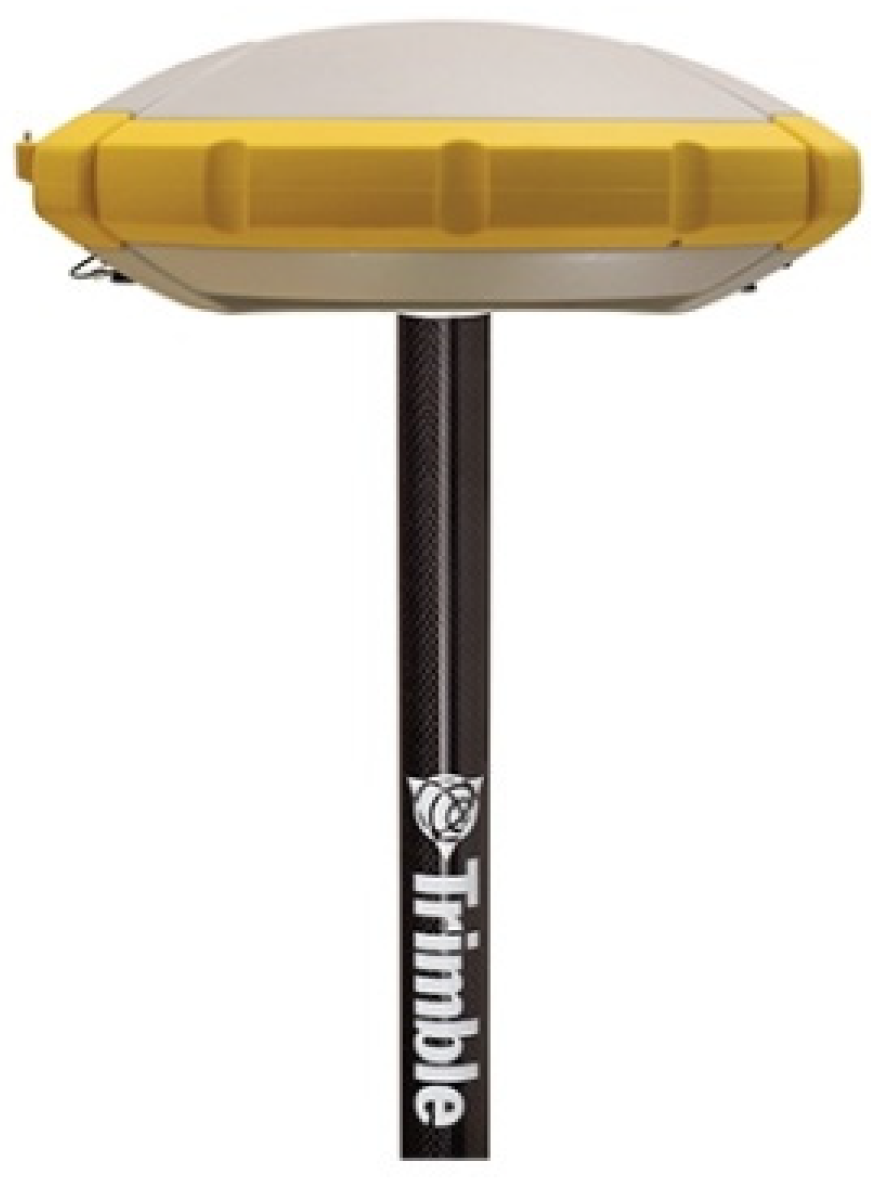
It is necessary to calibrate GCPs to reduce the errors that occur in aerial photography using UAVs. Although GCPs in the target area vary depending on the area, at least one or two points must be observed. GCP observation can be performed using various instruments. In this study, GNSS surveying, which provides information on the location, altitude, and velocity of ground objects, was conducted using satellites (i.e., Trimble R4s). It has 240 channels and secure high accuracy with an automatic calibration technique, as shown in Figure 3.
Trimble R4s can receive GNSS signals well in mountainous and urban areas with 240 channels. It enables precise measurement with a static positioning accuracy of approximately 3 mm and a VRS ranging from 8 to 15 mm. It has six input/output data types available, and the output of the results is possible through the USB and Bluetooth ports. Table 2 lists the detailed specifications of the Trimble R4s.
2.3. Software of Pix4D Mapper
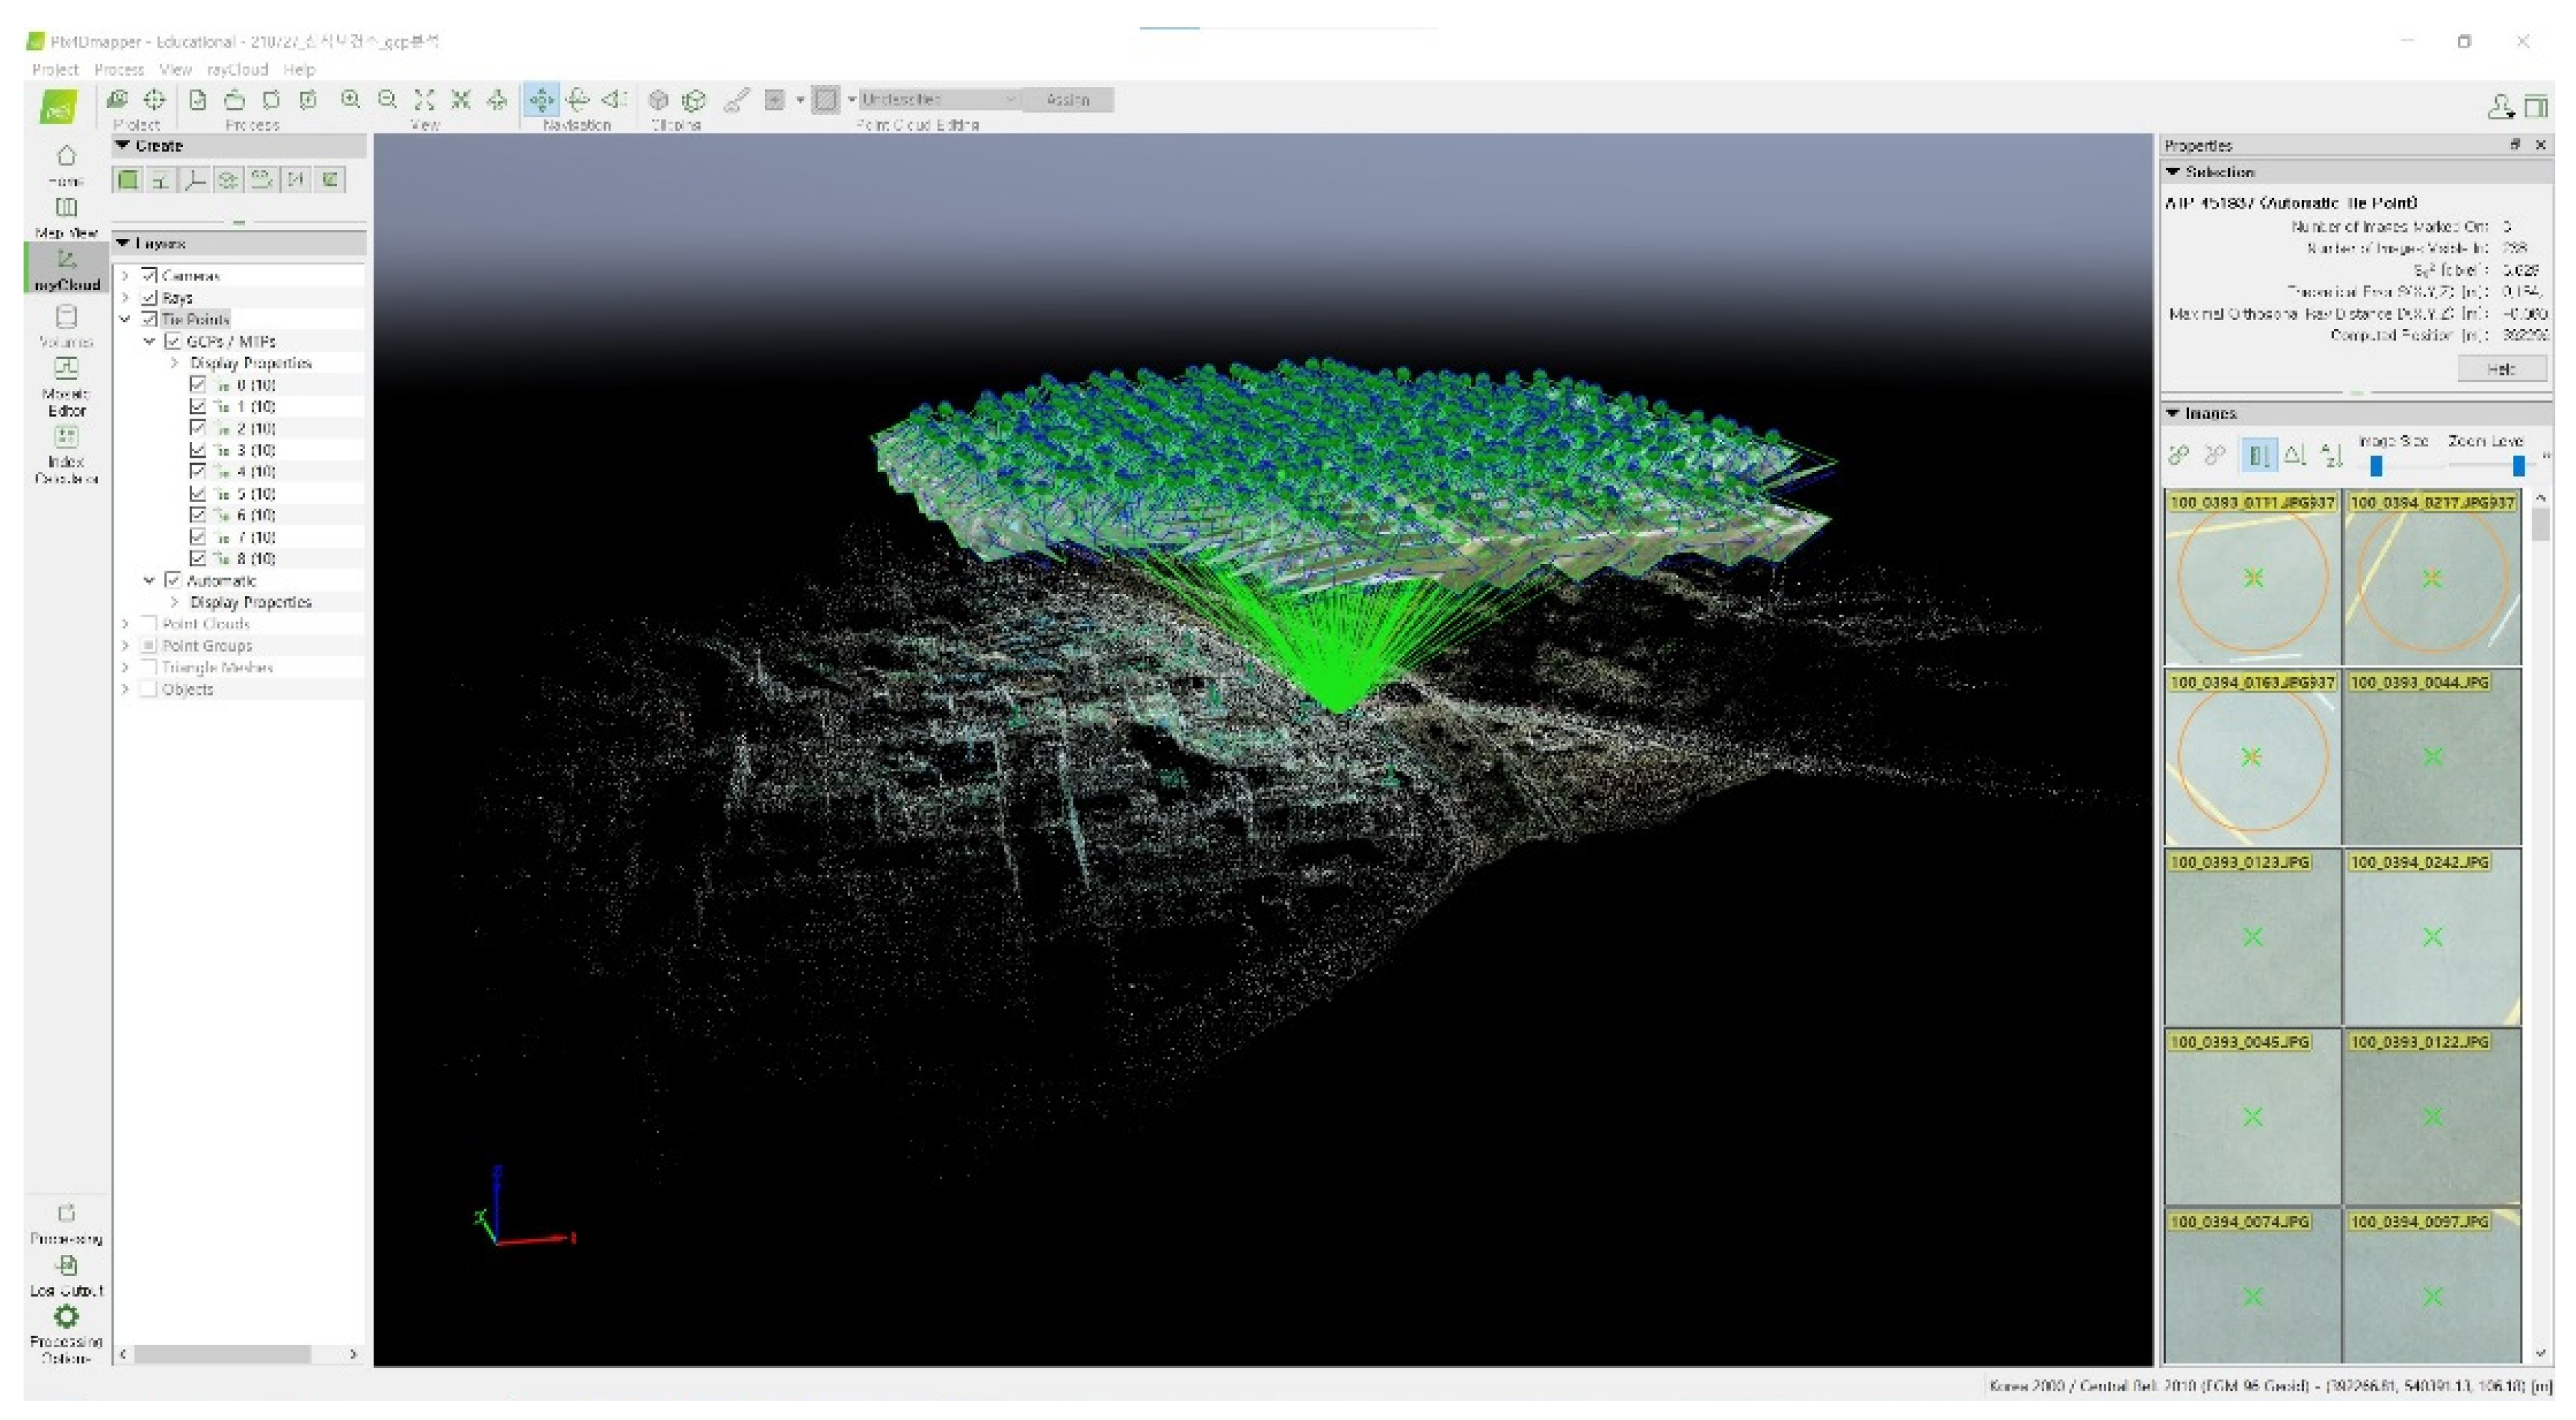
Aerial photography, which uses UAVs, aims to construct topographic data using precise images. There are several software that can be used to analyze aerial photos and images, including Pix4D Mapper, Photoscan, 3D Survey, DroneDeploy, and Drone2Map. Among them, the Pix4D Mapper has been most widely used to construct precise topographic data, as shown in Figure 4. It is a software for analyzing topographic data using images captured with UAVs or digital cameras, and is utilized in various fields, such as mining, agriculture, geodetic surveying, civil engineering, construction, disaster management, and emergency services.
Pix4D Mapper implements topographic data by analyzing images captured in various areas based on the automated work sequence [70,71,72]. For the analysis, up to 10,000 images can be processed, and the automated analysis technology improves accuracy by correcting any missing or inaccurate topographic information [73,74]. In addition, it enables analysis under the application of various cameras, such as standard perspective cameras and equidistant fisheye cameras [75,76].
Image analysis using Pix4D Mapper is performed in four steps. First, all captured images are examined for the analysis of matching points between pixels, and keypoints are matched using the scale-invariant feature transform (SIFT) function [77]. Second, the approximate values for the location and direction of the captured images by UAVs are analyzed. The accurate locations and directions of all images are reconstructed using the bundle block adjustment for matching points in each image. Third, orthomosaic, DTM, and DSM were created using the initially analyzed images based on their locations and directions. The World Geodetic System 1984 (WGS84), which is based on the satellite data obtained using GPS, was used as the terrestrial reference system for the images generated by UAVs and analysis results. Lastly, the 3D model is analyzed by forming an irregular triangular network based on the point cloud of the analyzed image. Images are implemented through the 3D model, and orthomosaics, DSM, 3D point clouds, and meshes that include topographic information can be identified [72,78].
GCPs that indicate the accurate locations of images are required to improve the accuracy of the Pix4D Mapper. The analyzed point cloud is overlapped with the horizontal (X), vertical (Y), and altitude (Z) information of the GCPs observed in topographic coordinates to select control points. This process prevents the occurrence of distortion when images overlap, improving accuracy. The accuracy improvement by the GCP setting is important for the photogrammetry technology that uses UAVs. The accuracy of the observation data acquired using UAVs and the reference coordinates of the GCPs were analyzed using RMSE. RMSE, which is a measure to analyze errors between the values estimated from UAV images and the values observed at GCPs, is suitable for expressing precision. The RMSE can be analyzed using (1).
where is the value observed by the UAV, is the value observed at GCP, and is the number of observations.
2.4. Watershed Analysis
Watershed analysis was started in a topology algorism that uses aerial photographs to find catchment basins in mountainous terrain. Watershed analysis is an area-based technique using edge information of an image, and it is an analysis that minimizes the deformation of the segmented image for infinitesimal noise. There are two ways to divide the image of Watershed analysis.
The first method begins by discovering a downstream path from each pixel of the image to a local minima. The area minimum is defined as a point that does not have a downstream path in the vicinity of the thing. One point above the digital surface is defined as , . Here, shows the two-dimensional position of point. also, represents the elevation of the point. The path above the surface can be defined as the sequins of the dots. If two dots and are on the river path, , for , is always true. In other words, a point of belongs to a minimum if there is no downstream path starting from the there. One catchment area is defined as a set of pixels whose paths to all downstreams end at the same minimum altitude. Each collection area represents a region of the divided image. There are no general rules there to uniquely define the paths downstream on the digital surface. On the other hand, its successive counterpart is well determined by calculating local gradients.
The second method is dual for the first method. Instead of identifying the routes downstream, the catchment areas are filled from the floor. It is assumed that holes exist at each local minimum, causing the topographical surface to be phased into the water. If two catchment areas are merged as a result of more locks, one watershed is built in all directions to the highest surface altitude. Watershed is classified into the watershed line of the standards for each range. When flooding reaches its highest level, only a watershed called the watershed line remains. As the water level rises from low areas, flooding of the basins occurs (Figure 5). Flooding that originates in each area raises the water level and divides the point of inundation into different areas of the watershed. After all the watershed division process is finished, the result is a watershed line that separates the regions. At the end of the flooding process, basins (A to C) are created, which are areas of watersheds surrounded by watershed lines.
3. Results
3.1. Construction of Topographic Data Using a UAV
3.1.1. Target Area and UAV Area Operation Conditions
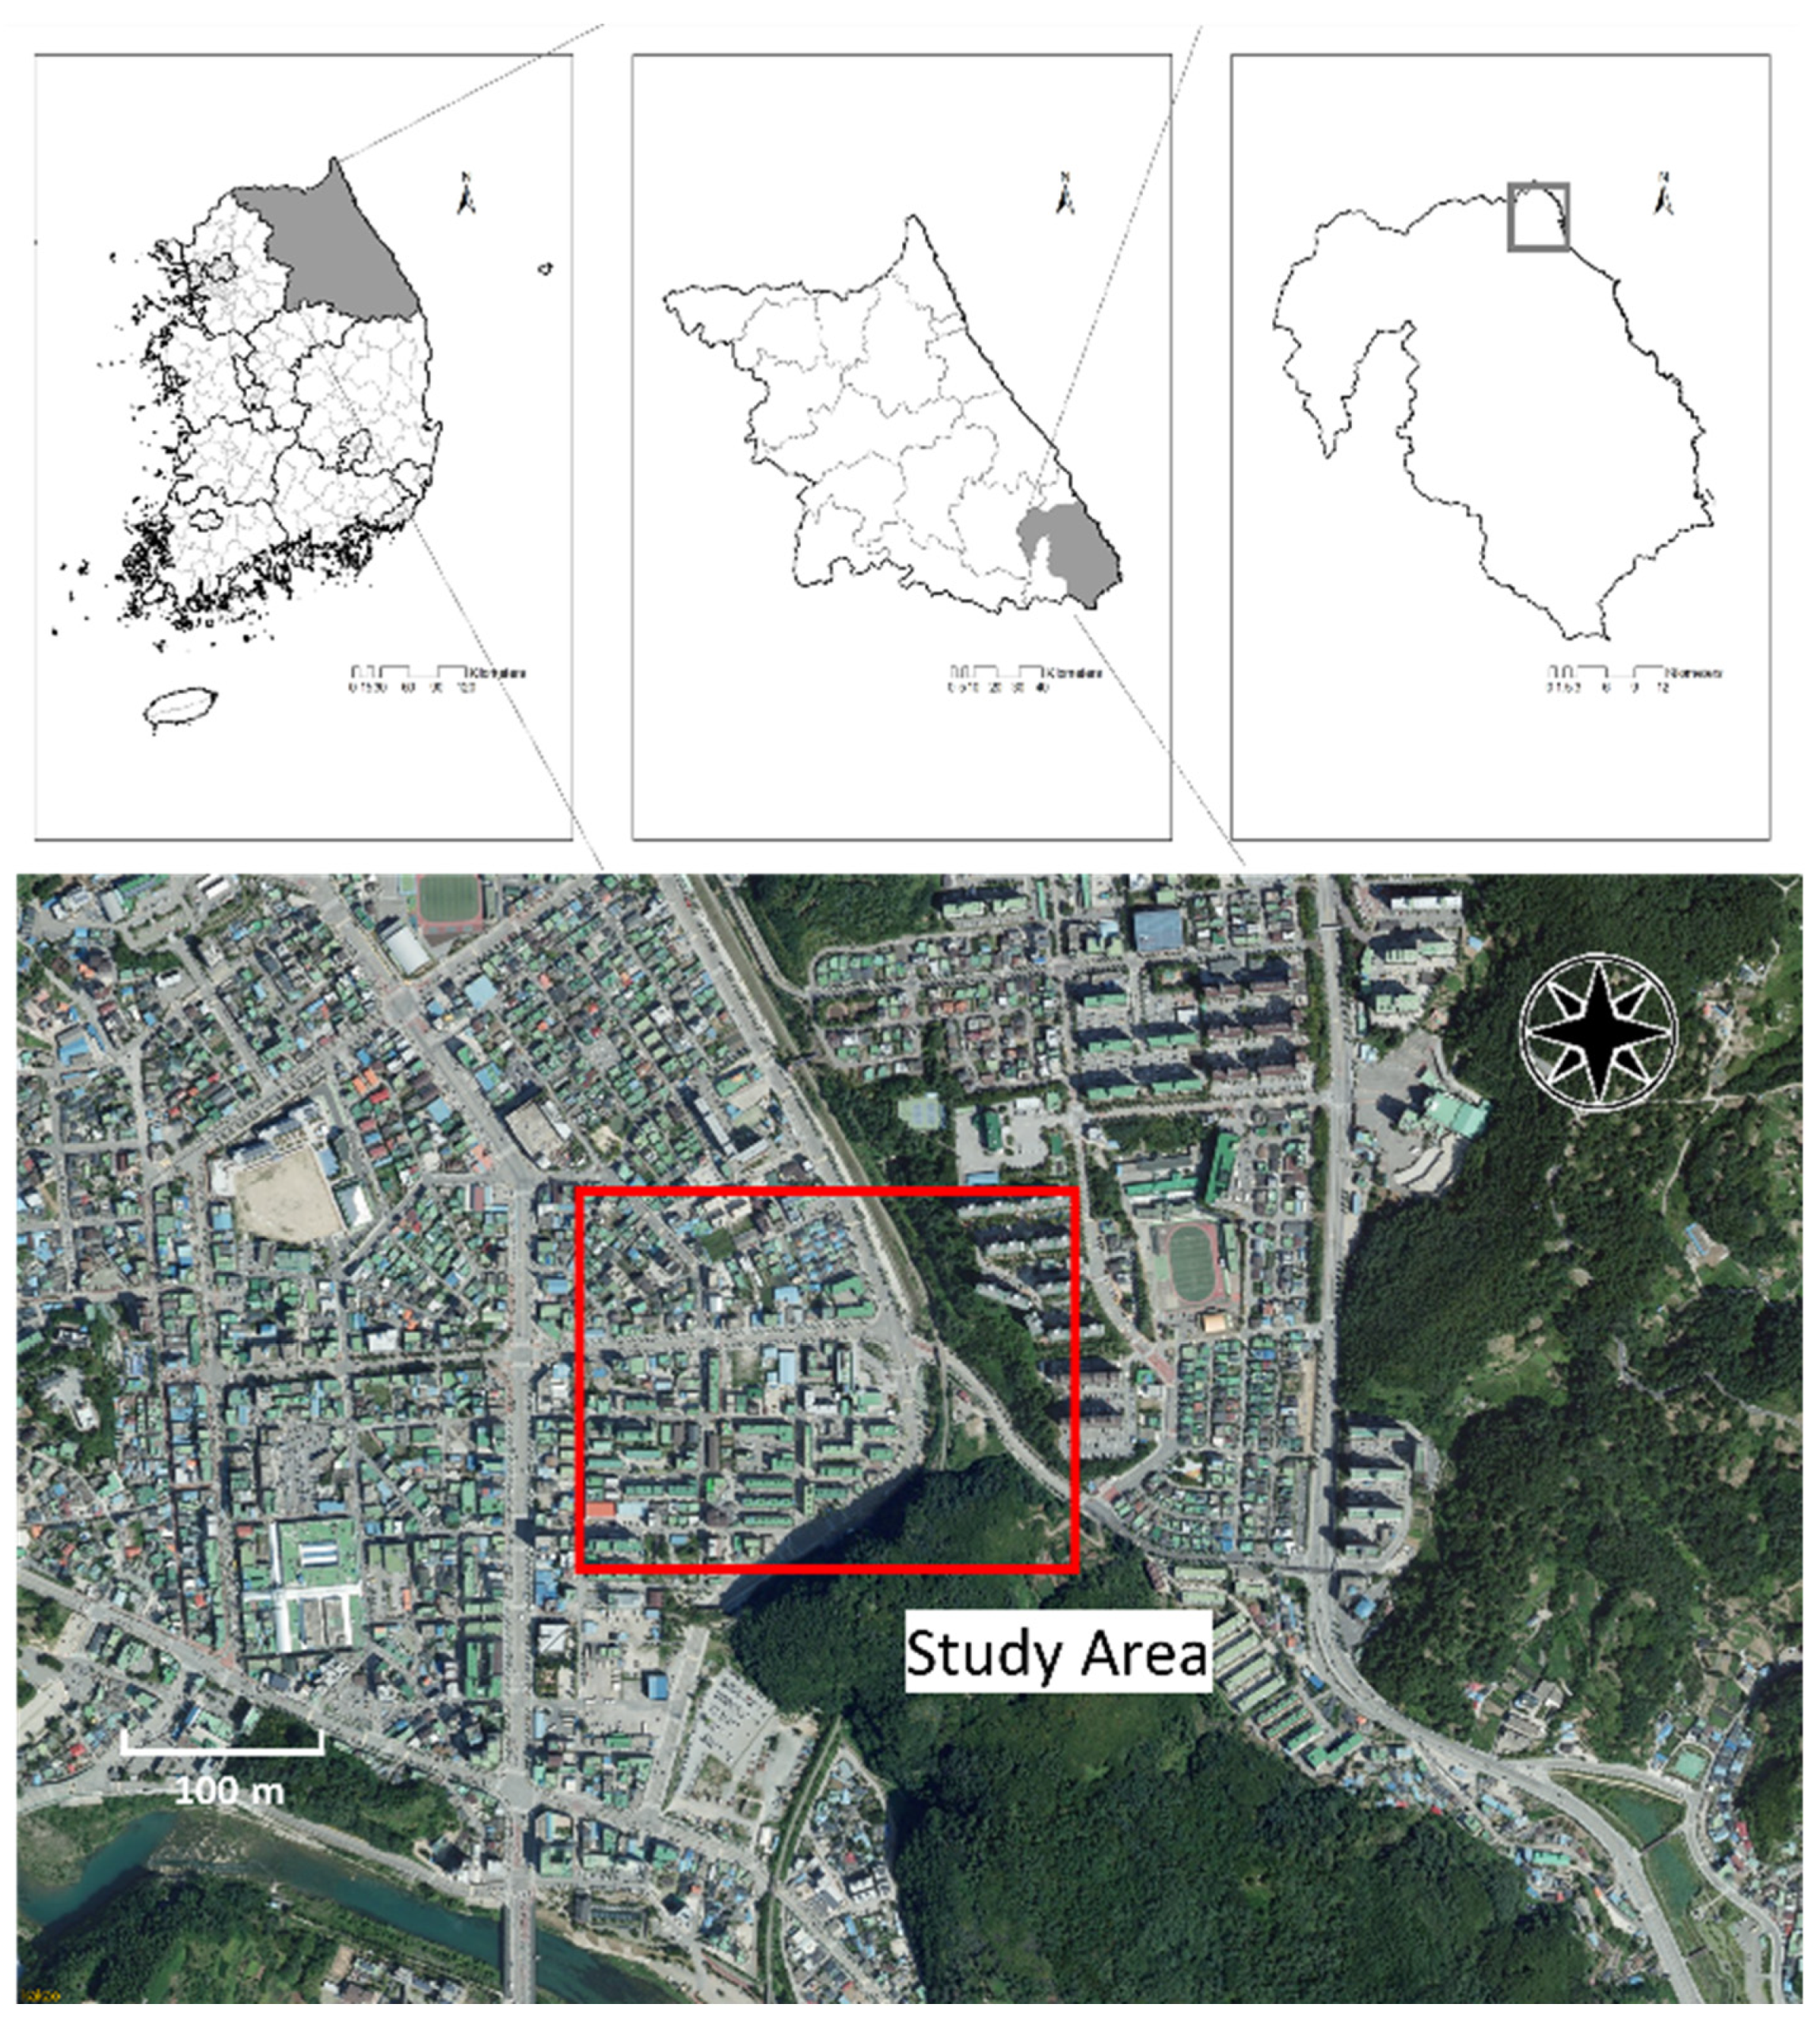
An urban area near the Samcheok public health center located in Samcheok City, Gangwon-do, Republic of Korea, where typhoon damages occurred in 2019 and 2020, was selected as the target area of this study, as shown in Figure 6. The target area has a high density of residential areas and commercial facilities. Therefore, massive damages are expected in the event of floods and heavy rainfall. The residential areas are located on the right side of the intersection of the Samcheok Public Health Center, and commercial areas are on the left side. In the residential areas, land use has changed from past mountainous areas to urban development. Moreover, most rainwater flows into the commercial areas when it rains due to the high altitude and an increase in impervious area in the residential areas. In the event of rainfall, flood damages occur near the Samcheok Public Health Center due to the inflow of rainwater into commercial areas.
A UAV flight plan was established to construct the topographic data of the target area. Various details, including the photographing area, altitude, image overlap rate, camera angle, and coordinates, must be set during the UAV flight planning. Setting the appropriate altitude and camera angle is necessary in the construction of the topographic data of an urban area to precisely capture the heights of apartments and buildings. The altitude of the target area ranged from El. 3.0 to 120.0 m, and the UAV photographing point was set to approximately El. 60.0 m. The UAV altitude was set to 120.0 m to ensure that aerial photos could be obtained for all structures because the UAV photographing altitude limit in Korea is 150.0 m. In addition, the camera angle was set to 90° and 60° to ensure that the topography and sides of the structures could be observed, as shown in Figure 7.
The overlap rate of photography must be determined once the photographing altitude and camera angle of the UAV are set. The overlap rate is the proportion of the overlapping area in each photograph, and it must be set to 70% or higher for precise photogrammetry. Because a high overlap rate is closely related to the UAV flight time, it must be planned considering the area and altitude of the target area. In this study, the overlap rate was set to 80% in both the longitudinal and transverse directions to construct the precise topographic data of the urban area. Based on the flight plan set for the target area, the photographing area was set to 0.222 km2, and the number of photographs was set to 179 and 336 for camera angles of 90° and 60°, respectively. Therefore, a total of 515 aerial photos were set, and the coordinates for UAV photography were set to WGS84. Table 3 lists the UAV flight plans in the target area.
The UAV selected in this study was Phantom 4 RTK, which can receive real-time location information during the flight. In South Korea, approximately 60 GNSS observation stations are in operation. The Samcheok observation station, which is a satellite reference point located near the target area, was used for precise UAV photography. Table 4 lists the detailed status of the observation stations.
3.1.2. Construction of the Topographic Data
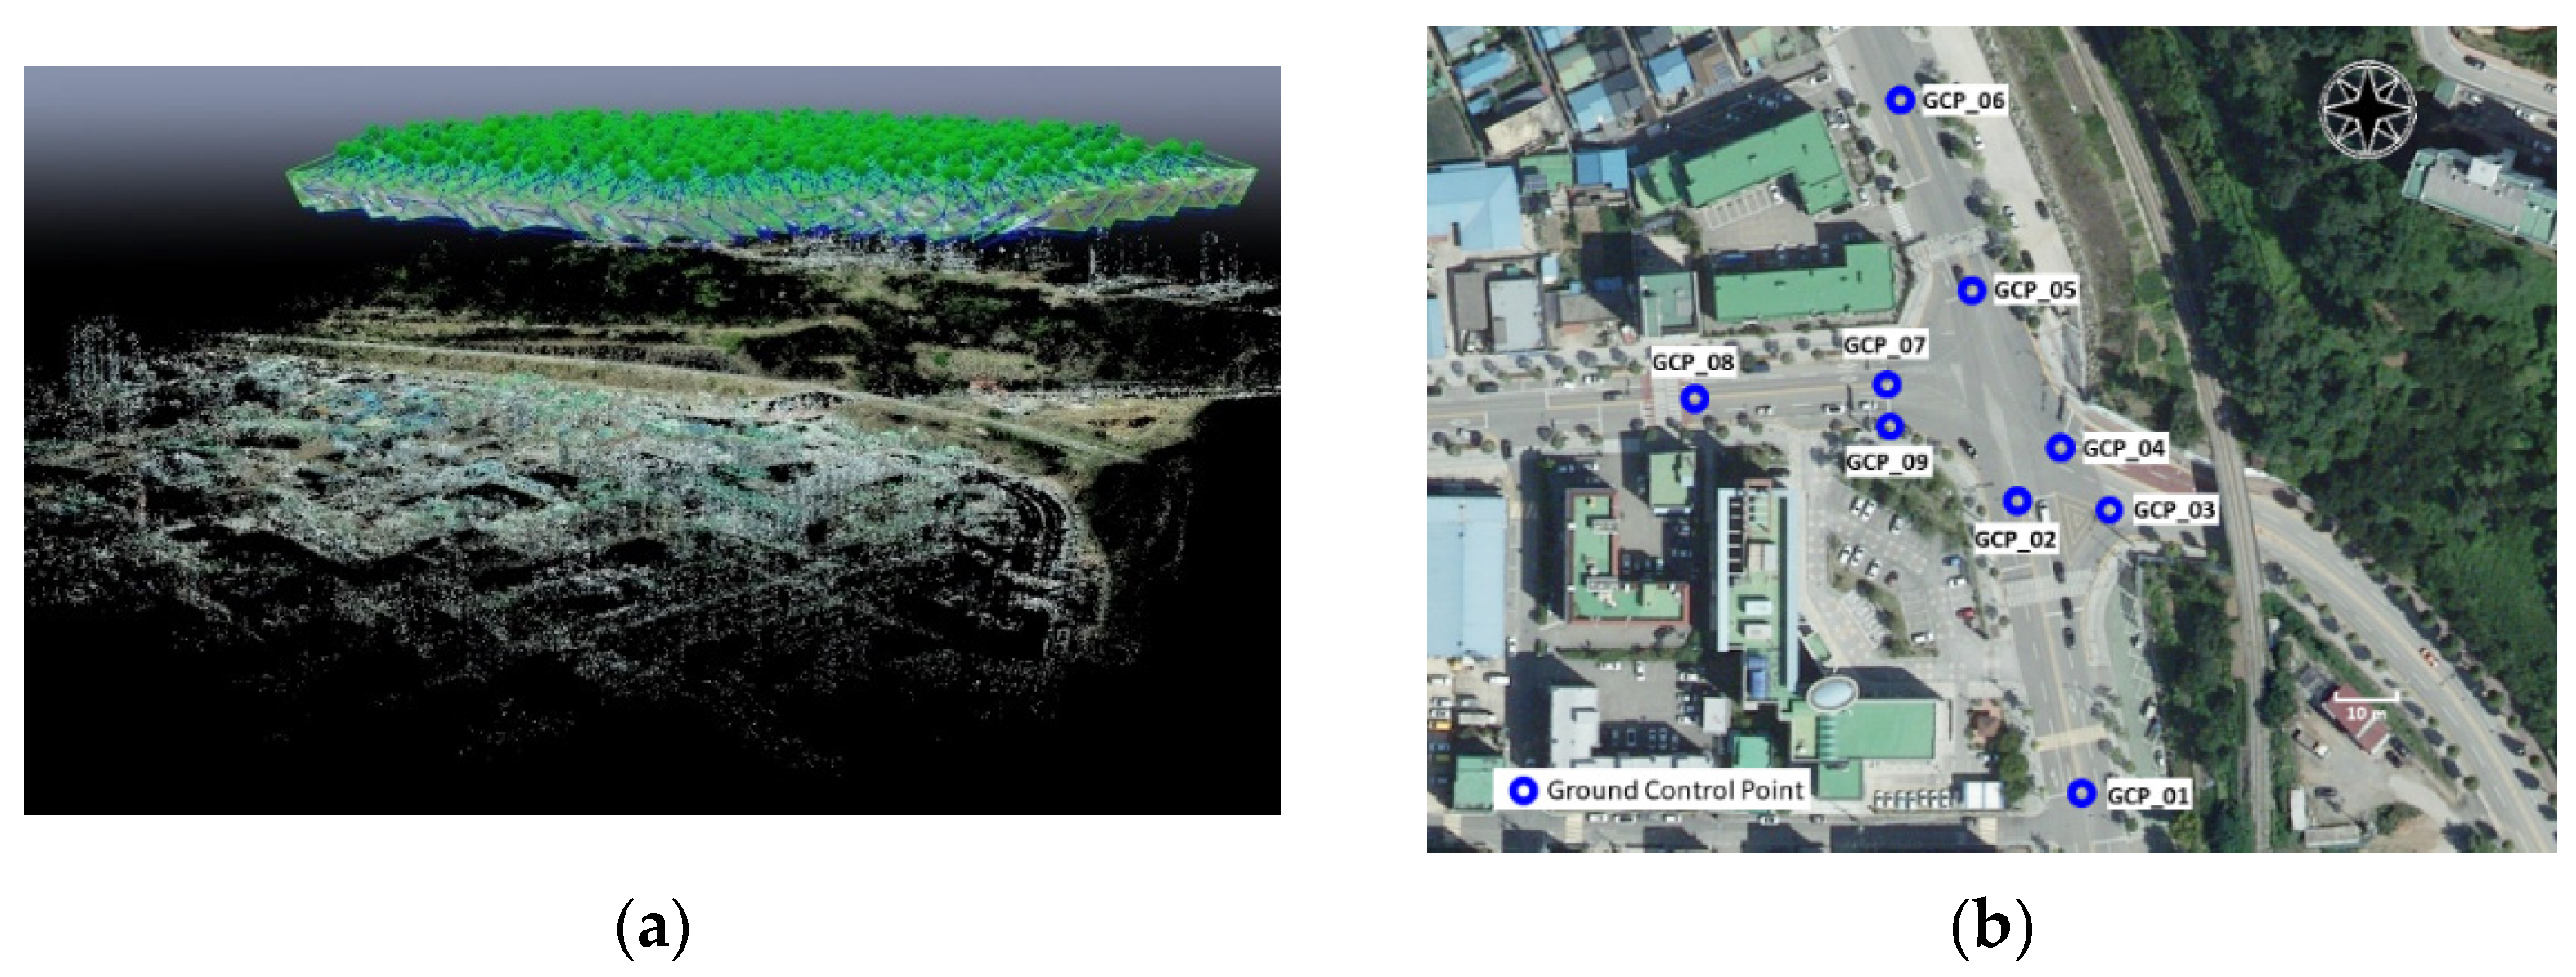
The aerial photos were captured using the UAV based on the flight plan set for the target area. The data including the real-time location information on the aerial photos taken using the UAV were acquired in connection with GNSS. The 515 aerial photos taken at different camera angles were subjected to image mapping using the Pix4D Mapper, as shown in Figure 8a. The topographic data were calibrated using GCPs after the initial processing for image mapping. In this study, nine GCPs were measured by considering the topographic characteristics of the target area, as shown in Figure 8b.
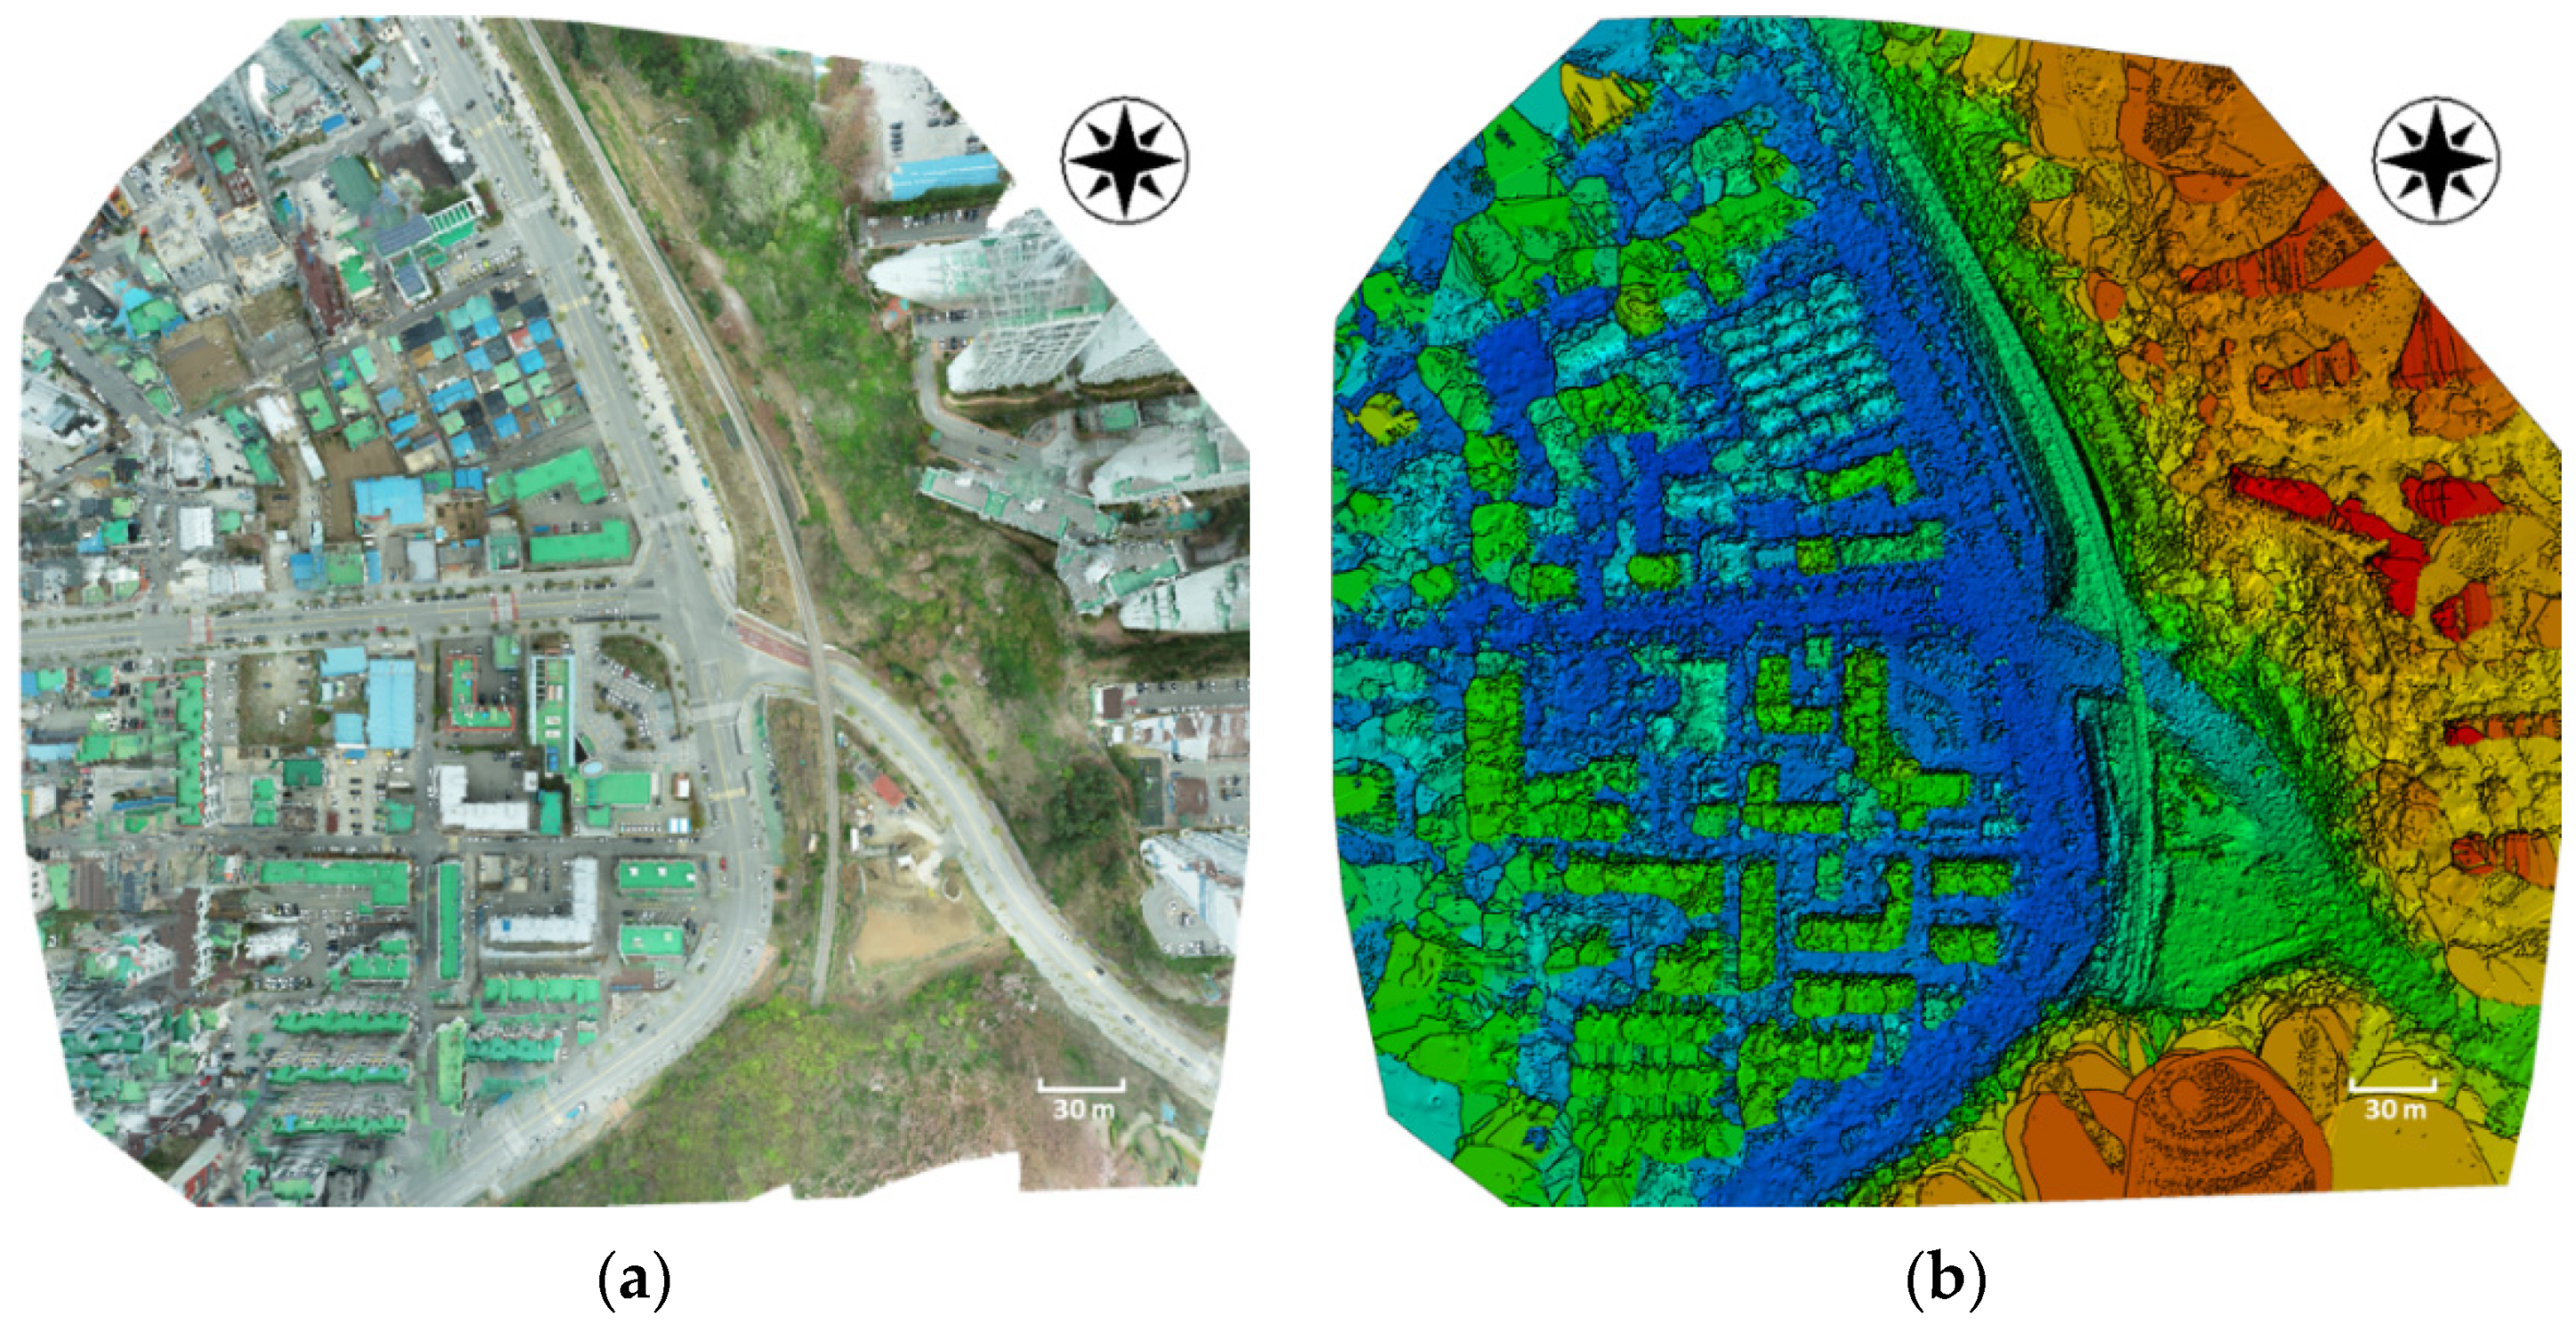
Moreover, the aerial photos and each GCP were matched after the initial processing of the acquired aerial photos. The accuracy of the matching increased as more photos were used. At least four photos must be matched to obtain highly precise results. In this study, ten aerial photos were matched for each GCP. The calibrated topographic data form a point cloud and mesh to analyze the orthomosaic and DSM. The analysis results for the target area are shown in Figure 9.
The analysis results include the location information of the photo that corrects the geometric distortion of the target area. The orthomosaic and DSM, which include the location information of all objects in the actual topography, were analyzed. The area of the target area was 0.222 km2, and high-precision topographic data were constructed with a ground sampling distance (GSD) of 3.4 cm. All the aerial photos taken were used for calibration, and approximately 145,000 keypoints were extracted per image. The RMSE was found to be 0.051 m under the application of GCPs, indicating that the high-precision topographic data were constructed. Table 5 presents detailed analysis results.
3.2. Selection of Monitoring Points in the Urban Area
3.2.1. Watershed Analysis Using the Topographic Data
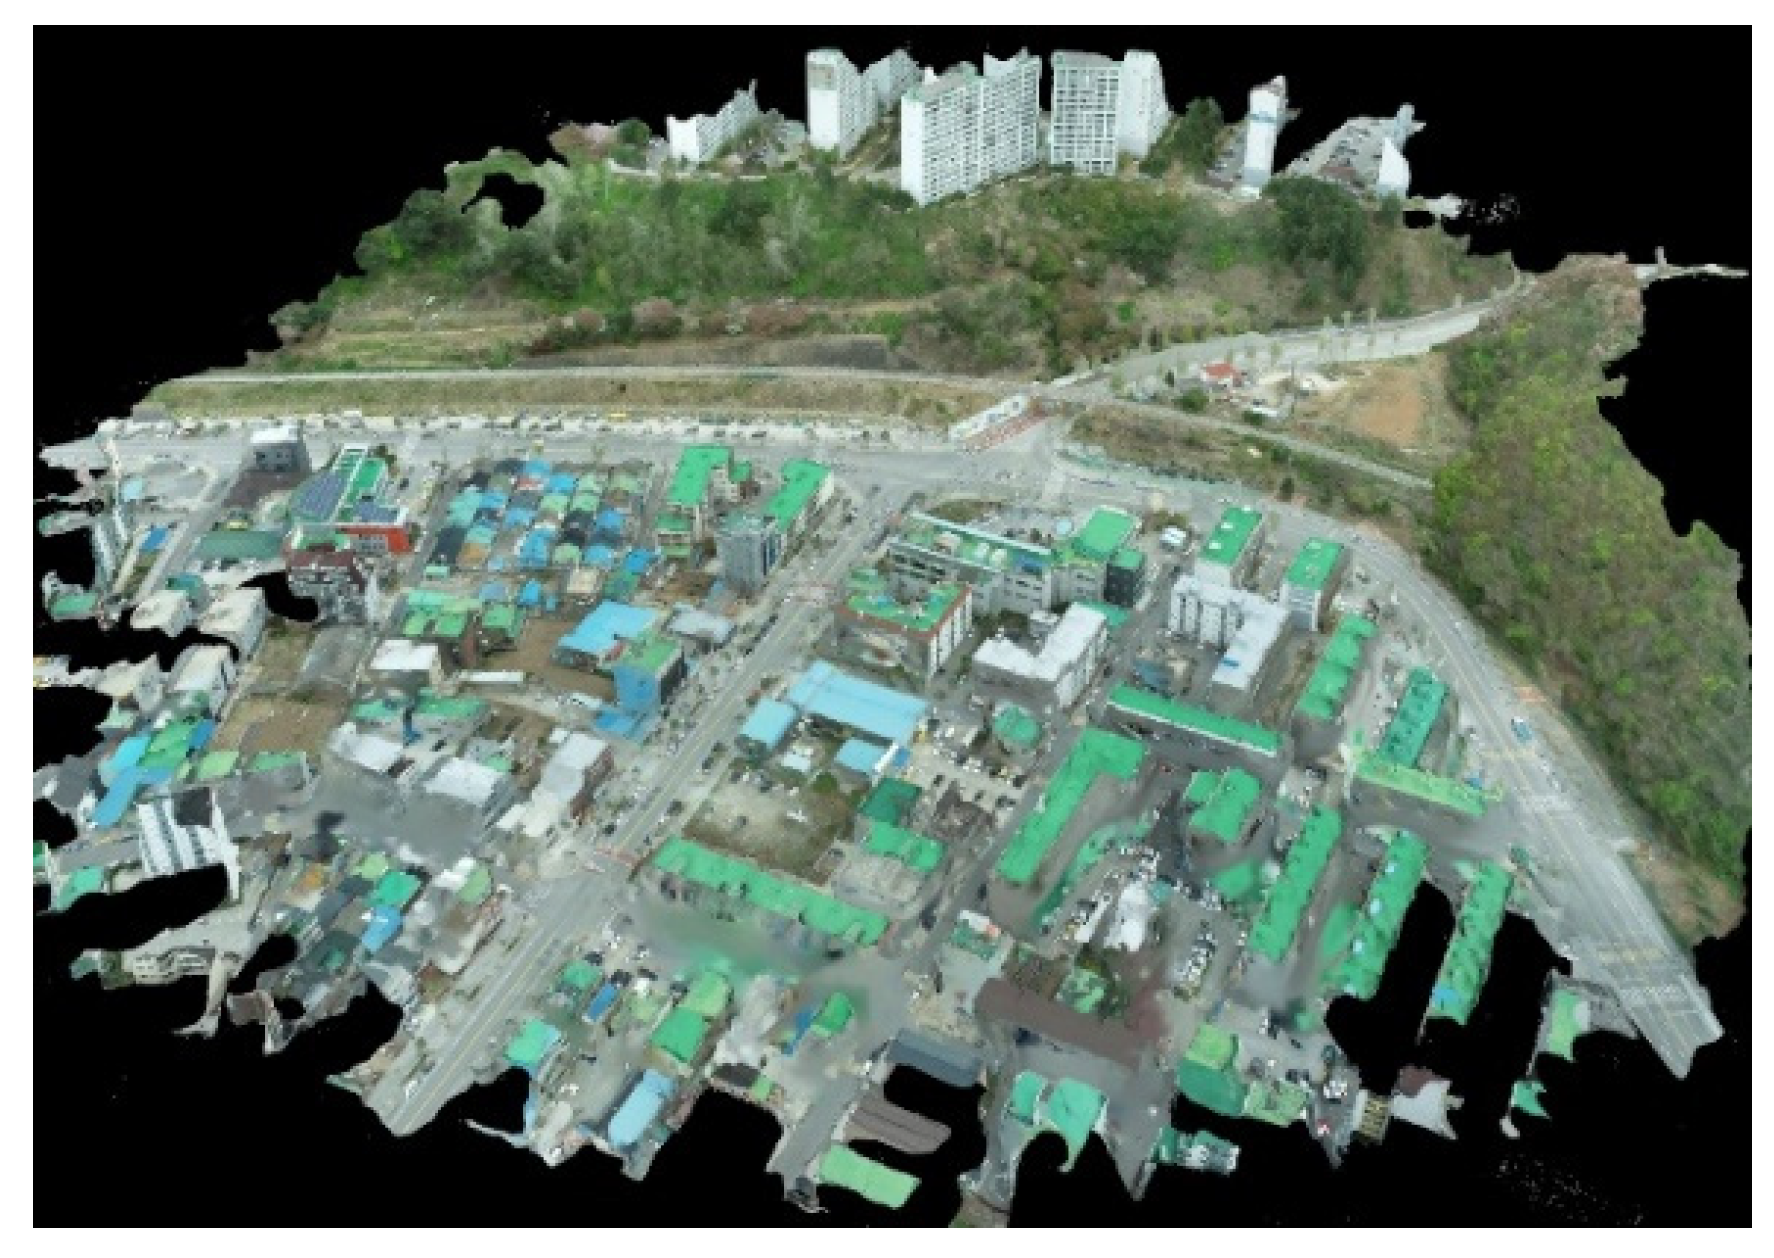
We used the DSM for the 3D model, and it was analyzed using the algorithm of the inverse distance weighting, which is based on the point cloud measured by the aerial photos. These algorithms used for analyzing DSM are mainly divided into triangulation and inverse distance weighting. In this study, inverse distance weighting, which can analyze corner points in buildings and structures in urban areas, was applied. Figure 10 shows the 3D model using the topographic data of the target area.
In hydrology, a watershed is an area where the rainwater converges due to the connected surface flow during rainfall. In urban areas, the flow areas of pipes are distinguished as drainage areas. Although the target area of this study is an urban area, we attempted to divide watersheds by considering only the influence of the surface flow during rainfall. The points in which watersheds converge must be selected as monitoring points in urban areas.
A watershed is an area contained in a virtual line that is included within the hydrological boundary. It is the range where water flows and converges due to the difference in elevation, and it can be divided into parts. In the past, watershed analysis was conducted through processes such as flow direction, sink, and flow accumulation using DEM. In this study, precise topographic data of the orthomosaic, DSM, and 3D models were constructed using a UAV. The watershed analysis was conducted using the constructed topographic data without preprocessing.
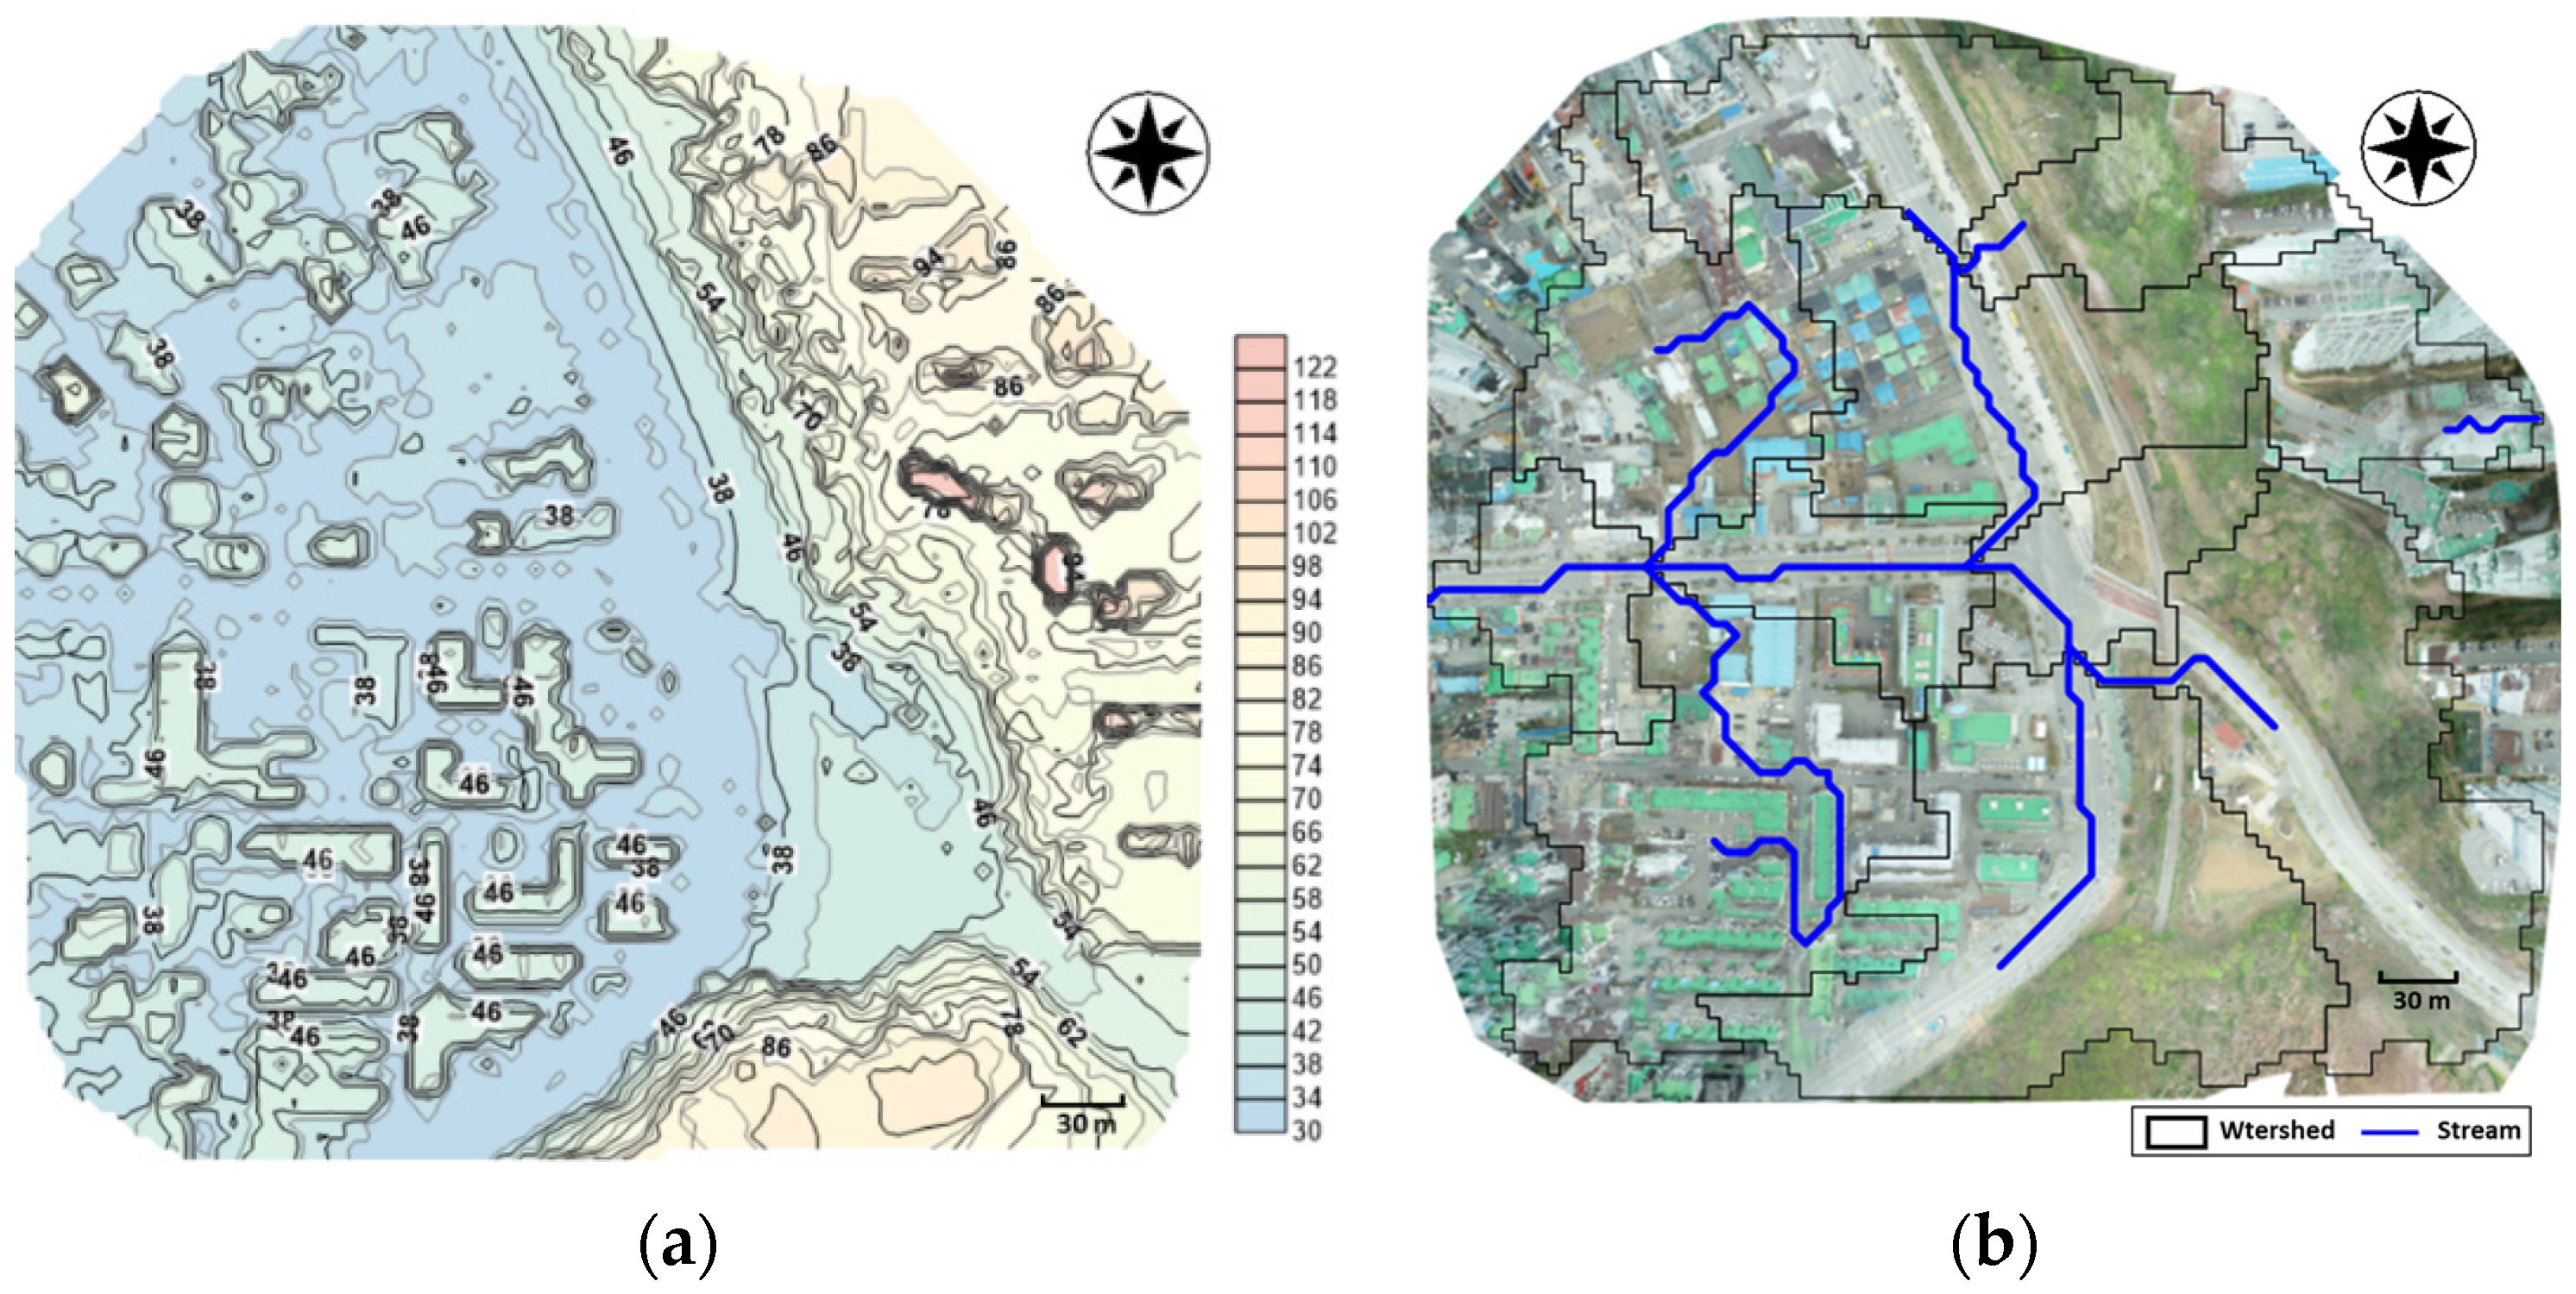
The contour and watershed were analyzed by extracting the X, Y, and Z information of 221,682 points from the topographic data for the watershed analysis of the target area, as shown in Figure 10. The altitude of the target area ranged from El. 30 to 130 m. Moreover, the altitudes of the residential and commercial areas are El. 70 m or higher and El. 50 m or higher, respectively. The contour map shows that roads, buildings, and apartments have high altitudes, while road areas have low altitudes, as shown in Figure 11a. The watershed was divided into several sub-watersheds within the target area, as shown in Figure 11b. Rainwater flows from residential to commercial areas, mainly along roads. It is apparent that rainwater from residential and commercial areas converges at the Samcheok Public Health Center and flows along the roads.
3.2.2. Selection of Monitoring Points for the Installation of the Observation Equipment
We attempted to select monitoring points for the installation of observation equipment to prevent flood damage in the urban area through the watershed analysis. DSM of the target area was analyzed using UAV, and high-precision topographic data was obtained. However, the monitoring point should select the point where the water junction meets the flow of rainwater, not the selection of the lowest elevation point. The low elevation point is because the water is collected and flooding does not occur; the flooding occurs at the point of the water junction. Therefore, a basin analysis was conducted to select monitoring points.
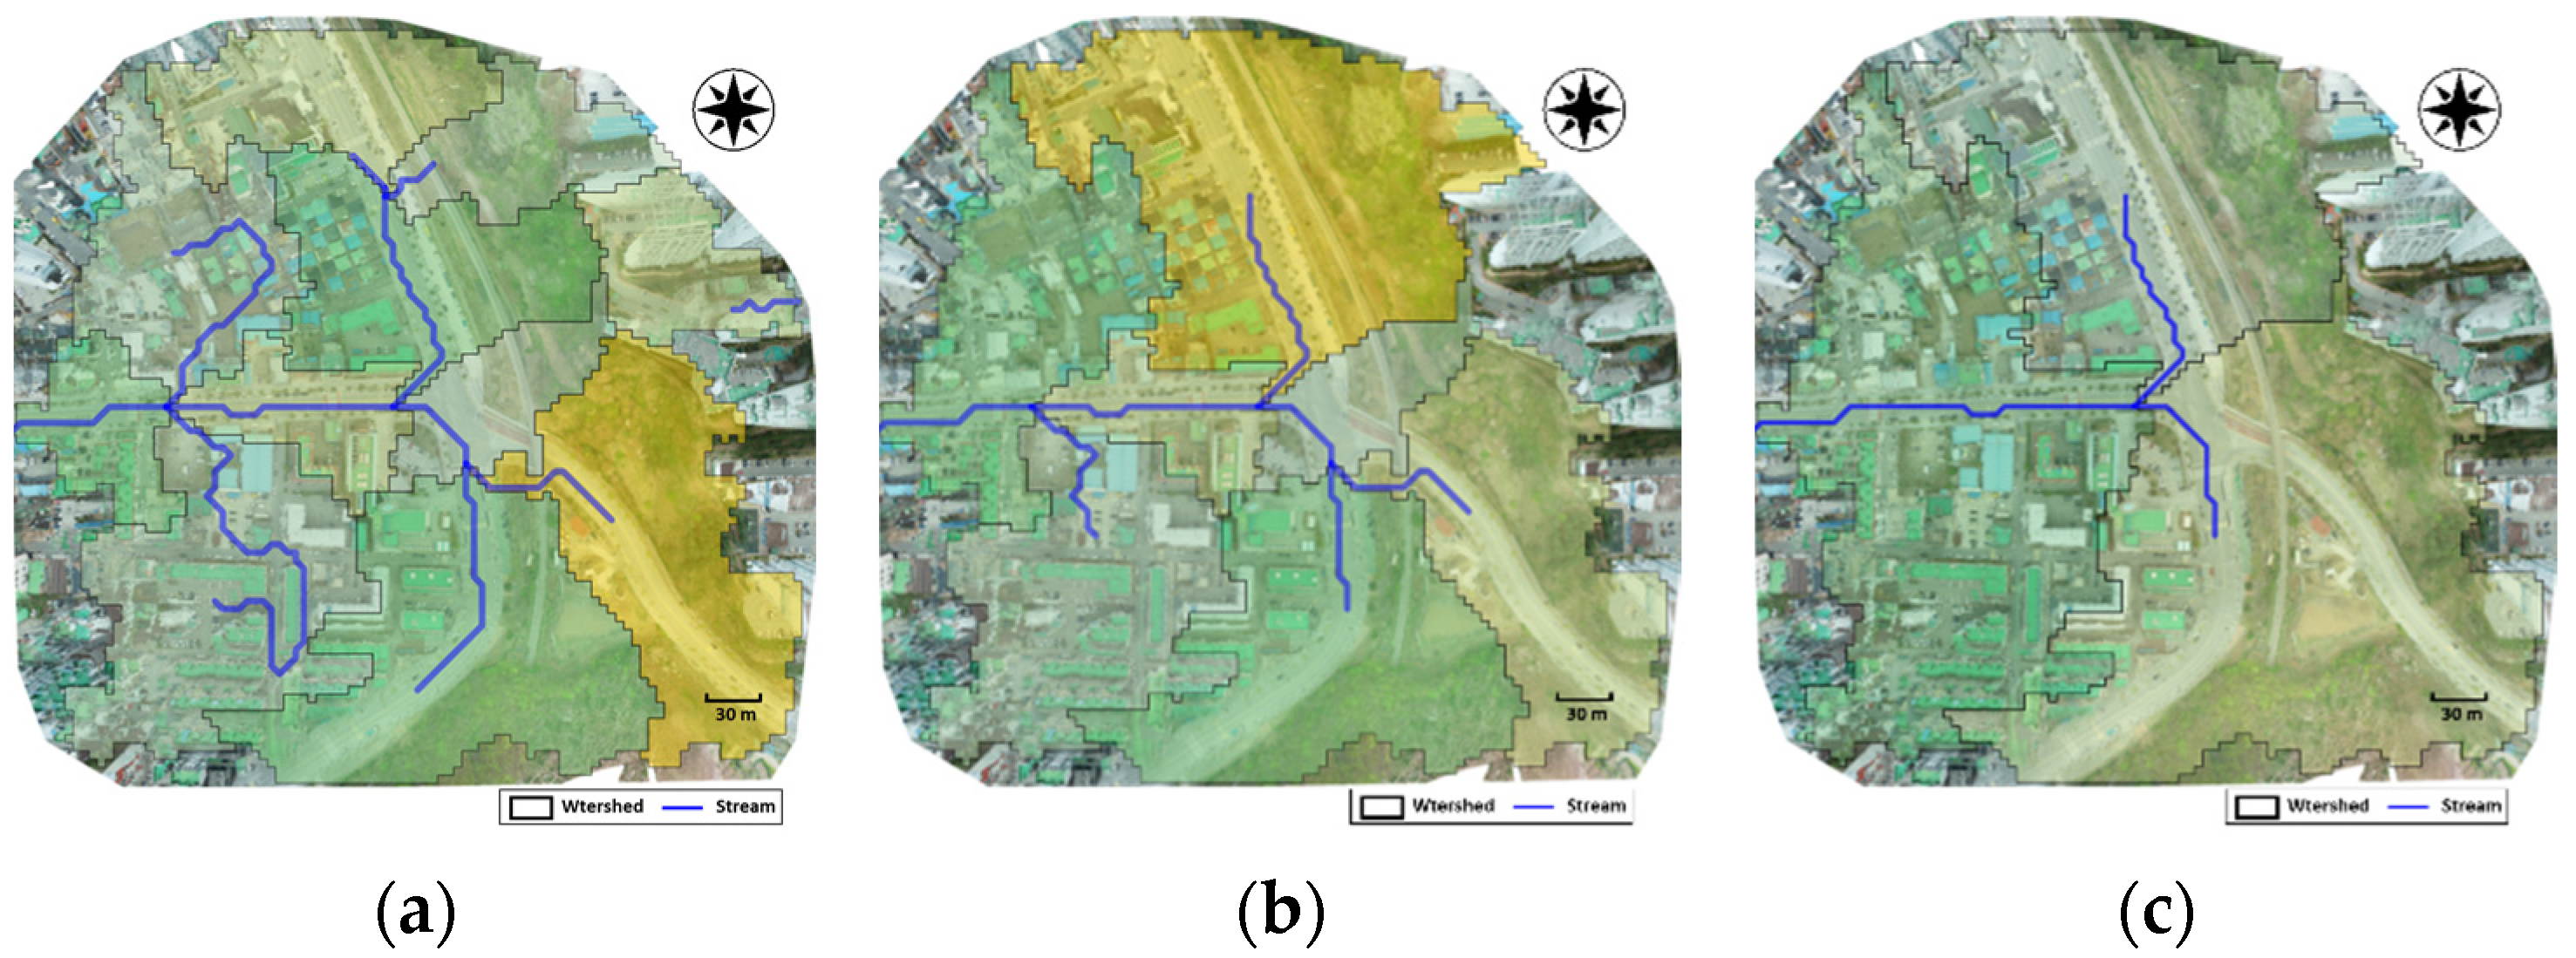
The watershed analysis can distinguish at least one watershed by adjusting the threshold. Points in which the inflow of rainwater converges in the target area must be selected as monitoring points for the installation of observation equipment. Figure 12 shows the threshold conditions to identify points at which the inflow of rainwater converges in the target area.
The sub-watersheds in the target area were analyzed by adjusting the threshold. Threshold is a factor that distinguishes watershed where flow of rainwater is gathered. Threshold can distinguish the size of the watershed, small or large depending on the value. The selection of monitoring points in the target area is to select one point where rainwater gathering is performed. The threshold was controlled and the point where the flow of rainwater is joined was analyzed.
The number of watersheds decreased as the threshold increased. Rainwater converged at three points, two points, and one point when the thresholds were 300, 700, and 1100, respectively. Table 6 lists the number of watersheds based on the threshold value.
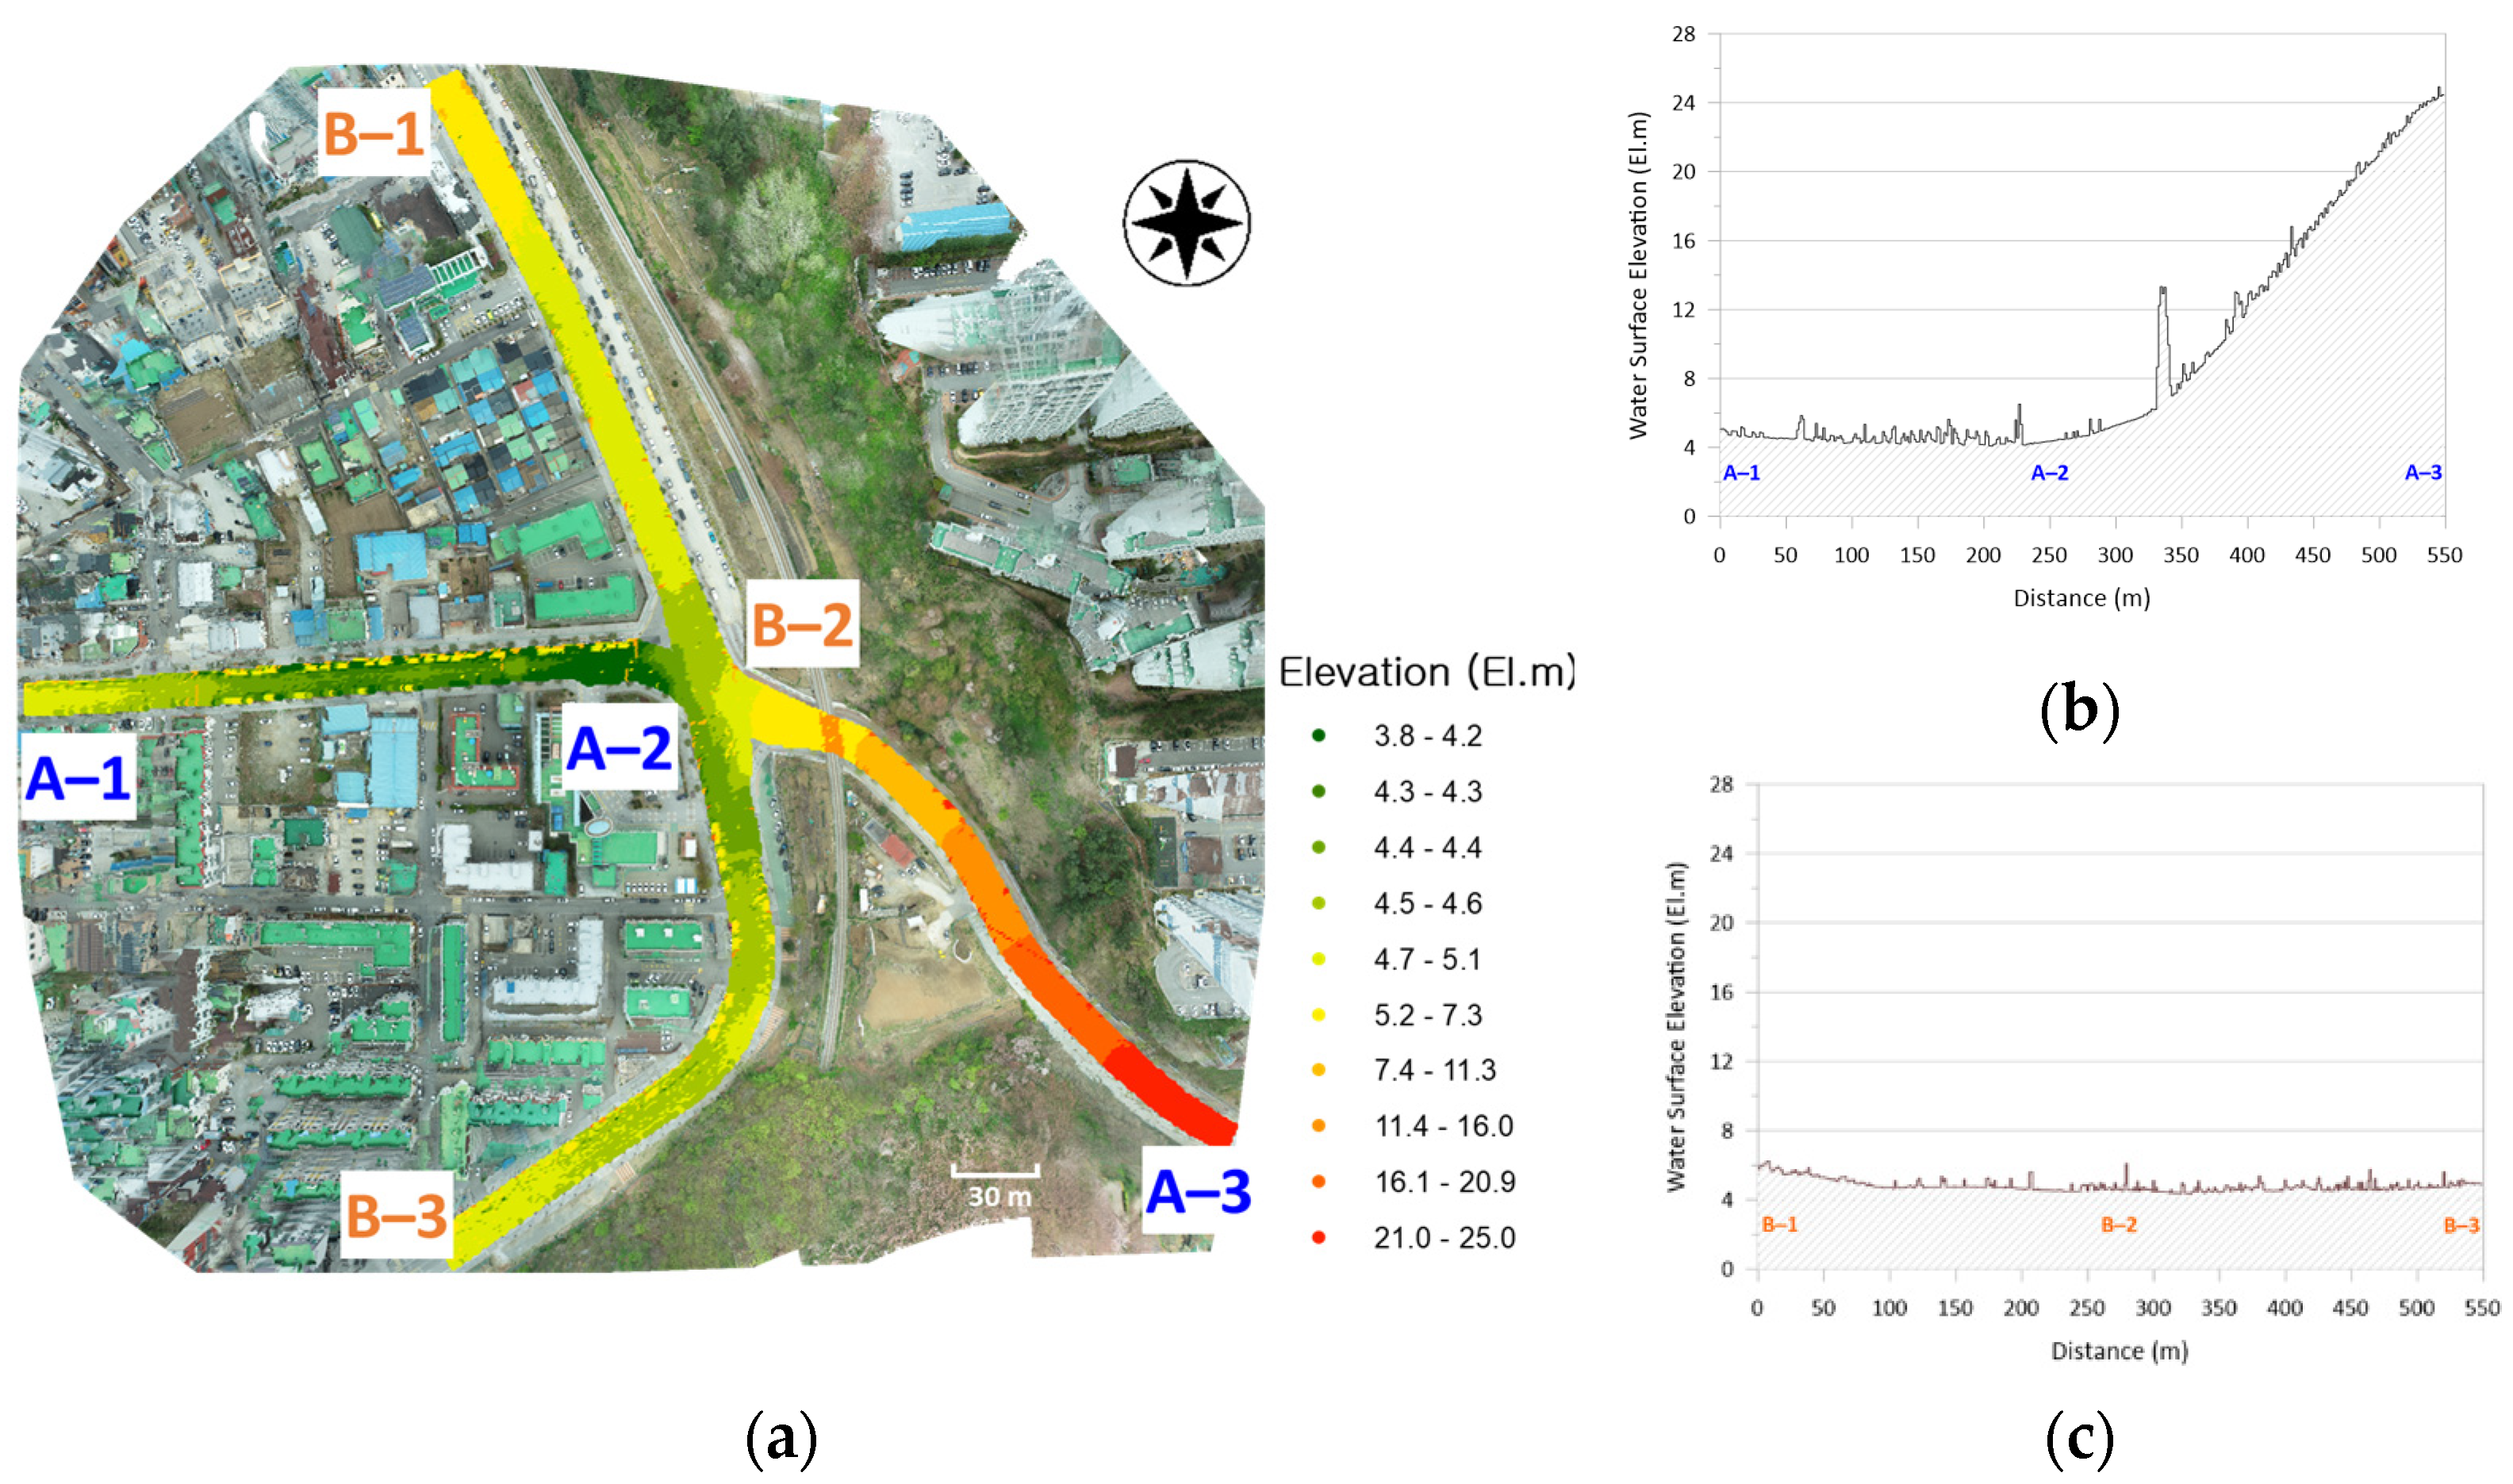
In the target area, the rainwater flow converged along the roads. The analysis of the threshold revealed that rainwater from residential and commercial areas was introduced to the intersection of the Samcheok Public Health Center. The elevation was examined to analyze the flow of rainwater introduced to the intersection, as shown in Figure 13a.
The elevation of roads that passed the intersection ranged from El. 3.8 to 25.0 m. The elevation continuously decreased toward the intersection from outside the target area. The road in the transverse direction, the starting point, the intersection of the Samcheok Public Health Center, and its ending point were set as A, A-1, A-2, and A-3, respectively, as shown in Figure 13b. The elevation of road A had a difference of approximately El. 20 m, and the lowest elevation was observed near the Samcheok Public Health Center.
The road in the longitudinal direction, the starting point, the intersection of the Samcheok Public Health Center, and its ending point were set as B, B-1, B-2, and B-3, respectively, as shown in Figure 13c. The elevation of road B had a difference of approximately El. 2.0 m, and the lowest elevation was observed near the Samcheok Public Health Center. The rainwater flows toward the intersection, although the change in elevation is not significant compared to that of road A.
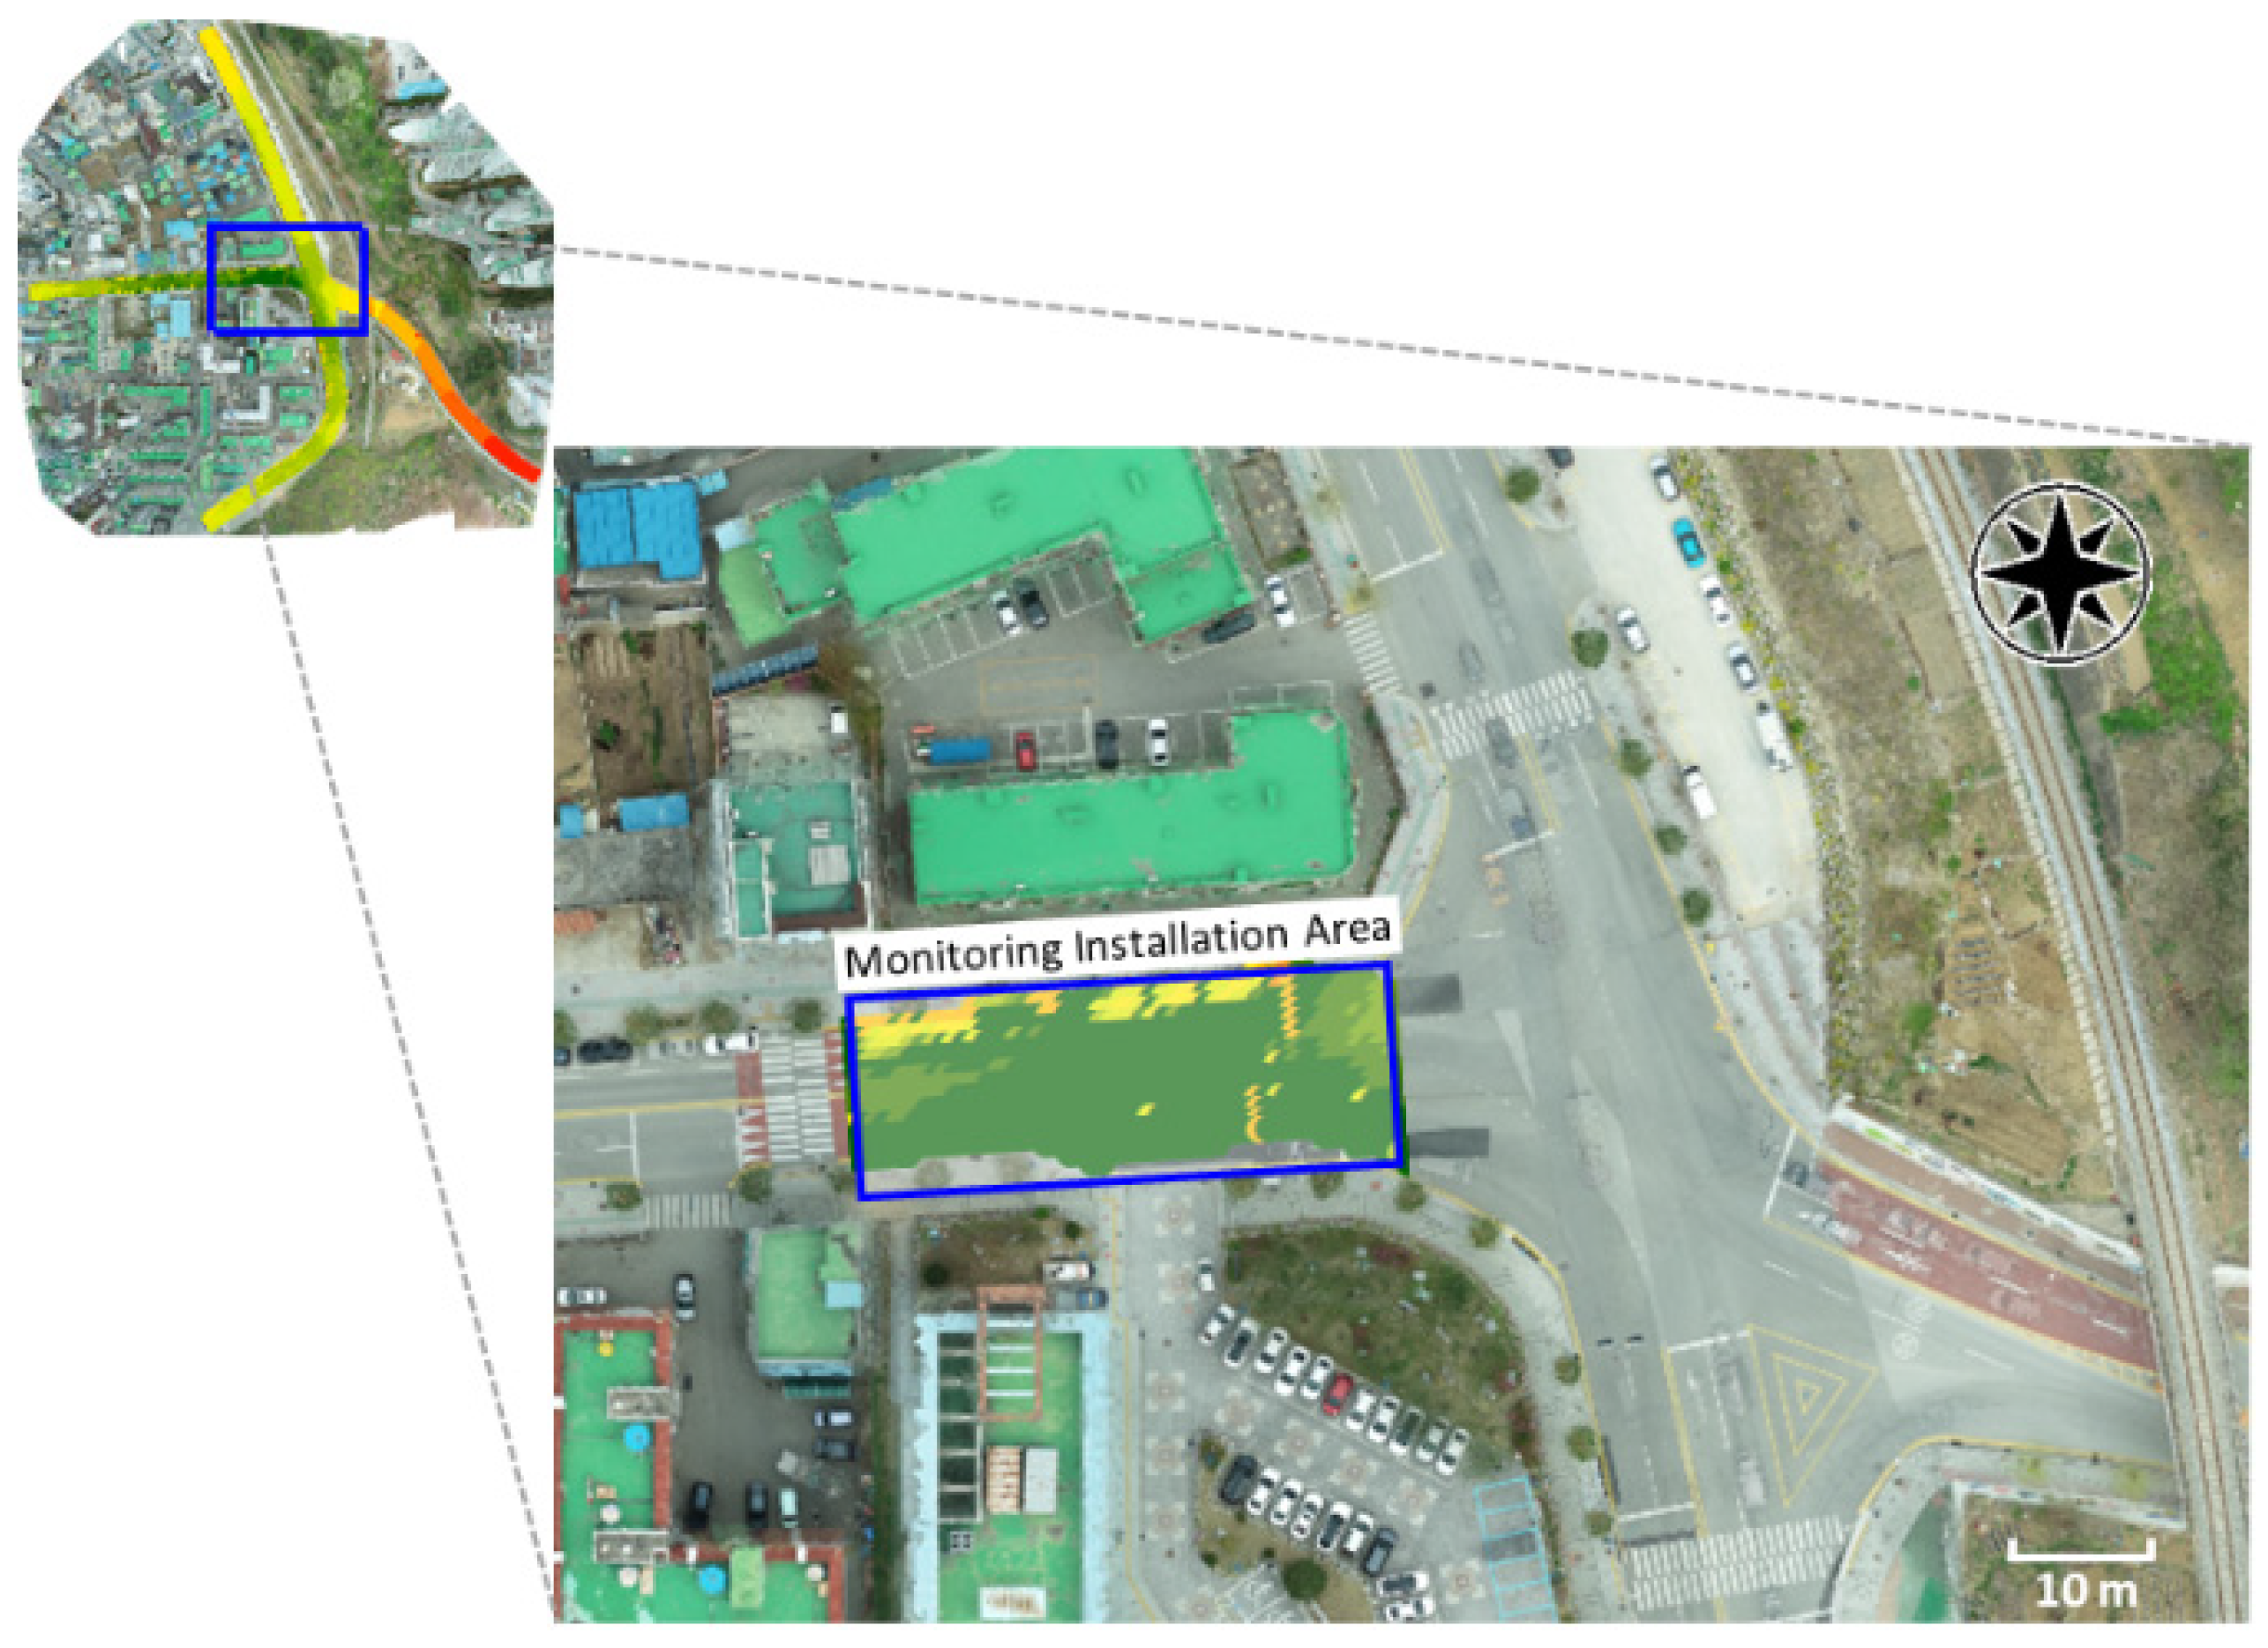
In this study, the topographic data of the target area were constructed using a UAV, and the watershed analysis was conducted to examine the flow of rainwater. In the target area, rainwater flows to the intersection of the Samcheok Public Health Center when it rains, and the flow of rainwater in the transverse direction is expected to have a large impact due to the residential areas on the right side.
On the other hand, the rainwater introduced in the longitudinal direction is expected to merge with the flow in the transverse direction. Therefore, an approximately 50 m section near the Samcheok Public Health Center, where the flow of rainwater converges with a low-lying area, was selected as the monitoring installation area to reduce flood damage in the urban area. The monitoring point is the road in front of the Samcheok Public Health Center, and the installation of observation equipment is judged to be required in the range shown in Figure 14.
4. Discussion
Flood damage in urban areas is mainly caused by the rapid increase of impermeable areas and surfaces, owing to urban developments and rapid change of rainwater flow. In addition, climate change increased local heavy rainfall and rainfall intensity, increasing the possibility of flood damage. Monitoring through the installation of observation equipment is required to examine the influence of flood damage in urban areas [10].
In the past, the topographic data of urban areas were constructed using contour lines and several elevation points. The construction of high-precision topographic data is now possible with the development of UAVs and software, making it possible to utilize hydrological analysis to identify the flow characteristics of rainwater in urban areas. Therefore, this study proposes a methodology for selecting monitoring points by combining the construction of topographic data using UAVs and hydrological watershed analysis.
Several previous studies that used UAVs focused on the construction of topographic data or improvement of the accuracy [13,14,15,16,17,18,19,30,31,32]. In addition, the utilization of constructed topographic data in various fields has been presented in different reports [33,34,35,36,37,38]. In this study, two camera angles were used in the photography to consider structures with different elevations in an urban area. In addition, nine GCPs were observed to ensure the accuracy of topographic data, and calibration was performed so that the RMSE could be less than 10 cm. Moreover, the methodology of constructing the topographic data of an urban area using a UAV was established based on previous studies, and its accuracy was verified.
Most of the studies on monitoring in urban areas have focused on the influence of air pollution by altitude, sampling frequency, and observation of monitoring points [49,50,51,52,53,54,55,56,57,58,59]. In some studies, monitoring was performed, and a method of selecting optimal points in consideration of parameters or improving quality was presented [60,61,62,70]. For the selection of monitoring points in previous studies, the optimal location of quality or network was selected through observation. In addition, the optimal method was proposed as a monitoring methodology by analyzing the observation results based on empirical knowledge. In this study, however, the flow of rainwater was analyzed through hydrological watershed analysis based on topographic data, and the confluence of rainwater with maximum flood damage was selected. The proposed research method can be utilized as reference data for the selection and operation of monitoring points, considering the topographic data of an urban area.
The high precision topographic data were analyzed by adjusting the threshold value during the basin analysis. Finally, it was confirmed that the rainwater flowed into one point. In this study, UAV was utilized to construct more precise topographic data than DEM or STRM-1 used in the existing urban hydrology analysis. Although a 10 × 10 m or 30 × 30 m grid is used in the field of urban hydrology, topographic data with a high precision of 3.4 cm was constructed in this study. The point where rainwater flows in and merges in the target area was selected as the monitoring point.
The proposed methodology is applicable to a limited range of urban areas and monitoring point selection. Conducting an analysis of a large area is impossible considering that the UAV operation time is less than 30 min, and the observation of GCPs will also require more time depending on the area. In addition, even if monitoring points have been set, they can be changed due to various conditions for the installation of the observation equipment. Despite these limitations, the results of this study for selecting monitoring points in urban areas can be utilized.
5. Conclusions
In this study, a method for selecting monitoring points for the installation of the observation equipment in an urban area is proposed. Aerial photos were taken using an unmanned aerial vehicle (UAV) to obtain the topographic data of the target area, and image mapping was analyzed using Pix4D Mapper. Aerial photos were measured using Phantom 4 RTK, which can transmit and receive real-time location information as the observation equipment. In addition, Trimble R4s and nine ground control points (GCPs) were used to calibrate the topographic data. Moreover, high-precision orthomosaics with a root mean square error (RMSE) of 0.051 m, a digital surface model (DSM), and a three-dimensional (3D) model were constructed for the topographic data of the target area.
The watershed analysis was conducted while adjusting the threshold to select monitoring points for the reduction of flood damages in urban areas. The number of watersheds decreased as the threshold increased, and the flow of rainwater was introduced through roads. The target area included long roads in the transverse and longitudinal directions. The flow of rainwater converged at the intersection of the Samcheok public health center when the thresholds were 300, 700, and 1100.
The elevation of the road up to the target point was analyzed for the flow of rainwater flowing into the intersection. The elevation difference was approximately equal to El. 20 m for Road A in the transverse direction, and El. 2.0 m for Road B in the longitudinal direction. Therefore, the flow of rainwater will be introduced to the Samcheok Public Health Center in the transverse direction. Therefore, in this study, an approximately 50 m section of the road in front of the Samcheok Public Health Center, where the flow of rainwater converges with a low-lying area, was selected as a monitoring point in the urban area.
Urban area is an area where buildings, vehicles, and facilities are located complexly, and the construction of precise topographic data is a necessary academic field in urban hydrology. Accurate topographic data recently constructed using UAVs can be analyzed for flood damage and flow of rainwater. If the flow of rainwater in urban areas in the past was connected in a grid unit, it is expected that the flow characteristics of the urban area can be reflected in detail by connecting the flow in point units in precise topographic data.
Author Contributions
Conceptualization, Y.S. and M.P.; methodology, Y.S. and H.L.; validation, Y.S.; formal analysis: D.K.; resources, D.K.; data curation, B.K. and H.L.; writing—original draft preparation, Y.S.; writing—review and editing, M.P.; visualization, D.K.; supervision, Y.S. and M.P.; project administration, M.P. All authors have read and agreed to the published version of the manuscript.
Funding
This research received no external funding.
Informed Consent Statement
Informed consent was obtained from all subjects involved in the study.
Data Availability Statement
The data presented in this study are available on request from the corresponding author. The data are not publicly available due to [national policy research result].
Acknowledgments
This work was funded by the Korea Meteorological Administration Research and Development Program under Grant KMI [2021-00312].
Conflicts of Interest
The authors declare no conflict of interest.
References
- Deng, W.; Tang, D.; Lu, K.; Tang, G. Multiple target recognition of UAV based on image processing. J. Phys. Conf. Ser. 2019, 1303, 012115. [Google Scholar] [CrossRef]
- Wallace, L.; Lucieer, A.; Malenovský, Z.; Turner, D.; Vopěnka, P. Assessment of Forest Structure Using Two UAV Techniques: A Comparison of Airborne Laser Scanning and Structure from Motion (SfM) Point Clouds. Forests 2016, 7, 62. [Google Scholar] [CrossRef] [Green Version]
- Mohan, M.; Silva, C.A.; Klauberg, C.; Jat, P.; Catts, G.; Cardil, A.; Hudak, A.T.; Dia, M. Individual Tree Detection from Unmanned Aerial Vehicle (UAV) Derived Canopy Height Model in an Open Canopy Mixed Conifer Forest. Forests 2017, 8, 340. [Google Scholar] [CrossRef] [Green Version]
- Guerra-Hernández, J.; González-Ferreiro, E.; Monleón, V.J.; Faias, S.P.; Tomé, M.; Díaz-Varela, R.A. Use of Multi-Temporal UAV-Derived Imagery for Estimating Individual Tree Growth in Pinus pinea Stands. Forests 2017, 8, 300. [Google Scholar] [CrossRef]
- Bagaram, M.B.; Giuliarelli, D.; Chirici, G.; Giannetti, F.; Barbati, A. UAV Remote Sensing for Biodiversity Monitoring: Are Forest Canopy Gaps Good Covariates? Remote Sens. 2018, 10, 1397. [Google Scholar] [CrossRef]
- Li, J.; Yang, B.; Cong, Y.; Cao, L.; Fu, X.; Dong, Z. 3D Forest Mapping Using A Low-Cost UAV Laser Scanning System: Investigation and Comparison. Remote Sens. 2019, 11, 717. [Google Scholar] [CrossRef] [Green Version]
- Durfee, N.; Ochoa, C.G.; Mata-Gonzalez, R. The Use of Low-Altitude UAV Imagery to Assess Western Juniper Density and Canopy Cover in Treated and Untreated Stands. Forests 2019, 10, 296. [Google Scholar] [CrossRef] [Green Version]
- González-Jaramillo, V.; Fries, A.; Bendix, J. AGB Estimation in a Tropical Mountain Forest (TMF) by Means of RGB and Multispectral Images Using an Unmanned Aerial Vehicle (UAV). Remote Sens. 2019, 11, 1413. [Google Scholar] [CrossRef] [Green Version]
- Nuijten, R.J.G.; Coops, N.C.; Goodbody, T.R.H.; Pelletier, G. Examining the Multi-Seasonal Consistency of Individual Tree Segmentation on Deciduous Stands Using Digital Aerial Photogrammetry (DAP) and Unmanned Aerial Systems (UAS). Remote Sens. 2019, 11, 739. [Google Scholar] [CrossRef] [Green Version]
- Gharibi, M.; Boutaba, R.; Waslander, S.L. Internet of Drones. IEEE Access 2016, 4, 1148–1162. [Google Scholar] [CrossRef]
- Labib, N.S.; Brust, M.R.; Danoy, G.; Bouvry, P. The Rise of Drones in Internet of Things: A Survey on the Evolution, Prospects and Challenges of Unmanned Aerial Vehicles. IEEE Access 2021, 9, 115466–115487. [Google Scholar] [CrossRef]
- Naqvi, S.A.R.; Hassan, S.A.; Pervaiz, H.; Ni, Q. Drone-Aided Communication as a Key Enabler for 5G and Resilient Public Safety Networks. IEEE Commun. Mag. 2018, 56, 36–42. [Google Scholar] [CrossRef] [Green Version]
- Nex, F.; Remondino, F. UAV for 3D mapping applications: A review. Appl. Geomat. 2014, 6, 1–15. [Google Scholar] [CrossRef]
- Zecevic, Z.; Popovic, T.; Krstajic, B. Cloud Based Solution for Automatic Image Mosaicking and Georeferencing. In Proceedings of the 22nd International Scientific-Professional Conference Information Technology, Zabljak, Montenegro, 27 February–4 March 2017. [Google Scholar]
- Niederheiser, R.; Mokros, M.; Lange, J.; Petschko, H.; Prasicek, G.; Oude Elberink, S.J. Deriving 3D point clouds from terrestrial photographs: Comparison of different sensors and software. In Proceedings of the 23rd International Archives of the Photogrammetry, Remote Sensing and Spatial Information Sciences Congress, ISPRS 2016, Prague, Czech Republic, 12–19 July 2016; Halounova, L., Ed.; International Society for Photogrammetry and Remote Sensing (ISPRS): Prague, Czech Republic, 2016; pp. 685–692. [Google Scholar] [CrossRef] [Green Version]
- Haala, N.; Cavegn, S. High Density Aerial Image Matching: State-of-the-Art and Future Prospects. Isprs—Int. Arch. Photogramm. Remote Sens. Spat. Inf. Sci. 2016, XLI-B4, 625–630. [Google Scholar] [CrossRef] [Green Version]
- Remondino, F.; Spera, M.G.; Nocerino, E.; Menna, F.; Nex, F. State of the art in high density image matching. Photogramm. Rec. 2014, 29, 144–166. [Google Scholar] [CrossRef] [Green Version]
- Haala, N. The Landscape of Dense Image Matching Algorithms; Wichmann/VDE Verlag, Belin & Offenbach: Berlin, Germany, 2013. [Google Scholar]
- Alidoost, F.; Arefi, H. Comparison of Uas-Based Photogrammetry Software for 3d Point Cloud Generation: A Survey over a Historical Site. ISPRS Ann. Photogramm. Remote Sens. Spat. Inf. Sci. 2017, IV-4/W4, 55–61. [Google Scholar] [CrossRef] [Green Version]
- Burns, J.H.R.; Delparte, D. Comparison of Commercial Structure-From Photogrammety Software Used for Underwater Three-Dimensional Modeling of Coral Reef Environments. ISPRS—Int. Arch. Photogramm. Remote Sens. Spat. Inf. Sci. 2017, 42W3, 127–131. [Google Scholar] [CrossRef] [Green Version]
- Svensk, J. Evaluation of Aerial Image Stereo Matching Methods for Forest Variable Estimation. 2017. Available online: https://core.ac.uk/display/132482225 (accessed on 15 February 2022).
- Kitagawa, E.; Muraki, H.; Yoshinaga, K.; Yamagishi, J.; Tsumura, Y. Research on Shape Characteristic of 3d Modeling Software (SfM/MVS) in Uav Aerial Images. J. Jpn. Soc. Civ. Eng. Ser. F3 (Civ. Eng. Inform.) 2018, 74, II_143–II_148. [Google Scholar] [CrossRef]
- Jaud, M.; Passot, S.; Le Bivic, R.; Delacourt, C.; Grandjean, P.; Le Dantec, N. Assessing the Accuracy of High Resolution Digital Surface Models Computed by PhotoScan® and MicMac® in Sub-Optimal Survey Conditions. Remote Sens. 2016, 8, 465. [Google Scholar] [CrossRef] [Green Version]
- Escobar Villanueva, J.R.; Iglesias Martínez, L.; Pérez Montiel, J.I. DEM Generation from Fixed-Wing UAV Imaging and LiDAR-Derived Ground Control Points for Flood Estimations. Sensors 2019, 19, 3205. [Google Scholar] [CrossRef] [Green Version]
- Casella, V.; Chiabrando, F.; Franzini, M.; Manzino, A.M. Accuracy Assessment of a UAV Block by Different Software Packages, Processing Schemes and Validation Strategies. ISPRS Int. J. Geo-Inf. 2020, 9, 164. [Google Scholar] [CrossRef] [Green Version]
- Fraser, B.T.; Congalton, R.G. Issues in Unmanned Aerial Systems (UAS) Data Collection of Complex Forest Environments. Remote Sens. 2018, 10, 908. [Google Scholar] [CrossRef] [Green Version]
- Hardin, P.J.; Lulla, V.; Jensen, R.R.; Jensen, J.R. Small Unmanned Aerial Systems (sUAS) for environmental remote sensing: Challenges and opportunities revisited. GISci. Remote Sens. 2019, 56, 309–322. [Google Scholar] [CrossRef]
- Oniga, V.-E.; Breaban, A.-I.; Statescu, F. Determining the Optimum Number of Ground Control Points for Obtaining High Precision Results Based on UAS Images. Proceedings 2018, 2, 352. [Google Scholar] [CrossRef] [Green Version]
- Chaudhry, M.H.; Ahmad, A.; Gulzar, Q.; Farid, M.S.; Shahabi, H.; Al-Ansari, N. Assessment of DSM Based on Radiometric Transformation of UAV Data. Sensors 2021, 21, 1649. [Google Scholar] [CrossRef]
- Benassi, F.; Dall’Asta, E.; Diotri, F.; Forlani, G.; Morra di Cella, U.; Roncella, R.; Santise, M. Testing Accuracy and Repeatability of UAV Blocks Oriented with GNSS-Supported Aerial Triangulation. Remote Sens. 2017, 9, 172. [Google Scholar] [CrossRef] [Green Version]
- Varbla, S.; Puust, R.; Ellmann, A. Accuracy assessment of RTK-GNSS equipped UAV conducted as-built surveys for construction site modelling. Surv. Rev. 2021, 53, 477–492. [Google Scholar] [CrossRef]
- Bertacchi, A.; Giannini, V.; Di Franco, C.; Silvestri, N. Using unmanned aerial vehicles for vegetation mapping and identification of botanical species in wetlands. Landsc. Ecol. Eng. 2019, 15, 231–240. [Google Scholar] [CrossRef]
- Murray, N.J.; Keith, D.A.; Bland, L.M.; Ferrari, R.; Lyons, M.B.; Lucas, R.; Pettorelli, N.; Nicholson, E. The role of satellite remote sensing in structured ecosystem risk assessments. Sci. Total Environ. 2018, 619–620, 249–257. [Google Scholar] [CrossRef] [Green Version]
- Oostdijk, M.; Santos, M.J.; Whigham, D.; Verhoeven, J.; Silvestri, S. Assessing rehabilitation of managed mangrove ecosystems using high resolution remote sensing. Estuar. Coast. Shelf Sci. 2018, 211, 238–247. [Google Scholar] [CrossRef]
- Mahdianpari, M.; Granger, J.E.; Mohammadimanesh, F.; Salehi, B.; Brisco, B.; Homayouni, S.; Gill, E.; Huberty, B.; Lang, M. Meta-Analysis of Wetland Classification Using Remote Sensing: A Systematic Review of a 40-Year Trend in North America. Remote Sens. 2020, 12, 1882. [Google Scholar] [CrossRef]
- Bhatnagar, S.; Gill, L.; Ghosh, B. Drone Image Segmentation Using Machine and Deep Learning for Mapping Raised Bog Vegetation Communities. Remote Sens. 2020, 12, 2602. [Google Scholar] [CrossRef]
- Murugan, D.; Garg, A.; Singh, D. Development of an Adaptive Approach for Precision Agriculture Monitoring with Drone and Satellite Data. IEEE J. Sel. Top. Appl. Earth Obs. Remote Sens. 2017, 10, 5322–5328. [Google Scholar] [CrossRef]
- Shi, Y.; Ren, C.; Lau, K.K.-L.; Ng, E. Investigating the influence of urban land use and landscape pattern on PM2.5 spatial variation using mobile monitoring and WUDAPT. Landsc. Urban Plan. 2019, 189, 15–26. [Google Scholar] [CrossRef]
- Adams, M.D.; Kanaroglou, P.S. Mapping real-time air pollution health risk for environmental management: Combining mobile and stationary air pollution monitoring with neural network models. J. Environ. Manag. 2016, 168, 133–141. [Google Scholar] [CrossRef]
- Hagler, G.S.W.; Thoma, E.D.; Baldauf, R.W. High-Resolution Mobile Monitoring of Carbon Monoxide and Ultrafine Particle Concentrations in a Near-Road Environment. J. Air Waste Manag. Assoc. 2010, 60, 328–336. [Google Scholar] [CrossRef]
- Isakov, V.; Touma, J.S.; Khlystov, A. A Method of Assessing Air Toxics Concentrations in Urban Areas Using Mobile Platform Measurements. J. Air Waste Manag. Assoc. 2007, 57, 1286–1295. [Google Scholar] [CrossRef] [Green Version]
- Westerdahl, D.; Fruin, S.; Sax, T.; Fine, P.M.; Sioutas, C. Mobile platform measurements of ultrafine particles and associated pollutant concentrations on freeways and residential streets in Los Angeles. Atmos. Environ. 2005, 39, 3597–3610. [Google Scholar] [CrossRef]
- Xu, W.; Riley, E.A.; Austin, E.; Sasakura, M.; Schaal, L.; Gould, T.R.; Hartin, K.; Simpson, C.D.; Sampson, P.D.; Yost, M.G.; et al. Use of mobile and passive badge air monitoring data for NOX and ozone air pollution spatial exposure prediction models. J. Expo. Sci. Environ. Epidemiol. 2017, 27, 184–192. [Google Scholar] [CrossRef]
- Wong, P.P.Y.; Lai, P.-C.; Allen, R.; Cheng, W.; Lee, M.; Tsui, A.; Tang, R.; Thach, T.-Q.; Tian, L.; Brauer, M.; et al. Vertical monitoring of traffic-related air pollution (TRAP) in urban street canyons of Hong Kong. Sci. Total Environ. 2019, 670, 696–703. [Google Scholar] [CrossRef] [Green Version]
- Lee, M.; Brauer, M.; Wong, P.; Tang, R.; Tsui, T.H.; Choi, C.; Cheng, W.; Lai, P.-C.; Tian, L.; Thach, T.-Q.; et al. Land use regression modelling of air pollution in high density high rise cities: A case study in Hong Kong. Sci. Total Environ. 2017, 592, 306–315. [Google Scholar] [CrossRef] [PubMed] [Green Version]
- Tang, R.; Tian, L.; Thach, T.-Q.; Tsui, T.H.; Brauer, M.; Lee, M.; Allen, R.; Yuchi, W.; Lai, P.-C.; Wong, P.; et al. Integrating travel behavior with land use regression to estimate dynamic air pollution exposure in Hong Kong. Environ. Int. 2018, 113, 100–108. [Google Scholar] [CrossRef] [PubMed] [Green Version]
- Yang, Y.; Tang, R.; Qiu, H.; Lai, P.-C.; Wong, P.; Thach, T.-Q.; Allen, R.; Brauer, M.; Tian, L.; Barratt, B. Long term exposure to air pollution and mortality in an elderly cohort in Hong Kong. Environ. Int. 2018, 117, 99–106. [Google Scholar] [CrossRef] [Green Version]
- Chan, L.Y.; Kwok, W.S. Vertical dispersion of suspended particulates in urban area of Hong Kong. Atmos. Environ. 2000, 34, 4403–4412. [Google Scholar] [CrossRef]
- Vardoulakis, S.; Gonzalez-Flesca, N.; Fisher, B.E.A. Assessment of traffic-related air pollution in two street canyons in Paris: Implications for exposure studies. Atmos. Environ. 2002, 36, 1025–1039. [Google Scholar] [CrossRef]
- Janhäll, S.; Molnár, P.; Hallquist, M. Vertical distribution of air pollutants at the Gustavii Cathedral in Göteborg, Sweden. Atmos. Environ. 2003, 37, 209–217. [Google Scholar] [CrossRef]
- Wu, C.-D.; MacNaughton, P.; Melly, S.; Lane, K.; Adamkiewicz, G.; Durant, J.L.; Brugge, D.; Spengler, J.D. Mapping the vertical distribution of population and particulate air pollution in a near-highway urban neighborhood: Implications for exposure assessment. J. Expo. Sci. Environ. Epidemiol. 2014, 24, 297–304. [Google Scholar] [CrossRef] [Green Version]
- Li, X.L.; Wang, J.S.; Tu, X.D.; Liu, W.; Huang, Z. Vertical variations of particle number concentration and size distribution in a street canyon in Shanghai, China. Sci. Total Environ. 2007, 378, 306–316. [Google Scholar] [CrossRef]
- Wu, Y.; Hao, J.; Fu, L.; Wang, Z.; Tang, U. Vertical and horizontal profiles of airborne particulate matter near major roads in Macao, China. Atmos. Environ. 2002, 36, 4907–4918. [Google Scholar] [CrossRef]
- Guerreiro, M.S.; Abreu, I.M.; Monteiro, Á.; Jesus, T.; Fonseca, A. Considerations on the monitoring of water quality in urban streams: A case study in Portugal. Environ. Monit. Assess. 2020, 192, 347. [Google Scholar] [CrossRef]
- Su, X.; Sutarlie, L.; Loh, X.J. Sensors, Biosensors, and Analytical Technologies for Aquaculture Water Quality. Research 2020, 2020, 8272705. [Google Scholar] [CrossRef] [PubMed] [Green Version]
- Pasika, S.; Gandla, S.T. Smart water quality monitoring system with cost-effective using IoT. Heliyon 2020, 6, e04096. [Google Scholar] [CrossRef] [PubMed]
- Yu, H.-C.; Tsai, M.-Y.; Tsai, Y.-C.; You, J.-J.; Cheng, C.-L.; Wang, J.-H.; Li, S.-J. Development of Miniaturized Water Quality Monitoring System Using Wireless Communication. Sensors 2019, 19, 3758. [Google Scholar] [CrossRef] [PubMed] [Green Version]
- Sambito, M.; Di Cristo, C.; Freni, G.; Leopardi, A. Optimal water quality sensor positioning in urban drainage systems for illicit intrusion identification. J. Hydroinform. 2019, 22, 46–60. [Google Scholar] [CrossRef]
- Kotamäki, N.; Järvinen, M.; Kauppila, P.; Korpinen, S.; Lensu, A.; Malve, O.; Mitikka, S.; Silander, J.; Kettunen, J. A practical approach to improve the statistical performance of surface water monitoring networks. Environ. Monit. Assess. 2019, 191, 318. [Google Scholar] [CrossRef] [Green Version]
- Pekey, H.; Karakaş, D.; Bakoglu, M. Source apportionment of trace metals in surface waters of a polluted stream using multivariate statistical analyses. Mar. Pollut. Bull. 2004, 49, 809–818. [Google Scholar] [CrossRef]
- Shrestha, S.; Kazama, F. Assessment of surface water quality using multivariate statistical techniques: A case study of the Fuji river basin, Japan. Environ. Model. Softw. 2007, 22, 464–475. [Google Scholar] [CrossRef]
- Sambito, M.; Freni, G. Strategies for Improving Optimal Positioning of Quality Sensors in Urban Drainage Systems for Non-Conservative Contaminants. Water 2021, 13, 934. [Google Scholar] [CrossRef]
- Schumann, G.J.P.; Muhlhausen, J.; Andreadis, K.M. Rapid Mapping of Small-Scale River-Floodplain Environments Using UAV SfM Supports Classical Theory. Remote Sens. 2019, 11, 982. [Google Scholar] [CrossRef] [Green Version]
- Annis, A.; Nardi, F.; Petroselli, A.; Apollonio, C.; Arcangeletti, E.; Tauro, F.; Belli, C.; Bianconi, R.; Grimaldi, S. UAV-DEMs for Small-Scale Flood Hazard Mapping. Water 2020, 12, 1717. [Google Scholar] [CrossRef]
- Backes, D.; Schumann, G.; Teferele, F.N.; Boehm, J. Towards a High-Resolution Drone-Based 3D Mapping Dataset to Optimise Flood Hazard Modelling. Int. Arch. Photogramm. Remote Sens. Spat. Inf. Sci.—ISPRS Arch. 2019, 42, 181–187. [Google Scholar] [CrossRef] [Green Version]
- Mourato, S.; Fernandez, P.; Pereira, L.; Moreira, M. Improving a DSM Obtained by Unmanned Aerial Vehicles for Flood Modelling. IOP Conf. Ser. Earth Environ. Sci. 2017, 95, 022014. [Google Scholar] [CrossRef]
- Langhammer, J.; Bernsteinová, J.; Miřijovský, J. Building a High-Precision 2D Hydrodynamic Flood Model Using UAV Photogrammetry and Sensor Network Monitoring. Water 2017, 9, 861. [Google Scholar] [CrossRef]
- Watson, C.; Kargel, J.; Tiruwa, B. UAV-Derived Himalayan Topography: Hazard Assessments and Comparison with Global DEM Products. Drones 2019, 3, 18. [Google Scholar] [CrossRef] [Green Version]
- Leitão, J.P.; Moy De Vitry, M.; Scheidegger, A.; Rieckermann, J. Assessing the Quality of Digital Elevation Models Obtained from Mini Unmanned Aerial Vehicles for Overland Flow Modelling in Urban Areas. Hydrol. Earth Syst. Sci. 2016, 20, 1637–1653. [Google Scholar] [CrossRef] [Green Version]
- Strecha, C.; Pylvänäinen, T.; Fua, P. Dynamic and scalable large scale image reconstruction. In Proceedings of the 2010 IEEE Computer Society Conference on Computer Vision and Pattern Recognition, San Francisco, CA, USA, 13–18 June 2010; pp. 406–413. [Google Scholar]
- Gool, V. Dense matching of multiple wide-baseline views. In Proceedings of the Ninth IEEE International Conference on Computer Vision, Nice, France, 13–16 October 2003; Volume 1192, pp. 1194–1201. [Google Scholar]
- Strecha, C.; Van Gool, L.; Fua, P. A Generative Model for True Orthorectification. In Proceedings of the ISPRS Congress, Beijing, China, 3–11 July 2008. [Google Scholar]
- Strecha, C.; Von Hansen, W.; Gool, L.V.; Fua, P.; Thoennessen, U. On benchmarking camera calibration and multi-view stereo for high resolution imagery. In Proceedings of the 2008 IEEE Conference on Computer Vision and Pattern Recognition, Anchorage, AK, USA, 23–28 June 2008; pp. 1–8. [Google Scholar]
- Agarwal, S.; Furukawa, Y.; Snavely, N.; Curless, B.; Seitz, S.M.; Szeliski, R. Reconstructing Rome. Computer 2010, 43, 40–47. [Google Scholar] [CrossRef]
- Kannala, J.; Brandt, S.S. A generic camera model and calibration method for conventional, wide-angle, and fish-eye lenses. IEEE Trans. Pattern Anal. Mach. Intell. 2006, 28, 1335–1340. [Google Scholar] [CrossRef] [Green Version]
- Hughes, C.; Denny, P.; Jones, E.; Glavin, M. Accuracy of fish-eye lens models. Appl. Opt. 2010, 49, 3338–3347. [Google Scholar] [CrossRef] [Green Version]
- Lowe, D.G. Distinctive Image Features from Scale-Invariant Keypoints. Int. J. Comput. Vis. 2004, 60, 91–110. [Google Scholar] [CrossRef]
- Scharstein, D.; Szeliski, R. A Taxonomy and Evaluation of Dense Two-Frame Stereo Correspondence Algorithms. Int. J. Comput. Vis. 2002, 47, 7–42. [Google Scholar] [CrossRef]
Figure 1.
Flow chart for unmanned aerial vehicle (UAV) processing.

Figure 2.
Phantom 4 RTK in a UAV.

Figure 3.
Trimble R4s used in Global Navigation Satellite System (GNSS) surveying.

Figure 4.
Pix4D Mapper.

Figure 5.
Concept map of the watershed analysis method.

Figure 6.
Study area in Samcheok City, Gangwon-do, Korea.

Figure 7.
Camera angle for photographing UAV: (a) 90°; (b) 60°.

Figure 8.
Calibration using initial processing and Ground Control Point (GCP): (a) Initial processing; (b) Ground Control Point (GCP).
Figure 8.
Calibration using initial processing and Ground Control Point (GCP): (a) Initial processing; (b) Ground Control Point (GCP).

Figure 9.
Topographical analysis result using Pix4D Mapper: (a) Orthomosaic; (b) Digital Surface Model (DSM).
Figure 9.
Topographical analysis result using Pix4D Mapper: (a) Orthomosaic; (b) Digital Surface Model (DSM).

Figure 10.
3D model of the study area.

Figure 11.
Watershed analysis using topographic data of UAV. (a) Contour; (b) watershed.

Figure 12.
Watershed analysis thresholds: (a) 300; (b) 700; (c) 1100.

Figure 13.
Elevation analysis of roads for stormwater flow: (a) Elevation of roads; (b) transverse direction of A; (c) longitudinal direction of B.
Figure 13.
Elevation analysis of roads for stormwater flow: (a) Elevation of roads; (b) transverse direction of A; (c) longitudinal direction of B.

Figure 14.
Selection of the monitoring point.


Table 1.
Specification of Phantom 4 RTK.
| UAV Characteristics | |
|---|---|
| Weight | 1391 g |
| Diagonal Length | 350 mm |
| Maximum Speed | Rise: 6 m/s (Automatic flight), 5 m/s (Manual control), Down: 3 m/s, 50 km/h (P Mode) 58 km/h (A Mode) |
| Maximum Flight Time | About 30 min |
| Operating Temperature Range | 0~40 °C |
| Camera Characteristics | |
| Sensors | 1” CMOS, Valid Pixel: 20 M |
| Lens | FOV 84°, 8.8 mm/24 mm, f/2.8~f/11, 1 m~∞ |
| International Organization for Standardization (ISO) Range | video: 100~3200 (Auto), 100~6400 (Manual), photo: 100~3200 (Auto), 100~12,800 (Manual) |
| Mechanical shutter speed | 8~1/2000 s |
| Electronic shutter speed | 8~1/8000 s |
| Field Of View (FOV) | Front/Rear: 60° (Horizontal), ±27° (Verticality), Down: 70° (Front and Rear), 50° (Left and Right) |
Table 2.
Specifications of the Trimble R4s.
| Performance | |
|---|---|
| Channel | 240 Channel |
| Static Positioning | Horizontal: 3 mm + 0.1 ppm Verticality: 3.5 mm + 0.4 ppm |
| Virtual Reference System (VRS) | Horizontal: 8 mm + 1 ppm Verticality: 15 mm + 1 ppm |
| Input/Output | ATOM, CMR, CMR+, RTCM, CMRx, NMEA |
| Radio Modem | 410–470 MHz, 2 W output |
| Port | RS-232, USB2.0, Bluetooth 2.1 |
| Weight | 930 g |
| Operating Temperature | −40° to +65° |
Table 3.
Flight planning establishment.
| Classification | Contents | |
|---|---|---|
| Photographing Area | 0.222 km2 | |
| Photographing Altitude | El. 120 m | |
| Photographing Point Altitude | Approximate El. 60 m | |
| Overlap Rate | Longitudinal: 80%, Transverse: 80% | |
| Camera Angle | 90° | 60° |
| Number of Photographs | 179 | 336 |
| Image Coordinate | WGS84 | |
Table 4.
Condition of the Global Navigation Satellite Systems (GNSS) observation station.
| Classification | Contents |
|---|---|
| Observation Station | Samcheok |
| Receiver Type | NetR9 |
| Antenna Type | ChokeRing |
| Radio Technical Commission for Maritime services (RTCM) Type | SAMC-RTCM30 |
| Coordination | Latitude: 37-26-9.96, Longitude: 129-11-17.16, Ellipsoid Height: 40.30 |
| Address | 196 Samcheokhang-gil, Gangwon-do. |
 | |
Table 5.
Evaluation of quality characteristics of topographical data.
| Classification | Contents |
|---|---|
| Average Ground Sampling Distance (GSD) | 1 × GSD (3.4 [cm/pixel]) |
| Area Covered | 0.222 km2 |
| Images | median of 14,665 keypoints per image |
| Dataset | 515 out of 515 images calibrated (100%), all images enabled |
| Camera Optimization | 0.68% relative difference between initial and optimized internal camera parameters |
| Matching | median of 3377.6 matches per calibrated image |
| Root Mean Square Error (RMSE) | 0.051 m |
Table 6.
Number of watersheds by thresholds.
| Thresholds | Watershed (Count) | Thresholds | Watershed (Count) |
|---|---|---|---|
| 100 | 35 | 700–1000 | 7 |
| 200 | 19 | 1100–1700 | 3 |
| 300 | 11 | Over 1700 | 1 |
| 400–600 | 8 |
Publisher’s Note: MDPI stays neutral with regard to jurisdictional claims in published maps and institutional affiliations. |
© 2022 by the authors. Licensee MDPI, Basel, Switzerland. This article is an open access article distributed under the terms and conditions of the Creative Commons Attribution (CC BY) license (https://creativecommons.org/licenses/by/4.0/).
Share and Cite
MDPI and ACS Style
Song, Y.; Lee, H.; Kang, D.; Kim, B.; Park, M. A Study on the Determination Methods of Monitoring Point for Inundation Damage in Urban Area Using UAV and Hydrological Modeling. Water 2022, 14, 1117. https://doi.org/10.3390/w14071117
AMA Style
Song Y, Lee H, Kang D, Kim B, Park M. A Study on the Determination Methods of Monitoring Point for Inundation Damage in Urban Area Using UAV and Hydrological Modeling. Water. 2022; 14(7):1117. https://doi.org/10.3390/w14071117
Chicago/Turabian StyleSong, Youngseok, Hyeongjun Lee, Dongho Kang, Byungsik Kim, and Moojong Park. 2022. "A Study on the Determination Methods of Monitoring Point for Inundation Damage in Urban Area Using UAV and Hydrological Modeling" Water 14, no. 7: 1117. https://doi.org/10.3390/w14071117
Note that from the first issue of 2016, this journal uses article numbers instead of page numbers. See further details here.