
Trophic Patterns of Freshwater Fish across the Balkan Biodiversity Hotspot
by
 , , ,
, , ,
Georgios Vagenas
* ,
,
Anthi Oikonomou
 ,
,
Paraskevi K. Karachle
 ,
,
Olga Petriki
and
Maria Th. Stoumboudi
Institute of Marine Biological Resources and Inland Waters, Hellenic Centre for Marine Research (HCMR), 16452 Attica, Greece
*
Author to whom correspondence should be addressed.
Water 2022, 14(7), 1112; https://doi.org/10.3390/w14071112
Submission received: 26 February 2022
/
Revised: 26 March 2022
/
Accepted: 29 March 2022
/
Published: 31 March 2022
(This article belongs to the Special Issue Recent Advances in Freshwater Fish Ecology and Fisheries Management)
Abstract
:Ecological information regarding trophic patterns and the inherent structure of freshwater aquatic communities is considered fundamental in ecological research. In this study, the trophic patterns of the Greek freshwater fish fauna, belonging to the Balkan biodiversity hotspot, were investigated, and comparisons of freshwater fish species feeding habits among the Greek freshwater ecoregions were performed. The analyses based on the widely used trophic level index and the available composition feeding datasets, along with the utilization of clustering methods, indicated seven major distinct trophic guilds in the Greek ecoregions. The trophic level of the studied fish species ranged from 2.0 to 4.5, thus being within the expected values for freshwater ecosystems, revealing the presence of both top predators and primary consumers. The highest trophic level values were found in the ecoregions of northern Greece. The results also exhibited considerable predominance of higher-trophic-level zooplanktivorous and insectivorous freshwater fish species in the mainland, compared to lower-trophic-level opportunist species in the island-isolated ecoregions. These results could be used for the application of ecosystem-based models and the formulation of conservation and fishery management schemes.
Keywords:
freshwater ecosystems; freshwater fish; trophic level; trophic guild; DCA; biogeography; Balkans; Greece1. Introduction
Freshwaters are considered the most vulnerable aquatic ecosystems, facing threats such as water pollution and overexploitation, flow modification. and invasive species [1,2,3] that pose immense pressure to their biodiversity. The current status of these ecosystems and their provided ecosystem services is rather alarming [4,5], whereby nearly one-third of all freshwater fish species that have been assessed for their conservation status by the International Union for Conservation of Nature (i.e., IUCN) are threatened with extinction [6].
From a historical perspective, the antagonistic behavior among organisms has been recognized since the 19th century by Darwin in the fundamental work “On the Origin of Species”, referred to as the struggle of existence [7]. Observations related to resource competition and habitat diversity have stimulated nature scientists into exploring the underlying mechanisms and patterns of trophic dynamics. In addition to the intra/inter-taxa differences in behavior, the dynamics of energy and matter flow within the aquatic ecosystems are highly affected by the structure of the trophic interactions, which can impact the trophic state [8,9,10]. Trophodynamics can affect, among others, vegetation cover, diseases, erosion, and biochemical and hydrological cycles [11]. Hence, there is an urgent need for studies concerning the trophic structure of biological communities.
Trophic guilds stand out among the most widely used functional guilds, due to their ability to “describe” an ecosystem’s clear response to environmental changes, and the fact that changes in trophic interactions and food web disruptions can cause significant quantitative and qualitative ecosystem changes. For example, the shift in a freshwater fish community from piscivorous prevalence to omnivorous domination (mainly Cyprinidae species) may be indicative of the system’s eutrophication [12], as cyprinids prefer eutrophic waters [13,14]. Under the framework of operational research, information regarding trophic guilds and the interactions among them is deemed as fundamental for the exploration of aquatic food webs and their inherent structure, while it can be utilized for formulating restoration and conservation strategies [15,16,17], as well as for ecosystem-based modeling [18,19].
In terms of European freshwater ichthyofauna, numerous studies dealt with functional guilds in general, including trophic ones [20,21]. However, these studies mainly concerned northern and central Europe [22], with the Balkan subregion of the Mediterranean hotspot for freshwater fish biodiversity [23] being largely understudied. Specifically, studies on the trophic guilds of the freshwater ichthyofauna of Greece or the wider Balkan area are lacking, with previous studies focusing on the diet of individual species [24,25,26] or on fish species interactions in aquatic ecosystems [27,28,29]. Greek freshwaters have distinctive properties that both underpin and challenge ecologists, since they are characterized by rich, highly endemic biodiversity, as a result of vast geological processes in the Balkan Peninsula and the isolation of the highly fragmented hydrographic networks [23,30,31].
Since species traits are necessary to facilitate studies of ecology, conservation, and fishery management, we conducted an extensive analysis using the available information on the trophic patterns of freshwater fish species of Greece. In addition to constituting the first step toward the elucidation of traits of the Greek freshwater fish, the present work attempts to provide baseline information regarding species trophic guilds and ecology, as well as to interpret the underlying biogeographical mechanisms. Thus, the present study can function as a basis for further scientific and administrative initiatives, aimed at the development of freshwater resources sustainable management and conservation schemes.
2. Materials and Methods
2.1. Data Collection
Data were collected through an extensive literature survey on the feeding habits and diet composition of fish species from the freshwater aquatic ecoregions of Greece. Initially, species trophic level (τ) was retrieved from the Fishbase database [32]. In addition, Scopus, Web of Science, and Google Scholar databases were explored using a Boolean search with the following combinations of keywords: Greece AND freshwater fish AND diet; Greece AND aquatic AND diet; Balkans AND fish AND diet; Balkans AND freshwater fish AND diet. Whenever trophic level or diet composition information was lacking, we used information for the same species in adjacent regions. Additionally, information was collected from gray literature (e.g., conference papers, academic theses, technical reports). Species and family names, along with their spatial allocation, were assigned according to previous works where the authors proceeded in an extensive coverage of all the types of aquatic ecosystems of Greece [33,34]. Each species was categorized to the Greek ecoregions on the basis of the biogeographical scheme proposed by Zogaris and Economou [35]. According to the aforementioned study, the Greek ichthyological ecoregions are (1) Thrace, (2) Macedonia-Thessaly, (3) Southeastern Adriatic, (4) Western Aegean, (5) Ionian, (6) Crete, (7) Eastern Aegean, and (8) Southern Anatolia. The Greek area of the latter ecoregion comprises Kastellorizo Island and its surrounding islets that are lacking permanent streams, wetlands, and native freshwater fish species; thus, it was excluded from the analyses.
2.2. Data Analysis
Under the framework of a consistent methodological protocol, the trophic level (τ) of the species was derived from the Fishbase database according to the following equation [36]:
where τj is the trophic level of prey j, DCij represents the proportion of j in the diet of species i, and G is the total number of preys [37]. Subsequently, trophic pattern analysis took place with the visualization of the mean τ-value (τmean) of each family connected to each ecoregion in the form of a visualized geometric rectangle (τmean step = 1). To achieve a better understanding of the species trophic patterns, we estimated the trophic guilds following the work of Pereira et al. [38].
A complete quantitative mass (w/w %) prey composition dataset was obtained for 60 species with data gathered in the bibliographic survey. Thus, the identified preys of the dataset were sorted into the following groups: detritus, algae, other plant material (e.g., macrophytes), aquatic insects (pupa and larvae), terrestrial insects, microcrustaceans (cladocerans, copepods, ostracods), other invertebrates (e.g., mollusks, worms), and nekton (fish). Initially, the data were scaled through square-root transformation, which significantly reduced skewness, and then ordinated through detrended correspondence analysis (DCA) [38,39,40]. This method has been proven to be one of the most efficient discriminating analyses in producing clusters with respect to habitats [39,41]. More specifically, the initial dataset was sorted in a matrix (n, p) with the included values of prey types j (p) in species i (n) being aij, and an arbitrarily chosen score (xi) for each species. Hence, with the use of the following equations, scores for each taxon were calculated as weighted averages (yi; Equation (1)), and then a new set of species scores (xi; Equation (2)) was produced [42]:
The xi scores for each sample were centered and standardized so that their mean was equal to zero (Equation (3)) and their variance was equal to one (Equation (4)) with the procedure applied progressively until the scores were stabilized.
Moreover, a final detrending ordination was applied with the use of sliding moving-average window algorithm, while the rescaling of the axis was accomplished by equalizing the weighted variance of yj scores along the axis segments [42]. Subsequently, the scores of the first two generated axes (DCA1–DCA2) created by the DCA were selected for clustering via the unsupervised k-means method, operated on 999 randomized iterations. The number of the optimal clusters was determined with the “average silhouette” and the “gap statistic” method operated through 999 Monte Carlo simulations. According to the silhouette routine, the optimal number of clusters during k-means clustering is estimated when the score of the average silhouette width is maximized [43]. The gap statistic method was used to validate the results of the silhouette routine, where the optimal number of clusters (k) is selected as the minimum point estimation () where the gap statistic is greater than or equal to the gap statistic of its higher by one (k + 1) cluster minus its standard error (Sk+1) deviation [44], where can be identified as the cluster point where the successively increase rate (slope) of the gap statistic is significantly minimized among the cluster populations.
Each trophic guild was named according to the food source type that appeared to exhibit the highest contribution to species diet. Finally, the guilds were aggregated on the basis of the food composition percentage and their distribution in the Greek ecoregions. All analyses were performed in the R programming environment [45].
3. Results
3.1. Trophic Level
Overall, the bibliographic survey yielded a dataset of 157 fish species of the Greek freshwater ichthyofauna, which belonged to 26 families. Cyprinidae was the most abundant family with the widest distribution. The species trophic level ± s.e. spanned values from 2.0 ± 0.00 to 4.5 ± 0.80 with an estimated mean trophic level (τmean) equal to 3.16. The most widespread species with the lowest trophic level were Ctenopharyngodon idella, Hypophthalmicthys molitrix, and Poecilia latipinna, while the species with the highest trophic level were Leuciscus aspius, Huso huso, and Perca fluviatilis. The greatest diversity regarding species richness was observed in the ecoregions of Thrace, Macedonia-Thessaly, and the Ionian. The τmean of the ecoregions ranged from 3.24 (Thrace) to 3.01 (Eastern Aegean) (Table 1), while the global mean trophic level for all Greek ecoregions was estimated at 3.14.
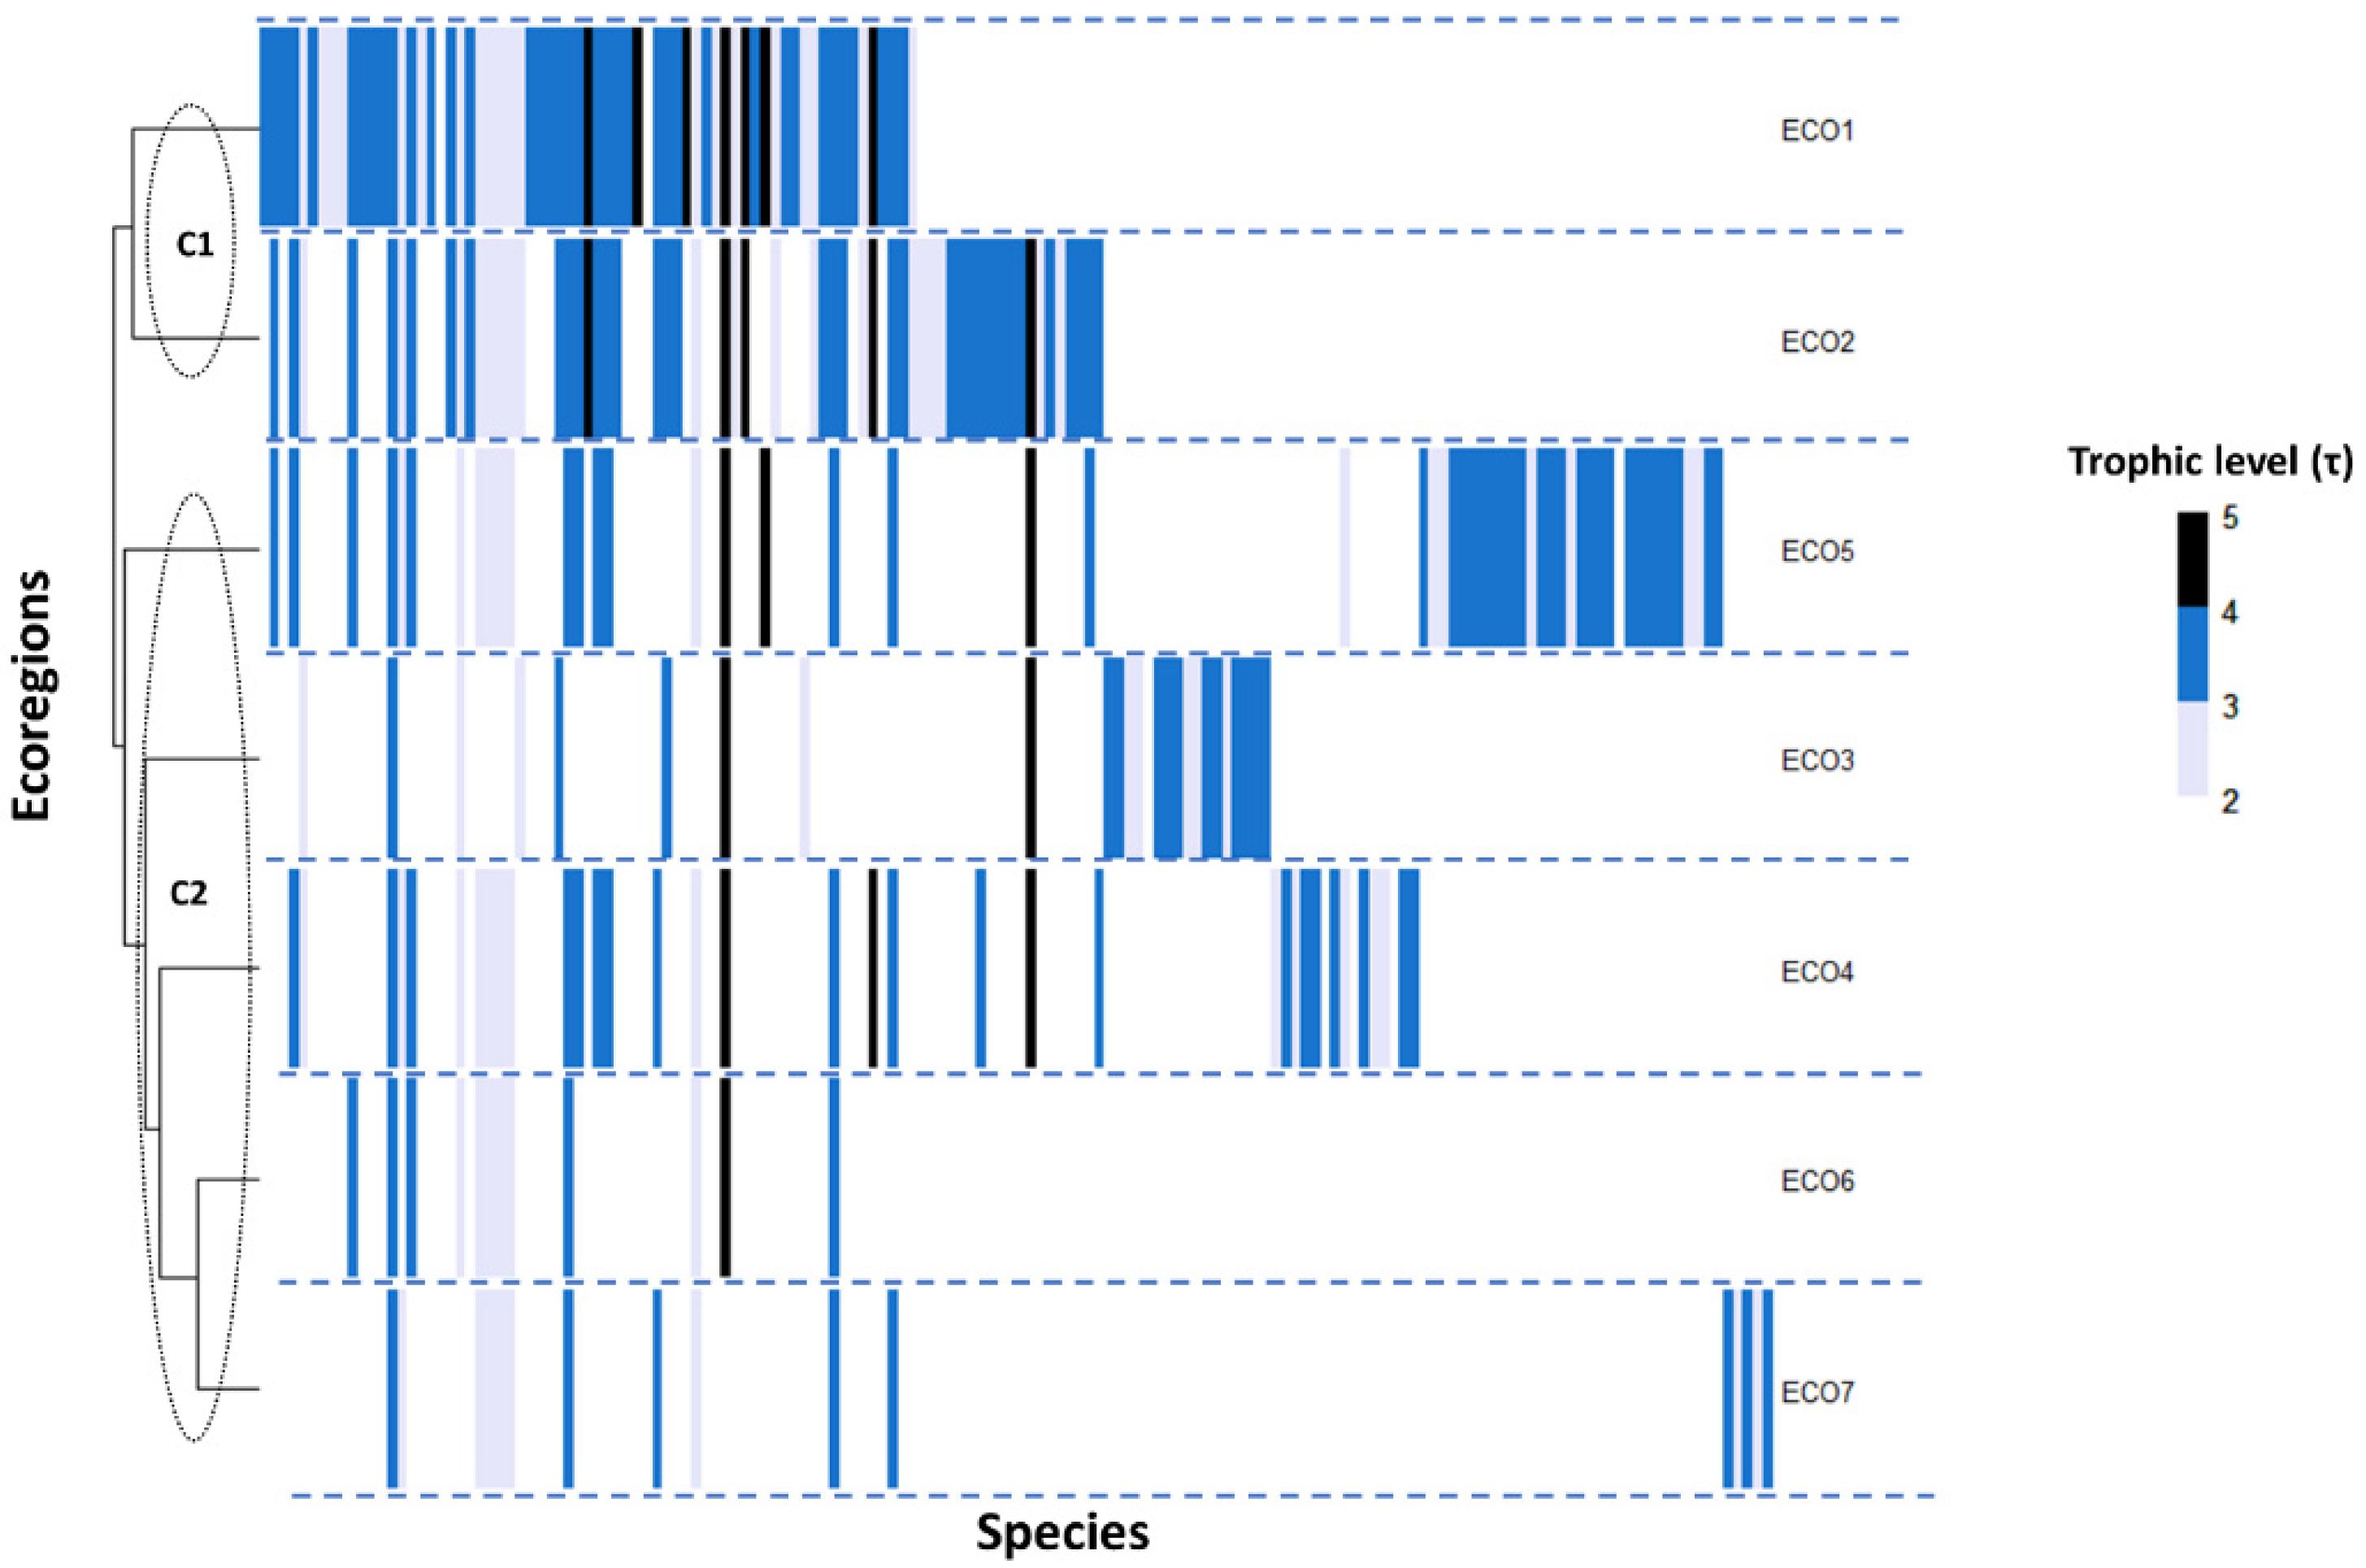
The hierarchical clustering of the species τ-value, as a function of the Euclidean and the Manhattan distance, resulted in the same pattern. As a result, the ecoregions of Thrace and Macedonia-Thessaly in northeastern and northern Greece formed a unique trophic–ecoregional cluster (C1, Figure 1), which actually hosted all the different families that constituted the aquatic freshwater fish diversity of Greece, except for Valenciidae, Coregonidae, and Cichlidae.
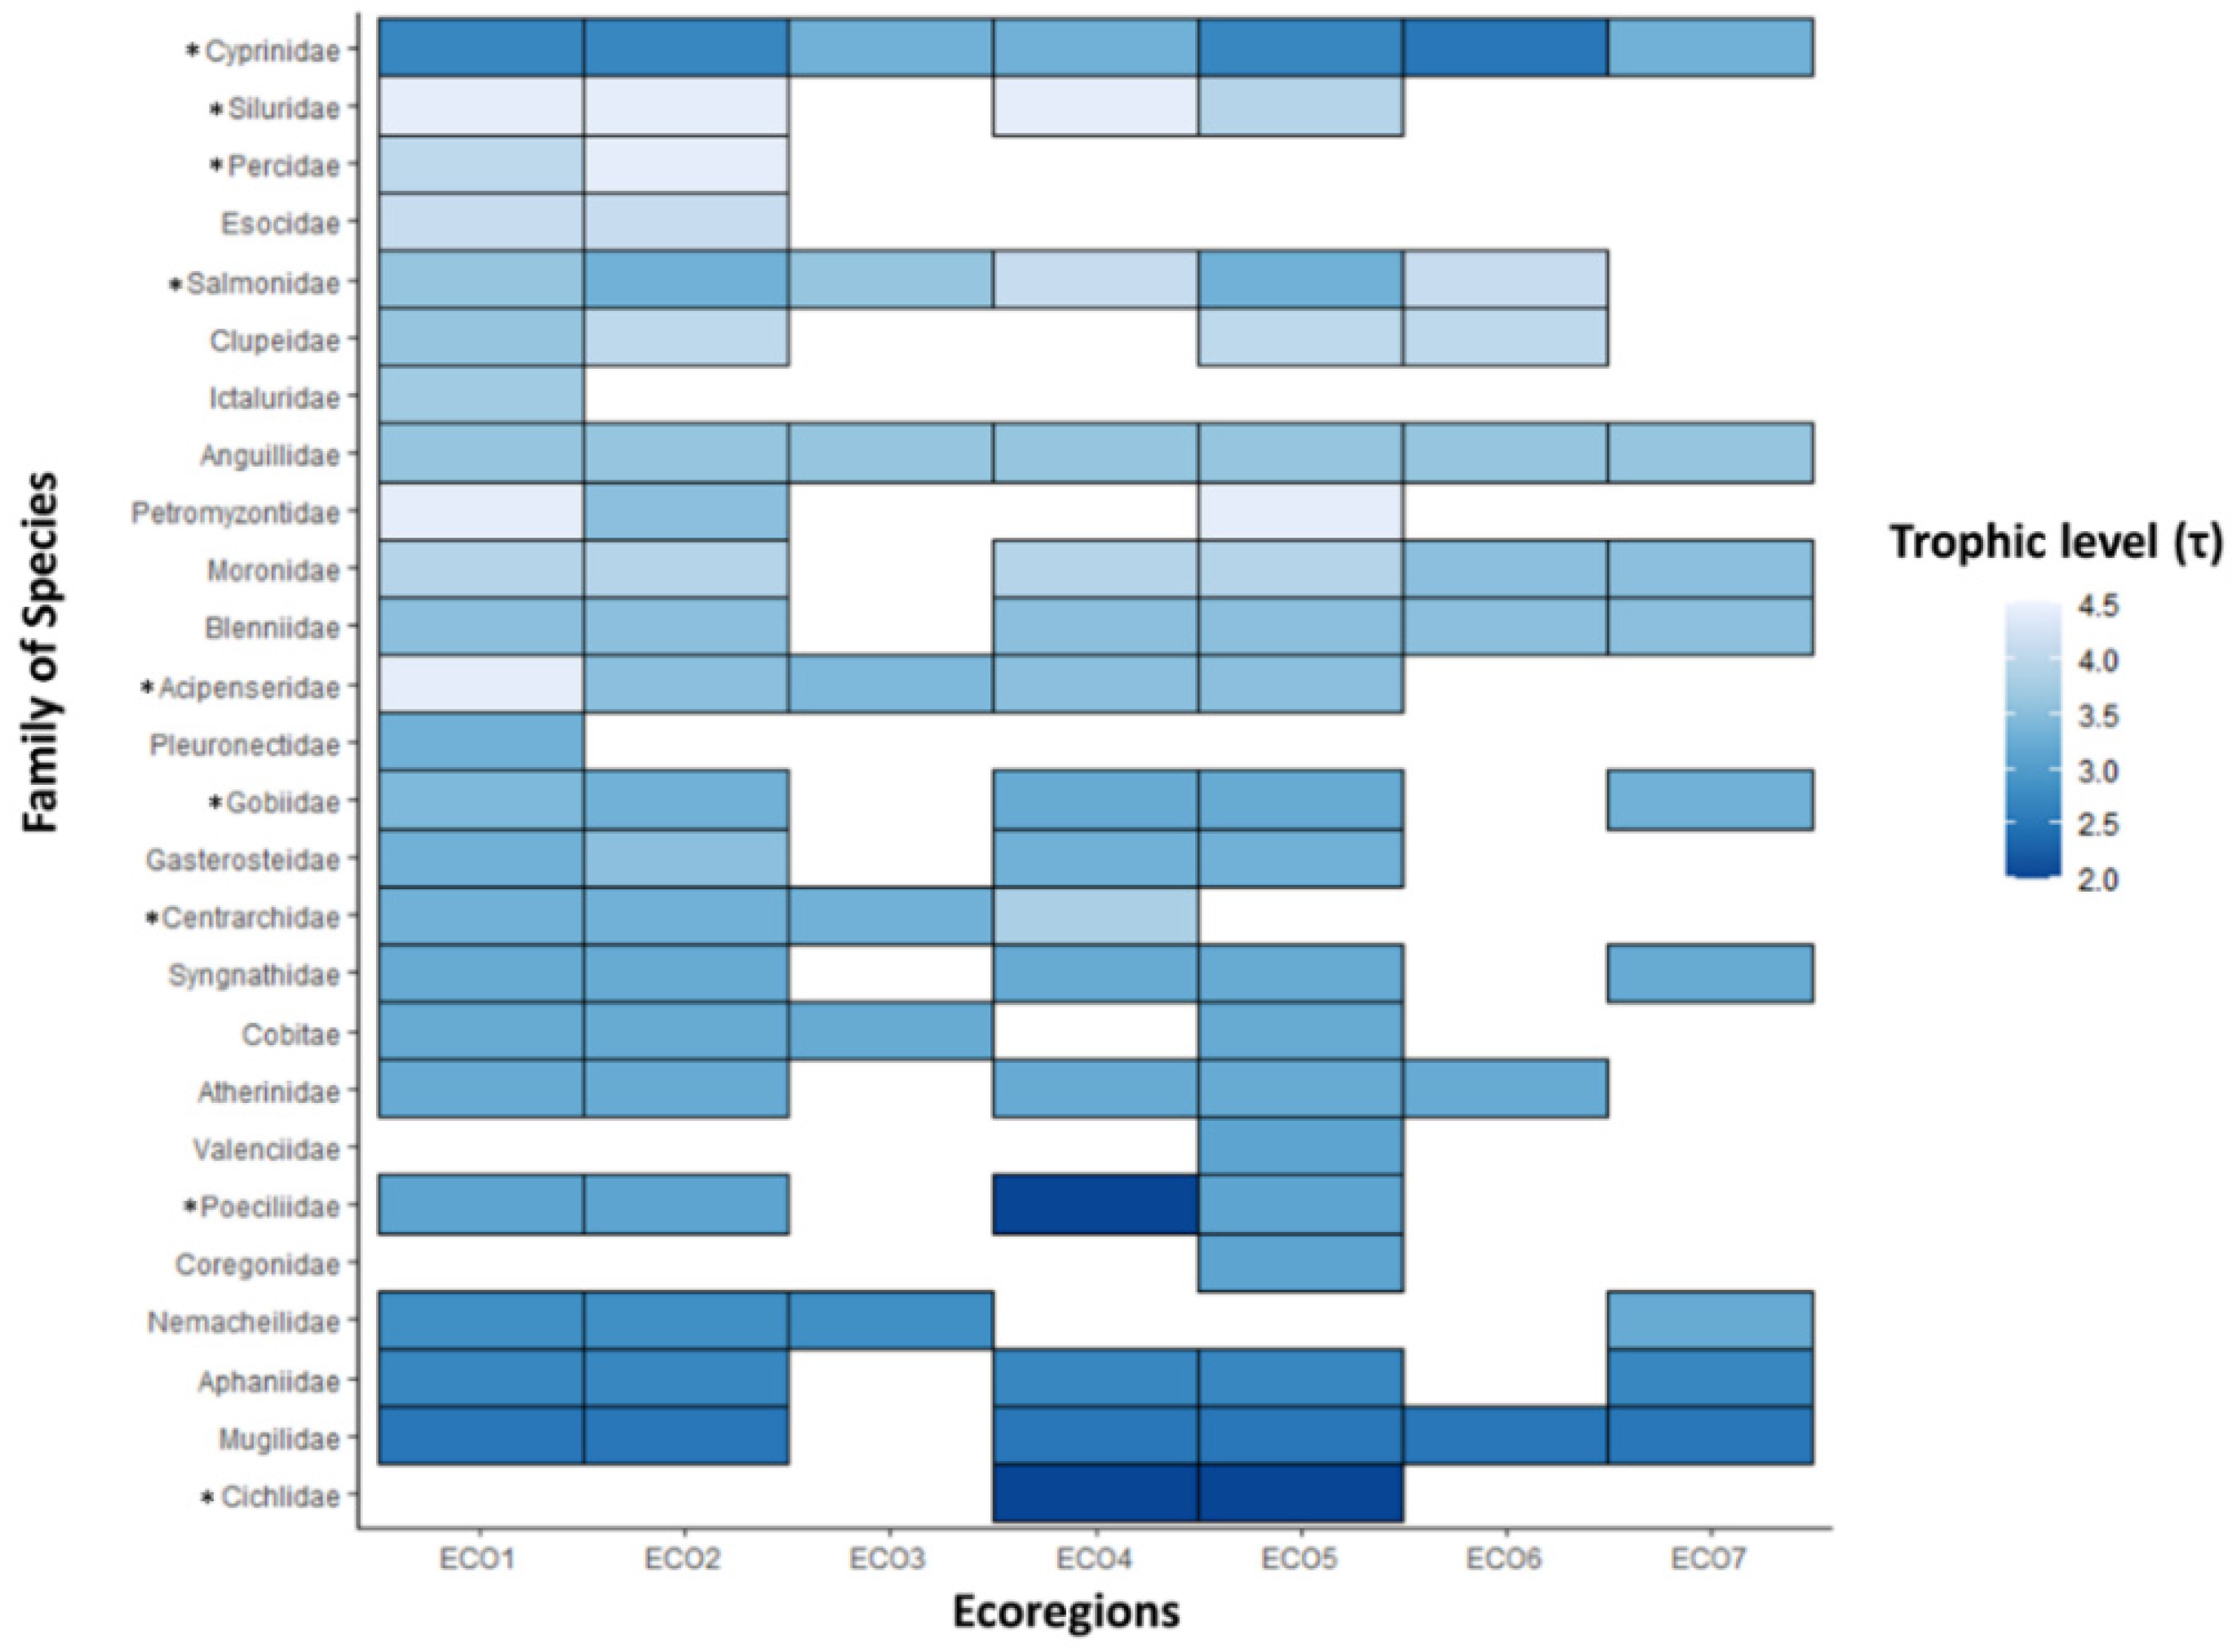
In addition, the Ionian ecoregion of Greece, located on the southwest side of the Balkan Peninsula, appeared to be quite species-distinct and isolated as a part of the second trophic cluster, while it appeared to function as an intermediary node between C1 and C2 (Figure 1). The hierarchical algorithm aggregated the ecoregions of Crete and Eastern Aegean, which are on the southeast Greek Island region, in one distinct subcluster of C2. Families Cyprinidae and Salmonidae demonstrated the largest heterogeneity regarding their species τ-values among the different ecoregions, while Cyprinidae and Anguillidae (i.e., Anguilla anguilla) appeared to be the two most widespread taxa (Figure 2).
3.2. Trophic Guilds
Prey composition was analyzed by DCA for the 60 species with diet data available. The scores of the DCA1 (56.8%) and DCA2 (34.9%) of the analysis that were imported into the k-means unsupervised algorithm resulted in the identification of seven distinct trophic guild groups in the Greek freshwater fish species (G1–G7, Figure 3a). The optimal number of clusters (= 7; Table 2) was estimated and validated with the use of the average silhouette width (widthmax = 0.403) and the gap statistic estimation (GS; GS = 0.495, GS ratemin = −2.4%).
The ratio of the between-cluster sum of squares and the total sum of squares was estimated at 91.7%, indicating increased internal cohesion and external separation of the allocated clustered guilds. The group related to the centroid of the scaled ordination analysis (Figure 3a; red circle) was G1, while the most isolated groups were G3 and G6.
More specifically, the “piscivorous” trophic guild group (G3, N = 7) appeared to be the one with species that demonstrated almost exclusive prey preference in nekton (fish) sources of food (94.1%, Table 3). The sixth trophic guild group (G6, N = 4), which was the subsequent most isolated according to the DCA ordination, included species that demonstrated a high feeding preference in algae (79.1%) and, thus, was named the “herbivorous” group. Another two quite distinct trophic guild groups were the fourth (G4, N = 12), which showed main preference for aquatic insects (65.1%), and the seventh (G7, N = 7), which exhibited preference in detritus (29.8%) and terrestrial insects (27.1%). Thus, the G4 and G7 trophic guild groups were named “insectivorous” and “opportunistic detritivorous”, respectively. The second “opportunistic piscivorous” group (G2, N = 6) included species which fed mainly with nekton (36.7%) and microcrustaceans (24.3%). Lastly, the fifth trophic guild group G5 (N = 11) included species that fed with microcrustaceans (38.6%) and detritus (35.1%), while G1 (N = 13) exhibited a specialized preference in microcrustaceans (57.1%). Therefore, G5 was described as “opportunistic zooplanktivorous” and G1 was described as “zooplanktivorous”.
According to the ordination map of the prey resources (Figure 3b), it appears that the only preys that were grouped together were the generic invertebrates (e.g., mollusks and worms) and the aquatic insects. Moreover, according to their location, the analysis raised the narrow linking between the prey types of plant matter and terrestrial insects, along with algae and detritus (Figure 3b). The nekton food resources point of ordination was isolated as a cluster of distinct preference, while microcrustacean prey was characterized as the centroid point of the ordination analysis.
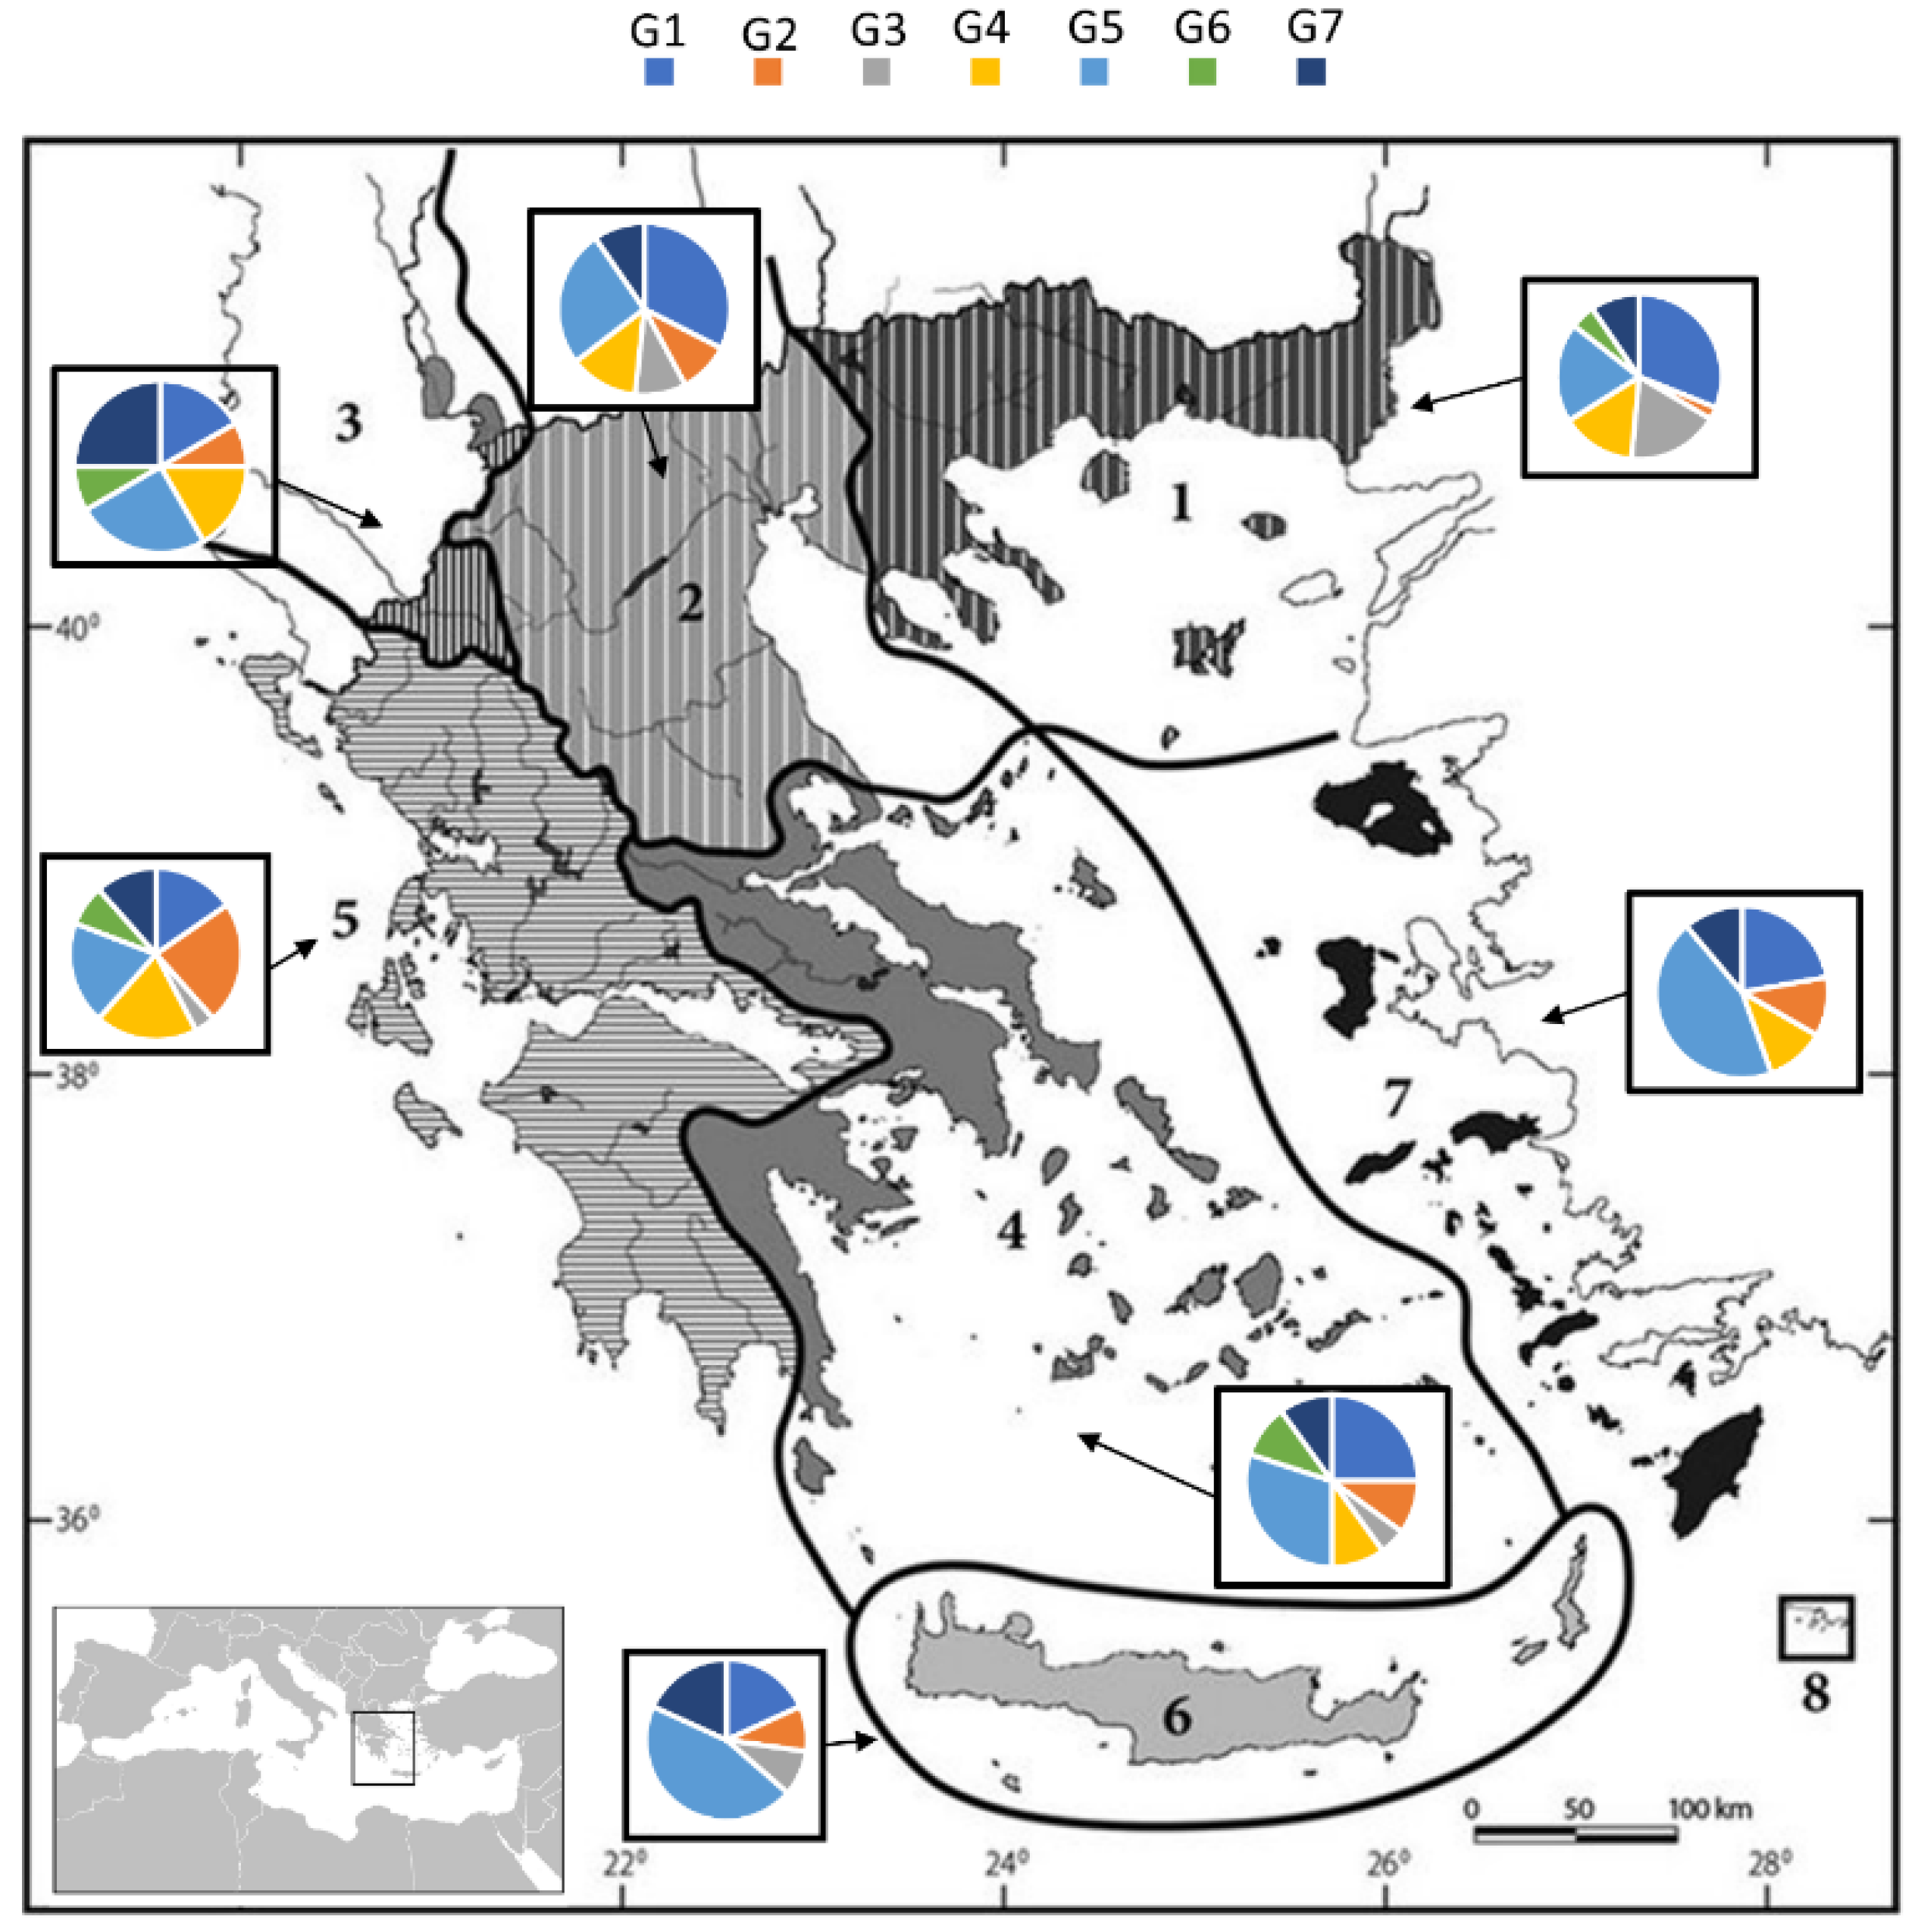
The relation of the Greek ecoregions to each functional trophic guild revealed that the ecoregion of Thrace was dominated by the zooplanktivorous species (G1 and G5), with the other trophic guilds following a descending order (Figure 4). Similarly, the ecoregion of Macedonia-Thessaly displayed a similar pattern where zooplanktivorous species (G1 and G5) were dominant, while insectivorous species (G4) also exhibited a considerable presence. The southeastern Adriatic showed a slightly different composition, as it mainly hosted opportunistic zooplanktivorous (G5) and opportunistic detritivorous species (G7).
A common pattern can be observed in the ecoregions of Western Aegean and Ionian, where zooplanktivorous species were the majority, while insectivorous and opportunistic piscivorous species showed an increase in the Ionian ecoregion compared to the rest. Regarding the exclusively island ecoregions of Greece (Crete and Eastern Aegean), a common trophic pattern existed as opportunistic zooplanktivorous species were the most abundant.
Τhe piscivorous and herbivorous groups had the highest (G3; τmean = 4.15, τmedian = 4.1) and the lowest (G6; τmean =2.25, τmedian = 2.00) trophic level values (Figure 5). The groups of insectivorous (G4; τmean = 3.2, τmedian = 3.2) and the zooplanktivorous (G1; τmean = 3.33, τmedian = 3.3) species demonstrated a more balanced variation in their τ-values. Lastly, the species that belonged to the opportunistic detritivorous (G7; τmean = 2.94, τmedian = 2.7), opportunistic piscivorous (G2; τmean = 3.48, τmedian = 3.35), and opportunistic zooplanktivorous (G5; τmean = 2.78, τmedian = 2.8) groups were characterized by an even more centroid-alike allocation of their τ-values due to their wider spectrum of food preference.
4. Discussion
This work represents the first attempt at the analysis of the trophic patterns of the freshwater fish species of Greece, in the southern Balkan biodiversity hotspot. The range of the trophic level of the studied fish species (i.e., from 2.0 to 4.5) was within the expected values for freshwater ecosystems, revealing the presence of both top predators and primary consumers [29]. In general, at the family level, the species belonging to Siluridae, Salmonidae, Percidae, Clupeidae, and Esocidae could be characterized as the top predators, while the species of Cichlidae, Poeciliidae, Mugilidae, and Cyprinidae appeared to be the trophic baseline of the freshwater ichthyofauna.
The fact that the most abundant family with the widest distribution in Greece is Cyprinidae is in accordance with regional works that also highlighted the family’s domination in the Balkan freshwater ichthyofauna [27,46,47,48]. This predominance could be attributed to their omnivorous behavior, coupled with their competitive advantage of adapting to eutrophic and turbid waters [49]. The complex trophic structure of the Greek freshwater ichthyofauna described under the theoretical scheme of trophic guilds [50,51] resulted in the identification of seven guilds, each including species with similar food resources.
The main representative trophic guilds at a national level were the zooplanktivorous (G1) and opportunistic zooplanktivorous (G5) species, with the insectivorous (G4) guilds being dominant mainly in continental Greece (Figure 4). These results are in agreement with previous studies that confirmed the considerable abundance of omnivorous trophic guilds of species inhabiting the Mediterranean shallow freshwater ecosystems, in contrast to those in northern climates [52,53,54]. Piscivorous (G3) and herbivorous (G6) species demonstrated a distinct, specialized trophic cluster in their food preferences (Table 3), an observation which is in accordance with previous studies in subtropical regions [55,56].
With reference to the biogeographical scheme, the ecoregions of Thrace, Macedonia-Thessaly, and the Ionian exhibited the highest species richness; a finding supported by the fact that they are the largest regions that include the majority of the aquatic ecosystems in Greece [33,46]. Our analysis revealed that the ecoregions of Thrace and Macedonia-Thessaly (northern Greece) were both dominated by zooplanktivorous, insectivorous, and opportunistic zooplanktivorous species (G1, G4, and G5; Figure 4). The latter guild, which exhibited main preference in microcrustacean and detritus species, demonstrated a considerable dominance in the continental and island Greek regions (Figure 4). Accordingly, especially in meso/eutrophic basins (e.g., Greece: Lake Volvi [27]), detritus is considered as a food source that can be consumed accidentally, while it is available during all seasons [57,58]. Its consumption by opportunistic species (e.g., G7; τmean = 2.94; Table 3) can cause negative ecosystem impacts, since it can potentially enhance the decrease in zooplankton communities, trigger the development of algal populations, and eventually result in the emergence of eutrophication events [54].
The Ionian ecoregion (i.e., Western Greece) did not share the same features with the ecoregions mentioned above. This ecoregion is characterized by promontories, karstic features, canyons, and numerous small lentic and small-sized lotic basins, offering the ability of isolation and the capacity to accumulate and host a unique biodiversity [46] and, thus, a variety of feeding habits and strategies. The relative predominance of opportunistic piscivorous (G2), opportunistic zooplanktivorous (G5), and insectivorous (G4) species was an interesting observation in Western Greece (Figure 4). In conjunction with the first published data on the Albanian (Adriatic basin) freshwater fish species [59], there are species similarities with the Ionian ecoregion, indicating the considerable presence of zooplanktivorous (G1 and G5) and insectivorous (G4) species in the mountainous freshwaters of the southwestern Balkans. The major west–east split of Greece has been well documented in many studies and is able to describe the vast compositional dissimilarity of the Balkan biota [31,60], thus providing further support to our findings on the distribution and the grouping of species based on their trophic level indices.
The southeastern Adriatic ecoregion stands at the junction of the two abovementioned major groupings of the regions (western and eastern) and shows the highest level of distinctiveness, hosting endemic ichthyofauna with strong affinities to the Dessaretes lake group fauna (i.e., Ohrid, Prespa, and Mikri Prespa Lakes [61]). This compositional dissimilarity is linked to the dispersal limitation of species, the complex geological history of the area, and the high rates of extinction [60]. It is the smallest ecoregion in our study, and it is part of the transboundary system between North Macedonia and Albania [62], with two drainages in the Greek territory (Aoos River and Prespa Lakes). According to the results of this study, the two main trophic guilds of the southeastern Adriatic were the opportunistic zooplanktivorous (G5) and the opportunistic detritivorous (G7) species. The preference in nekton exhibited by the opportunistic piscivorous species in the Greek region of this ecoregion can be explained since the Prespa Lakes represent a large lentic ecosystem that can adequately host fish predators in terms of spatial and temporal prey abundance.
The Western Aegean ecoregion is severely impacted by high anthropogenic pressure and presents a depauperate freshwater ichthyofauna, compared to the other continental ecoregions, despite showing affinities to the Macedonia-Thessaly freshwater ecoregion. One important observation is that dominant species belong to the opportunistic zooplanktivorous guild (G5), which feeds mainly on microcrustacean and detritus prey, exhibited a proportional increased presence in regions with an increased level of isolation, similar to the (partially) Western Aegean and to the (exclusively) Crete–Eastern Aegean Island Greek ecoregions (Figure 4). An explanation could be that the predominance of generalist opportunistic species, which is greater in hydrologically variable environments [63], occurs due to the exploitation of the high nutritional detritus, in aquatic regions where resource input is limited [64].
The island freshwater ecoregions (i.e., Crete and Eastern Aegean) host very few native fish species, mainly secondary (of marine origin) or diadromous species (e.g., Anguilla anguilla). It is possible, however, that the aquatic biodiversity of Crete) was determined by the extirpation of several aquatic species, due to anthropogenic activities [35]. In both island ecoregions, opportunistic zooplanktivorous (G5) species form the most distributed trophic guild (Figure 4). A noteworthy observation is that the herbivorous (G6) species guild was absent from both ecoregions, while, in the Eastern Aegean ecoregion, piscivorous (G3) species were also absent. This observation can be indirectly related to the analogous relationship of species richness and total ecosystem size [65,66]. In particular, smaller, isolated areas (i.e., Eastern Aegean ecoregion) tend to provide less diverse aquatic basins (temporary and shallow habitats), which are associated with increased environmental stochasticity, resulting in spatiotemporal limitation of energy resources. Thus, the presence of species that utilize low-trophic-level prey is expected (e.g., τmean: Crete = 3.12; Eastern Aegean = 3.01), such as species that feed on microcrustaceans and detritus prey (G5; Figure 5), a finding confirmed in the present work.
Mediterranean aquatic ecosystems (e.g., Greek lakes) are characterized by higher insolation and increased temperature, compared to northern temperate ecosystems, which can activate the development of phytoplankton populations [67]. Additionally, an aquatic community that hosts a high density of zooplanktivorous fish can cause a decline in the zooplankton communities and, thus, an increase in phytoplankton organisms, due to the absence of predators [68]. On the basis of the assumption that an omnivorous strategy can mitigate the propagation of trophic cascades to lower trophic levels [69], the considerable dominance of opportunist species in the ecoregions of this study, especially in the isolated and urbanized/industrialized ones, may constitute a potential response to the aforementioned climatic conditions in Mediterranean basins, as well as the anthropogenic pressures.
5. Conclusions
In conclusion, the Greek freshwater ichthyofauna is characterized by a strong heterogeneity in its species composition and trophic structure, which is principally a result of biogeographical history. In general, there is a considerably higher trophic level in the freshwater fish located in northern Greece compared to the rest of the country. There are some basic trophic patterns that are consistent in the Mediterranean ecoregions and that were confirmed in the present study, such as the predominance of zooplanktivorous and insectivorous species and the lower contribution of specialists in the most geographically isolated regions. The study was limited by the lack of complete food resource datasets for all the species and by the seasonal discrepancies which shape interspecific differences in fish species as a condition factor [70,71]. Nevertheless, it can be considered as providing useful baseline information and, thus, it can be utilized to resolve further research questions, as well as for the application of ecosystem-based models and the formulation of conservation and fishery management schemes.
Author Contributions
Conceptualization, P.K.K. and G.V.; methodology, G.V.; software, G.V.; resources, G.V., O.P. and A.O.; data curation, G.V.; writing—original draft preparation, G.V., A.O., P.K.K., O.P. and M.T.S.; writing—review and editing, G.V., A.O., P.K.K., O.P. and M.T.S.; visualization, G.V.; supervision, P.K.K. and M.T.S.; project administration, M.T.S.; funding acquisition, M.T.S. All authors read and agreed to the published version of the manuscript.
Funding
Funding for this research was provided by Greece and the European Regional Development Fund under the Operational Program “Competitiveness, Entrepreneurship, and Innovation, NSRF 2014–2020” within a research project entitled “ANATHALLOI: Development of management tools for marine and lake ecosystems” (contract MIS 5002500).
Data Availability Statement
The data that support the findings of this study are available on request from the corresponding author, G.V. The data are not publicly available due to privacy/ethical restrictions.
Conflicts of Interest
The authors declare no conflict of interest.
References
- Dudgeon, D.; Arthington, A.H.; Gessner, M.O.; Kawabata, Z.I.; Knowler, D.J.; Lévêque, C.; Naiman, R.J.; Prieur-Richard, A.H.; Soto, D.; Stiassny, M.L.J.; et al. Freshwater biodiversity: Importance, threats, status and conservation challenges. Biol. Rev. 2007, 81, 163–182. [Google Scholar] [CrossRef] [PubMed]
- Collen, B.; Whitton, F.; Dyer, E.E.; Baillie, J.E.M.; Cumberlidge, N.; Darwall, W.R.T.; Pollock, C.; Richman, N.I.; Soulsby, A.; Böhm, M. Global patterns of freshwater species diversity, threat and endemism. Glob. Ecol. Biogeogr. 2014, 23, 40–51. [Google Scholar] [CrossRef] [Green Version]
- Angeler, D.G.; Allen, C.R.; Birgé, H.E.; Drakare, S.; McKie, B.G.; Johnson, R.K. Assessing and managing freshwater ecosystems vulnerable to environmental change. Ambio 2014, 43, 113–125. [Google Scholar] [CrossRef] [PubMed] [Green Version]
- Reid, A.J.; Carlson, A.K.; Creed, I.F.; Eliason, E.J.; Gell, P.A.; Johnson, P.T.J.; Kidd, K.A.; MacCormack, T.J.; Olden, J.D.; Ormerod, S.J.; et al. Emerging threats and persistent conservation challenges for freshwater biodiversity. Biol. Rev. 2019, 94, 849–873. [Google Scholar] [CrossRef] [PubMed] [Green Version]
- Winfield, I.J.; Baigún, C.; Balykin, P.A.; Becker, B.; Chen, Y.; Filipe, A.F.; Gerasimov, Y.V.; Godinho, A.L.; Hughes, R.M.; Koehn, J.D.; et al. International Perspectives on the Effects of Climate Change on Inland Fisheries. Fisheries 2016, 41, 399–405. [Google Scholar] [CrossRef]
- WWF. The World’s Forgotten Fishes, 1st ed.; WWF (World Wildlife Fund) International: Gland, Switzerland, 2021; p. 38. Available online: https://wwfint.awsassets.panda.org/downloads/world_s_forgotten_fishes__report_final__1.pdf (accessed on 20 February 2022).
- Darwin, C. On the Origin of Species by Means of Natural Selection, or the Preservation of Favored Races in the Struggle for Life, 1st ed.; John Murray: London, UK, 1859; pp. 60–79. [Google Scholar] [CrossRef]
- Jeppesen, E.; Jensen, J.P.; Søndergaard, M.; Lauridsen, T.; Pedersen, L.J.; Jensen, L. Top-down control in freshwater lakes: The role of nutrient state, submerged macrophytes and water depth. Hydrobiologia 1997, 342, 151–164. [Google Scholar] [CrossRef]
- Jeppesen, Ε.; Lauridsen, T.L.; Mitchell, S.F.; Christoffersen, Κ.; Burns, C.W. Trophic structure in the pelagial of 25 shallow New Zealand lakes: Changes along nutrient and fish gradients. J. Plankton Res. 2000, 22, 951–968. [Google Scholar] [CrossRef] [Green Version]
- Gibert, J.P. Temperature directly and indirectly influences food web structure. Sci. Rep. 2019, 9, 5312. [Google Scholar] [CrossRef]
- Estes, J.A.; Terborgh, J.; Brashares, J.S.; Power, M.E.; Berger, J.; Bond, W.J.; Carpenter, S.R.; Essington, T.E.; Holt, R.D.; Jackson, J.B.C.; et al. Trophic Downgrading of Planet Earth. Science 2011, 333, 301–306. [Google Scholar] [CrossRef] [Green Version]
- Tammi, J.; Lappalainen, A.; Mannio, J.; Rask, M.; Vuorenmaa, J. Effects of eutrophication on fish and fisheries in Finnish lakes: A survey based on random sampling. Fish. Manag. Ecol. 2001, 6, 173–186. [Google Scholar] [CrossRef]
- Jeppesen, E.; Jensen, J.P.; Søndergaard, M.; Lauridsen, T.; Møller, P.H.; Sandby, K. Changes in nitrogen retention in shallow eutrophic lakes following a decline in density of cyprinids. Arch. Für Hydrobiol. 1998, 142, 129–151. [Google Scholar] [CrossRef]
- Olin, M.; Rask, M.; Ruuhljärvi, J.; Kurkilahti, M.; Ala-Opas, P.; Ylönen, O. Fish community structure in mesotrophic and eutrophic lakes of southern Finland: The relative abundances of percids and cyprinids along a trophic gradient. J. Fish Biol. 2002, 60, 593–612. [Google Scholar] [CrossRef]
- Minns, C.K.; Kelso, J.R.; Randall, R.G. Detecting the response of fish to habitat alterations in freshwater ecosystems. Can. J. Fish. Aquat. Sci. 1996, 53, 403–414. [Google Scholar] [CrossRef]
- Jones, J.I.; Sayer, C.D. Does the fish-invertebrate-periphyton cascade precipitate plant loss in shallow lakes? Ecology 2003, 84, 2155–2167. [Google Scholar] [CrossRef]
- Terborgh, J.; Estes, J. Trophic Cascades: Predators, Prey, and The Changing Dynamics of Nature; Island Press: Washington, DC, USA, 2010. [Google Scholar]
- de Mutsert, K.; Cowan, J.H., Jr.; Walters, C.J. Using Ecopath with Ecosim to Explore Nekton Community Response to Freshwater Diversion into a Louisiana Estuary. Mar. Coast. Fish. 2012, 4, 104–116. [Google Scholar] [CrossRef]
- Moutopoulos, D.K.; Stoumboudi, M.T.; Ramfos, A.; Tsagarakis, K.; Gritzalis, K.C.; Petriki, O.; Patsia, A.; Barbieri, R.; Machias, A.; Stergiou, K.I.; et al. Food web modelling on the structure and functioning of a Mediterranean lentic system. Hydrobiologia 2018, 822, 259–283. [Google Scholar] [CrossRef]
- Aarts, B.G.; Nienhuis, P.H. Fish zonations and guilds as the basis for assessment of ecological integrity of large rivers. Hydrobiologia 2003, 500, 157–178. [Google Scholar] [CrossRef]
- Noble, R.A.A.; Cowx, I.G.; Goffaux, D.; Kestemont, P. Assessing the health of European rivers using functional ecological guilds of fish communities: Standardising species classification and approaches to metric selection. Fish. Manag. Ecol. 2007, 14, 381–392. [Google Scholar] [CrossRef]
- Logez, M.; Bady, P.; Melcher, A.; Pont, D. A continental-scale analysis of fish assemblage functional structure in European rivers. Ecography 2013, 36, 80–91. [Google Scholar] [CrossRef] [Green Version]
- Darwall, W.; Carrizo, S.; Numa, C.; Barrios, V.; Freyhof, J.; Smith, K. Freshwater Key Biodiversity Areas in the Mediterranean Basin Hotspot: Informing Species Conservation and Development Planning in Freshwater Ecosystems; IUCN (International Union for Conservation of Nature): Gland, Switzerland, 2014; p. 2. [Google Scholar]
- Leonardos, I. The feeding ecology of Aphanius fasciatus (Valenciennes, 1821) in the lagoonal system of Messolongi (western Greece). Sci. Mar. 2008, 72, 393–401. [Google Scholar] [CrossRef] [Green Version]
- Kalogianni, E.; Giakoumi, S.; Andriopoulou, A.; Chatzinikolaou, Y. Feeding ecology of the critically endangered Valencia letourneuxi (Valenciidae). Aquat. Ecol. 2010, 44, 289–299. [Google Scholar] [CrossRef]
- Gkenas, C.; Oikonomou, A.; Economou, A.; Kiosse, F.; Leonardos, I. Life history pattern and feeding habits of the invasive mosquitofish, Gambusia holbrooki, in Lake Pamvotis (NW Greece). J. Biol. Res. 2012, 17, 121–136. [Google Scholar]
- Bobori, D.; Salvarina, I.; Michaloudi, E. Fish dietary patterns in the eutrophic Lake Volvi (East Mediterranean). J. Biol. Res. 2013, 19, 139–149. [Google Scholar]
- Oikonomou, A.; Leprieur, F.; Leonardos, I.D. Ecomorphological diversity of freshwater fishes as a tool for conservation priority setting: A case study from a Balkan hotspot. Environ. Biol. Fishes 2018, 101, 1121–1136. [Google Scholar] [CrossRef]
- Yoğurtçuoğlu, B.; Ekmekçi, F.G.; Karachle, P.K. A review and assessment of fish trophic levels in a large reservoir of central Anatolia, Turkey. Mar. Freshw. Res. 2020, 72, 311–320. [Google Scholar] [CrossRef]
- Bănărescu, P.M. Distribution pattern of the aquatic fauna of the Balkan Peninsula. In Balkan Biodiversity, Pattern and Process in the European Hotspot; Griffiths, H.I., Kryštufek, B., Reed, J.M., Eds.; Kluwer Academic Publishers: Amsterdam, The Netherlands, 2004; pp. 203–217. [Google Scholar]
- Economidis, P.S.; Bănărescu, P.M. The Distribution and Origins of Freshwater Fishes in the Balkan Peninsula, Especially in Greece. Int. Rev. Gesamten Hydrobiol. Hydrogr. 1991, 76, 257–284. [Google Scholar] [CrossRef]
- Froese, R.; Pauly, D. Fishbase. Available online: www.fishbase.org (accessed on 1 September 2021).
- Barbieri, R.; Zogaris, S.; Kalogianni, E.; Stoumboudi, M.T.; Chatzinikolaou, Y.; Giakoumi, S.; Kapakos, Y.; Kommatas, D.; Koutsikos, N.; Tachos, V.; et al. Freshwater Fishes and Lampreys of Greece: An Annotated Checklist; Hellenic Centre for Marine Research: Athens, Greece, 2015. Available online: https://imbriw.hcmr.gr/wp-content/uploads/2015/05/FINAL_MARCH_2015_FreshwaterFishlist-1.pdf (accessed on 1 September 2021).
- Koutsikos, N.; Zogaris, S.; Vardakas, L.; Kalantzi, O.I.; Dimitriou, E.; Economou, A.N. Tracking non-indigenous fishes in lotic ecosystems: Invasive patterns at different spatial scales in Greece. Sci. Total Environ. 2019, 659, 389–400. [Google Scholar] [CrossRef]
- Zogaris, S.; Economou, A.N. The Biogeographic Characteristics of the River Basins of Greece. In The Rivers of Greece; Skoulikidis, N., Dimitriou, E., Karaouzas, I., Eds.; Springer: Berlin, Germany, 2017; pp. 53–95. [Google Scholar] [CrossRef]
- Pauly, D.; Froese, R.; Sa-a, P.; Palomares, M.L.; Christensen, V.; Rius, J. Trophlab Manual; ICLARM: Manila, Philippines, 2000. [Google Scholar]
- Gascuel, D.; Guénette, S.; Pauly, D. The trophic-level-based ecosystem modelling approach: Theoretical overview and practical uses. ICES J. Mar. Sci. 2011, 68, 1403–1416. [Google Scholar] [CrossRef] [Green Version]
- Pereira, P.R.; Agostinho, C.S.; de Oliveira, R.J.; Marques, E.E. Trophic guilds of fishes in sandbank habitats of a Neotropical river. Neotrop. Ichthyol. 2007, 5, 399–404. [Google Scholar] [CrossRef] [Green Version]
- Graham, J.H.; Vrijenhoek, R.C. Detrended Correspondence Analysis of Dietary Data. Trans. Am. Fish. Soc. 1998, 117, 29–36. [Google Scholar] [CrossRef]
- Gauch, H.G. Multivariate Analysis in Community Ecology; University Press: Cambridge, UK, 1982; pp. 211–241. [Google Scholar]
- Friedlander, A.M.; Parrish, J.D. Habitat characteristics affecting fish assemblages on a Hawaiian coral reef. J. Exp. Mar. Biol. Ecol. 1998, 224, 1–30. [Google Scholar] [CrossRef]
- Holland, S.M. Detrended Correspondence Analysis (DCA); Department of Geology, University of Georgia: Athens, GA, USA, 2008; Available online: https://strata.uga.edu/software/pdf/dcaTutorial.pdf (accessed on 1 September 2021).
- Kaufman, L.; Rousseeuw, P.J. Finding Groups in Data: An Introduction to Cluster Analysis. In Wiley Series in Probability and Statistics; Barnett, V., Bradley, R.A., Hunter, J.S., Kadane, J.B., Kendall, D.G., Smith, F.M., Stigler, S.M., Teugels, J., Watson, G.S., Eds.; John Wiley and Sons, Inc.: Hoboken, NJ, USA, 1990; p. 87. [Google Scholar] [CrossRef]
- Tibshirani, R.; Walther, G.; Hastie, T. Estimating the number of clusters in a data set via the gap statistic. J. R. Stat. Soc. 2001, 63, 411–423. [Google Scholar] [CrossRef]
- R Core Team. R: A Language and Environment for Statistical Computing; R Foundation for Statistical Computing: Vienna, Austria, 2021; Available online: https://www.R-project.org/ (accessed on 1 September 2021).
- Economou, A.N.; Giakoumi, S.; Vardakas, L.; Barbieri, R.; Stoumboudi, M. Τh.; Zogaris, S. The freshwater ichthyofauna of Greece—An update based on a hydrographic basin survey. Mediterr. Mar. Sci. 2007, 8, 91. [Google Scholar] [CrossRef] [Green Version]
- Shumka, S.; Meulenbroek, P.; Schiemer, F.; Sanda, R. Fishes of the River Vjosa—An annotated Checklist. Acta ZooBot Austria 2018, 155, 163–176. [Google Scholar]
- Marić, D. The Skadar/Shkodra Lake Environment. In The Handbook of Environmental Chemistry; Pešić, V., Karaman, G., Kostianoy, A.G., Eds.; Springer International Publishing: New York City, NY, USA, 2018; pp. 363–381. [Google Scholar] [CrossRef]
- Persson, L.; Diehl, S.; Johansson, L.; Andersson, G.; Hamrin, S.F. Shifts in fish communities along the productivity gradient of temperate lakes-patterns and the importance of size-structured interactions. J. Fish Biol. 1991, 38, 281–293. [Google Scholar] [CrossRef]
- Root, R.B. The niche exploitation pattern of the blue-grey gnatcatcher. Ecol. Monogr. 1967, 37, 317–350. [Google Scholar] [CrossRef]
- Specziár, A.; Rezsu, E.T. Feeding guilds and food resource partitioning in a lake fish assemblage: An ontogenetic approach. J. Fish Biol. 2009, 75, 247–267. [Google Scholar] [CrossRef]
- Jacobsen, L.; Perrow, M.R.; Landkildehus, F.; Hjørne, M.; Lauridsen, T.L.; Berg, S. Interactions between piscivores, zooplanktivores and zooplankton in submerged macrophytes: Preliminary observations from enclosure and pond experiments. Hydrobiologia 1997, 342/343, 197–205. [Google Scholar] [CrossRef]
- Tátrai, I.; Mátyás, K.; Korponai, J.; Paulovits, G.; Pekár, F. Management of fish communities and its impacts on the lower trophic levels in shallow ecosystems in Hungary. Hydrobiologia 2003, 506, 489–496. [Google Scholar] [CrossRef]
- Blanco, S.; Romo, S.; Villena, M.J.; Martínez, S. Fish communities and food web interactions in some shallow Mediterranean lakes. Hydrobiologia 2003, 506, 473–480. [Google Scholar] [CrossRef]
- de Mérona, B.; Vigouroux, R. Diet changes in fish species from a large reservoir in South America and their impact on the trophic structure of fish assemblages (Petit-Saut Dam, French Guiana). Ann. Limnol. Int. J. Limnol. 2006, 42, 53–61. [Google Scholar] [CrossRef] [Green Version]
- Delariva, R.L.; Hahn, N.S.; Kashiwaqui, E.A.L. Diet and trophic structure of the fish fauna in a subtropical ecosystem: Impoundment effects. Neotrop. Ichthyol. 2013, 11, 891–904. [Google Scholar] [CrossRef] [Green Version]
- Michelsen, K.; Pedersen, J.; Christoffersen, K.; Jensen, F. Ecological consequences of food partitioning for the fish population structure in a eutrophic lake. Hydrobiologia 1994, 291, 35–45. [Google Scholar] [CrossRef]
- Tolonen, K.T.; Karjalainen, J.; Staff, S.; Leppä, M. Individual and population-level food consumption by cyprinids and percids in a mesotrophic lake. Ecol. Freshw. Fish 2000, 9, 153–162. [Google Scholar] [CrossRef]
- Rakaj, N.; Flloko, A. Conservation status of freshwater fish of Albania. Biol. Conserv. 1995, 72, 195–199. [Google Scholar] [CrossRef]
- Oikonomou, A.; Leprieur, F.; Leonardos, I.D. Biogeography of freshwater fishes of the Balkan Peninsula. Hydrobiologia 2014, 738, 205–220. [Google Scholar] [CrossRef]
- Albrecht, C.; Wolff, C.; Glöer, P.; Wilke, T. Concurrent evolution of ancient sister lakes and sister species: The freshwater gastropod genus Radix in lakes Ohrid and Prespa. Hydrobiologia 2008, 615, 157–167. [Google Scholar] [CrossRef]
- Zogaris, S.; Economou, A.N.; Dimopoulos, P. Ecoregions in the Southern Balkans: Should Their Boundaries Be Revised? Environ. Manag. 2009, 43, 682–697. [Google Scholar] [CrossRef]
- Poff, N.L.; Allan, J.D. Functional Organization of Stream Fish Assemblages in Relation to Hydrological Variability. Ecology 1995, 76, 606–627. [Google Scholar] [CrossRef]
- Wilson, S.K.; Bellwood, D.R.; Choat, J.H.; Furnas, M.J. Detritus in the epilithic algal matrix and its use by coral reef fishes. Oceanogr. Mar. Biol. 2003, 41, 279–309. [Google Scholar]
- Amarasinghe, U.S.; Welcomme, R.L. An Analysis of Fish Species Richness in Natural Lakes. Environ. Biol. Fishes 2002, 65, 327–339. [Google Scholar] [CrossRef]
- Oikonomou, A.; Stefanidis, K. α- and β-Diversity Patterns of Macrophytes and Freshwater Fishes are Driven by Different Factors and Processes in Lakes of the Unexplored Southern Balkan Biodiversity Hotspot. Water 2020, 12, 1984. [Google Scholar] [CrossRef]
- Moustaka-Gouni, M.; Michaloudi, E.; Sommer, U. Modifying the PEG model for Mediterranean lakes—No biological winter and strong fish predation. Freshw. Biol. 2014, 59, 1136–1144. [Google Scholar] [CrossRef] [Green Version]
- Perrow, M.R.; Jowit, A.J.D.; Stansfield, J.H.; Phillips, G.L. The practical importance of the interactions between fish, zooplankton and macrophytes in shallow lake restoration. Hydrobiologia 1999, 395, 199–210. [Google Scholar] [CrossRef]
- Meerhoff, M.; Clemente, J.M.; De Mello, F.T.; Iglesias, C.; Pedersen, A.R.; Jeppesen, E. Can warm climate-related structure of littoral predator assemblies weaken the clear water state in shallow lakes? Glob. Chang. Biol. 2007, 13, 1888–1897. [Google Scholar] [CrossRef]
- Mozsár, A.; Sály, P.; Antal, L.; Nagy, S.A.; Boros, G. Organismal stoichiometry at the temporal scale: Seasonal variability shapes interspecific differences in fish. Freshw. Biol. 2018, 64, 244–254. [Google Scholar] [CrossRef] [Green Version]
- Mozsár, A.; Boros, G.; Sály, P.; Antal, L.; Nagy, S.A. Relationship between Fulton’s condition factor and proximate body composition in three freshwater fish species. J. Appl. Ichthyol. 2014, 31, 315–320. [Google Scholar] [CrossRef] [Green Version]
Figure 1.
Heatmap analysis of the freshwater fish species (N = 157) trophic level (τ < 3: gray; 3 < τ < 4: blue; τ > 4: black) in the hierarchical clustered Greek ecoregions. Each column represents a species, and each row represents the ecoregion of presence. Ecoregions are according to Zogaris and Economou [35] as follows: ECO1: Thrace, ECO2: Macedonia-Thessaly, ECO3: Southeastern Adriatic, ECO4: Western Aegean, ECO5: Ionian, ECO6: Crete, ECO7: Eastern Aegean.

Figure 2.
Geometrical rectangle visualization of the trophic level mean (τmean) value of each fish family per ecoregion (* at least one introduced species within the family; τmax: light blue; τmin: dark blue; N = 157). Ecoregions are according to Zogaris and Economou [35] as follows: ECO1: Thrace, ECO2: Macedonia-Thessaly, ECO3: Southeastern Adriatic, ECO4: Western Aegean, ECO5: Ionian, ECO6: Crete, ECO7: Eastern Aegean.

Figure 3.
Ordination map of the standardized detrended correspondence analysis (DCA) for (a) the trophic guild groups (G1–G7), and (b) prey types of the Greek freshwater fish species resulting from the k-means the clustering optimization routines (DCA1: 56.87%; DCA2: 34.98%; N = 60). The red circle indicates the centroid of the ordination analysis (G1: zooplanktivorous; G2: opportunistic piscivorous; G3: piscivorous, G4: insectivorous; G5: opportunistic zooplanktivorous; G6: herbivorous; G7: opportunistic detritivorous).

Figure 4.
Distribution of the freshwater fish species trophic guilds in the Greek ecoregions (G1: zooplanktivorous; G2: opportunistic piscivorous; G3: piscivorous, G4: insectivorous; G5: opportunistic zooplanktivorous; G6: herbivorous; G7: opportunistic detritivorous; N = 60). The provided map is originally from the work of Zogaris and Economou [35] as follows: 1: Thrace, 2: Macedonia-Thessaly, 3: Southeastern Adriatic, 4: Western Aegean, 5: Ionian, 6: Crete, 7: Eastern Aegean.

Figure 5.
Box-and-whisker plots of the trophic level per trophic guilds (G1–G7) of the Greek freshwater fish species (red dot: mean; vertical line: median; gray dots: outliers; G1: zooplanktivorous; G2: opportunistic piscivorous; G3: piscivorous, G4: insectivorous; G5: opportunistic zooplanktivorous; G6: herbivorous; G7: opportunistic detritivorous; N = 60).


Table 1.
Mean trophic level (τmean) values and the total number of species (N) of each Greek ecoregion, named according to Zogaris and Economou [35].
Table 1.
Mean trophic level (τmean) values and the total number of species (N) of each Greek ecoregion, named according to Zogaris and Economou [35].
| ID | Ecoregion | τmean | N |
|---|---|---|---|
| 1 | Thrace | 3.24 | 67 |
| 2 | Macedonia-Thessaly | 3.23 | 58 |
| 3 | Southeastern Adriatic | 3.15 | 26 |
| 4 | Western Aegean | 3.1 | 38 |
| 5 | Ionian | 3.15 | 57 |
| 6 | Crete | 3.12 | 12 |
| 7 | Eastern Aegean | 3.01 | 17 |
Table 2.
Cluster metrics obtained from the average silhouette and the gap statistic method via 999 Monte Carlo simulations for the determination of the optimal number of clusters ( = 7) in the Greek freshwater icthyofauna based on their diet composition.
Table 2.
Cluster metrics obtained from the average silhouette and the gap statistic method via 999 Monte Carlo simulations for the determination of the optimal number of clusters ( = 7) in the Greek freshwater icthyofauna based on their diet composition.
| Number of Optimal Clusters () | Method | ||
|---|---|---|---|
| Average Silhouette Width | Gap Statistic (GS) | Increase Rate of GS | |
| 1min | 0 | 0.141 | 20.9% |
| 2 | 0.192 | 0.178 | 34.8% |
| 3 | 0.289 | 0.273 | 22.1% |
| 4 | 0.334 | 0.350 | 6.3% |
| 5 | 0.339 | 0.374 | 14.4% |
| 6 | 0.390 | 0.436 | 11.8% |
| 7 | 0.403 | 0.495 | −2.4% |
| 8 | 0.340 | 0.483 | 4.3% |
| 9 | 0.352 | 0.505 | 4.9% |
| 10max | 0.351 | 0.531 | |
Table 3.
Mean value of quantitative mass prey contribution (w/w %) to the diet of each functional trophic guild group of the Greek freshwater fish species (G1: zooplanktivorous; G2: opportunistic piscivorous; G3: piscivorous G4: insectivorous; G5: opportunistic zooplanktivorous; G6: herbivorous; G7: opportunistic detritivorous). The asterisk (*) denotes the most abundant preys of food in each group.
| Trophic Guild | Algae | Detritus | Aquatic Insects | Terrestrial Insects | Micro-Crustaceans | Other Invertebrates | Nekton | Plant Matter |
|---|---|---|---|---|---|---|---|---|
| G1 | 1.09 | 5.45 | 12.59 | 2.71 | 57.10 * | 17.71 | 0.78 | 2.54 |
| G2 | 0.00 | 0.00 | 15.48 | 7.62 | 24.29 * | 5.23 | 36.70 * | 10.65 |
| G3 | 0.00 | 0.00 | 1.25 | 3.17 | 0.18 | 0.75 | 94.06 * | 0.02 |
| G4 | 2.86 | 0.00 | 65.09 * | 0.00 | 7.34 | 22.71 | 0.66 | 1.30 |
| G5 | 9.09 | 35.15 * | 0.30 | 0.70 | 38.63 * | 5.18 | 0.00 | 10.10 |
| G6 | 79.15 * | 20.85 | 0.00 | 0.00 | 0.00 | 0.00 | 0.00 | 0.00 |
| G7 | 0.22 | 29.85 * | 3.02 | 27.10 * | 15.76 | 1.19 | 3.17 | 19.66 |
Publisher’s Note: MDPI stays neutral with regard to jurisdictional claims in published maps and institutional affiliations. |
© 2022 by the authors. Licensee MDPI, Basel, Switzerland. This article is an open access article distributed under the terms and conditions of the Creative Commons Attribution (CC BY) license (https://creativecommons.org/licenses/by/4.0/).
Share and Cite
MDPI and ACS Style
Vagenas, G.; Oikonomou, A.; Karachle, P.K.; Petriki, O.; Stoumboudi, M.T. Trophic Patterns of Freshwater Fish across the Balkan Biodiversity Hotspot. Water 2022, 14, 1112. https://doi.org/10.3390/w14071112
AMA Style
Vagenas G, Oikonomou A, Karachle PK, Petriki O, Stoumboudi MT. Trophic Patterns of Freshwater Fish across the Balkan Biodiversity Hotspot. Water. 2022; 14(7):1112. https://doi.org/10.3390/w14071112
Chicago/Turabian StyleVagenas, Georgios, Anthi Oikonomou, Paraskevi K. Karachle, Olga Petriki, and Maria Th. Stoumboudi. 2022. "Trophic Patterns of Freshwater Fish across the Balkan Biodiversity Hotspot" Water 14, no. 7: 1112. https://doi.org/10.3390/w14071112
Note that from the first issue of 2016, this journal uses article numbers instead of page numbers. See further details here.