
Thermal Regime and Water Balance of Two Tropical High-Mountain Lakes in the Nevado de Toluca Volcano, Mexico

 , , and
Abstract
:1. Introduction
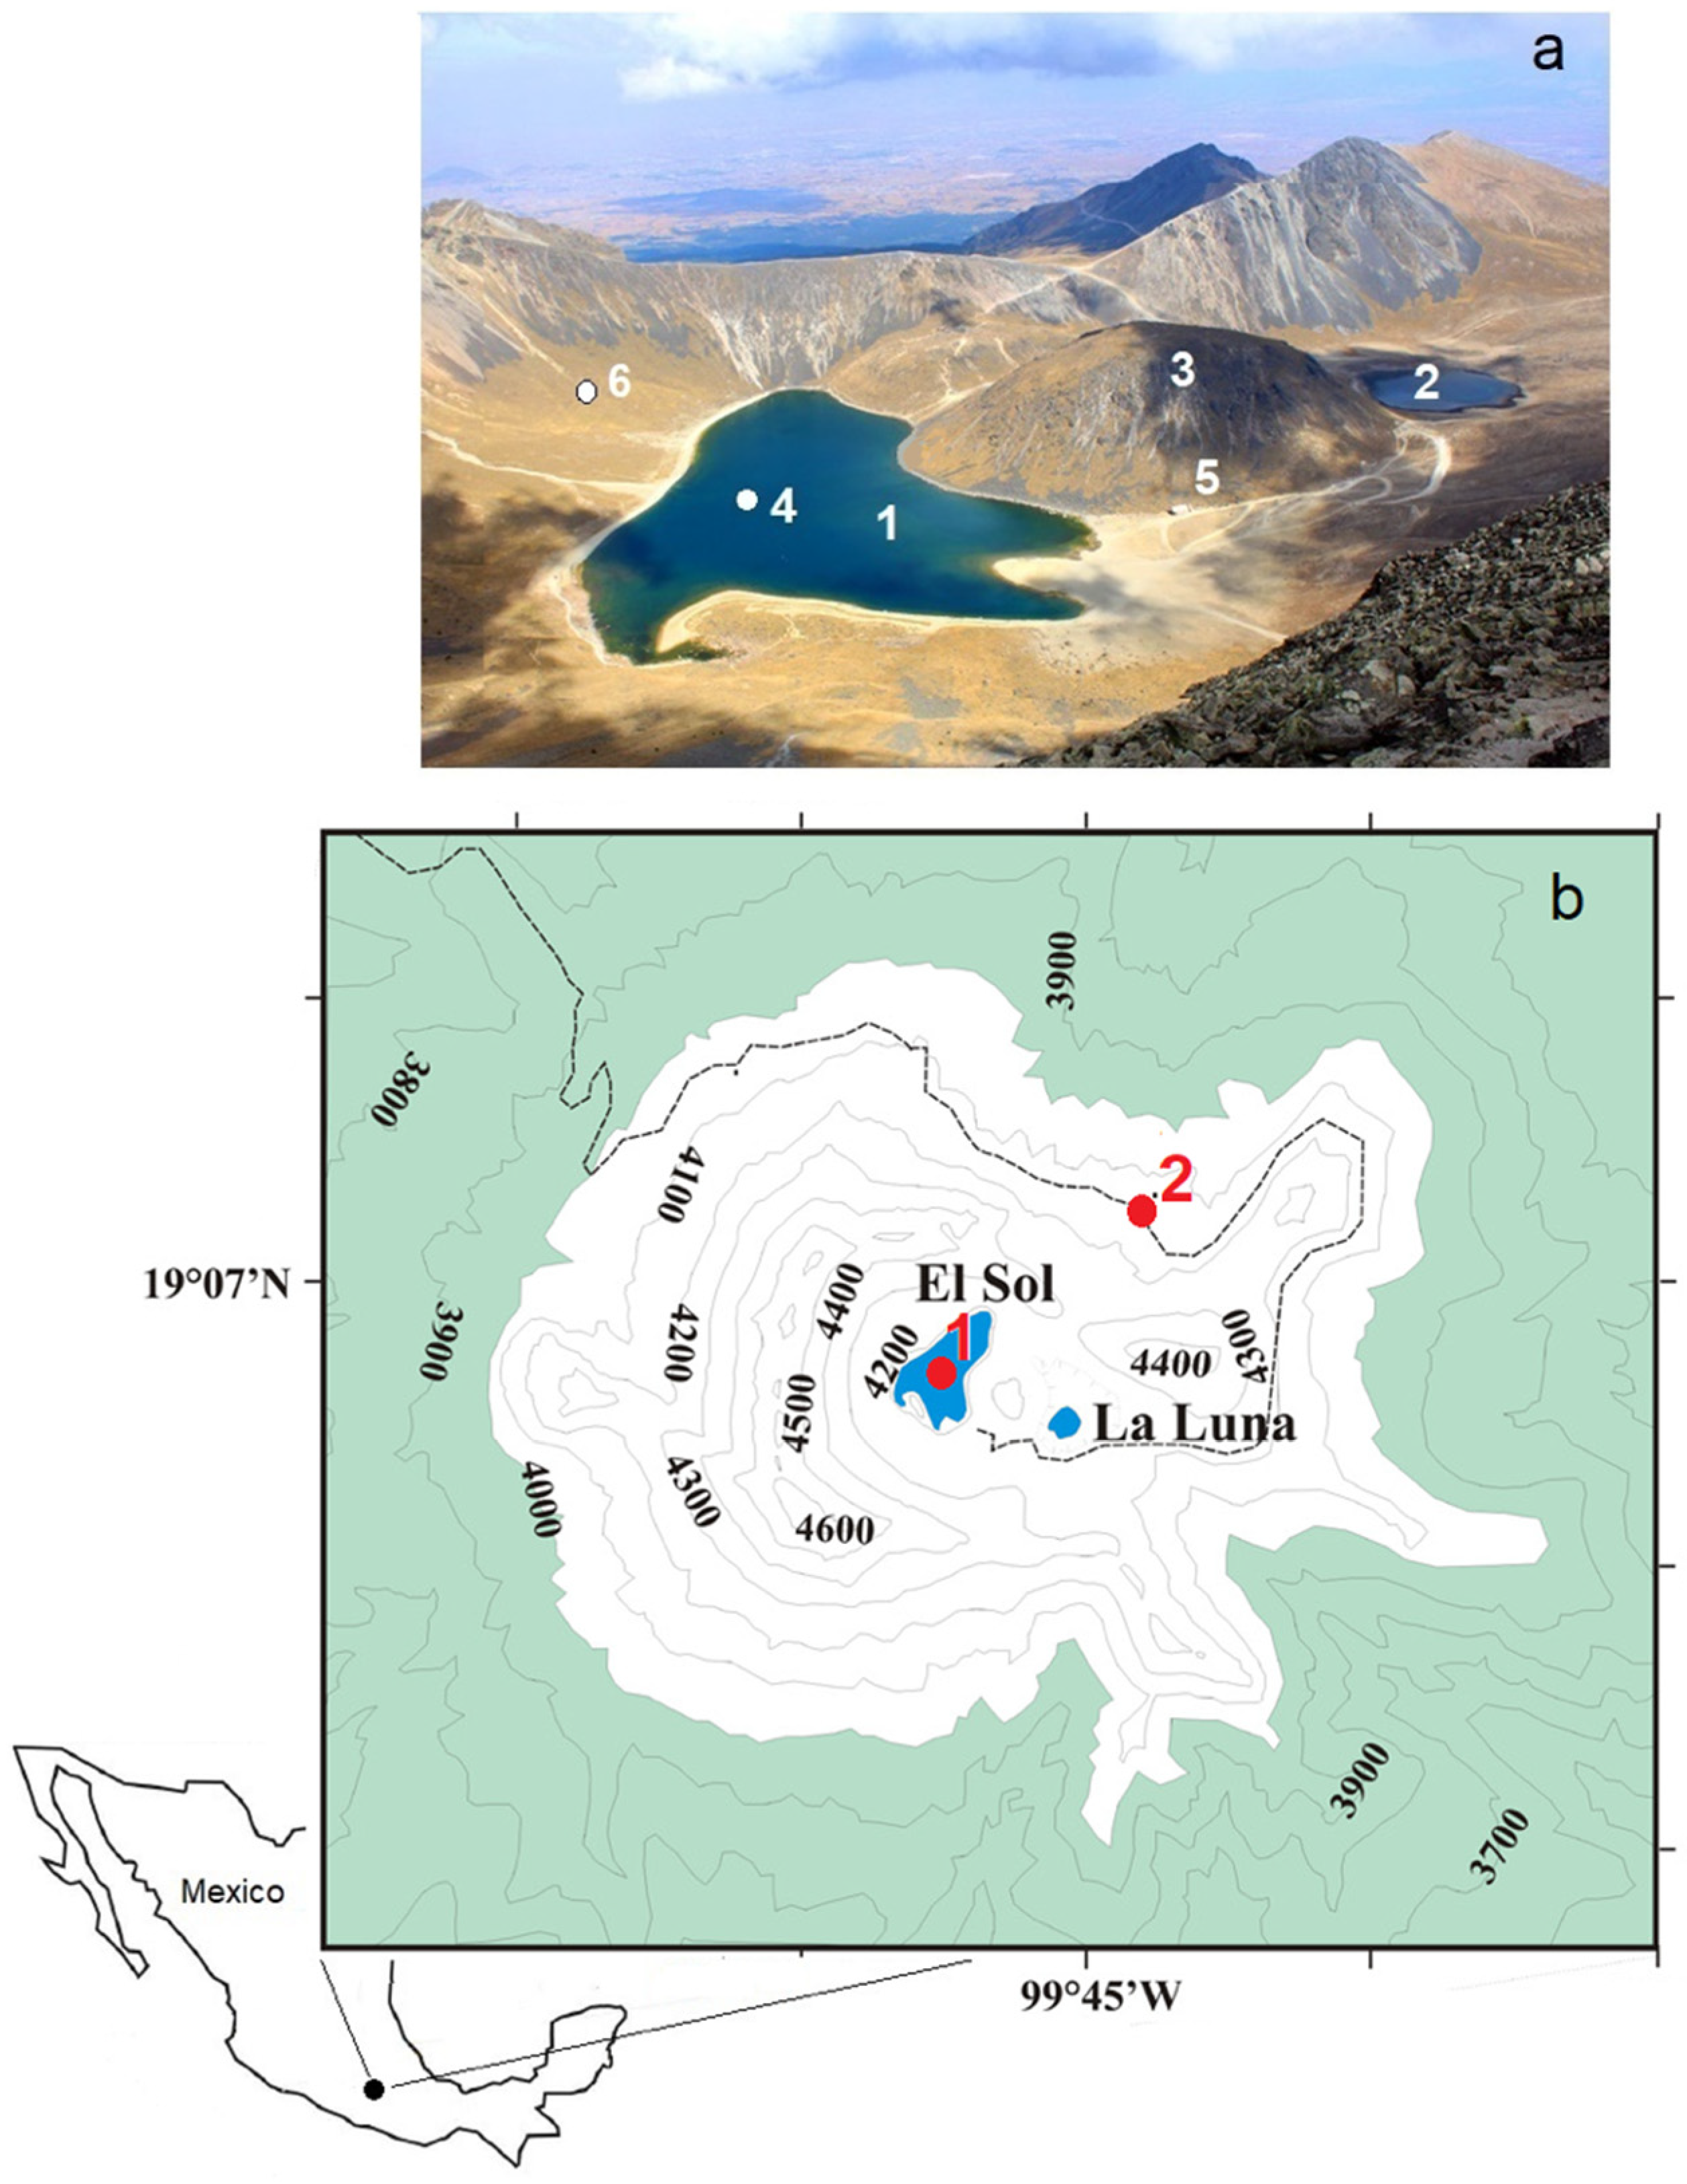
2. Study Area
3. Data and Methods
3.1. Field Measurements
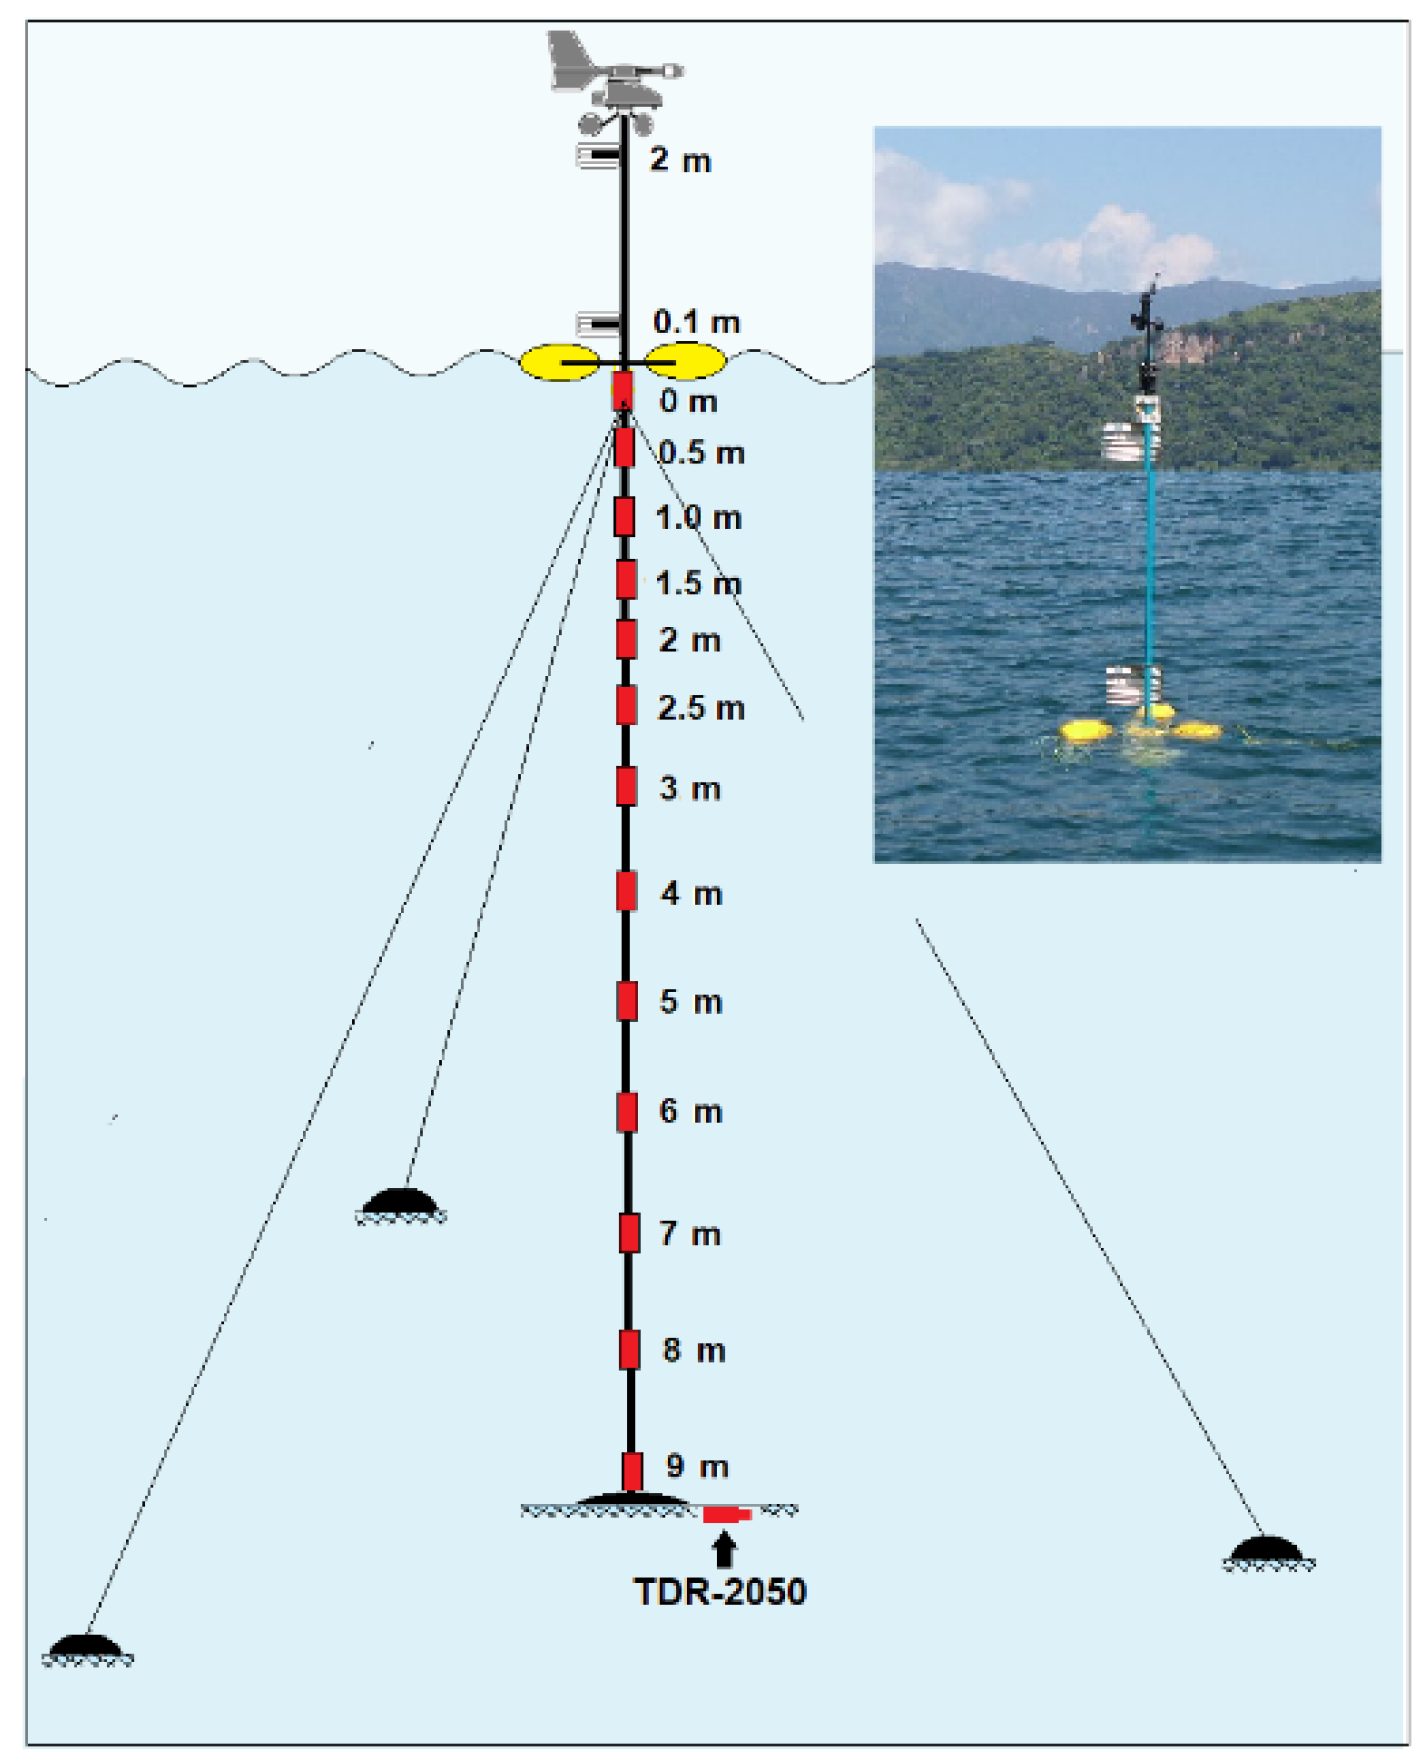
3.1.1. Floating Weather Station
3.1.2. National Meteorological Service (NMS) Weather Station
3.1.3. Temperature on the Internal Slope of the Nevado de Toluca Volcano
3.1.4. Lake Level and Bottom Sediment Temperature Measurements
3.1.5. Water Temperature Measurements
3.1.6. Hydrodynamic Modeling
3.2. Data Analysis
3.2.1. Meteorological Variables
3.2.2. Water Temperature
3.2.3. Heat Flux between the Water-Bottom Sediments Interface
3.2.4. Rainfall, Evaporation and Level Fluctuations
4. Results and Discussion
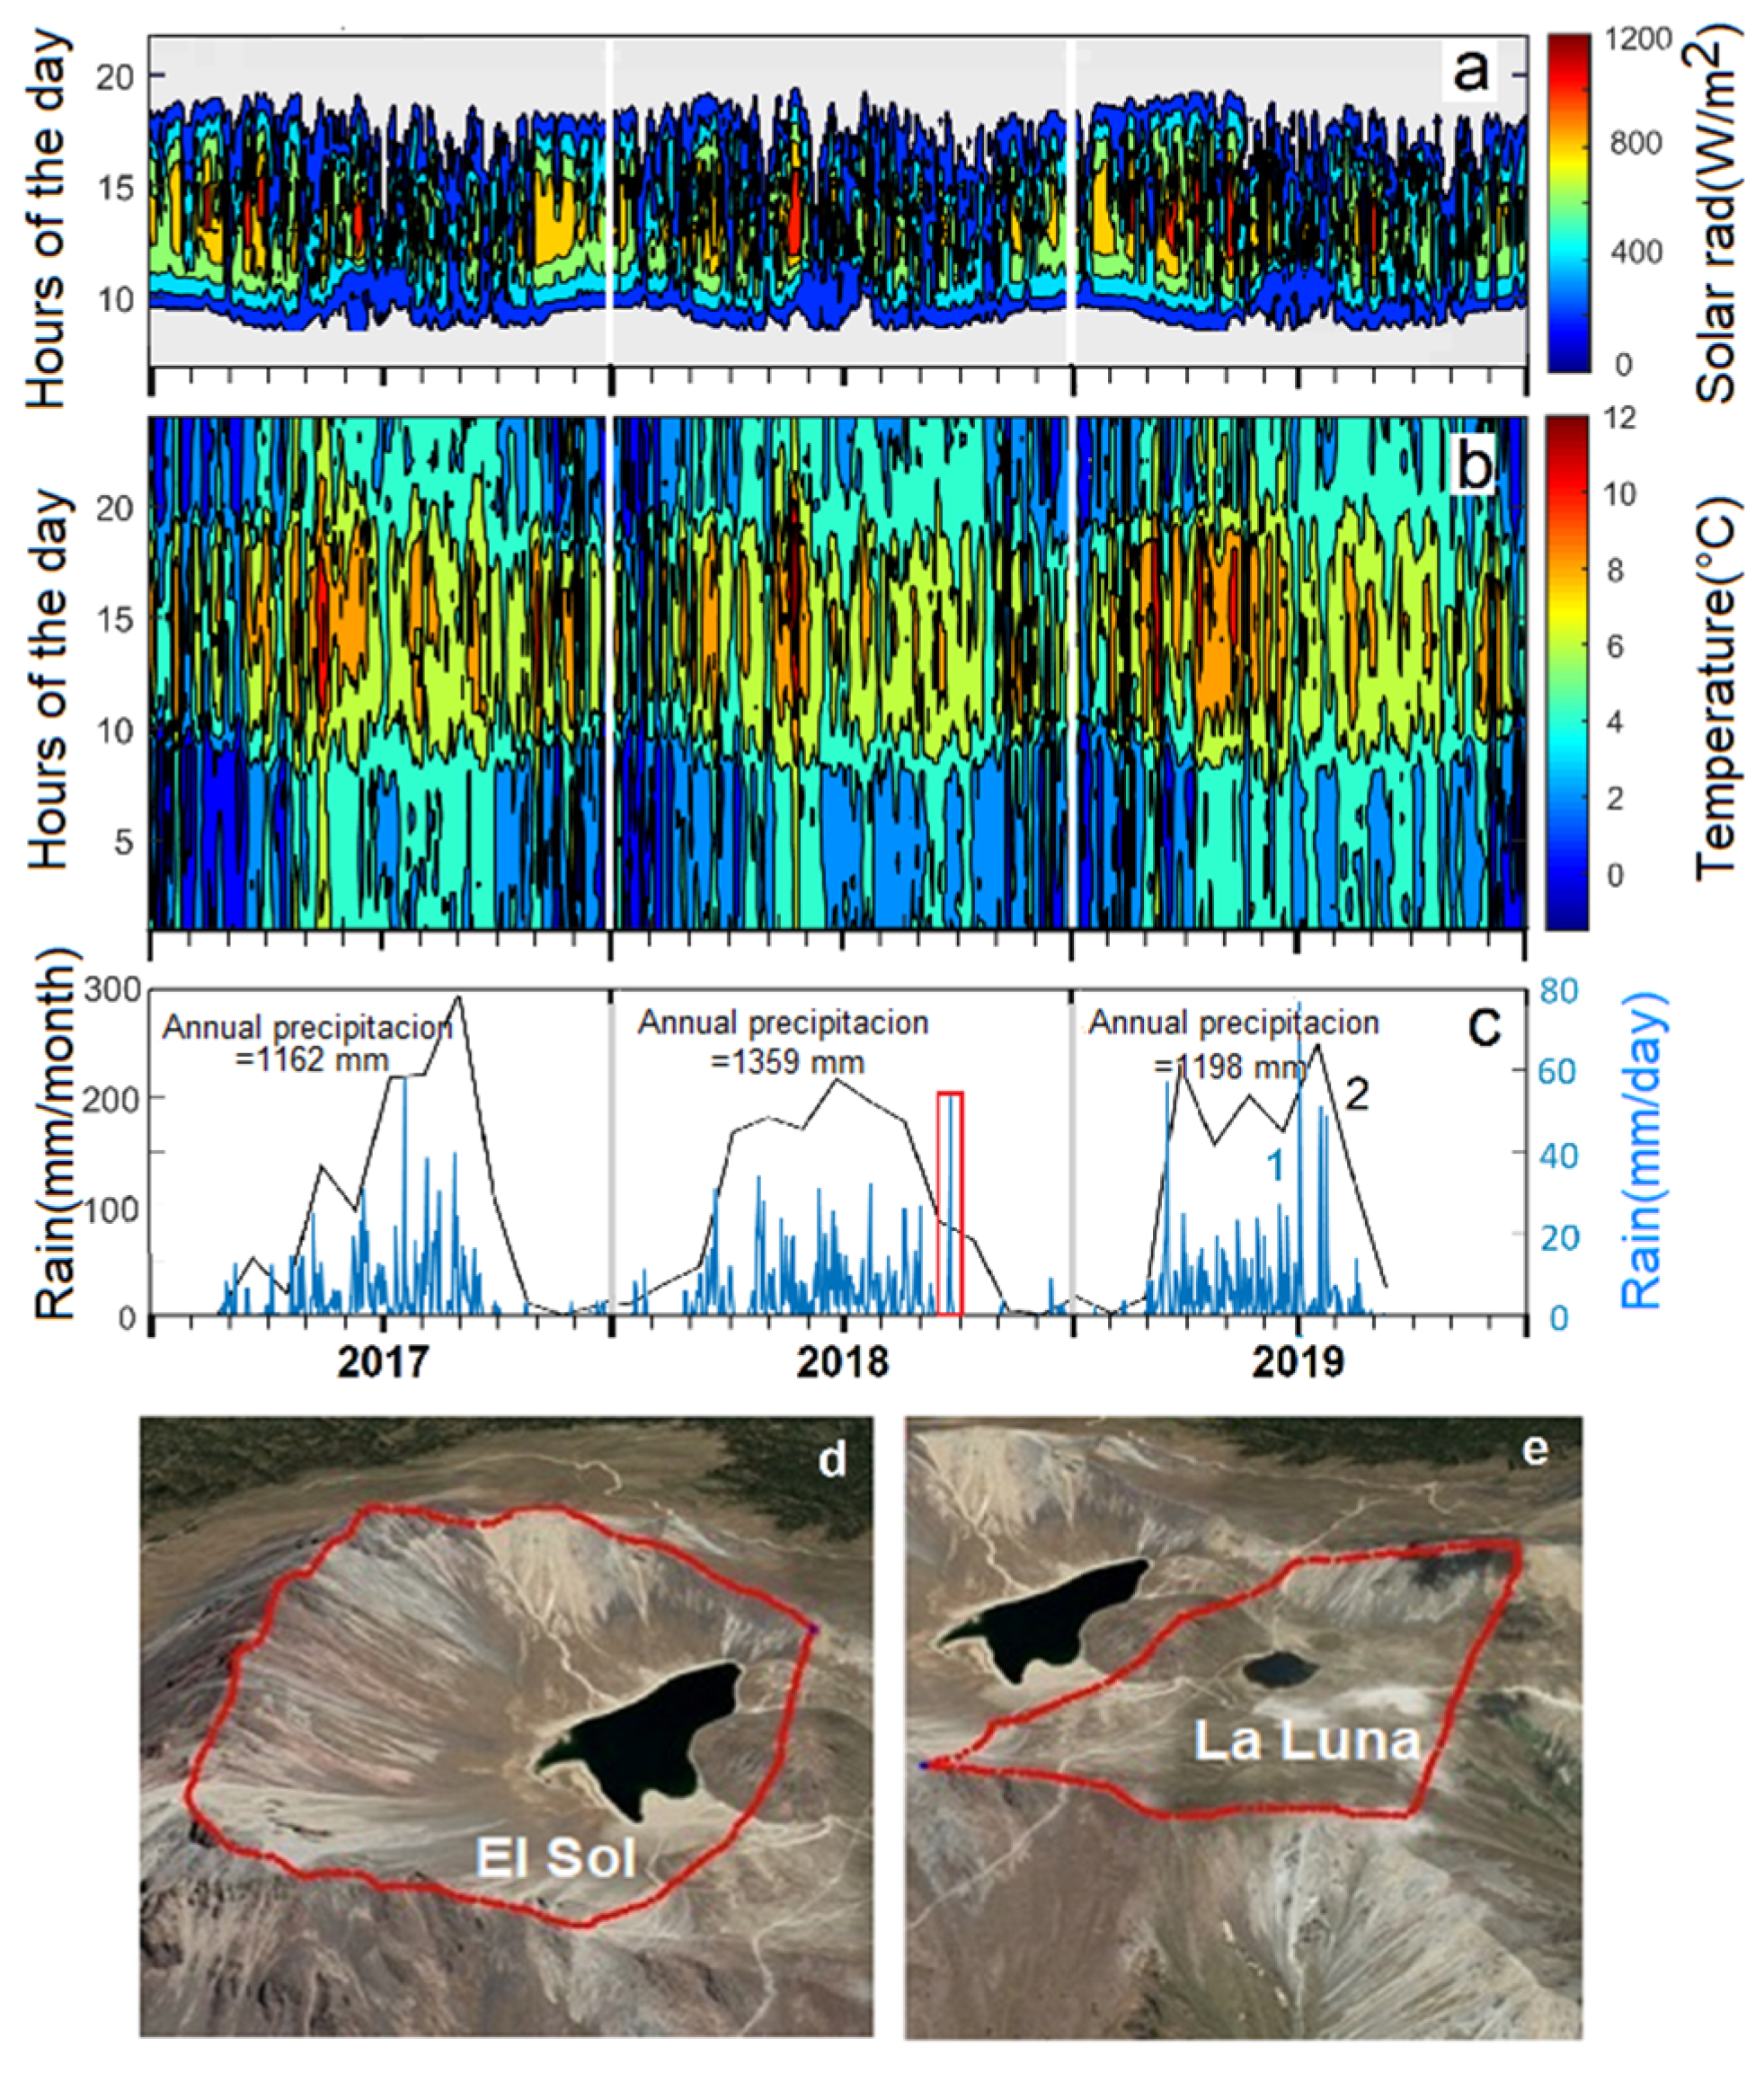
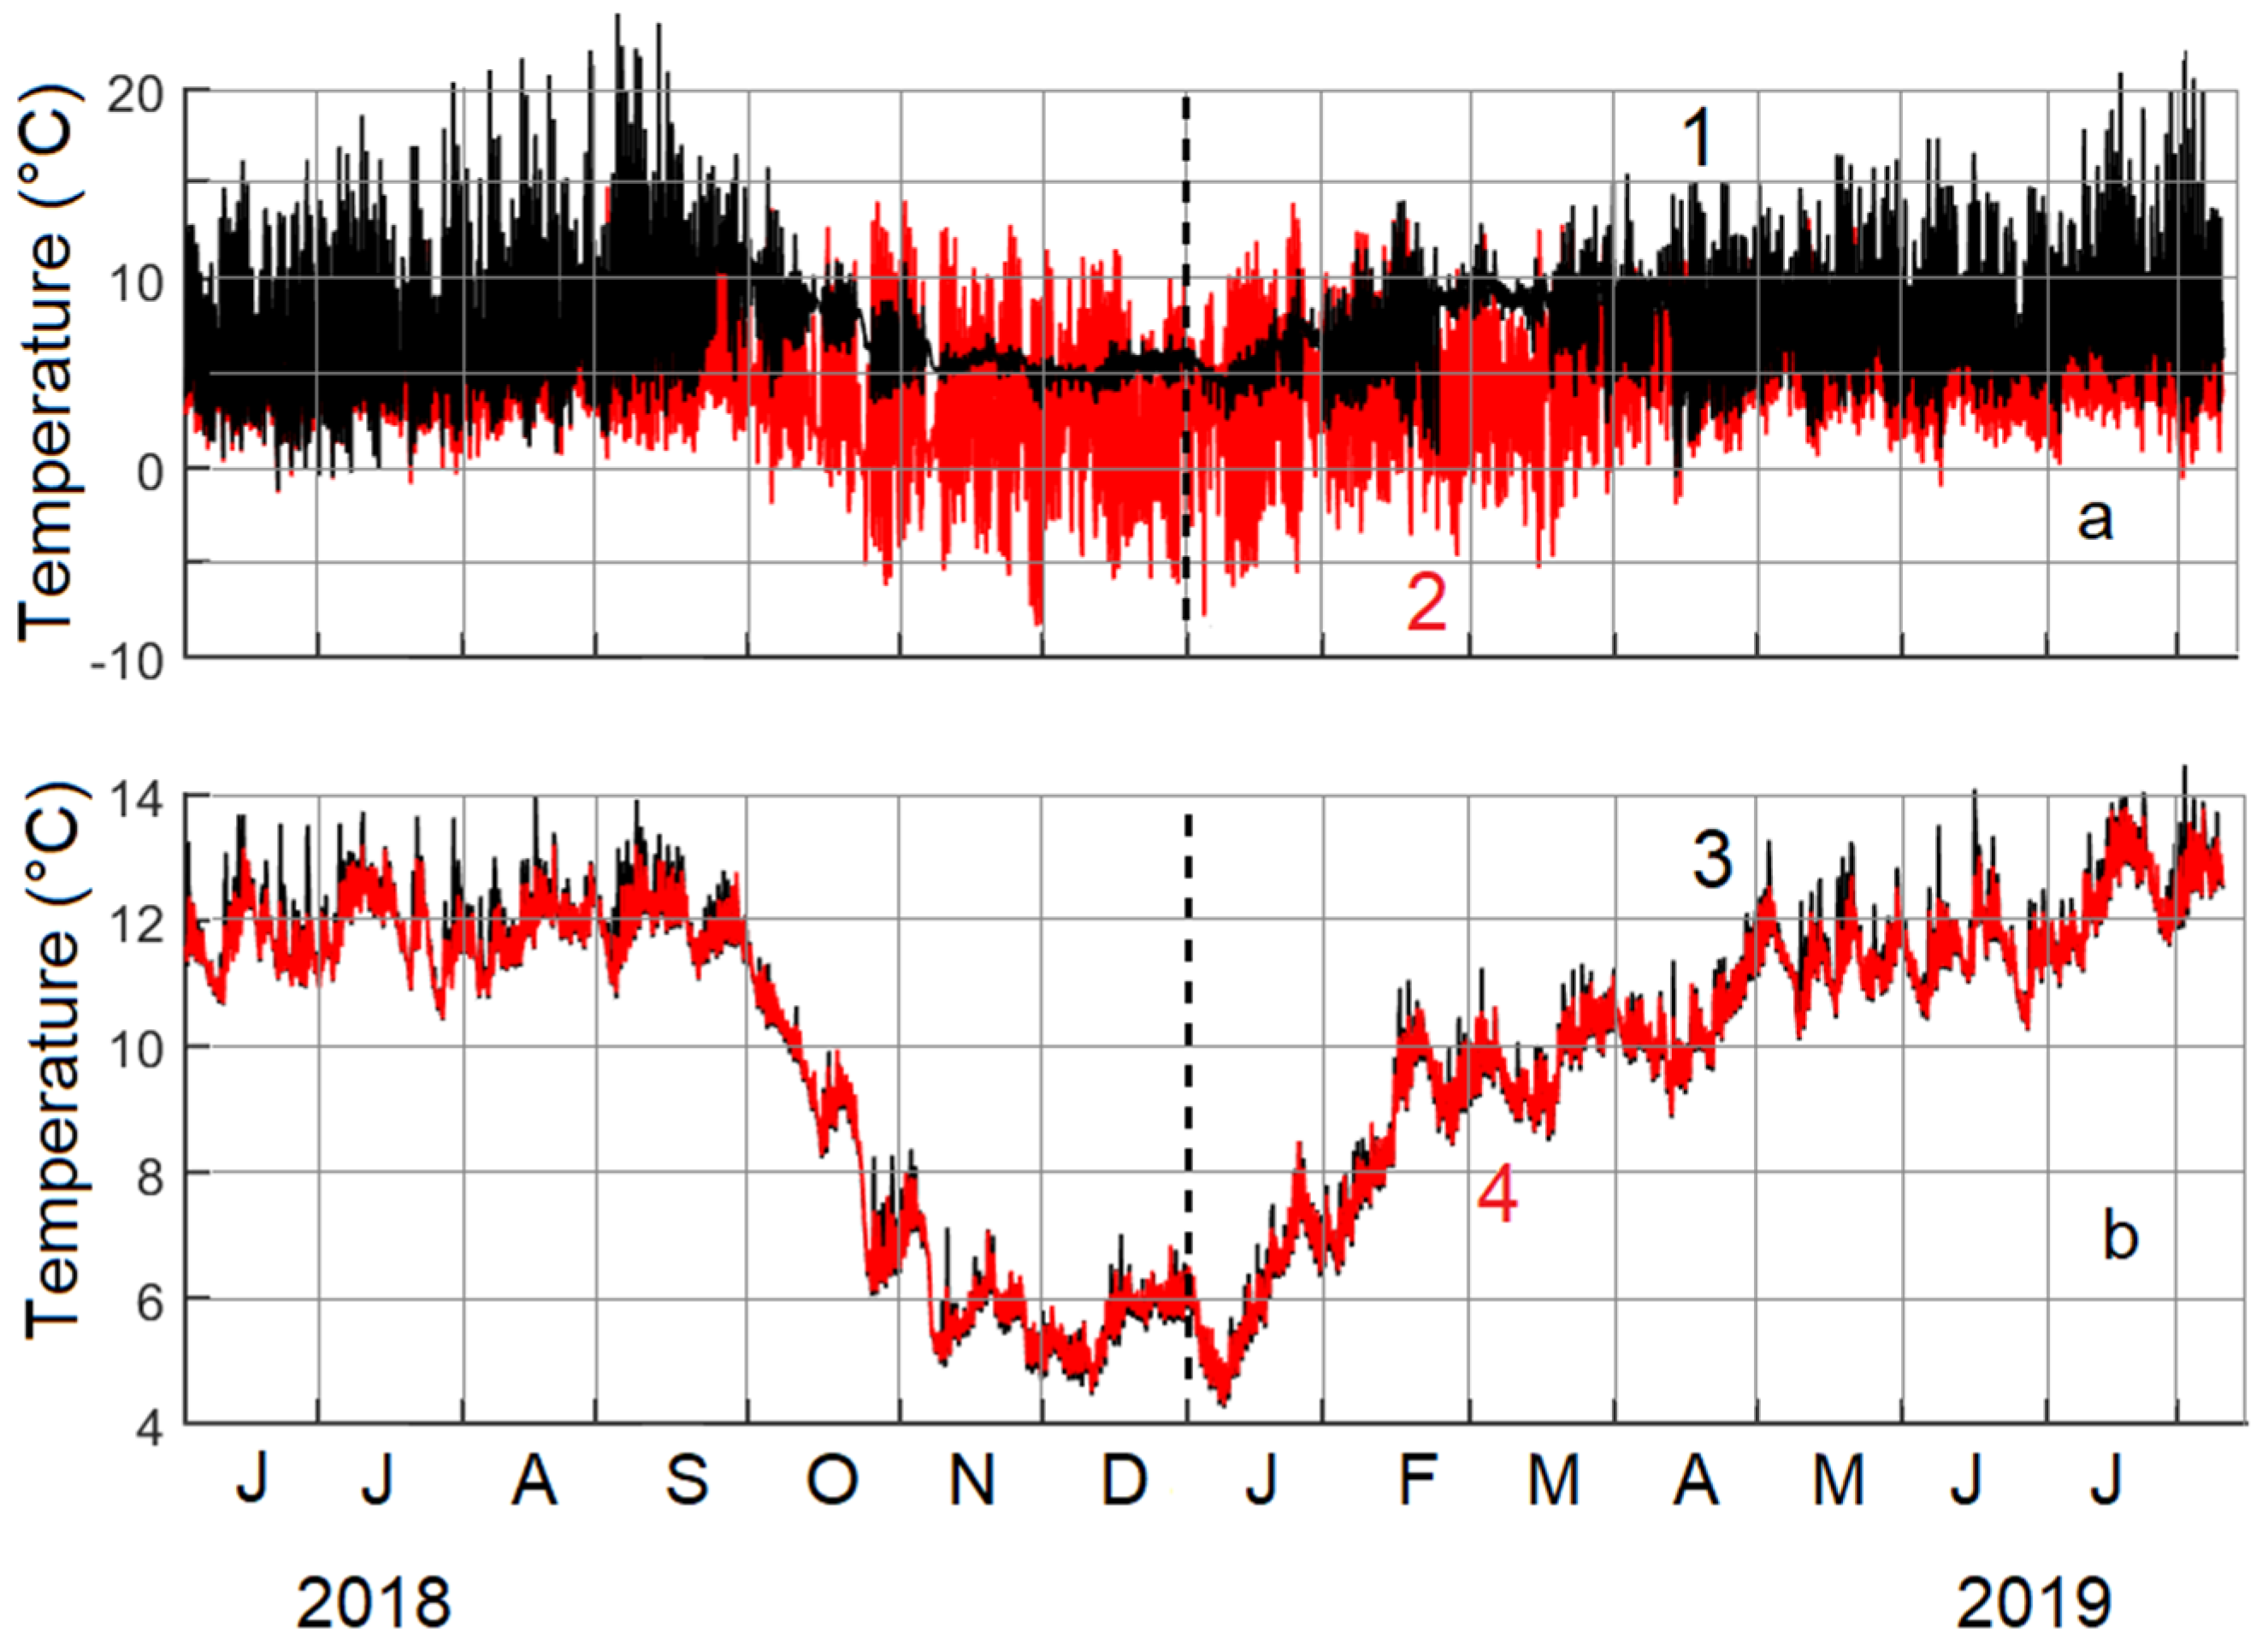
4.1. Long-Term Series. NMS Weather Station (2017–2019)
4.2. Data Obtained at the Floating Weather Station
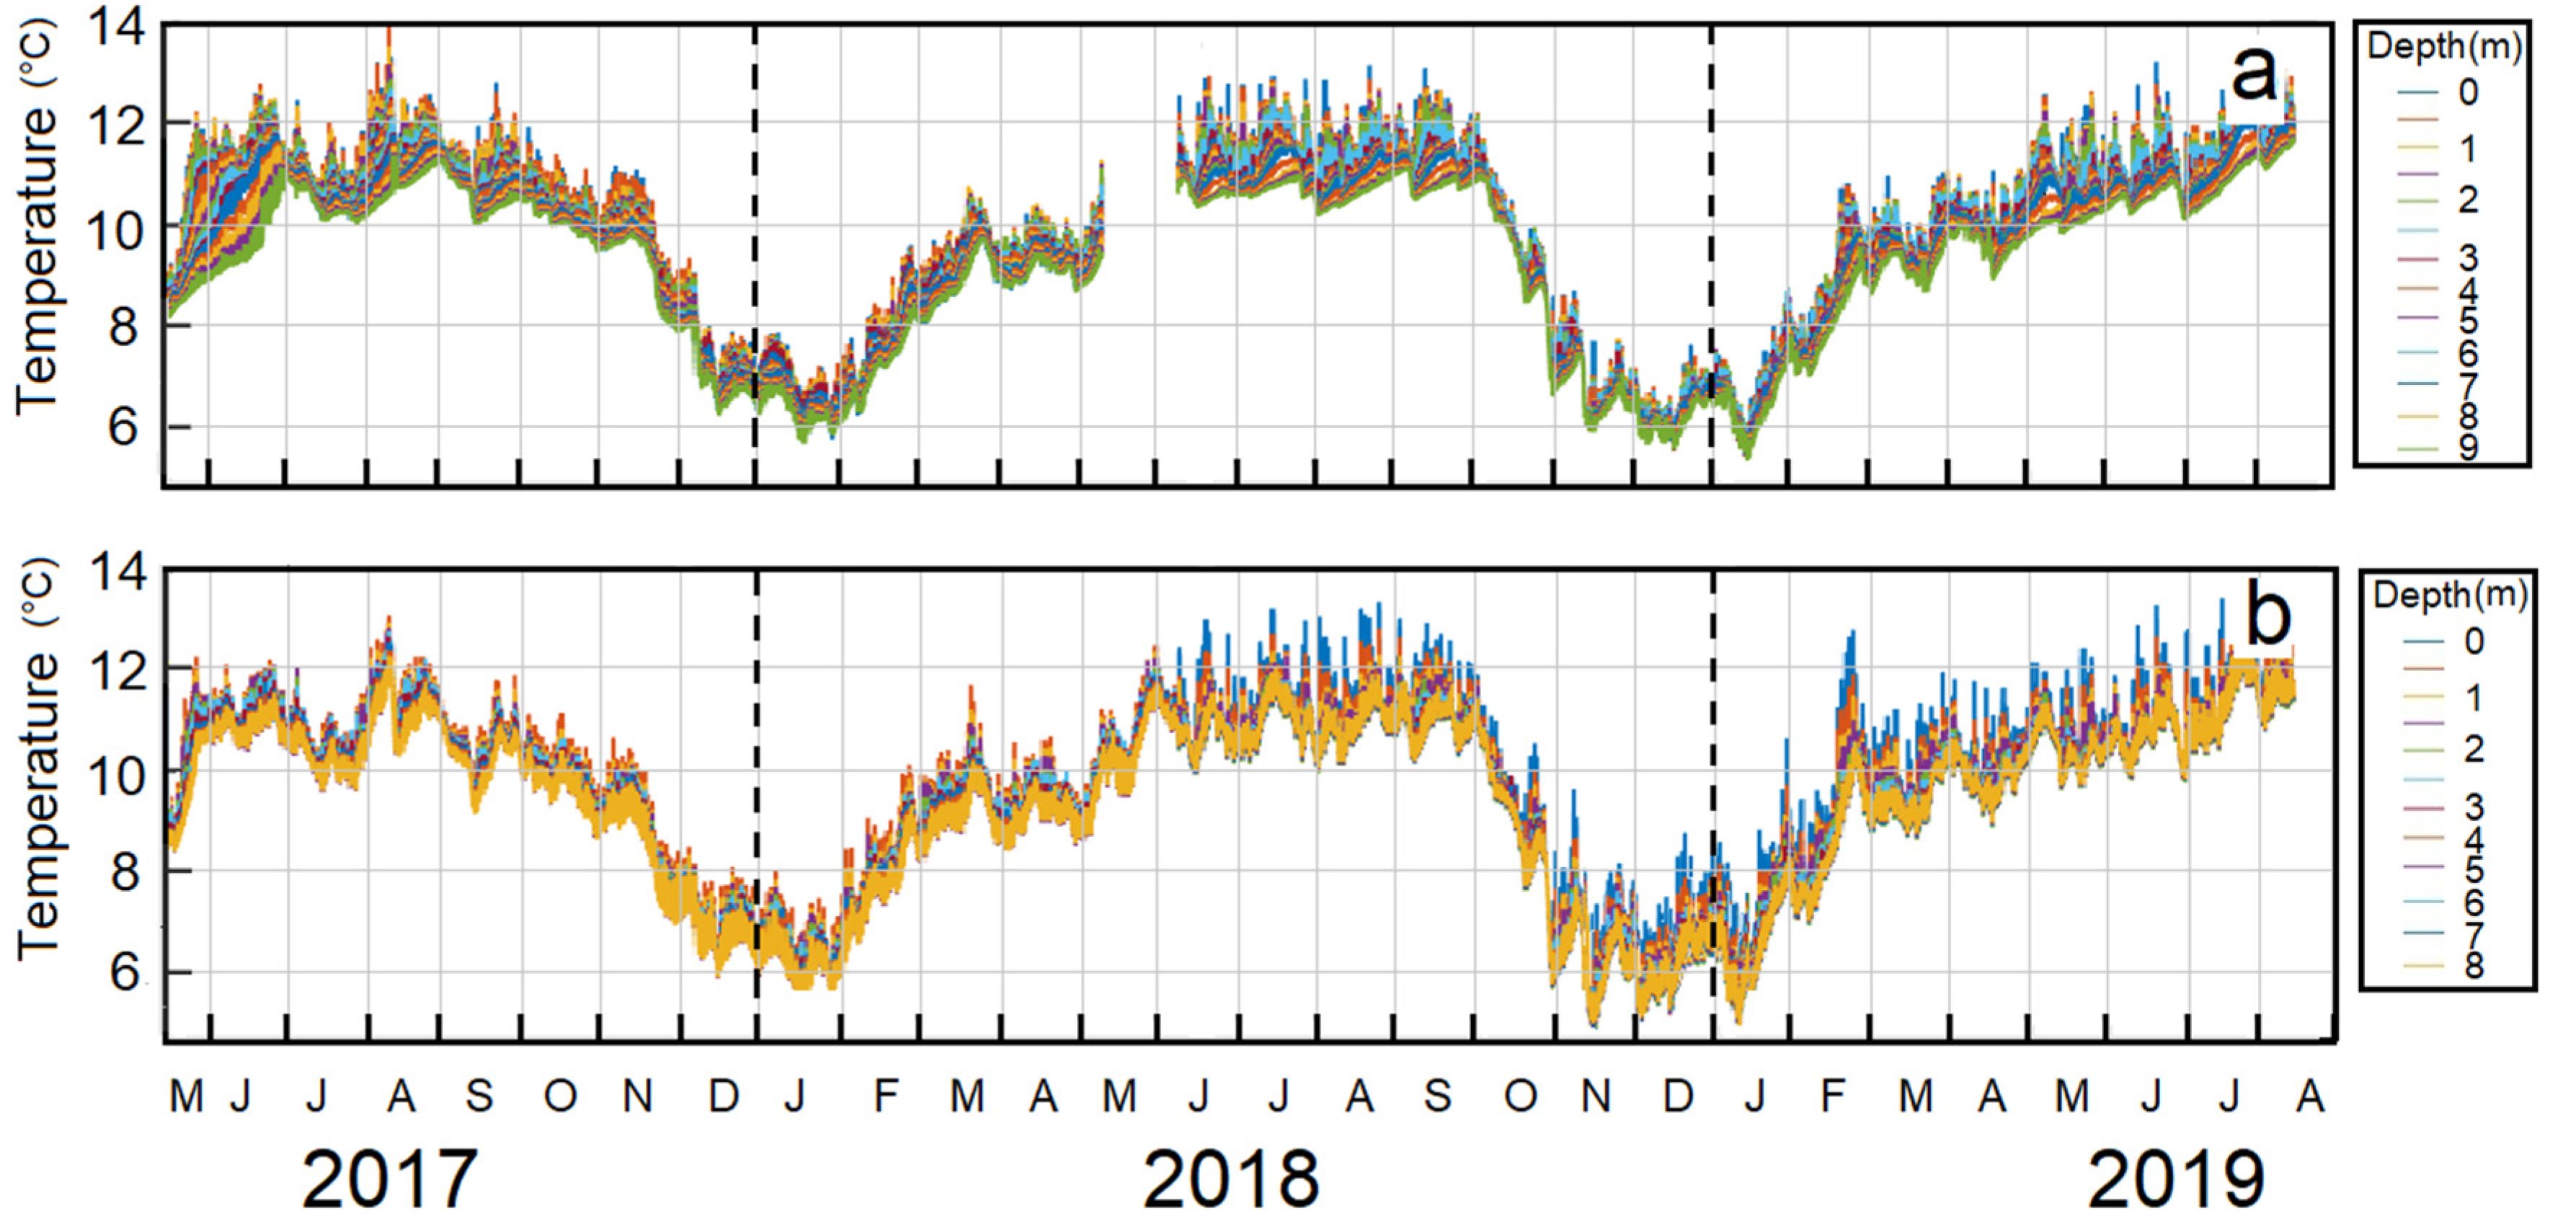
4.2.1. Water Temperature
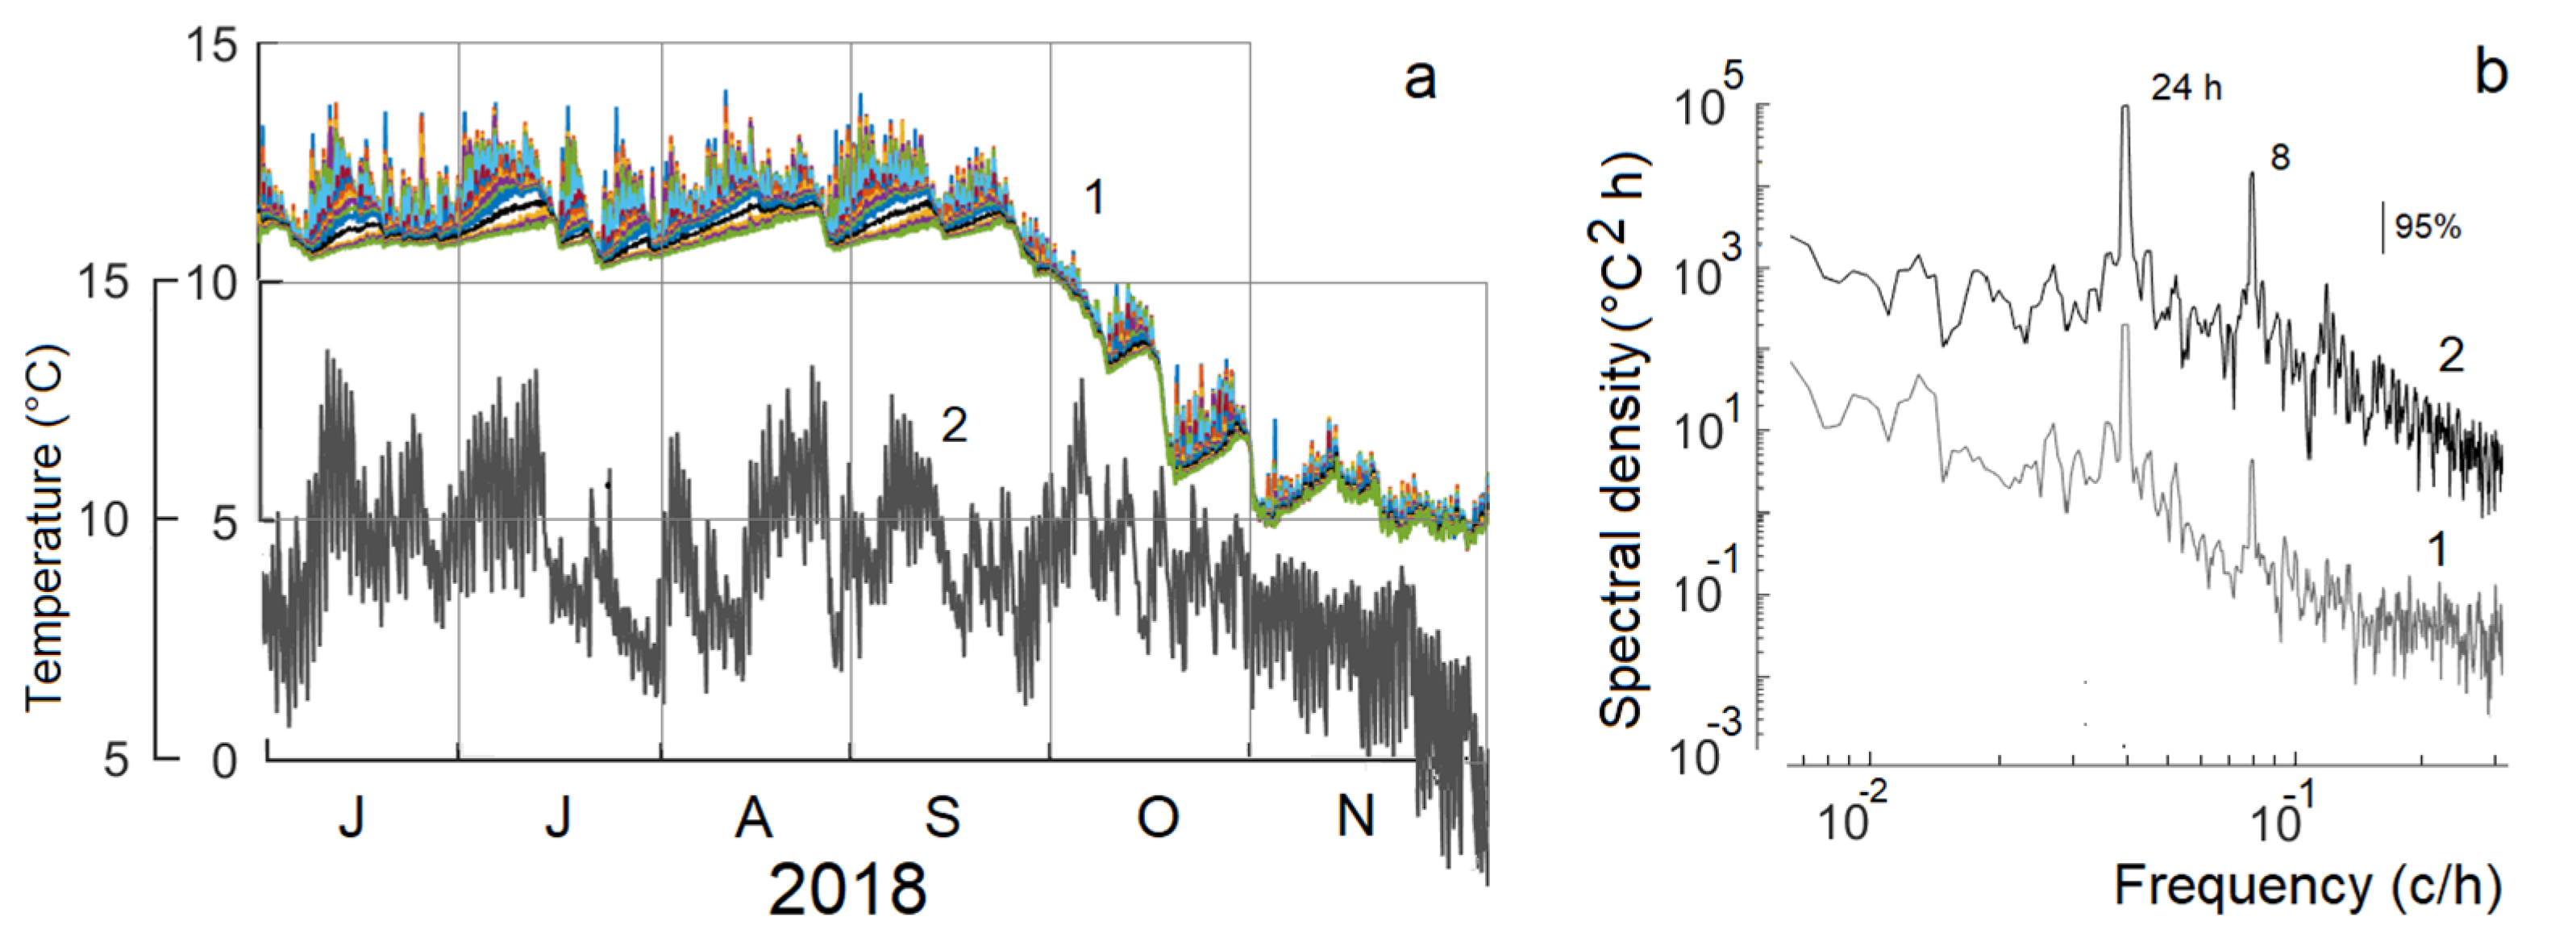
4.2.2. Relationship between Air Temperature Fluctuations on the Western Slope of the Volcano and Surface Temperature Fluctuations of Lake El Sol
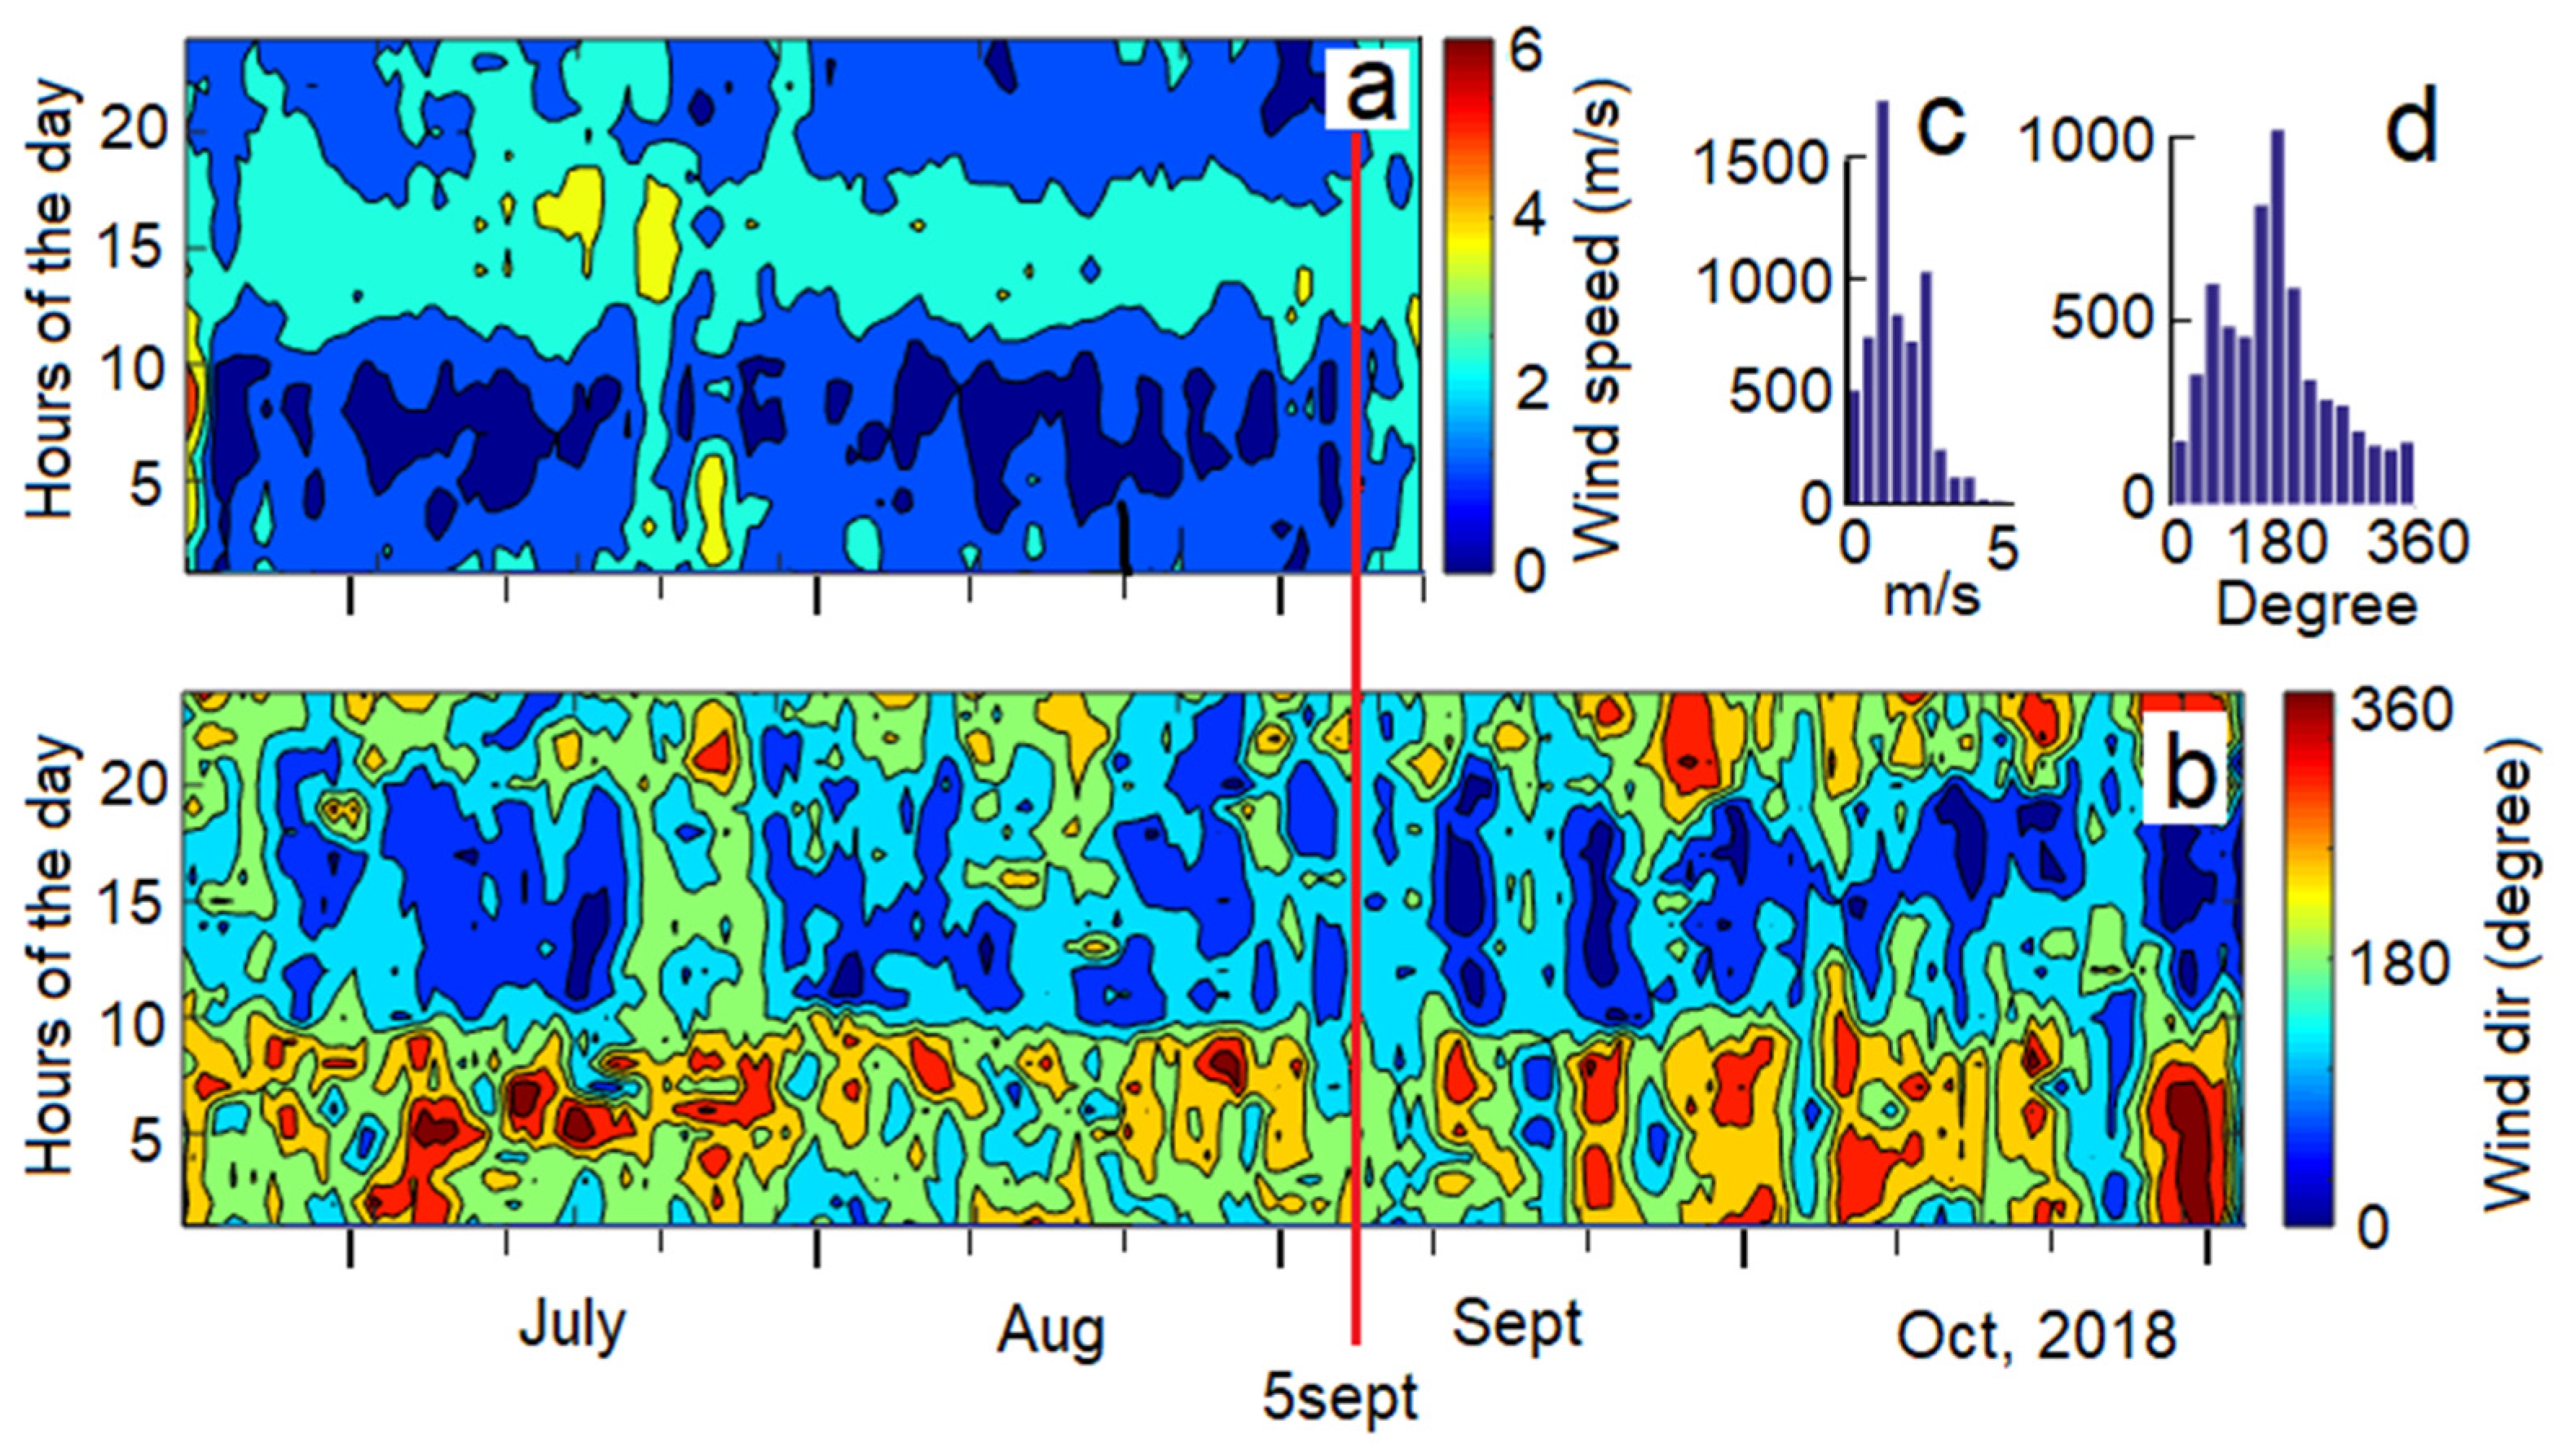
4.2.3. Wind Speed and Direction
4.2.4. Fluctuations in Air Temperature above Water and at the Near-Surface Layer of the Lake
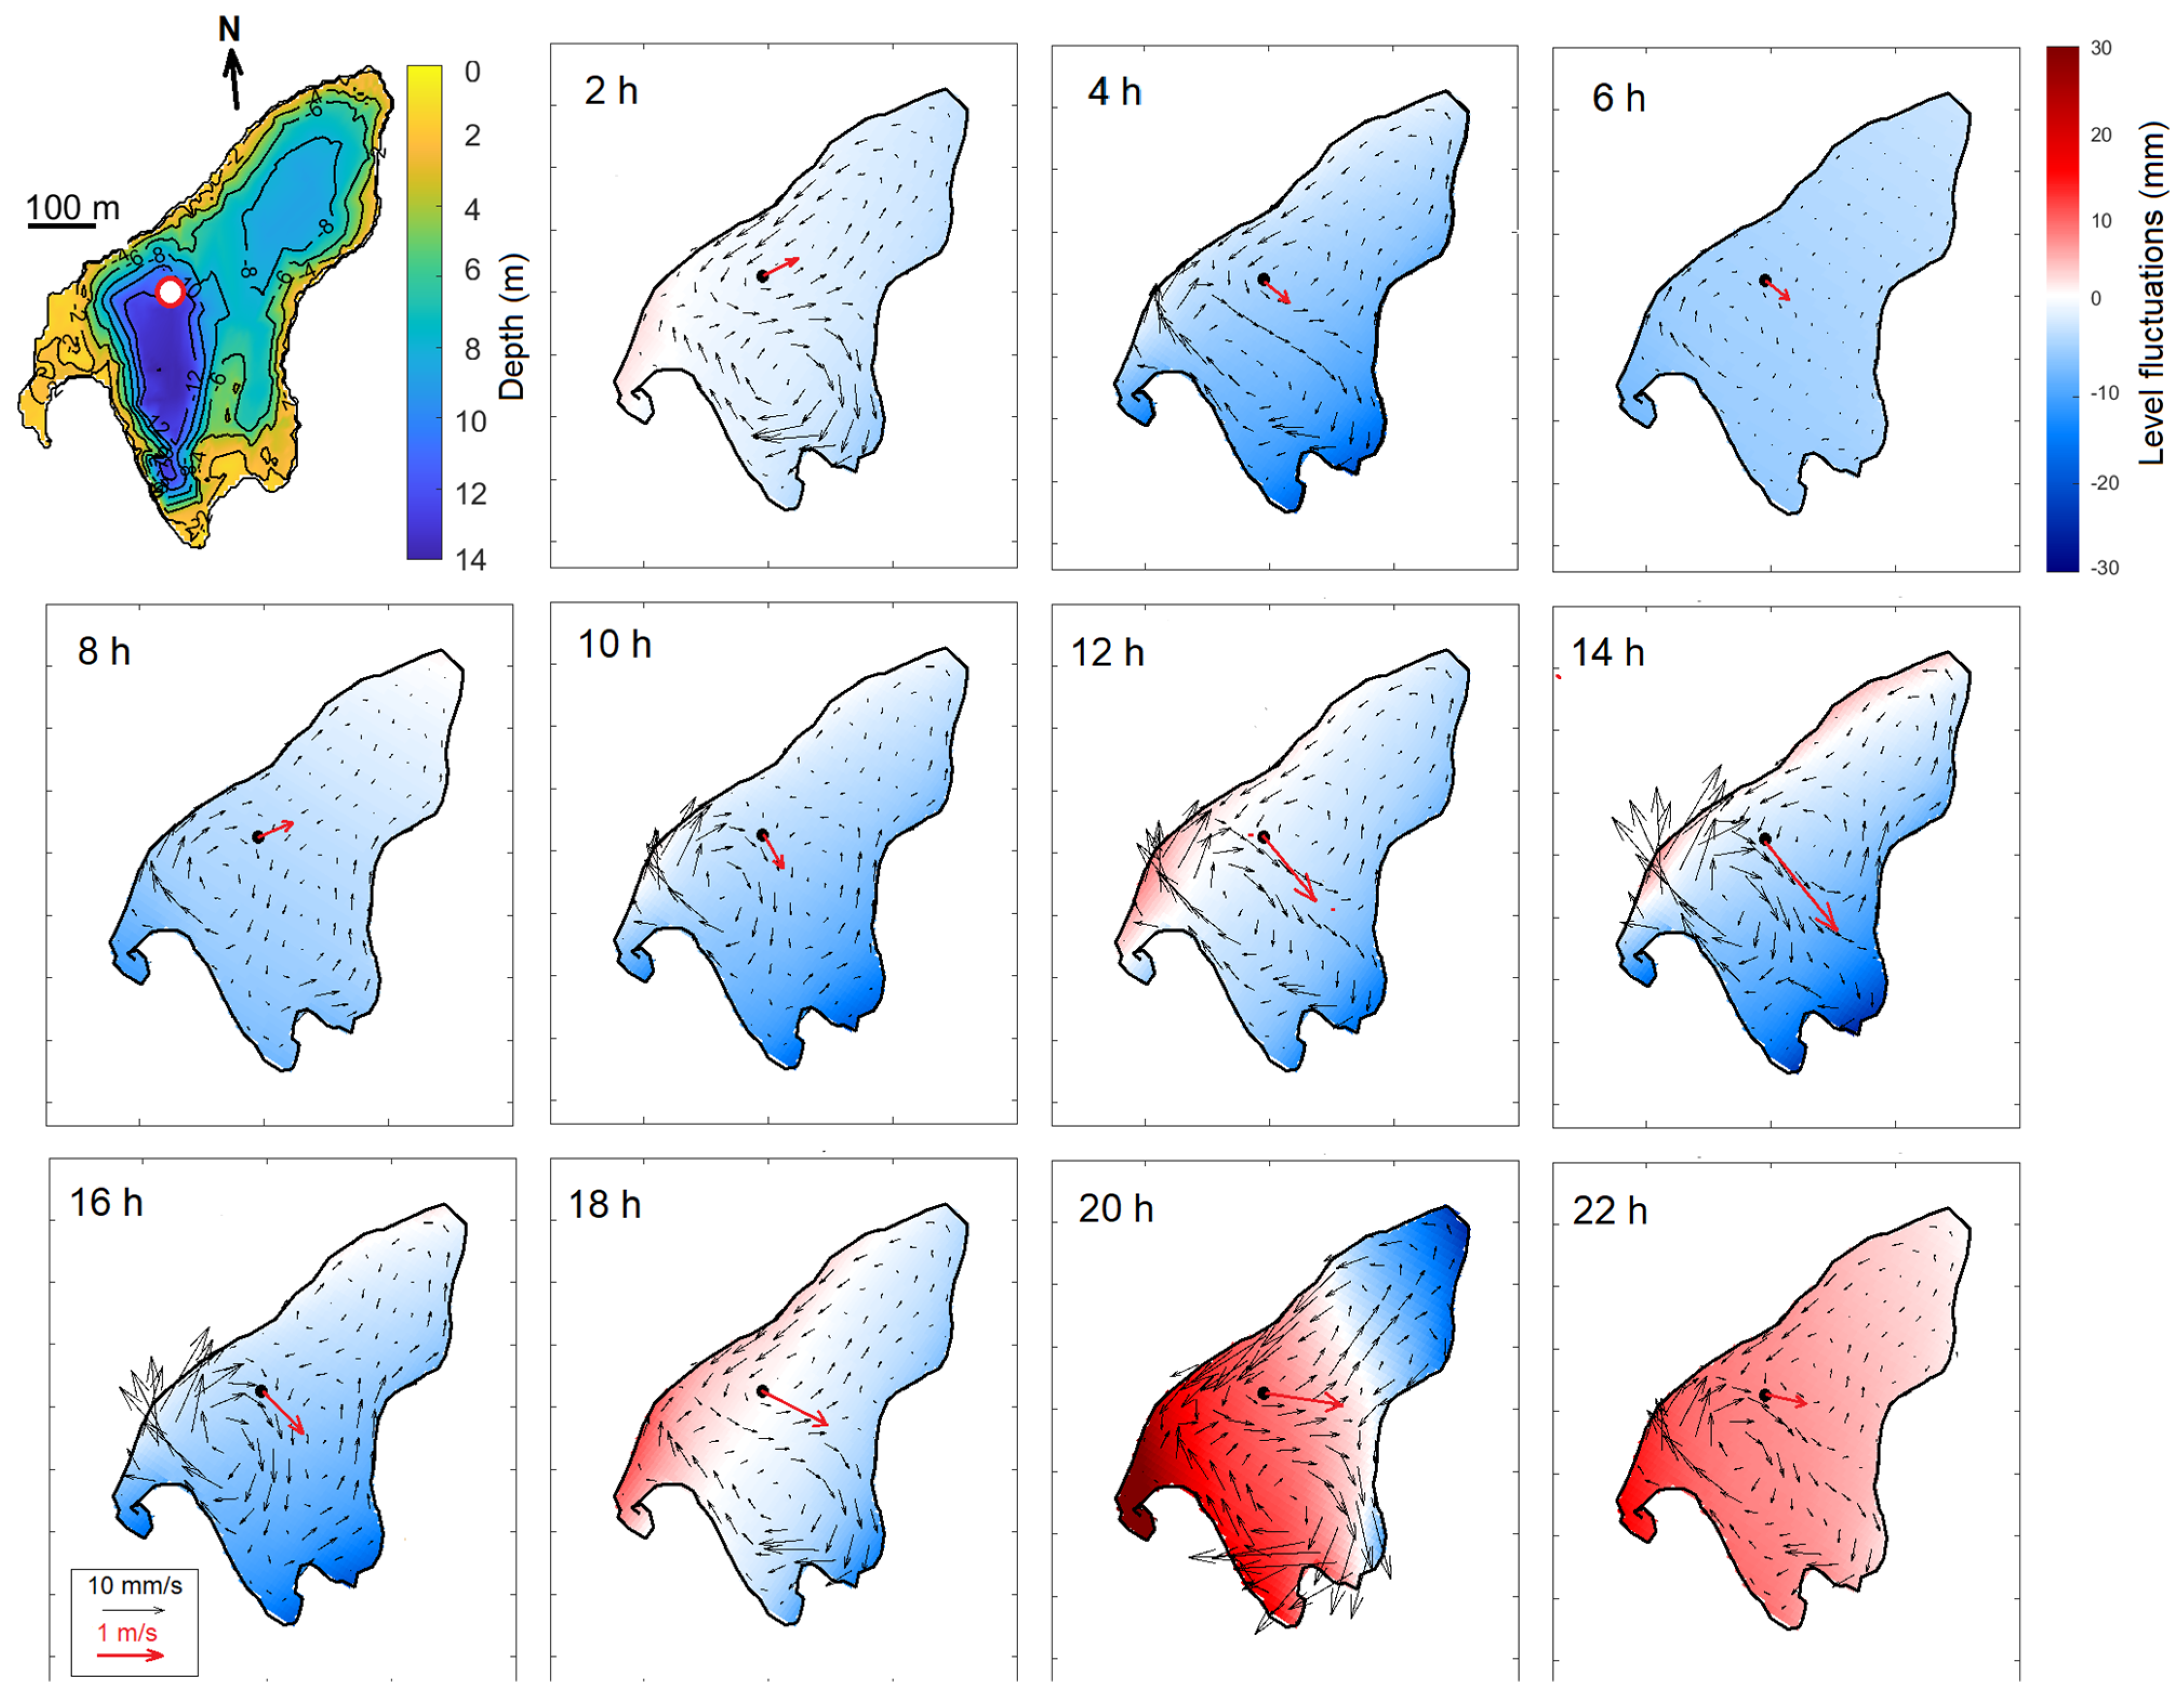
4.3. Modeling Results of Currents and Level Fluctuations in Lake El Sol
4.4. Lake-Level Fluctuations and Processes Occurring at Its Bottom
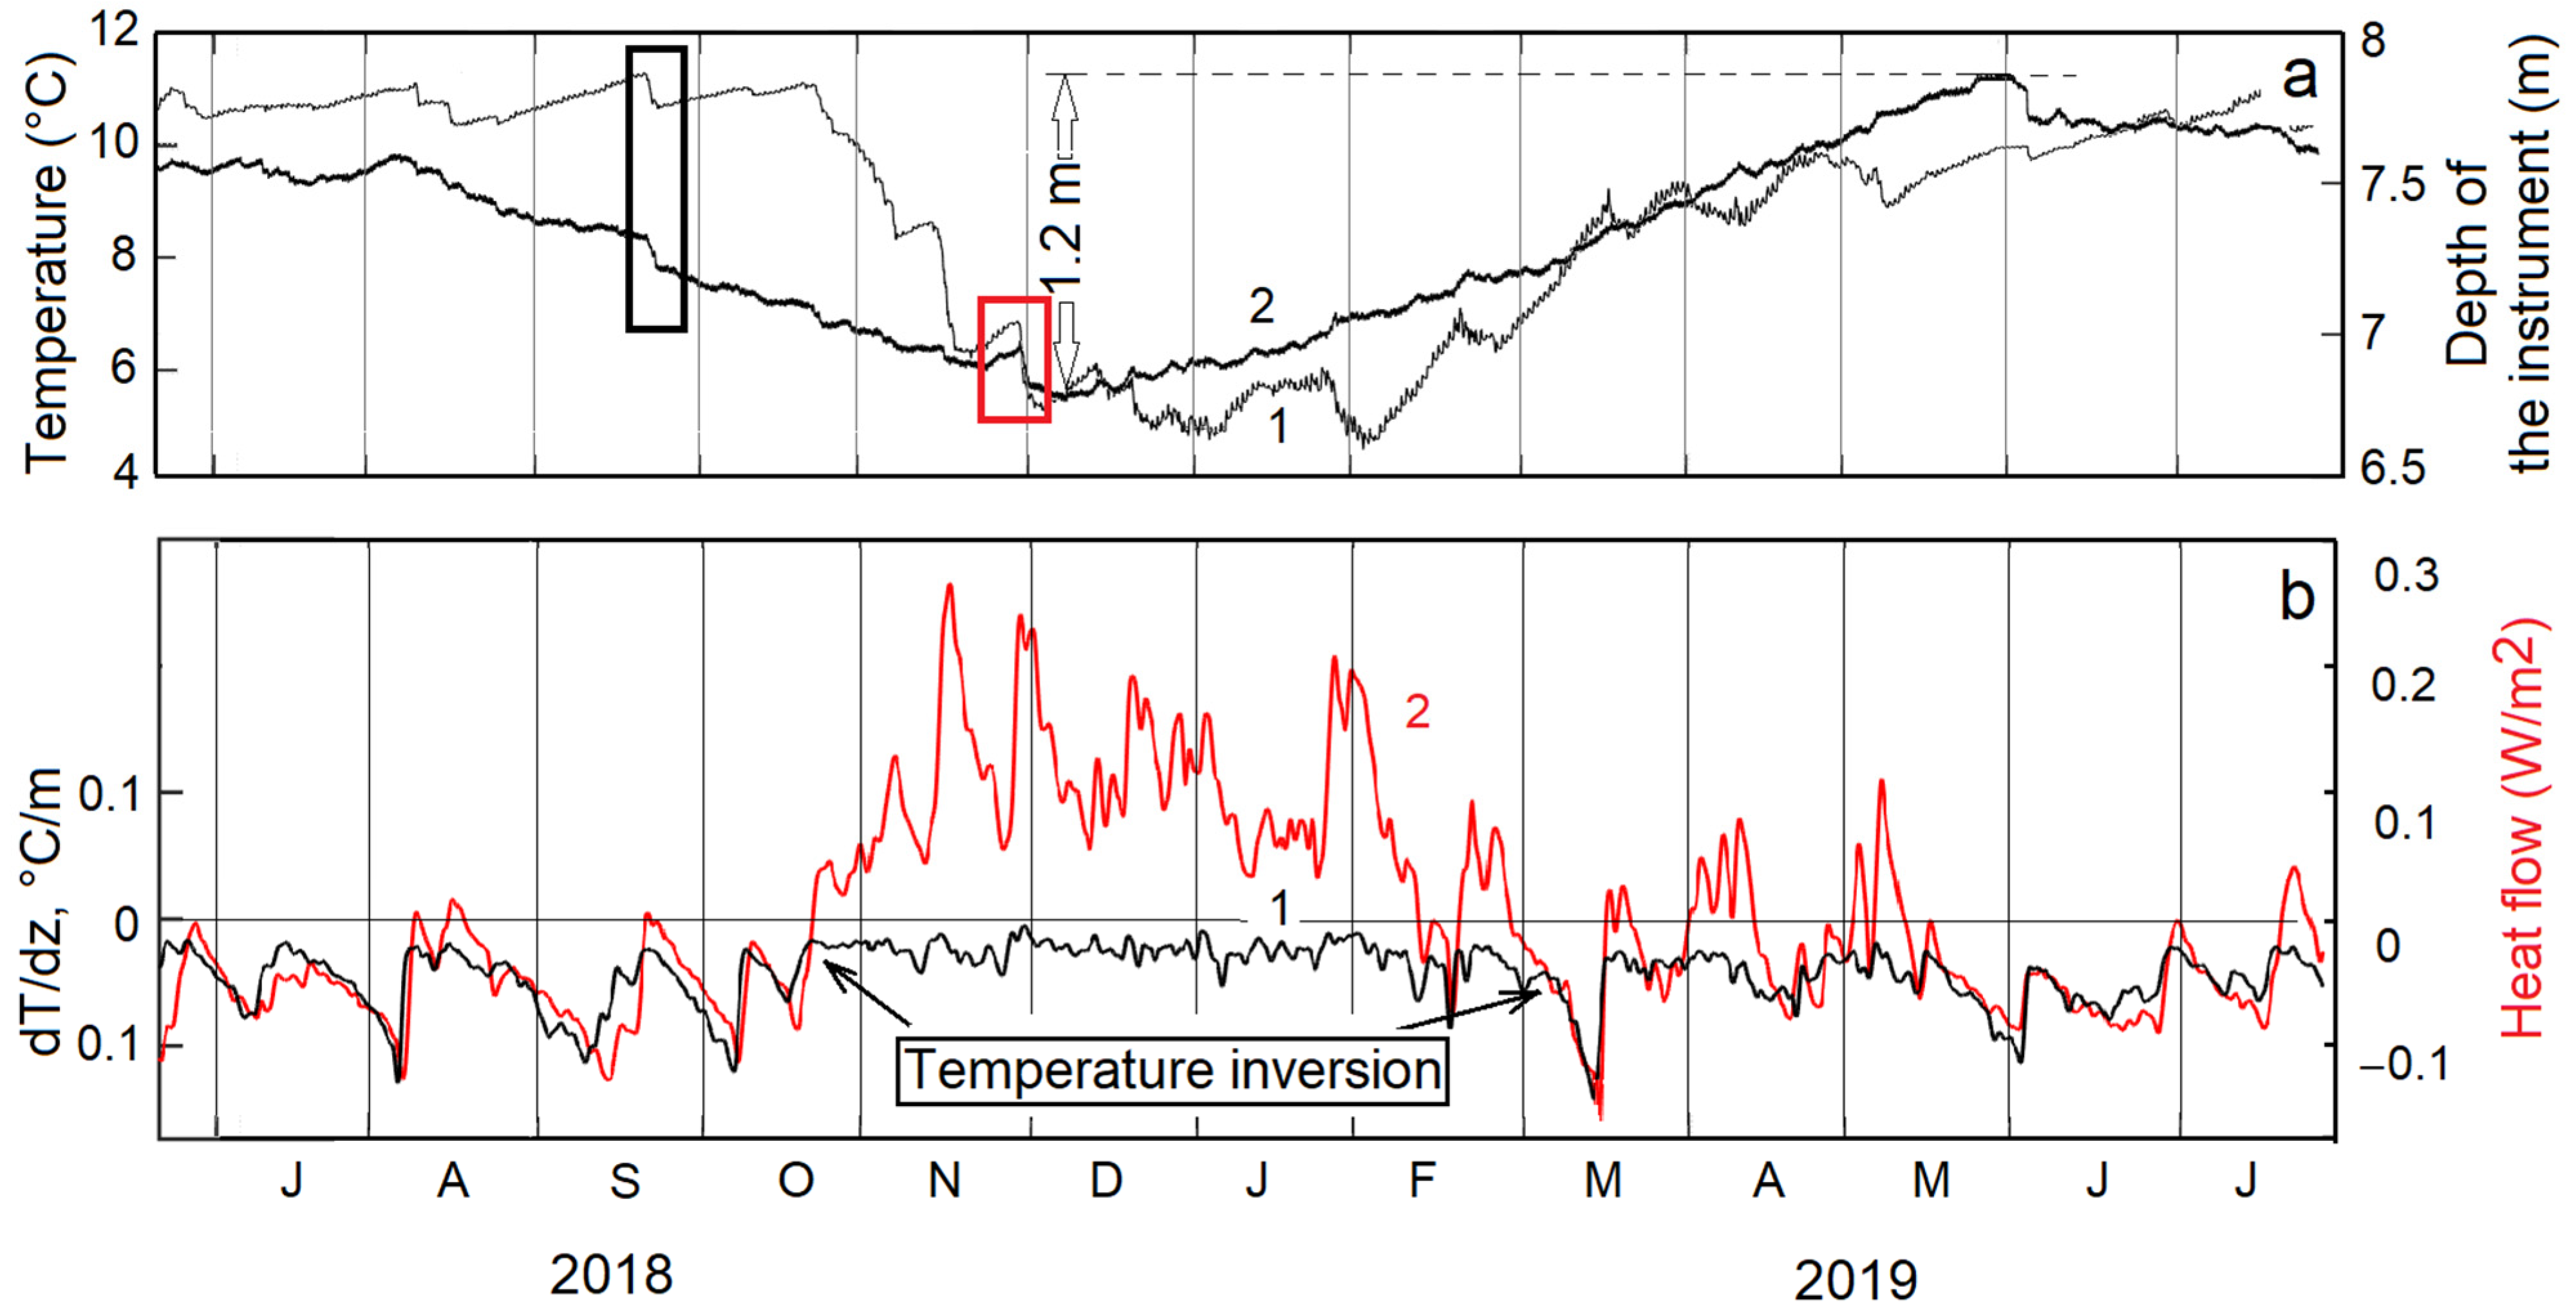
4.4.1. Heat Fluxes between the Water-Bottom Sediments Interface
4.4.2. Variability of Level Fluctuations and Stratification in Lake El Sol
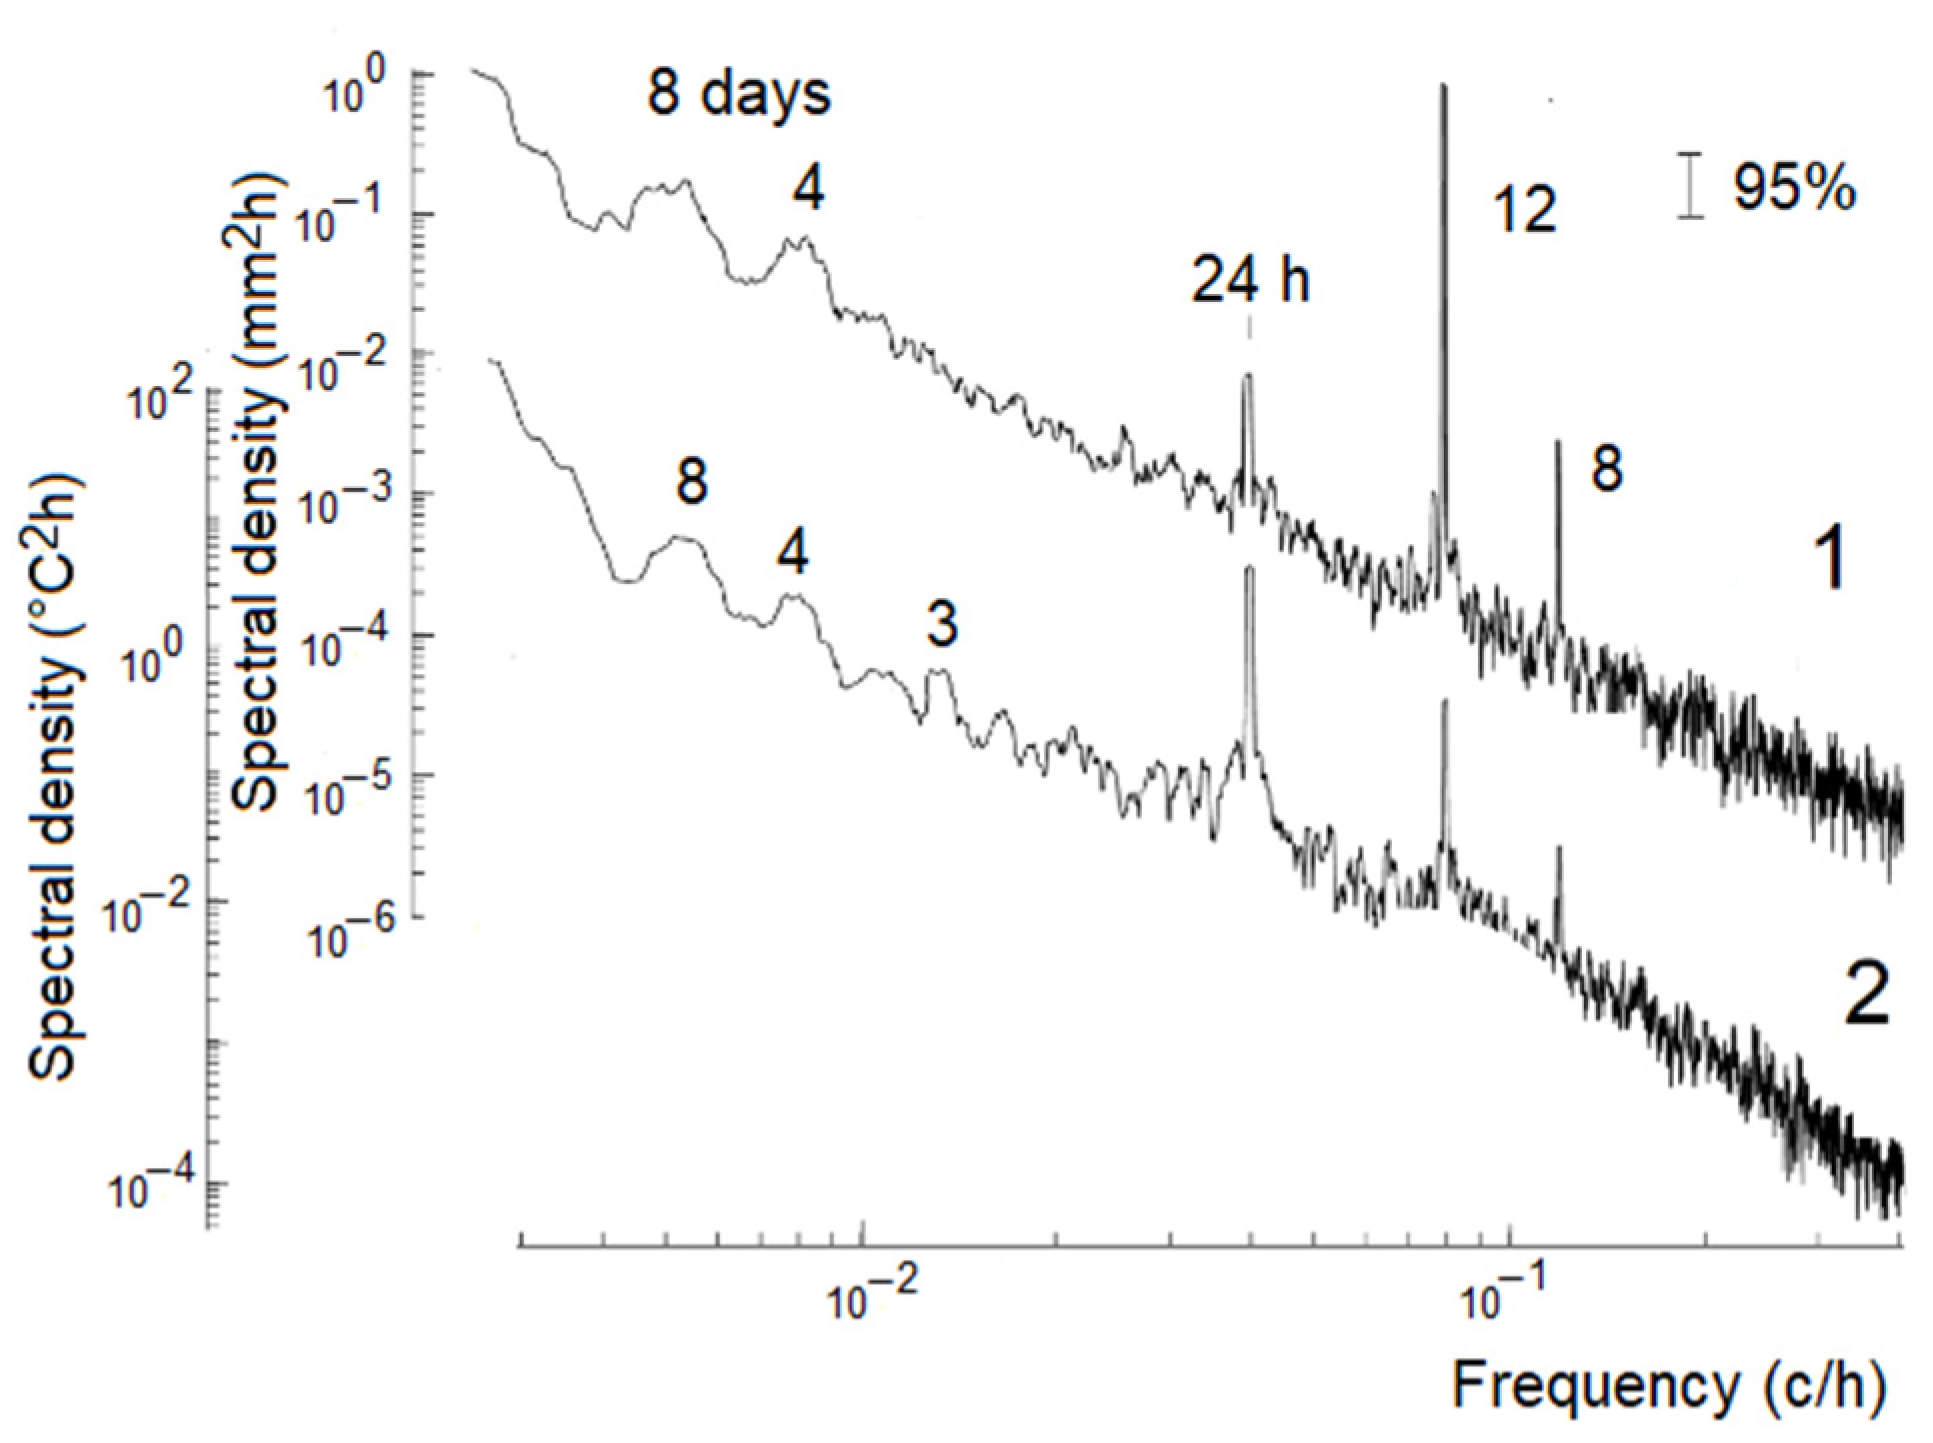
4.4.3. Spectra of the Level and Temperature Fluctuations
4.5. Fluctuation of the Water Balance of the Lake Depending on Precipitation and Evaporation
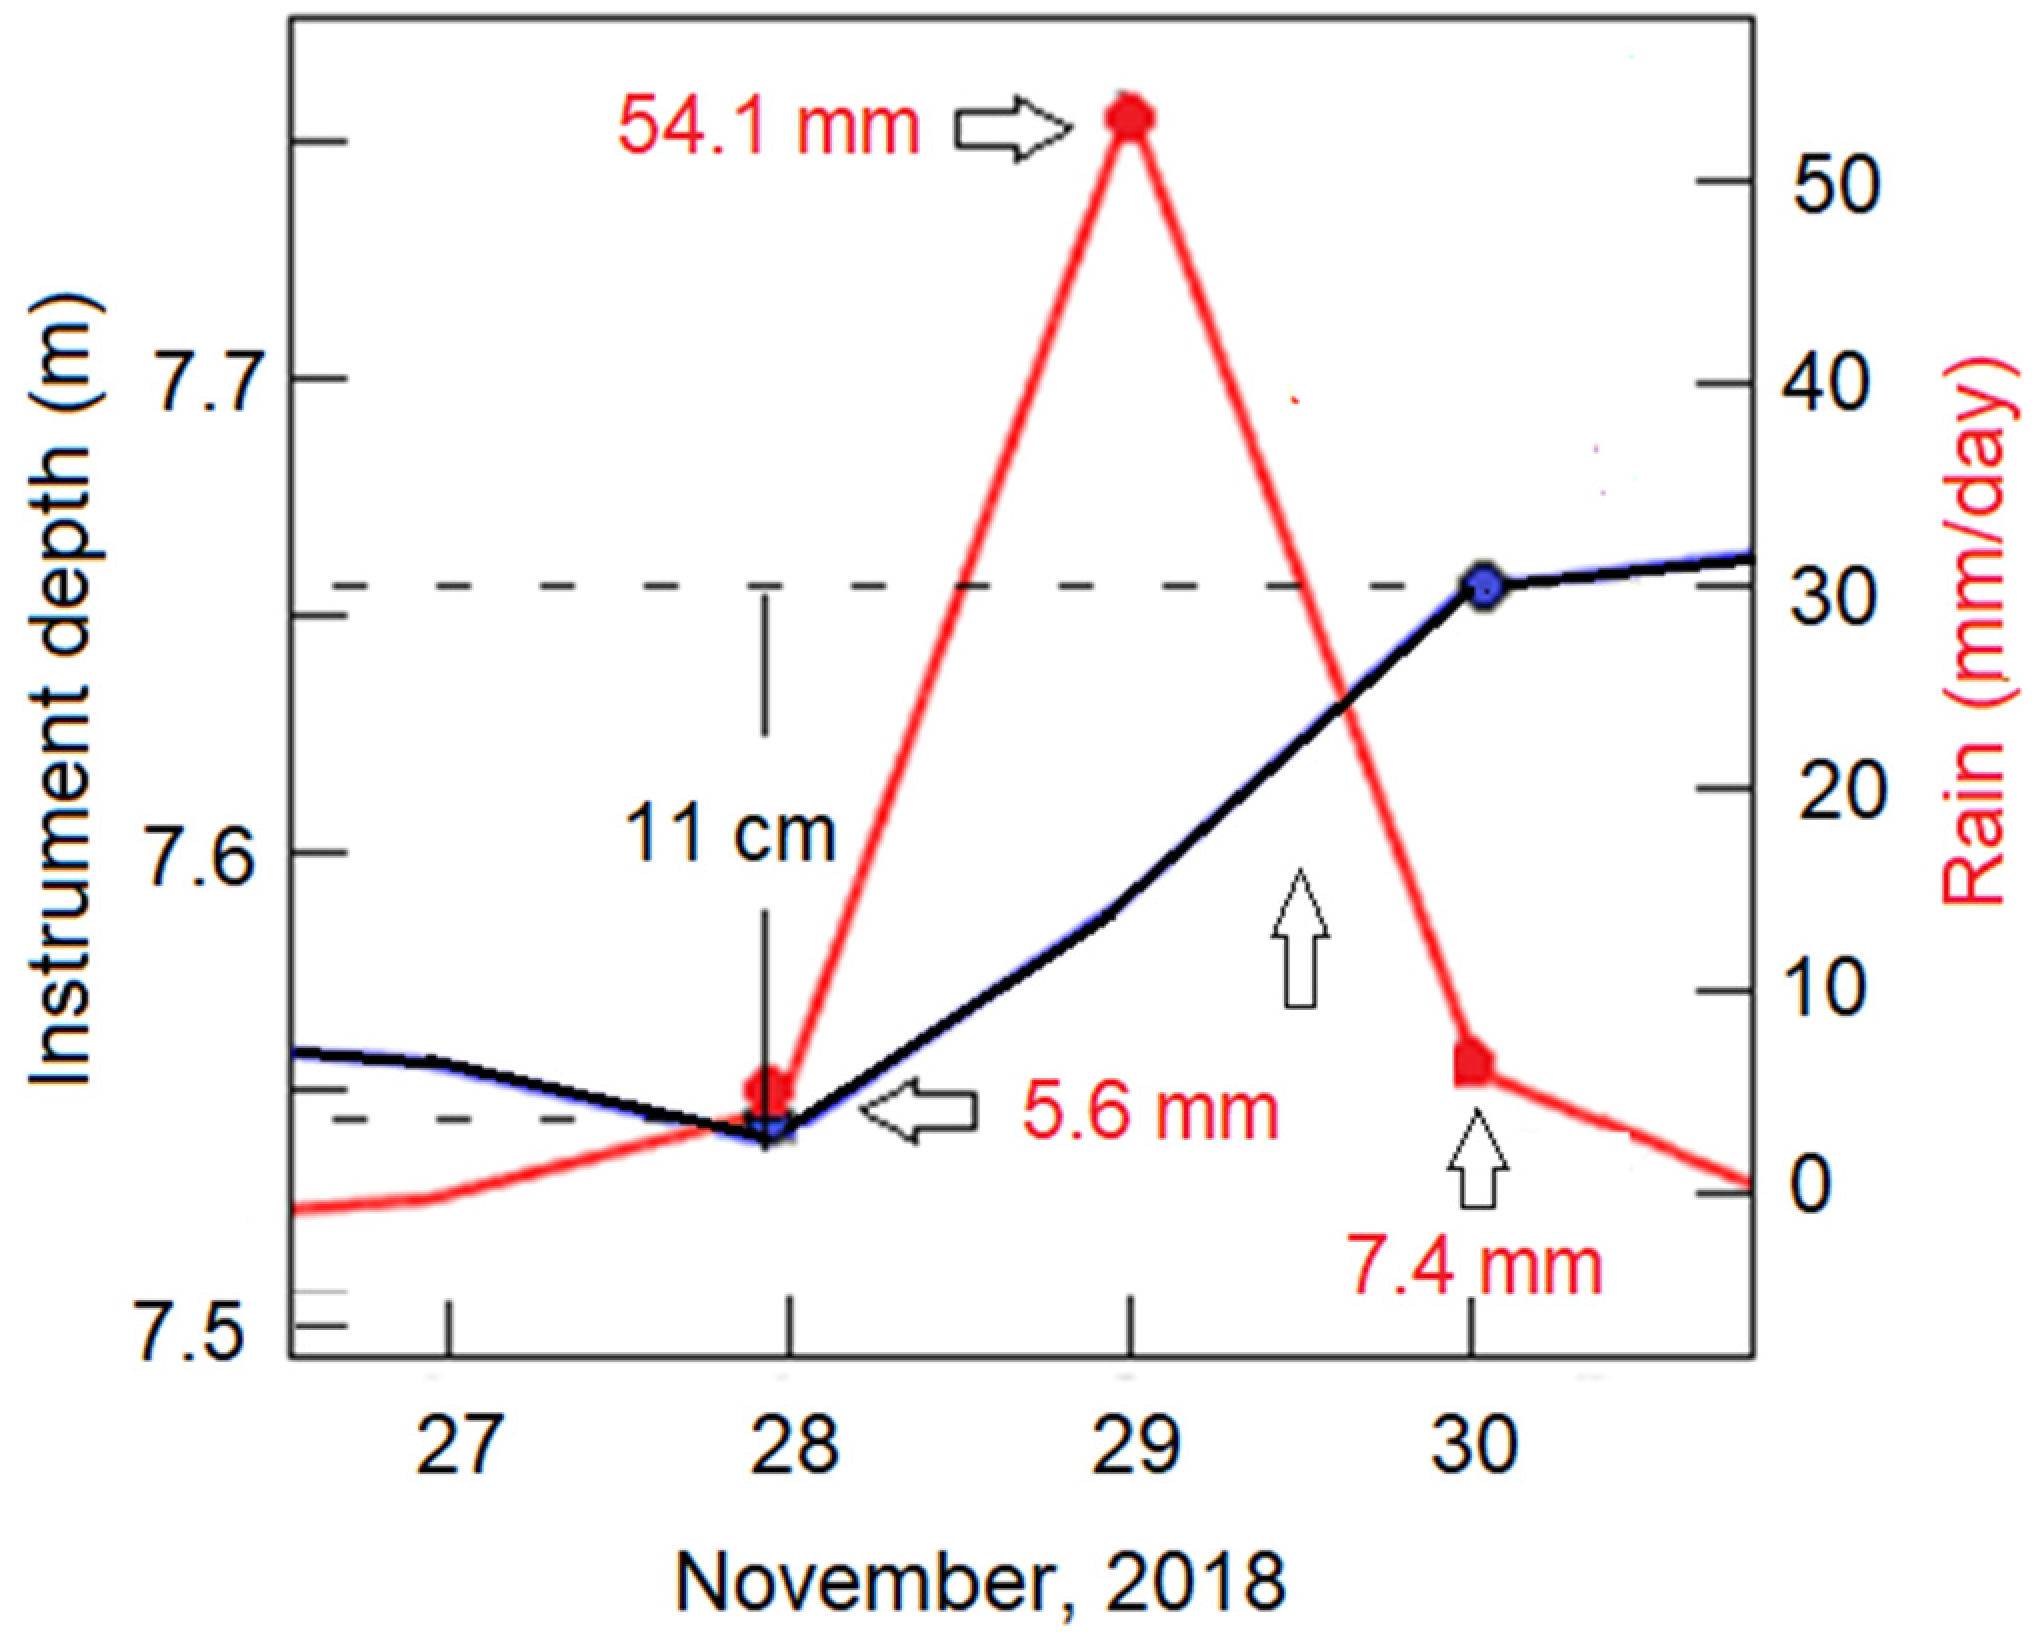
4.5.1. Lake El Sol Level Response in One Case of Heavy Precipitation
4.6. Annual Water Budget of Lake El Sol
5. Conclusions
Author Contributions
Funding
Data Availability Statement
Acknowledgments
Conflicts of Interest
Appendix A. Calculation of Evaporation from the Surface of the Lake

| Year | Month | T2 m Average (°C) | RS Average (MJ/m2 day) | RA (MJ/m2 day) | HR Average (%) |
|---|---|---|---|---|---|
| 2018 | July | 5.2 | 14.4 | 26.8 | 85.8 |
| August | 4.7 | 16.7 | 30.6 | 98.3 | |
| September | 5.4 | 14.8 | 34.7 | 85.3 | |
| October | 5.0 | 11.8 | 37.9 | 79.4 | |
| November | 3.0 | 14.9 | 39.3 | 61.9 | |
| December | 2.6 | 17.4 | 39.5 | 65.2 | |
| 2019 | January | 2.1 | 17.9 | 39.3 | 62.3 |
| February | 3.2 | 19.6 | 38.3 | 52.6 | |
| March | 4.3 | 23.3 | 35.8 | 64.4 | |
| April | 4.6 | 22.4 | 31.8 | 62.5 | |
| May | 6.4 | 22.6 | 27.7 | 79.1 | |
| June | 5.8 | 13.9 | 25.6 | 73.4 |
| Monthly Evaporation (mm/month) | |
|---|---|
| July 2018 | 68.8 |
| August 2018 | 70.7 |
| September 2018 | 77.4 |
| October 2018 | 72.5 |
| November 2018 | 87.9 |
| December 2018 | 95.5 |
| January 2019 | 96.7 |
| February 2019 | 112.2 |
| March 2019 | 107.2 |
| April 2019 | 107.7 |
| May 2019 | 97.0 |
| June 2019 | 76.3 |
| Annual evaporation | 1070.0 (mm/year) |
References
- Löffler, H. Contribution to the Limnology of High Montain Lakes in Central America. Int. Rev. Hydrobiol. Hydrogr. 1972, 57, 397–408. [Google Scholar] [CrossRef]
- Hutchinson, G.E. A Treatise on Limnology. In Geography, Physics and Chemistry; John Wiley and Sons: New York, NY, USA, 1957; Volume 1, p. 1015. [Google Scholar]
- Sommaruga, R. The role of solar UV radiation in the ecology of alpine lakes. J. Photochem. Photobiol. B Biol. 2001, 62, 35–42. [Google Scholar] [CrossRef]
- Hobbs, W.O.; Telford, R.J.; Birks, H.J.B.; Saros, J.E.; Hazewinkel, R.R.O.; Perren, B.B.; Saulnier-Talbot, É.; Wolfe, A.P. Quantifying recent ecological changes in remote lakes of North America and greenland using sediment diatom assemblages. PLoS ONE 2010, 5, e10026. [Google Scholar] [CrossRef] [PubMed] [Green Version]
- Moser, K.A.; Baron, J.S.; Brahney, J.; Oleksy, I.A.; Saros, J.E.; Hundey, E.J.; Sadro, S.A.; Kopáček, J.; Sommaruga, R.; Kainz, M.J.; et al. Mountain lakes: Eyes on global environmental change. Glob. Planet. Change 2019, 178, 77–95. [Google Scholar] [CrossRef] [Green Version]
- Pepin, N.; Bradley, R.S.; Diaz, H.F.; Baraer, M.; Caceres, E.B.; Forsythe, N.; Fowler, H.; Greenwood, G.; Hashmi, M.Z.; Liu, X.D.; et al. Elevation-dependent warming in mountain regions of the world. Nat. Clim. Change 2015, 5, 424–430. [Google Scholar]
- Schirpke, U.; Ebner, M.; Pritsch, H.; Fontana, V.; Kurmayer, R. Quantifying ecosystem services of high mountain lakes across different socio-ecological contexts. Sustainability 2021, 13, 6051. [Google Scholar] [CrossRef]
- Battarbee, R.W.; Grytnes, J.A.; Thompson, R.; Appleby, P.G.; Catalan, J.; Korhola, A.; Lami, A. Comparing palaeolimnological and instrumental evidence of climate change for remote mountain lakes over the last 200 years. J. Paleolimnol. 2002, 28, 161–179. [Google Scholar] [CrossRef]
- Catalan, J.; Pla-Rabés, S.; Wolfe, A.P.; Smol, J.P.; Rühland, K.M.; Anderson, N.J.; Kopáček, J.; Stuchlík, E.; Schmidt, R.; Koinig, K.A.; et al. Global change revealed by palaeolimnological records from remote lakes: A review. J. Paleolimnol. 2013, 49, 513–535. [Google Scholar] [CrossRef]
- Alcocer, J. Las aguas celestiales. Nevado de Toluca. In Las Aguas Celestiales. Nevado de Toluca; Luna, P., Montero, A., Junco, R., Eds.; Instituto Nacional de Antropología e Historia: Ciudad de México, Mexico, 2009; Volume 16, pp. 10–13. [Google Scholar]
- Filonov, A. On the dynamical response of Lake Chapala, Mexico to lake breeze forcing. Hydrobiologia 2002, 141–157. [Google Scholar] [CrossRef]
- Filonov, A.; Tereshchenko, I.; Alcocer, J. Dynamic response to mountain breeze circulation in Alchichica, a crater lake in Mexico. Geophys. Res. Lett. 2006, 33, 2–5. [Google Scholar] [CrossRef]
- Löffler, H. The limnology of tropical high-mountain lakes Internationale. Vereinigung Theor. Angew. Limnol. Verh. 1964, 15, 176–193. [Google Scholar]
- Payne, A.I. The ecology of tropical lakes and rivers. Ecol. Trop. 1991, 75, 582. [Google Scholar] [CrossRef]
- Catalan, J.; Donato Rondón, J.C. Perspectives for an integrated understanding of tropical and temperate high-mountain lakes. J. Limnol. 2016, 75, 215–234. [Google Scholar] [CrossRef] [Green Version]
- Alcocer, J.; Oseguera, L.A.; Ibarra-Morales, D.; Escobar, E.; García-Cid, L. Responses of benthic macroinvertebrate communities of two tropical, high-mountain lakes to climate change and deacidification. Diversity 2021, 13, 243. [Google Scholar] [CrossRef]
- Kinzie, R.A.; Banaszak, A.T.; Lesser, M.P. Effects of ultraviolet radiation on primary productivity in a high altitude tropical lake. Hydrobiologia 1998, 385, 23–32. [Google Scholar] [CrossRef]
- Wetzel, R. Limnology. Lake and River Ecosystems; Academic Press: Cambridge, MA, USA, 2001. [Google Scholar]
- Wang, J.; Huang, L.; Ju, J.; Daut, G.; Wang, Y.; Ma, Q.; Zhu, L.; Haberzettl, T.; Baade, J.; Mäusbacher, R. Spatial and temporal variations in water temperature in a high-altitude deep dimictic mountain lake (Nam Co), central Tibetan Plateau. J. Great Lakes Res. 2019, 45, 212–223. [Google Scholar] [CrossRef]
- Baron, J.S.; Caine, N. Temporal coherence of two alpine lake basins of the Colorado Front Range, U.S.A. Freshw. Biol. 2000, 43, 463–476. [Google Scholar] [CrossRef]
- Becker, A.; Bugmann, H. Predicting Global Change Impacts on Mountain Hydrology and Ecology: Integrated Catchment Hydrology/Altitudinal Gradient Studies: A Workshop report. IGBP Rep. 1997, 43, 7–9. [Google Scholar]
- Bitan, A. Lake kinneret (sea of galilee) and its exceptional wind system. Bound.-Layer Meteorol. 1981, 21, 477–487. [Google Scholar] [CrossRef]
- Bueche, T.; Vetter, M. Simulating water temperatures and stratification of a pre-alpine lake with a hydrodynamic model: Calibration and sensitivity analysis of climatic input parameters. Hydrol. Process. 2014, 28, 1450–1464. [Google Scholar] [CrossRef]
- Solarski, M.; Szumny, M. Conditions of spatiotemporal variability of the thickness of the ice cover on lakes in the Tatra Mountains. J. Mt. Sci. 2020, 17, 2369–2386. [Google Scholar] [CrossRef]
- Barba-López, M.D.R.; Filonov, A.; Alcocer, J.; Ladah, L.; Tereshchenko, I. Complex interactions between meteorological parameters and the thermal regime of two tropical, high altitude crater lakes (Nevado de Toluca, Mexico). Sci. Total Environ. 2021, 771, 145310. [Google Scholar] [CrossRef] [PubMed]
- Alcocer, J.; Oseguera, L.A.; Escobar, E.; Peralta, L.; Lugo, A. Phytoplankton biomass and water chemistry in two high-mountain Tropical Lakes in central Mexico. Arctic. Antarct. Alp. Res. 2004, 36, 342–346. [Google Scholar] [CrossRef] [Green Version]
- Armienta, M.A.; De La Cruz-Reyna, S.; Macías, J.L. Chemical characteristics of the crater lakes of Popocatetetl, El Chichon, and Nevado de Toluca volcanoes, Mexico. J. Volcanol. Geotherm. Res. 2000, 97, 105–125. [Google Scholar] [CrossRef]
- Caballero-Miranda, M. The diatom flora of two acid lakes in central Mexico. Diatom Res. 1996, 11, 227–240. [Google Scholar] [CrossRef]
- Cuna, E.; Caballero, M.; Zawisza, E.; Ruiz, C. Historia Ambiental De Un Lago Alpino En El Centro De México (1230–2010). Tip 2015, 18, 97–106. [Google Scholar] [CrossRef] [Green Version]
- García-Palomo, A.; Macías, J.L.; Arce, J.L.; Capra, L.; Garduño, V.H.; Espíndola, J.M. Geology of the Nevado de Toluca Volcano and Surrounding Areas, Central Mexico. 2002. Available online: https://www.researchgate.net/publication/265539610_Geology_of_Nevado_de_Toluca_Volcano_and_surrounding_areas_central_Mexico (accessed on 14 February 2022).
- Oseguera, L.A.; Alcocer, J.; Escobar, E. Macroinvertebrados bentónicos de dos lagos tropicales de alta montaña en el volcán Nevado de Toluca, en la región central de México. Hidrobiologica 2016, 26, 419–432. [Google Scholar]
- Alcocer, J.; Roberson, J.; Oseguera, L.A.; Lewis, W.M., Jr. Rhythmic episodes of heating and cooling control thermal stratification of two tropical high mountain lakes. Aquat. Sci. 2020, 82, 58. [Google Scholar] [CrossRef]
- Soto, V.H.; Yoshikawa, K.; Schörghofer, N. Climatic variation in the high mountains of central Mexico: Temperature and precipitation indices at Nevado de Toluca volcano. Atmósfera 2020, 33, 301–318. [Google Scholar] [CrossRef]
- Gavrilenko, G.G.; Zdorovennova, G.E.; Zdorovennov, R.E.; Palshin, N.I.; Mitrokhov, A.V.; Terzhevik, A.Y. Heat Flux At the Water-Sediment Interface in a Shallow Lake. Proc. Karelian Res. Cent. Russ. Acad. Sci. 2015, 3, 3. [Google Scholar] [CrossRef] [Green Version]
- Filonov, A.; Barba-López, M.D.R.; Ladah, L.; Tereshchenko, I.; Palacios-Hernández, E.; Alcocer, J.; Ávalos-Cueva, D. The dynamics and temperature regime of the crater lakes in the Nevado de Toluca volcano, Mexico. Limnologica 2022, 92, 125938. [Google Scholar] [CrossRef]
- Guía de México: Información, Turismo y Viajes a México. Available online: https://www.turismomexico.es/ (accessed on 14 February 2022).
- Golosov, S.; Kirillin, G. A parameterized model of heat storage by lake sediments. Environ. Model. Softw. 2010, 25, 793–801. [Google Scholar] [CrossRef]
- Deltares. Simulation of Multi-Dimensional Hydrodynamic Flows and Transport Phenomena, Including Sediments; User Manual Delft3D-FLOW; Version 3.15; Deltares: Delft, The Netherlands, 2020. [Google Scholar]
- Baracchini, T.; Hummel, S.; Verlaan, M.; Cimatoribus, A.; Wüest, A.; Bouffard, D. An automated calibration framework and open source tools for 3D lake hydrodynamic models. Environ. Model. Softw. 2020, 134, 104787. [Google Scholar] [CrossRef]
- Kranenburg, W.; Tiessen, M.; Veenstra, J.; de Graaff, R.; Uittenbogaard, R.; Bouffard, D.; Sakindi, G.; Umutoni, A.; Van de Walle, J.; Thiery, W.; et al. 3D-modelling of Lake Kivu: Horizontal and vertical flow and temperature structure under spatially variable atmospheric forcing. J. Great Lakes Res. 2020, 46, 947–960. [Google Scholar] [CrossRef]
- Razmi, A.M.; Barry, D.A.; Bakhtyar, R.; Le Dantec, N.; Dastgheib, A.; Lemmin, U.; Wüest, A. Current variability in a wide and open lacustrine embayment in Lake Geneva (Switzerland). J. Great Lakes Res. 2013, 39, 455–465. [Google Scholar] [CrossRef]
- Cardoso-Mohedano, J.G.; Sanchez-Cabeza, J.A.; Ruiz-Fernández, A.C.; Pérez-Bernal, L.H.; Lima-Rego, J.; Giralt, S. Fast deep water warming of a subtropical crater lake. Sci. Total Environ. 2019, 691, 1353–1361. [Google Scholar] [CrossRef]
- Gasca-Ortiz, T.; Pantoja, D.A.; Filonov, A.; Domínguez-Mota, F.; Alcocer, J. Numerical and observational analysis of the hydro-dynamical variability in a small lake: The case of Lake Zirahuén, México. Water 2020, 12, 1658. [Google Scholar] [CrossRef]
- Emery, W.J.; Thomson, R.E. Data Analysis Methods in Physical Oceanography; Elsevier: Amsterdam, The Netherlands, 1997. [Google Scholar]
- Jenkins, D.M.; Watts, D.G. Spectral Analysis and Its Applications; Card Nr. 67-13840; Holden-Day, Inc.: San Francisco, CA, USA, 1969. [Google Scholar]
- Thermal Conductivity—Online Converter. Available online: https://www.engineeringtoolbox.com/thermal-conductivity-calculator-d_857.html (accessed on 14 February 2022).
- Penman, H.L. Natural evaporation from open water, bare soil and grass. Proc. R. Soc. Lond. Math. Phys. Sci. 1948, 193, 120–145. [Google Scholar]
- Valiantzas, J.D. Simplified versions for the Penman evaporation equation using routine weather data. J. Hydrol. 2006, 331, 690–702. [Google Scholar] [CrossRef]
- Rodgers, G.K. The Thermal Bar in Lake Ontario, Spring 1965 and Winter 1965–66. Gt. Lakes Res. Div. Univ. Michigan Ann. Arbor. 1966, 15, 369–374. [Google Scholar]
- Labaj, A.L.; Michelutti, N.; Smol, J.P. Annual stratification patterns in tropical mountain lakes reflect altered thermal regimes in response to climate change. Fundam. Appl. Limnol. 2018, 191, 267–275. [Google Scholar] [CrossRef]
- Michelutti, N.; Labaj, A.L.; Grooms, C.; Smol, J.P. Equatorial mountain lakes show extended periods of thermal stratification with recent climate change. J. Limnol. 2016, 75, 403–408. [Google Scholar] [CrossRef]
- Livingstone, D.M.; Lotter, A.F.; Walker, I.R. The decrease in summer surface water temperature with altitude in Swiss Alpine lakes: A comparison with air temperature lapse rates. Arctic. Antarct. Alp. Res. 1999, 31, 341–352. [Google Scholar] [CrossRef]
- O’Neill, K.; Ashton, G.D. Bottom Heat Transfer to Water Bodies in Winter. 1981. Available online: https://erdc-library.erdc.dren.mil/jspui/handle/11681/12042 (accessed on 14 February 2022).
- Pasternack, G.B.; Varekamp, J.C. Volcanic lake systematics I. Physical constraints. Bull. Volcanol. 1997, 58, 528–538. [Google Scholar] [CrossRef]
- Berberan-Santos, M.N.; Bodunov, E.N.; Pogliani, L. On the barometric formula inside the Earth. Am. J. Phys. 1997, 65, 404–412. [Google Scholar] [CrossRef]
- van Haren, H.; Dijkstra, H.A. Convection under internal waves in an alpine lake. Environ. Fluid Mech. 2021, 21, 305–316. [Google Scholar] [CrossRef]
- Serrano, D. Dynamic response to valley breeze circulation in Santa María del Oro, a volcanic lake in Mexico. Geophys. Res. Lett. 2002, 29, 13–16. [Google Scholar] [CrossRef]
- Arnon, A.; Brenner, S.; Selker, J.S.; Gertman, I.; Lensky, N.G. Seasonal dynamics of internal waves governed by stratification stability and wind: Analysis of high-resolution observations from the Dead Sea. Limnol. Oceanogr. 2019, 64, 1864–1882. [Google Scholar] [CrossRef]
- Gloor, M.; Wüest, A.; Münnich, M. Benthic boundary mixing and resuspension induced by internal seiches. Hydrobiologia 1994, 284, 59–68. [Google Scholar] [CrossRef]
- Rueda, F.J.; Schladow, S.G. Surface seiches in lakes of complex geometry. Limnol. Oceanogr. 2002, 47, 906–910. [Google Scholar] [CrossRef]
- Williams, Z.C.; Pelletier, J.D. Self-affinity and surface-area-dependent fluctuations of lake-level time series. Water Resour. Res. 2015, 51, 7258–7269. [Google Scholar] [CrossRef]
- Oliver, J.E. Encyclopedia of World Climatology; Springer: New York, NY, USA, 2005; ISBN 978-1-4020-3264-6. [Google Scholar]
- Yau, M.K.; Rogers, R.R. A Short Course in Cloud Physics, 3rd ed.; Butterworth-Heinemann: Oxford, UK, 1989; ISBN 9780750632157. [Google Scholar]
- Mercier, F.; Cazenave, A.; Maheu, C. Interannual lake level fluctuations (1993–1999) in Africa from Topex/Poseidon: Connections with ocean-atmosphere interactions over the Indian Ocean. Glob. Planet. Change 2002, 32, 141–163. [Google Scholar] [CrossRef]
- Wilcox, D.A.; Thompson, T.A.; Booth, R.K.; Nicholas, J.R. Lake-level variability and water availability in the Great Lakes. US Geol. Surv. Circ. 2007, 1311, 25. [Google Scholar] [CrossRef]
- Pasquini, A.I.; Lecomte, K.L.; Depetris, P.J. Climate change and recent water level variability in Patagonian proglacial lakes, Argentina. Glob. Planet. Change 2008, 63. [Google Scholar] [CrossRef]
- Sellinger, C.E.; Stow, C.A.; Lamon, E.C.; Qian, S.S. Recent water level declines in the Lake Michigan-Huron system. Environ. Sci. Technol. 2008, 42, 367–373. [Google Scholar] [CrossRef] [PubMed]
- Kossmann, M.; Sturman, A.P.; Zawar-Reza, P.; McGowan, H.A.; Oliphant, A.J.; Owens, I.F.; Spronken-Smith, R.A. Analysis of the wind field and heat budget in an alpine lake basin during summertime fair weather conditions. Meteorol. Atmos. Phys. 2002, 81, 27–52. [Google Scholar] [CrossRef]
- McGowan, H.A.; Owens, I.F.; Sturman, A.P. Thermal and dynamic characteristics of alpine lake breezes, Lake Tekapo, New Zealand. Bound.-Layer Meteorol. 1995, 76, 3–24. [Google Scholar] [CrossRef]
- Santo, M.A.; Toffolon, M.; Zanier, G.; Giovannini, L.; Armenio, V. Large eddy simulation (LES) of wind-driven circulation in a peri-alpine lake: Detection of turbulent structures and implications of a complex surrounding orography. J. Geophys. Res. Ocean. 2017, 122, 4704–4722. [Google Scholar] [CrossRef] [Green Version]
- Barry, R.G. Mountain Weather and Climate, 3rd ed.; Cambridge University Press: Cambridge, UK, 2008. [Google Scholar]
- Barco, J.; Cuartas, A.; Mesa, O.; Poveda, G.; Vélez, J.I.; Hoyos, C.; Mejía, J.F.; Botero, B. Estimación de la evaporación en colombia. Av. EN Recur. Hidraul. 2000, 7, 43–51. [Google Scholar]


| At the End of the Rainy Season (October) | At the End of the the Dry Season (May) | |||
|---|---|---|---|---|
| El Sol Lake | La Luna Lake | El Sol Lake | La Luna Lake | |
| Surface area | 2.020 × 10⁵ m2 | 0.203 × 10⁵ m2 | 2.003 × 10⁵ m2 | 0.202 × 10⁵ m2 |
| Maximum depth | 13.8 m | 10.2 m | 10.9 m | 7.6 m |
| Average depth | 6.4 m | 5.7 m | 4.0 m | 3.5 m |
| Volume | 13.022 × 10⁵ m3 | 1.172 × 10⁵ m3 | 8.102 × 10⁵ m3 | 0.725 × 10⁵ m3 |
| Dry season area of the lake El Sol [35] | 200,330 m2 |
| Runoff area | 2,170,000 m2 |
| Evaporation rate (November 2018) | 3.33 mm/day |
| Rain case | 50.8 mm |
| Real level rise | 0.11 m |
| Accumulated in runoff area | 110,236 m3 |
| Expected level rise with evaporation | 0.550 m |
| Expected level rise without evaporation | 0.586 m |
| Lake El Sol average area for the rainy and dry seasons [35] | 201,165 m2 | |
| Runoff area | 2,170,000 m2 | |
| Rain rate | 1.2771 m (NMS measures) | 1.359 m (calculations) |
| Evaporation rate | 0.9708 m (NMS measures) | 0.941 m (calculations) |
| Accumulated volume | 907,060 m3 | |
| Expected level rise with evaporation | 4.509 m | |
| Real level rise | 1.20 m | |
Publisher’s Note: MDPI stays neutral with regard to jurisdictional claims in published maps and institutional affiliations. |
© 2022 by the authors. Licensee MDPI, Basel, Switzerland. This article is an open access article distributed under the terms and conditions of the Creative Commons Attribution (CC BY) license (https://creativecommons.org/licenses/by/4.0/).
Share and Cite
Filonov, A.; Barba-López, M.d.R.; Tereshchenko, I.; Ladah, L.B.; Pantoja, D.A.; Alcocer, J.; Velázquez-Muñoz, F.Á. Thermal Regime and Water Balance of Two Tropical High-Mountain Lakes in the Nevado de Toluca Volcano, Mexico. Water 2022, 14, 1104. https://doi.org/10.3390/w14071104
Filonov A, Barba-López MdR, Tereshchenko I, Ladah LB, Pantoja DA, Alcocer J, Velázquez-Muñoz FÁ. Thermal Regime and Water Balance of Two Tropical High-Mountain Lakes in the Nevado de Toluca Volcano, Mexico. Water. 2022; 14(7):1104. https://doi.org/10.3390/w14071104
Chicago/Turabian StyleFilonov, Anatoliy, María del Refugio Barba-López, Iryna Tereshchenko, Lydia B. Ladah, Diego A. Pantoja, Javier Alcocer, and Federico Ángel Velázquez-Muñoz. 2022. "Thermal Regime and Water Balance of Two Tropical High-Mountain Lakes in the Nevado de Toluca Volcano, Mexico" Water 14, no. 7: 1104. https://doi.org/10.3390/w14071104