Article

Assessment of Changing the Abstraction and Recharge Rates on the Land Subsidence in the Nile Delta, Egypt

by
Hany F. Abd-Elhamid
1,2,
Basant S. Abd-Elkader
1,
Osama Wahed
1,
Martina Zeleňáková
3,* and
Ismail Abd-Elaty
1
1
Water and Water Structures Engineering Department, Faculty of Engineering, Zagazig University, Zagazig 44519, Egypt
2
Center for Research and Innovation in Construction, Faculty of Civil Engineering, Technical University of Košice, 04200 Košice, Slovakia
3
Institute of Environmental Engineering, Faculty of Civil Engineering, Technical University of Košice, 04200 Košice, Slovakia
*
Author to whom correspondence should be addressed.
Water 2022, 14(7), 1096; https://doi.org/10.3390/w14071096
Submission received: 4 February 2022 / Revised: 19 March 2022 / Accepted: 21 March 2022 / Published: 30 March 2022
(This article belongs to the Special Issue Assessment and Management of Hydrological Risks Due to Climate Change)

Abstract

:
The majority of residential, agricultural, and industrial areas are situated on cohesive soil in the Nile Delta, Egypt. Excessive pumping from the Nile Delta aquifer to meet the increasing demands for water could lead to aquifer system compaction and land subsidence. Land subsidence endangers infrastructure such as buildings, bridges, canals, and roads, as well as deteriorating lands and agricultural resources. The objective of this research is to investigate the land subsidence and predict the future behavior of the middle Nile Delta. The study goals are met by using a numerical model (MODFLOW) to simulate groundwater flow and an analytical solution to calculate land subsidence conditions. In this study, three scenarios are considered including; decreasing aquifer recharge, increasing abstraction and combination of the two. The results reveal that decreasing recharge by 94.4%, 88.8%, and 83.2% led to 30-, 60-, and 90-mm land subsidence, respectively, while increasing abstraction by 146%, 193%, and 233% led to land subsidence by 190, 380, and 560 mm, respectively, in the Nile delta. However, the combination of the two scenarios led to 220-, 440-, and 650-mm land subsidence. According to the results the future land subsidence due to over pumping from the Nile Delta should be considered in the future development plans of the country which intend to increase the abstraction from the Nile Delta aquifer. Increasing abstraction could increase the land subsidence that may cause many damages in different properties.

1. Introduction

Groundwater (GW) is one of the most significant natural water resources and a source of survival for many living organisms. In Egypt, GW is one of the most valuable water resources after the Nile River. Most of Egypt’s residential areas are located on cohesive soil (clay) in Nile valley and Delta. The Nile Delta (ND) in Egypt, like all other deltas all over the world, is a densely inhabited area [1]. The Delta is home to 50 million people and has a population density of 2300 people per square kilometer, which is expected to double in the next 50 years [2]. The Nile Delta is the most significant strategic and economic region, with precious resources (such as oil, gas, black sand, and groundwater), fertile soil, and historic ancient sites [3]. It also includes several densely populated cities in Egypt as well as the majority of the industrial and commercial cities (Alexandria, Port Said, Damietta, Rosetta, and Suez) [4]. Due to the population explosion, economic development, and the impact of climate change, a poor future is predicted for the Nile Delta [5,6]. The Nile Delta faces serious environmental challenges such as land subsidence (LS), sea level rise (SLR), and coastline erosion.
One of the most serious threats to the ND is LS. LS is a vital geological hazard that causes the land surface elevation to gradually lower [7]. It causes serious problems such as damages to buildings and infrastructures and deterioration of land and agricultural resources. Additionally, LS increases the risk of flooding and seawater incursion in coastal areas [7]. LS in the ND is influenced by a lot of natural and anthropogenic physical processes. Holocene fluvial sediment LS which is linked to global SLR and climate change, as well as localized tectonic, downslope mass movements [8]. The Nile River discharge cycle is another physical phenomenon that influences LS rates in the ND. The recharge/discharge cycle carries sediments from the Nile’s various climate regimes and causes land-loading variations as water tables rise and fall [3]. Building dams and regulators holds sediments upstream and reduces sediment loads reaching deltas and coastal area. For example, the establishment of the Aswan High Dam in southern Egypt decreased the rate of sedimentation since the 1970s [9]. Local tectonic movements can also induce to LS in the ND in the long run [10]. GW and oil and gas withdrawal, gives enough space for sediments to re-arrange, resulting in soil compaction [11].
One of the most common causes of LS in the world is GW extraction due to increasing the demand for water resources for domestic, agricultural, and industrial purposes. For example, in the United States (USA), GW over pumping is responsible for more than 80% of current subsidence [12]. Land subsidence of up to 10 m due to GW extraction is also observed in Mexico City, Mexico [13,14]. In Taiwan, the subsidence area of 2400 km2 was subjected to 3.4 m LS due to massive GW use [15]. LS due to GW extraction in sedimentary environments leads to the compaction of soil layers [16]. The volume of groundwater withdrawn and the layers from which groundwater was obtained are the factors that influence the magnitude and location of compaction. The principle of effective stress can be used to describe the mechanism of soil compaction (Terzaghi, 1925) [17]. The effective stress, which is linked to the pore water pressure, supports the overall loading that is attributed to solid material and fluid. Groundwater withdrawal generates a decrease in pore water pressure, which leads to an increase in strain and effective stress that compresses the soil skeleton and compacts the soil layers when the total stress is given [16]. Therefore, controlling LS required setting a limitation of GW withdrawn volume.
A number of researchers have used geodetic techniques, numerical models, and analytical solutions to investigate the rate and patterns of LS. Investigation of LS using geodetic techniques such as Global Positioning System (GPS) and Interferometric Synthetic Aperture Radar (InSAR). The geodetic techniques have been extensively used to assess LS in various regions all over the world, such as the Mekong Delta (Vietnam) [18]; the Nile Delta (Egypt) [1,3,19,20,21,22]; the Mexicali Valley (Mexico) [23]; Miami Beach and Norfolk (USA) [24] and Las Vegas Valley (USA) [25]. The geodetic techniques’ disadvantages are: the limited level of confidence in the physical causes of subsidence, as well as the complicated processing of SAR imaging in vegetation-covered regions and wetlands due to low coherence pixels. Furthermore, a scarcity of accurate, independent geodetic data to corroborate or InSAR result to estimate the groundwater level [3]. Investigation of LS based on numerical models is useful for simulating compaction for complicated aquifer parameters, boundary geometry and pumping activities. Many studies used numerical models to assess LS in different regions all over the world such as, the Los Banos-Kettleman City area in California [26], the Emilia-Romagna coastland of Ital [27], the Suzhou area of China [28] and the Shanghai area of China [29]. The limitation of numerical model is the difficulty to measure LS for multi-layers aquifer and near pumping wells [16]. Yilong, Yuan, et al. (2020) has developed a THM model to investigate land subsidence due to gas production in south China [30]. The results indicated that the maximum land subsidence occurred around the gas production wells. Additionally, Kiryukhin, A.V., et al. (2015) investigated land subsidence at Mutnovsk geothermal field in Russia using THM model [31]. The model results showed high rates of subsidence in 2008 reaching 6–18 mm/year. Investigation of LS based on analytical models is convenient for initial investigation, sensitivity and uncertainty analysis, and the numerical model’s verification [16]. Analytical solution has been applied in many areas such as, Shen, S. and Xu, Y (2011) [32] applied analytical solution to predict the future behavior of LS in Shanghai due to groundwater over-pumping. Po-Lung Lin et al. [16] developed a one-dimensional deformation analytical model to simulate groundwater flow and land subsidence in Tawian. Abd-Elhamid et al. [33] established an analytical model to simulate the soil compaction in multi-layer aquifer considering different scenarios of abstraction rates and pumping wells location.
Studies have investigated LS in the Nile Delta of Egypt. For example, between 1993 and 2000, Aly et al. [19] used InSAR images to investigate LS in Greater Cairo. Between 1993 and 2000, the mean rate of LS was around −7 mm/y. Aly et al. (2012) [20] used PSI images to estimate the magnitude of LS from 1993 to 2000 in two main cities in the Delta, Mansura and Greater Mahala, the rates were −9 and −5 mm/y, respectively. Wöppelmann et al. [21] investigated LS in Alexandria between 2003 to 2010 based on PSI images, the rate ranged between −0.4 to −2 mm/y Gebremichael et al. [1] used PSI images between 2004 and 2010 over the whole Delta to determine LS. The results showed a stable and minor land lowering in the southern part of the Delta of −0.4 mm/y, a local uplift in the central zone of the Delta’s plains with a rate of 2.5 mm/y and a high subsidence rate of −9.7 mm/y in the Menoufia governorate, and reclaimed desert due to GW withdrawal. Saleh and Becker [22] investigated LS across the Nile Delta, using InSAR data and the PSI images. The rates from Cairo, Tanta, Mahala, Mansoura, Damietta, and Port Said were around −6.4 ± 0.4 mm/y, −4.0 ± 0.6 mm/y, −4.8 ± 1.0 mm/y, −10.0 ± 1.2 mm/y, −10.3 ± 1.6 mm/year, and −4.9 ± 1.6 mm/y, respectively. Rateb and Abotalib [3] investigated three patterns of LS due to urban loading, natural sediment compaction, and GW over-pumping. The rates of LS due to GW withdrawal ranged from −20 to −16 mm/year and −6 to −12 mm/year in newly reclaimed lands on the west and east of the Delta’s flood plains.
In this study, LS of the ND is assessed with a new technique that is significantly different from the previous studies based on analytical solution. In this study numerical and analytical models are developed to investigate LS in the Middle Nile Delta aquifer (MNDA). MODFLOW is used to predict the groundwater levels at different scenarios of GW including over-pumping, decreasing the recharge, and combination of both scenarios. Moreover, the analytical and numerical solutions are used to predict future possible LS in MNDA according to different scenarios of GW pumping and aquifer recharge. Additionally, SURFER 13.0 is used to map both GW drawdown and LS in the MNDA for different scenarios.

2. Materials and Methods

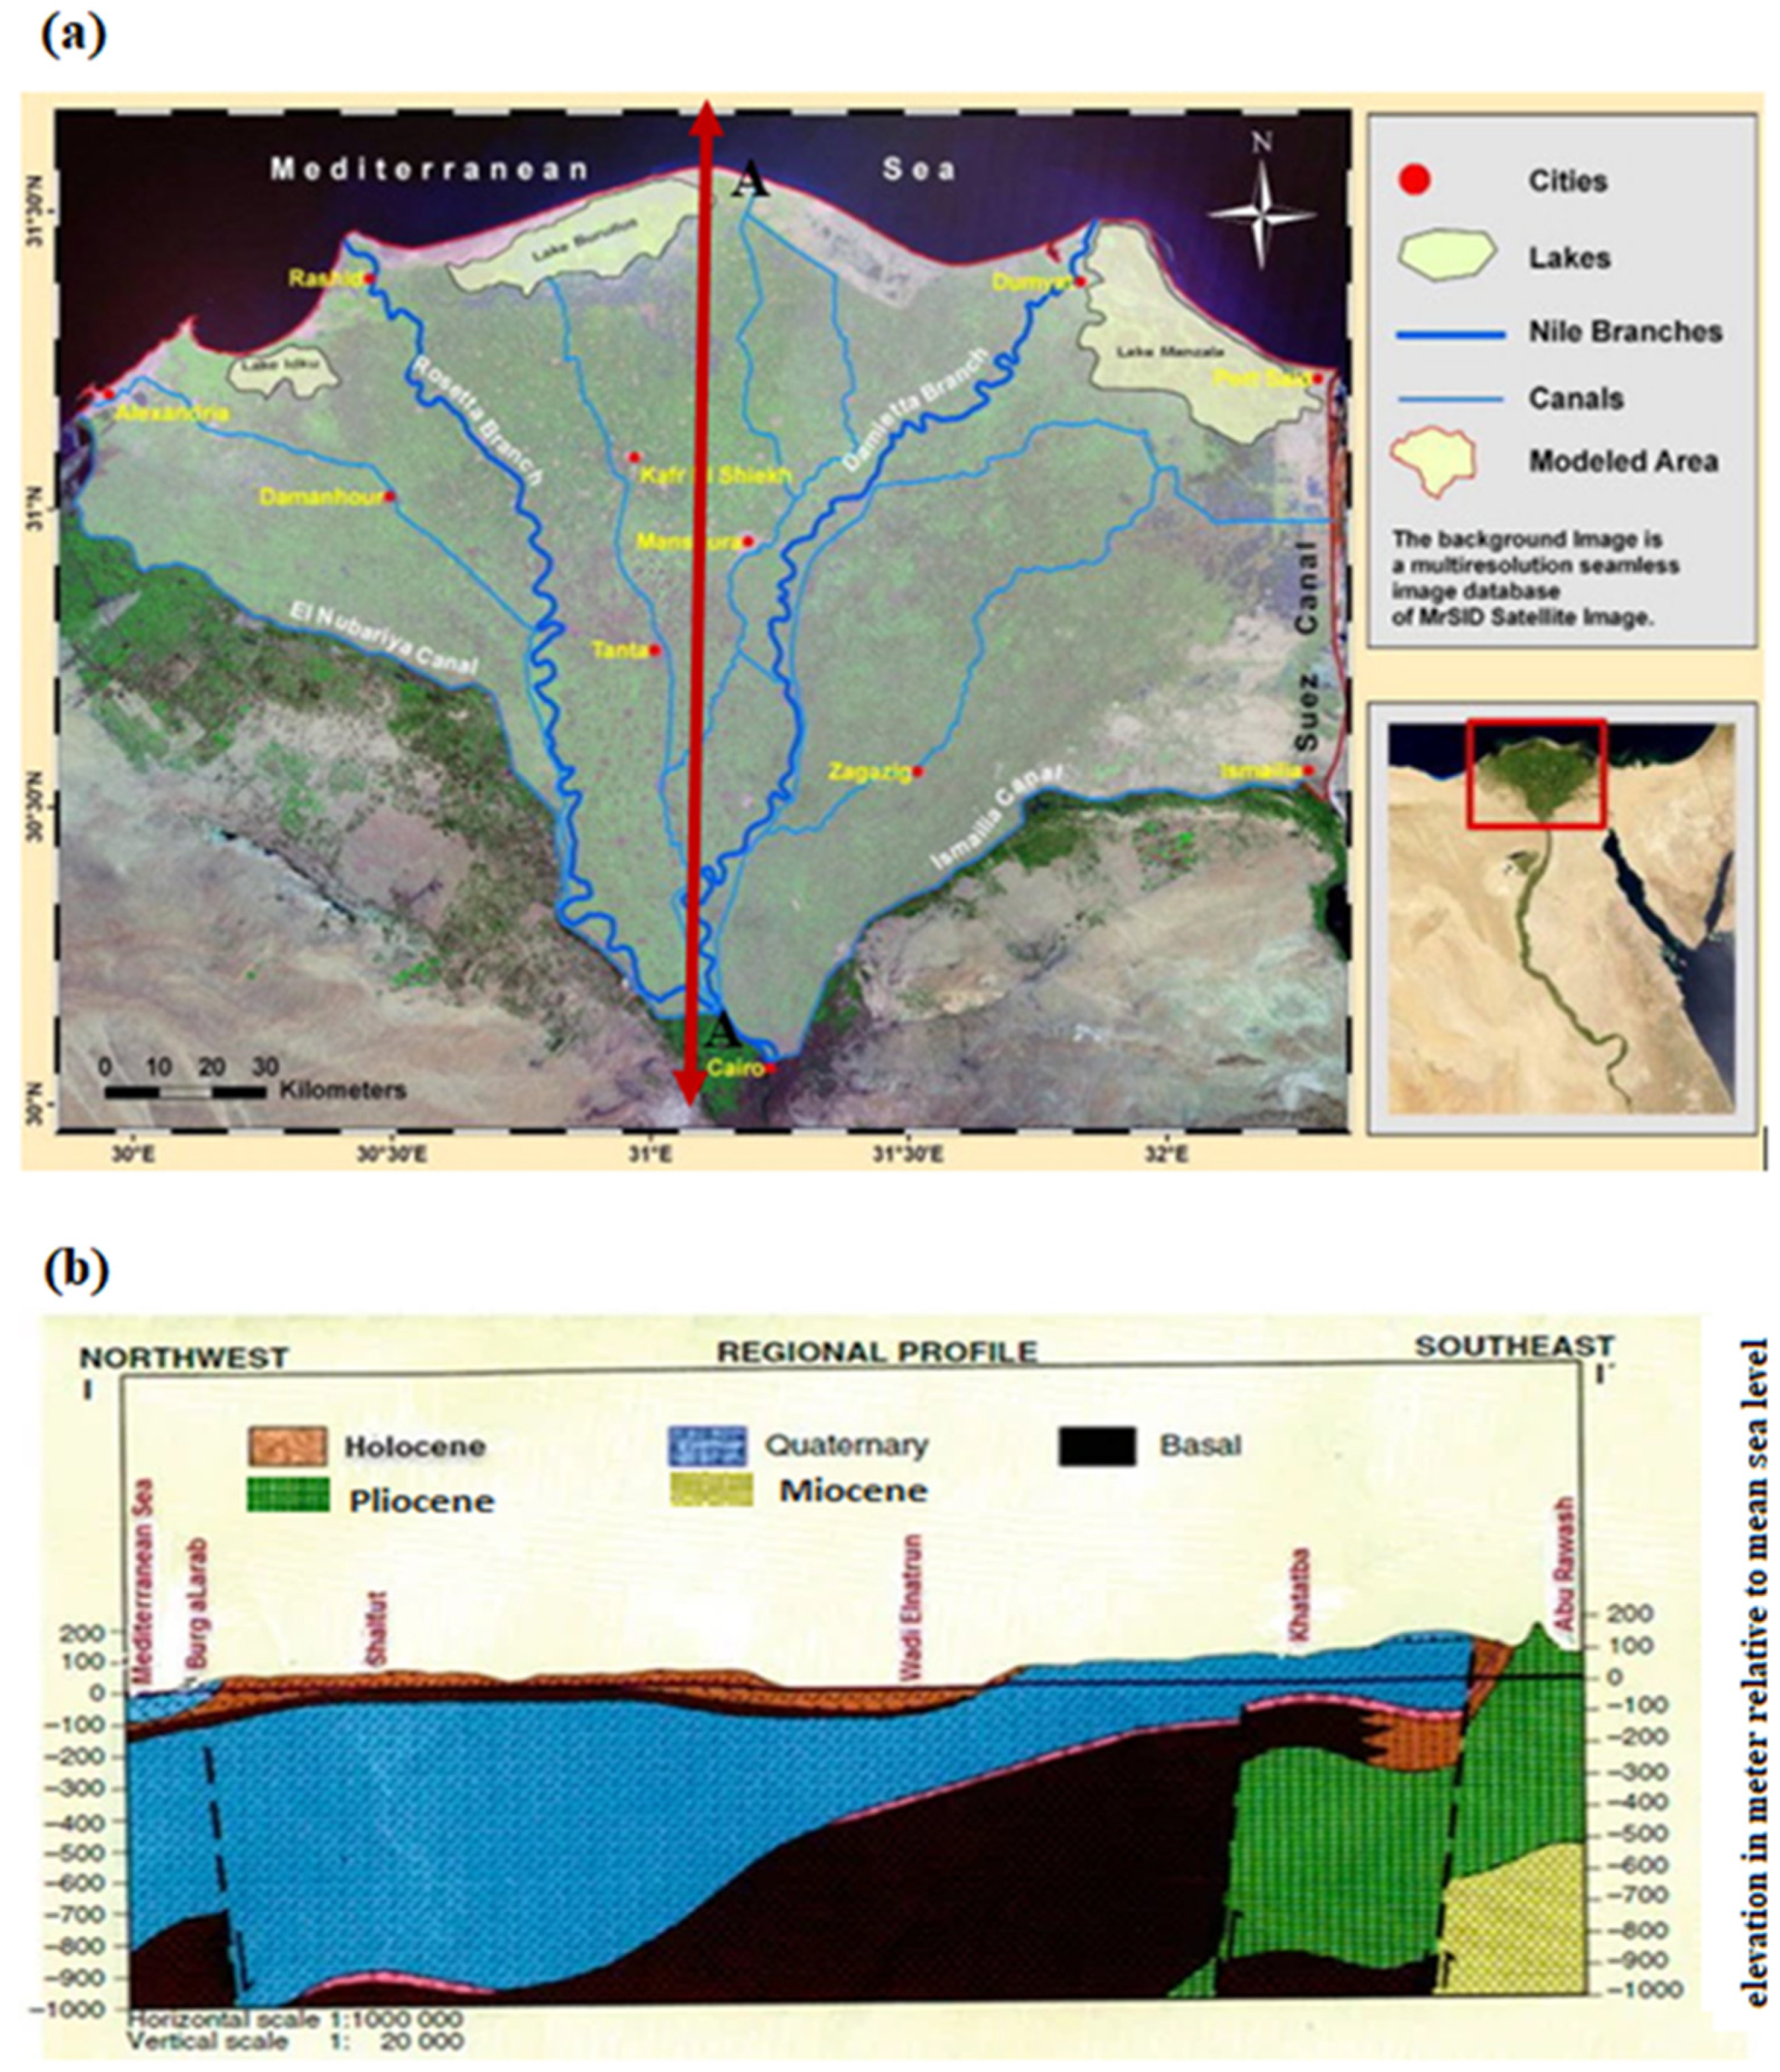
2.1. Study Area and Used Data

The Nile Delta (ND) contains the majority of fertile lands in Egypt, as around two-thirds of its area is under agriculture. Irrigation water is derived mainly from surface water via canals branching out of the Nile River as well as groundwater from the Nile Delta aquifer (NDA). The NDA is one of the world’s deepest freshwater aquifers. The Middle Nile Delta aquifer (MNDA) is considered as the study area in this paper since it is anticipated to be the most affected part of the ND by land subsidence (LS). The MNDA is located between 30°20′ and 31°50′ N latitude and 30°10′ and 31°35′ E longitude covering an area of 9000 km2. It is bordered from the north by the Mediterranean Sea, from the south by Cairo, and from the east and west by the two branches of the Nile River. The apex of the MNDA is around 20 km north of Cairo. Its Mediterranean Sea base is around 245 km long, the length of the right branch (Damietta) is about 240 km and the length of the left branch (Rosetta) is around 235 km (see Figure 1a).

2.1.1. Geology of the Study Area

The NDA system is a massive and complex groundwater system. The geological units of the aquifer system are the top unit of Holocene clay (aquitard), quaternary and late tertiary gravels and sands (aquifer), and base unit (see Figure 1b). The clay cap thickness in the southern part of the Nile Delta ranges from 5 to 25 m, however it reaches 50 m in the northern part [34]. The Quaternary aquifer’s thickness ranges from 200 m near Cairo in the south to around 1000 m towards the Mediterranean Sea in the north [35]. The major aquifer of the study area is the Quaternary aquifer [36]. The top layer of the quaternary aquifer is a clay layer, so it is considered a semi-confined aquifer. The level of groundwater in the NDA increases from north to south. It varies from 1 to 2 m above MSL in the north, 3 to 4 m above MSL in the middle, and 5 m above MSL in the south [36,37].
Figure 1. The Nile Delta aquifer, (a) the location map [38] (b) hydrogeological cross section (A-A) in the NDA [39].
Water 14 01096 g001

2.1.2. Meteorological Data of the Study Area

The average daily temperature in the Nile Delta varies from 17 to 20 °C along the Mediterranean to more than 25 °C in the south [40]. In the study area, the evaporation rates range from 7 mm/day in the south to 4 mm/day along the northern Mediterranean Sea coast [41]. The average rainfall in the Nile Delta is fairly small and ranges from 25 mm/y in the south and middle to 200 mm/y in the north [34].

2.1.3. Population Growth and Historical Situation of Groundwater Levels

Egypt is one of the most densely populated countries in the Middle East. The Nile Delta of Egypt is overpopulated area as it represents for only 2% of Egypt’s total land area, but it is home to 41% of the country’s people [42]. The Egyptian population was 82 million in 2010 and increased to 102 million in 2020 [43] as shown in Figure 2b. The population growth in the Nile Delta is followed by the increase in agriculture and industrial activities. Egypt’s population is predicted to double by 2078, according to current projections. The population is currently rising at a rate of 1.94%, which means that every year, about 2 million residents are added to the population [43]. This increasing population growth rate causes an increase in the water demand which resulted in extensive extraction from groundwater. Around 85% of Egypt’s total GW abstraction is provided by the NDA. Over the last 30 years, total yearly GW extraction from the NDA has rapidly increased. According to the Egyptian Research Institute of Groundwater (RIGW), the abstraction rate was 0.1 billion cubic meters (BCM)/year from the year 1980 to 2010 and the abstraction rate increased to 0.2 BCM/year from 2003 to 2010. In the next years, it is predicted that the yearly pumping rate will approach 0.20 BCM/year [44] as shown in Figure 2a.
The NDA is recharged through the Nile River flow, percolation from excess irrigation, rainfall and seepage from canals. The significant source of GW recharge in the Nile Delta is the Nile River flow as the NDA receives around 35.5 km3/y from the Nile flow [45]. Excess irrigation water recharges the NDA at a rate ranging from 0.25 to 1.1 mm/d. The NDA recharge rate from rainfall is very small—it varied from 0 to 134 mm in winter season. The groundwater situation between 1980 and 2010 in the Nile Delta was complicated as it was dependent on seepage losses from canals and GW over-pumping due to reclamation projects [36]. In both the Eastern Nile Delta and Western Nile Delta, depression cones in GW tables were created due to GW over-pumping. In the Middle Nile Delta, there was no change in GW levels, which means a steady-state situation [36]. The GW recharge is highly affected by the Nile flow change. The Nile flow will change by 0.28%/year due to climate changes and the estiblashment of the Grand Ethiopian Renaissance Dam (GERD) [46]. The construction of GERD will reduce the Nile flow to Aswan High Dam (AHD). The Nile flow to AHD was estimated to decrease by 10 to 50% in 2020 [47].

2.2. Analytical Solution of Land Subsidence

The analytical solution for simulating LS based on the consolidation due to change in effective stress (σe). The developed solution is based on Terzaghi 1D consolidation theory [48]. This theory based on the relationship between the effective stress (σe), the pore water pressure (p) and the total stress (σt). During the groundwater withdrawal, the hydraulic head (h) and poor water pressure (P) decrease, thus the effective stress increases (σe) by the same value and the total stress (σt) remain constant with time as following:
Δσe = −ΔP= −γw Δh =γw Δs
The relationship between effective stress (σe) and strain (ε) was revealed by Das (2006) [36] as following:
Δε = α Δσe
where α is the compressibility coefficient of a soil.
By combining Equations (1) and (2), the following equation is obtained
Δε = α γw Δs
As shown in Equations (1) and (3), groundwater withdrawal causes increase in effective stress. Therefore, consolidation occurs, then land subsidence happens when the consolidation transmits to the land surface.
The compressibility coefficient (α) can be derived from the following relationship
Ss = γw (α + n β)
The water compressibility coefficient (β) can be ignored as it is very small compared to the soil compressibility coefficient (α). Therefore, Ss = γw α.
The compaction of single soil layer (δi) with thickness (bi) can be calculated based on the change in groundwater drawdown (Δs) from specific storage change (Ss) as shown:
δi (t) = α γw Δsi (t) bi = SSw ∗ γw Δsi (t) bi = Ss Δsi (t) bi
Land subsidence for multi-layer aquifer system (δ) can be calculated by accumulating the compaction of single soil layers as following:
δ ( t ) = i = 1 n δ i ( t ) = i = 1 n S si   Δ S i ( t ) b i

2.3. Numerical Simulation of Groundwater Flow

In this study, a numerical model (MODFLOW) is built to simulate 3D, variable density, and steady-state GW flow in MNDA porous media. A mathematical combination of the water balance equation and Darcy’s law derives the governing equation of the GW flow [49]. According to the following equation [50], the MODFLOW model represents GW flow in anisotropic and nonhomogeneous media:
t ( K x x h x ) + y ( K y y h y ) + z ( K z z h z ) + W = S s h t
where Kxx, Kyy, and Kzz are values of porous media hydraulic conductivity along the x, y and z coordinate axes (LT−1), h is the potentiometric head (L), W is volumetric flux per unit volume rep-resenting source and /or sink water in (T−1), Ss is specific storage (L−1), and t is time (T).

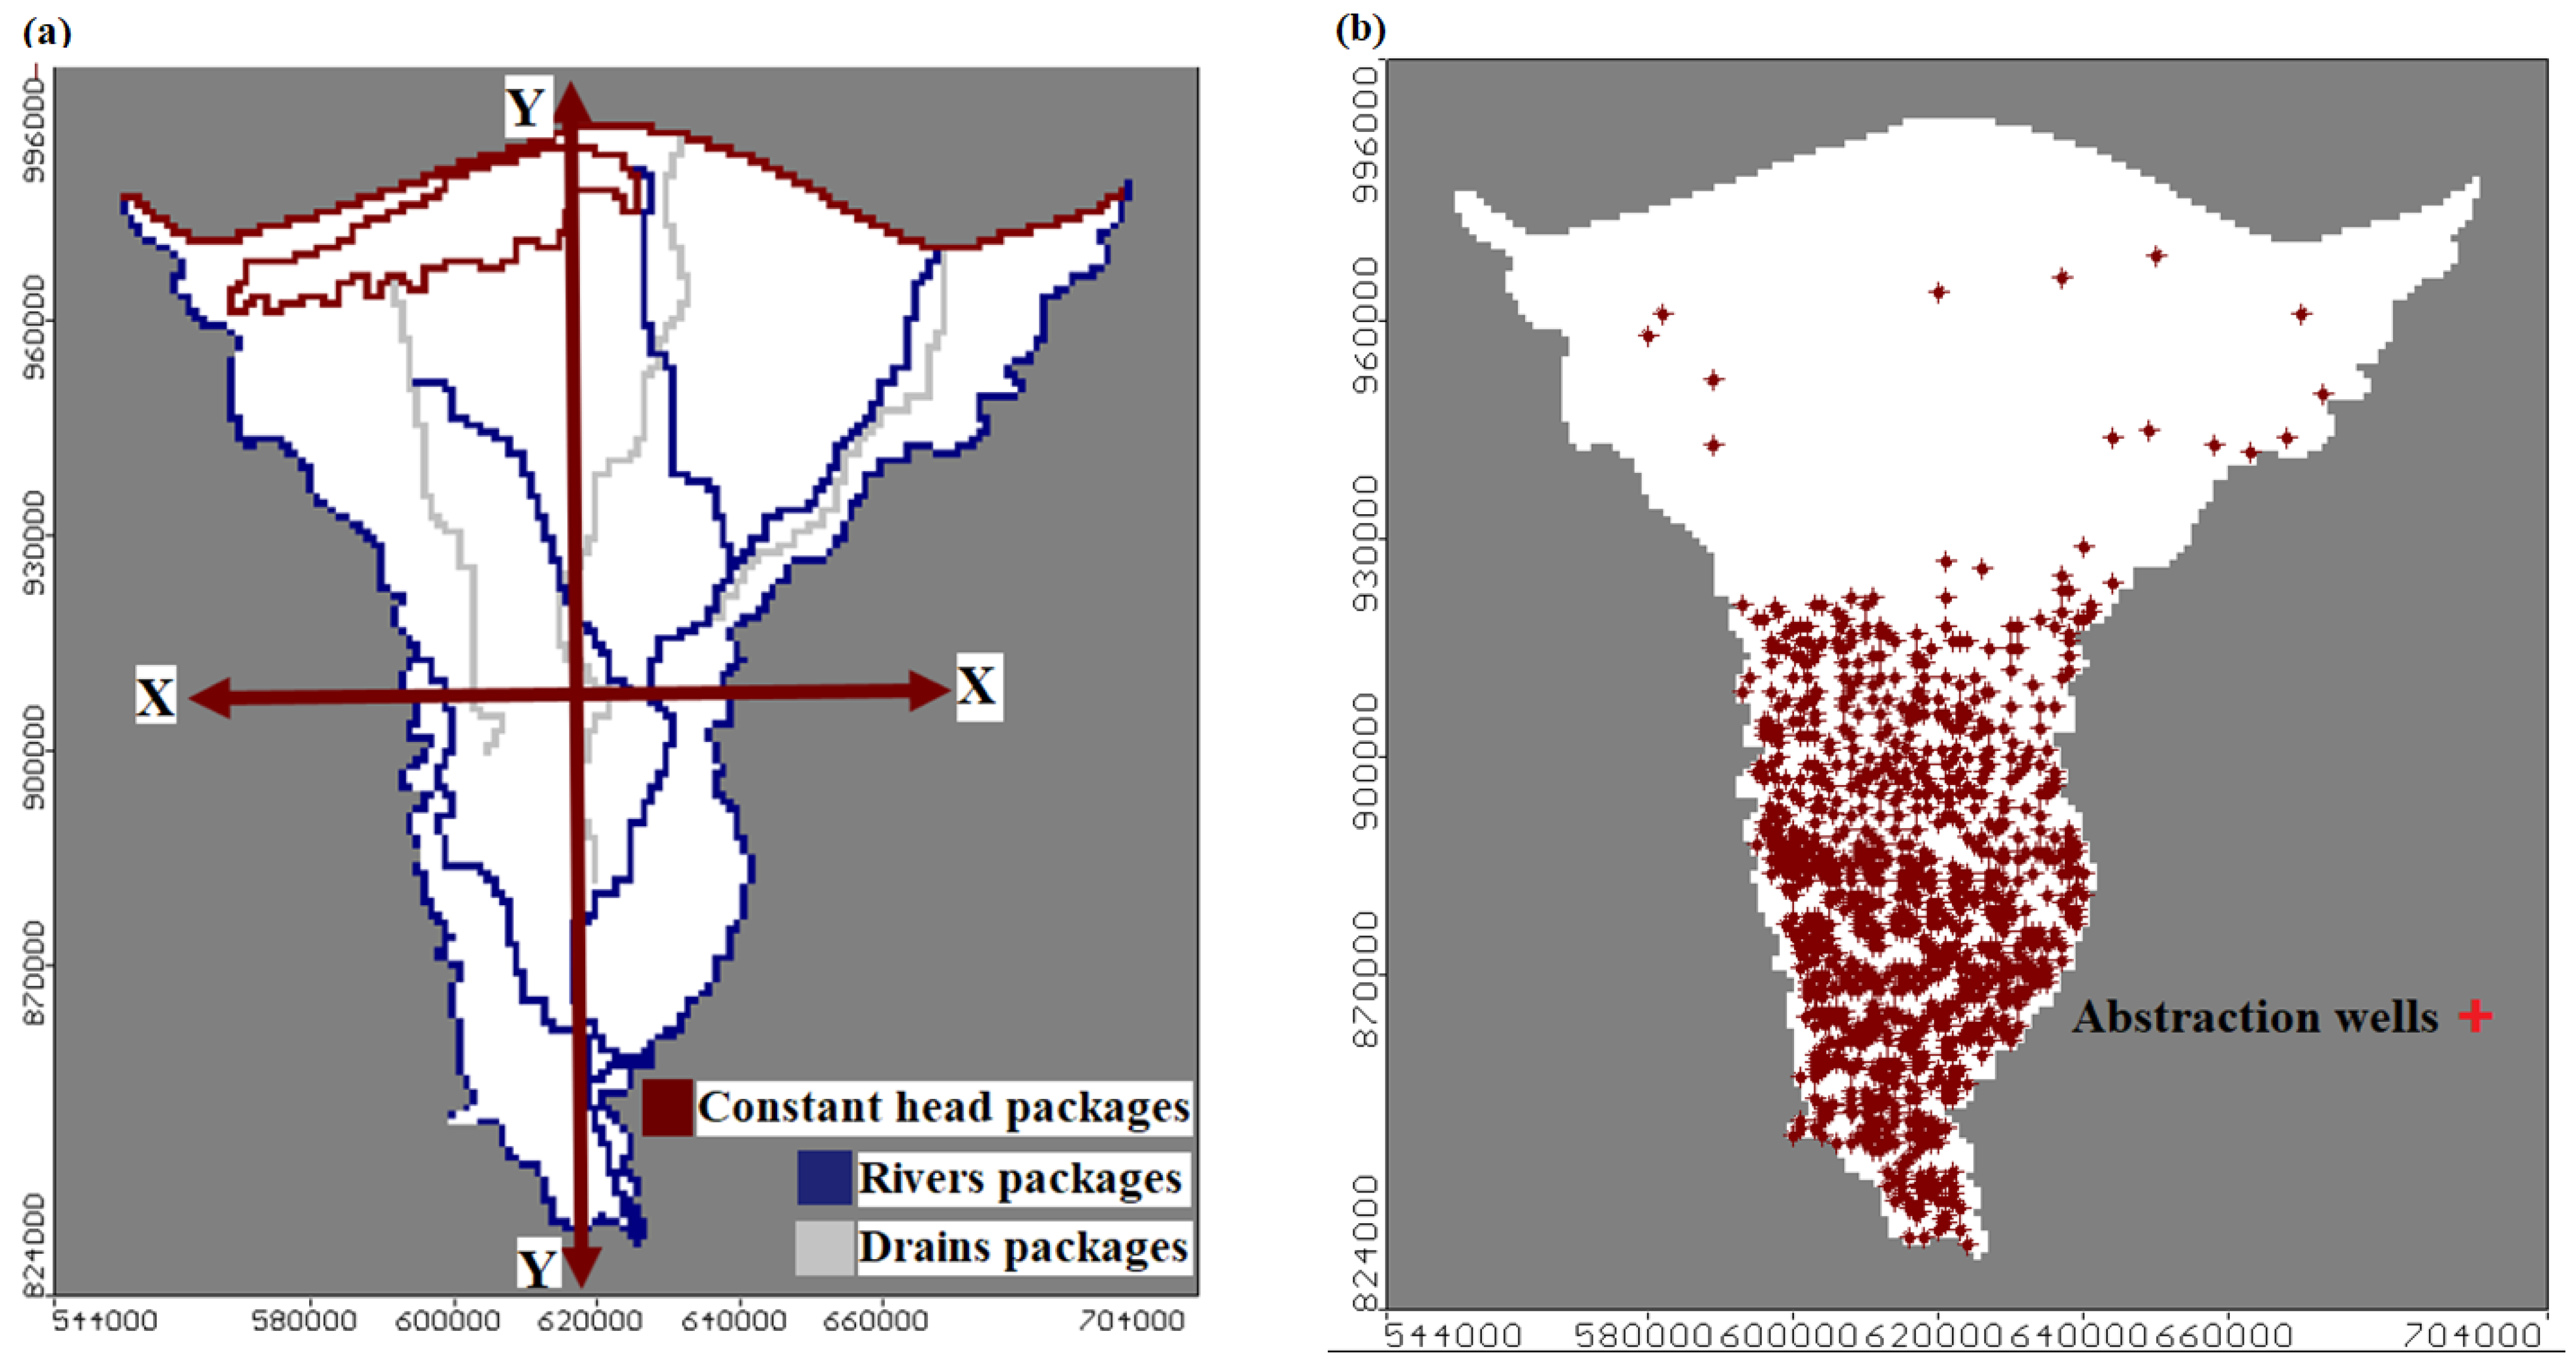
2.3.1. Model Boundary Geometry

The 3-D model of MNDA was established using a grid system comprising 160 columns and 172 rows with cell dimensions of 1 km × 1 km as shown in Figure 3a. The simulated area (9000 km2) was divided into 11 layers, including the clay cap layer and other layers represented quaternary aquifer with equal thickness. Figure 3b,c shows two cross sections taken in the model in x and y directions. As indicated in Figure 3, the layers numbers 1, 2–5, 6–9, and 10–11 are in colors blue, green, red and purple, respectively. According to the cross sections, the aquifer thickness ranges from 200 m at the south (near Cairo) to 1000 m at the north (along the Mediterranean Sea shoreline) with a clay layer between 20 at the south to 50 m at the north.

2.3.2. Model Boundary Conditions

The flow boundary conditions were assigned as a constant hydraulic head of zero along the shoreline of the Mediterranean Sea in the north and a specified head of 16.96 m above MSL in the south. The east and west boundaries were determined by the water levels in the Nile’s Damietta and Rosita branches. The water level in the Damietta branch declined and ranged from 13.66 m above MSL in the south to 0.5 m above MSL in the north. Moreover, the water level in the Rosita branch varied from 13.17 m above MSL in the south to 0.5 m above MSL in the north. Canals and drains packages were used to assign canals and drains in the model. The study area’s main and branch canals had average depths of 2.0 and 3.0 m, respectively. Drain package head ranged from 8 m above MSL in the south to 0.25 m above MSL in the north. Figure 4a shows the MNDA boundary conditions.

2.3.3. Model Hydraulic Parameters

Numerous field experiments were conducted to estimate the aquifer parameters. Table 3 shows the initial values of hydraulic parameters in the MNDA area. Specific storage (Ss), specific yield (Sy), hydraulic conductivity (K), and effective porosity (neff) are all the hydraulic parameters for each layer of the study area. These data were collected from previous studies. The hydraulic conductivity was ranged from 0.1 to 0.25 m/d for clay cap and from 5 to 100 m/d for the other layers, and the storativity ranges from 10−4 to 10−3 [51].The model recharge from excess irrigation water and the GW extraction rate were based on the identified value by Morsy 2009 [36]. The recharge rate to the aquifer is 0.25 to 0.8 mm/day. The abstraction wells distribution in the MND is assigned according to data collected by RIGW [35,36]. Figure 4b presents the distribution of 946 abstraction wells assigned to the study area. Production irrigation water wells and drinking water wells are among the groundwater abstraction activities in the Nile Delta aquifer. The abstraction from wells produced a total volume rate of 2.22 × 10⁶ m3/day. As shown in Figure 4b, there are few abstraction wells in the northern part of the MND to avoid saltwater intrusion due to over-pumping because the northern part is near to the Mediterranean Sea.

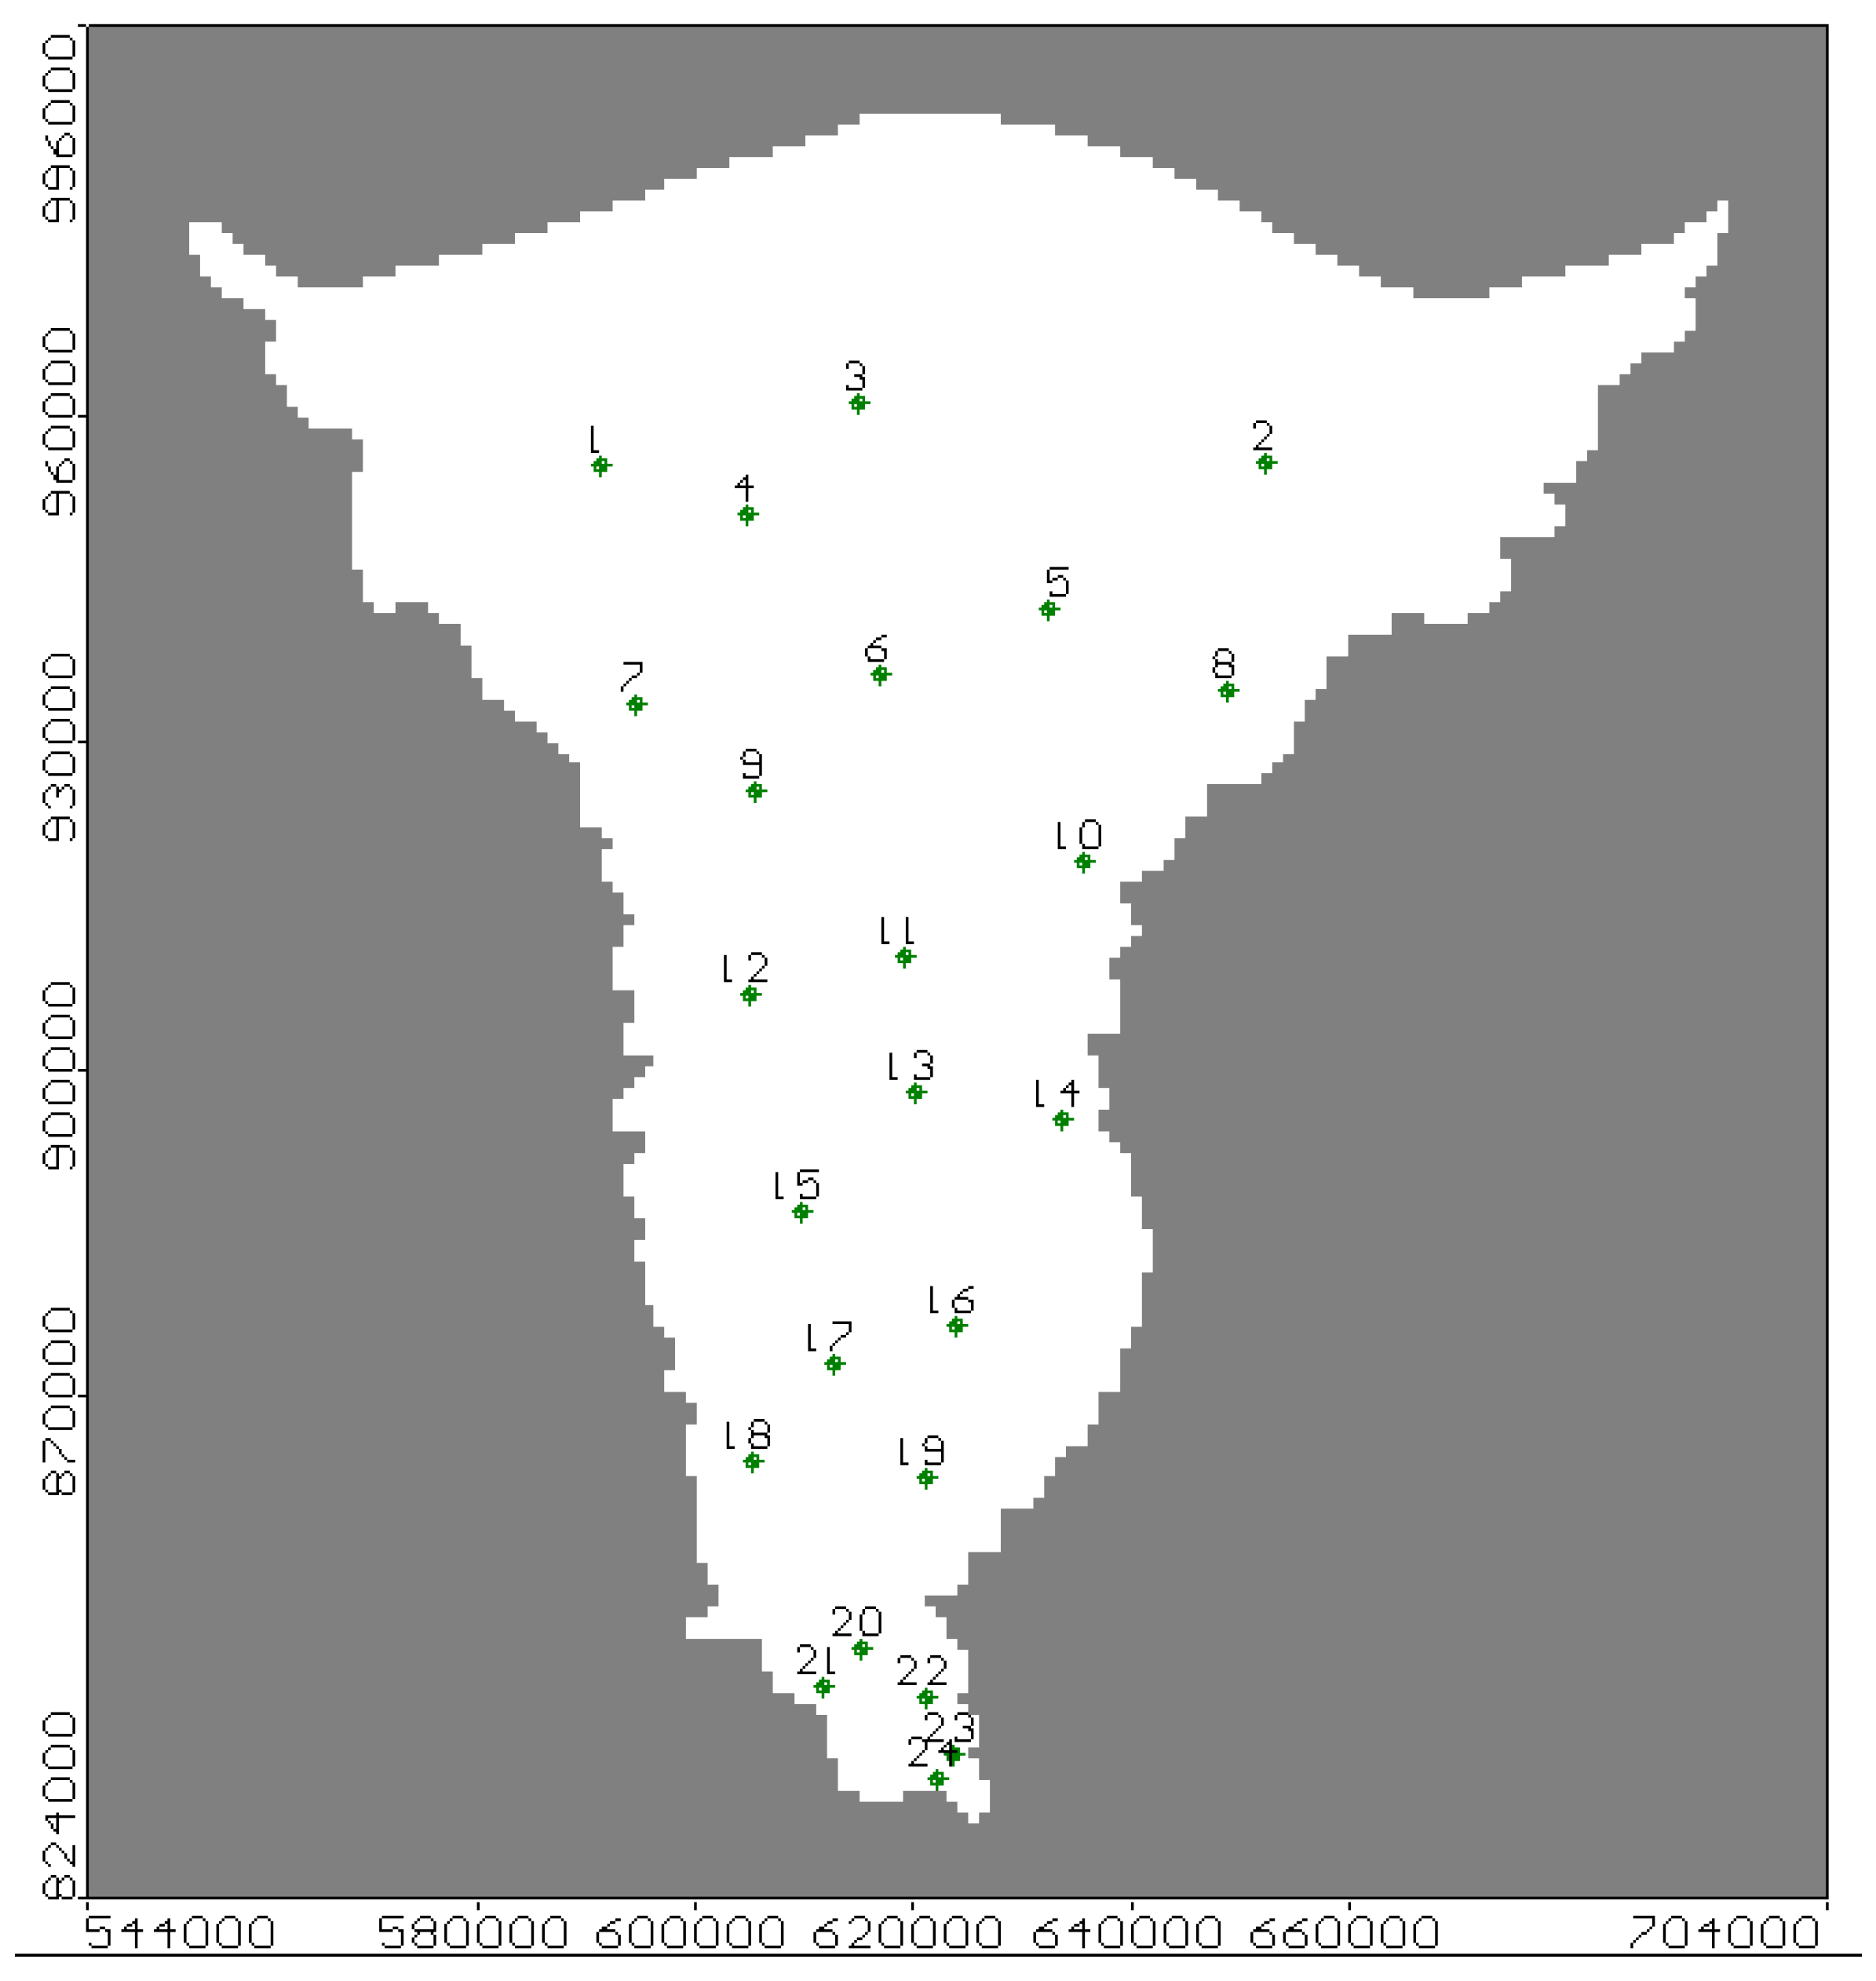
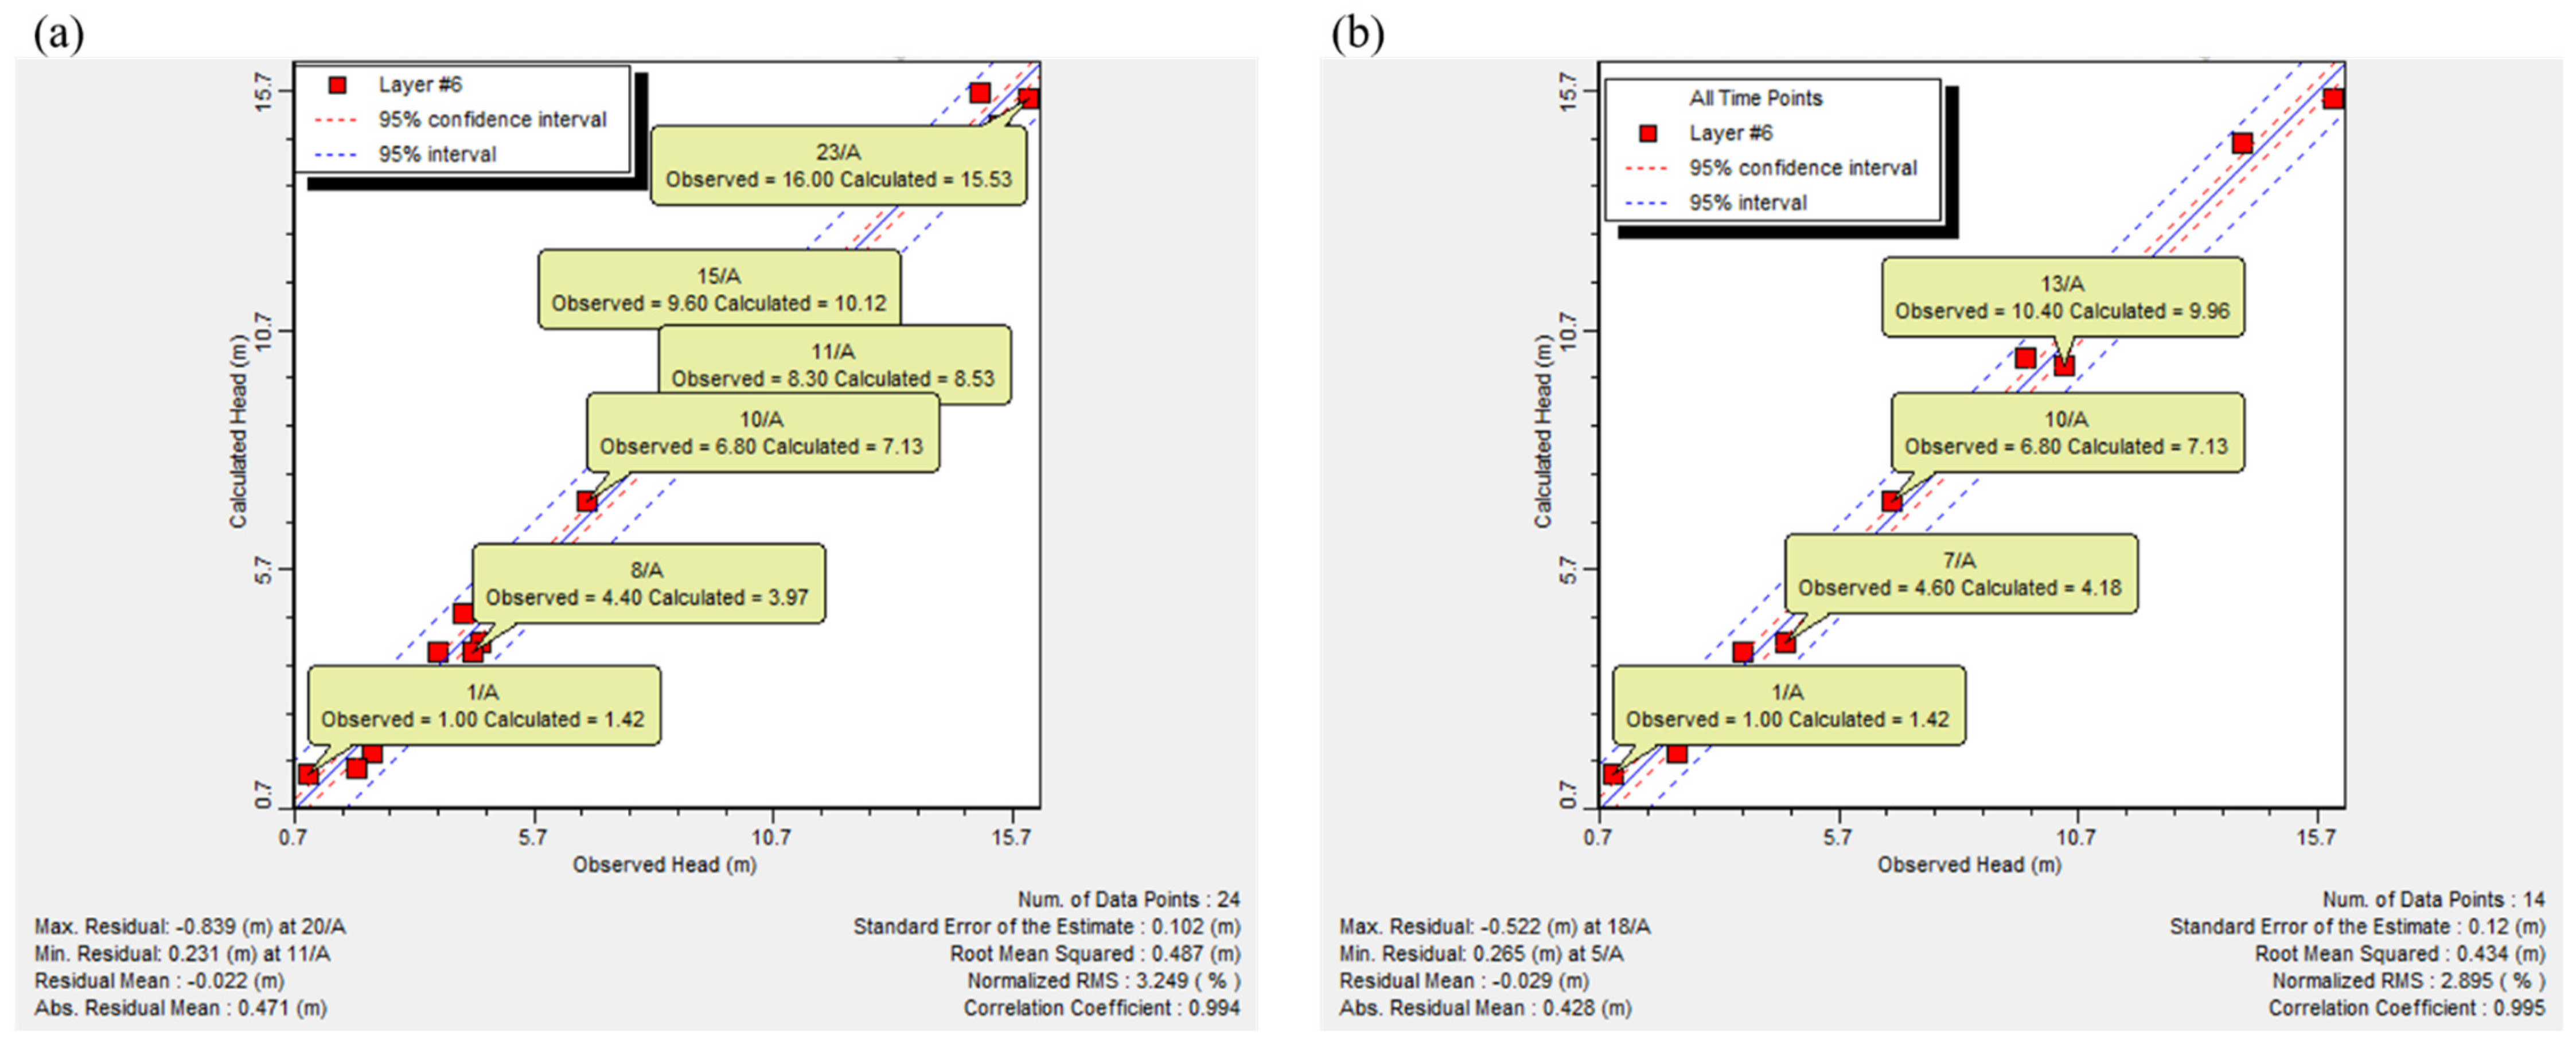
2.3.4. Model Calibration

The model calibration is the process that shows the difference between the calculated head and the field data obtained by RIGW 2002 [37], which have been presented by 24 observation wells throughout the study area. Figure 5 shows the distribution of 24 observation wells in the study domain. The model was calibrated for steady-state using a trial-and-error process for the aquifer parameters presented in Table 1 until the GW levels in the observation wells matching the levels in 2002. After model calibration, a model verification and preliminary sensitivity analysis were performed to investigate the most significant parameters affecting the model results.

2.4. Proposed Scenarios for Simulating the Land Subsidence in the MNDA

In the MNDA, the MODFLOW calibrated results for groundwater head are used as a base case for future scenarios as shown in Table 1. Due to population growth, abstraction rates will increase to 146%, 193%, and 233% in 2030, 2050, and 2070, respectively as shown in Figure 2a. Due to climate change and the construction of GERD, the Nile flow will change by 0.28% every year, reducing recharge to 94.4%, 88.8%, and 83.2% in 2030, 2050, and 2070, respectively. The predicted heads are used to evaluate the land subsidence using the analytical solution. Free version of SURFER 13.0 model was used for mapping land subsidence in the study area.

3. Results

3.1. Model Calibration Results

The model was calibrated with 24 values of GW head for steady state condition. The calibration results indicated that the maximum and the minimum residual (the difference between the calculated and the observed heads) reached −0.893 and 0.231 m, respectively, while the absolute residual mean was 0.471, the root mean square was 0.487 m and normalized RMS was 3.249%. The model’s calibration aim was 10% difference in height between the minimum and maximum GW heads, which is around 1.5 m as presented in Figure 6a. Table 2 presents the agreement between the model results and the field measurements confirms the model calibration.
The model verification comes after the model calibration to to ensure that the model is reliable under various conditions. The model was verified using a set of independent data (14 points) as shown in Figure 6b. Table 3 presents the model verification results. The results of verification and sensitivity analysis showed that the most sensitive parameters are the hydraulic conductivity and specific storage.

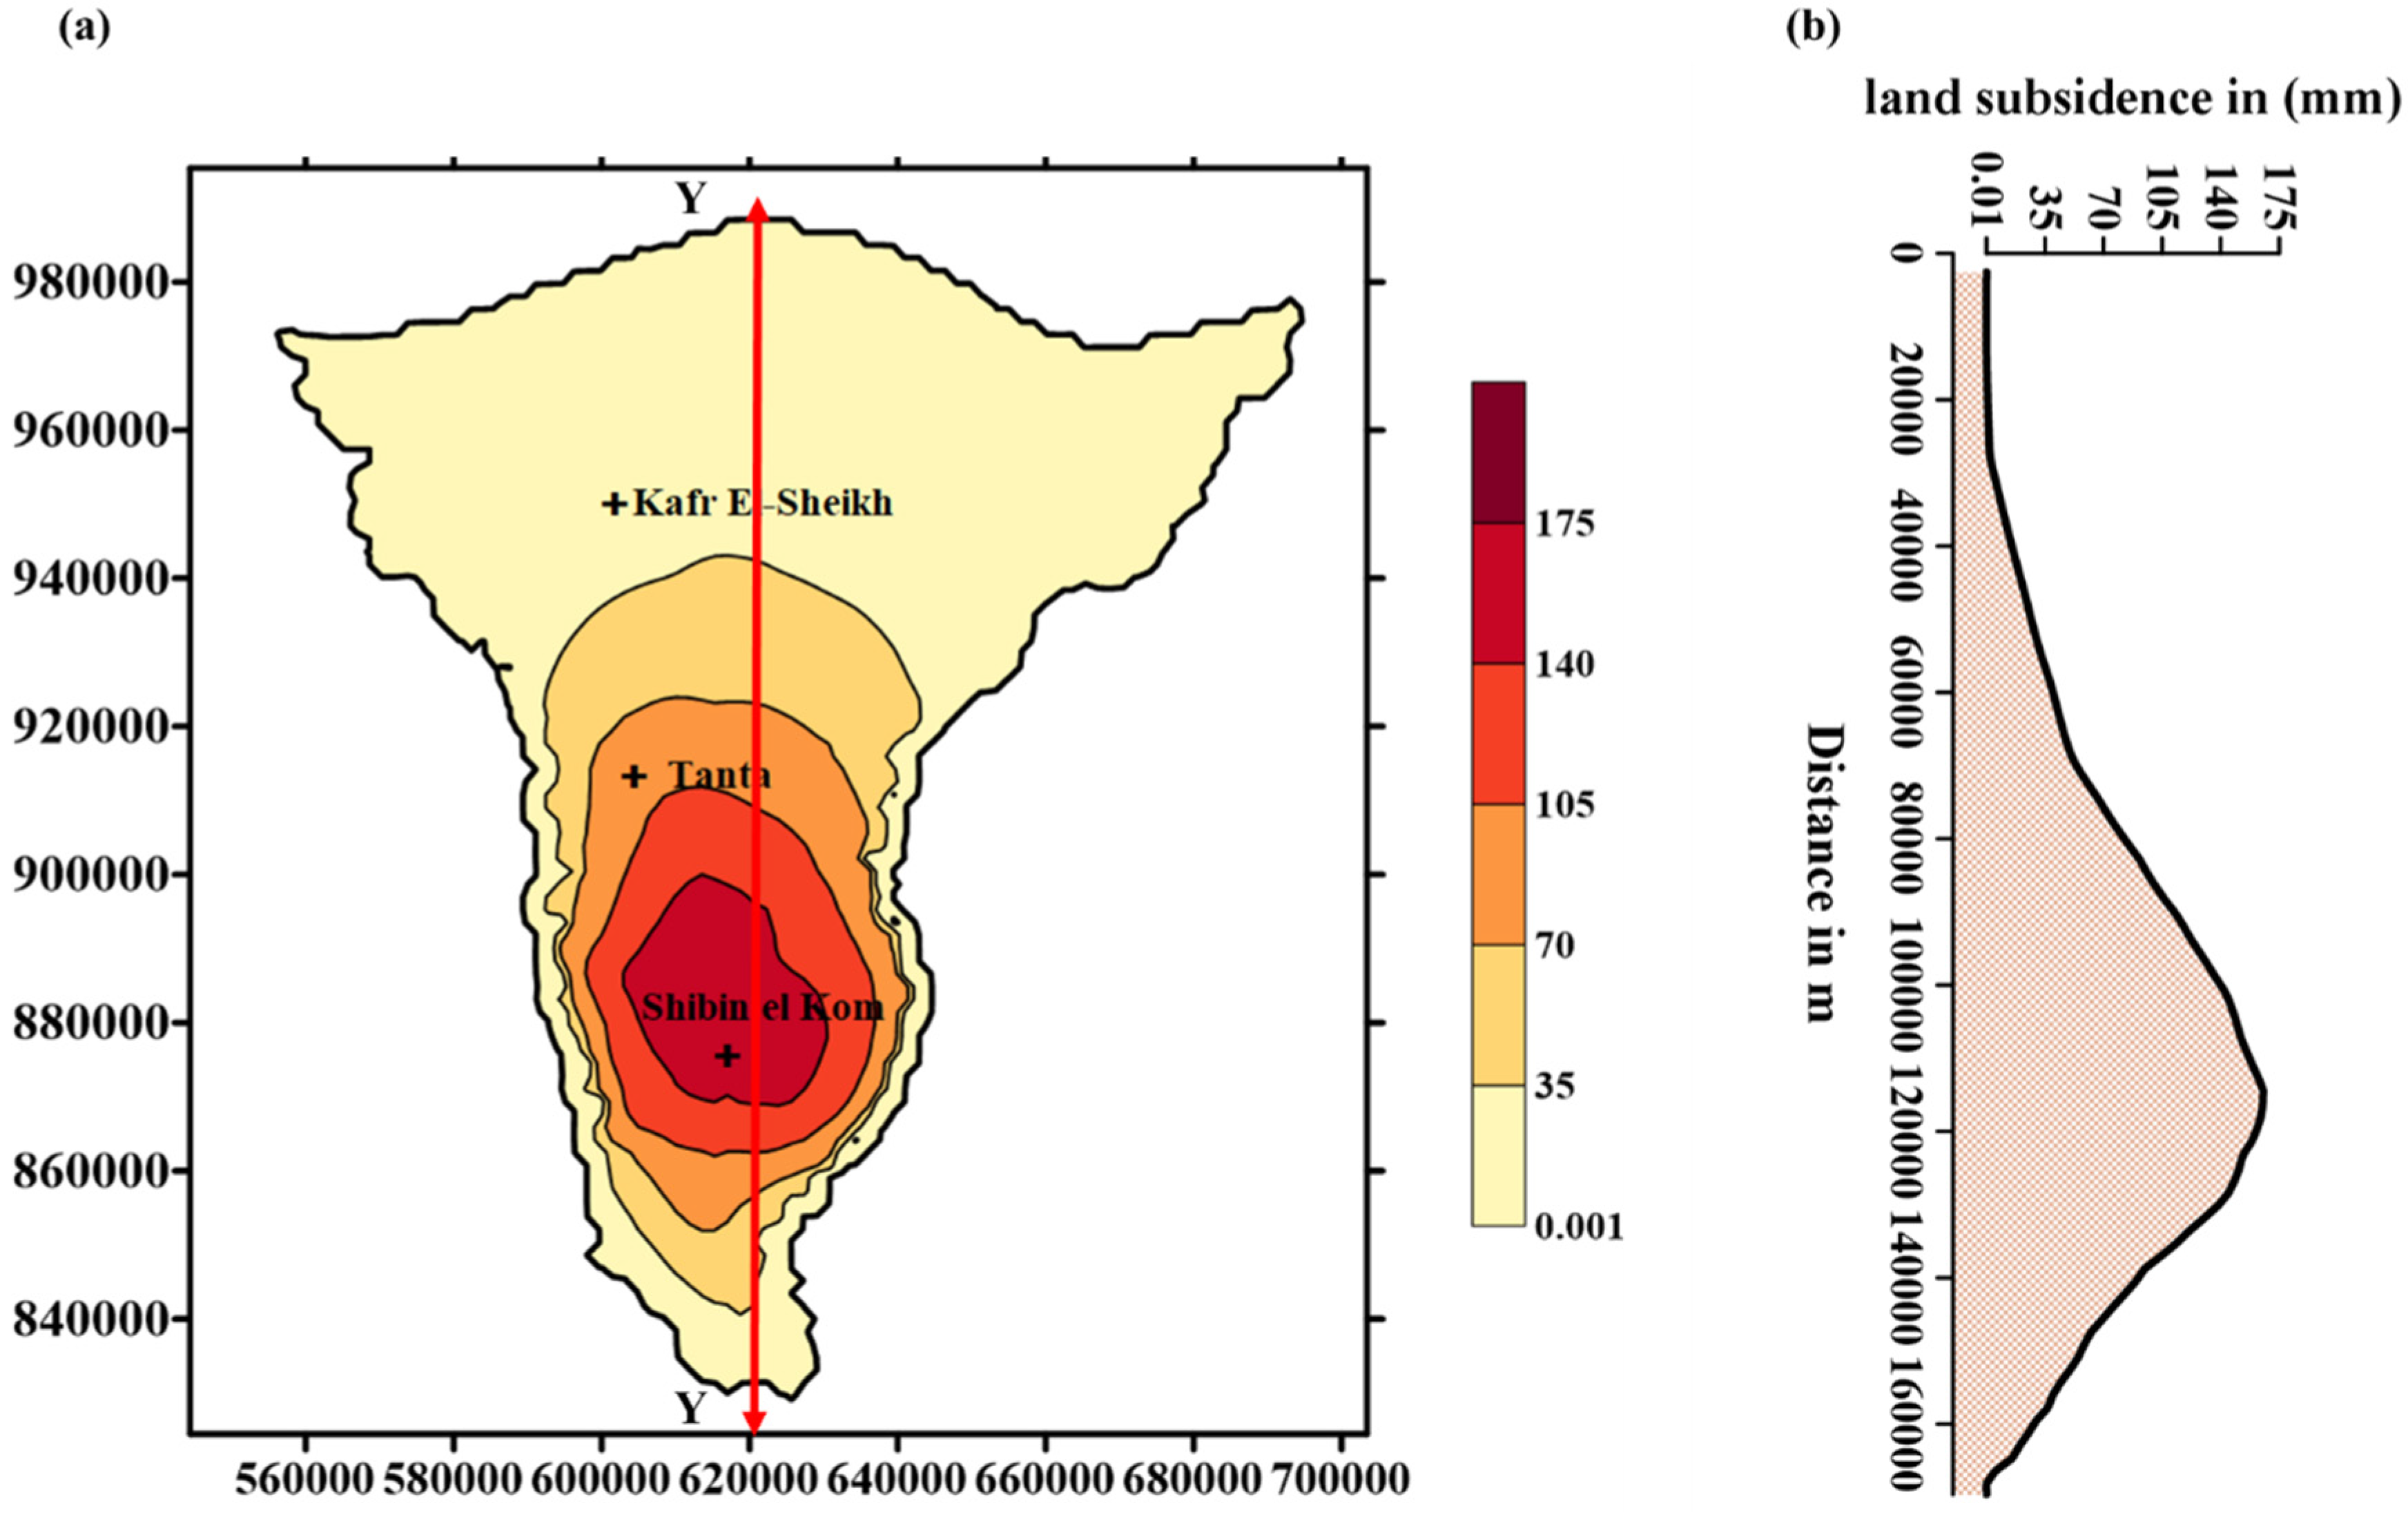
3.2. Land Subsidence Calibratiom

Calibration land subsidence is the process of comparing the LS rate obtained from the analytical solution with LS rates from previous studies in the MND. In this section, the analytical model is used to calculate land subsidence in the period from 2010 to 2016. The abstraction rate of GW is indicated in Table 4. The analytical model results showed that the maximum LS is 170 mm from 2010 to 2016. So, the maximum rate of LS is 10.6 mm/year. Ls rates in the major cities of the MND are also measured as shown in Figure 7. LS rates in Kafr El-Sheikh, Tanta and Shibin El-Kom are 1.7 ± 0.5 mm/ year, 4.35 ± 0.6 mm/year and 8.75 ± 0.6 mm/ year, respectively. The analytical model results have been compared with the results of LS obtained by using INSAR and GPS techniques developed by Saleh and Becker [22]. Saleh and Becker investigated LS due to GW abstraction in the whole Nile Delta. Their results showed that LS rates due to excessive GW withdrawal were −6.4 ± 0.4 mm/y, −4.0 ± 0.6 mm/y, −4.8 ± 1.0 mm/y, −10.0 ± 1.2 mm/y, −10.3 ± 1.6 mm/year, and −4.9 ± 1.6 mm/y from Cairo, Tanta, Mahala, Mansoura, Damietta, and Port Said. Comparing the results from the analytical model and the results of INSAR gave a good agreement.

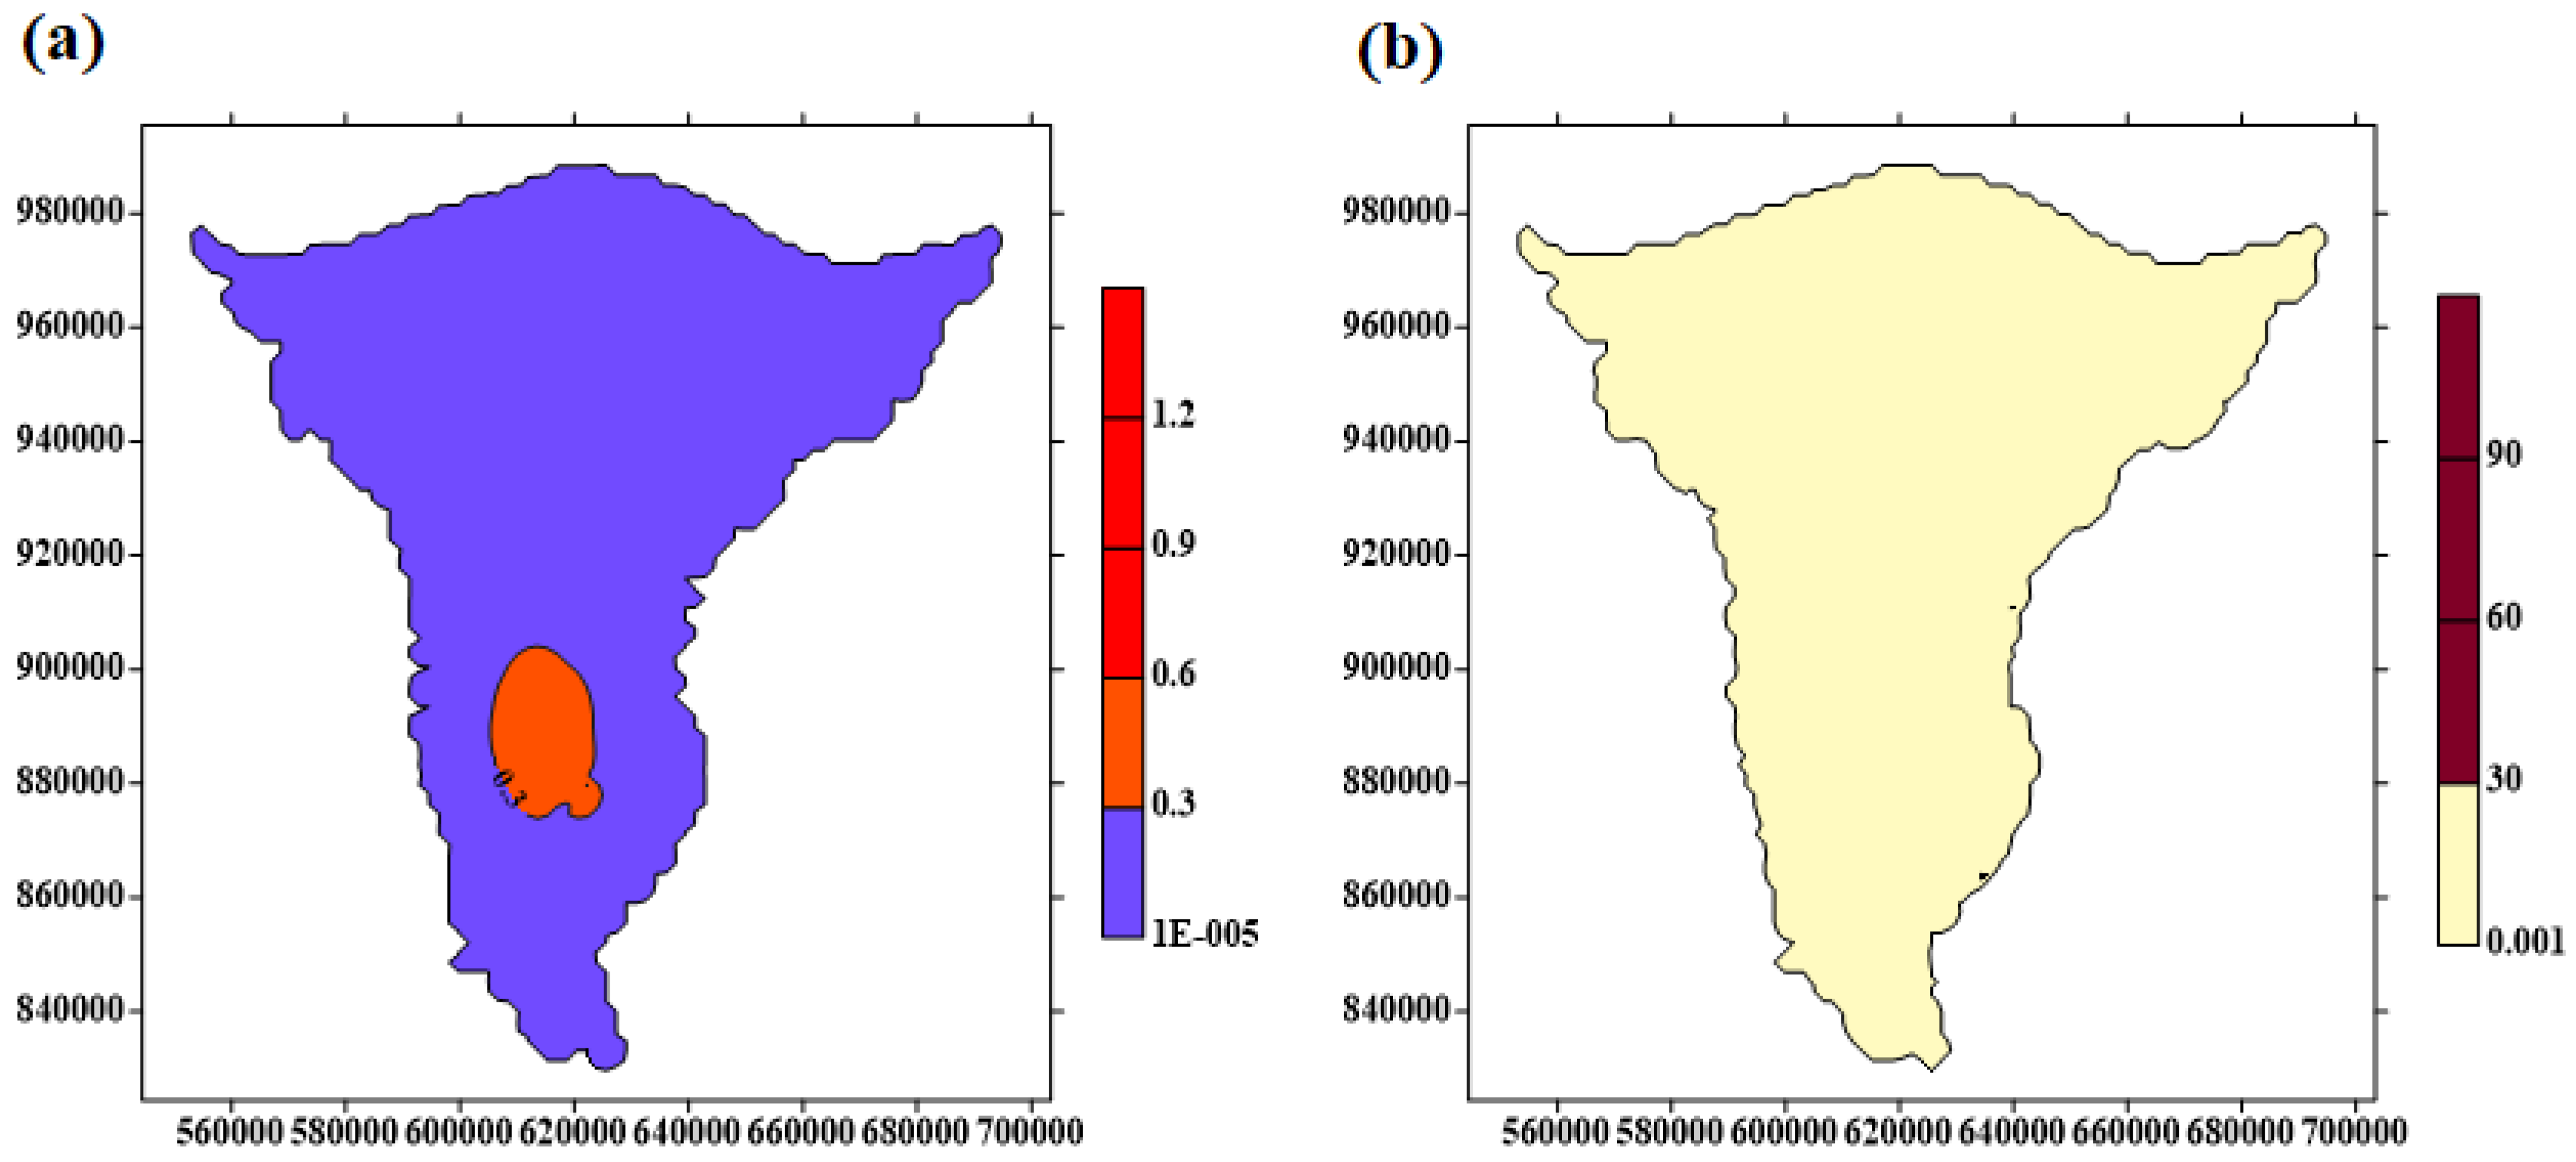
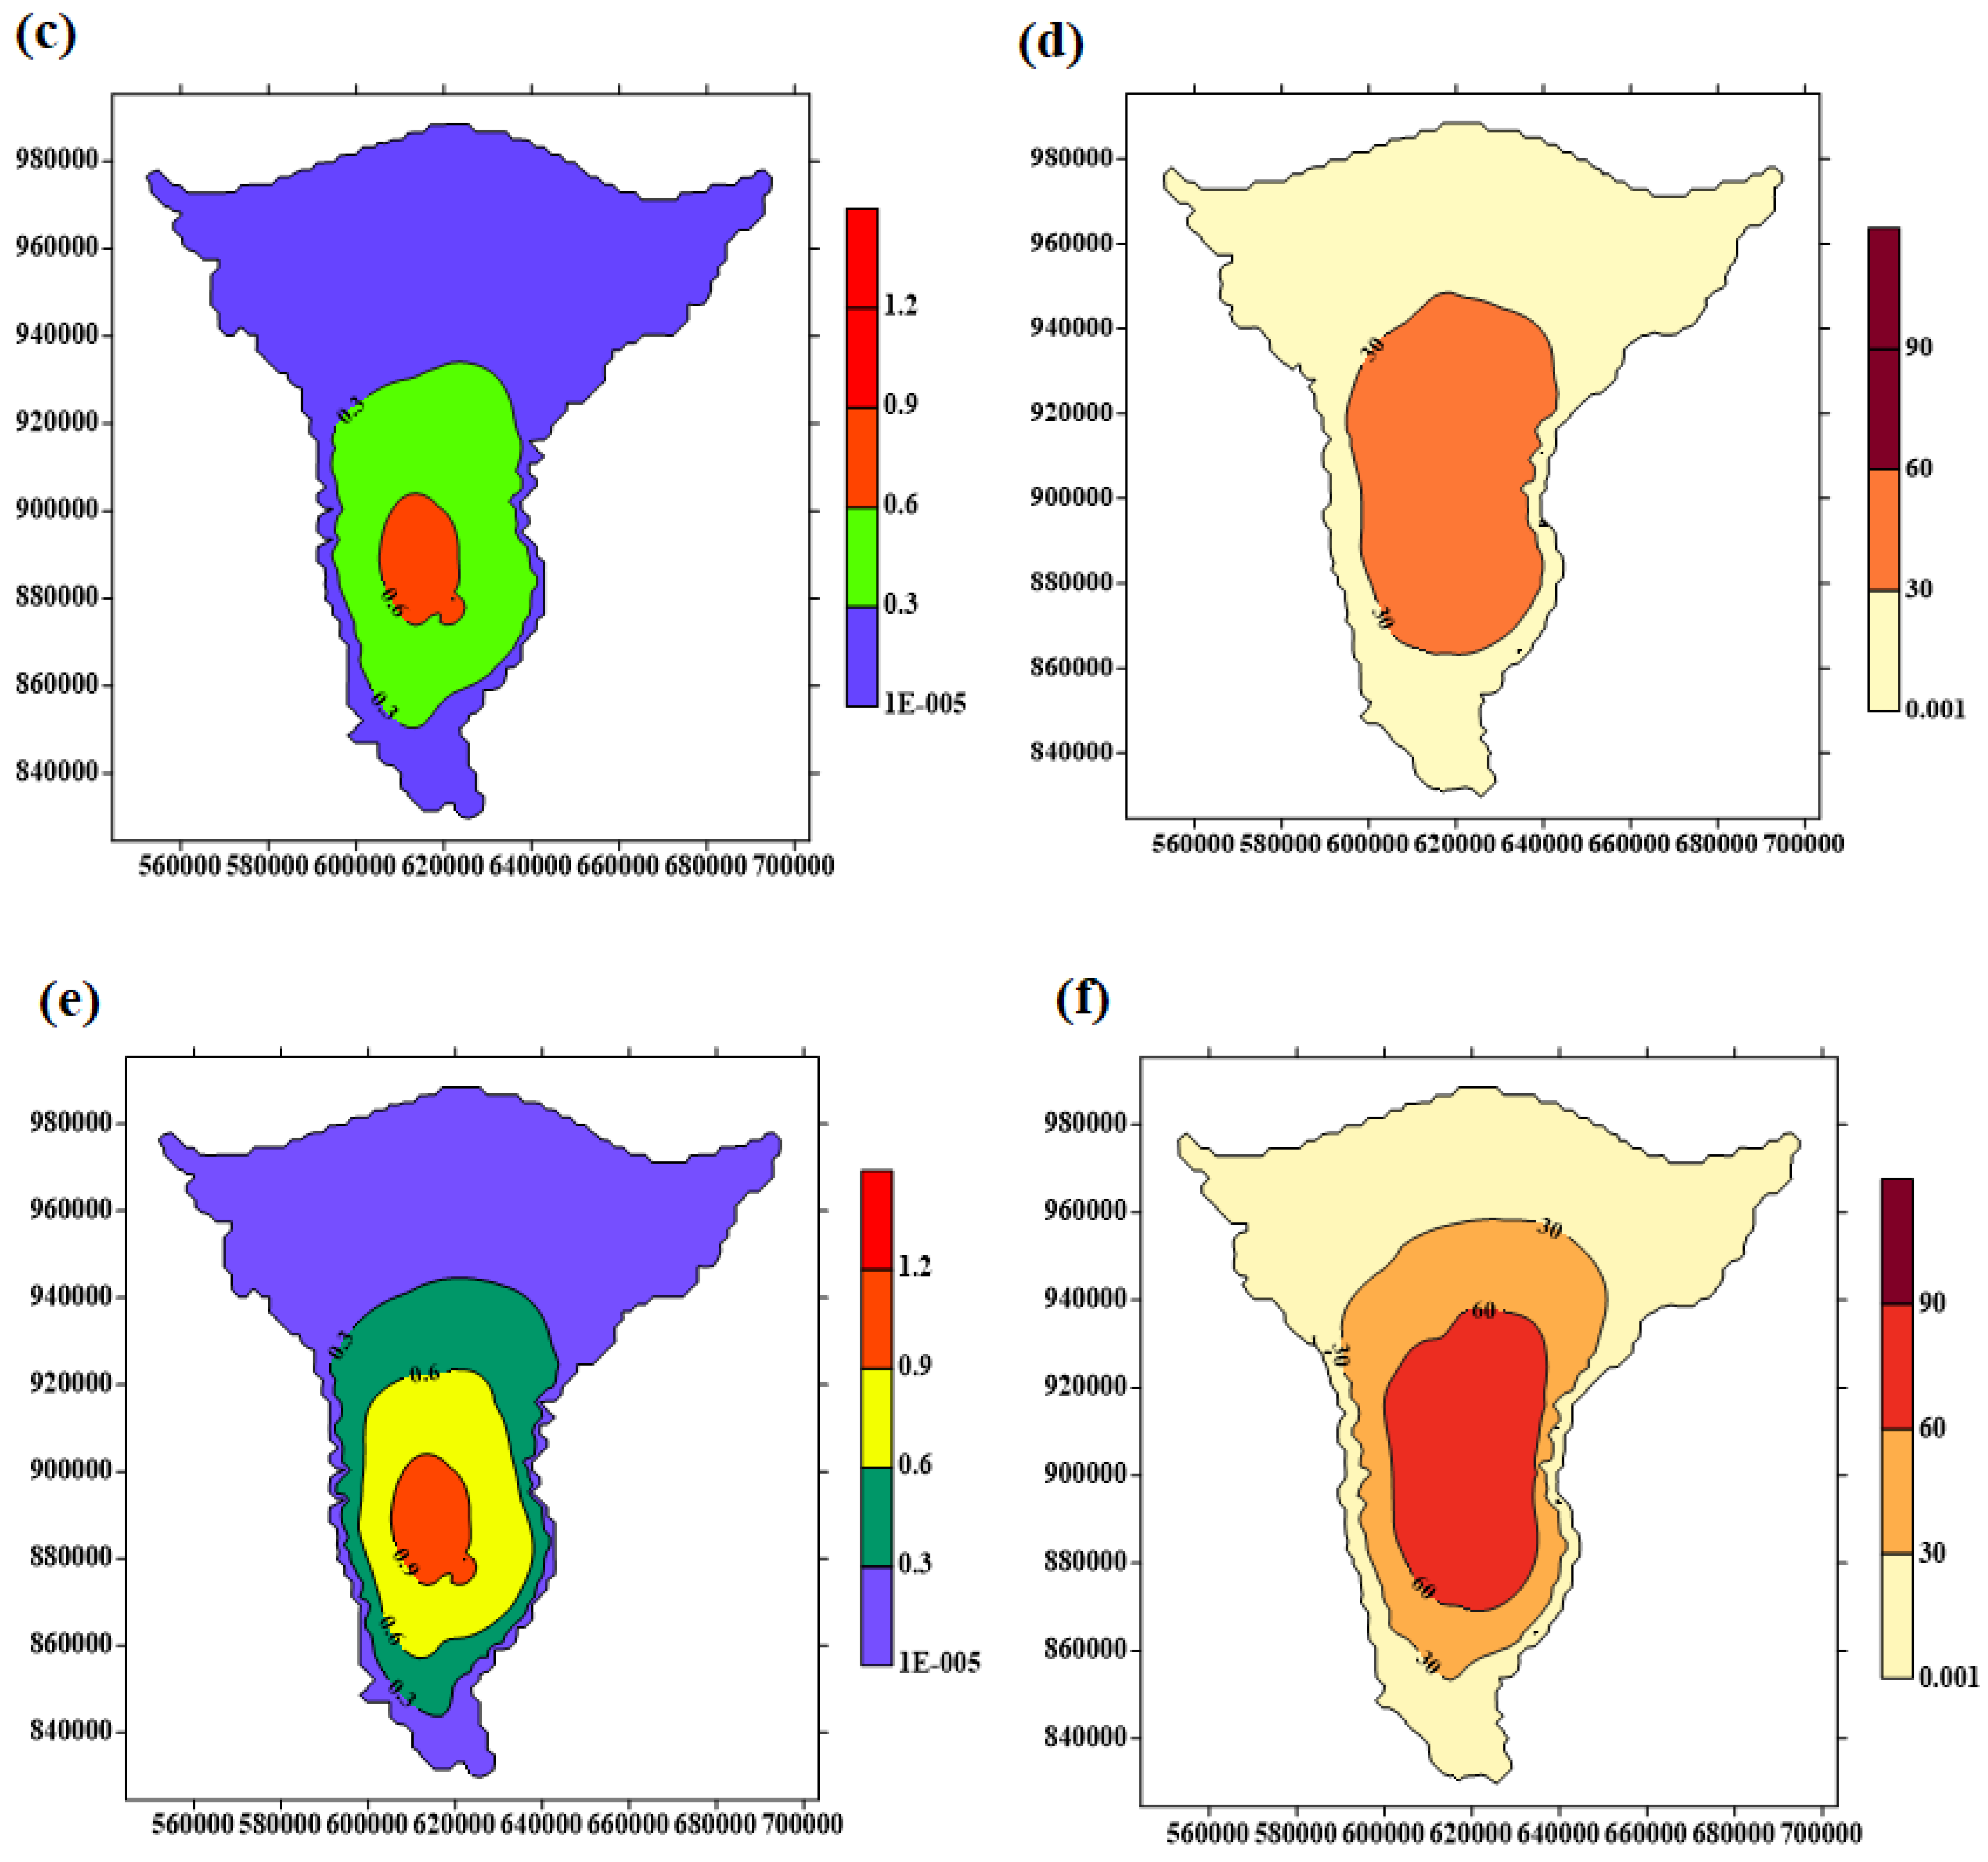
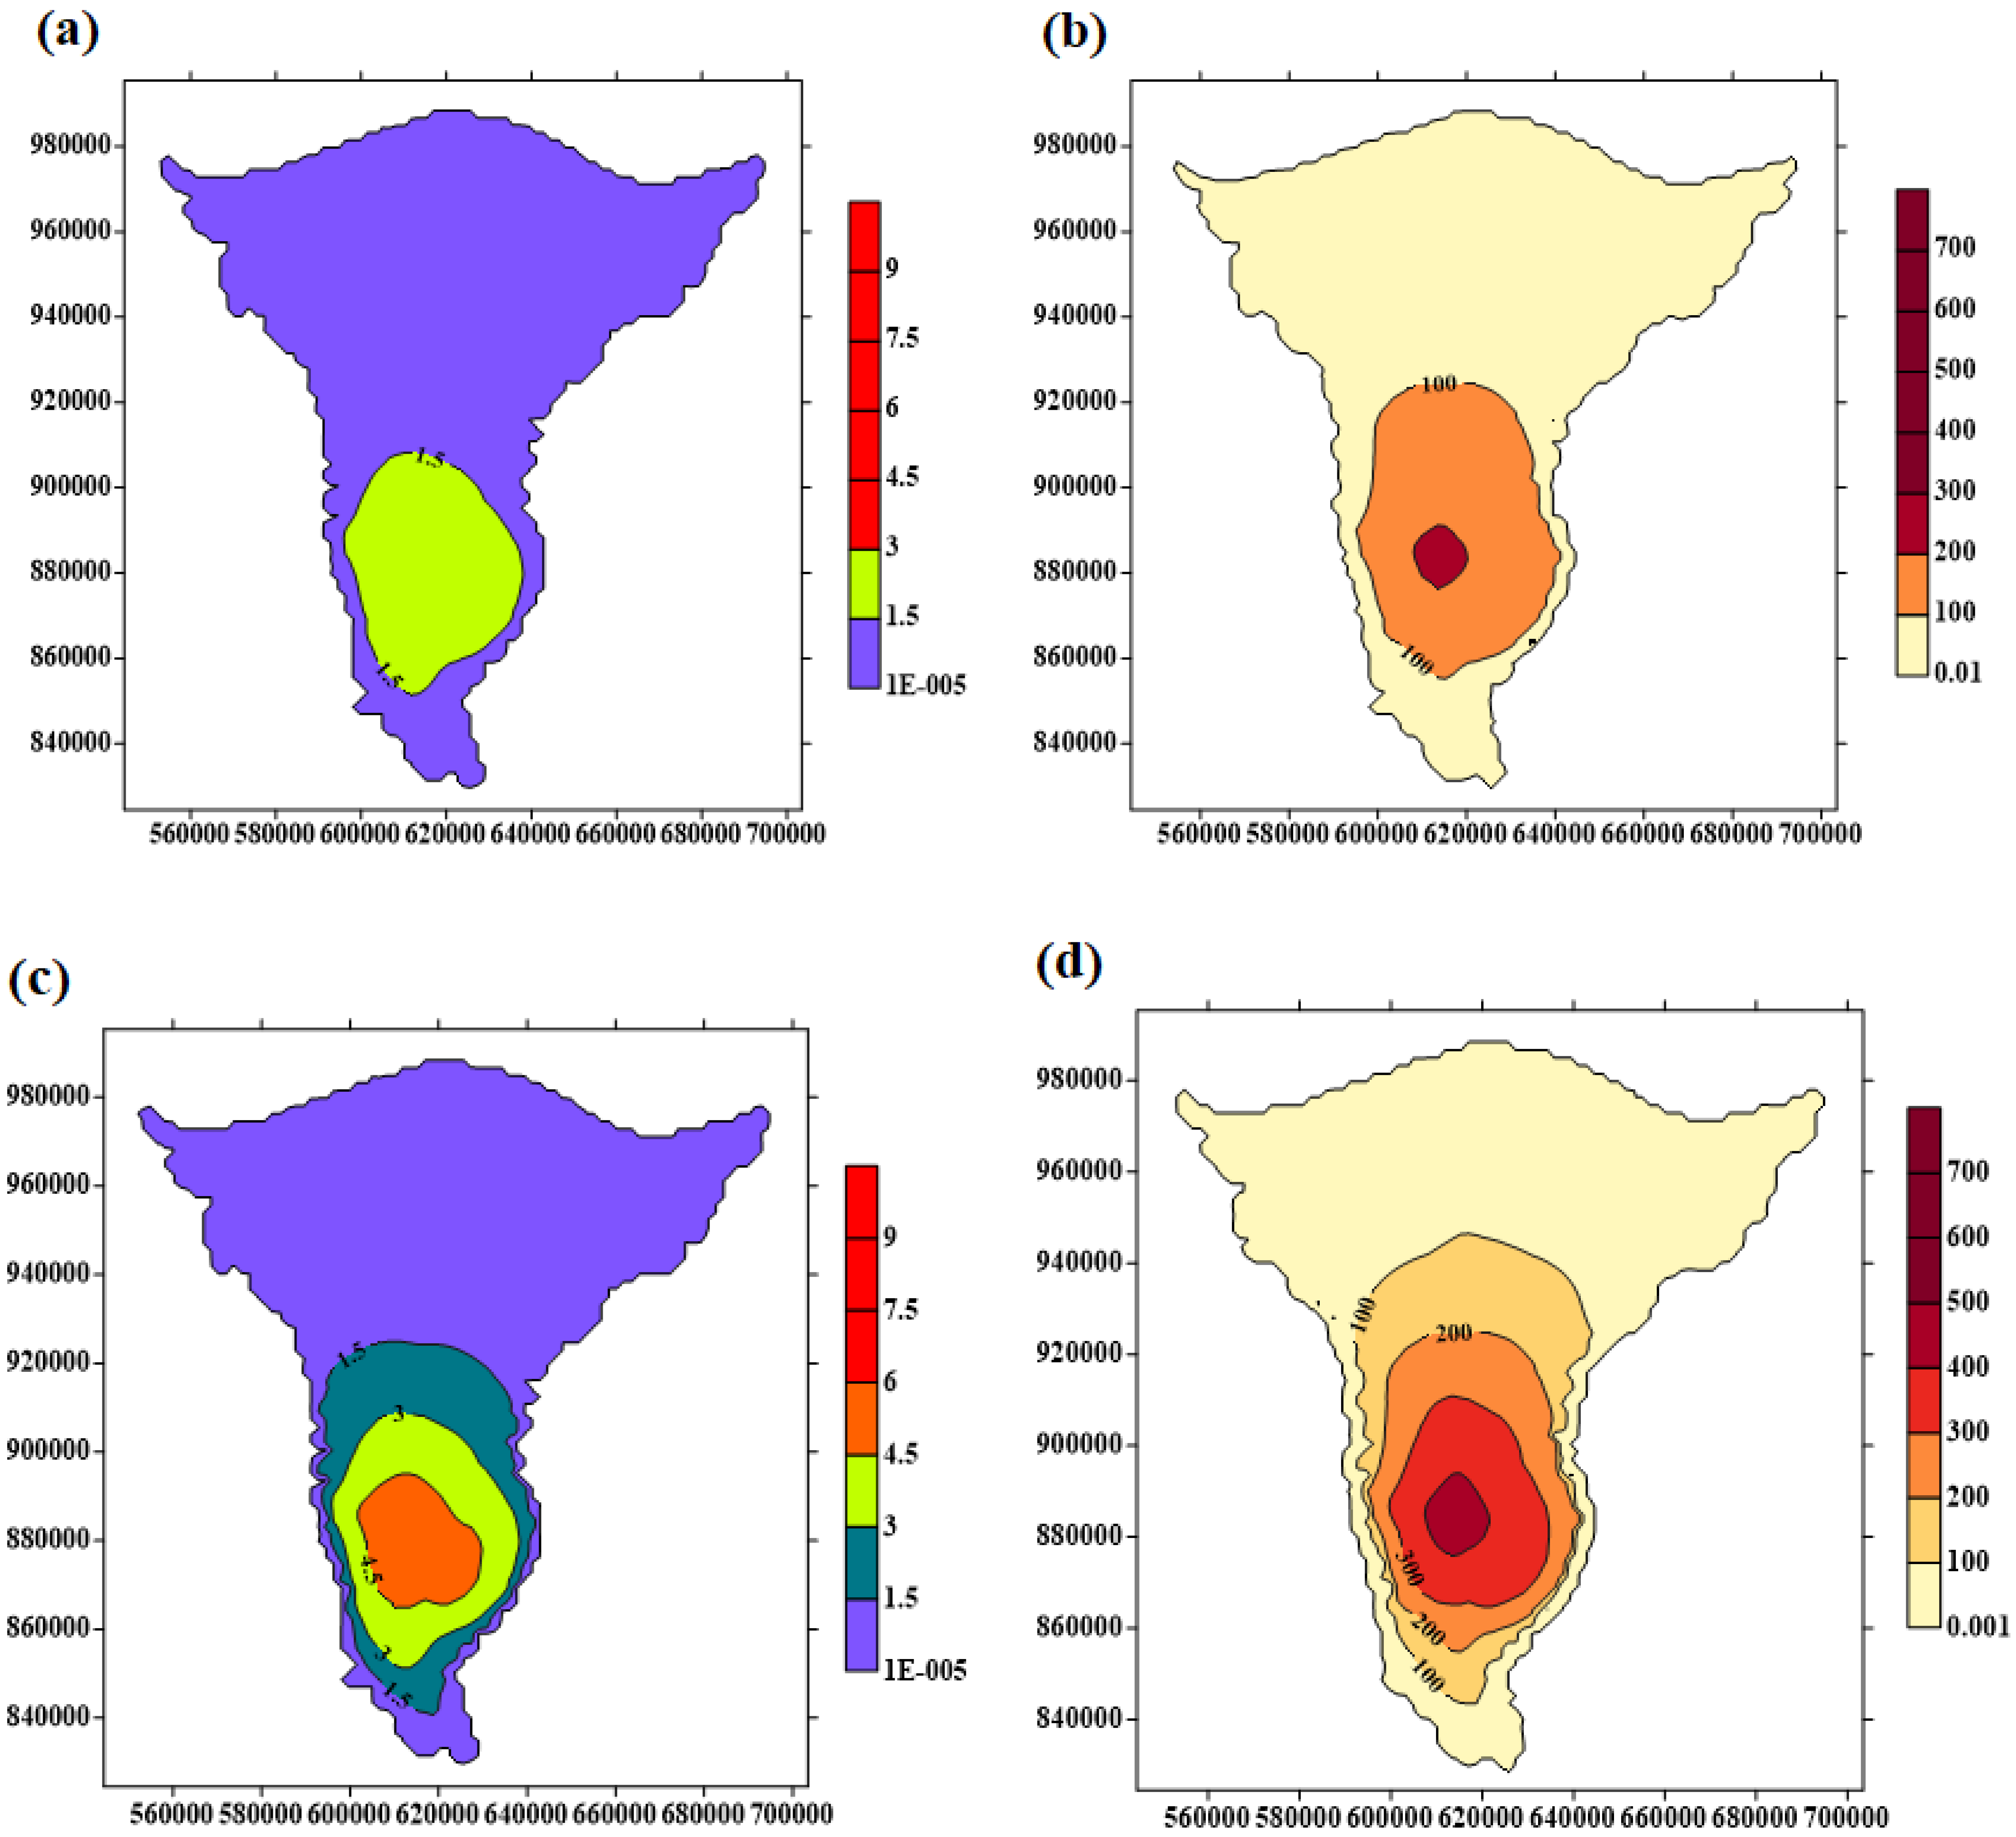
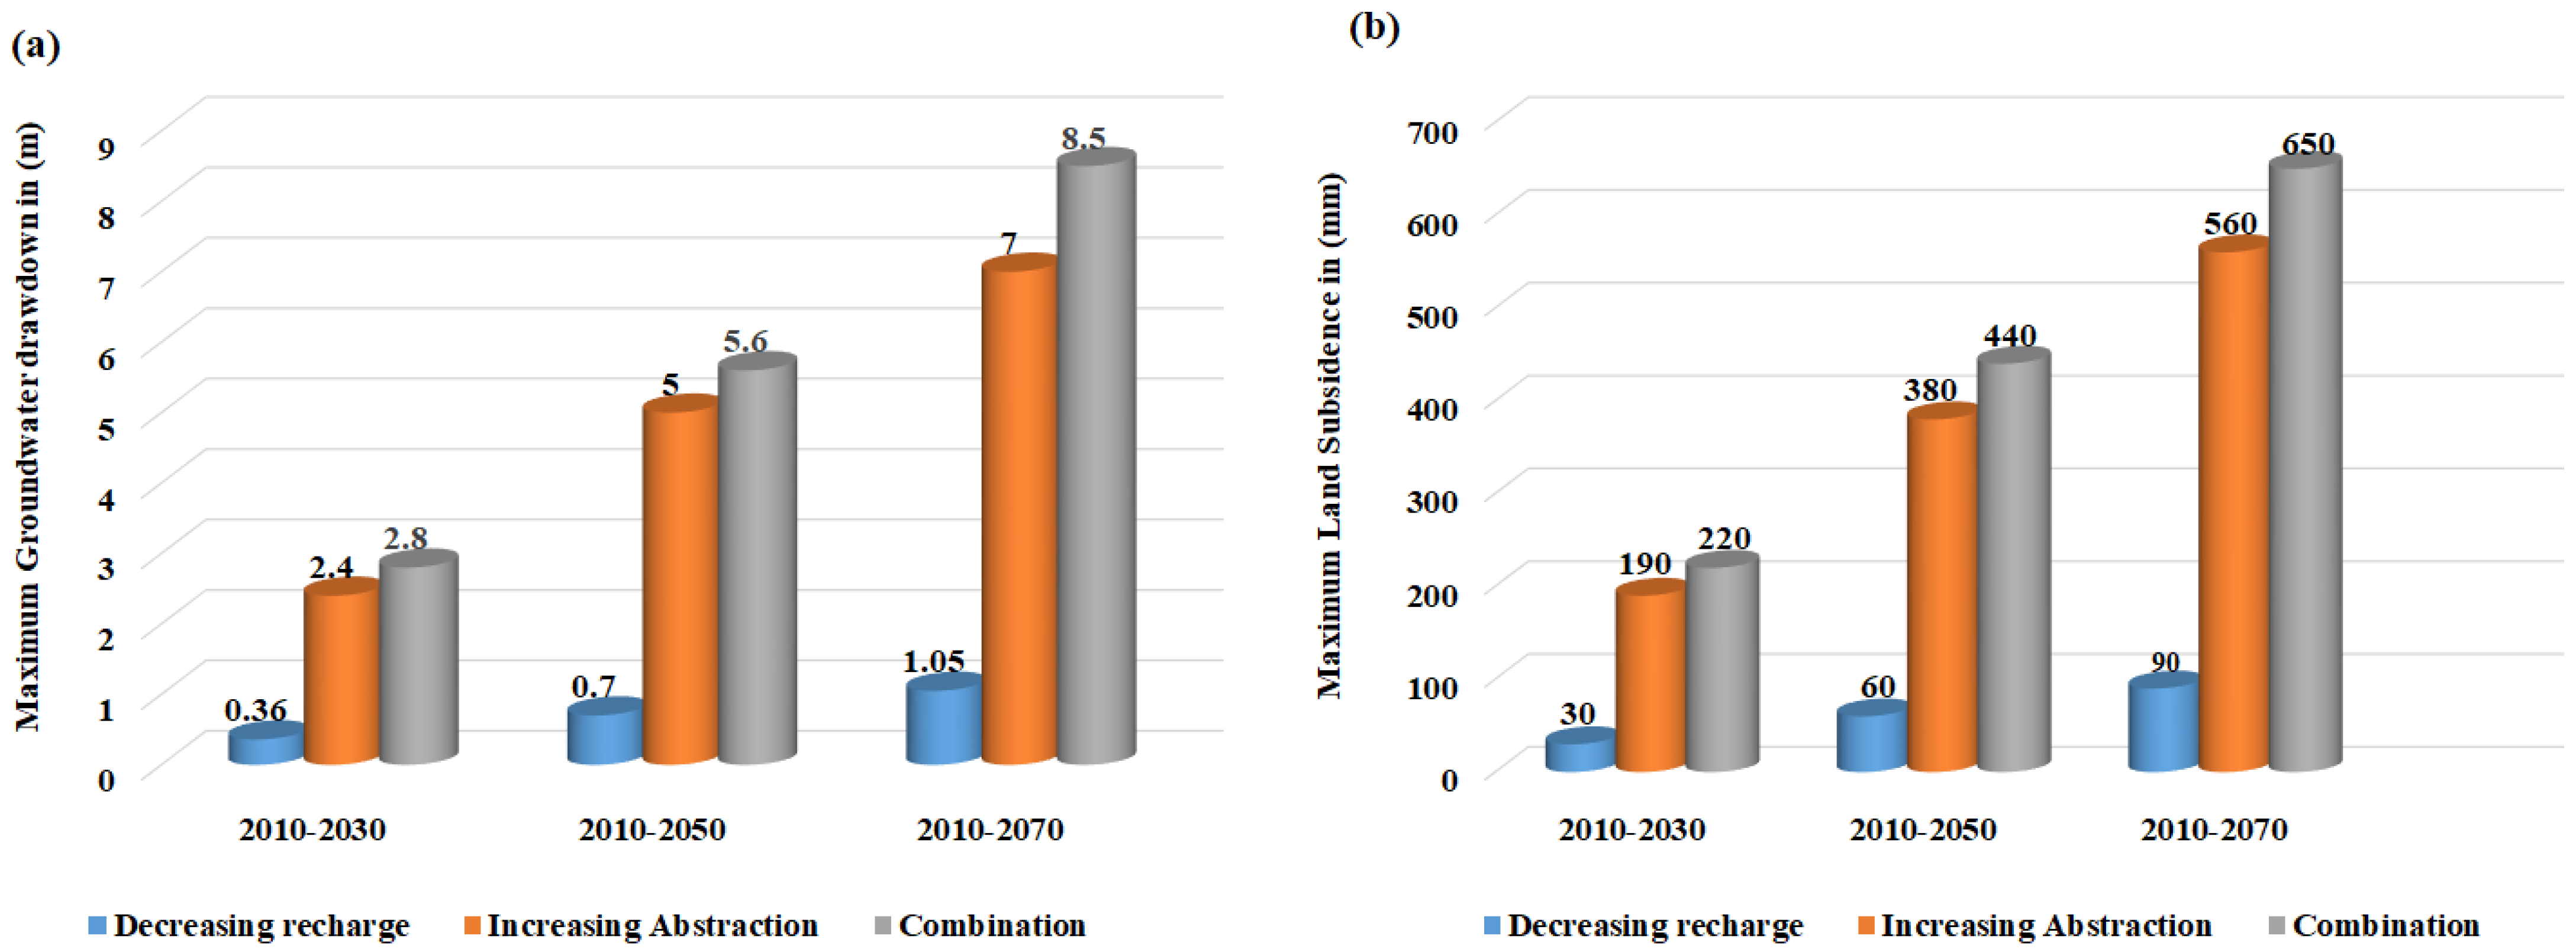
3.3. Effect of Decreasing Recharge Rates on LS in the MNDA

The reduction in the Nile flow results in the depletion of the recharge to the MND aquifer. In this stage of the case study, the model was used to assess the impact of decreasing recharge rates to 94.4 %, 88.8%, and 83.2% while maintaining the GW abstraction volume constant at 0.81 BCM y−1. For scenario 2, the results show that when the recharge rate decrease to 94.4%, the maximum GW drawdown is 0.36 m from the starting GW level in 2010, and the maximum LS value is 30 mm (Figure 8a,b). In scenario 3, as the recharge rate drops to 88.8%, the difference between the GW levels reaches a maximum drop of 0.70 m from the starting levels in 2010, and the LS value reached a maximum of 60 mm (Figure 8c,d). Finally, in scenario 4 the recharge rate decreases to 83.2% resulting in a maximum GW drawdown of 1.05 m from the starting level in 2010, and a maximum LS value of 90 mm (Figure 8e,f). Figure 8 shows that the groundwater drawdown is displayed as concentric circles. We believe that this is due to the dense concentration of pumping wells in core of the study area. Moreover, the results indicate that the area with the highest LS rates is the core of the MND as shown in Figure 8.

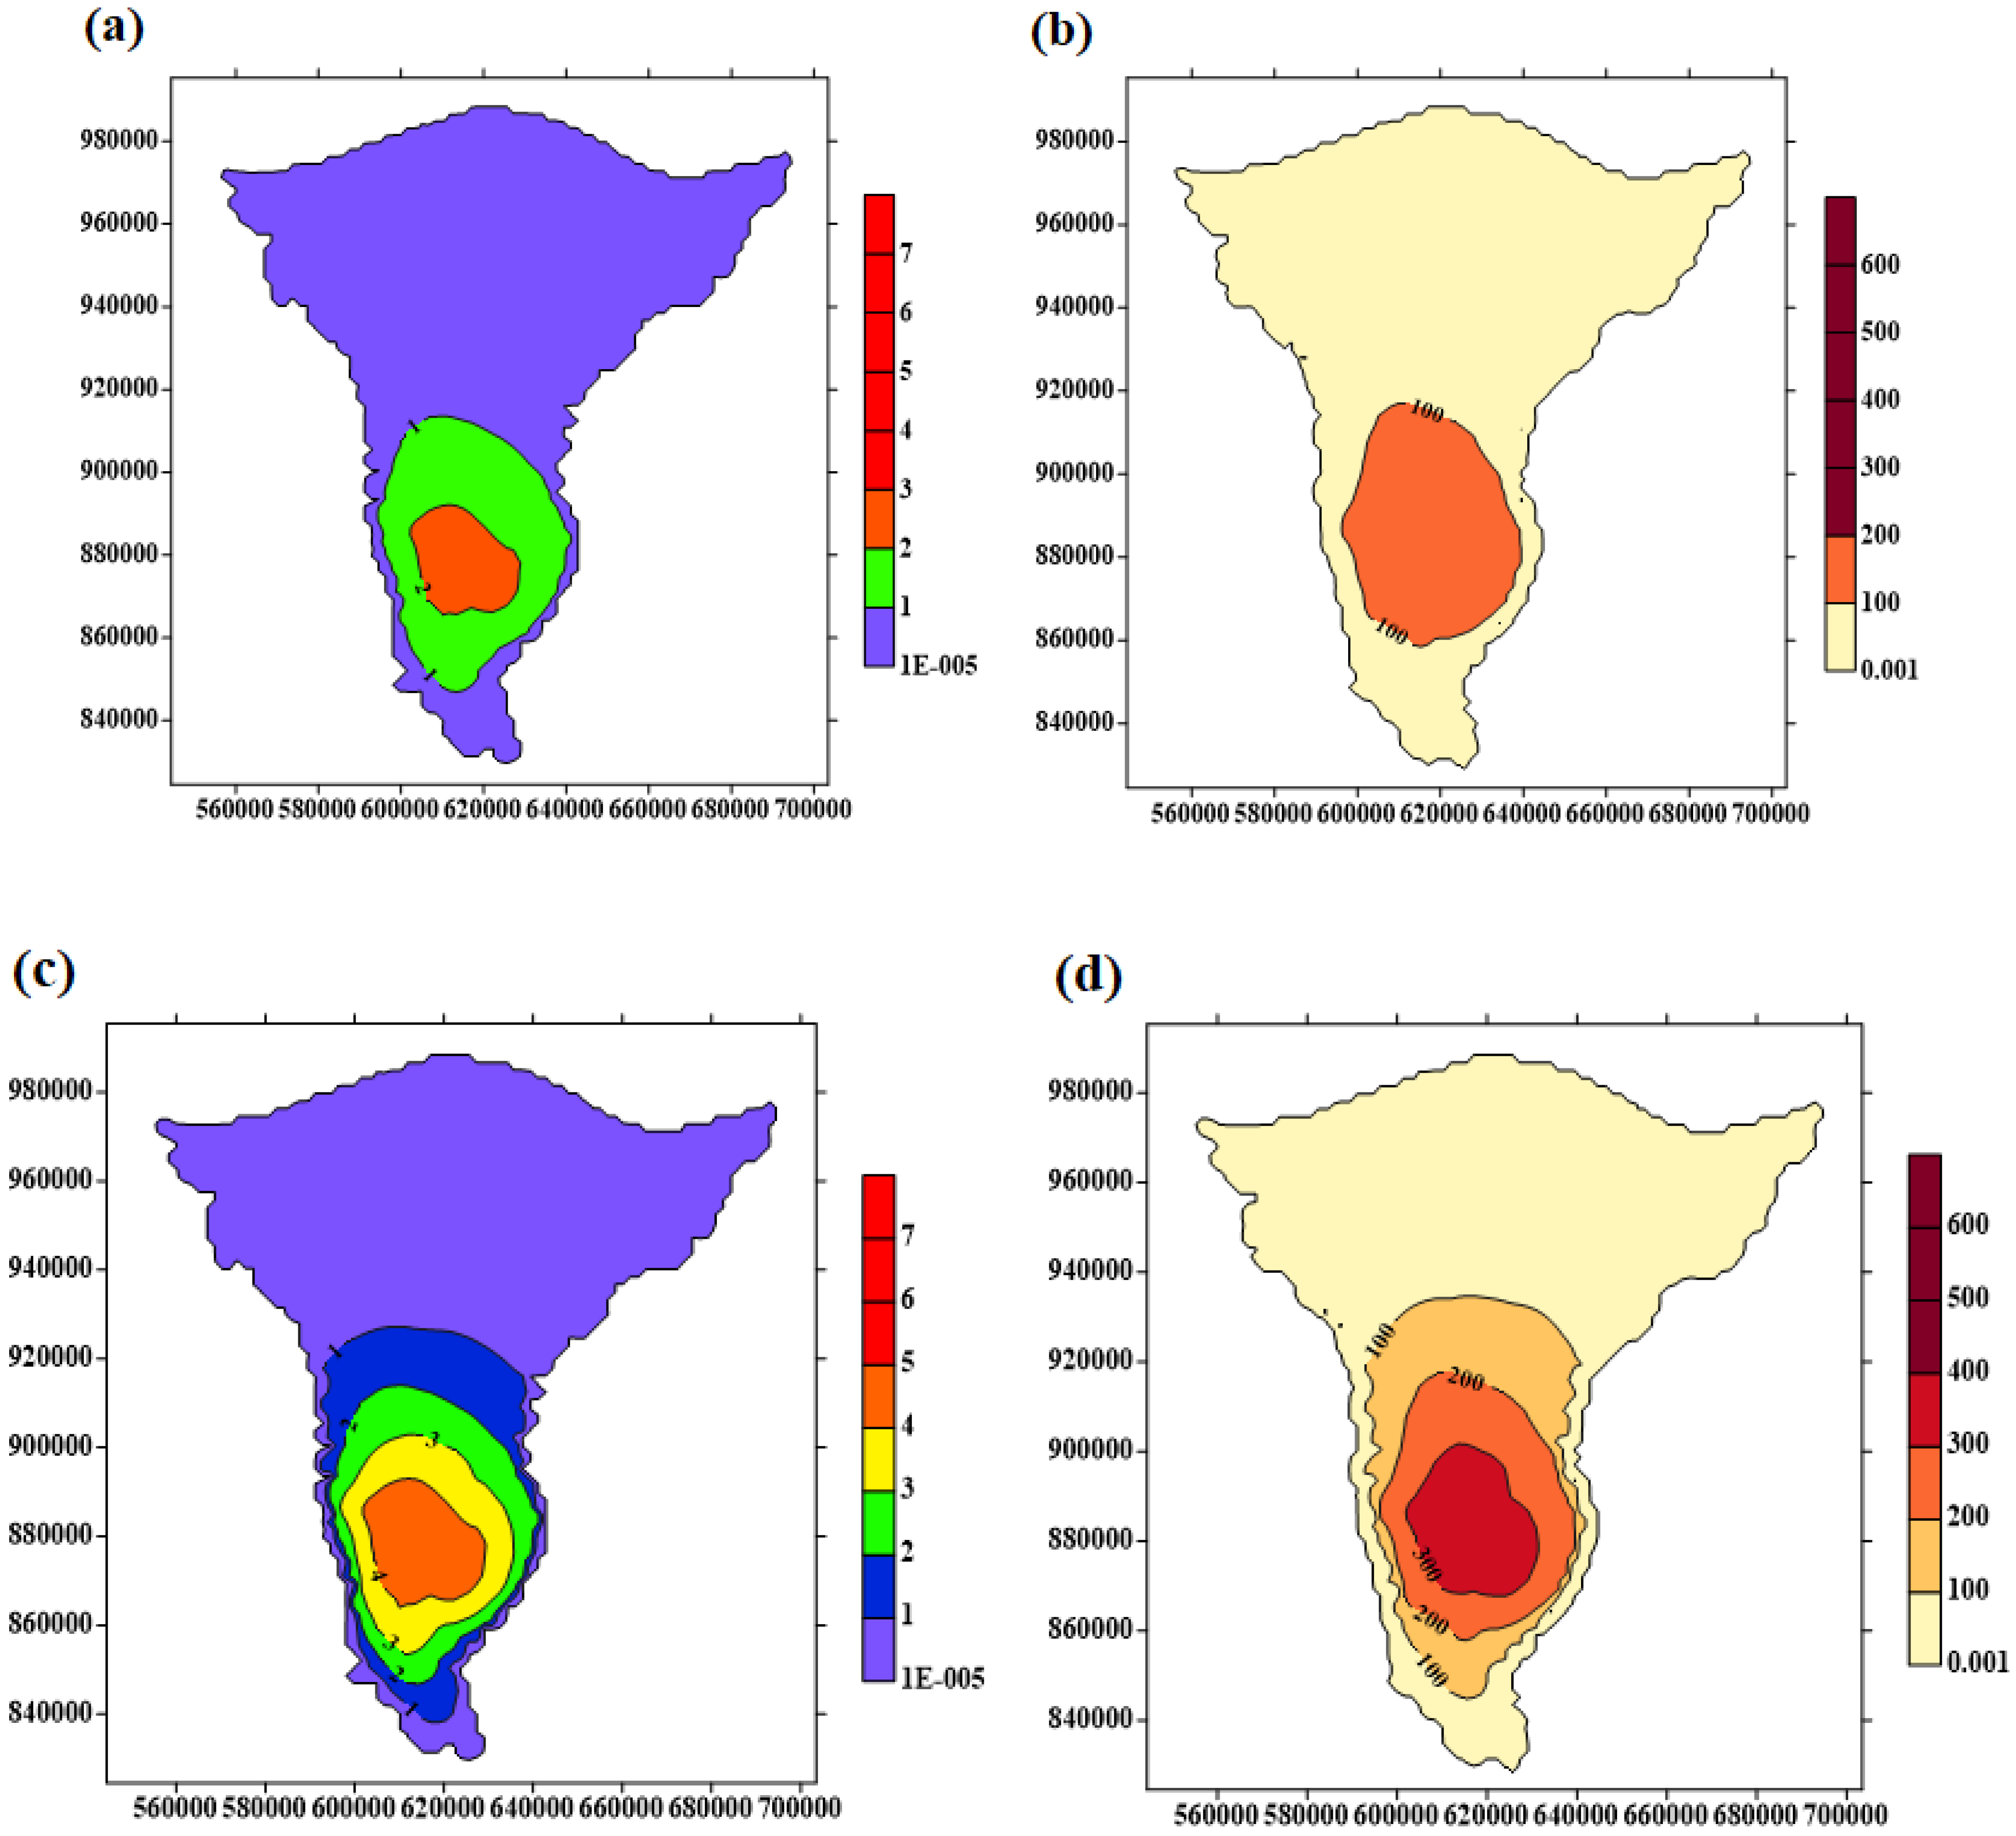
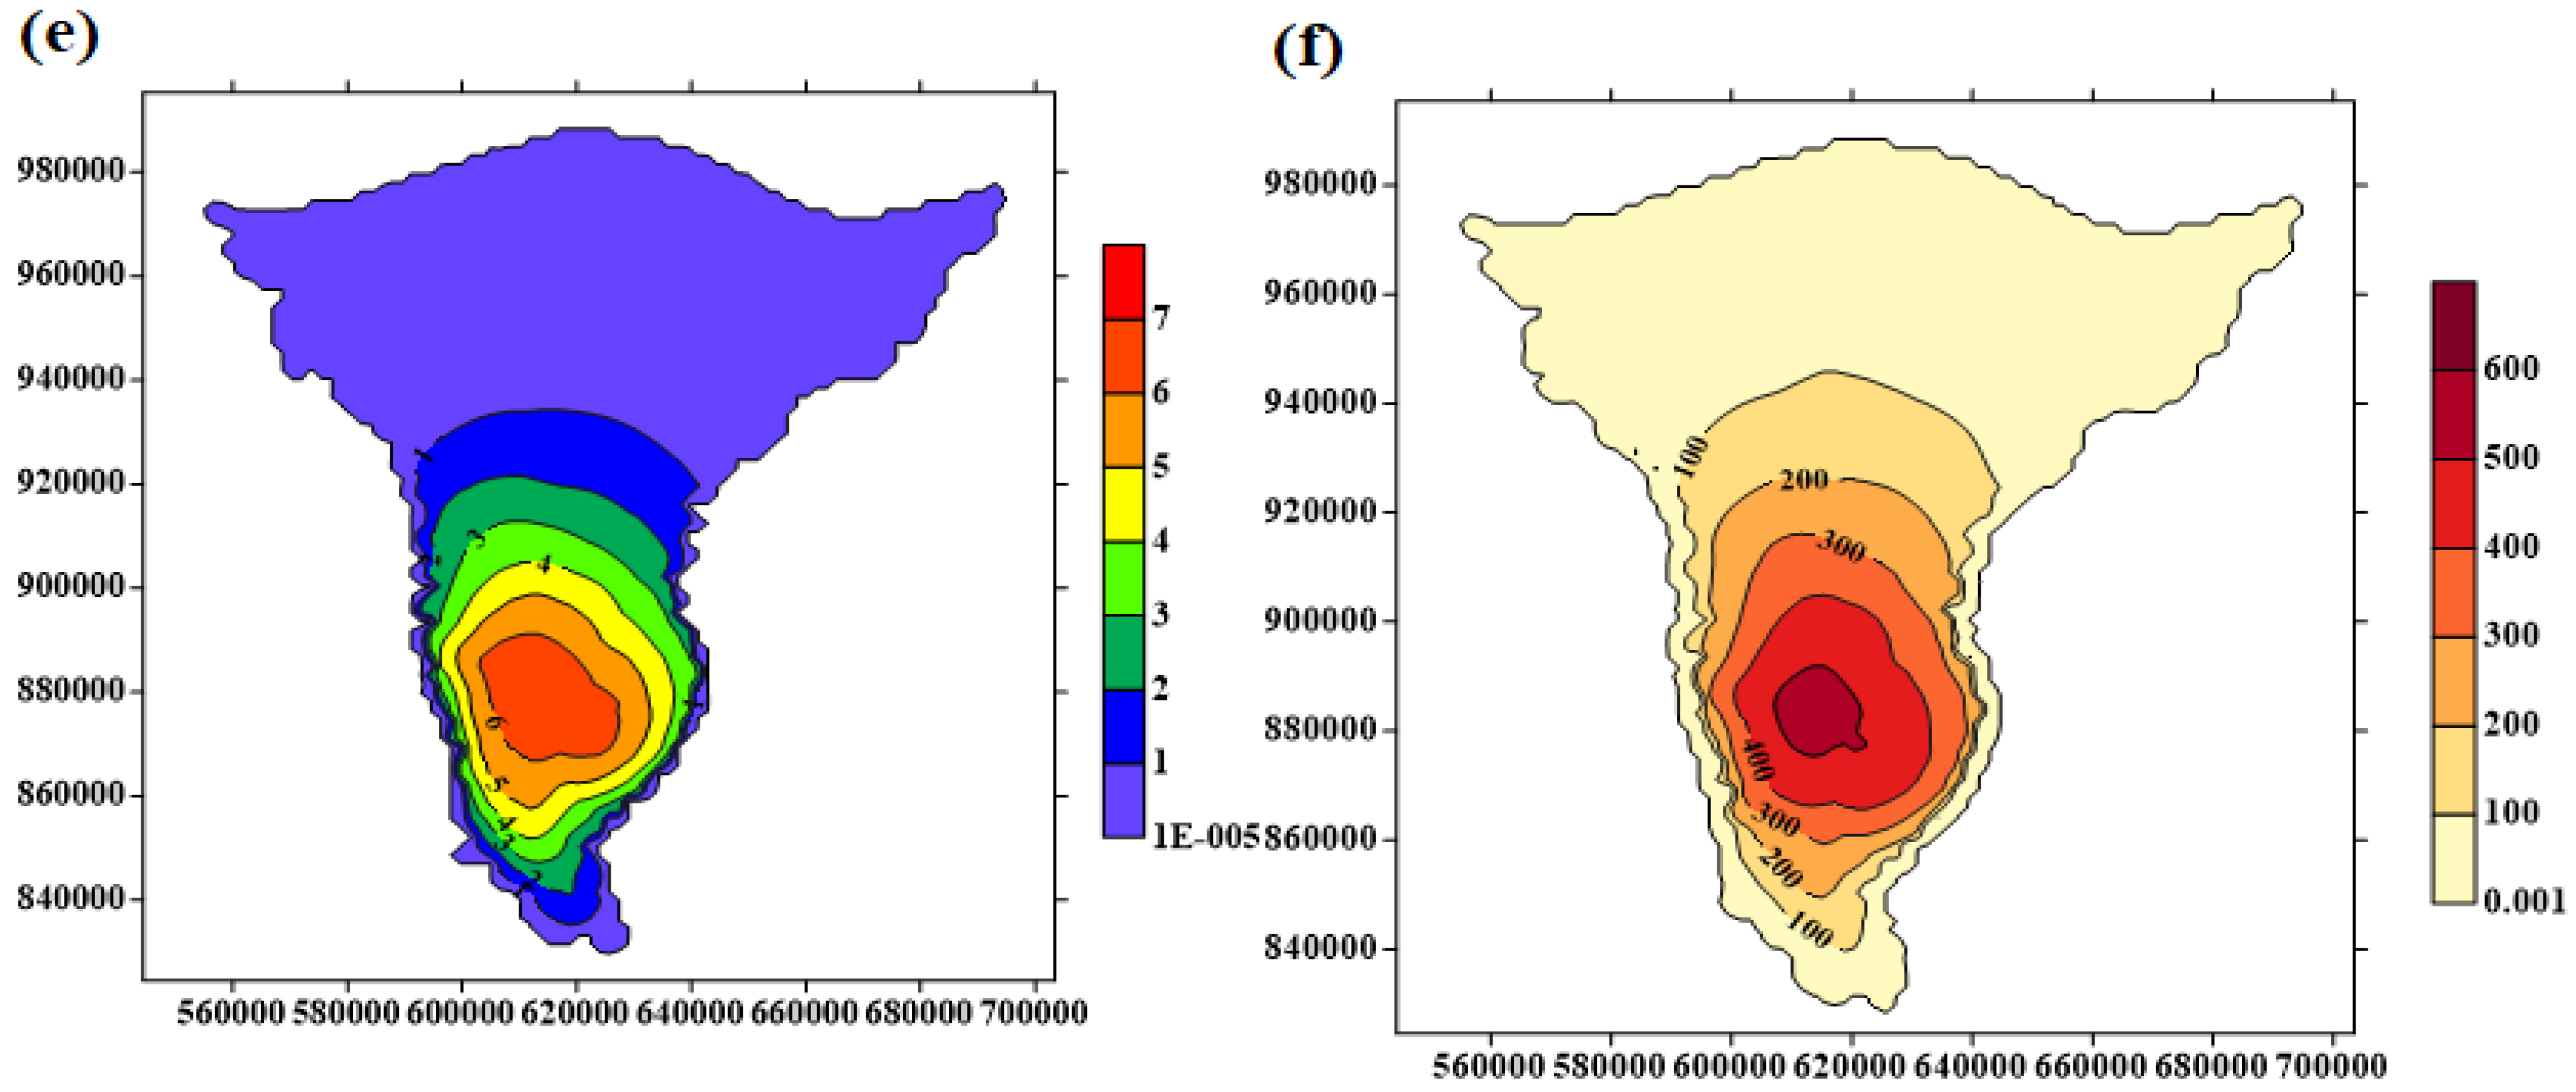
3.4. Effect of Increasing Abstraction Rates on LS in the MNDA

Population growth leads to an increase in the GW abstraction from the MND aquifer [52]. In this part of the case study, the model evaluated the impact of increasing abstraction rates to 146 %, 193%, and 233 % while maintaining the GW recharge volume constant at 1.4 BCM y−1. In scenario 5, the abstraction rate increased to 146% causing a maximum GW drawdown of 2.4 m from the starting levels in 2010, and a maximum LS value of 190 mm (Figure 9a,b). When the abstraction rate increased to 193% in scenario 6, the maximum GW drawdown reached a 5.0 m from the starting level in 2010, and the maximum LS value reached 380 mm (Figure 9c,d). For scenario 7, the abstraction rate increased to 233% resulting in a maximum GW drawdown of 7.0 m from the starting level in 2010, and a maximum LS value of 560 mm (Figure 9f). The intensive concentration of pumping wells in the core of the study area is responsible for presenting the groundwater drawdown as concentric circles as indicated in Figure 9. The results also indicated that the area with the highest LS rates is the core of the MND as shown in Figure 9.

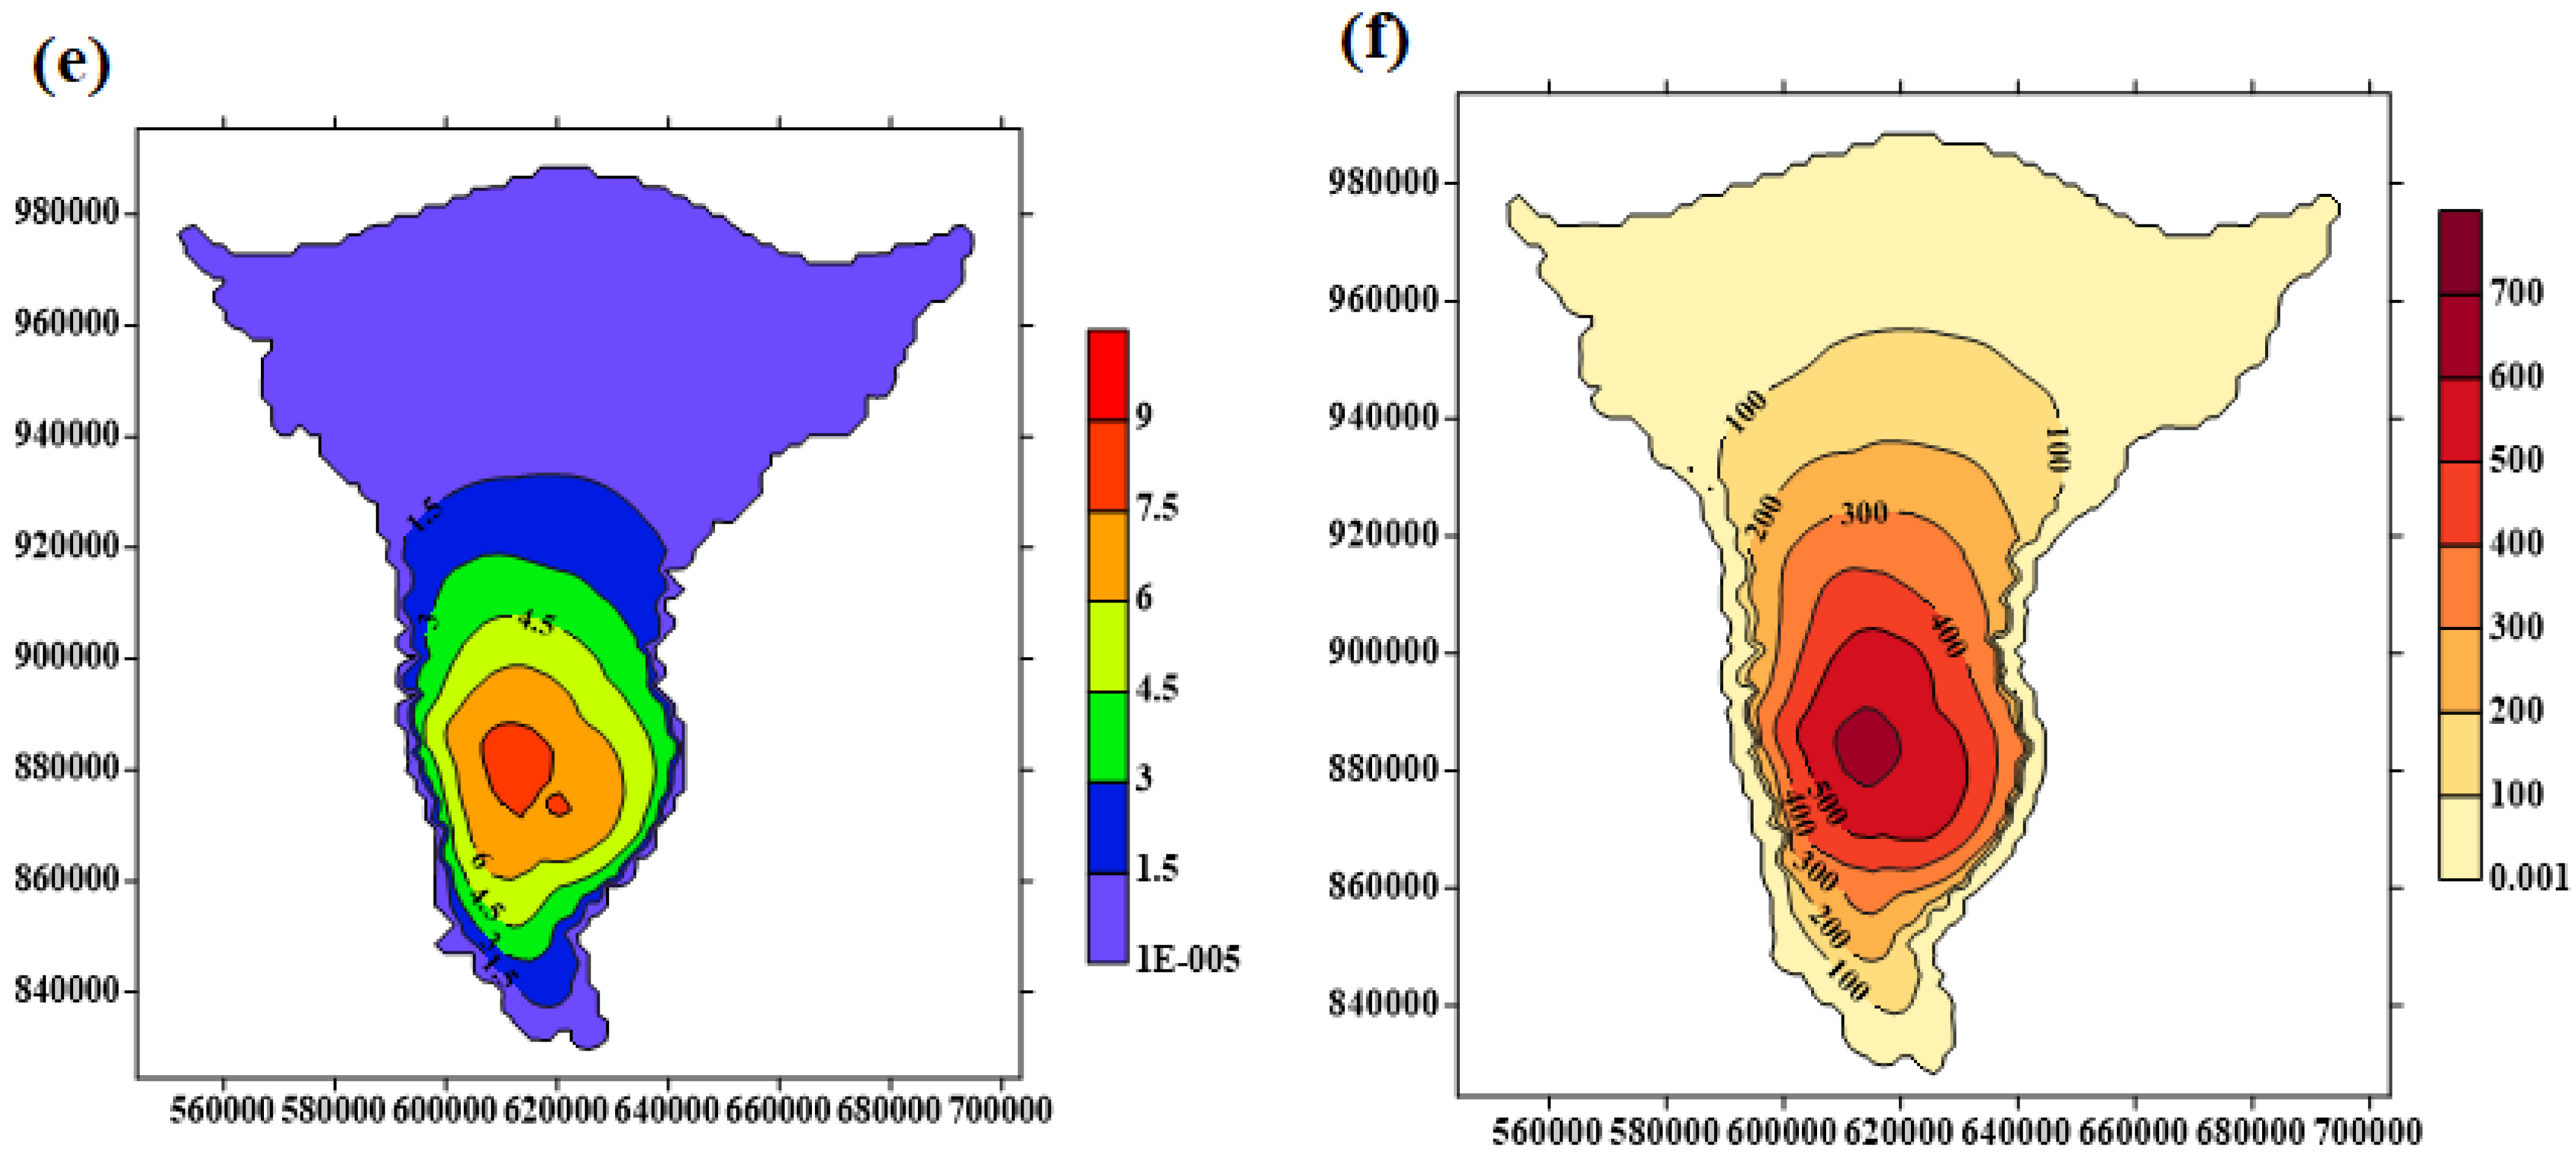
3.5. Effect of Combination between Increasing Abstraction and Decreasing Recharge Rates on LS in the MNDA

In this stage, the model was used to assess the impact of both increasing the GW abstraction rates to 146%, 193%, and 233% and decreasing recharge rates to 94.4%, 88.8%, and 83.2%, respectively. The results showed that in scenario 8, when the abstraction rate increased by 146% and the recharge rate decreased to 94.4%, the maximum GW drawdown was 2.8 m from the starting level in 2010, and the maximum LS value was 220 mm (Figure 10a,b). In scenario 9, the abstraction rate increased to 193% while the recharge rate decreased to 88.8%, resulted in a maximum GW drawdown of 5.6 m from the starting levels in 2010, and the maximum LS value reached 440 mm (Figure 10c,d). For scenario 10, when the abstraction rate increased to 233% and the recharge rate decreased to 83.2%, the maximum GW drawdown was 8.5 m from the starting GW level in 2010, and the maximum LS value was 650 mm (Figure 10e,f). As shown in Figure 10, the groundwater drawdown is represented as concentric circles because of the intensive concentration of pumping wells in middle zone of the study area. In addition, the results indicated that the area with the highest LS rates is the core of the MND as shown in Figure 10.

4. Discussion

In this study, different scenarios were applied to the case study (MNDA) in order to predict the future behavior of LS in the ND. Land subsidence was predicted for both the current and future situations. By comparing the tested scenarios, it was clear that the minimum GW lowering obtained from scenario 2 with 0.36 m from the starting GW in 2010. While, the maximum GW lowering obtained from scenario 10 with 8.5 m from the starting GW in 2010 as shown in Figure 11a. Also, Figure 11b shows that the minimum LS value obtained from scenario 2 equals to 30 mm. While the maximum LS value obtained from scenario 10 equals to 650 mm. As a result of the previous scenarios, decreasing recharge rates to 94.4%, 88.2%, and 83.2% leads to increasing LS rates by 1.5 mm/y during the period of 2010–2070. Increasing abstraction rates to 146%, 193%, and 233% leads to increasing LS rates by (9 + 0.5) mm/y during the period of 2010–2070. Finally, the combination of increasing abstraction rates to 146%, 193%, and 233% and decreasing recharge rates to 94.4%, 88.2%, and 83.2%, respectively, leads to increasing LS rates by (10 + 0.5) mm/y during the period of 2010–2070.

5. Conclusions

Land subsidence is a serious phenomenon that is associated with aquifer system compaction. In this study, the GW flow model MODFLOW was merged with the analytical solution based on Terzaghi’s theory for assessing the land subsidence in the Nile Delta. Different scenarios of decreasing recharge, increasing abstraction, and the combination of the two were applied to estimate land subsidence in the MND. For the first case, the results showed that there is an obvious effect of decreasing recharge on LS in the MNDA. The maximum values of GW drawdown and land subsidence were 1.05 m, 90 mm, respectively, after 60 years since 2010 when the recharge rate decreased to 83.2%. For the second case, the results showed that there is an obvious effect of increasing abstraction on LS in the MNDA. The maximum values of GW drawdown and land subsidence were 7 m and 560 mm, respectively, after 60 years until 2010, when the abstraction rate increased to 233%. For the third stage, the results showed that there is an obvious drawdown in GW head due to combination of decreasing recharge and increasing abstraction that increased the LS in the MNDA. The maximum values of GW drawdown and land subsidence were 8.5 m and 650 mm, respectively, after 60 years, until 2010 when the recharge rate decreased to 83.2% and the abstraction rate increased to 233%. Additionally, the results showed that this stage is the most critical case. The results demonstrate that changing groundwater abstraction and recharge rates should be controlled to mitigate land subsidence and achieve proper management of GW resource. This study gave an insight to decision makers to consider the effect of changing the rates of groundwater pumping and recharge to groundwater aquifers to avoid more land subsidence which may damage many properties.

Author Contributions

Conceptualization, H.F.A.-E., B.S.A.-E., O.W. and I.A.-E.; methodology H.F.A.-E., B.S.A.-E., O.W. and I.A.-E.; validation, H.F.A.-E., B.S.A.-E., O.W. and I.A.-E.; formal analysis, H.F.A.-E., B.S.A.-E., O.W. and I.A.-E.; investigation; data curation; writing—original draft preparation, H.F.A.-E., B.S.A.-E., O.W. and I.A.-E.; writing—review and editing, H.F.A.-E., B.S.A.-E., O.W. and I.A.-E.; supervision, H.F.A.-E., B.S.A.-E., O.W. and I.A.-E.; project administration, M.Z.; funding acquisition, M.Z. All authors have read and agreed to the published version of the manuscript.

Funding

This research received no external funding.

Institutional Review Board Statement

Not applicable.

Informed Consent Statement

Not applicable.

Data Availability Statement

The data are not publicly available due to institutional property rights.

Acknowledgments

The authors are thankful to the Department of Water and Water Structures Engineering, Faculty of Engineering, Zagazig University, Zagazig 44519, Egypt, for constant support during the study. This work was supported by the Project of the Ministry of Education of the Slovak Republic VEGA 1/0308/20 Mitigation of Hydrological Hazards, Floods and Droughts by Exploring Extreme Hydroclimatic Phenomena in River Basins and Project HUSKROUA/1702/6.1/0072 Environmental Assessment for Natural Resources Revitalization in Solotvyno to Prevent the Further Pollution of the Upper-Tisza Basin Through the Preparation of a Complex Monitoring System. Thank you for support of NFP313010T578 and 055TUKE-4/2021 Scientific and educational centre of advanced GIS technologies with a focus on supporting the methods of combined and distance education.

Conflicts of Interest

The authors declare no conflict of interest.

References

  1. Gebremichael, E.; Sultan, M.; Becker, R.; El Bastawesy, M.; Cherif, O.; Emil, M. Assessing Land Deformation and Sea Encroachment in the Nile Delta: A Radar Interferometric and Inundation Modeling Approach. J. Geophys. Res. Solid Earth 2018, 123, 3208–3224. [Google Scholar] [CrossRef]
  2. Nations, U. Demographic Yearbook 2018; United Nations: New York, NY, USA, 2019. [Google Scholar]
  3. Rateb, A.; Abotalib, A.Z. Inferencing the land subsidence in the Nile Delta using Sentinel-1 satellites and GPS between 2015 and 2019. Sci. Total Environ. 2020, 729, 138868. [Google Scholar] [CrossRef] [PubMed]
  4. El-Raey, M. Impact of Climate Change on Egyp; Chapter 1: Water Resources; GAIA Case Study: Egypt, 2009; Available online: https://orca.cardiff.ac.uk/44506/3/ISOCARP_2009_Impact%20of%20Sea%20Level%20Rise%20on%20Egypt.pdf (accessed on 2 February 2022).
  5. Smajgl, A.; Toan, T.Q.; Nhan, D.K.; Ward, J.F.; Trung, N.H.; Tri, L.Q.; Tri, V.P.D.; Vu, P.T. Responding to rising sea levels in the Mekong Delta. Nat. Clim. Chang. 2015, 5, 167–174. [Google Scholar] [CrossRef]
  6. Stanley, J.-D.; Clemente, P.L. Increased Land Subsidence and Sea-Level Rise Are Submerging Egypt’s Nile Delta Coastal Margin. GSA Today 2017, 27, 4–11. [Google Scholar] [CrossRef] [Green Version]
  7. Hu, B.; Zhou, J.; Wang, J.; Chen, Z.; Wang, D.; Xu, S. Risk assessment of land subsidence at Tianjin coastal area in China. Environ. Earth Sci. 2009, 59, 269–276. [Google Scholar] [CrossRef]
  8. Stanley, D.J. Recent subsidence and northeast tilting of the Nile delta, Egypt. Mar. Geol. 1990, 94, 147–154. [Google Scholar] [CrossRef]
  9. Syvitski, J.P.M.; Vörösmarty, C.J.; Kettner, A.J.; Green, P. Impact of Humans on the Flux of Terrestrial Sediment to the Global Coastal Ocean. Science 2005, 308, 376–380. [Google Scholar] [CrossRef] [PubMed]
  10. Meshref, W.M. Tectonic framework. Geol. Egypt 1990, 8, 113–155. [Google Scholar]
  11. Galloway, D.L.; Hudnut, K.W.; Ingebritsen, S.E.; Phillips, S.P.; Peltzer, G.; Rogez, F.; Rosen, P.A. Detection of aquifer system compaction and land subsidence using interferometric synthetic aperture radar, Antelope Valley, Mojave Desert, California. Water Resour. Res. 1998, 34, 2573–2585. [Google Scholar] [CrossRef]
  12. Galloway, D.; Jones, D.R.; Ingebritsen, S.E. Land Subsidence in the United States; US Geological Survey: Reston, VA, USA, 1999; Volume 1182, p. 117.
  13. Castellazzi, P.; Arroyo-Domínguez, N.; Martel, R.; Calderhead, A.I.; Normand, J.C.L.; Gárfias, J.; Rivera, A. Land Subsidence in Major Cities of Central Mexico: Interpreting InSAR-Derived Land Subsidence Mapping with Hydrogeological Data. Int. J. Appl. Earth Obs. Geoinf. 2016, 47, 102–111. [Google Scholar] [CrossRef]
  14. Chaussard, E.; Wdowinski, S.; Cabral-Cano, E.; Amelung, F. Land subsidence in central Mexico detected by ALOS InSAR time-series. Remote Sens. Environ. 2014, 140, 94–106. [Google Scholar] [CrossRef]
  15. Hung, W.C.; Hwang, C.; Liou, J.C.; Lin, Y.S.; Yang, H.L. Modeling aquifer-system compactionand predicting land subsidence in central Taiwan. Eng. Geol. 2012, 147, 78–90. [Google Scholar] [CrossRef]
  16. Lin, P.-L.; Hsu, K.-C.; Lin, C.-W.; Hwung, H.-H. Modeling compaction of multi-layer-aquifer system due to groundwater withdrawal. Eng. Geol. 2015, 187, 143–155. [Google Scholar] [CrossRef]
  17. Terzaghi, K. Erdbaumechanik Auf Bodenphisikalischer Grundlage; Franz Deuticken: Vienna, Austria, 1925. [Google Scholar]
  18. Minderhoud, P.S.J.; Erkens, G.; Pham, V.H.; Bui, V.T.; Erban, L.; Kooi, H.; Stouthamer, E. Impacts of 25 years of groundwater extraction on subsidence in the Mekong delta, Vietnam. Environ. Res. Lett. 2017, 12, 064006. [Google Scholar] [CrossRef]
  19. Aly, M.H.; Zebker, H.A.; Giardino, J.R.; Klein, A.G. Permanent Scatterer investigation of land subsidence in Greater Cairo, Egypt. Geophys. J. Int. 2009, 178, 1238–1245. [Google Scholar] [CrossRef] [Green Version]
  20. Aly, M.H.; Klein, A.G.; Zebker, H.A.; Giardino, J.R. Land subsidence in the Nile Delta of Egypt observed by persistent scatterer interferometry. Remote Sens. Lett. 2012, 3, 621–630. [Google Scholar] [CrossRef]
  21. Wöppelmann, G.; Le Cozannet, G.; de Michele, M.; Raucoules, D.; Cazenave, A.; Garcin, M.; Hanson, S.; Marcos, M.; Santamaría-Gómez, A. Is land subsidence increasing the exposure to sea level rise in Alexandria, Egypt. Geophys. Res. Lett. 2013, 40, 2953–2957. [Google Scholar] [CrossRef] [Green Version]
  22. Saleh, M.; Becker, M. New estimation of Nile Delta subsidence rates from InSAR and GPS analysis. Environ. Earth Sci. 2019, 78, 6. [Google Scholar] [CrossRef]
  23. Sarychikhina, O.; Glowacka, E. Spatio-temporal evolution of aseismic ground deformation in the Mexicali Valley (Baja California, Mexico) from 1993 to 2010, using differential SAR interferometry. In International Association of Hydrological Sciences; Copernicus GmbH: Wallingford, UK, 2015; pp. 335–341. [Google Scholar]
  24. Fiaschi, S.; Wdowinski, S. Local land subsidence in Miami Beach (FL) and Norfolk (VA) and its contribution to flooding hazard in coastal communities along the U.S. Atlantic coast. Ocean Coast. Manag. 2019, 187, 105078. [Google Scholar] [CrossRef]
  25. Burbey, T. The influence of faults in basin-fill deposits on land subsidence, Las Vegas Valley, Nevada, USA. Hydrogeol. J. 2002, 10, 525–538. [Google Scholar] [CrossRef]
  26. Larson, K.J.; Basagaoglu, H.; Marino, M.A. Prediction of optimal safe ground wateryield and land subsidence in the Los Banos–Kettleman City area, California, using a calibrated numerical simulation model. J. Hydrol. 2001, 242, 79–102. [Google Scholar] [CrossRef]
  27. Teatini, P.; Ferronato, M.; Gambolati, G.; Gonella, M. Groundwater pumping andland subsidence in the Emilia-Romagna coastland, Italy: Modeling the past occurrence and the future trend. Water Res. 2006, 42, W01406. [Google Scholar] [CrossRef]
  28. Shi, X.; Fang, R.; Wu, J.; Xu, H.; Sun, Y.; Yu, J. Sustainable development and utilization of groundwater resources considering land subsidence in Suzhou, China. Eng. Geol. 2012, 124, 77–89. [Google Scholar] [CrossRef]
  29. Zhang, Y.; Xue, Y.Q.; Wu, J.C.; Ye, S.J.; Wei, Z.X.; Li, Q.F.; Yu, J. Characteristic of aquifer system deformation in the Southern Yangtze Delta, China. Eng. Geol. 2007, 90, 160–173. [Google Scholar] [CrossRef]
  30. Yilong, Y.; Tianfu, X.; Xin, X.; Yingli, X.; Bing, L. Mechanical stability analysis of strata and wellbore associated with gas production from oceanic hydrate-bearing sediments by depressurization. Chin. J. Theor. Appl. Mech. 2020, 52, 544–555. [Google Scholar]
  31. Kiryukhin, A.V.; Rutqvist, J.; Maguskin, M.A. Modeling of the vertical deformations during exploitation of the Mutnovsky geothermal field, Kamchatka. In Proceedings of the World Geothermal Congress 2015, Melbourne, Australia, 16–24 April 2015. [Google Scholar]
  32. Shen, S.-L.; Xu, Y.-S. Numerical evaluation of land subsidence induced by groundwater pumping in Shanghai. Can. Geotech. J. 2011, 48, 1378–1392. [Google Scholar] [CrossRef]
  33. Abd-Elhamid, H.F.; Wahid, O.; Abd-Elaty, I.; Abdelkader, B.S. Numerical analysis to assess the impacts of changing groundwater levels on land subsidence. In Proceedings of the Twenty-Second International Water Technology Conference, IWTC22, Ismailia, Egypt, 12–13 September 2019; pp. 555–561. [Google Scholar]
  34. Diab, M.S.; Dahab, K.; El Fakharany, M. Impacts of the paleohydrological conditions on the groundwater quality in the northern part of Nile Delta, The geological society of Egypt. Geol. J. B 1997, 4112, 779–795. [Google Scholar]
  35. RIGW. Hydrogeological Map of Nile Delta, Scale 1:500,000, 1st ed.; MWRI Publishing Unit: Cairo, Egypt, 1992.
  36. Morsy, W.S. Environmental Management to Groundwater Resources for Nile Delta Region. Ph.D. Thesis, Faculty of Engineering, Cairo University, Cairo, Egypt, 2009. [Google Scholar]
  37. RIGW. Nile Delta Groundwater Modeling Report; Research Inst. For Groundwater: Kanater El-Khairia, Egypt, 2002.
  38. Sherif, M.; Sefelnasr, A.; Javadi, A. Incorporating the concept of equivalent freshwater head in successive horizontal simulations of seawater intrusion in the Nile Delta aquifer, Egypt. J. Hydrol. 2012, 464–465, 186–198. [Google Scholar] [CrossRef]
  39. Sakr, S.A. Impact of the possible sea level rise on the Nile Delta aquifer. In A Study for Lake Nasser Flood and Drought Control Project (LNFDC/ICC); Planning Sector, Ministry of Water Resources and Irrigation: Cairo, Egypt, 2005. [Google Scholar]
  40. EEAA. Egypt Second National Communication under the United Nations Framework Convention on Climate Change (UNFCCC); Egyptian Environmental Affairs Agency, Ministry of State for Environmental Affairs: Cairo, Egypt, 2010.
  41. WMRI-NWRC. Unpublished Report under the Matching Supply and Demand Project; Water Management Research Institute, National Water Research Center, Ministry of Water Resources and Irrigation: Cairo, Egypt, 2002.
  42. Hereher, M.E. Vulnerability of the Nile Delta to sea level rise: An assessment using remote sensing. Geomat. Nat. Hazards Risk 2010, 1, 315–321. [Google Scholar] [CrossRef]
  43. Egypt Population 2021 (Live). Egypt Population 2021 (Demographics, Maps, Graphs). (n.d.). Available online: https://worldpopulationreview.com/countries/egypt-population (accessed on 3 November 2021).
  44. Mabrouk, M.B.; Jonoski, A.; Solomatine, D.; Uhlenbrook, S. A review of seawater intrusion in the Nile Delta groundwater system—The basis for assessing impacts due to climate changes and water resources development. Hydrol. Earth Syst. Sci. Discuss. 2013, 10, 10873–10911. [Google Scholar]
  45. Abd-Elaty, I.; Saleh, O.K.; Ghanayem, H.M.; Grischek, T.; Zelenakova, M. Assessment of hydrological, geohydraulic and operational conditions at a riverbank filtration site at Embaba, Cairo using flow and transport modeling. J. Hydrol. Reg. Stud. 2021, 37, 100900. [Google Scholar] [CrossRef]
  46. Abd-Elaty, I.; Zeleňáková, M.; Krajníková, K.; Abd-Elhamid, H. Analytical Solution of Saltwater Intrusion in Costal Aquifers Considering Climate Changes and Different Boundary Conditions. Water 2021, 13, 995. [Google Scholar] [CrossRef]
  47. Strzepek, K.; Yates, D.; Yohe, G.; Tol, R.; Mader, N. Constructing not implausible Climate and Economicscenarios for Egypt. Integr. Assess. 2001, 2, 139–157. [Google Scholar] [CrossRef]
  48. Terzaghi, K. Theoretical Soil Mechanics; Wiley: New York, NY, USA, 1943. [Google Scholar]
  49. Anderson, M.P.; Woessner, W.W. Applied Groundwater Modeling: Simulation of Flow and Advection Transport; Academic Press: San Diego, CA, USA; New York, NY, USA; Boston, MA, USA, 1992; p. 318. [Google Scholar]
  50. McDonald, M.G.; Harbaugh, A.W. A Modular Three-Dimensional Finite-Difference Ground-Water Flow Model; US Geological Survey: Reston, VA, USA, 1988. Available online: https://pubs.er.usgs.gov/publication/ofr83875 (accessed on 10 October 2021).
  51. Abdelaty, I.M.; Abd-Elhamid, H.F.; Fahmy, M.R.; Abdelaal, G.M. Study climate changes and its impact on groundwater system in Nile Delta Aquifer. Egypt. Int. J. Eng. Sci. Technol. 2014, 17, 2061–2079. [Google Scholar]
  52. Abd-Elaty, I.; Javadi, A.A.; Abd-Elhamid, H. Management of saltwater intrusion in coastal aquifers using different wells systems: A case study of the Nile Delta aquifer in Egypt. Hydrogeol. J. 2021, 29, 1767–1783. [Google Scholar] [CrossRef]
Figure 2. (a) Egyptian population growth [43] and (b) The annual abstraction rates in MNDA [44].
Water 14 01096 g002
Figure 3. Model domain for MNDA, (a) model grid (white color indicates the active domain of middle Nile Delta area and dark gray indicates the inactive domain), (b) cross section in Y-direction, and (c) cross section in X-direction.
Water 14 01096 g003
Figure 4. (a) Model boundary condition and (b) distribution of abstraction wells in MNDA.
Water 14 01096 g004
Figure 5. The distribution of observation wells in the MNDA.
Water 14 01096 g005
Figure 6. (a) Model calibration for calculated and observed heads in m above MSL, (b) model verification for calculated and observed heads in m above MSL.
Water 14 01096 g006
Figure 7. Model calibration results (a) land subsidence map in (mm), (b) cross section (Y-Y) of LS.
Water 14 01096 g007
Figure 8. Results of drawdown in (m) and Land subsidence in (mm) in the MND due to decreasing recharge. (a) GW drawdown during 2010 to 2030, (b) LS during 2010 to 2030, (c) GW drawdown during 2010 to 2050, (d) LS during 2010 to 2050, (e) GW drawdown during 2010 to 2070 (f) LS during 2010 to 2070.
Water 14 01096 g008aWater 14 01096 g008b
Figure 9. Results of drawdown in (m) and Land subsidence in (mm) in the MND due to increasing abstraction (a) GW drawdown during 2010 to 2030, (b) LS during 2010 to 2030, (c) GW drawdown during 2010 to 2050, (d) LS during 2010 to 2050, (e) GW drawdown during 2010 to 2070, (f) LS during 2010 to 2070.
Water 14 01096 g009aWater 14 01096 g009b
Figure 10. Results of drawdown in (m) and Land subsidence in (mm) in the MND due to combination of increasing abstraction and decreasing recharge. (a) GW drawdown during 2010 to 2030, (b) LS during 2010 to 2030, (c) GW drawdown during 2010 to 2050, (d) LS during 2010 to 2050, (e) GW drawdown during 2010 to 2070, (f) LS during 2010 to 2070.
Water 14 01096 g010aWater 14 01096 g010b
Figure 11. Comparison between the results of different scenarios (a) Maximum drawdown in (m) for different scenarios, (b) maximum land subsidence in (mm) for different scenarios.
Water 14 01096 g011
Table 1. Proposed scenarios of different GW abstraction and surface recharge rates.
StageScenarios No.YearAbstractionRecharge
Values (BCM.yr−1)Rates (%)Values (BCM.yr−1)Rates (%)
Base Case120100.811001.4100
Decreasing Recharge220300.811001.3294.4
320501.2488.8
420701.1683.2
Increasing Abstraction520301.181461.4100
620501.56193
720701.89233
Combination820301.181461.3294.4
920501.561931.2488.8
1020701.892331.1683.2
Table 2. Result of model calibration for calculated and observed heads.
WellCalculated Head (m)Observed Head (m)Difference(m)
1/A1.4210.42
2/A1.892.3−0.41
3/A1.562−0.44
4/A2.483−0.52
5/A3.973.70.27
6/A4.84.20.6
7/A4.184.6−0.42
8/A3.974.4−0.43
9/A5.965.40.56
10/A7.136.60.53
11/A8.538.30.23
12/A8.699.1−0.41
13/A9.9610.4−0.44
14/A10.6710.10.57
15/A10.129.60.52
16/A11.2210.90.32
17/A11.0111.6−0.59
18/A11.5812.1−0.52
19/A11.9411.50.44
20/A14.1615−0.84
21/A14.614.10.5
22/A14.9815.4−0.42
23/A15.5316−0.47
24/A15.64150.64
Table 3. Result of calibrated hydraulic parameters.
Layer No.Layer TypeLayer Thickness (m above MSL)Hydraulic Conductivity (m/Day)Storage CoefficientSpecific YieldEffective
Porosity
KhKvSS (-)Sy (1/m)neff (%)
Initial parameters1Clay13.2 to −420.10–0.250.01–0.02510−350–6050–60
2–5Fine sand with lenses of clay1.1 to −3985–200.5–25 × 10−33030
6–9Coarse sand quaternary−103.2 to −757.620–752–7.52.5 × 10−32525
10–11Graded sand and gravel−218 to −93975–1007.5–105 × 10−42020
Calibrated
parameters
1Clay13.2 to −420.15–0.350.015–0.0350.6 × 10−350–6050–60
2–5Fine sand with lenses of clay1.1 to −39825–402.5–46.5 × 10−33030
6–9Coarse sand
quaternary
−103.2 to −757.640–1304–133 × 10−32525
10–11Graded sand and gravel−218 to −939130–15013–152 × 10−42020
Table 4. Land subsidence model calibration scenario.
Year20102016
Population (Million)82.294.4
Abstraction rate (BCM/Year)4.97
% Abstraction rate100%142%
Publisher’s Note: MDPI stays neutral with regard to jurisdictional claims in published maps and institutional affiliations.

