Article

A GIS-Based Method for Identification of Blindness in Former Site Selection of Sewage Treatment Plants and Exploration of Optimal Siting Areas: A Case Study in Liao River Basin

1
Key Laboratory of Groundwater Resources and Environment, China’s Ministry of Education, Jilin University, Changchun 130021, China
2
Jilin Provincial Key Laboratory of Water Resources and Environment, Jilin University, Changchun 130021, China
3
College of New Energy and Environment, Jilin University, Changchun 130012, China
*
Author to whom correspondence should be addressed.
Water 2022, 14(7), 1092; https://doi.org/10.3390/w14071092
Submission received: 16 February 2022 / Revised: 24 March 2022 / Accepted: 24 March 2022 / Published: 30 March 2022

Abstract

:
With regard to environmental facilities, blindness and the subjectivity of site selection lead to serious economic, engineering and social problems. A proper siting proposal often poses a challenge to local governments, as multiple factors should be considered, such as costs, construction conditions and social impact. How to make the optimal siting decision has become a topical issue in academic circles. In order to enrich the framework of site selection models, this study combined GIS, AHP and Remote Sensing (RS) technologies to conduct siting suitability analysis of sewage treatment plants, and it was first applied in the Liao River basin in Jilin Province in China. The enriched model is able to reveal blindness in the former site selection of sewage treatment plants and explore optimal siting areas, involving an effective quantification method for summer dominant wind direction and urban stream direction. In a case study, it was found that local governments need to be cautious of the distance of sites from rivers and residential areas and the impact of these sites on downwind and downstream residents. Additionally, siting suitability has obvious regional characteristics, and its distribution varies significantly between towns. Huaide Town shows the largest optimal siting areas and can be given priority for the construction of new sewage treatment plants. This paper developed a more scientific approach to site selection, and the outcome can provide a robust reference for local governments.

1. Introduction

The urbanization of town areas will inevitably cause environmental pollution [1], as the expansion of environmental facilities is far behind the production of industrial, agricultural and domestic wastes [2]. In 2015, over 30% of the population still lacked effective sewage treatment facilities, especially in the town areas of developing countries [3]. When promoting water pollution treatment projects, local governments encounter site selection challenges for environmental facilities. Multiple factors should be considered, such as costs, construction conditions and social impact. A reasonable layout can meet the requirements of relevant laws and regulations, and realize sewage collection and treatment at low costs [4]. Conversely, an improper site selection decision will hinder the process of water pollution control projects due to high overall investment (e.g., difficult construction and high cost of pipe networks). Even worse, it may lead to the closure of sewage treatment facilities, such as Sanya Xincheng Sewage Treatment Plant and Shenyang Jinjiawan Sewage Treatment Plant, which were closed as they had serious impacts on local residents, i.e., causing visual, odor and downstream water pollution. This issue has drawn increasingly more researchers’ attention, reflected by the growing quantity of site selection papers from 2008 to 2018 [5]. Note that there are a growing number of sewage treatment facilities oriented to chemical or thermal recovery in developed countries, such as the Netherlands and Finland [6]. However, sewage treatment plants tend to be regarded as disposal facilities in China, as the national reclamation rate is less than one-tenth of wastewater, and energy recovery is even less common [7], except for in key cities, such as Beijing. Hence, the authors omitted indicators relating to resource recovery in this study, under the scope of the Liao River basin in Northeast China.
The methodology of site selection can be roughly divided into two categories: one is the spatial overlay analysis method based on Geographic Information System (GIS) technology [8] and the other is the multi-objective optimization method based on heuristic algorithms [9,10]. The former was mainly applied in this study, as it is able to analyze the trade-offs between many factors and then visualize them; however, constraint equations in an optimization model cannot reveal factors intuitively. As mentioned, GIS technology has the advantage of digitizing the spatial information of regions, providing a scientific basis for planning and decision making [11]. Recently, a GIS-based site selection model was applied to siting suitability analysis of waste disposal sites [12,13,14,15], power plants [16,17,18,19] and hospitals [20,21,22,23]. With regard to sewage treatment facilities, some scholars applied GIS-based technology and presented their siting results. Gemitzi et al. [24] calculated the required area of stabilization ponds according to urban population, temperature and sewage discharge standards, and then they analyzed whether there was enough optional area in the urban area to build them. Considering soil and groundwater pollution, Shabou et al. [25] selected appropriate locations to build evaporation ponds for olive mill wastewater management. Anagnostopoulos and Vavatsikos [26] combined the fuzzy Analytic Hierarchy Process (AHP) method to conduct site suitability analysis of natural treatment technologies in northeastern Greece. Nigusse et al. [2] considered the distance between roads and rivers, sewage pipe networks, soil depth, etc., and provided the site selection decision for stabilization ponds in cities. However, there are few studies on the site selection of sewage treatment plants. Many existing papers did not reveal the blindness in the former site selection of facilities in their study areas, so targeted policy implications may not have been well provided. Additionally, they did not verify the accuracy and applicability of the site selection models used, possibly leading to misleading or unpractical results [27]. Some indicators, i.e., summer dominant wind direction and urban stream direction, are difficult to quantify and visualize using GIS technology.
To fill the above research gaps, this study combined GIS, Remote Sensing (RS) and the AHP method together to construct a site selection model for siting suitability analysis of sewage treatment plants, exploring an effective quantification method for summer dominant wind direction and urban stream direction. In addition, the accuracy and applicability of this model were subsequently demonstrated using location assessment of existing sewage treatment plants and satellite image analysis in the study area. This paper can enrich the framework of site selection models, making them more scientific and effective. In terms of practical significance, this model was first applied to the Liao River basin in Jilin Province, aiming to reveal possible blindness in former site selection processes and explore future optimal siting areas. Many towns in this basin lack sewage treatment facilities, which has led to ecological and environmental pollution in the water body. This paper can provide technical support and a robust reference for local governments to make future siting decisions, which can also be applied as a decision-making framework for site selection analysis in other industries.

2. Methodology

This section introduces the process of establishing a GIS-based site selection model for sewage treatment plants, which was applied to the study area with some supplements and adjustments.

2.1. Geospatial Database

2.1.1. A Set of Criteria and Indicators

In this study, the frequently used indicators in previous site selection studies were taken as the reference for this model, where the indicator system was divided into restricted indicators (IR) and selective indicators (IS) [28]. Restricted indicators, called constraint or exclusion indicators in some papers [5], were used to classify restricted areas where construction was not allowed according to laws, regulations, experience, etc., as sewage treatment plants would seriously affect the local environment and society. Selective indicators were composed of three criteria, namely, economic cost (C1), construction conditions (C2) and social impact (C3), which were key factors used to optimize selective areas [27], reflecting the degree of meeting the target expectation. The above restricted and selective areas can be used for spatial overlay analysis to create siting suitability maps [29], as shown in Figure 1.
With regard to buffer indicators, this study mainly designed restricted areas of roads (IR1), rivers (IR2), water sources (IR3), lakes (IR4), residential areas (IR7) and built-up areas (IR8) in order to avoid the serious environmental and social impact of sewage treatment plants [30]. In addition, considering the cost of transporting residual sludge and building a new pipe network [31], plants should keep a relatively close distance to the nearest road (IS1) and river (IS2), which were listed in the criterion of economic cost (C1). The selective indicator of distance from residential area (IS7) was listed in the criterion of social impact (C3). These distances above should be neither too far nor too close; somewhere in the middle works best.
For slope indicators (IR5, IS4), a large slope will cause difficulties to construction, earth excavation and subsequent transport [26]. An area with a slope greater than a certain value was regarded as terrain slope restriction (IR5), while others were selective areas (IS4), where the smaller the slope, the more it met the decision expectation [32]. For soil texture indicators (IR6, IS6), soil texture was divided into sand, silt and clay. Because sand and silt cannot bear the foundations well, the area with a low ratio of clay to the other two substances was regarded as soil texture restriction (IR6), while the others were selective areas (IS6), where the higher the clay ratio, the more it met the decision expectation. The above two selective indicators (IS4, IS6) were listed in the criterion of construction conditions (C2), and the rest of this criterion was land-use type (IS5), related to construction difficulty [30].
The remaining selective indicators were pipe network coverage (IS3), dominant wind direction (IS8) and urban stream direction (IS9). The first indicator was listed in the economic cost (C1) criterion, and the second and third indicators were listed in the social impact (C3) criterion. Different from other indicators, these three indicators only have applicability in developed urban areas. This model needed to artificially divide urban areas of administrative zones above town level, as these areas have a large population density with a certain degree of pipe network coverage (IS3), while other areas, such as village-level administrative zones and non-residential areas, have almost no pipe network. Similarly, odor pollution and sewage outlet pollution from sewage treatment plants through dominant wind direction (IS8) and urban stream direction (IS9) only have a significant effect on residents living downwind or downstream of those areas and have little impact on other areas with a low population density.

2.1.2. Data Preprocessing

After collecting relevant hydrology, topography and other data, the authors needed to process and sort out the above data on the ArcGIS platform due to the inconsistency of original data sources with different formats [33]. Firstly, the data were projected into the same projection coordinate system and then were clipped and unified to the scope of the study area. Due to the different levels of accuracy of each data source, spatial correction and geographical registration were applied to make the error between each layer within tens of meters. Before the overlay operation between layers, they were converted into a raster format to store the indicator value information. Finally, raster source data were uniformly divided into 30 m × 30 m cells. In this case, the practical application effect is ideal from two aspects of accuracy and operational efficiency.

2.2. Indicator Quantification

With regard to restricted indicators, the attribute value of the cell was quantified as the Boolean value (0 or 1). V k ( I R i ) represents the Boolean value of the kth cell in the ith restricted indicator layer. If the value is 0, then this cell is regarded as the restricted area; otherwise, it is the selective area.
For buffer restricted indicators (IR1, IR2, IR3, IR4, IR7, IR8), the attribute value of the kth cell ( F k ) represents the nearest distance of this cell to a specific subject (road, water body, residential area, etc.), as shown in Table 1. Then, thresholds can be set for the indicators. Taking road restriction (IR1) as an example, if the distance from the kth cell to the nearest road (i.e., attribute value F k ) is less than the threshold, then the Boolean value of this cell ( V k ( I R i ) ) is 0; otherwise, it is 1. Note that the indicator of built-up area restriction (IR8) should only be considered when proposing building a sewage treatment plant; it is not considered when evaluating the location of an existing sewage treatment plant. Because the location will be classified as a built-up area by the model, the Boolean value of the cell ( V k ( I R 8 ) ) in this location is 0, making the evaluation result meaningless.
For the indicator of terrain slope restriction (IR5), the attribute value of the kth cell ( F k ) represents the slope on this cell. If the slope of the kth cell (i.e., attribute value F k ) is higher than a certain threshold, then the Boolean value of this cell ( V k ( I R 5 ) ) is 0; otherwise, it is 1. For the indicator of soil texture restriction (IR6), F k represents the weighted value of the proportion of sand, silt and clay in the kth cell, where the weighting method should be determined according to the study area, and then F k can be quantified as F ˜ k by the following equation:
F ˜ k = { 0 F k < F a , F k > F c F k F a F b F a F a F k F b F c F k F c F b F b F k F c
where F ˜ k [ 0 ,   1 ] , and the parameters Fa, Fb and Fc can be determined according to indicator characteristics of the study area. If the quantified attribute value ( F ˜ k ) of the kth cell is lower than a certain threshold, then the Boolean value of this cell ( V k ( I R 6 ) ) is 0; otherwise, it is 1.
With regard to selective indicators, the attribute value of the cell was quantified as the indicator value (from 0 to 1). V k ( I S j ) represents the indicator value of the kth cell in the jth selective indicator layer, reflecting the siting suitability of a sewage treatment plant, where the larger the index value, the more it conforms to the decision expectation.
For some of the selective indicators (IS1, IS2, IS4, IS6, IS7), the attribute value of the kth cell ( F k ) should be quantified as F ˜ k using Equation (1), where F ˜ k [ 0 ,   1 ] , representing the indicator value of the kth cell ( V k ( I S ) ). For the indicator of land-use type (IS5), V k ( I S 5 ) is related to the land-use type (e.g., grassland, water bodies), where the kth cell is located. The value should be assigned according to construction difficulty of building a sewage treatment plant at this location. Finally, the remaining selective indicators (IS3, IS8, IS9) need to be quantitatively analyzed in divided urban areas with a high population density.
After quantifying all the above indicators on the ArcGIS platform, the indicator value or Boolean value distribution map of each indicator layer can be drawn for later spatial overlay analysis.

2.3. AHP Method

Before the spatial overlay analysis, the weight of each selective index was determined based on the AHP method. This method was proposed by the famous American operations researcher Saaty [34], making decision making clearer. It has gained a high degree of popularity and has been widely used due to its understandability in theory and simplicity in application and the robustness of its outcomes [5]. Based on expert opinions, the pairwise comparison matrix (CM) of indicators can be constructed as follows:
M = [ a i j ] n × n = I 1 I 2 I n I 1 1 a 12 a 1 n I 2 1 / a 12 1 a 2 n I n 1 / a 1 n 1 / a 2 n 1
where aij represents the degree of importance of Ii relative to Ij, ranging from 1 (indifference or equal importance) to 9 (extreme preference or absolute importance), while 1/aij represents the degree of importance of Ij relative to Ii.
By calculating the maximum eigenvalue ( λ m a x ) and the corresponding eigenvector of the matrix based on the MATLAB platform, the weights of the indicators ( w j ) can be determined. Finally, a consistency check of the matrix should be carried out according to the Consistency Index (CI) and Consistency Ratio (CR) as follows:
C I = λ m a x n n 1
C R = C I R I
where n represents the order of the matrix, and the Random Average Index (RI) of the third-order matrix is 0.58 [34]. If C R 0.1 , the comparison matrix is verified to be consistent; otherwise, it needs to be readjusted until it passes the consistency check.

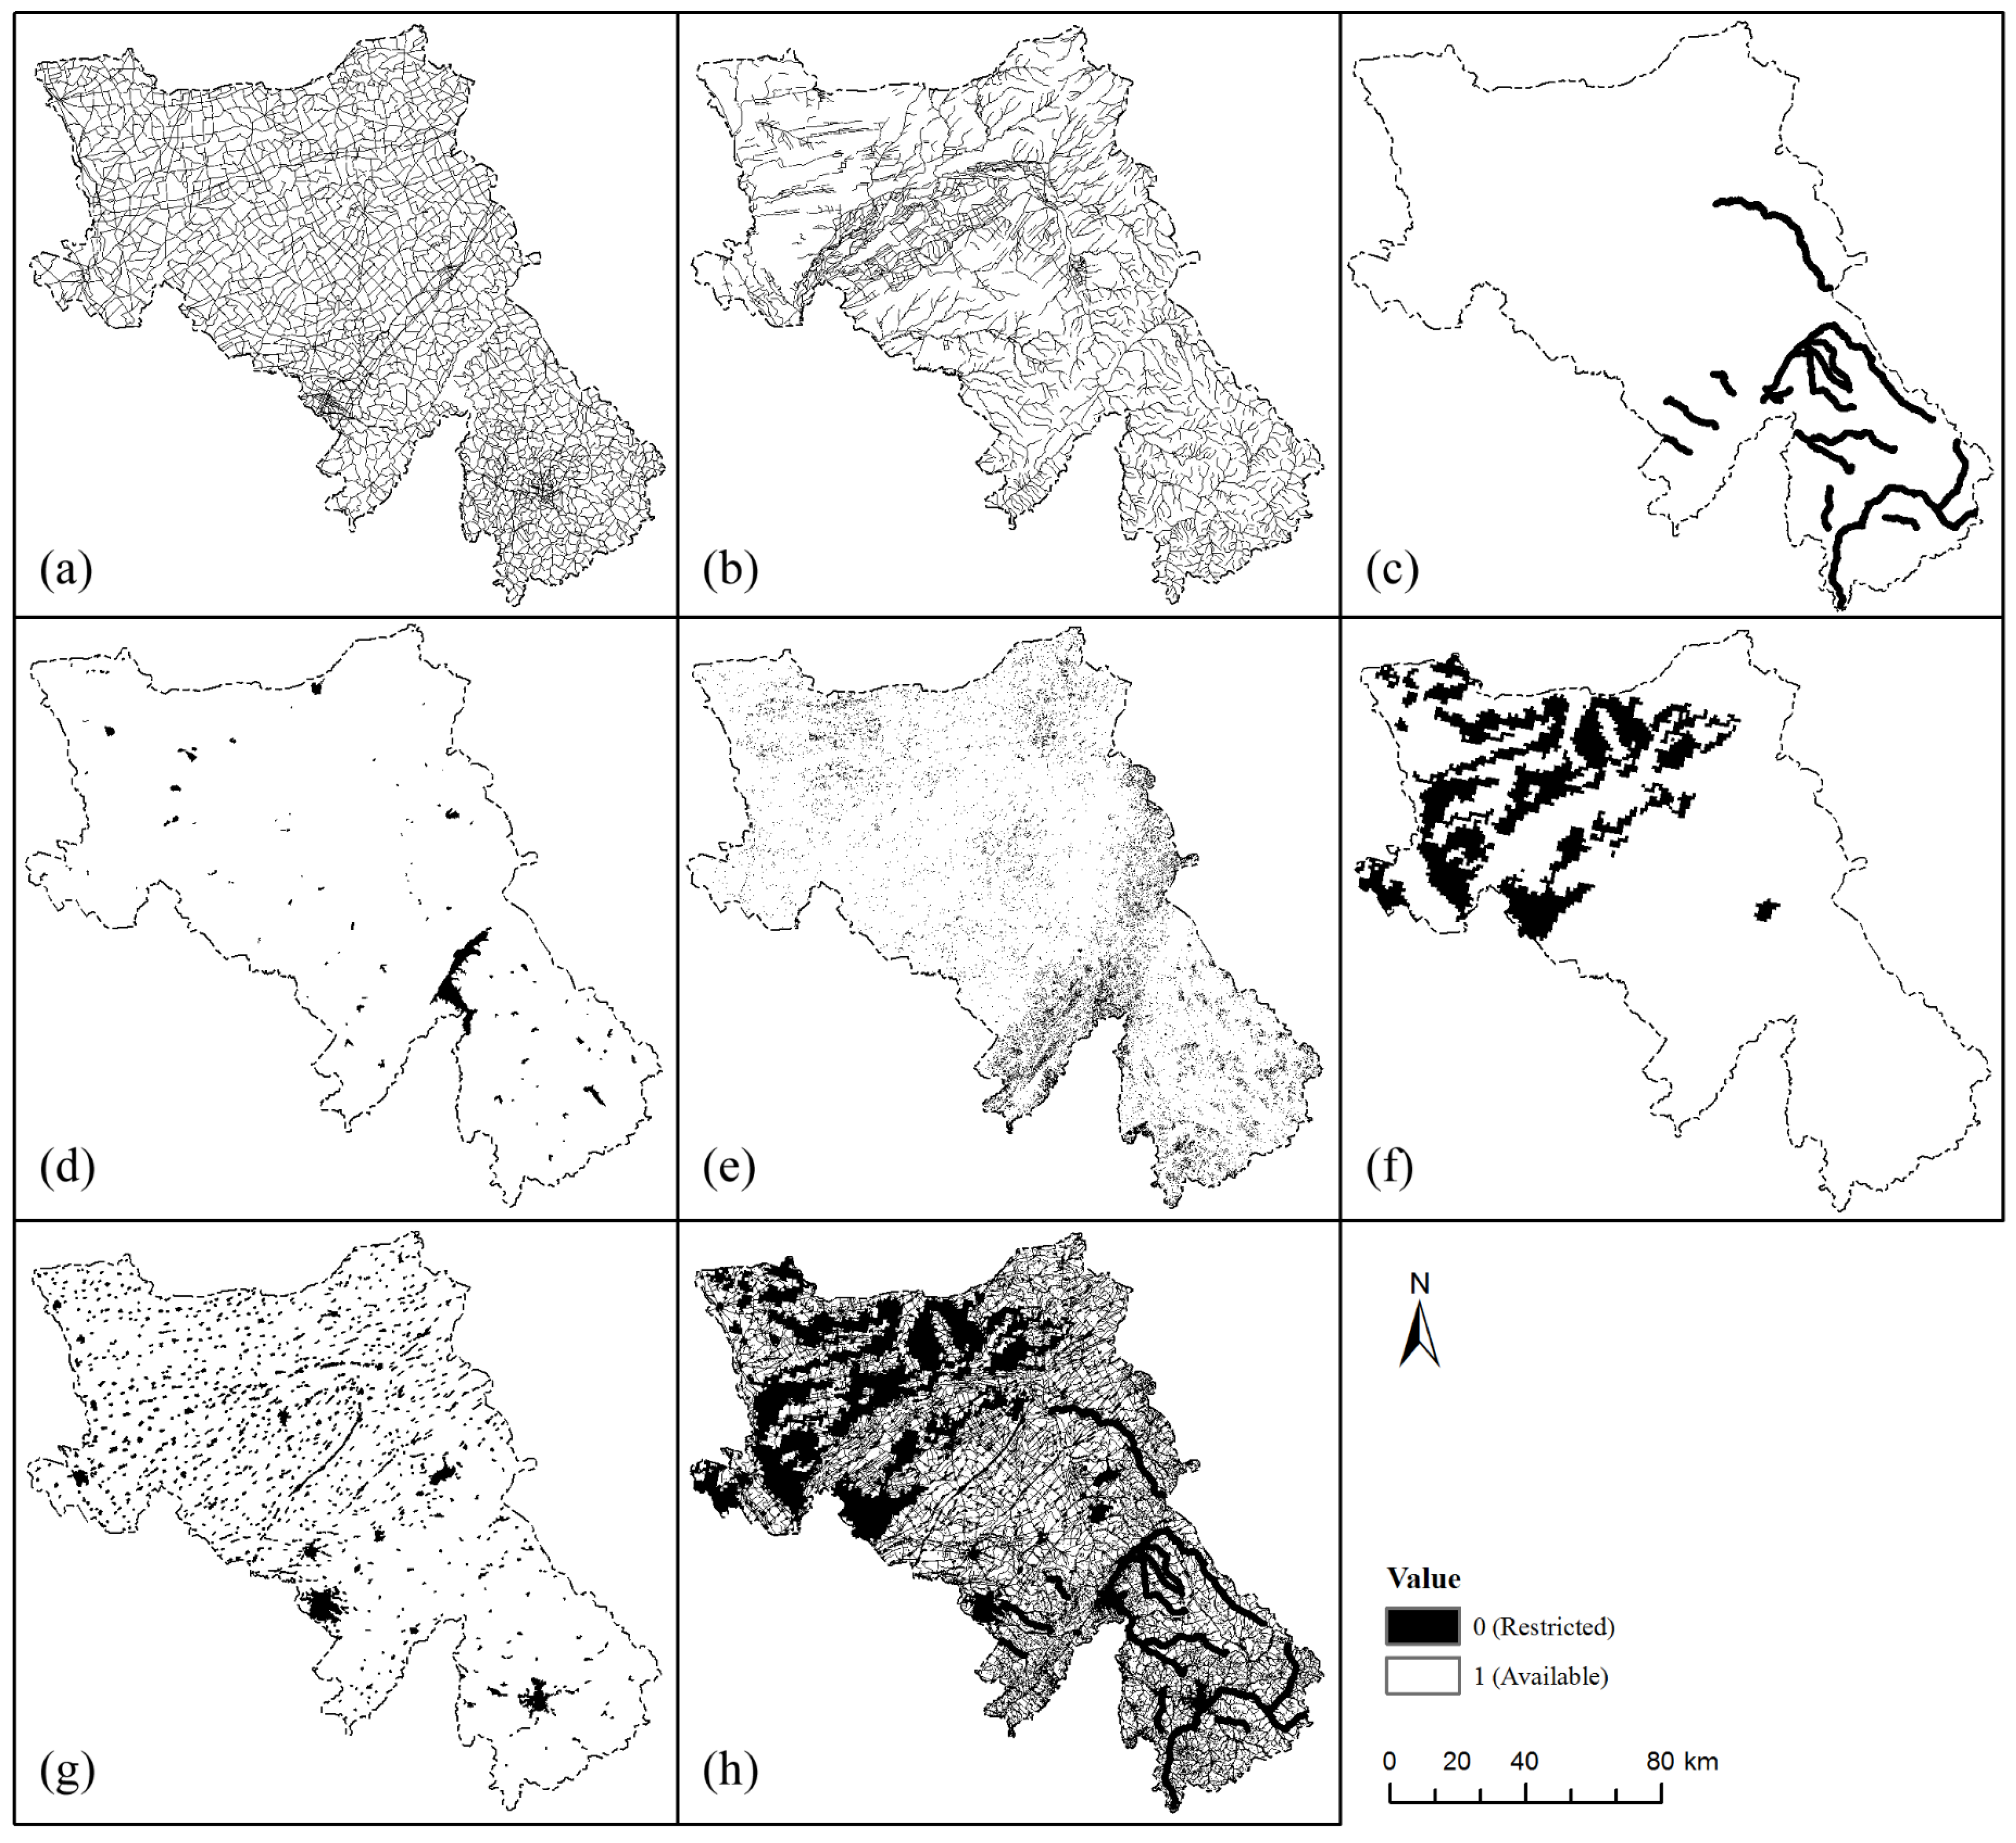
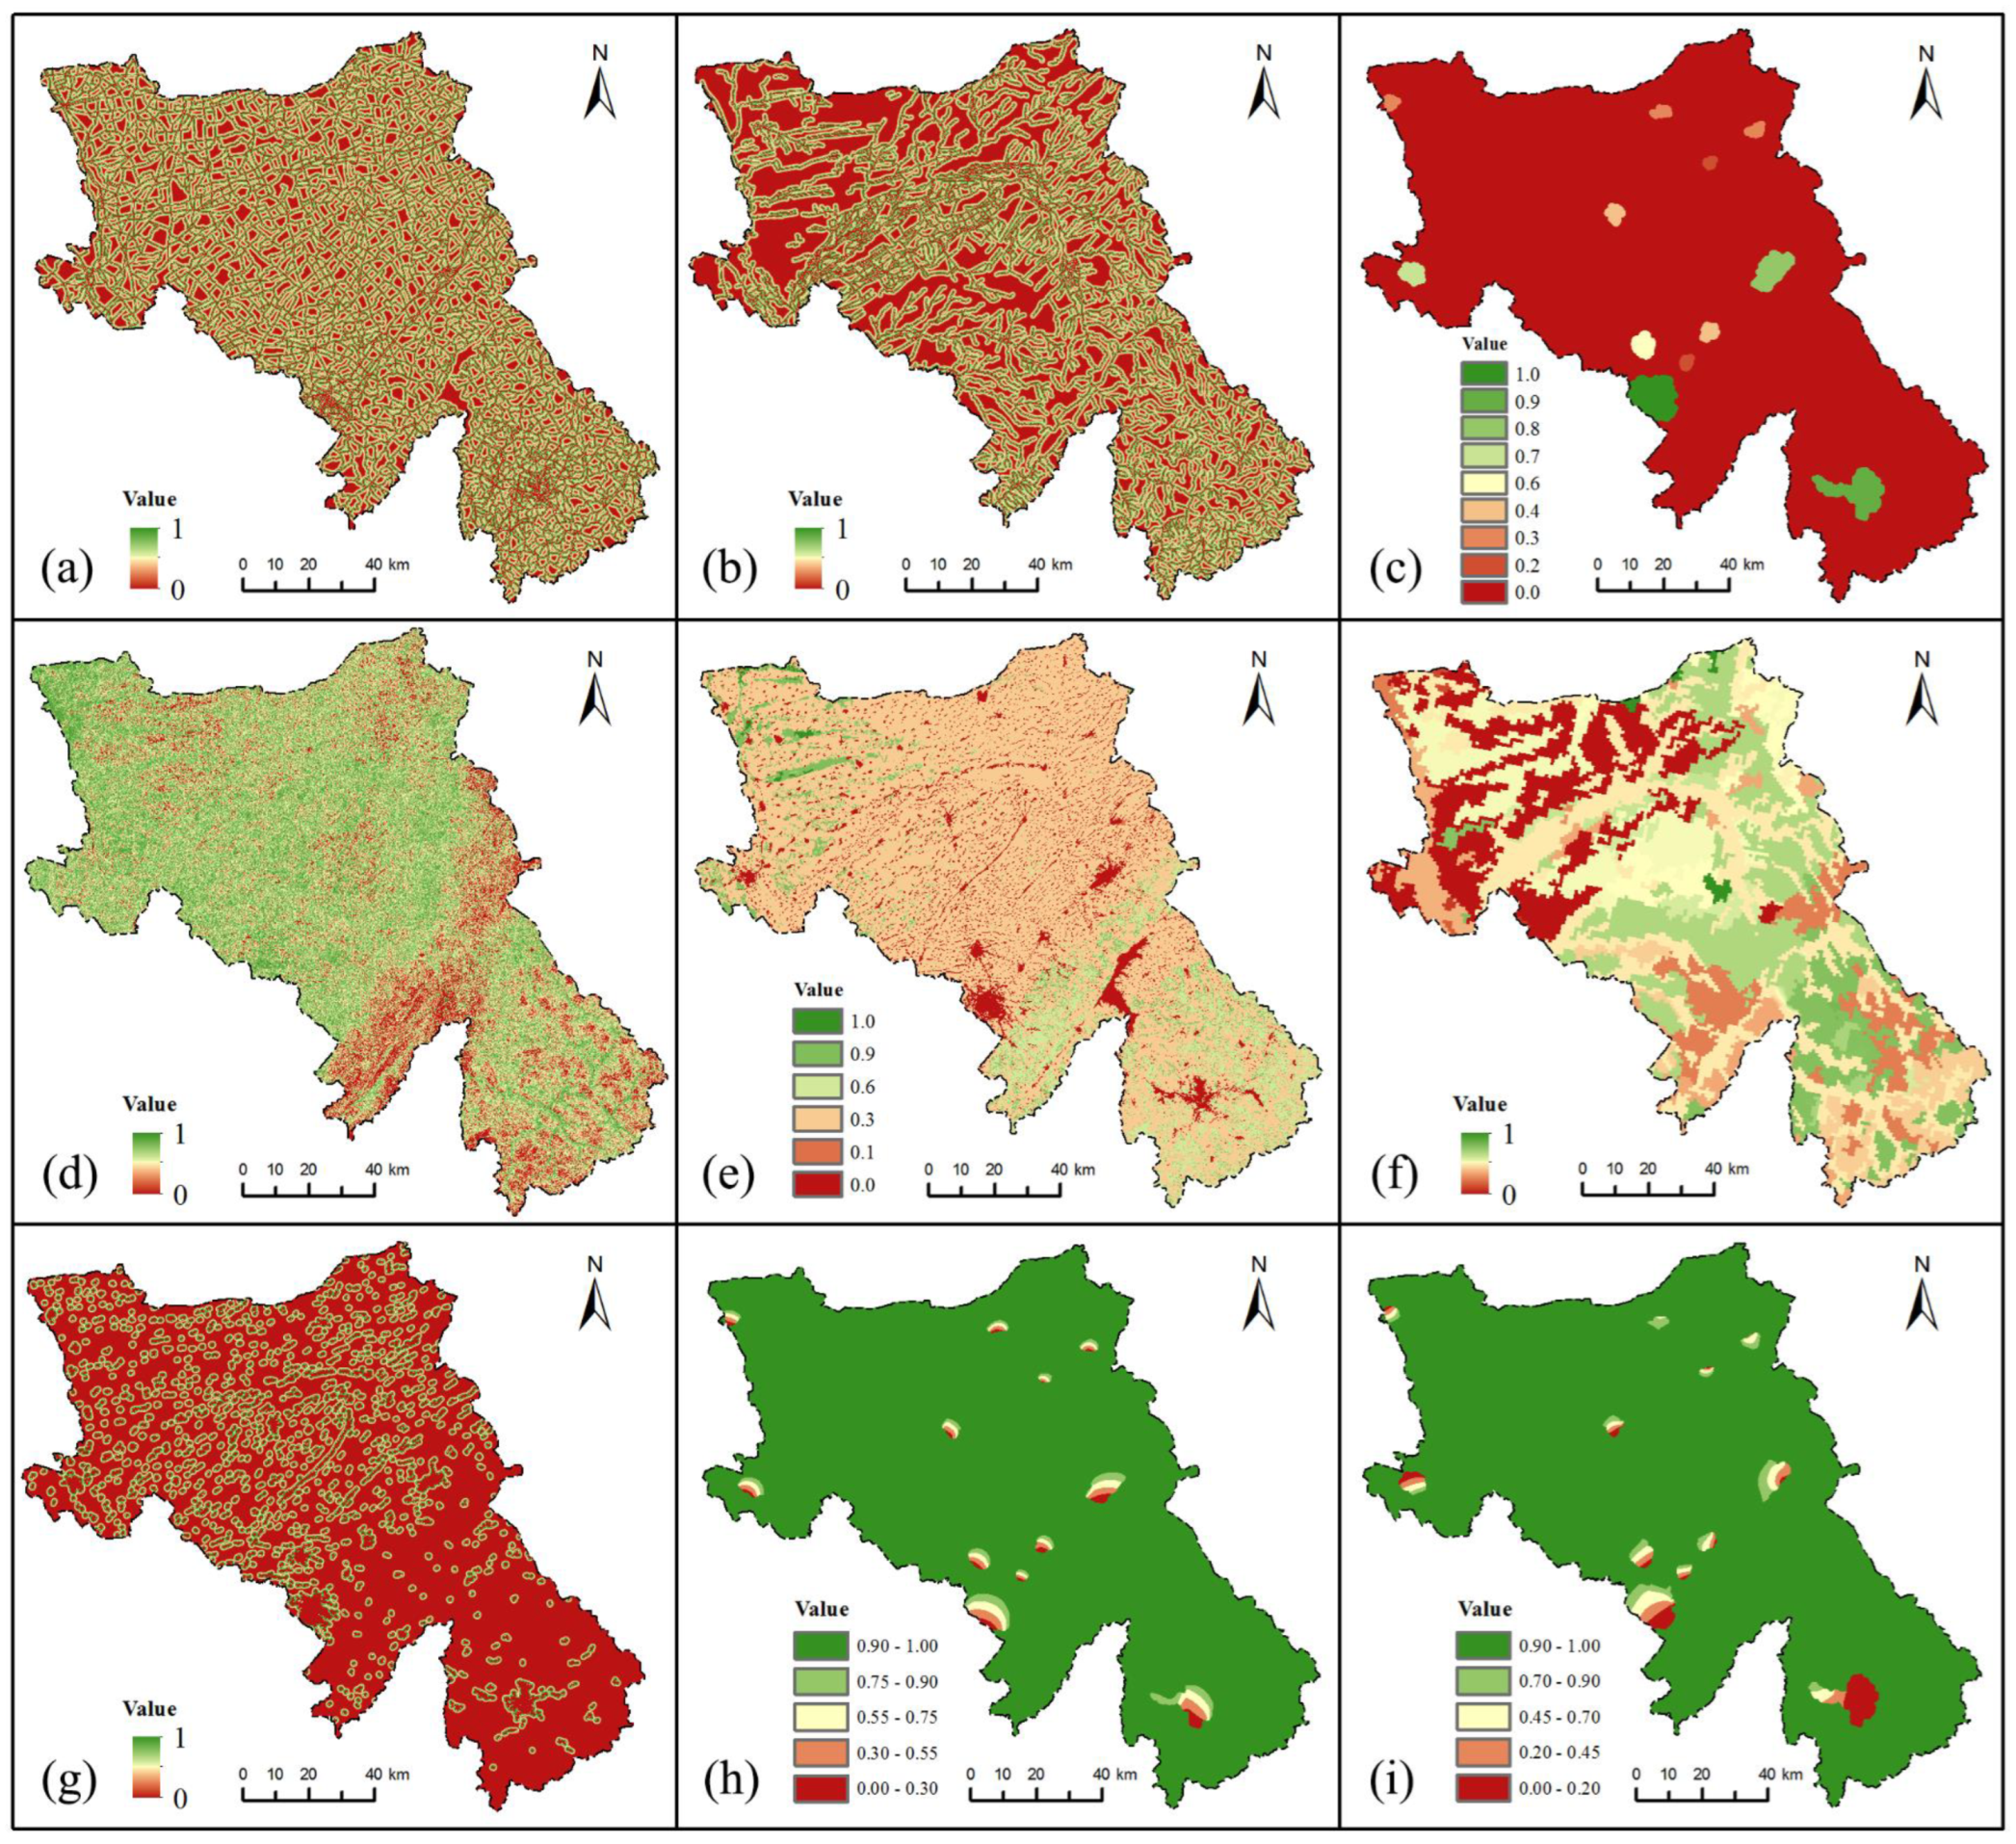
2.4. Spatial Overlay Analysis
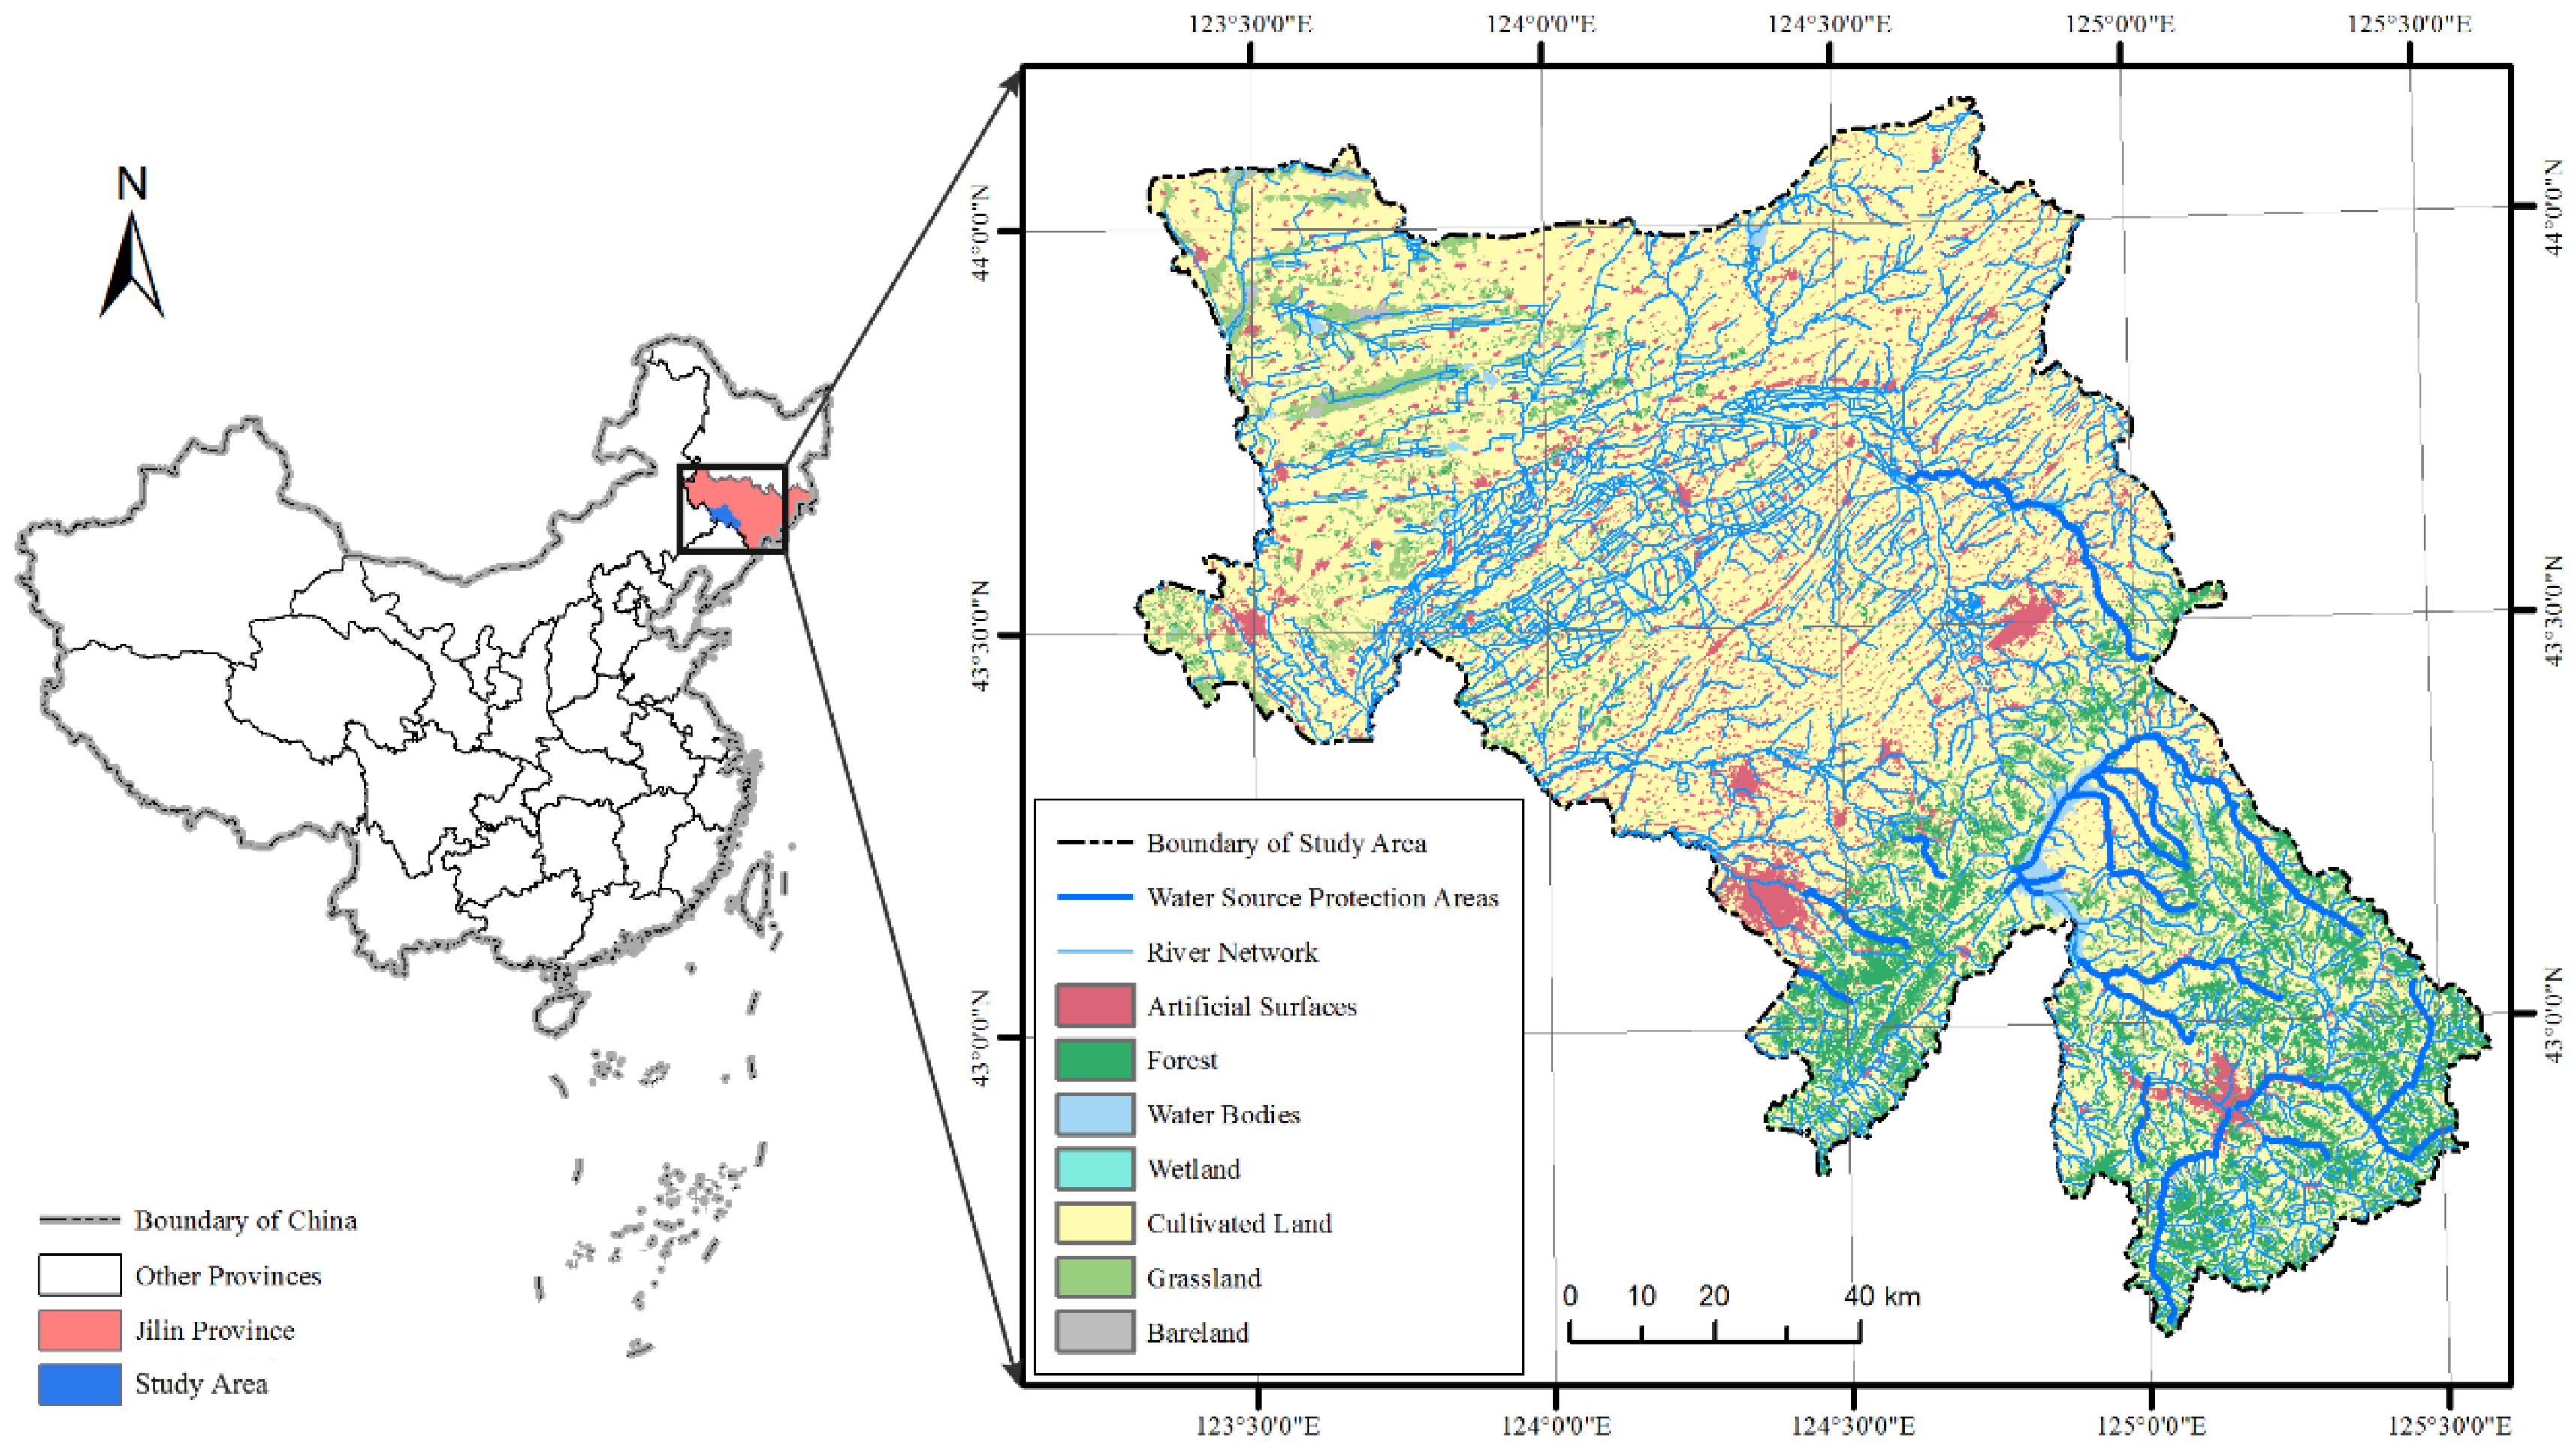
After the spatial information of each indicator was digitized on the ArcGIS platform, restricted indicator layers were overlaid as the restricted area (RA) layer by the following equation:
V k ( RA ) = i = 1 m V k ( I R i )
where V k ( I R i ) represents the Boolean value of the kth cell in the ith restricted indicator layer, and m is the number of restricted indicator layers to be overlaid.
When m is equal to 7, layers IR1–IR7 are overlaid as the Restricted Area for Evaluation (RAE) layer (Equation (6)), used to assess the location of existing sewage treatment plants, and the score of the kth cell of this layer is represented by V k ( RAE ) .
V k ( RAE ) = i = 1 7 V k ( I R i )
Then, selective indicator layers were overlaid as the selective area (SA) layer based on their weights by the following equation:
V k ( SA ) = j = 1 n w j V k ( I S j )
where V k ( I S j ) represents the indicator value of the kth cell in the jth selective indicator layer, w j represents the weight of the jth selective indicator, and n is the number of selective indicator layers to be overlaid. When n is equal to 9, layers IS1–IS9 are overlaid, and the score of the kth cell of this selective area layer is represented by V k ( SA ) .
Finally, overlaying the above restricted area layer and the selective area layer provides a Siting Suitability Map (SSM). In this study, the map was classified into two categories: one category is the Siting Suitability Map for Evaluation (SSME), used to assess the location of existing sewage treatment plants, as shown in Equation (8), and the other category is the Siting Suitability Map for Optimization (SSMO), used to divide optimal siting areas of a proposed sewage treatment plant, as shown in Equation (9), where the indicator of built-up area restriction (IR8) should be considered.
V k ( SSME ) = V k ( RAE ) × V k ( SA ) = i = 1 7 V k ( I R i ) × j = 1 9 w j V k ( I S j )
V k ( SSMO ) = V k ( SSME ) × V k ( I R 8 )
The scores of the kth cell in the above SSM are V k ( SSME ) and V k ( SSMO ) , respectively, based on which the subsequent siting suitability analysis of sewage treatment plants can be conducted in the study area.

3. Case Study

The Liao River basin is located in the southwest in Jilin Province, covering an area of more than 15,000 km2 and accounting for 8.4% of the province’s total area, with a large number of water bodies classified as water source protection areas in the southeast, as shown in Figure 2. The basin is also an important commodity grain production base in Jilin Province, playing a strategic role in China [35]. However, this region is economically underdeveloped, suffering from river basin pollution of domestic sewage and industrial wastewater caused by gradual economic growth, and many densely populated town areas lack sewage treatment facilities. According to the watershed water pollution control plan, many sewage treatment plants will be constructed in town areas. This study can provide technical support and a robust reference for local governments to make future siting decisions.

3.1. Data Sources

The location data of existing sewage treatment plants were obtained through a field investigation conducted by the authors, while the other databases in this study were offered by many institutions. DEM data (30 m resolution covering Jilin Province) were provided by the Geospatial Data Cloud Site, Computer Network Information Center, Chinese Academy of Sciences. Soil texture data (proportion of sand, silt and clay) were provided by the Resource and Environment Science and Data Center, Institute of Geographic Sciences and Natural Resources Research, Chinese Academy of Sciences. Land-use data were obtained from the Global Geo-Information Public Product (GlobeLand30), provided by China to the United Nations with extensive use. The distribution data of roads, rivers, residential areas, etc., were obtained from the National Catalogue Service for Geographic Information, National Basic Geographic Information Center. The data concerning county, city and provincial administrative divisions were provided by the National Earth System Science Data Center, National Science & Technology Infrastructure of China.

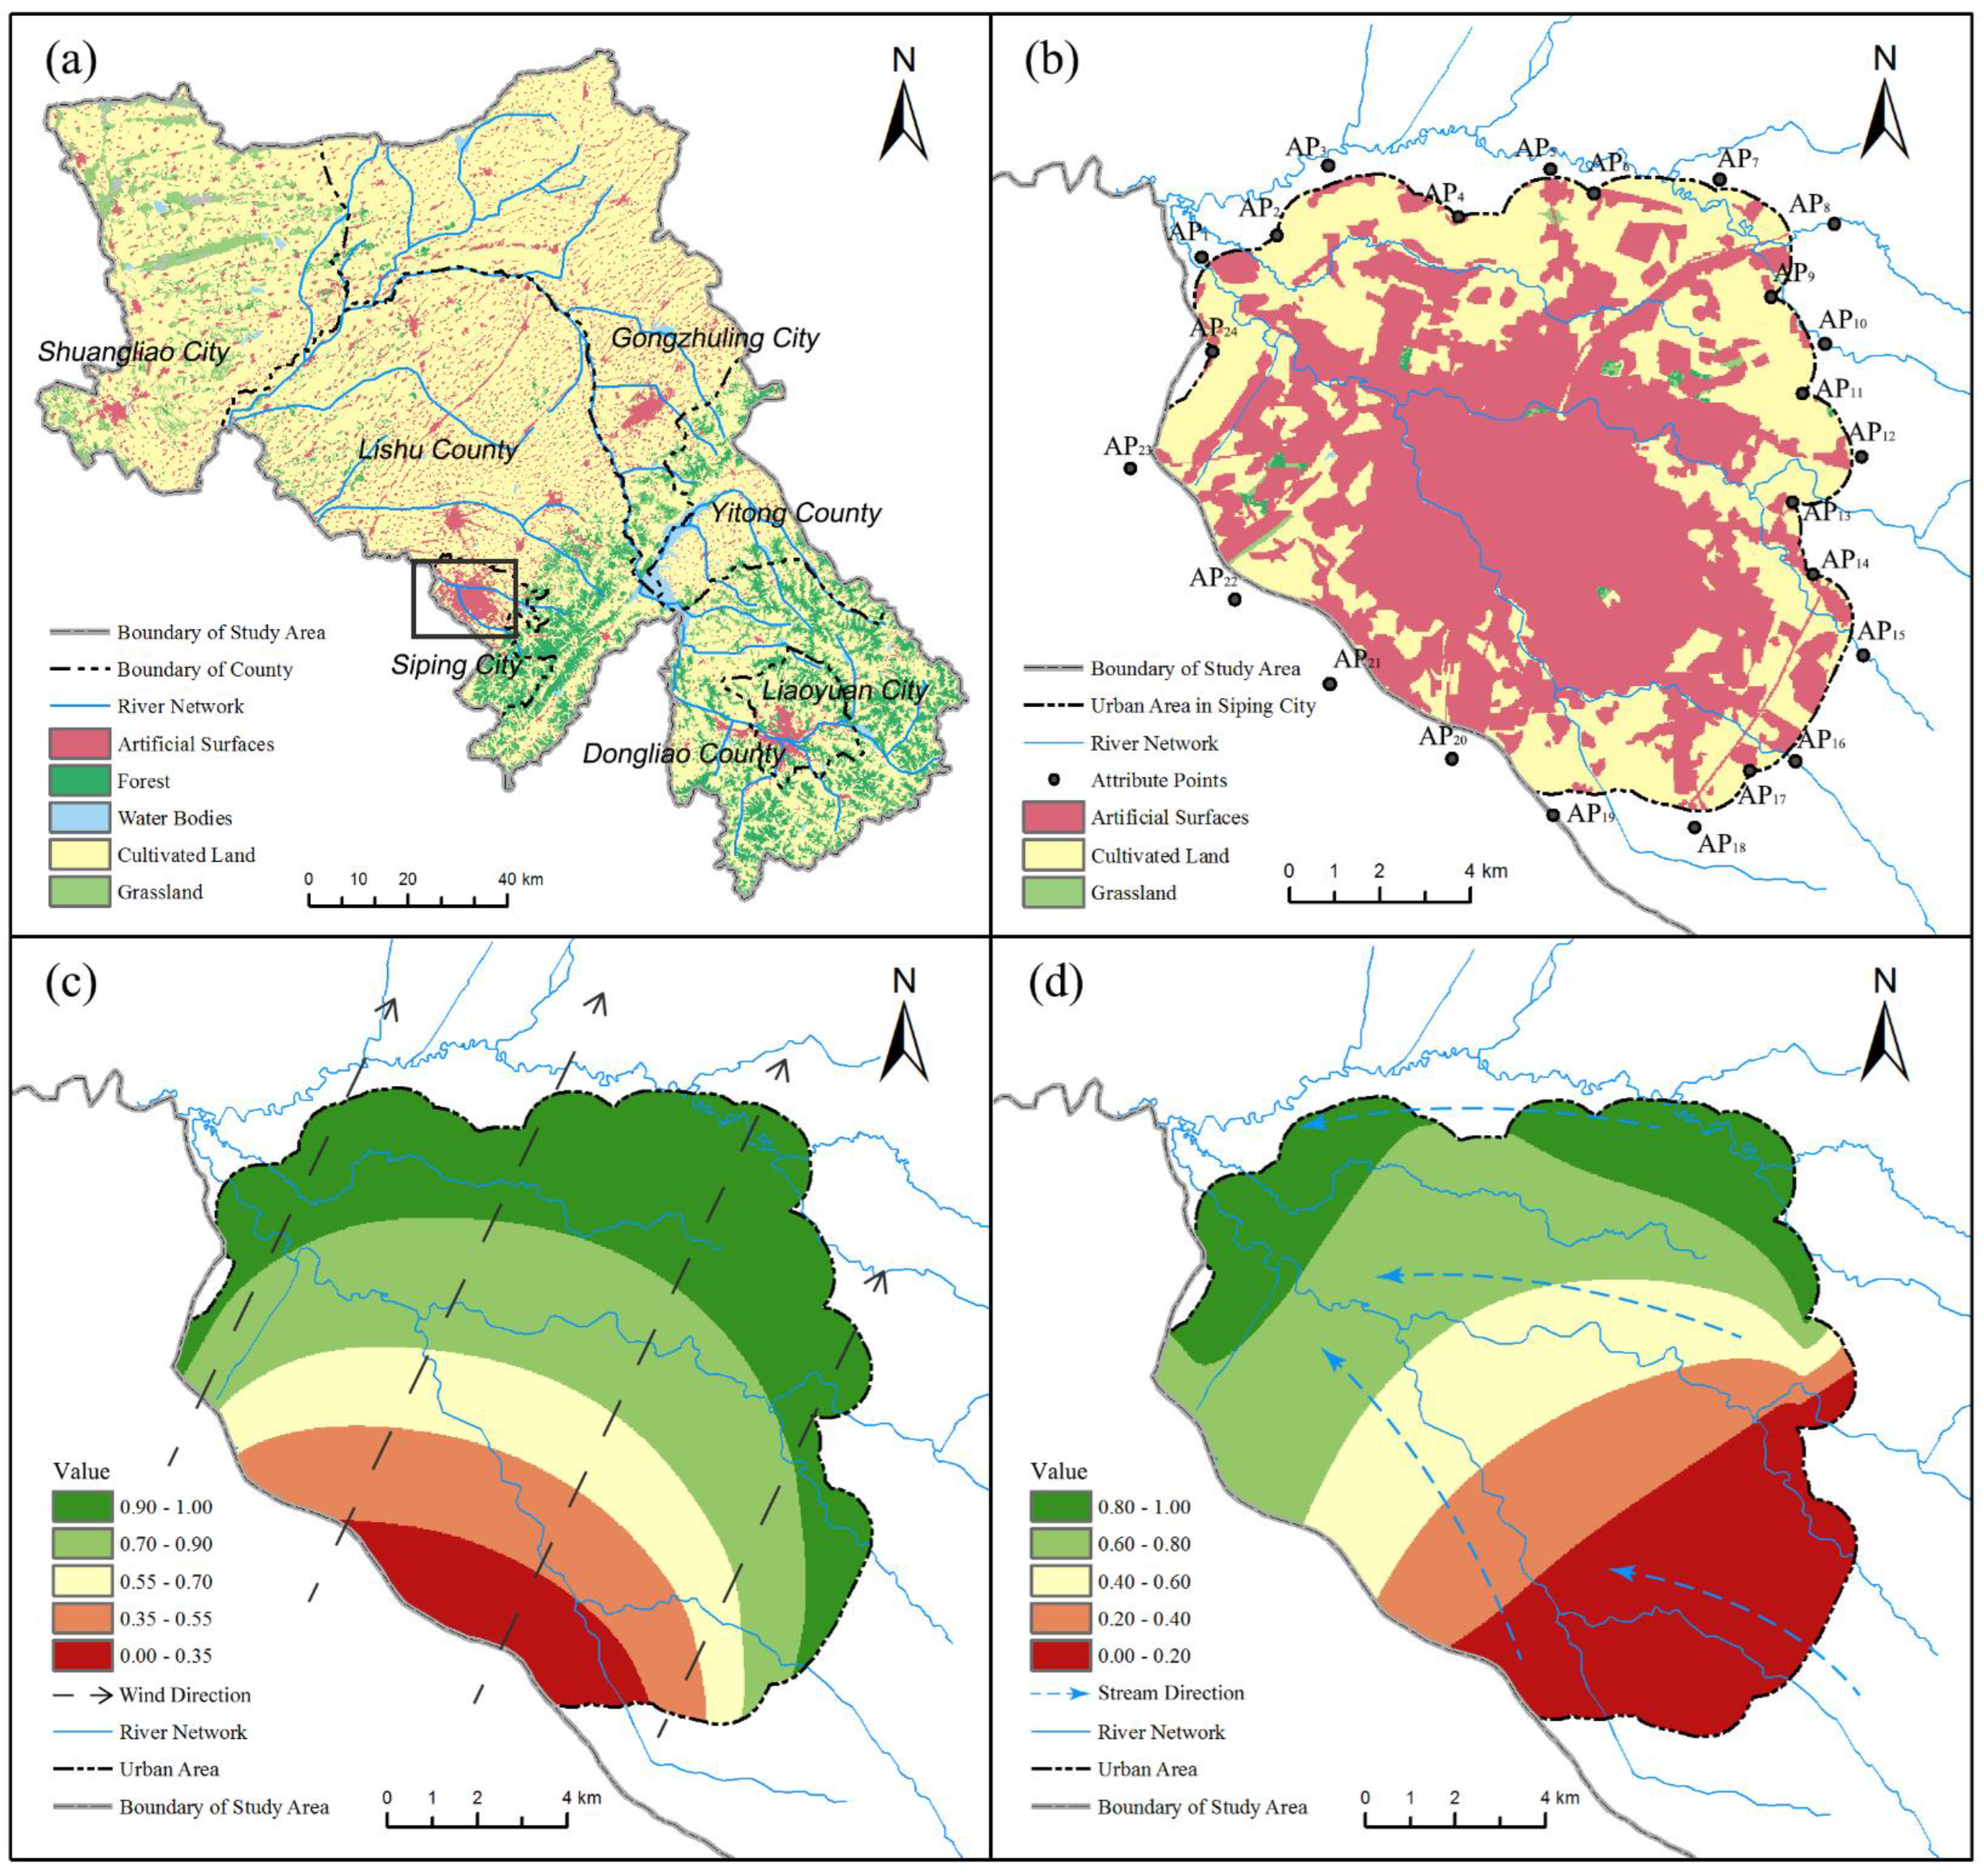
3.2. Specific Indicator Quantification

The site selection model was applied to the Liao River basin, and then quantification rules for restricted and selective indicators were formulated, as shown in Table 1. By quantifying restricted indicators on the ArcGIS platform, Boolean value distribution maps of layers IR1–IR7 were created, as shown in Figure 3a–g, respectively.
Regarding the selective indicators, the distance from road (IS1), distance from river (IS2), terrain slope (IS4) and distance from residential area (IS7) were directly quantified by Equation (1), as shown in Figure 4a,b,d,g, respectively.
For land-use type (IS5), the V k ( I S 5 ) of the kth cell in the area of artificial surfaces, water bodies, wetland, cultivated land, forest, grassland and bareland was defined as 0.0, 0.0, 0.1, 0.3, 0.6, 0.9 and 1.0, respectively, as shown in Figure 4e. The higher the value, the lower the construction difficulty and cost, and the more conducive to building sewage treatment plants.
For soil texture (IS6), the attribute value of the kth cell ( F k ) was calculated as follows:
F k = 3 P k ( Sand ) + 5 P k ( Silt ) + 10 P k ( Clay )  
where Pk (Sand), Pk (Silt) and Pk (Clay) represent the percentage of sand, silt and clay in this cell, respectively, complying with P k ( Sand ) + P k ( Silt ) + P k ( Clay ) = 100 % . Then, F k was quantified as F ˜ k , namely, V k ( I S 6 ) , the distribution of which is shown in Figure 4f.
In addition, this study divided 12 urban areas of administrative districts above town level in the Liao River basin in Jilin Province. For pipe network coverage (IS3), the indicator values of cells ( V k ( I S 3 ) ) within above urban areas were assigned between 0.2 and 1.0, related to their prosperity and population density, and in other areas, V k ( I S 3 ) was set to 0, as shown in Figure 4c.
With regard to the indicators of dominant wind direction (IS8) and urban stream direction (IS9), this study explored an effective quantification method applied in the above divided urban areas. Taking the urban area of Siping City as an example, 24 Attribute Points (APs) were evenly arranged around the urban area, as shown in Figure 5b.
The indicator values of APs were assigned in accordance with the following principles: in the direction of summer dominant wind and urban stream, V k ( I S 8 ) and V k ( I S 9 ) gradually increase from 0 to 1, respectively, as shown in Table 2. The summer dominant wind direction (IS8) in the study area is south-southwest, and the urban stream direction (IS9) can be determined by DEM difference.
Then, the above APs were processed using interpolation analysis on the ArcGIS platform, as shown in Figure 5c,d. By repeating the above operation in the other 11 urban areas, the indicator value distributions of layers IS8 and IS9 are shown in Figure 4h,i, respectively.
It can be seen that V k ( I S 8 ) and V k ( I S 9 ) show an obvious fan increasing distribution along the south-southwest wind direction and urban stream direction, respectively, which indicates that this analysis method is scientific and feasible, providing an effective quantification method for site selection models.

3.3. Indicator Weights

Combined with the background of the study area, comparison matrices of the selective indicators were established, as shown in Table 3. This process was supported by relevant experts from the water pollution prevention and control project.
Since the Consistency Ratios (CRs) of the above matrices are less than 0.1, the weights of each indicator ( w j ) can be calculated based on MATLAB. It was found that the economic cost (C1) is the most important criterion in this study area due to the underdeveloped economy and limited water pollution control funds, and it was found that the social impact (C3) criterion has a low weight, indicating a low return on investment in this aspect. The influence of pipe network coverage (IS3) on site selection is particularly significant ( w 3 = 0.275 ) due to the high cost of building pipe networks, and it is a decisive indicator of the model. According to the town governance plan, the estimated investment in rainwater and sewage diversion pipe networks is nearly 500,000 yuan/km. The indicators of distance from road (IS1), terrain slope (IS4) and dominant wind direction (IS8) have low weights ( w j < 0.050 ), and they have little impact on site selection.

3.4. Siting Suitability Analysis

After conducting the process outlined in Section 2.4, the RAE layer, SSME and SSMO are shown in Figure 3h and Figure 6b,c, respectively.
In general, a large part of the Liao River basin in Jilin Province is regarded as a restricted area, mainly concentrated in the northwest and southeast. This is mainly because the soil texture is poor in the northwest, and there are many water source areas in the southwest, which should be avoided in site selection. Suitable areas with high scores are scattered around urban areas and rivers, which is in line with this fact, as the cost of building pipelines in these sites is relatively low.
As shown in Figure 6b, this study randomly selected ten sewage treatment plants that were constructed before September 2019 in order to calibrate the site selection model to test its applicability in the whole basin and to evaluate the location of the plants. In addition, according to the water pollution control plan, Maolin Town, Yang Town, Huaide Town, Qin Town and Shijiapu Town lacked effective sewage treatment systems, as shown in Figure 6c, posing a serious threat to the local aquatic environment. Therefore, this study carried out site selection research on sewage treatment plants in the above towns, which has certain guiding significance for the local government’s site selection decision.

4. Results and Discussion

4.1. Existing Sewage Treatment Plants

Based on the spatial locations of ten sewage treatment plants, the assessment results of each plant are shown in Table 4, where V ( SSME ) was divided into intervals and transformed into natural language, namely, VG   ( V e r y   G o o d ) ( 0.50 ,   1.00 ] , G   ( G o o d ) ( 0.42 ,   0.50 ] , M   ( M e d i u m ) ( 0.35 ,   0.42 ] , P   ( P o o r ) ( 0.00 ,   0.35 ] and R   ( R e s t r i c t e d ) = 0.00 . These intervals are obtained and adjusted according to the Natural Breaks method (Jenks).
Since the land-use data are from the year 2020, the above sewage treatment plants have all been built, and they are located on artificial surfaces of land-use type (IS5), so V ( I S 5 ) of all plants should be 0 according to Table 1. This indicator is mainly used for the siting suitability analysis of proposed sewage treatment plants, and it has no influence on the location assessment of existing plants. Therefore, this factor is not considered in the following analysis.
The location assessment results are able to calibrate the model. If the results of the above plants are all poor or have no significant differences, the accuracy and applicability of this model should be reconsidered. However, Table 4 shows that there are certain differences in the assessment results of the sewage treatment plants, most of which are G or VG, indicating satisfactory applicability in the whole basin.
Overall, the scores in some indicators have large variances (over 0.080), such as distance from river (IS2), pipe network coverage (IS3), distance from residential area (IS7), dominant wind direction (IS8) and urban stream direction (IS9), which means that local governments’ blindness and subjectivity exist in these aspects when selecting sites. However, differences in pipe network coverage (IS3) between sites are unavoidable in some cases, especially when these sites are located in towns with different levels of development, as the level of pipe network coverage (IS3) is almost uniform in the urban areas of a given town. It can also be seen that the government has a certain awareness of terrain slope (IS4) and soil texture (IS6), as the variances in the site scores of these indicators are not significant (0.003 and 0.016, respectively). However, the overall score of soil texture (IS6) is obviously lower than that of terrain slope (IS4), so there remains room for improvement of later site selection.
Regarding Northeast Hosiery Base Sewage Treatment Plant (STP10), the model determined that the plant was located within the residential area restriction (IR7), which was less than the safety distance. Therefore, V ( SSME ) = V ( I R 7 ) = 0 , and then, this site was classified as R. After investigation, this plant was less than 200 m away from residential areas, and there were odor, visual and other pollutions, which were reported by local residents, further demonstrating the accuracy of this model.
Among the other sewage treatment plants, five of them were highly evaluated (VG), indicating that the site selection decision in this basin was not terrible to some extent. However, Gong City Sewage Treatment Plant (STP3) and Guo Town Sewage Treatment Plant (STP6) were classified as M, both of which are far from residential areas (IS7) and have a low pipe network coverage (IS3), leading to a high pipeline cost. In addition, the soil texture (IS6) of the former’s position is poor, while the latter’s position is far from the road and river (IS1, IS2), and it is susceptible to odor pollution brought by summer dominant wind (IS8). These account for the poor scores, and this analysis could give the government a signal to avoid making similar mistakes the next time a new sewage treatment plant is built.

4.2. Proposed Sewage Treatment Plants

After verifying the applicability and accuracy of the model in the whole basin, siting suitability analysis of the proposed sewage treatment plants was carried out in the towns of the basin. By cropping the urban areas of the five towns in Figure 6c, detailed SSMs were created, as shown in Figure 7.
Then, the percentage of the scoring interval (R, P, M, G, and VG) was calculated, as shown in Table 5. These five towns lacked sewage treatment facilities as of September 2019. It is of great significance to conduct SSM analysis in these towns for the government’s reference.
It was found that restricted areas (R) are located in the very center of each town, accounting for a large proportion in all towns, especially in Yang Town (74.18%), followed by Qin Town (64.67%) and Shijiapu Town (63.01%). This is because there are many built-up areas, residential areas, roads and rivers in urban areas, where large buffer zones are required. Cells graded G or VG are areas where it is suitable to construct sewage treatment plants, and proportions of them vary obviously from 0.13% to 10.67% and from 3.75% to 16.58%, respectively. After classification, specific sites of construction can be determined by the decision makers’ understanding of local conditions only around these satisfactory areas. As such, this study can lessen the considerable workload of decision makers.
Among these towns, Shijiapu Town is the least conducive to building sewage treatment plants, with a max value of only 0.540, where only 0.13% and 3.75% of areas were rated as VG and G, respectively, while 14.65% and 18.46% were rated as M and P, respectively. Optimal siting areas are quite limited and distributed in the north and west, as shown in Figure 7e. This is due to the low pipe network coverage (IS3), undulating terrain (IS4) and poor soil texture (IS6) in the urban area, leading to the low overall score of this town. In this case, a comprehensive investigation around optimal sitting areas is highly recommended before building sewage treatment plants.
For Maolin Town, although the max value is the highest at 0.633, only 2.36% of areas were rated as VG, and they are distributed in the south and west, as shown in Figure 7a. However, 18.60% and 12.34% of areas were rated as M and P, respectively. Taking this town as an example, this study analyzed the SSM using RS technology, aiming to intuitively illustrate suitable areas to build sewage treatment plants. This approach can further reduce the site survey workload of decision makers. There are three optimal siting areas, as shown in Figure 8. The geographical feasibility of these areas on satellite images also strongly proves the robustness of the methodology.
There are sufficient areas classified as VG or G in Yang Town and Qin Town, 19.18% and 22.08%, respectively. Although a high proportion of restricted areas exist, the percentages of poor areas in the two towns are quite low, 0.29% and 4.38%, respectively. The positions of optimal siting areas are quite different. The siting areas in Yang Town are distributed in the west, north and southeast corner, while the north, east and south of Qin Town are suitable for new constructions, as shown in Figure 7b,d.
As the remaining town, Huaide Town is the most conducive to building sewage treatment plants, with 16.58% and 10.67% of areas rated as G and VG, respectively, and they are distributed around the urban area, as shown in Figure 7c. This is due to the gentle terrain (IS4) and suitable soil texture (IS6) in the urban area, resulting in the high overall score of this town. The high siting suitability means that the government can set up a sewage treatment plant in Huaide Town as a pilot site, followed by Qin Town, Yang Town, Maolin Town and Shijiapu Town.

5. Conclusions

A reasonable layout of environmental facilities can maximize their functions and reduce the negative impact on the environment and society at a small cost, but many developing countries are not aware of this issue. Sewage treatment plants are one of the most commonly used facilities for water pollution prevention and control. With the increasing acknowledgement of the significance of site selection, more research will be conducted in this field. In order to enrich the framework of site selection models, this study developed a combined multi-criteria site selection model with GIS, AHP and Remote Sensing (RS) technologies, revealing blindness in former site selections of sewage treatment plants and exploring optimal siting areas. This model explored an effective method to quantify summer dominant wind direction and urban stream direction, and it was first applied in the Liao River basin in Jilin Province in China.
The research shows that local governments should handle blindness and subjectivity existing in the following aspects when selecting sites in the Liao River basin: distance from river and residential area (IS2 and IS7), dominant wind direction (IS8) and urban stream direction (IS9). Later, the site selection of sewage treatment plants could also be optimized overall by comprehensive analysis of local soil texture (IS6). Although the location of many sewage treatment plants is highly evaluated, the assessment of Gong City Sewage Treatment Plant and Guo Town Sewage Treatment Plant is not ideal due to defects in various indicators. Additionally, problems exist in the location of the Northeast Hosiery Base Sewage Treatment Plant, which is less than 200 m away from residential areas, leading to odor, visual and other pollutions. In this model, the influence of pipe network coverage (IS3) on site selection is strong. This indicator, together with terrain slope (IS4) and soil texture (IS6), gives SSMs regional characteristics. Huaide Town has the largest optimal siting areas because of its gentle terrain and acceptable soil texture. This town can be considered as a pilot site for the construction of sewage treatment plants. On the contrary, in Shijiapu town, the optimal siting areas are quite limited and are distributed in the north and west. To build sewage treatment plants in this town requires various aspects of investigation with considerable caution. In addition, combined with RS technology, Maolin Town was divided into three optimal siting areas, distributed in the west and south. This approach can make the areas more visible and reduce the investigation workload of decision makers. It can be seen that this enriched site selection model consisting of GIS, AHP and RS can effectively divide optimal siting areas of sewage treatment plants, providing a scientific and robust decision-making support framework for local governments.

Author Contributions

Conceptualization, J.T.; data curation, B.L. and H.L.; formal analysis, Y.Y.; investigation, Y.Q. and Y.D.; methodology, B.L.; project administration, Z.L.; resources, Y.Q.; software, B.L.; supervision, J.T.; visualization, Y.Y.; writing—original draft, B.L.; writing—review and editing, Z.L. All authors have read and agreed to the published version of the manuscript.

Funding

This research was funded by Major Science and Technology Project, Science and Technology Department of Jilin Province, grant number 20200503003SF.

Data Availability Statement

“Geospatial Data Cloud Site, Computer Network Information Center, Chinese Academy of Sciences” at http://www.gscloud.cn, assessed on 16 February 2022; “Resource and Environment Science and Data Center, Institute of Geographic Sciences and Natural Resources Research, Chinese Academy of Sciences” at http://www.resdc.cn, assessed on 16 February 2022; “Global Geo-Information Public Product (GlobeLand30)” at http://www.globallandcover.com, assessed on 16 February 2022; “National Catalogue Service for Geographic Information, National Basic Geographic Information Center” at https://www.webmap.cn, assessed on 16 February 2022; “National Earth System Science Data Center, National Science & Technology Infrastructure of China” at http://www.geodata.cn, assessed on 16 February 2022.

Acknowledgments

We acknowledge the data provided by Chinese Academy of Sciences, National Science & Technology Infrastructure of China, etc. At the same time, we would like to thank the reviewers for their helpful suggestions on the improvements of this paper.

Conflicts of Interest

The authors declare that they have no conflicts of interest.

References

  1. Jara-Samaniego, J.; Perez-Murcia, M.D.; Bustamante, M.A.; Perez-Espinosa, A.; Paredes, C.; Lopez, M.; Moral, R. Composting as sustainable strategy for municipal solid waste management in the Chimborazo Region, Ecuador: Suit- ability of the obtained composts for seedling production. J. Clean. Prod. 2017, 141, 1349–1358. [Google Scholar] [CrossRef]
  2. Nigusse, A.G.; Adhaneom, U.G.; Kahsay, G.H.; Abrha, A.M.; Gebre, D.N.; Weldearegay, A.G. GIS application for urban domestic wastewater treatment site selection in the Northern Ethiopia, Tigray Regional State: A case study in Mekelle City. Arab. J. Geosci. 2020, 13, 1538. [Google Scholar] [CrossRef]
  3. Arroyo, P.; Molinos-Senante, M. Selecting appropriate wastewater treatment technologies using a choosing-by-advantages approach. Sci. Total Environ. 2018, 625, 819–827. [Google Scholar] [CrossRef] [PubMed]
  4. Rahimi, S.; Hafezalkotob, A.; Monavari, S.M.; Hafezalkotob, A.; Rahimi, R. Sustainable landfill site selection for municipal solid waste based on a hybrid decision-making approach: Fuzzy group BWM-MULTIMOORA-GIS. J. Clean. Prod. 2020, 248, 119186. [Google Scholar] [CrossRef]
  5. Shao, M.; Han, Z.X.; Sun, J.W.; Xiao, C.S.; Zhang, S.L.; Zhao, Y.X. A review of multi-criteria decision making applications for renewable energy site selection. Renew. Energy 2020, 157, 377–403. [Google Scholar] [CrossRef]
  6. Hao, X.D.; Li, J.; Loosdrecht, M.C.; Jiang, H.; Liu, R.B. Energy recovery from wastewater: Heat over organics. Water Res. 2019, 161, 74–77. [Google Scholar] [CrossRef] [PubMed]
  7. Smith, K.; Liu, S.M.; Hu, H.Y.; Dong, X.; Wen, X.H. Water and energy recovery: The future of wastewater in China. Sci. Total Environ. 2018, 637, 1466–1470. [Google Scholar] [CrossRef] [PubMed]
  8. Donevska, K.; Jovanovski, J.; Gligorova, L. Comprehensive Review of the Landfill Site Selection Methodologies and Criteria. J. Indian Inst. Sci. 2021, 101, 509–521. [Google Scholar] [CrossRef]
  9. Hannan, M.A.; Lipu, M.S.H.; Akhtar, M.; Begum, R.A.; Al Mamun, M.A.; Hussain, A.; Mia, M.S.; Basri, H. Solid waste collection optimization objectives, constraints, modeling approaches, and their challenges toward achieving sustainable development goals. J. Clean. Prod. 2020, 277, 123557. [Google Scholar] [CrossRef]
  10. Xiao, N.; Murray, A.T. Spatial optimization for land acquisition problems: A review of models, solution methods, and GIS support. Trans. GIS 2019, 23, 645–671. [Google Scholar] [CrossRef]
  11. Kao, J.J.; Lin, H.Y. Multifactor Spatial Analysis for Landfill Siting. J. Environ. Eng. 1996, 122, 902–908. [Google Scholar] [CrossRef] [Green Version]
  12. Mallick, J. Municipal Solid Waste Landfill Site Selection Based on Fuzzy-AHP and Geoinformation Techniques in Asir Region Saudi Arabia. Sustainability 2021, 13, 1538. [Google Scholar] [CrossRef]
  13. Mortazavi Chamchali, M.; Mohebbi Tafreshi, A.; Mohebbi Tafreshi, G. Utilizing GIS linked to AHP for landfill site selection in Rudbar County of Iran. Geojournal 2021, 86, 163–183. [Google Scholar] [CrossRef]
  14. Sadhasivam, N.; Sheik Mohideen, A.R.; Alankar, B. Optimisation of landfill sites for solid waste disposal in Thiruverumbur taluk of Tiruchirappalli district, India. Environ. Earth Sci. 2020, 79, 522. [Google Scholar] [CrossRef]
  15. Tulun, S.; Gurbuz, E.; Arsu, T. Developing a GIS-based landfill site suitability map for the Aksaray province, Turkey. Environ. Earth Sci. 2021, 80, 310. [Google Scholar] [CrossRef]
  16. Arca, D.; Keskin Citiroglu, H. Geographical information systems-based analysis of site selection for wind power plants in Kozlu District (Zonguldak-NW Turkey) by multi-criteria decision analysis method. Energy Sources Part A Recovery Util. Environ. Eff. 2020, 1–13. [Google Scholar] [CrossRef]
  17. Ibrahim, G.R.F.; Hamid, A.A.; Darwesh, U.M.; Rasul, A. A GIS-based Boolean logic-analytical hierarchy process for solar power plant (case study: Erbil Governorate-Iraq). Environ. Dev. Sustain. 2021, 23, 6066–6083. [Google Scholar] [CrossRef]
  18. Yousefi, H.; Hafeznia, H.; Yousefi-Sahzabi, A. Spatial Site Selection for Solar Power Plants Using a GIS-Based Boolean-Fuzzy Logic Model: A Case Study of Markazi Province, Iran. Energies 2018, 11, 1648. [Google Scholar] [CrossRef] [Green Version]
  19. Zambrano-Asanza, S.; Quiros-Tortos, J.; Franco, J.F. Optimal site selection for photovoltaic power plants using a GIS-based multi-criteria decision making and spatial overlay with electric load. Renew. Sustain. Energy Rev. 2021, 143, 110853. [Google Scholar] [CrossRef]
  20. Dell’Ovo, M.; Capolongo, S.; Oppio, A. Combining spatial analysis with MCDA for the siting of healthcare facilities. Land Use Policy 2018, 76, 634–644. [Google Scholar] [CrossRef]
  21. Halder, B.; Bandyopadhyay, J.; Banik, P. Assessment of hospital sites’ suitability by spatial information technologies using AHP and GIS-based multi-criteria approach of Rajpur-Sonarpur Municipality. Modeling Earth Syst. Environ. 2020, 6, 2581–2596. [Google Scholar] [CrossRef]
  22. Nsaif, Q.A.; Khaleel, S.M.; Khateeb, A.H. Integration of gis and remote sensing technique for hospital site selection in baquba district. J. Eng. Sci. Technol. 2020, 15, 1492–1505. [Google Scholar]
  23. Parvin, F.; Ali, S.A.; Hashmi, S.N.I.; Khatoon, A. Accessibility and site suitability for healthcare services using GIS-based hybrid decision-making approach: A study in Murshidabad, India. Spat. Inf. Res. 2021, 29, 1–18. [Google Scholar] [CrossRef]
  24. Gemitzi, A.; Tsihrintzis, V.A.; Christou, O.; Petalas, C. Use of GIS in siting stabilization pond facilities for domestic wastewater treatment. J. Environ. Manag. 2007, 82, 155–166. [Google Scholar] [CrossRef] [PubMed]
  25. S’Habou, R.; Zairi, M.; Kallel, A.; Neji, J.; Dhia, H.B. Disposal site choice for olive mill wastewater. Waste Resour. Manag. 2009, 162, 99–108. [Google Scholar] [CrossRef]
  26. Anagnostopoulos, K.; Vavatsikos, A. Site Suitability Analysis for Natural Systems for Wastewater Treatment with Spatial Fuzzy Analytic Hierarchy Process. J. Water Resour. Plan. Manag. 2012, 138, 125–134. [Google Scholar] [CrossRef]
  27. Zhou, J.L.; Wu, Y.N.; Wu, C.H.; He, F.Y.; Zhang, B.Y.; Liu, F.T. A geographical information system based multi-criteria decision-making approach for location analysis and evaluation of urban photovoltaic charging station: A case study in Beijing. Energy Convers. Manag. 2020, 205, 112340. [Google Scholar] [CrossRef]
  28. Aydi, A.; Abichou, T.; Nasr, I.H.; Louati, M.; Zairi, M. Assessment of land suitability for olive mill wastewater disposal site selection by integrating fuzzy logic, AHP, and WLC in a GIS. Environ. Monit. Assess. 2016, 188, 59. [Google Scholar] [CrossRef]
  29. Ma, J.G.; Scott, N.R.; DeGloria, S.D.; Lembo, A.J. Siting analysis of farm-based centralized anaerobic digester systems for distributed generation using GIS. Biomass Bioenergy 2005, 28, 591–600. [Google Scholar] [CrossRef]
  30. Tavares, G.; Zsigraiova, Z.; Semiao, V. Multi-criteria GIS-based siting of an incineration plant for municipal solid waste. Waste Manag. 2011, 31, 1960–1972. [Google Scholar] [CrossRef]
  31. Zhang, G.; Shi, Y.; Maleki, A.; Rosen, M.A. Optimal location and size of a grid-independent solar/hydrogen system for rural areas using an efficient heuristic approach. Renew. Energy 2020, 156, 1203–1214. [Google Scholar] [CrossRef]
  32. Zhang, Y.H.; Ren, J.; Pu, Y.R.; Wang, P. Solar energy potential assessment: A framework to integrate geographic, technological, and economic indices for a potential analysis. Renew. Energy 2020, 149, 577–586. [Google Scholar] [CrossRef]
  33. Colak, H.E.; Memisoglu, T.; Gercek, Y. Optimal site selection for solar photovoltaic (PV) power plants using GIS and AHP: A case study of Malatya Province, Turkey. Renew. Energy 2020, 149, 565–576. [Google Scholar] [CrossRef]
  34. Saaty, T.L. Scaling Method for Priorities in Hierarchical Structures. J. Math. Psychol. 1977, 15, 234–281. [Google Scholar] [CrossRef]
  35. Liu, B.; Tang, J.; Li, Z.Y.; Yan, Y.; Chen, J.S. Optimal Selection of Sewage Treatment Technologies in Town Areas: A Coupled Multi-Criteria Decision-Making Model. Environ. Manag. 2020, 66, 709–721. [Google Scholar] [CrossRef]
Figure 1. Technology roadmap.
Water 14 01092 g001
Figure 2. Study area (Liao River basin in Jilin Province).
Water 14 01092 g002
Figure 3. Layers of restricted indicators and Restricted Area for Evaluation (RAE): (a) road restriction (IR1); (b) river restriction (IR2); (c) water source restriction (IR3); (d) lake restriction (IR4); (e) terrain slope restriction (IR5); (f) soil texture restriction (IR6); (g) residential area restriction (IR7); and (h) RAE.
Water 14 01092 g003
Figure 4. Layers of selective indicators: (a) distance from road (IS1); (b) distance from river (IS2); (c) pipe network coverage (IS3); (d) terrain slope (IS4); (e) land-use type (IS5); (f) soil texture (IS6); (g) distance from residential area (IS7); (h) dominant wind direction (IS8); and (i) urban stream direction (IS9).
Water 14 01092 g004
Figure 5. Quantification of dominant wind direction (IS8) and urban stream direction (IS9): (a) administrative division of the study area; (b) distribution of Attribute Points (APs) in Siping City; (c) distribution of V k ( I S 8 ) in Siping City; and (d) distribution of V k ( I S 9 ) in Siping City.
Water 14 01092 g005
Figure 6. Siting Suitability Map (SSM) of the study area: (a) distribution of Sewage Treatment Plants (STPs) and urban areas of towns; (b) Siting Suitability Map for Evaluation (SSME); and (c) Siting Suitability Map for Optimization (SSMO).
Water 14 01092 g006
Figure 7. Siting Suitability Map (SSM) for urban areas of towns: (a) Maolin Town; (b) Yang Town; (c) Huaide Town; (d) Qin Town; and (e) Shijiapu Town.
Water 14 01092 g007
Figure 8. Satellite image analysis of Maolin Town.
Water 14 01092 g008
Table 1. Quantifying specification of indicators.
Restricted IndicatorsQuantification into Boolean ValuesVk(IRi) = 0Vk(IRi) = 1
Road restriction (IR1)Distance to road, m<100≥100
River restriction (IR2)Distance to river, m<100≥100
Water source restriction (IR3)Distance to water source, m<1000≥1000
Lake restriction (IR4)Distance to lake, m<100≥100
Terrain slope restriction (IR5)Slope, degree>10≤10
Soil texture restriction (IR6)Vk(IS6) referring to Equations (1) and (10) <0.2≤0.2
Residential area restriction (IR7)Distance to settlement, m<200≥200
Built-up area restriction (IR8)Distance to building, m<100≥100
Selective IndicatorsQuantification into Indicator ValuesVk(ISj)(0, 1)
Distance from road (IS1)Normalized score referring to Equation (1), Equal to normalized score
where Fa = 100 m, Fb = 200 m and Fc = 1000 m
Distance from river (IS2)Normalized score referring to Equation (1),Equal to normalized score
where Fa = 100 m, Fb = 200 m and Fc = 1000 m
Pipe network coverage (IS3)Based on the prosperity of its urban areaPositive correlation
Terrain slope (IS4)Normalized score referring to Equation (1), Equal to normalized score
where Fa = Fb = 0 degree and Fc = 10 degrees
Land-use type (IS5)Artificial surfaces, water bodies, wetland, 0.0, 0.0, 0.1, 0.3, 0.6, 0.9
cultivated land, forest, grassland, barelandand 1.0, respectively
Soil texture (IS6)Normalized score referring to Equations (1) and (10), Equal to normalized score
where Fa = min(Fk), Fb = Fc = max(Fk)
Distance from residential area (IS7)Normalized score referring to Equation (1), Equal to normalized score
where Fa = 200 m, Fb = 300 m and Fc = 1000 m
Dominant wind direction (IS8)Method referring to Section 3From 0 to 1
Urban stream direction (IS9)Method referring to Section 3From 0 to 1
Study area: Liao River basin in Jilin Province (30 m resolution).
Table 2. V k ( I S 8 ) and V k ( I S 9 ) of Attribute Points (APs).
Attribute PointsAP1AP2AP3AP4AP5AP6AP7AP8
Vk (Dominant wind direction) (IS8)1.001.001.001.001.001.001.001.00
Vk (Urban stream direction) (IS9)1.000.951.000.701.001.000.950.85
Attribute PointsAP9AP10AP11AP12AP13AP14AP15AP16
Vk (Dominant wind direction) (IS8)0.951.001.001.000.951.001.001.00
Vk (Urban stream direction) (IS9)0.850.850.850.050.050.050.000.00
Attribute PointsAP17AP18AP19AP20AP21AP22AP23AP24
Vk (Dominant wind direction) (IS8)0.800.600.000.000.200.351.000.95
Vk (Urban stream direction) (IS9)0.000.000.000.100.500.700.700.90
Table 3. Weights of selective indicators.
Goal CriterionC1C2C3WeightswjCR
Economic cost (C1)1120.413
Construction conditions (C2)1110.328
Social impact (C3)1/2110.260 0.046
C1 Selective IndicatorIS1IS2IS3
Distance from road (IS1)11/21/6 0.1110.046
Distance from river (IS2)211/3 0.2220.092
Pipe network coverage (IS3)631 0.6670.2750.000
C2 Selective IndicatorIS4IS5IS6
Terrain slope (IS4)11/41/2 0.1490.049
Land-use type (IS5)411 0.4740.155
Soil texture (IS6)211 0.3760.1230.046
C3 Selective IndicatorIS7IS8IS9
Distance from residential area (IS7)131 0.4430.115
Dominant wind direction (IS8)1/311/2 0.1690.044
Urban stream direction (IS9)121 0.3870.1010.016
Table 4. Location assessment of existing Sewage Treatment Plants (STPs).
Sewage Treatment PlantsSTP1STP2STP3STP4STP5STP6STP7STP8STP9STP10VAR
V (Distance from road) (IS1)0.9850.8000.6160.6090.9980.2370.4480.5000.8970.6210.061
V (Distance from river) (IS2)0.9320.9770.9570.8730.0820.5000.9640.6160.3610.8510.096
V (Pipe network coverage) (IS3)0.0000.7000.0000.8000.6000.4001.0000.9000.9000.9000.137
V (Terrain slope) (IS4)0.7840.8310.7430.8650.8030.7610.8180.9250.8180.7280.003
V (Land-use type) (IS5)0.0000.0000.0000.0000.0000.0000.0000.0000.0000.0000.000
V (Soil texture) (IS6)0.4560.3390.4560.6810.3990.6810.6810.4560.4560.4560.016
V (Distance from residential area) (IS7)0.3980.7860.0000.6560.2850.0000.9400.9130.8100.0000.152
V (Dominant wind direction) (IS8)1.0000.5321.0000.9980.6560.1520.7690.9650.5130.5320.082
V (Urban stream direction) (IS9)1.0000.8551.0000.8210.8400.8210.7020.8400.1540.1140.101
V (SSME) 0.4160.6020.3540.6570.4530.3900.7210.6610.5400.0000.044
EvaluationGVGMVGGMVGVGVGR-
Table 5. Siting suitability analysis in towns.
GradeMaolin TownYang TownHuaide TownQin TownShijiapu Town
R53.66%74.18%56.33%64.67%63.01%
P12.34%0.29%1.56%4.38%18.46%
M18.60%6.35%14.87%8.86%14.65%
G13.04%14.51%16.58%15.33%3.75%
VG2.36%4.67%10.67%6.75%0.13%
Max value0.6330.6030.6080.5800.540
Publisher’s Note: MDPI stays neutral with regard to jurisdictional claims in published maps and institutional affiliations.

