Article

Integrated Modeling of Agronomic and Water Resources Management Scenarios in a Degraded Coastal Watershed (Almyros Basin, Magnesia, Greece)

by
Aikaterini Lyra
1,*,
Athanasios Loukas
2,
Pantelis Sidiropoulos
1,2,
Konstantinos Voudouris
3 and
Nikitas Mylopoulos
1
1
Laboratory of Hydrology and Aquatic Systems Analysis, Department of Civil Engineering, School of Engineering, University of Thessaly, 38334 Volos, Greece
2
Laboratory of Hydraulic Works and Environmental Management, School of Rural and Surveying Engineering, Aristotle University of Thessaloniki, 54124 Thessaloniki, Greece
3
Laboratory of Engineering Geology and Hydrogeology, Department of Geology, Aristotle University of Thessaloniki, 54124 Thessaloniki, Greece
*
Author to whom correspondence should be addressed.
Water 2022, 14(7), 1086; https://doi.org/10.3390/w14071086
Submission received: 24 February 2022 / Revised: 24 March 2022 / Accepted: 27 March 2022 / Published: 29 March 2022

Abstract

:
The scope of this study is to assess the effects of agronomic and water resources management scenarios on groundwater balance, seawater intrusion, and nitrate pollution and the comparison of the developed scenarios relative to the current crop production and water management regime in the coastal agricultural Almyros basin in the Thessaly region, Greece. Agronomic and water resources scenarios have been simulated and analyzed for a period of 28 years, from 1991 to 2018. The analysis has been conducted with the use of an Integrated Modeling System for agricultural coastal watersheds, which consists of coupled and interlinked simulation models of surface water hydrology (UTHBAL), reservoir operation (UTHRL), agronomic/nitrate leaching model (REPIC), and groundwater models for the simulation of groundwater flow (MODFLOW) and contaminant transport of nitrates (MT3DMS) and chlorides (SEAWAT). The pressure on water resources has been estimated with the Water Exploitation Index (WEI+) and the reservoirs’ operation with the Reliability index to cover the water demands. The indices of Crop Water Productivity, Nitrogen Use Efficiency, and Economic Water Productivity have been used to quantify the benefits and the feasibility of the alternative scenarios. The best results for the sustainability of water resources are achieved under the deficit irrigation and rain-fed scenario, while the best results for water resources and the local economy are achieved under deficit irrigation and reduced fertilization scenario.

1. Introduction

Water scarcity and degradation are becoming an urgent problem around the world due to the rising water demand and emerging conflicts among water uses (urban, agricultural, industrial, and other water uses) [1]. The quantity and quality of water resources in many coastal agricultural watersheds are at a critical stage. The non-existence and/or the limited use of surface water reservoirs, the over-exploitation of groundwater resources, and over-use and application of fertilizers to maximize crop production result in lowering groundwater table and increasing nitrate concentrations and seawater intrusion [2,3,4]. Water resource management strategies in Europe increasingly focus on long-term sustainability [5] while also being in alignment with the Sustainable Development Goals (SDGs) of the United Nations for water, land use, efficient and resilient agriculture, decrease in poverty, provision of quality food, and protection of the environment and human health [6,7], the Water Framework Directive [8], and the Nitrates Directive [9]. In the context of an integrated modeling approach, simulation of the multi-scale dynamics of surface and groundwater systems can improve the understanding and modeling of complex interconnections of water systems. A holistic approach to the environmental and socioeconomic variables that may lead to quantitative and qualitative challenges with water sustainability can help to enhance their management, the development of improvement initiatives, and the setting of realistic timelines to achieve environmental targets [2,10,11,12]. Water scarcity has a direct effect on crop productivity in irrigated agriculture and the development and operation of surface water storages and reservoirs are directly associated with the alleviation of pressure ongroundwater resources [13,14]. In integrated water resource management, the conjunctive use of surface water and groundwater is a standard policy to meet the water needs and cope with the environmental impacts of anthropogenic activities [15]. A large number of studies have focused on the development of reservoir projects to tackle water scarcity and groundwater degradation [14,15,16,17,18,19,20,21,22,23,24,25,26,27,28,29]. Simulation is commonly used to find the best and/or optimized reservoir operation and groundwater use [20,30,31,32,33,34].
According to the Nitrates Directive, the River Basin Management Plans of Greece, and the European Commission’s for Best Management Practices in Agriculture, every Member State has to identify and protect Nitrate Vulnerable Zone (NVZs) and design one or more Best Management Practices (BMPs) to be voluntarily adopted by local agriculture professionals [9,35,36] because the effects of nitrogen fertilizer changes have a time-lag environmental response to achieve water quality improvements [12]. Every agronomic and water resources management scenario must also comply with legislative constraints to the benefit of human health and crop yield. The World Health Organization (WHO) has specified a short-term limit of nitrates concentration at 50 mg/L for potable water and the European Union has endorsed this restriction [9,37]. Greek and international legislation has set the upper threshold of 50 mg/L. However, the legislation recognizes that long-term consumption of water with nitrate concentration larger than 25 mg/L may cause health disorders in humans, including methemoglobinemia in neonates (i.e., blue baby syndrome), cancer, and thyroid problems [9,37,38,39,40]. The maximum permitted concentration of chlorides in urban water is established at 250 Cl mg/L, although lower concentrations are detectable in taste and may have been associated with health issues [2,41].
Particular attention and proper planning should also be placed upon seawater intrusion when irrigation occurs from coastal aquifers that have been salinized. Although chloride is classified as a nutrient in plants in approximate amounts of 100 mg kg–1 in soil, larger concentrations become toxic to crops and reduce the nitrogen uptake of the plants [42,43,44,45]. Chlorides take the place of nitrates during the nutrient uptake processes of crops and reduce crop yield, by causing crop nitrogen deficiency and/or salt accumulation in the leaf area and reducing its size (depending on the crop’s tolerance to salinity) [43,46]. The maximum allowable soil salinity for crops is 1–2 EC (dS/m) for alfalfa, maize, olives, trees, vegetables, and vineyards, and 6–8 EC (dS/m) for cereals, cotton, and wheat [47]. Cereals, wheat, and cotton are classified as moderately tolerant to tolerant crops to chlorides, alfalfa as moderately sensitive, most vegetables are moderately sensitive to sensitive, and maize, vineyards, and trees are most sensitive to moderately sensitive [42,47].
Metrics of resources efficiency, productivity, and economic and nutrient efficiency have been used for various water projects and agronomy practices in many scientific studies to determine whether a management policy is sustainable [48,49,50,51,52,53,54]. Water Exploitation Index (WEI) is an indicator to quantify water scarcity, Water Use Efficiency is an indicator to evaluate the impact of different irrigation scenarios on crop productivity, and Economic Water Productivity indicates the financial benefits of agronomical and water-saving practices to local stakeholders [48,51,55]. Nitrogen Use Efficiency indicators are used to estimate the productivity of various crops for different nitrogen applications [56]. The aforementioned metrics are very useful to integrate detailed results and communicate effectively to water resources managers and stakeholders the benefits and the economic sustainability of various alternative scenarios.
The problem of water scarcity and its consequences may be alleviated, or even reversed, by improving the efficiency of the agronomic and water management practices and the storage water works, increasing the socioeconomic and resources’ profits from their implementation [3,51,52,57]. The main objective of the present study is to assess the effects of agronomic and water resources management scenarios coupled with the development and operation of surface water reservoirs on groundwater budget, seawater intrusion, and nitrate pollution and the advantages of the scenarios’ schemes relative to the current crop production and water management regime in the coastal agricultural Almyros basin in Thessaly, Greece. The analysis has been conducted with a calibrated, validated, and high efficiency Integrated Modeling System for agricultural coastal watersheds, developed in an earlier study by Lyra et al. (2021), which consists of coupled and interlinked models of surface water hydrology, an agronomic/nitrate leaching model, and groundwater models for the simulation of groundwater flow and contaminant species of nitrates and chlorides [2]. A reservoir operation simulation model has been added to the previously developed modeling system, the optimization of which is presented for the first time in this study, with the aim to configure a tool that guarantees reliable irrigation projects and water management schemes depending on the irrigation demands of arable land and the changes of the irrigated crop pattern. Agronomic and water resources scenarios have been developed and simulated for a period of 28 years, from 1991 to 2018, while the groundwater quantity and quality are evaluated at the end of the simulation period (2018). The pressure on water resources has been estimated with the Water Exploitation Index (WEI+), and the reservoirs’ operation with a performance index of reliability to cover the water demands and the indicators of Crop Water Productivity, Nitrogen Use Efficiency, and Economic Water Productivity have been used to quantify the benefits and feasibility of each alternative scenario. The methodology presented in this paper provides an integrated and holistic approach for the simulation and evaluation of agricultural practices, water resources development scenarios, and climate change impacts on the quantity and quality of surface water and groundwater resources of coastal agricultural watersheds.

2. Materials and Methods
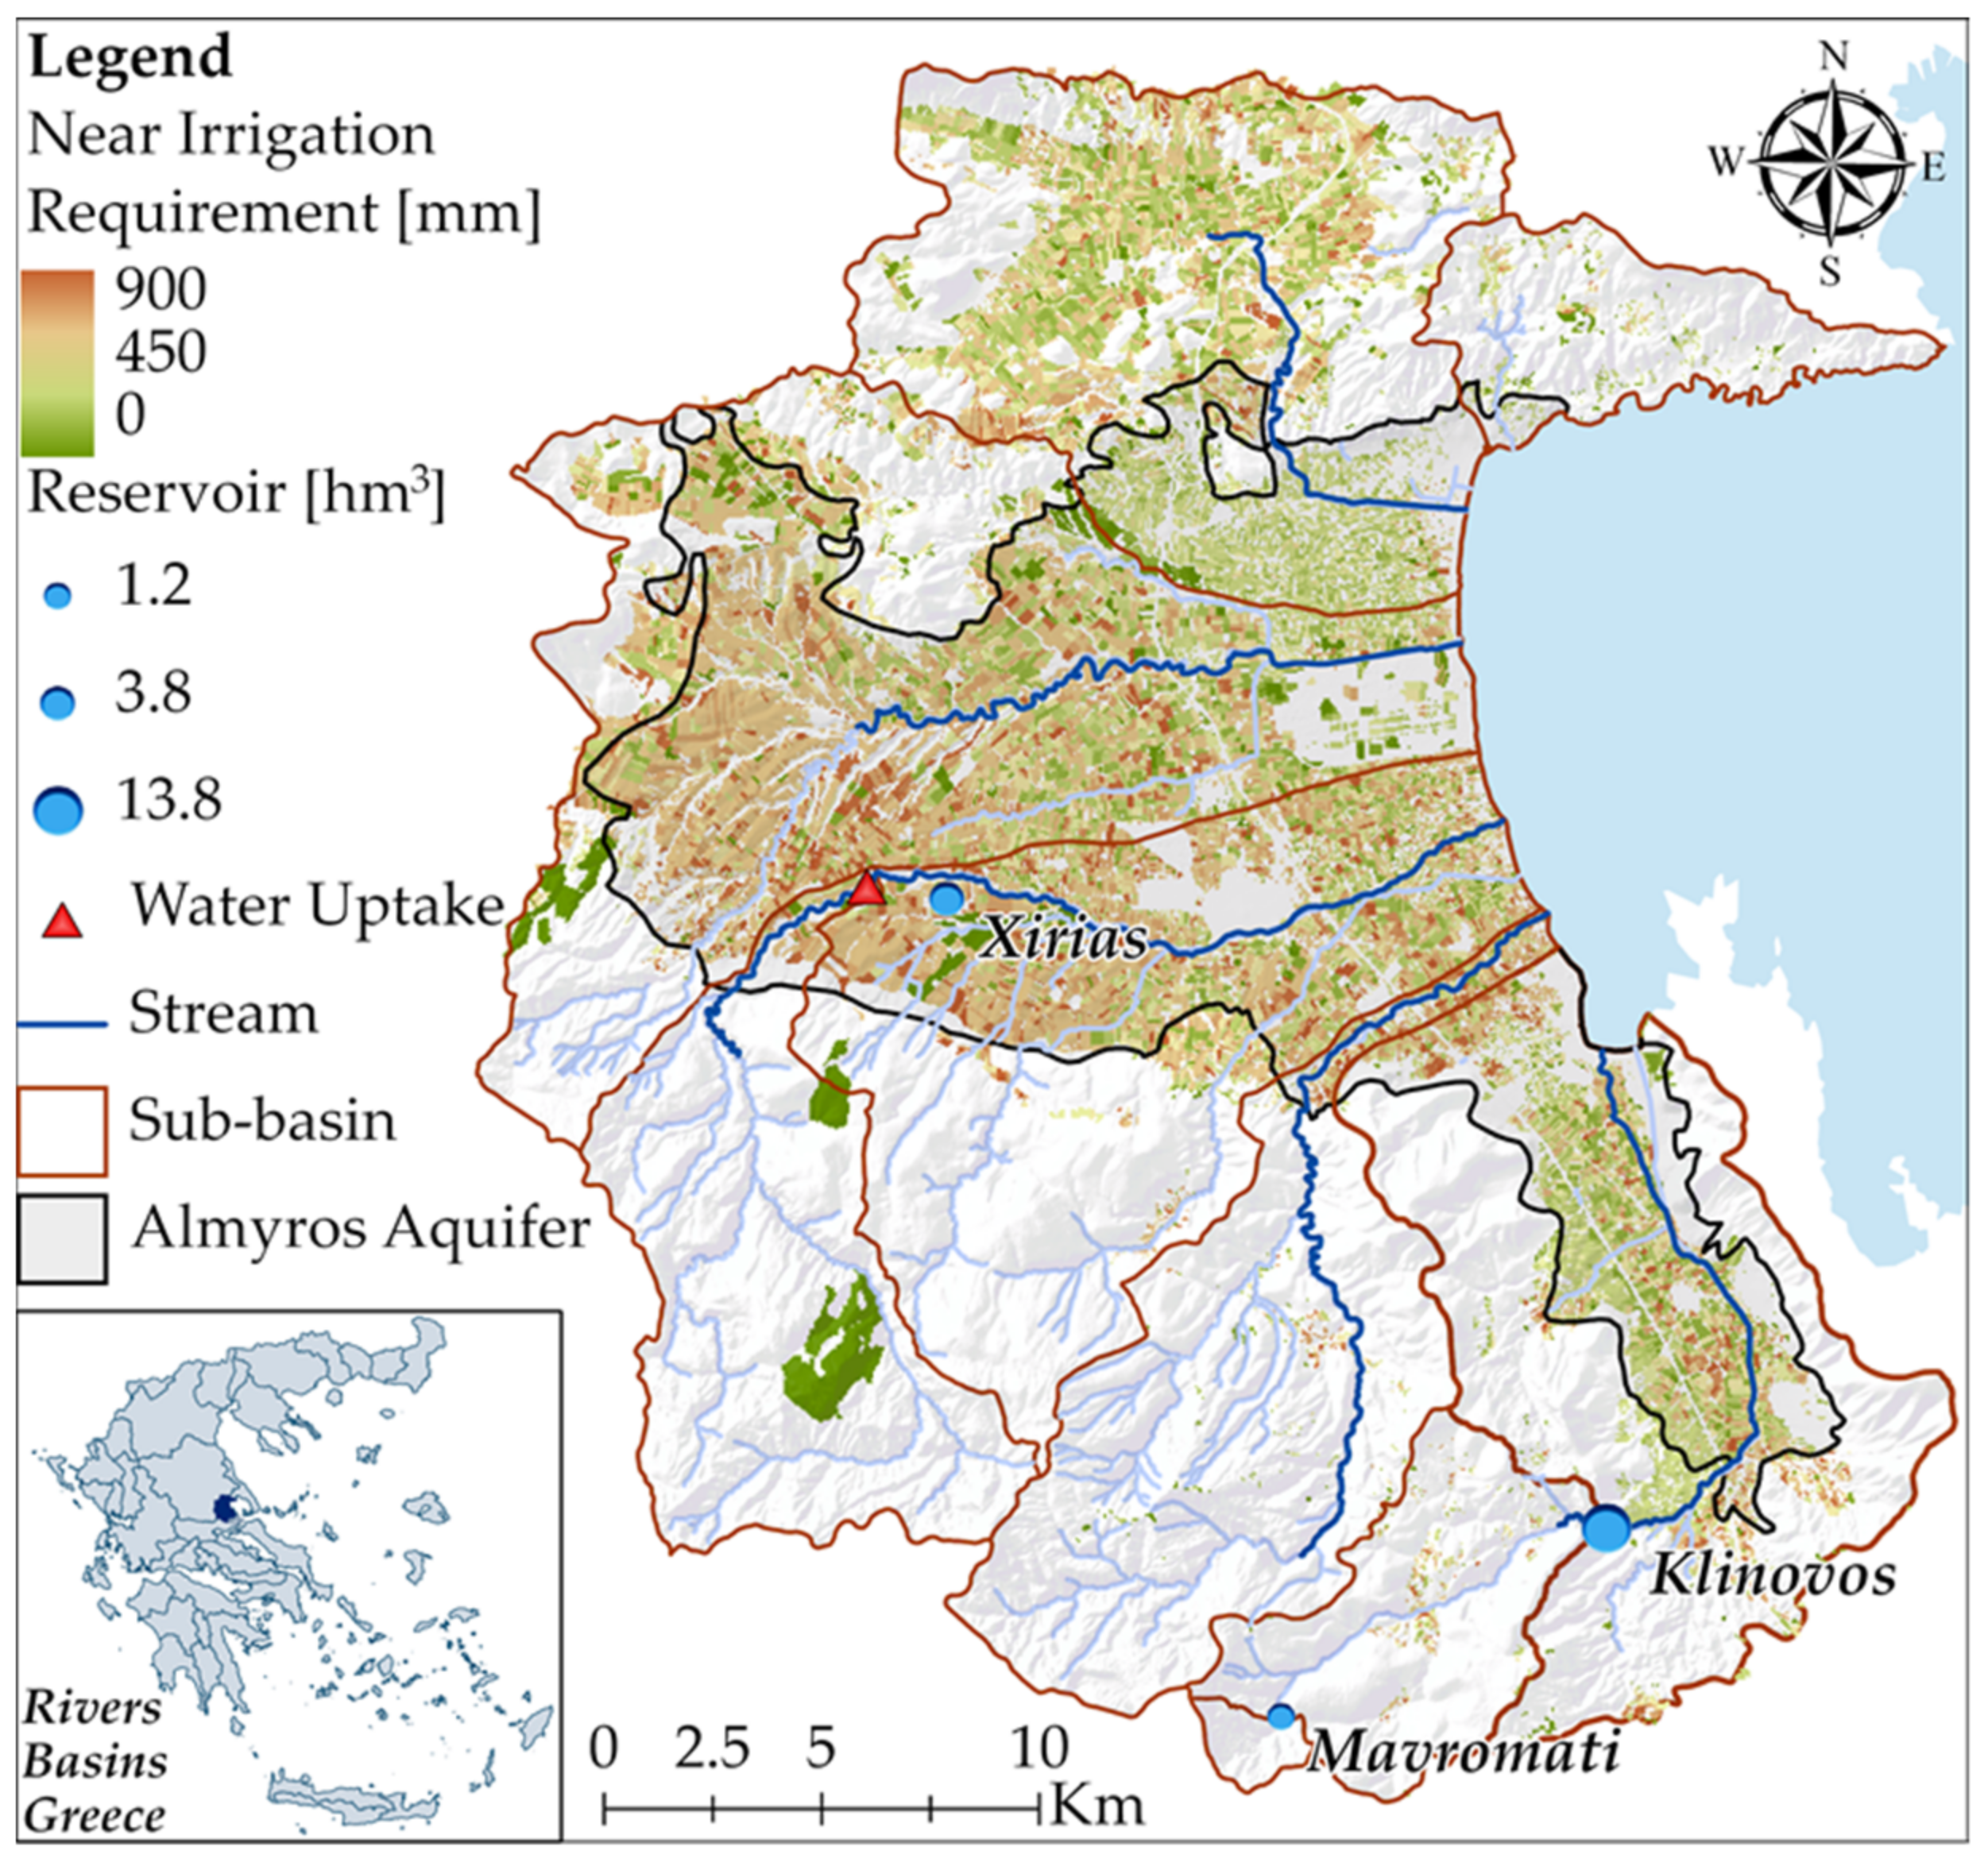
2.1. Study Area

The Almyros basin is located in the Thessaly region, central-eastern Greece (Figure 1). The total basin area is nearly 856 km2 with an elevation range of 0–1700 m and an average of 370 m. The basin has an intensively cultivated agricultural area of about 205 km2, which is mainly located in the area of the Almyros aquifer (Figure 1). The demands of irrigation and other water uses are totally covered by groundwater abstractions.
The basin has a semi-arid Mediterranean climate with hot, dry summers but chilly and rainy winters. The mean annual rainfall is about 570 mm with a range of 509–778 mm with elevation, and the mean annual temperature is 15.0 °C with a range of 9.8–16.9 °C with elevation. The estimated mean annual surface water runoff is about 113 mm, and the mean annual aquifer recharge is about 54 mm [2]. The hydrographic network of the basin is characterized by torrential streams with temporary flow. The basin is subdivided into six sub-watersheds, namely, Kazani, Lahanorema, Holorema, Xiria, Platanorema, and Xirorema (Figure 1). The basin is coastal, while the Almyros aquifer occupies the lowland area of the basin and is in contact with the sea.
The lowland near the shoreline is largely made up of sandy porous solids with clay layers. Clay lenses and clay, sand, and gravel intercalations with volcanics and conglomerates provide low permeability complexes at the western and the upper height zones. Limited limestone outcrops form karst aquifer systems within the southernmost part of the region, which provide physical communication to the sea (open karst) but are not in hydraulic conduct with the alluvium aquifer. The quantity and quality status of the aquifer is degraded and the problems of water table drawdown, nitrate pollution, and seawater intrusion are present in recent years (Figure 2).
All the water demands (i.e., agricultural, urban, and industrial) in the Almyros basin are satisfied by unsustainable groundwater pumping. The local authorities have already proceeded with the construction and operation of the Mavromati reservoir to alleviate and mitigate the water quantity and quality problems. The Mavromati reservoir was constructed to cover the urban water supply needs of villages located in and in the vicinity of the southernmost sub-watershed of Almyros basin (i.e., Xirorema sub-watershed) (Figure 3). At present, there are not any other water storages in the basin and all water needs are currently being covered by groundwater abstractions.
A reservoir is under construction, the Xirias reservoir, which is designed to cover crop irrigation needs in the central part of the area and improve the quality of groundwater by preventing seawater intrusion [36,58]. Furthermore, this study proposes the development of a larger reservoir, the Klinovos reservoir, to cover the irrigation needs of agricultural areas in the Xirorema sub-watershed. Klinovos reservoir is located downstream from the Mavromati reservoir (Figure 1).
The Xirias reservoir has been designed to cover the irrigation needs of 7 km2 of arable land. The construction of the storage work includes a water uptake dam from the Xirias stream, water pipelines from the dam to the reservoir, and also an adjacent sedimentation tank. The artificial reservoir will be 600 × 600 m in dimensions, with a storage capacity of approximately 4 hm3 and zero dead storage [58,59]. The Mavromati reservoir is located in the highlands of the Xirorema sub-watershed and, as a first stage, is intended to cover the drinking water needs of 9 villages. The reservoir has a storage capacity of approximately 1.2 hm3 and dead storage of 0.0003 hm3 [58,60]. The Klinovos reservoir is proposed in an earlier study [61] to cover the irrigation needs of the southern region, and to recharge the Almyros aquifer. The proposed reservoir will have an active storage capacity of approximately 14 hm3 and dead storage of 0.002 hm3 [61]. The characteristics of reservoir sub-watersheds are presented in Table 1. This information is used in the hydrologic simulation of the sub-watersheds.

2.1.1. Crop Water Demands

Based on factual datasets supplied by the Greek Payment Authority of the Common Agricultural Policy, irrigation water demands for every main crop type have been estimated in a recent analysis [2]. Alfalfa, cereals, cotton, maize, olive groves, trees, vegetables, vineyards, and wheat are the main crops cultivated in the Almyros basin. The spatial annual average of the Near Irrigation Requirements (NIR) of the crops cultivated in the wider Almyros watershed is presented in Figure 1. Various scenarios of water supply, irrigation methods, and fertilization have been developed and applied. An analytical description of these scenarios is presented in Section 2.4.

2.1.2. Urban Water Demands

The demographic data of Almyros’ Municipalities and satellite areas were obtained by the Hellenic Statistical Authority using censuses’ estimates of the years 1991, 2001, and 2011 for the permanent population. The monthly percentage variation of annual drinking water needs is estimated as 8% for October, 5% for November, 5% for December, 5% for January, 5% for February, 6% for March, 8% for April, 10% for May, 12% for June, 13% for July, 13% for August, and 10% for September [62]. Between 1991 and 2001 the total annual water demand for the urban areas supplied by the Almyros aquifer system was 0.53 hm3, from 2001 to 2011 was 0.46 hm3, and from 2011 to 2018 was 0.45 hm3. The Mavromati reservoir is intended to supply nine (9) residential areas with drinking water, inside and outside the Almyros basin (Table 2). The locations of the demand sites supplied with water from the Mavromati reservoir are illustrated in Figure 3.

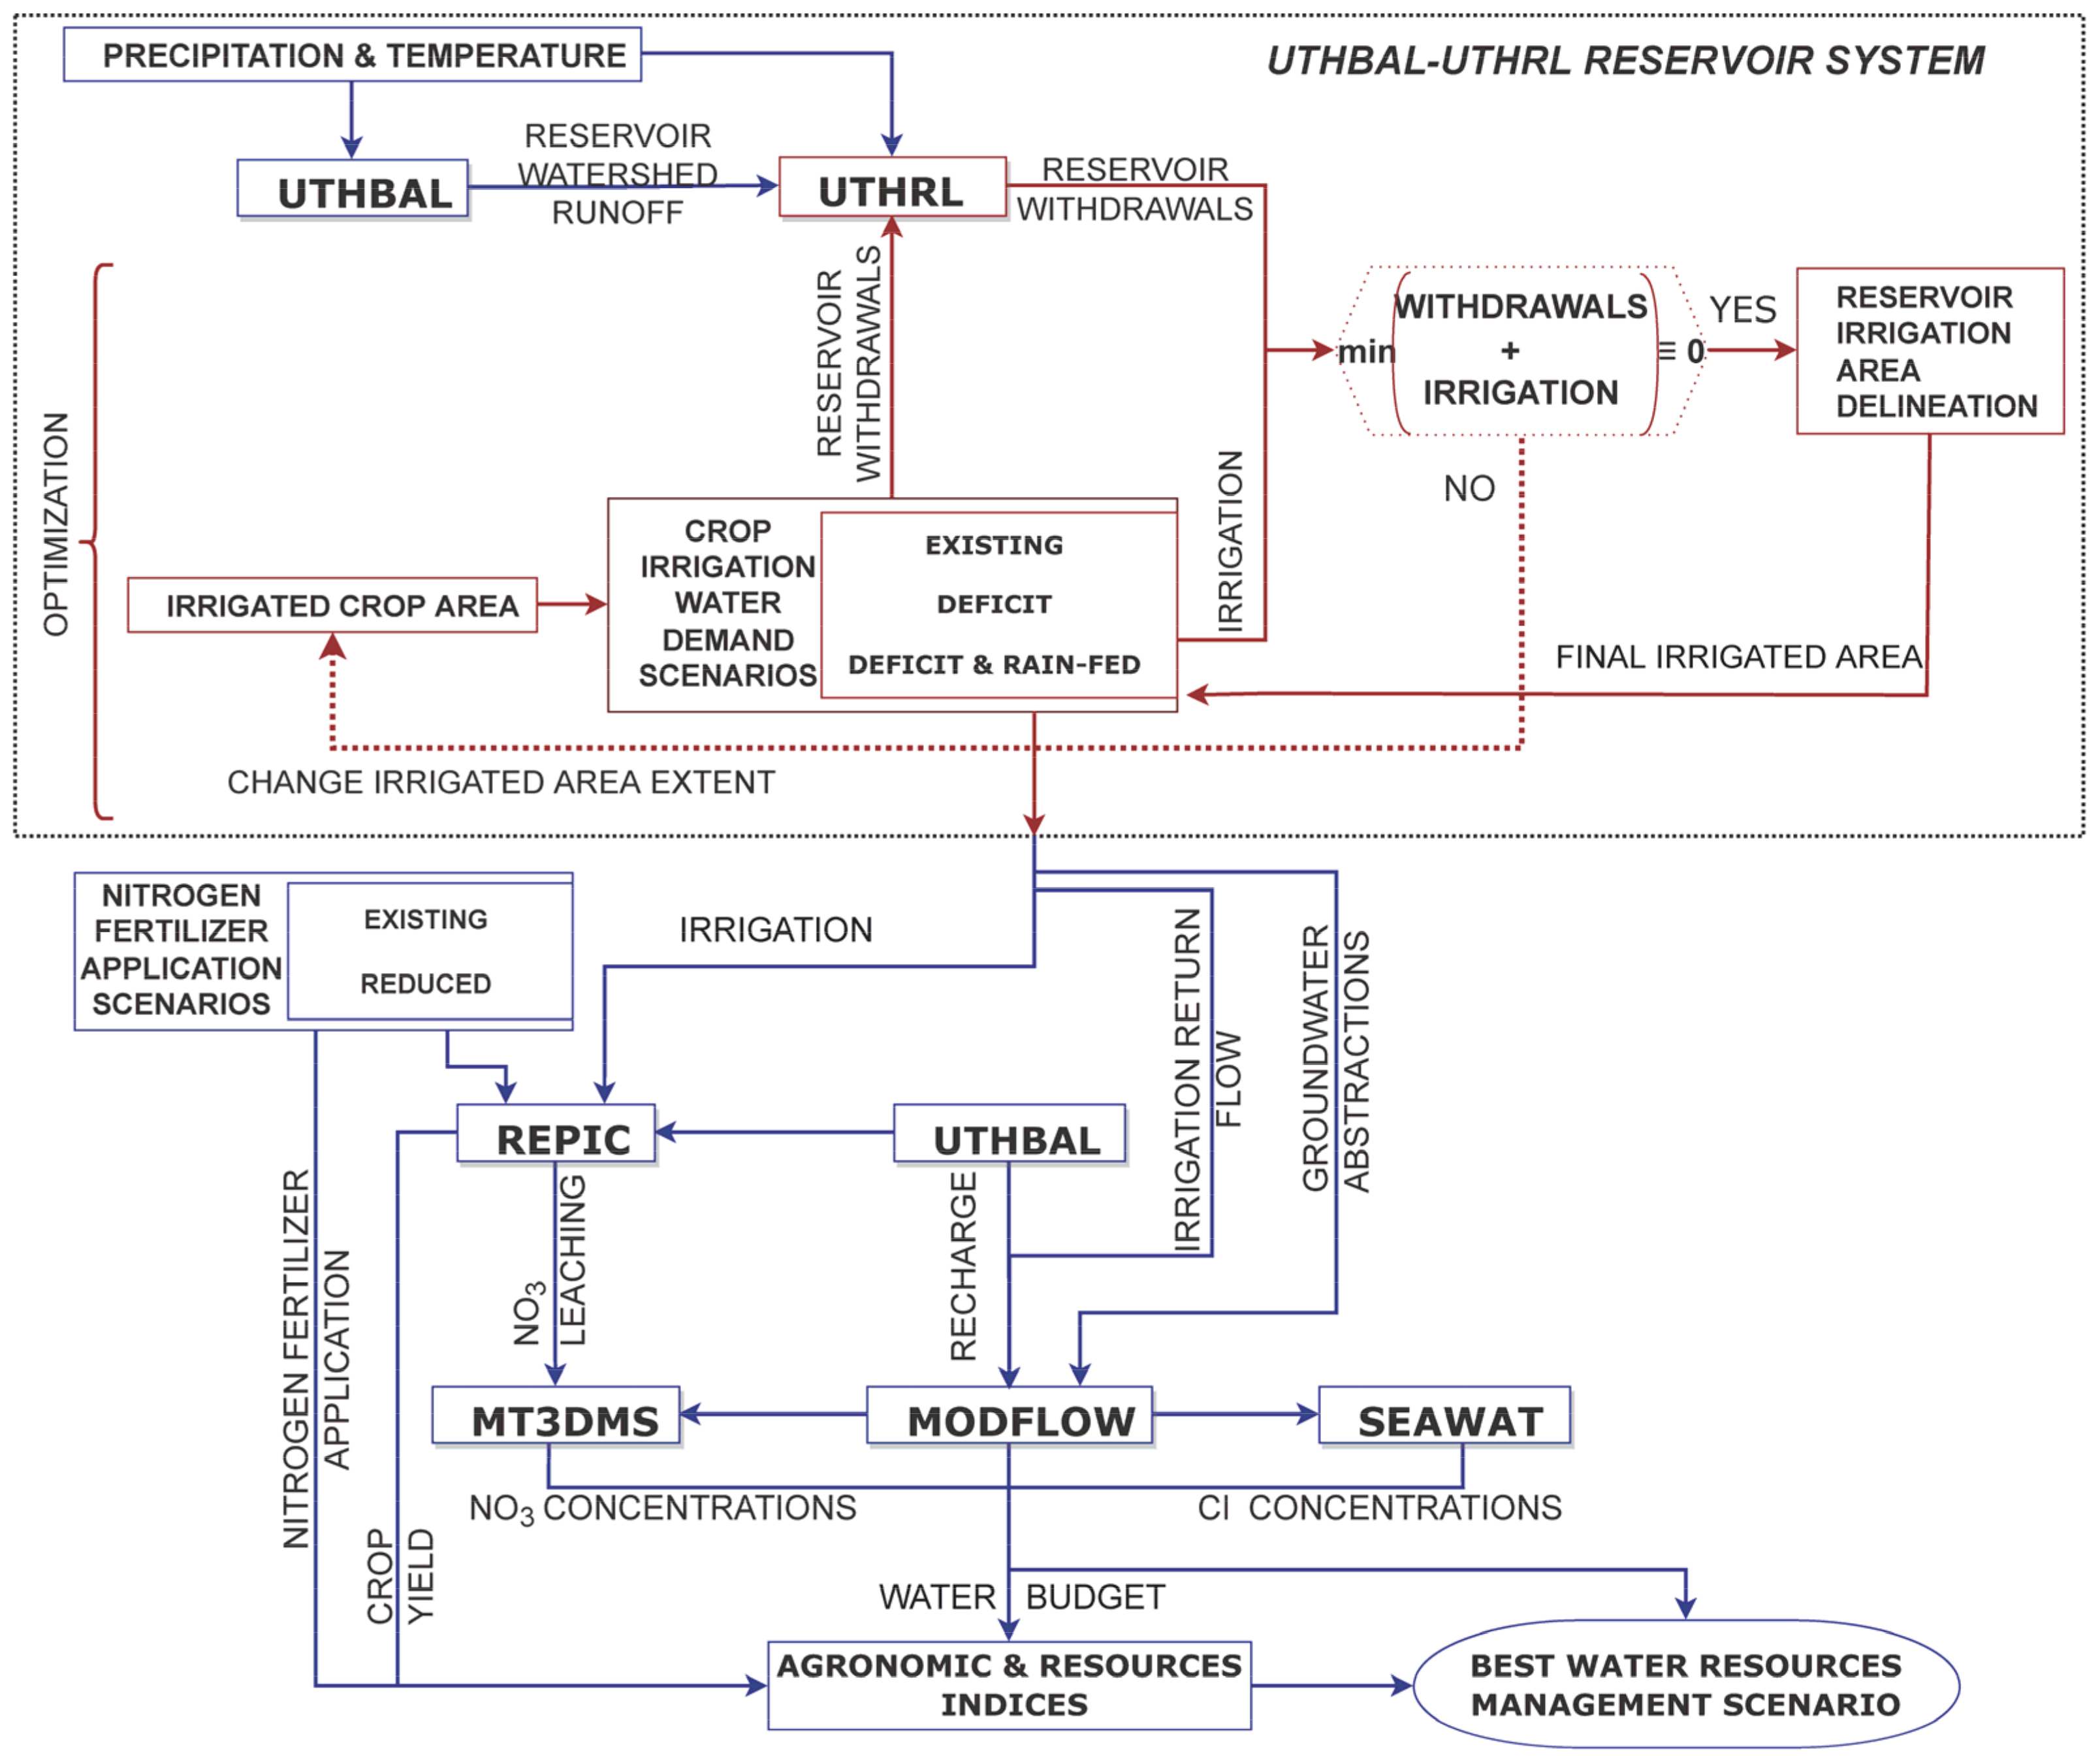
2.2. Integrated Modeling System

An Integrated Modeling System developed in an earlier study has been used for the simulation of surface water and groundwater resources of the Almyros basin. The System consists of coupled models for the simulation of surface hydrology (UTHBAL) [16], reservoir operation (UTHRL) [16], groundwater flow (MODFLOW) [63], agronomic crop schedules and nitrates leaching (REPIC) [2], an R-ArcGIS [64] based EPIC model [65]), groundwater nitrate transport (MT3DMS) [66], and groundwater seawater intrusion (SEAWAT) [67]. The modeling system has been expanded to include a reservoir/lake operation model (UTHRL) to simulate the operation of surface water storage works [16]. The monthly areal precipitation, temperature, and potential evapotranspiration are inserted in the surface hydrology model (UTHBAL) which estimates the monthly watershed runoff and the natural groundwater recharge. The weighted average irrigation return flow per sub-basin and main crops are then added to the recharge. The watershed runoff is the input of the reservoir operation model (UTHRL) along with other possible inflows, the reservoir’s storage capacity, the desirable withdrawals from the reservoir, the direct precipitation and evaporation from the reservoir’s surface, and the losses toward groundwater. The total of natural recharge, irrigation return flow, reservoir’s groundwater losses, the sea level, and the shoreline conductance are the input to the groundwater hydrology model (MODFLOW), whereas the outflows are designed as wells that are assigned with monthly flow units according to the agricultural and urban and other water demands. The agronomic practices are simulated with the crop growth/nitrates leaching model (REPIC) by modifying for each management application the irrigated water and the fertilization amounts for each crop type. The input data include climatic, land use, and other variables, and crop cultivation schedules and other parameters, while the outputs of the model are the crop yield and the nitrate leaching to groundwater. The nitrate leaching calculated by the agronomic model (REPIC) is used as input to the groundwater pollution model (MT3DMS), and the concentrations of chlorides are the input to the seawater intrusion of variable density model (SEAWAT). The flow chart of the Integrated Modeling System is presented in Figure 4.
The Integrated Modeling System is applied and used in the Almyros basin on a semi-distributed mode (i.e., sub-watershed, aquifer scale) to estimate the water balance of the basin and the aquifer, as well as the concentrations of nitrates and chlorides in groundwater for the developed and applied scenarios. Figure 2 presents the results of the baseline scenario for September 2018.
The simulation of water resources requires databases of a wide range of measured variables that span over many years of monitoring for calibration and validation purposes of the models. Meteorological variables (e.g., precipitation and temperature), water table measurements of wells, and groundwater nitrates and chloride concentrations were also required and used in the analysis. Land use and crop type data were used to estimate the crop irrigation demands, number, and groundwater well abstractions. Meteorological data were collected by various governmental organizations and agencies, pre-processed, and validated; land use cultivated fields and crop data yielded across the aquifer were provided by the Greek Payment Authority of Common Agricultural Policy (C.A.P.) Aid Schemes (OPEKEPE). Soil characteristics of unsaturated zones were obtained from the European Soil Data Centre (ESDAC) [68], (OPEKEPE), and National Agricultural Research Foundation (NAGREF); hydrogeological borehole data from the Greek Ministry of Agriculture; and observation data of water table, nitrate concentrations, and chloride concentrations by the Institute of Geology and Mineral Exploration (IGME), the Regional Government of Thessaly, and the Magnesia Prefecture. Last but not least, nitrate concentrations measurements and chloride observation measurements for the years 2013 to 2015 were performed in the Almyros aquifer in previous research studies [69,70]. Known locations of pumping wells were extracted by regional well maps and the National Register of Water Abstraction Points from Surface and Underground Water Bodies [71].

2.3. UTHBAL–UTHRL Reservoir System–Optimization Module

The surface hydrological model (UTHBAL) and the reservoir’s operation model (UTHRL) are also connected with the extents of the irrigated areas of the various crop types that are cultivated in the simulated sub-watersheds of the Almyros basin. A control condition to quantify the adequacy of the water storage works against the crop water demands has been added to the processes of simulation. At least, the average annual withdrawal rate of water from the reservoir has to be approximately equal or close to the average annual irrigation needs of the cultivated crop pattern. The operation of the two models is optimized by changing the cultivated area of each crop (crop pattern), calculating the irrigation needs, and setting them as reservoir withdrawals. The loop to find the optimum water withdrawals is continued until the desirable balance is reached. Then, when the irrigated area is delineated, the simulation continues deterministically, as described in the previous paragraph. This module is particularly useful to minimize the designation time of the appropriate but unknown irrigated extent area by the reservoir and provide feasible solutions. The UTHBAL–UTHRL Reservoir System-Optimization Module extends the Integrated Modeling System (IMS) developed in an earlier study [2]. In this study, the impact of the development and operation of surface storages (i.e., reservoirs) along with various irrigation and fertilization practices on the water balance and quality of the Almyros aquifer is assessed. The updated IMS may be used for simulating the impacts of various agricultural policies and schemes, such as agronomic practices, changes in crop pattern, implementation of Best Management Practices. Furthermore, the specific module may also be used for estimating and designing water resources projects for future climate conditions and scenarios.
This optimization procedure has only been followed for the proposed Klinovos reservoir. For the other two reservoirs, Mavromati and Xirias, the design values have been used without optimization because they are either constructed and operated (e.g., Mavromati reservoir) or near construction completion (e.g., Xirias reservoir). The flowchart of the Integrated Modeling System and the Reservoir Simulation-Optimization Module is shown in Figure 4.

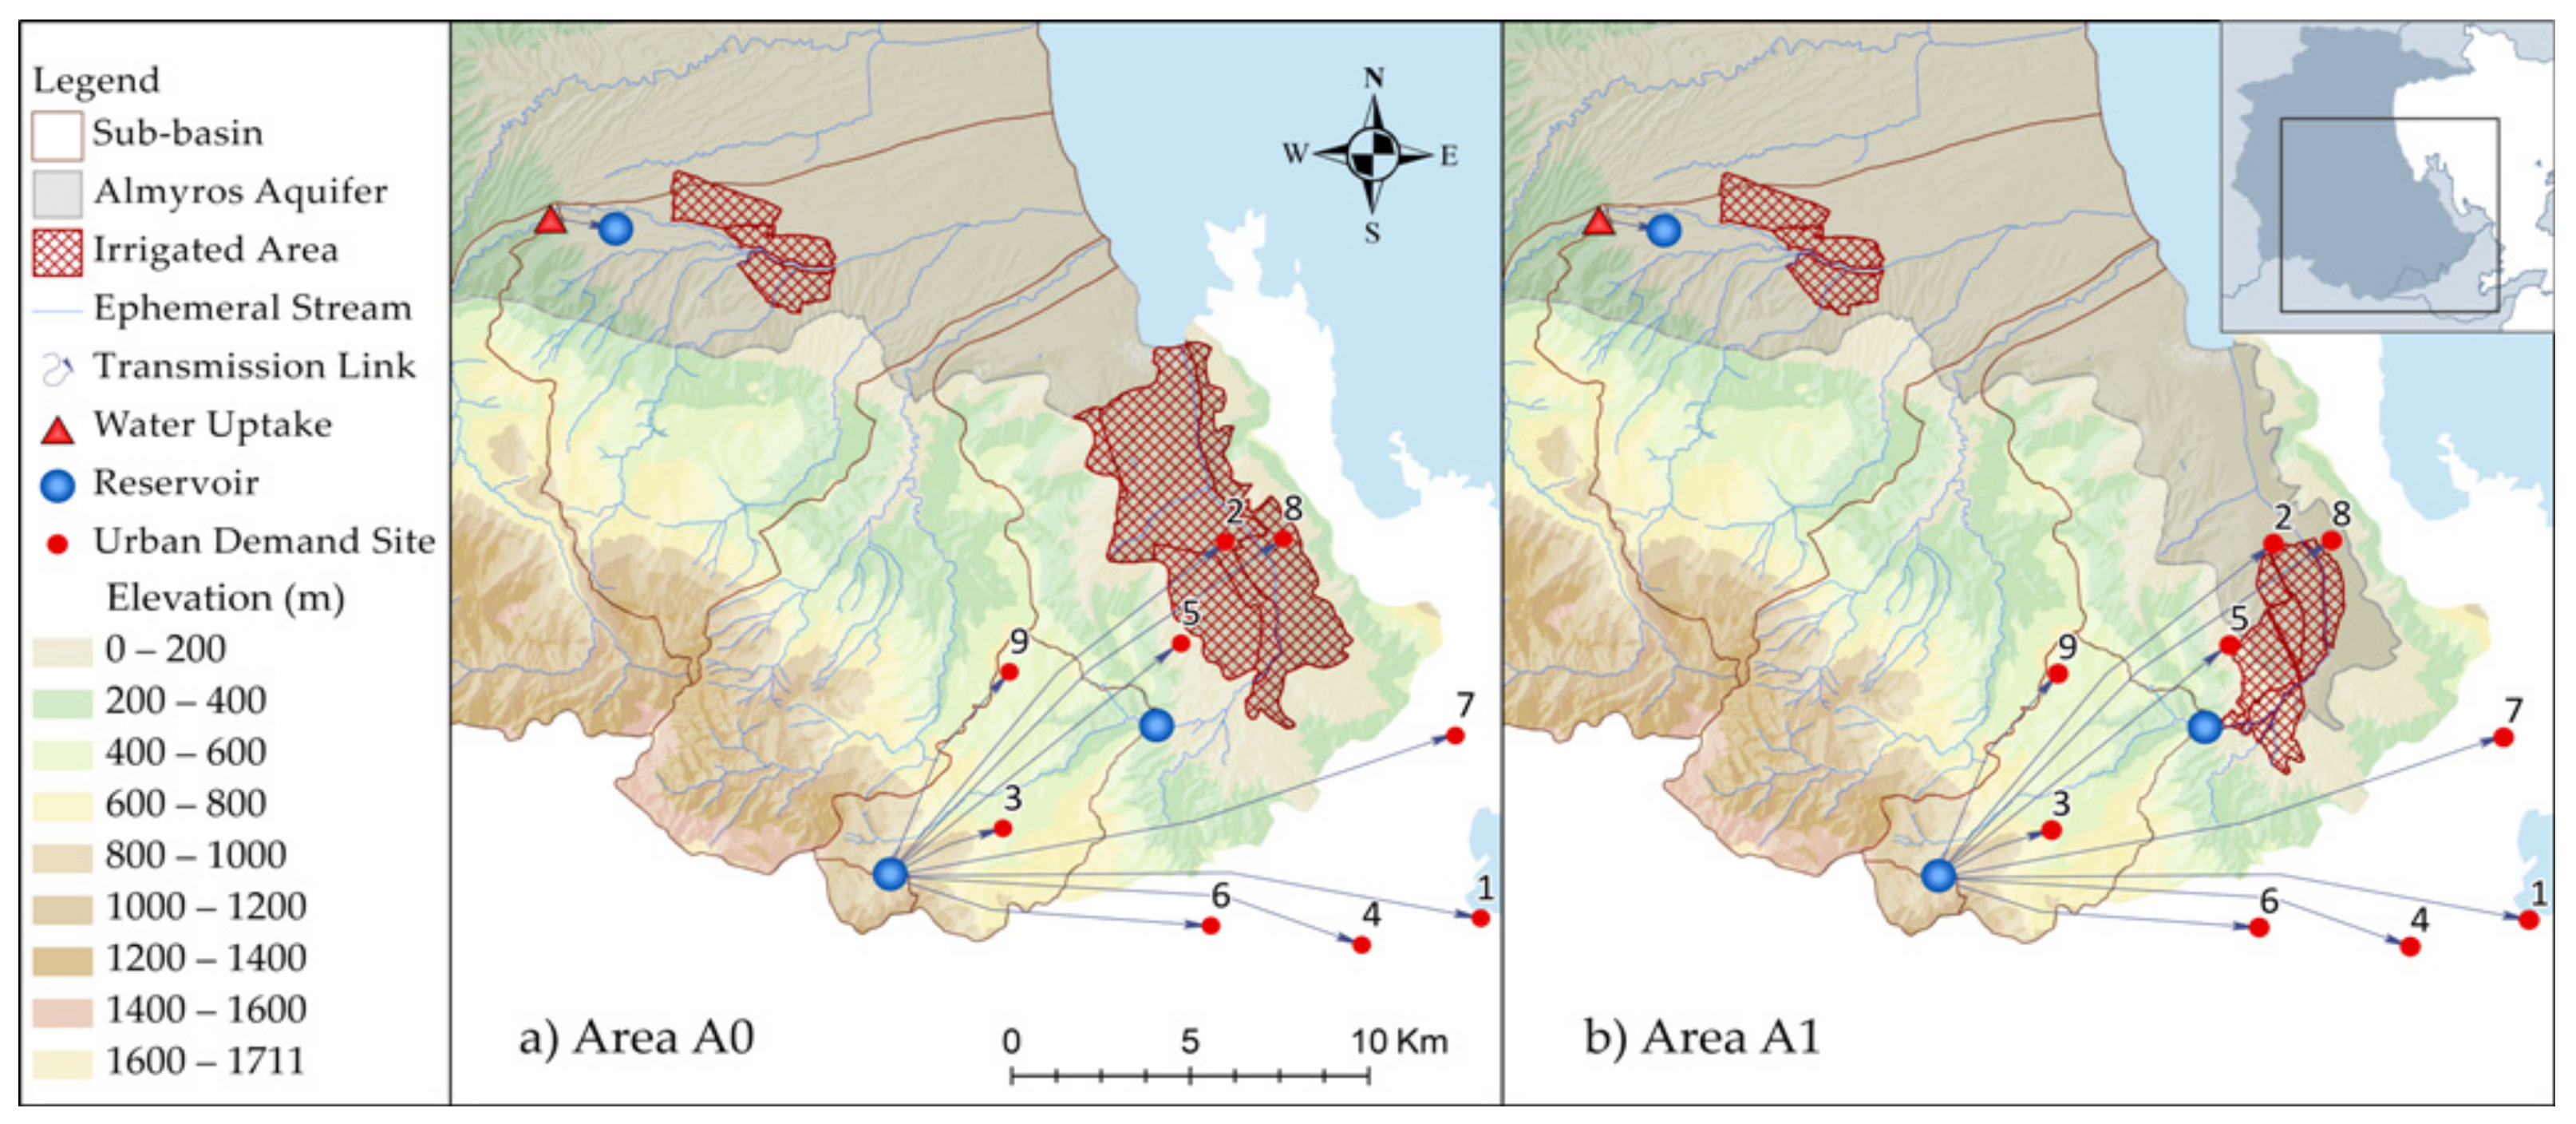
2.4. Agronomic and Water Resources Management Scenarios

A baseline scenario (S0) has been developed for comparison with other water resources and agronomic scenarios. In this baseline scenario, existing irrigation methods and fertilization applications are applied for all crops, and the water demands for all water uses (i.e., irrigation, urban, industrial, and tourism water use) are satisfied by groundwater pumping. This baseline scenario represents the existing agricultural and water resources management in the Almyros basin [57].
An alternative scenario (SR0) has been developed to assess the contribution of reservoirs, which is similar to S0, but the water demands for all water uses are satisfied through withdrawals from the reservoirs and groundwater pumping. This scenario uses, as scenario S0, the existing irrigation methods and fertilization applications. It is also coupled with the two proposed irrigated areas of Klinovos reservoir A0 and A1, explained later. Thus, two baseline alternative sub-scenarios are developed SR0-A0 and SR0-A1, for irrigated areas A0 and A1, respectively. Similar to the logic of SR0, two types of agronomic scenarios have been combined and simulated for irrigation water and fertilizer applications. Based on literature field experimental results in the Mediterranean areas and Greece, Crop Water Productivity (CWPI) can be increased with deficit irrigation, which is the reduction in applied irrigation at a ratio of crop water demands, and/or with rain-fed cultivation, which is the absence of irrigation for the crop types that can grow based only on natural precipitation. Nitrogen Use Efficiency (NUE) can be increased by reducing the nitrogen fertilization applied to crops. In a previous study for the Almyros basin [57], scenarios of Deficit Irrigation, Deficit Irrigation and Rain-fed cultivation, and the Reduced Nitrogen Fertilization amounts for the main crops had been studied and applied based on results of field experiments in Greece and the Mediterranean area for the major crops of the study basin [53,54,72,73,74,75,76,77,78,79,80]. Specifically, irrigation water reduced for alfalfa at 90%, cereals at 80%, cotton at 80%, maize at 90%, olive groves at 89%, trees at 76%, vegetables at 90%, vineyards at 60%, and wheat at 80% of crop water demands ensure optimized irrigation and yield. Nitrogen fertilization, reduced for alfalfa at 93% (28 kg/ha), cereals at 60% (60 kg/ha), cotton at 78% (109.5 kg/ha), maize at 31% (100 kg/ha), olive groves at 80% (91.2 kg/ha), trees at 73% (128 kg/ha), vegetables at 80% (120 kg/ha), vineyards at 48% (60 kg/ha) and wheat at 64% (102 kg/ha), ensure optimized yield. These scenarios are applied during the implementation of the agronomic and irrigation scenarios, but also in the simulation of the operation of the reservoirs (Table 3).
The irrigated area from the Xirias reservoir has been defined by the reservoir project study and is used in this work [59]. However, the irrigated area from the proposed Klinovos reservoir is unknown, as the reservoir and surrounding irrigation network have not been designed yet. Hence, this study examines the reservoir’s efficiency to irrigate two cases of crop areas. The first case, Area (A0), considers an irrigated area of 23 km2, which has been set in past studies [3,60] while the second case, Area (A1), considers an optimized irrigated extent.
The irrigated croplands from the Xirias and the Klinovos reservoirs are presented in Table 4 and their location is shown in Figure 3.
The crop pattern of Area (A1) has been optimized with the use of the UTHBAL–UTHRL System and Optimization module on known spatial land use data of the region, and the delineation of the irrigated area includes 10 km2 of arable land. The historical crop pattern consists of alfalfa, cereals, cotton, maize, olive groves, trees, vegetables, vineyards, and wheat cultivars.

2.5. Reservoir Reliability and Efficiency Indices

The potential performance of a water resource system can be evaluated with a variety of performance indices, although the results of the Integrated Modeling System are very detailed. In this study, the resource efficiency is estimated with several indices, namely, the Water Exploitation Index (WEI+), the Reservoir Reliability, the Crop Water Productivity (CWPI), the Economic Water Productivity (EWPI), and the Nitrogen Use Efficiency for the current historical and the agronomic and water resources scenarios.

2.5.1. Water Exploitation Index

Water scarcity is estimated with the Water Exploitation Index (WEI+) for watersheds and basins or monthly and seasonal timesteps. The index is calculated based on the annual freshwater abstractions to the long-term average of the renewable resources (LTAA) for a time of at least 20 years. Based on the data from [81], the WEI+ value for the whole Thessaly region is, on average, 53% in spring, 35% in summer, 44% in winter, and 10% in autumn, and the annual average is 33% from 1990 to 2015. A WEI+ score larger than 20% denotes that a water system is under pressure, and a WEI+ score larger than 40% reveals tremendous pressure and explicitly inefficient resources use [82]. The Water Exploitation Index (WEI+) can be estimated for watersheds and aquifers by defining the water demands and renewable resources, as shown in Equations (1) and (2).
WEI + W a t e r s h e d = Water   Demand   Irrigation ,   Urban   and   other per   year Renewable   Surface   Water   +   Groundwater   Volume  
WEI + G r o u n d w a t e r = Groundwater   Abstractions per   year Renewable   Groundwater   Volume

2.5.2. Reservoir Reliability

The reservoirs’ performance has been estimated for their given ability from the sur-rounding hydrological conditions and regional climate to supply water and fully cover the drinking and irrigational demands. According to Hashimoto et al. (1982), the reliability of a water resources system can be defined as “how often the system fails” its purpose. Let Xt be a random discrete variable in a time step t. The possible system’s response can belong, in its simplest form, to one of two sets of values that denote either success or satisfactory result and failure or unsatisfactory result. The reliability is then the possibility a system’s response falls within the satisfactory set of values. The reliability performance index α, for a number of timesteps n, and a variable Xt that is larger than a specified variable XT, α is given in Equation (3) [83].
R e l i a b i l i t y   α = n u m b e r   o f   t i m e s   X t X T n
The reliability performance index has been estimated for the three reservoirs and all the agronomic and water resources management practices to assess the storage waterworks capability to cover the water demands.

2.5.3. Agronomic Indices

Indices of the productivity of the simulated water uses, aquifer budget, crop yield, and nitrogen fertilization have been integrated to assess the efficiency of the agronomic and water management scenarios in improving the farmland benefits. The scenario results have been also compared to the baseline (historical) scenario, in which the traditional practices are implemented. The Crop Water Productivity index (CWPI) for the applied irrigation water and the crop yield is estimated based on the simulation results of the REPIC model, the groundwater abstractions of the MODFLOW model, and the reservoir withdrawals of the UTHBAL–UTHRL System module for the Almyros cropland. The Crop Water Productivity for irrigation water is given in Equation (4) [51]:
C r o p   W a t e r   P r o d u c t i v i t y   C W P I = C r o p   Y i e l d   k g   ha 1   I r r i g a t i o n   W a t e r   m 3 ha 1
The Economic Water Productivity (EWPI) index for the applied irrigation water and Gross Profits of the crop yield is estimated based on the simulation results of the REPIC model, the groundwater abstractions of the MODFLOW model, and the reservoir withdrawals of the UTHBAL–UTHRL System module and the marketable product prices. The marketable product prices have been obtained from publicly available data of the Hellenic Statistical Authority already in the base year of 2015, from 2000 to 2018.
The Economic Water Productivity is given in Equation (5) [51]:
E c o n o m i c   W a t e r   P r o d u c t i v i t y   E W P I = P r o f i t   EUR   ha 1 I r r i g a t i o n   W a t e r   m 3 ha 1
The Nitrogen Use Efficiency index (NUE) for applied nitrogen fertilization and the crop yield is estimated based on the inputs and simulation results of the REPIC model, and for the long-term estimation of yields and resources is estimated as partial factor productivity. The Nitrogen Use Efficiency is given by Equation (6) [56]:
N i t r o g e n   U s e   E f f i c i e n c y   N U E = C r o p   Y i e l d   ( k g   ha 1 ) N i t r o g e n   A p p l i e d   ( k g   ha 1 )

3. Application—Results

The results of the Integrated Water Resources Modeling System in the Almyros basin for the developed agronomic and water resources management scenarios are presented and discussed in the next paragraphs.

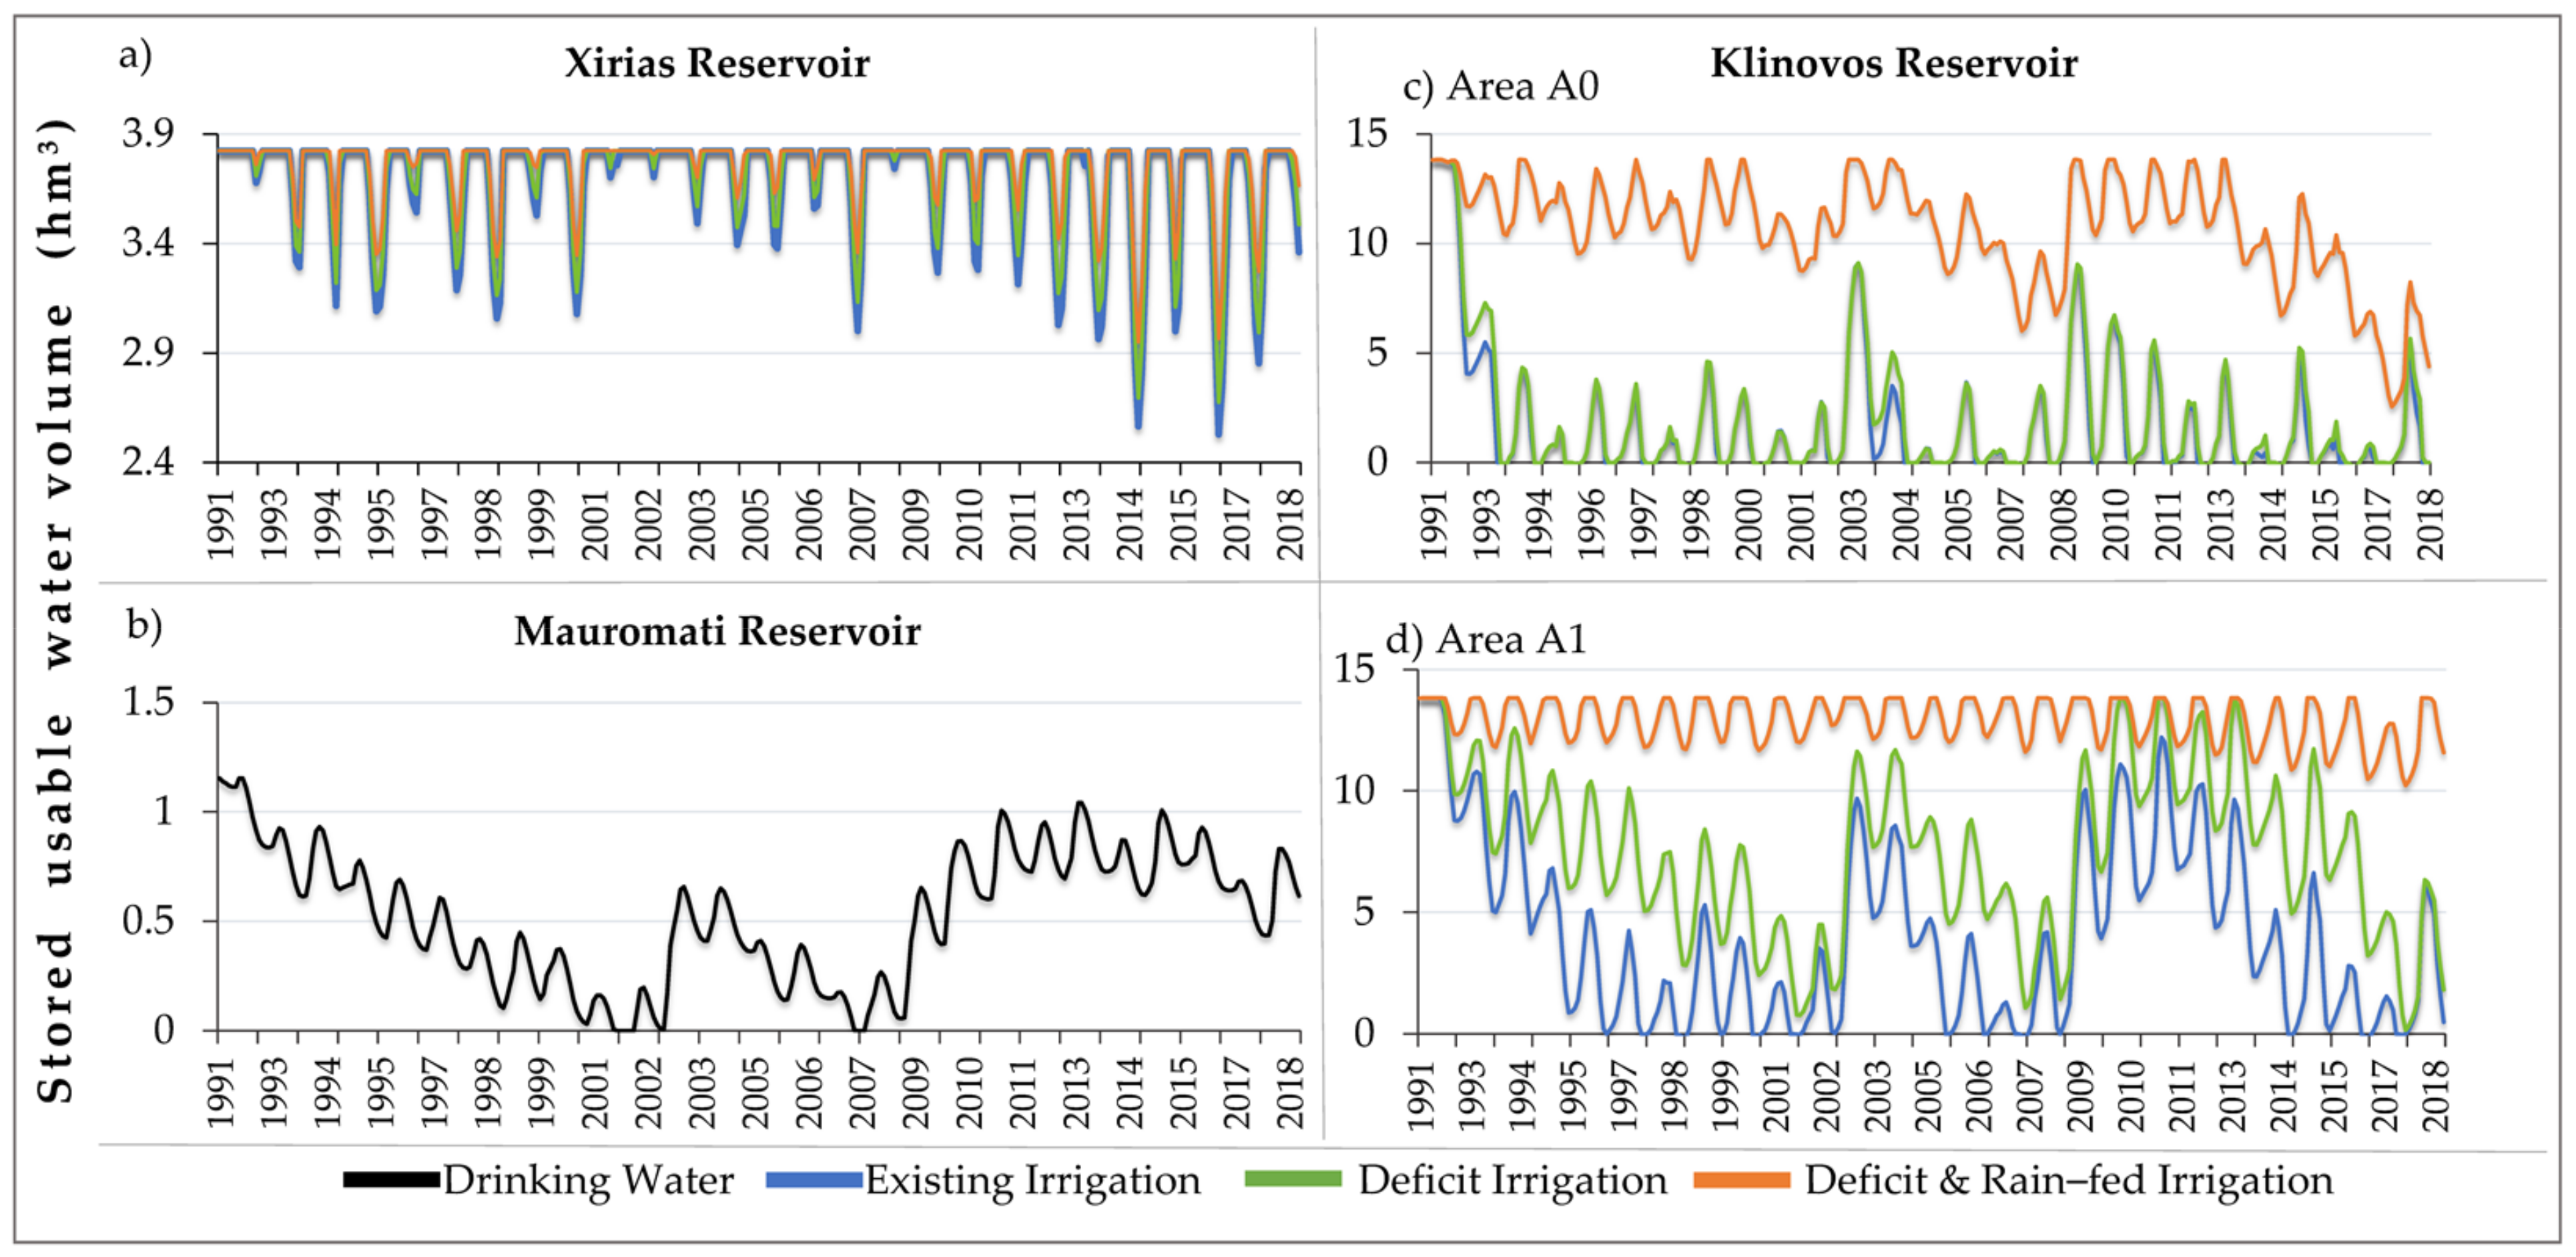
3.1. UTHBAL–UTHRL Surface Hydrology and Reservoir Simulation

The UTHBAL model was used for the simulation of monthly surface runoff and groundwater recharge of the Almyros basin in the semi-distributed model (sub-watersheds), for the period October 1991 to September 2018. The results of the UTHBAL model for the sub-watersheds of the Almyros basin without considering the operation of reservoirs (baseline scenario) have been acquired in a previous study [2]. In the present study, the inflows to the existing and proposed reservoirs have been estimated. The monthly areal precipitation, temperature, and potential evapotranspiration have been estimated at the mean elevation of Almyros sub-watersheds following the methodologies of the previous study by Lyra et al. [2]. Monthly areal precipitation and temperature have been estimated with the gradient method, while potential evapotranspiration was estimated with the Thornthwaite method [84]. The summarized results of the hydrological simulation using the UTHBAL model for the human-modified hydrological systems of Xirias, Mavromati, and Klinovos of the Almyros basin are presented in Table 5.
The UTHRL model has been applied for the operation of the three reservoirs in the Almyros basin, namely, Xirias, Mavromati, and Klinovos reservoirs, using as input data the upstream runoff and meteorological data, the desired reservoir withdrawals on monthly time step, and the characteristic curves of the reservoirs (water level volume and water level area of the reservoirs). The net water losses of the reservoir are calculated as the summation of reservoir evaporation, reservoir precipitation, and losses to the groundwater through infiltration and integrated over the varied surface area of the reservoir. The output of the model is, on monthly time step, the feasible water withdrawals, the useable stored water volume of the reservoir, and the water volume spilled over from the reservoir’s spillway. The results of the UTHRL model are presented in Figure 5.

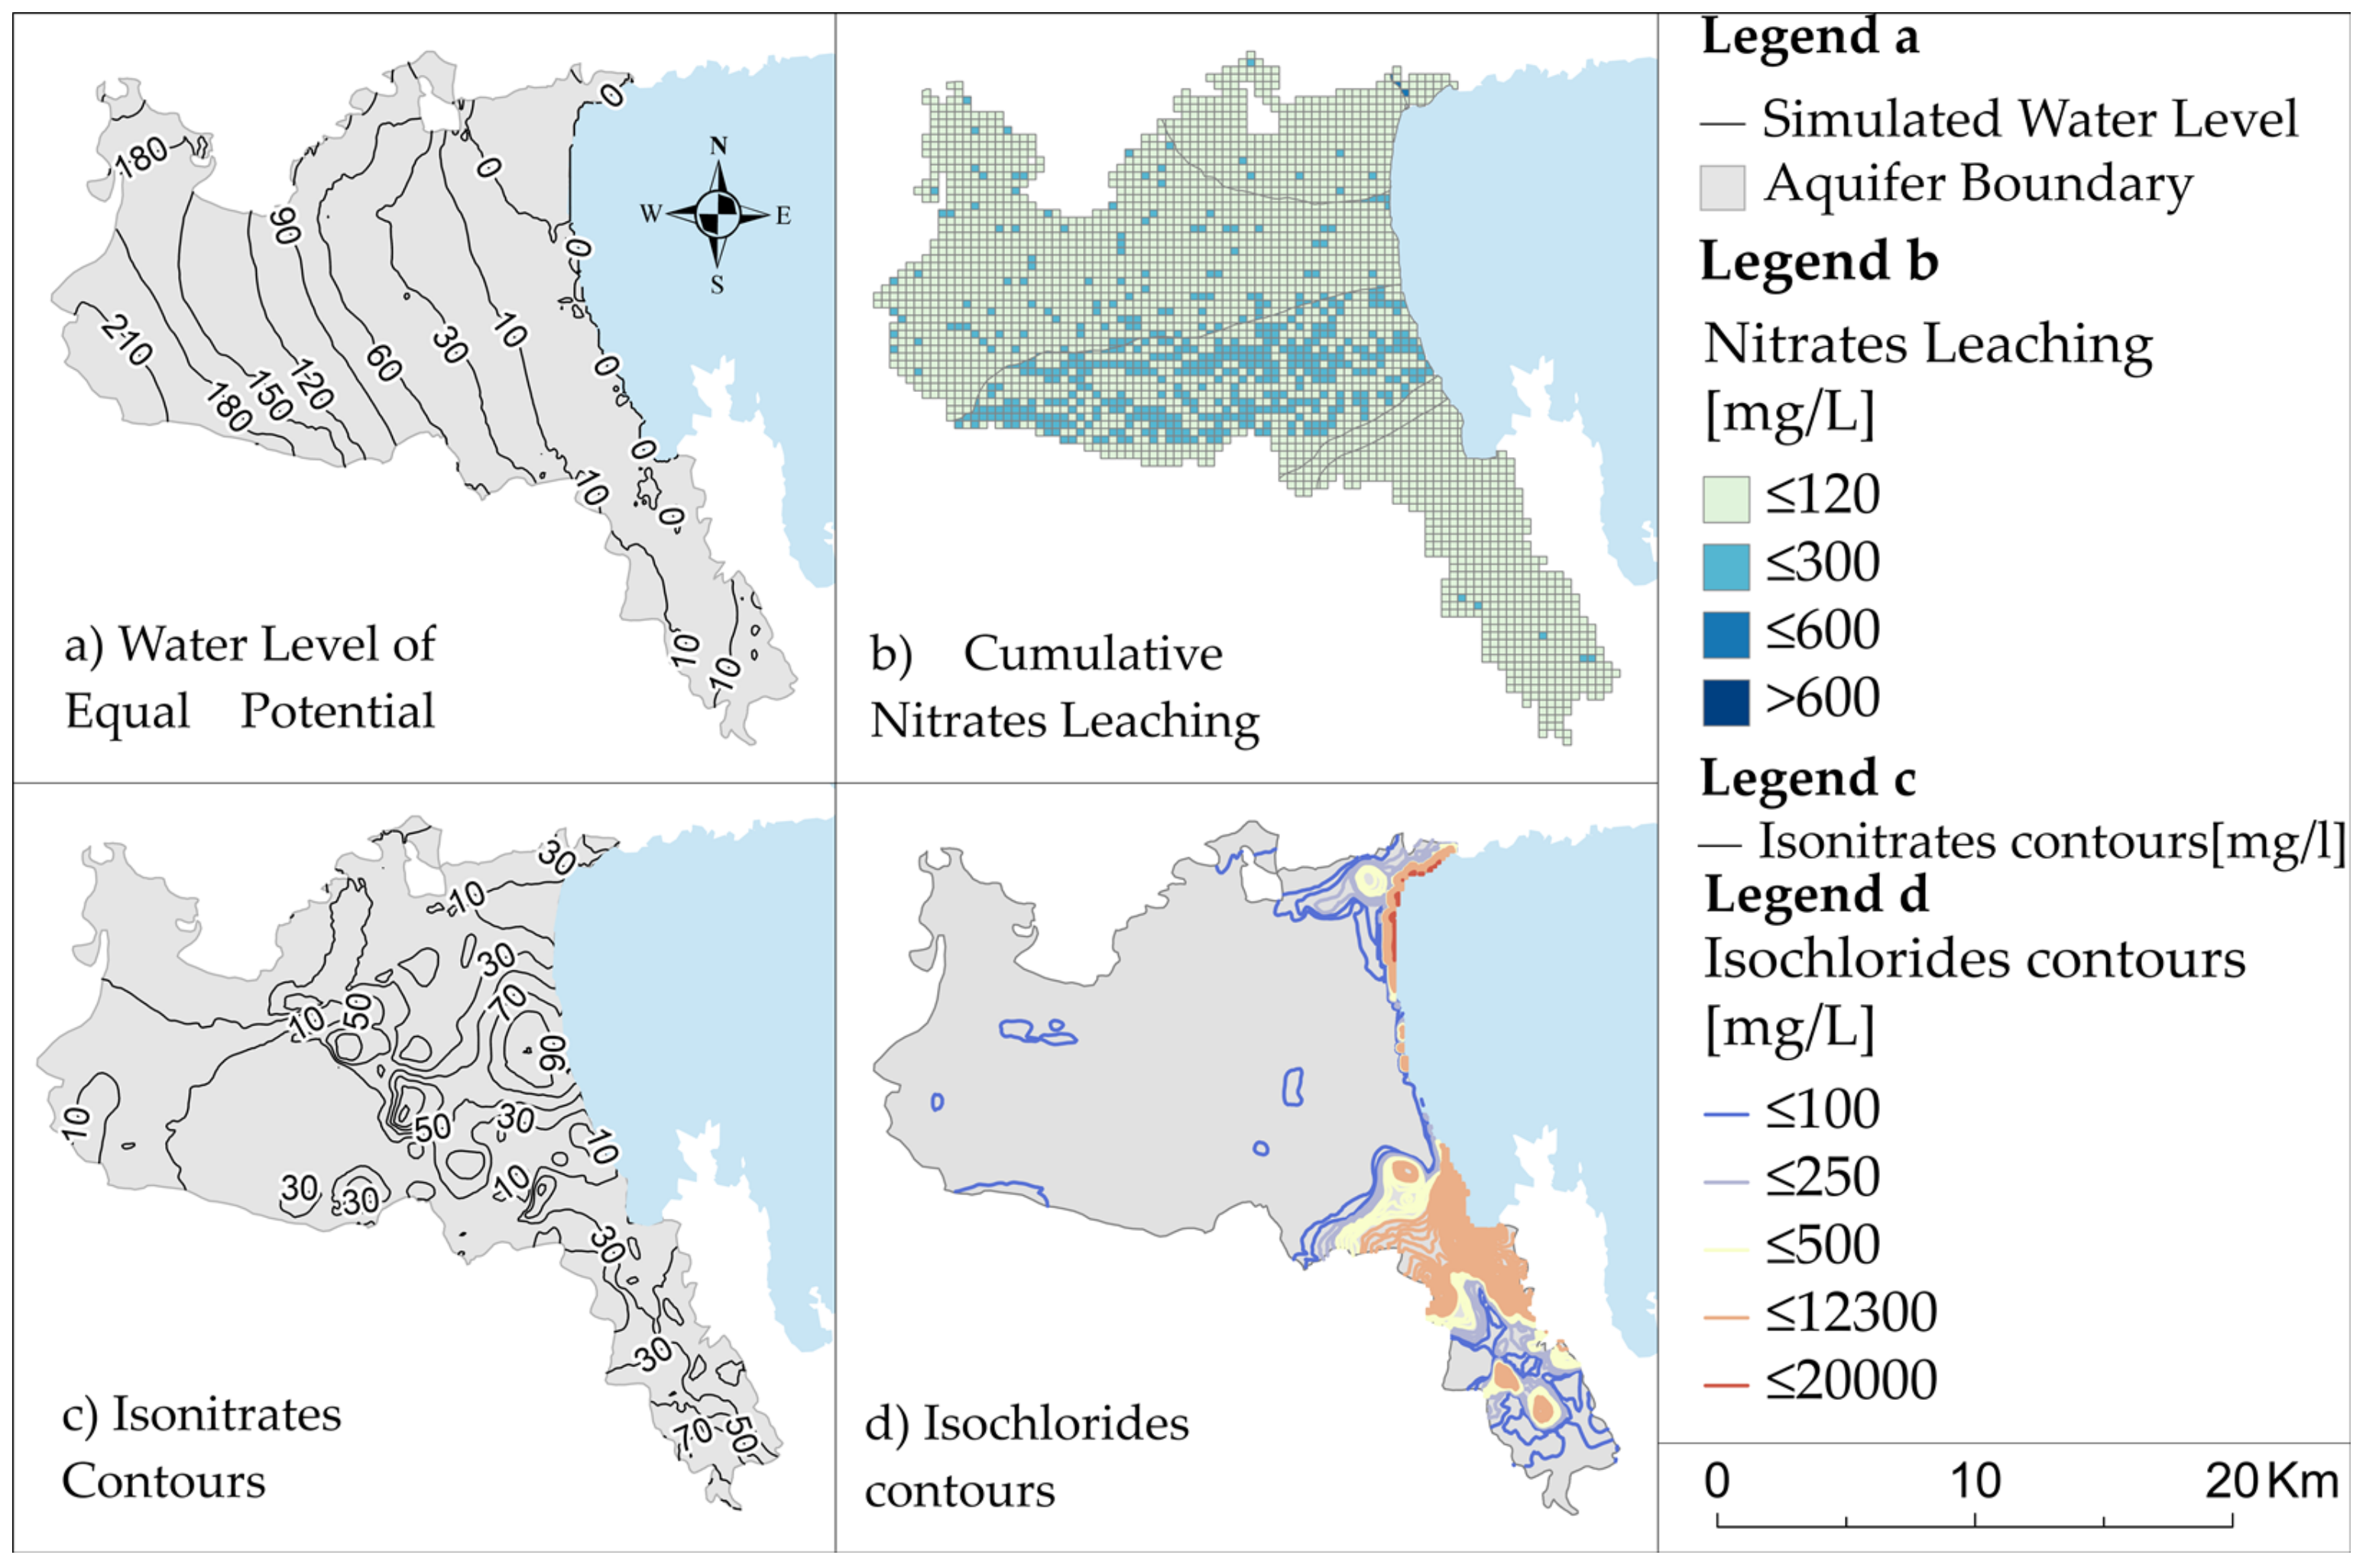
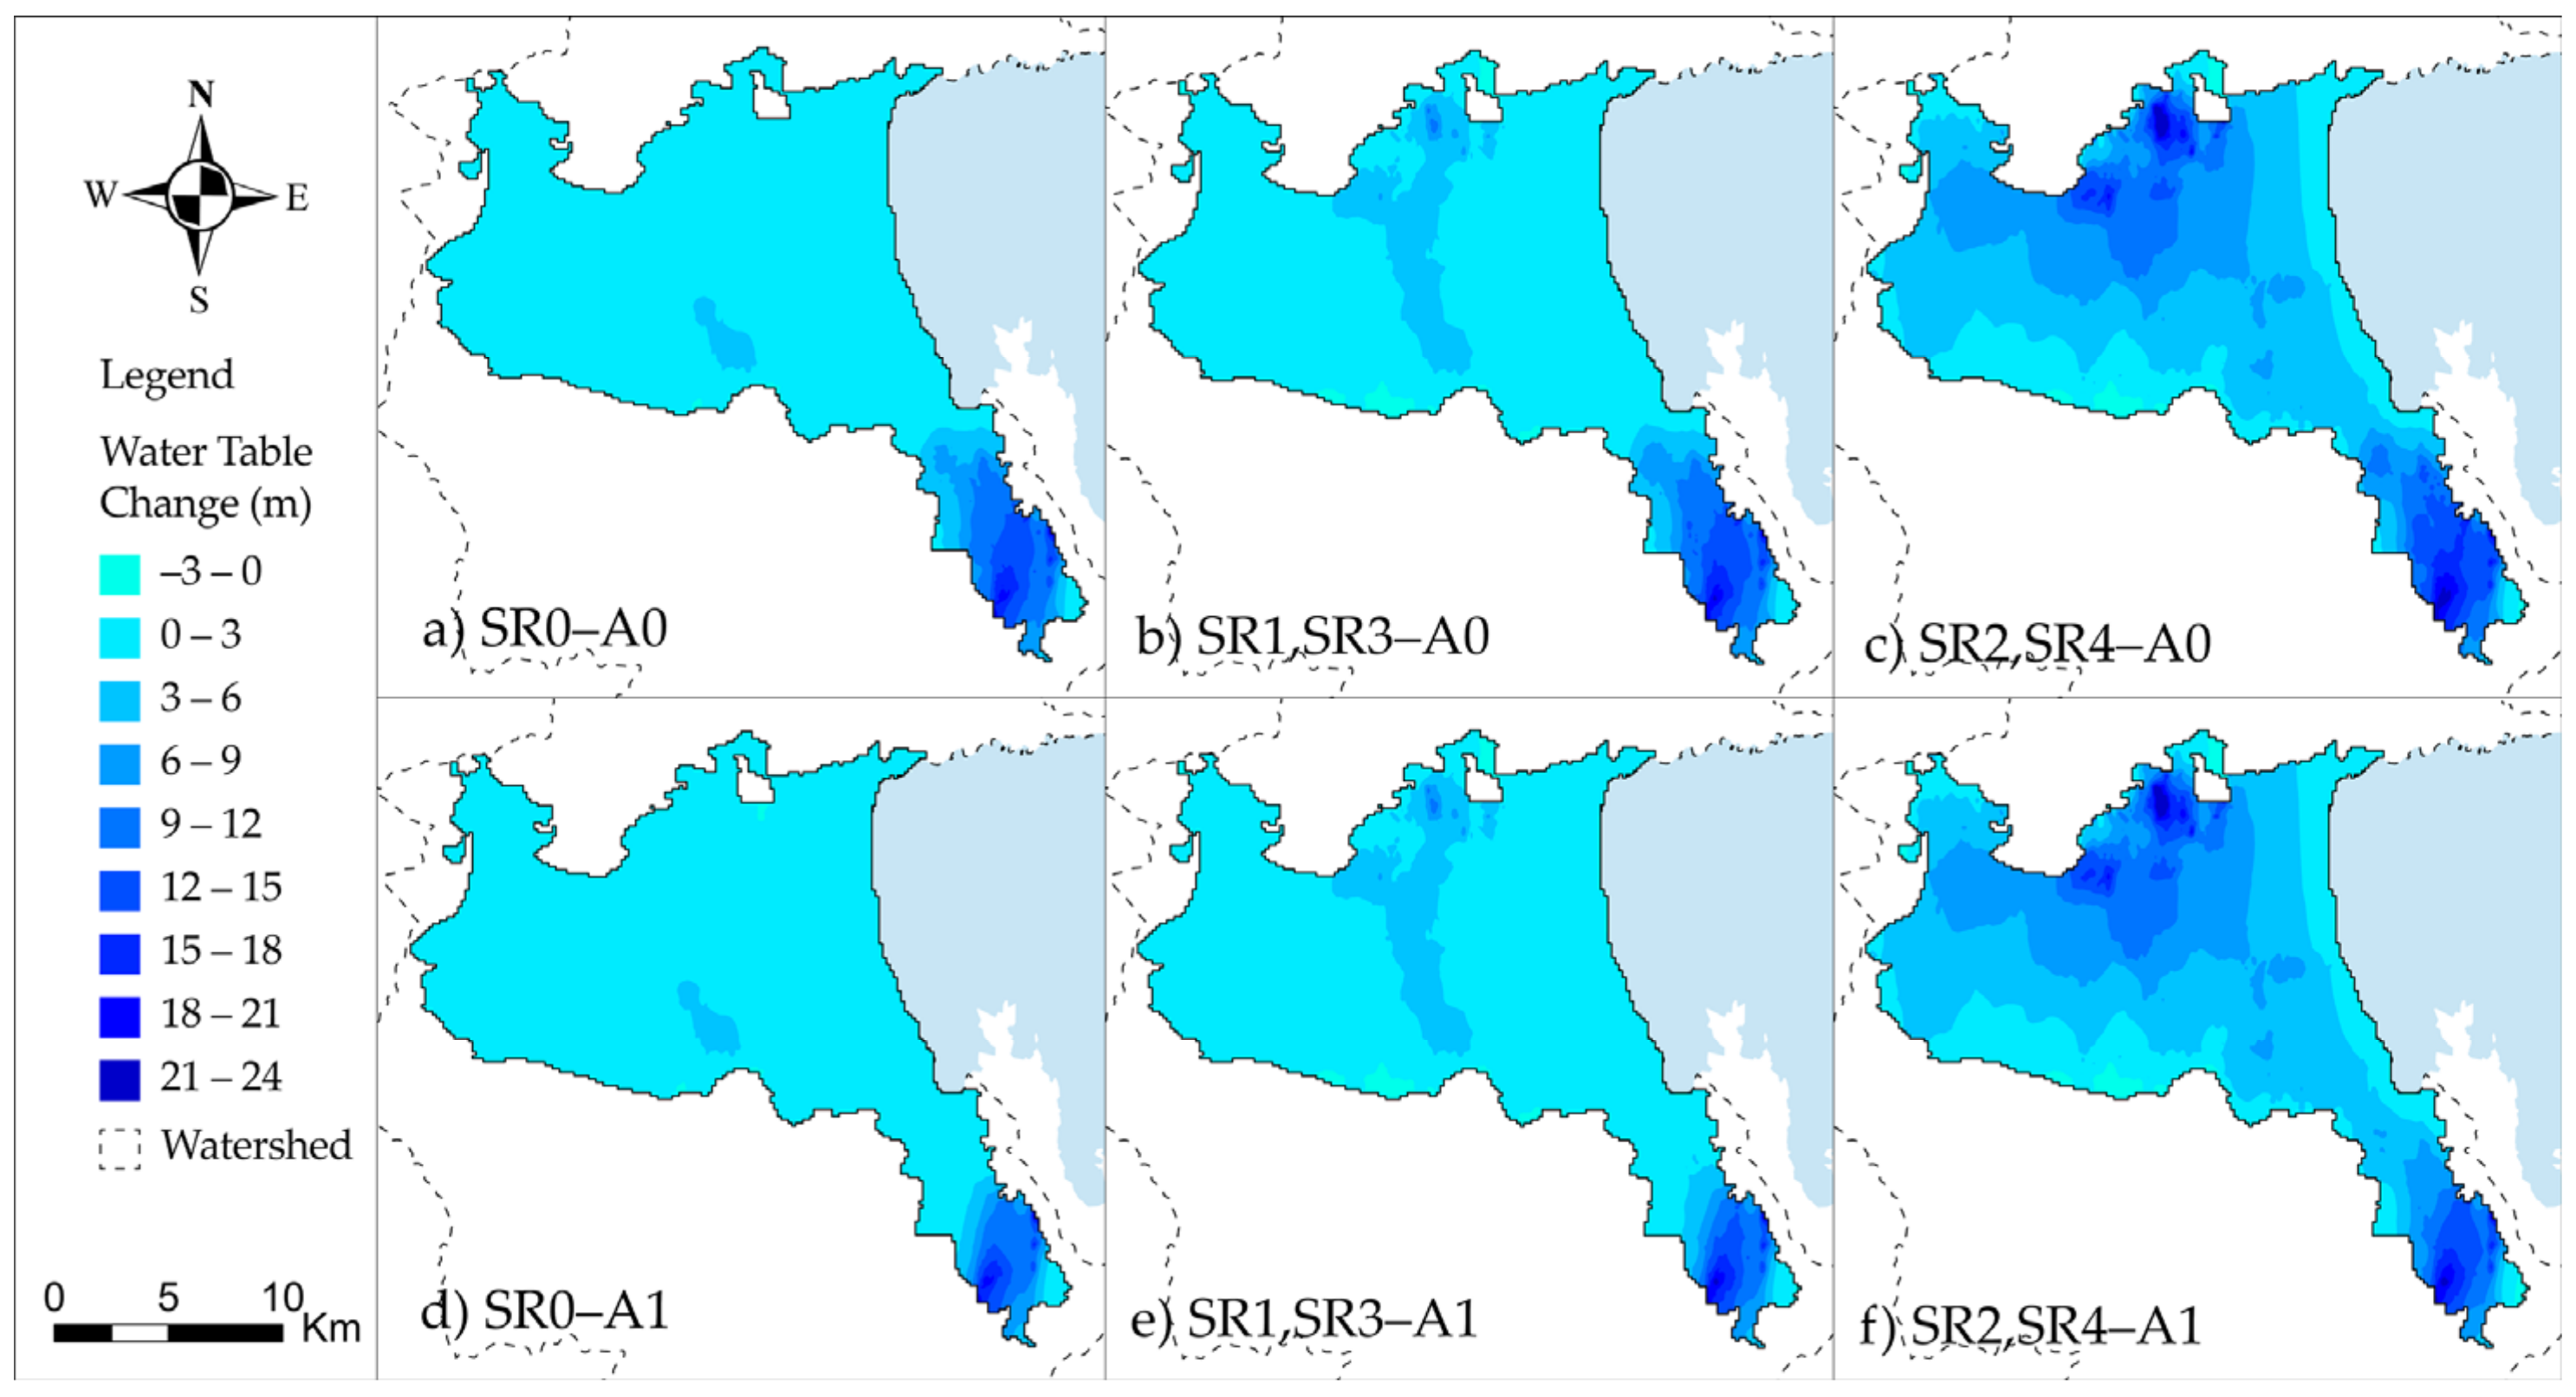
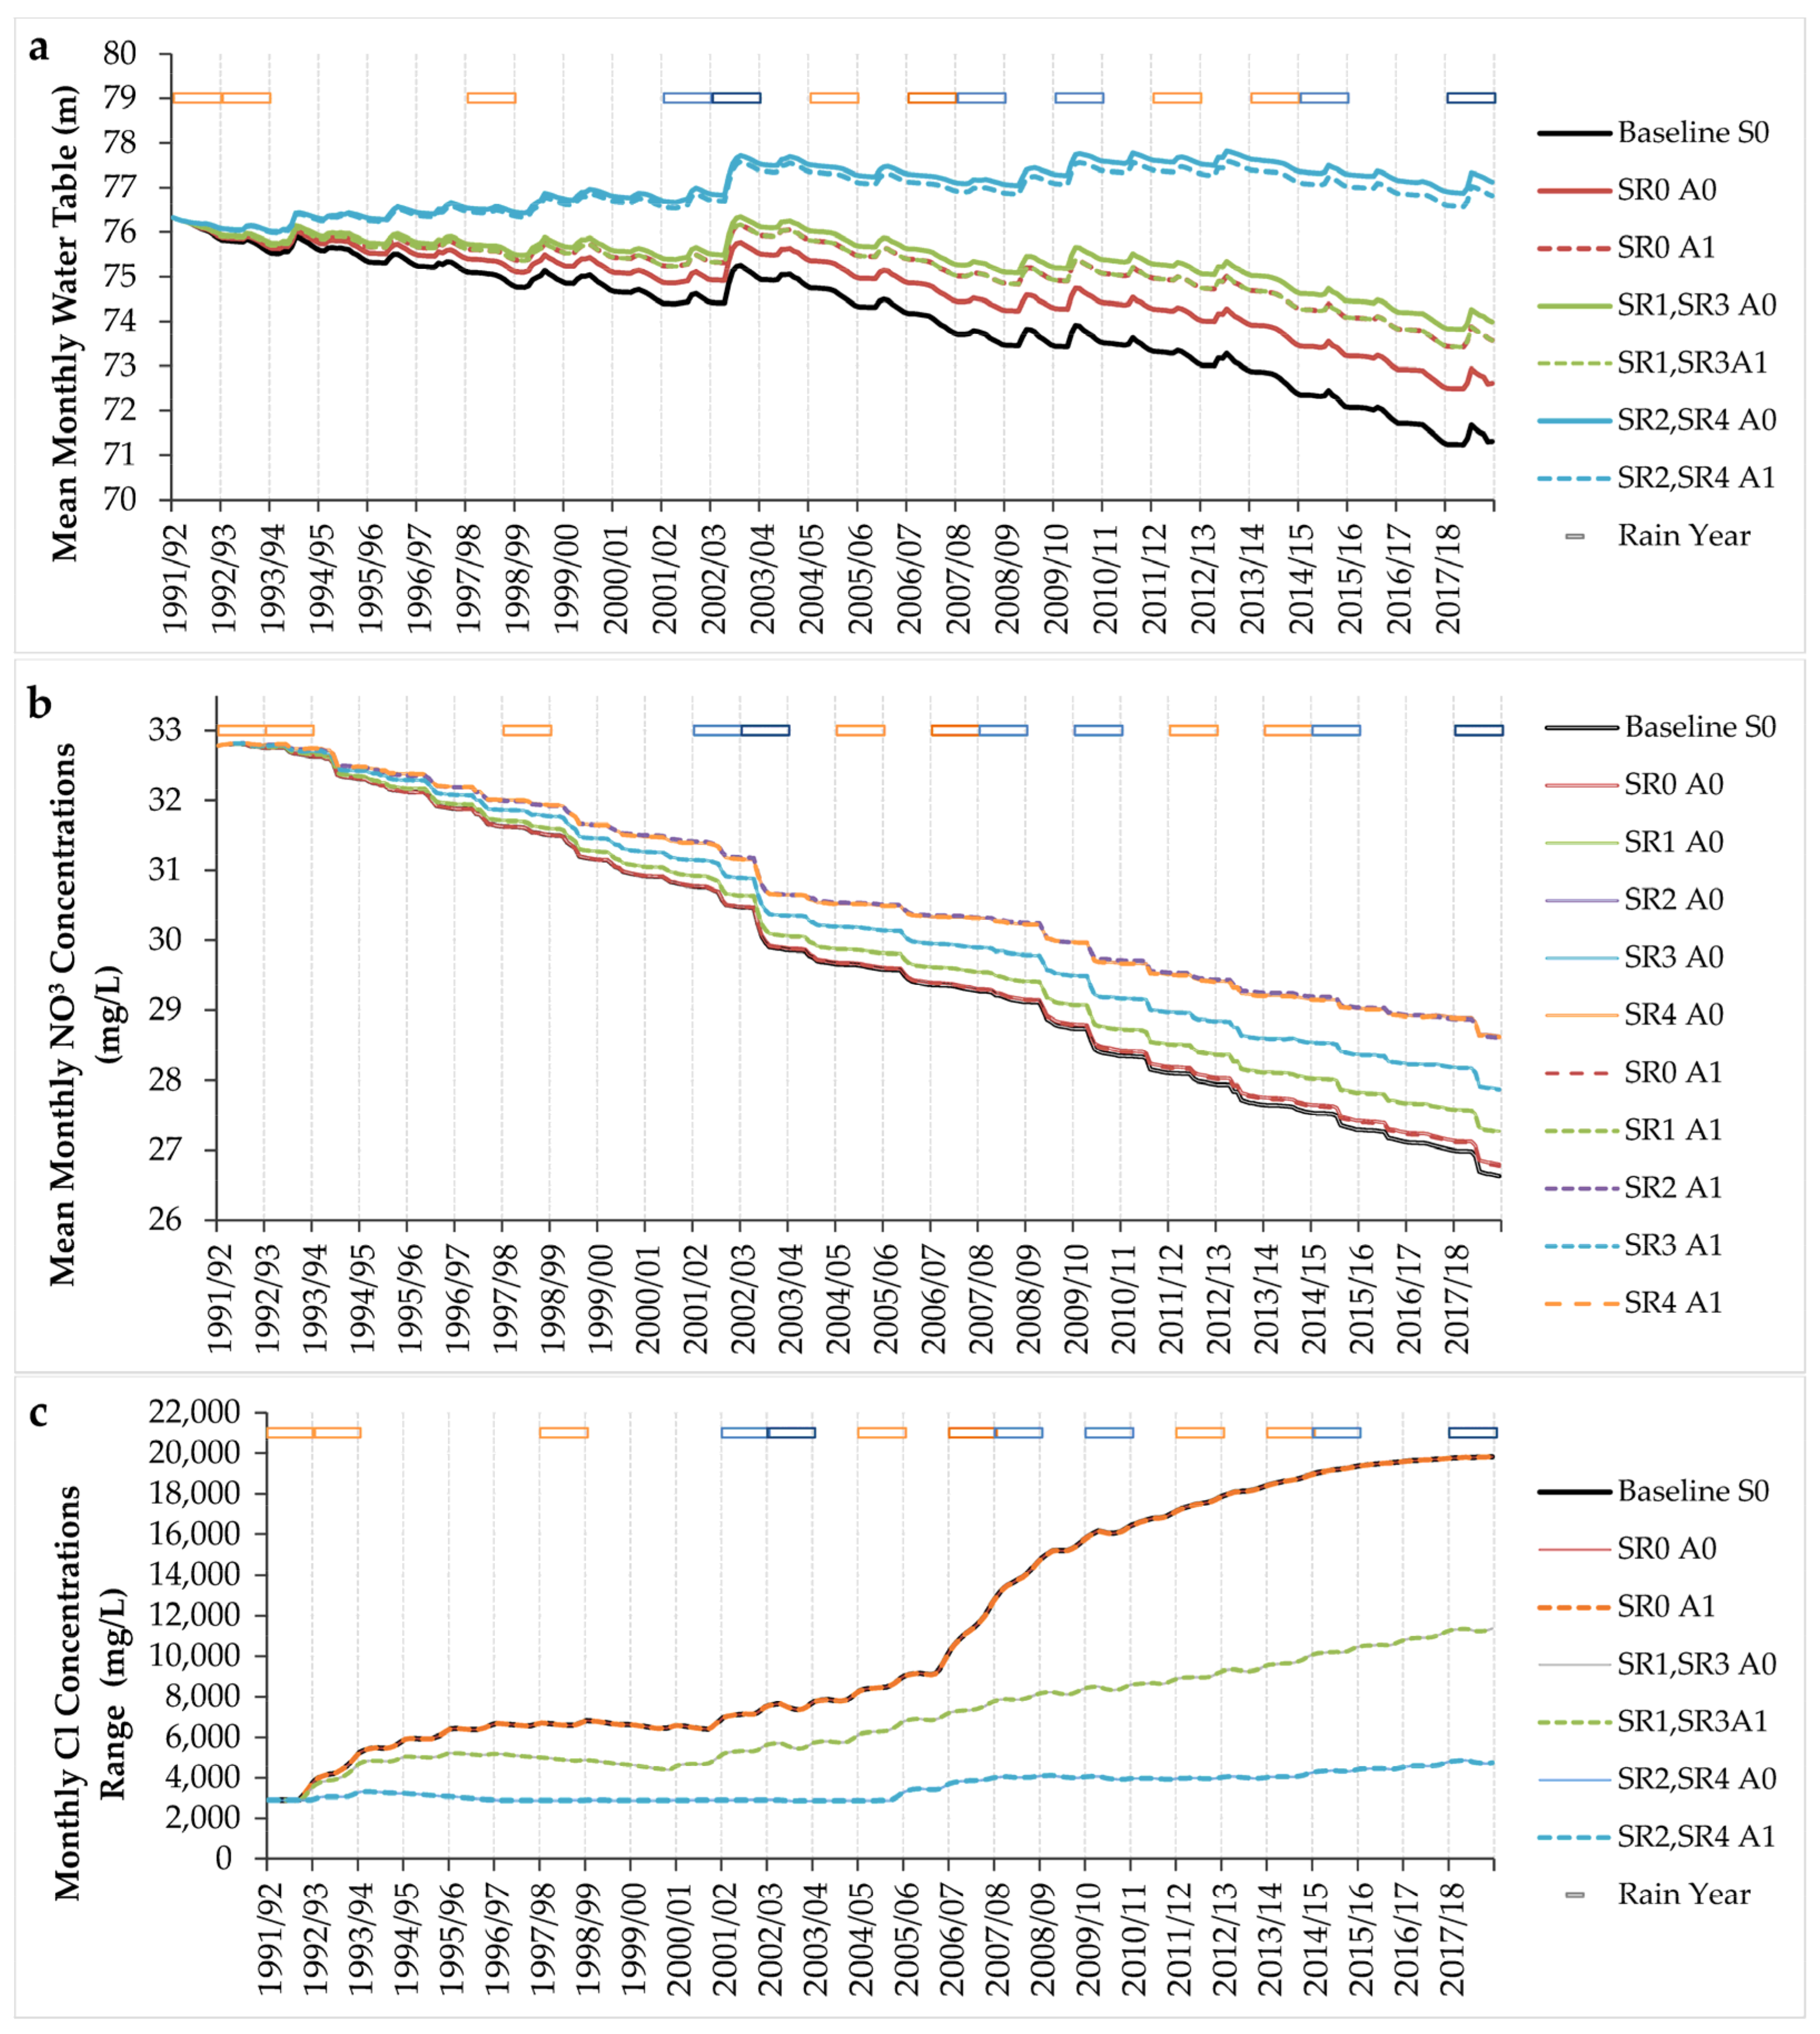
3.2. MODFLOW Model—Groundwater Flow Simulation

From October 1991 until September 2018, the MODFLOW model simulated groundwater levels, pump withdrawals, groundwater storage fluctuation, and seawater flows to the coastal aquifer of Almyros on a monthly step. The groundwater flows have been modelled for the existing irrigation and the operation of the reservoirs, the deficit irrigation (SR1, SR3), as well as the deficit and rain-fed practices (SR2, SR4), also combined with the reservoirs’ operation (areas A0 and A1). The modelled hydraulic levels for the different scenarios have been paired and differentiated from the numerical results of the baseline water table (S0) (Figure 2) [2]. The changes in the water table are presented in Figure 6.
In all simulated scenarios, the water table is elevated, with a negligible exception area in the southern-central boundary of the aquifer. In existing irrigation and reservoirs’ operation, the largest increase is noticed in the irrigated areas by Klinovos reservoir. The largest beneficiary region is noticed in the scenario (SR0-A0) (Figure 5a), but the range of the elevated water table is similar to the scenario (SR0–A1) (Figure 5d), reaching the color step of 15 to 18 m. In existing irrigation, 87% of the groundwater table is elevated up to 3 m for irrigated extent A0 (Figure 5a) and 92% for irrigated extent A0 (Figure 5d). In deficit irrigation, the largest improvement is also noticed at the southern part of the aquifer. For irrigated area A0, 76% of the groundwater table is elevated up to 3 m, and 13% up to 6m (Figure 6b), while for irrigated area A1, 81% is elevated up to 3 m and 12% up to 6 m (Figure 6e). In deficit irrigation and rain-fed cultivars, the water table is elevated across the aquifer. For irrigated area A0, 20% of the groundwater table is elevated up to 3 m, and 39% up to 6m (Figure 6c), while for irrigated area A1, 22% is elevated up to 3 m, and 40% up to 6 m (Figure 6f). The average water budget in the existing irrigation scenarios is –12 hm3 (S0), –9 hm3 (SR0-A0), and –10 hm3 (SR0–A1). In deficit irrigation scenarios, the water balance is –6 hm3 (SR1, SR3-A0) and −7 hm3 in scenario (SR1, SR3–A1), while in deficit irrigation and rain-fed is 1.6 hm3 (SR2, SR2-A0) and 0.7 hm3 (SR2, SR4–A1).

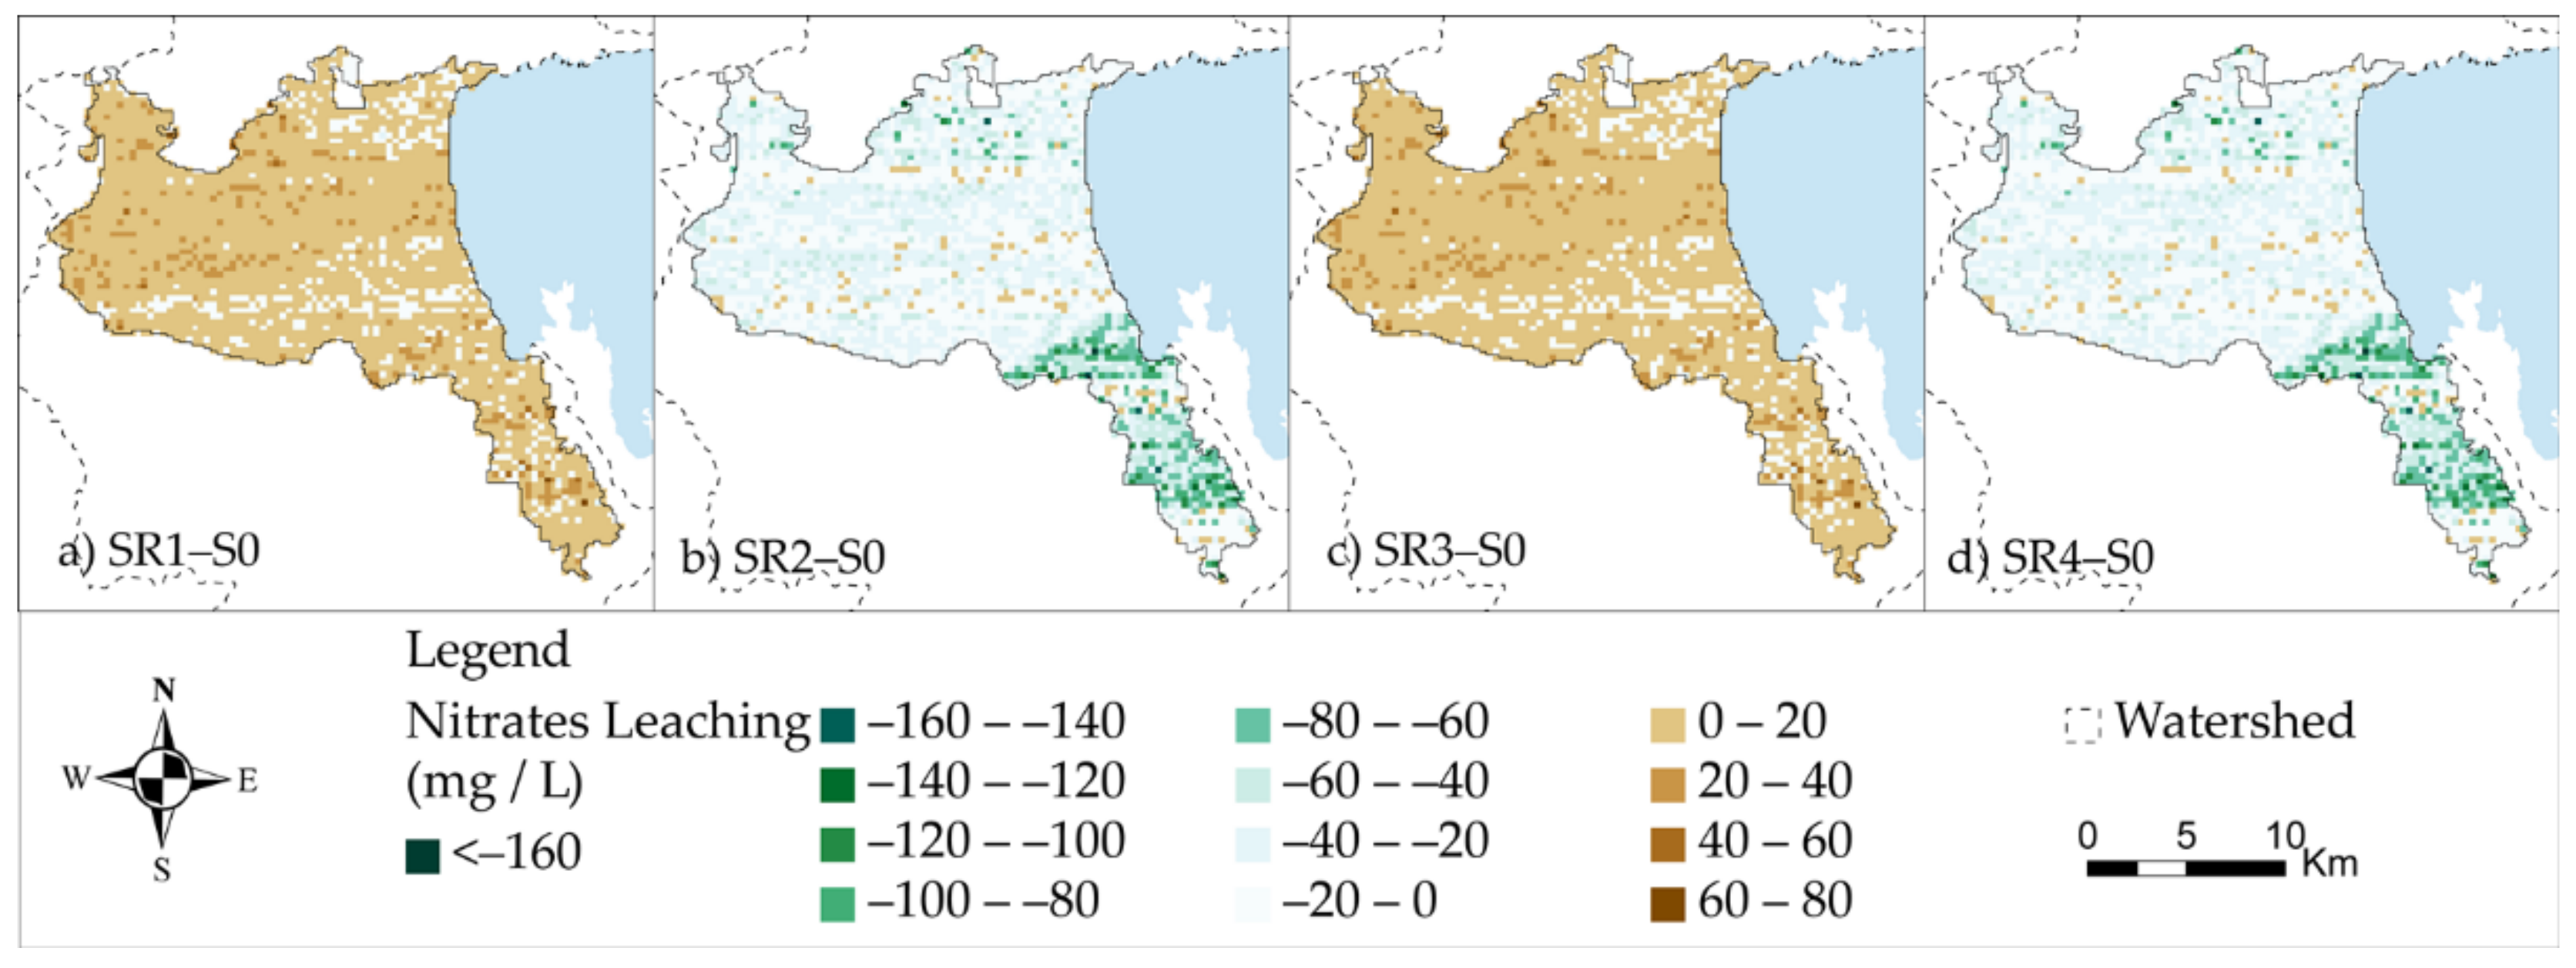
3.3. REPIC Model—Nitrogen Leaching and Crop Yield Simulation

The nitrates leaching and the crop growth have been simulated with the REPIC model from October 1991 to September 2018. The nitrates leaching has been modelled for existing fertilization, with deficit irrigation (SR0-A0, A1, SR1-A0, A1) as well as with deficit irrigation and rain-fed conditions (SR2-A0, A1), and, respectively, for reduced fertilization (SR3, SR4-A0, A1). The quantity of the nitrates leached is affected by the alterations in nitrogen application, irrigation water, and total groundwater recharge. The concentration of nitrates leached through the vadose zone is dependent on the dilution of the pollutants by the recharge and irrigation return flow. The time when the nitrogen leachates reach the groundwater depends on the rainfall and the infiltrated rainwater in the soil. The spatial distribution differences of nitrates leaching from the baseline scenario practices for the simulated scenarios are presented in Figure 7.
Reducing the nitrogen fertilizer applied in crops and altering the irrigation water has a direct effect on nitrates concentrations leached in all scenarios. In deficit irrigation, there is a minor increase in nitrates concentrations leached, which is attributed to irrigation return flow that transfers less diluted nitrates to groundwater (Figure 7a,c). In deficit irrigation and rain-fed cultivation, the decrease in nitrates leached is attributed to the absence of irrigation return flow of olive groves, cereals, and wheat (Figure 7b,d). REPIC model is capable to calculate the annual yields of various crops for different irrigation and fertilization scenarios. This simulation has been performed in a previous study [57] and the results for the simulated annual crop yields of various crops have been compared to the historical measured crop yields. The averaged yields of the crops for the baseline conditions and the agronomic and water resources scenarios are presented in Table 6.
Alfalfa and vegetables show stable yield and negligible yield reduction in all scenarios. Cotton shows minimal yield reduction due to reduced fertilization practices, while olive trees are affected in deficit irrigation and rain-fed conditions. Significantly, vineyards are the most sensitive to cultivation practices and the results indicate that reduced fertilization is best combined with rain-fed conditions. On the other hand, the yields of cereals, maize, trees, and wheat are not affected by changes in fertilization and irrigation practices. These results have been used for the estimation of the efficiency indices.

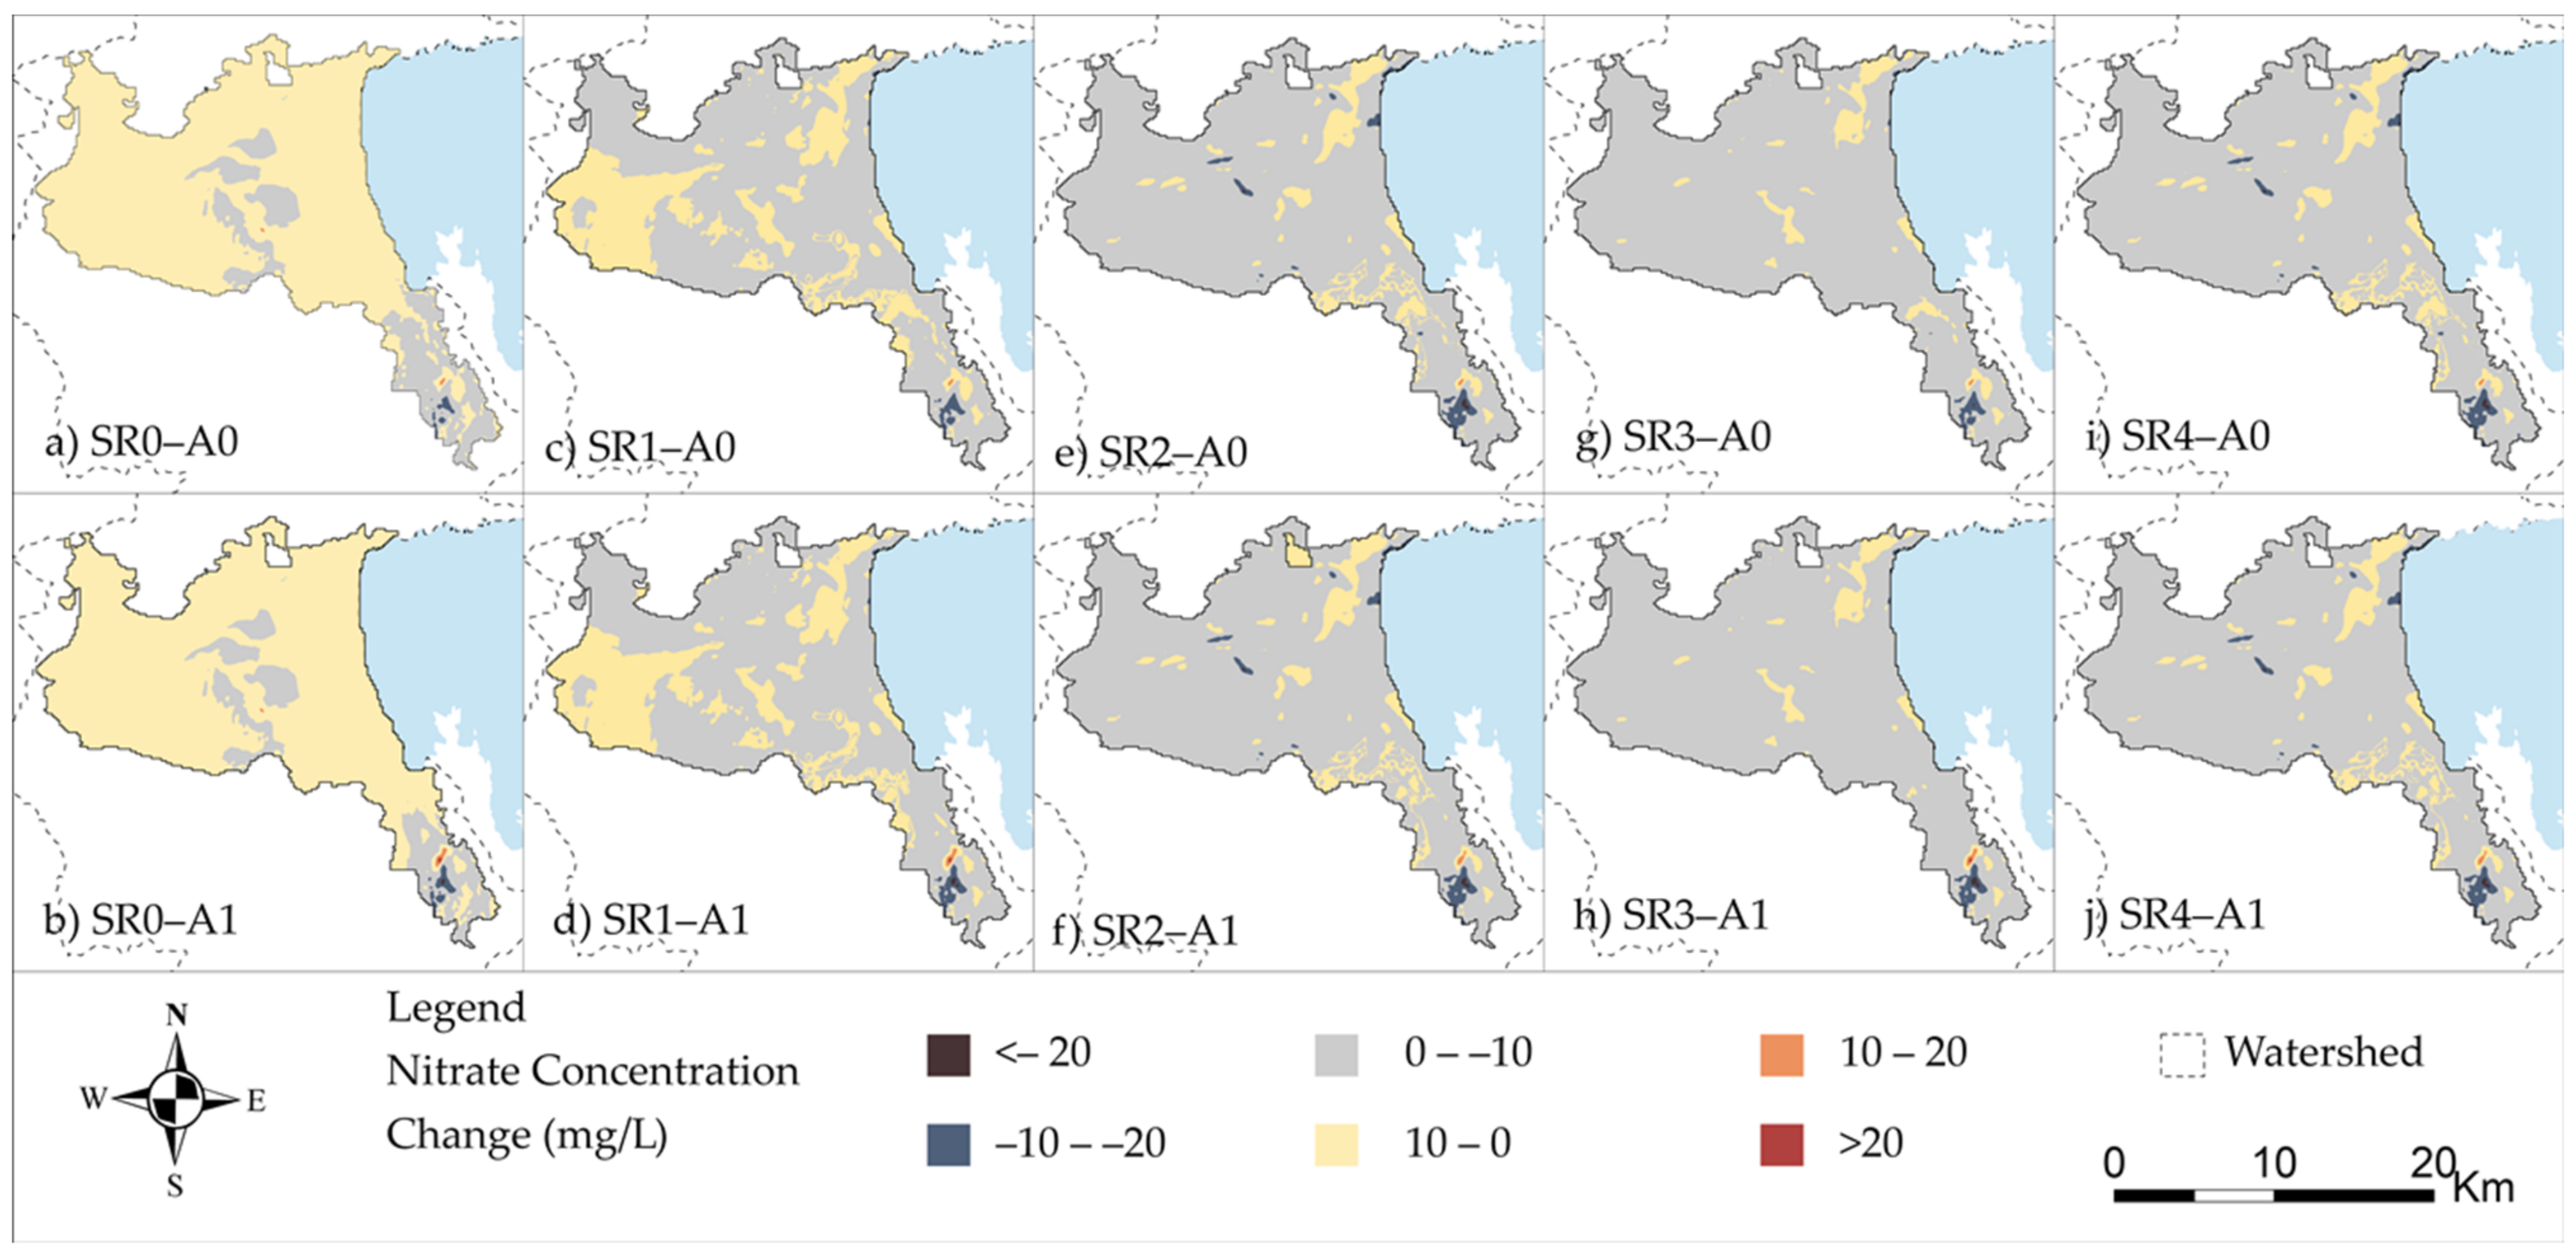
3.4. MT3DMS Model—Nitrate Groundwater Transport Simulation

From October 1991 until September 2018, the MT3DMS model simulated the nitrates concentrations in the coastal aquifer of Almyros on a monthly step. The modelled nitrates concentrations for the different scenarios have been paired and differentiated from the numerical results of the baseline nitrates concentrations (S0) (Figure 2) [2]. The changes of nitrates concentrations for the various scenarios from the baseline scenario (S0) are presented in Figure 8.
In the existing irrigation and fertilization scenarios, the nitrates are reduced only in 21% and 19% of irrigated areas, respectively, near the operated reservoirs (Figure 8a,b). In deficit irrigation and existing fertilization for the irrigated Area A0 and A1, 85% of the area presents a reduction in nitrates concentration up to 10 mg/L (Figure 8c,d). In deficit irrigation and reduced fertilization, nitrates concentrations are reduced up to 10 mg/L in 95% of the aquifer area (Figure 8g,h). In the scenarios of deficit irrigation with rain-fed cultivars and existing fertilization, nitrates concentrations are reduced up to 10 mg/L in 90% of the aquifer area in the scenario with area A0 (Figure 8e) and 89% in the scenario with area A1 (Figure 8f), and up to 20 mg/L in 0.8% and 1.6%, correspondingly. In deficit irrigation with rain-fed cultivars and reduced fertilization, the nitrates concentrations are reduced up to 10 mg/L in the 89% and 90% and up to 20 mg/L in the 1.6% and 1.5% of the aquifer area (Figure 8i,j).

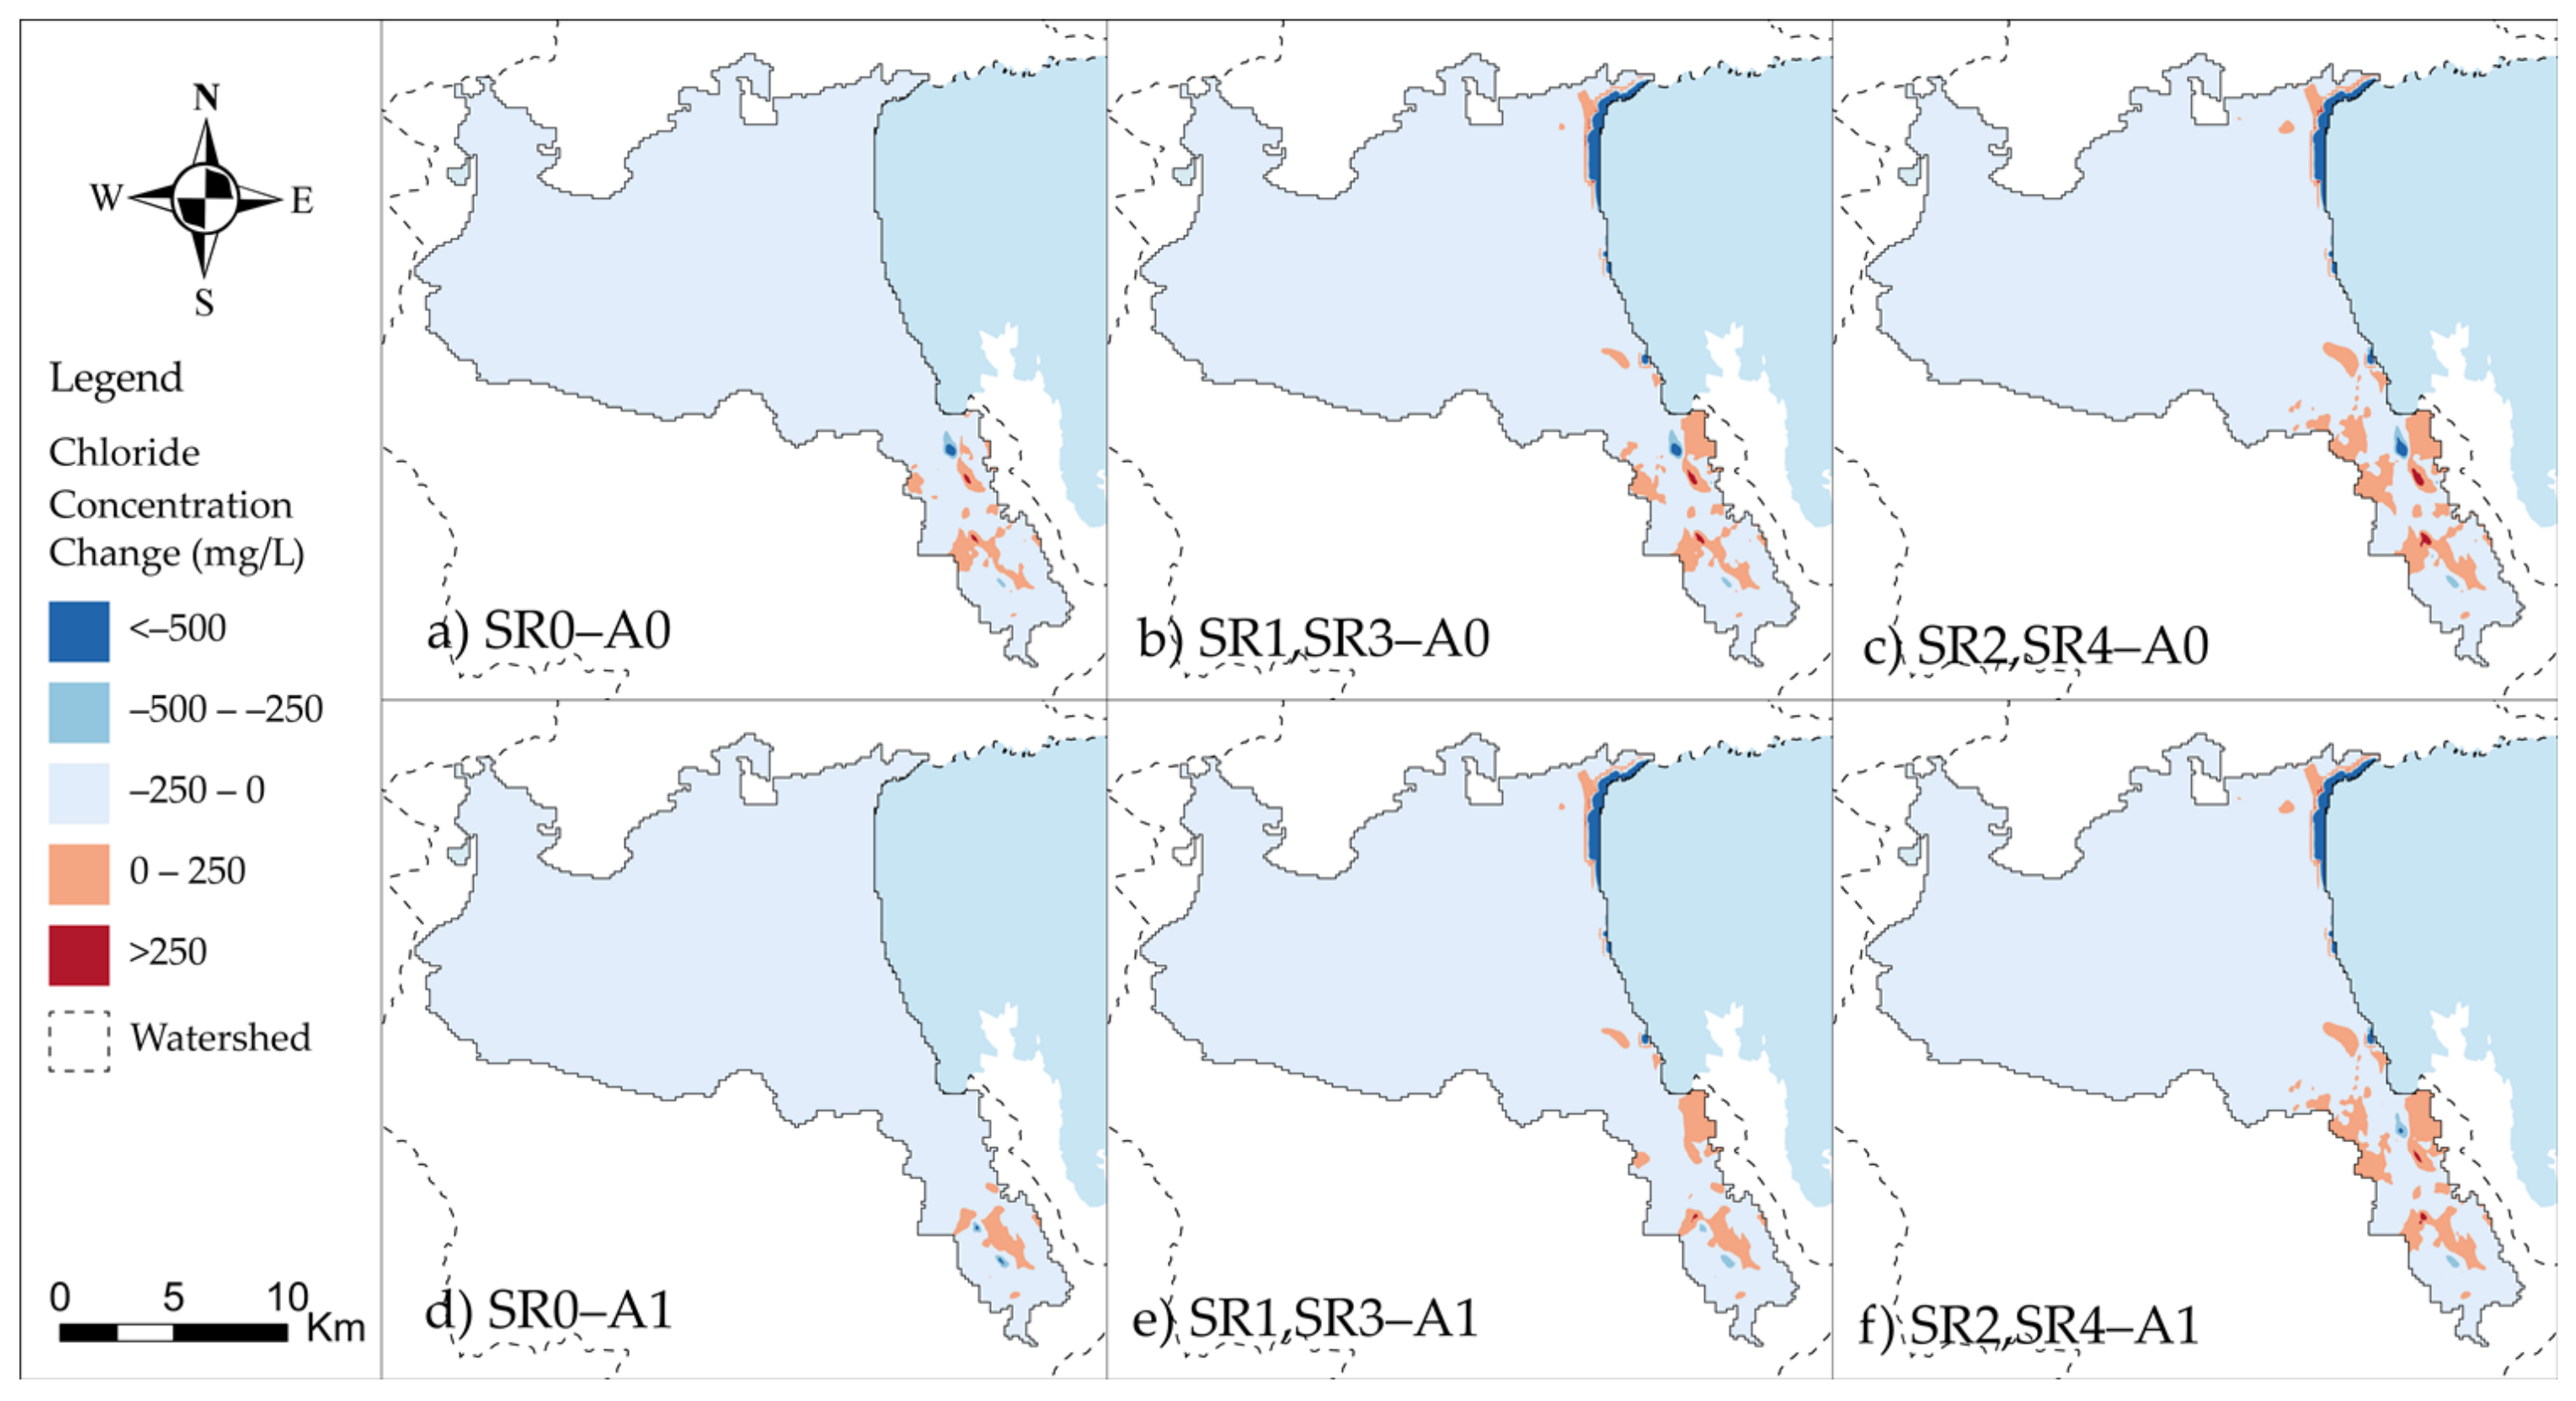
3.5. SEAWAT Model—Seawater Intrusion Simulation

From October 1991 until September 2018, the SEAWAT model simulated the chlorides concentrations in the coastal aquifer of Almyros on a monthly step. The chlorides fluxes have been modelled for the various scenarios. The modelled chlorides concentrations for the different scenarios have been paired and differentiated from the numerical results of the baseline chlorides concentrations (S0) (Figure 2) [2]. The changes in chlorides concentrations are presented in Figure 9.
In existing irrigation and fertilization, the chlorides concentrations are reduced up to 250 mg/L in 94% for the irrigated Area A0 (Figure 9a), and in 93% for the irrigated Area A1 (Figure 9d). In the location of the Klinovos reservoir, the chlorides concentrations are increased up to 250 mg/L in the 6% and 7%, respectively. In deficit irrigation, the chlorides concentrations are reduced up to 250 mg/L in 84% of the aquifer area (Figure 9b,e) while local increases are noticed in the 15% of the aquifer area. In deficit irrigation with rain-fed cultivars, chlorides concentrations are reduced up to 250 mg/L in 78% of the aquifer area (Figure 9c,f), while local increases are noticed in 19% of the aquifer area. However, the maximum chlorides concentrations of the coastlines, as compared to the baseline (S0) scenario, are significantly reduced by 42% in scenarios of deficit irrigation and by 76% in scenarios of deficit irrigation with rain-fed cultivars. No change is noticed in baseline irrigation practices with the operation of reservoirs because they are away from the coast.

3.6. Efficiency Indices

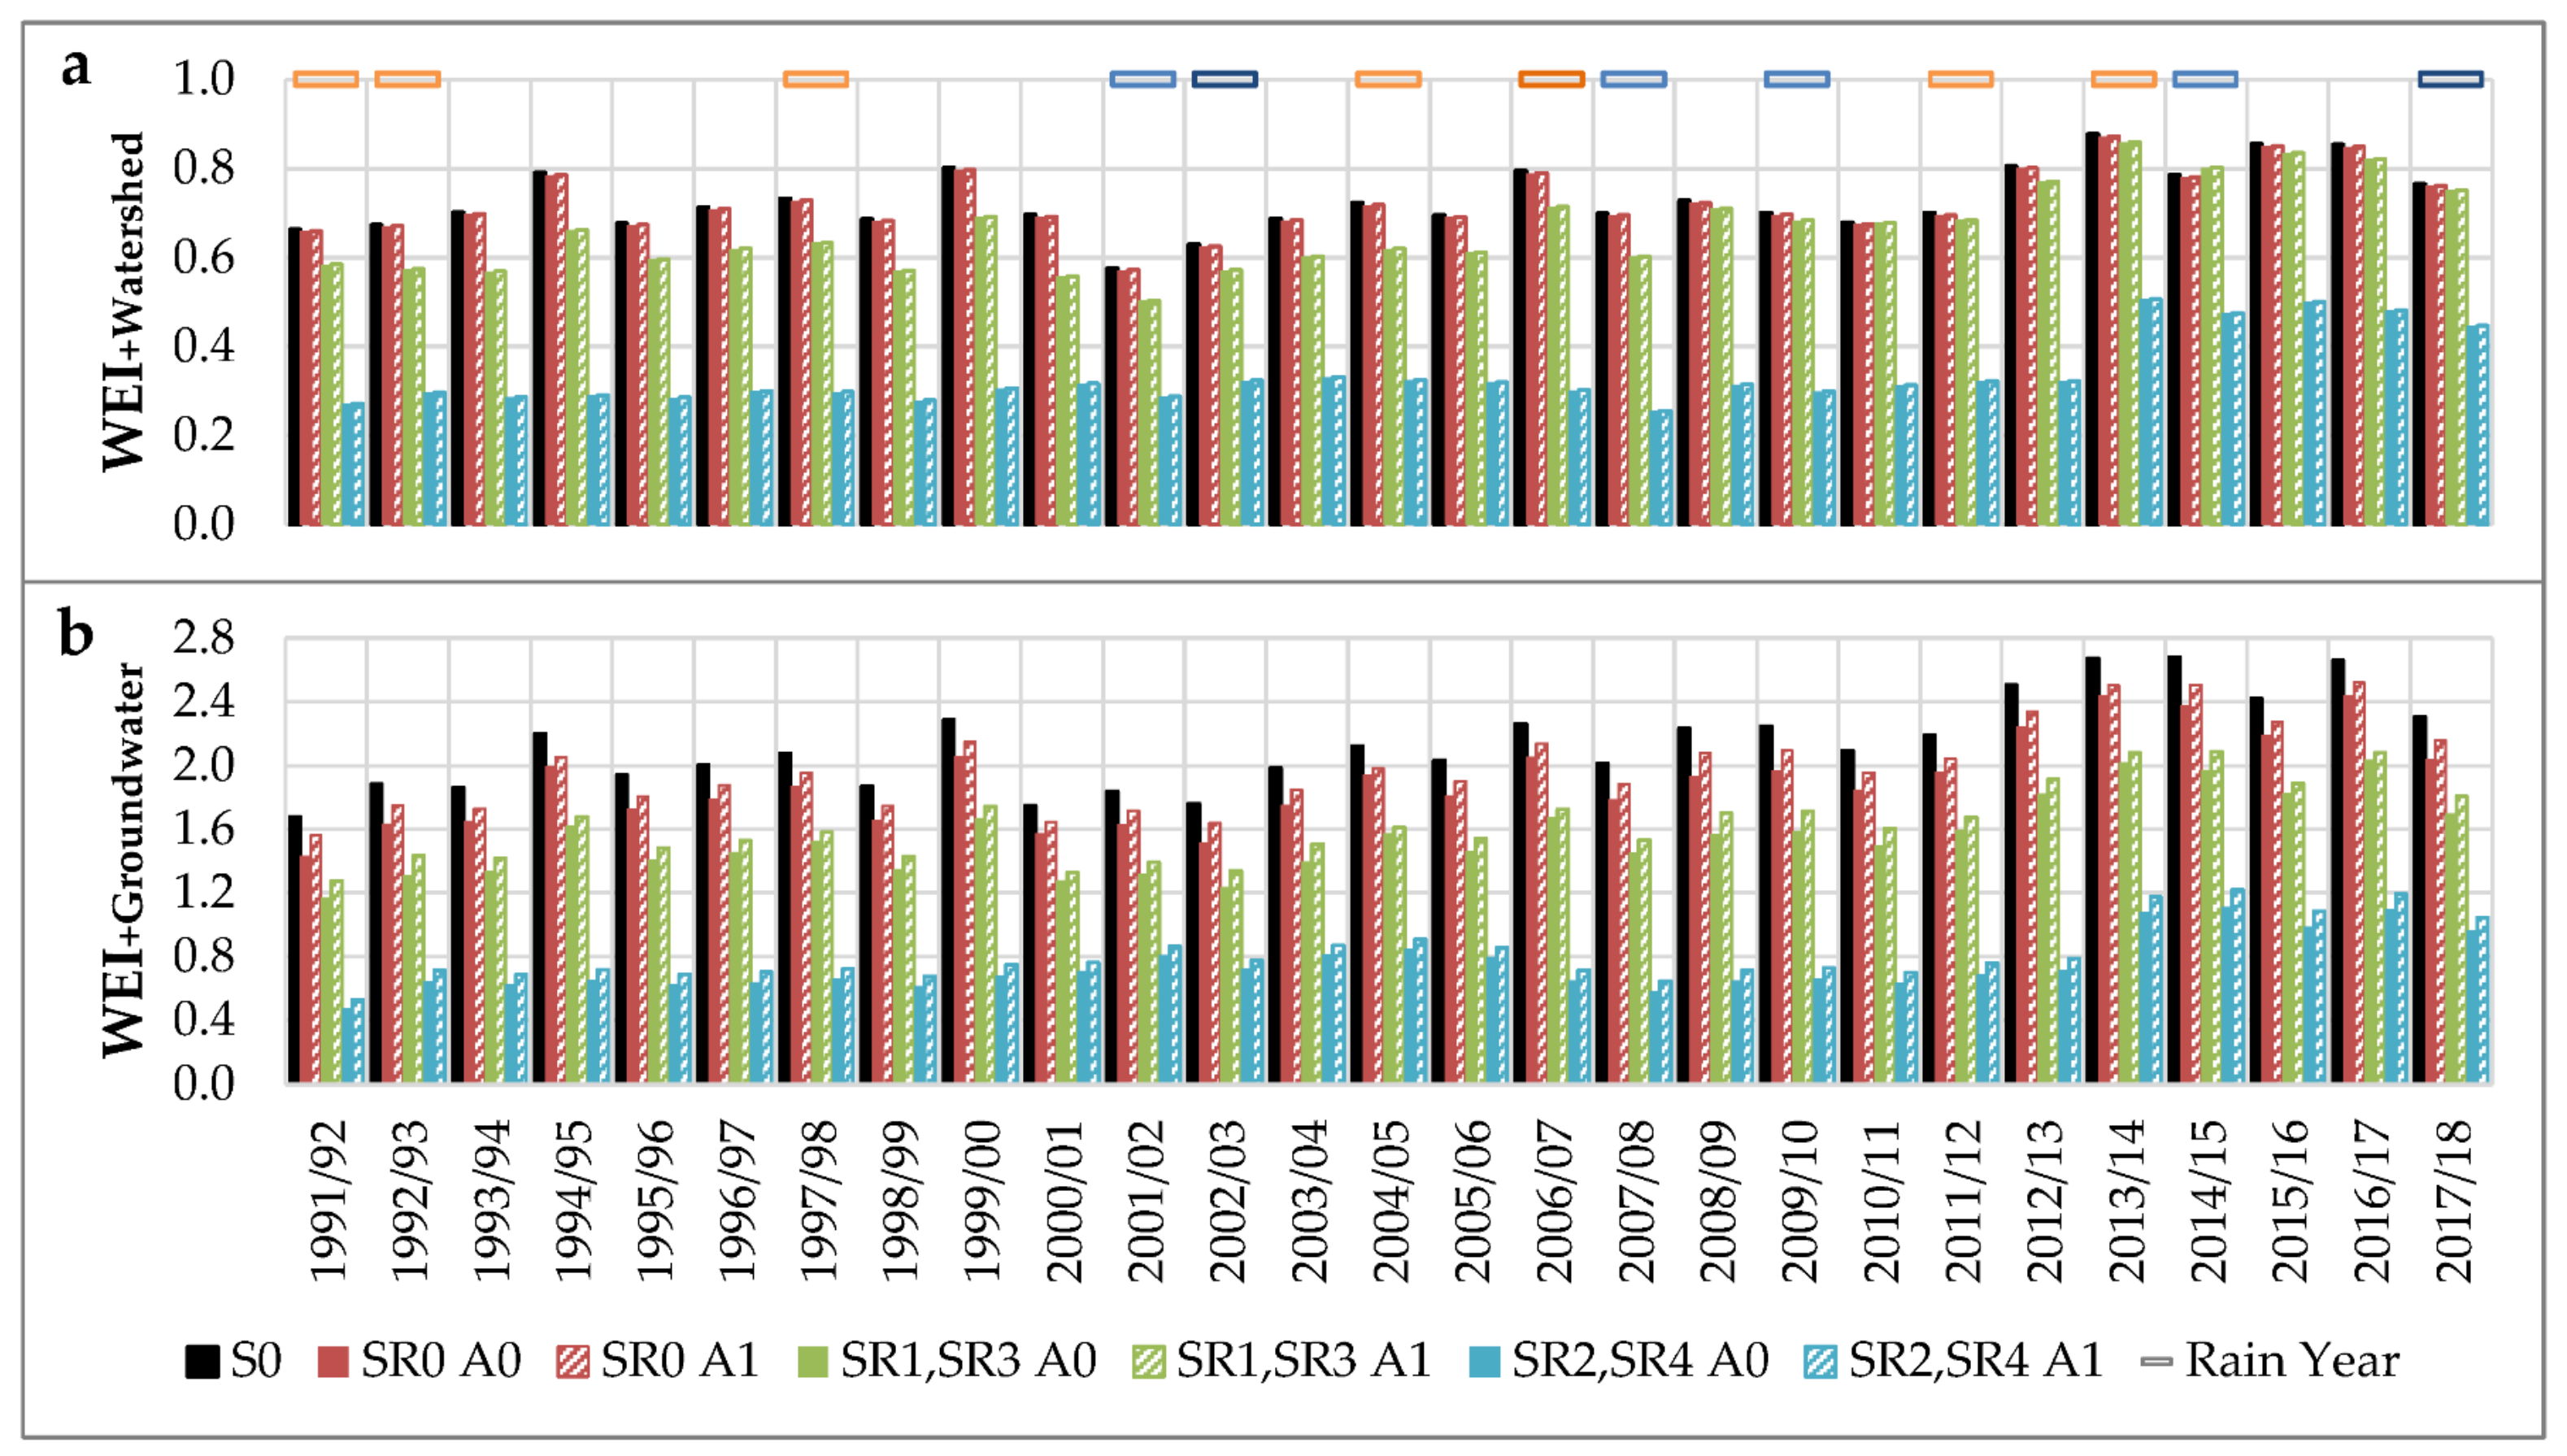
3.6.1. Water Exploitation Indices WEI+Watershed and WEI+Groundwater

The Water Exploitation Index (WEI+) has been estimated for the drinking and agricultural demands of the baseline scenario (S0) where no storage works exist and of the simulated scenarios on a yearly time step. The time series of the WEI+Watershed and WEI+Groundwater scores are presented in Figure 10.
The average WEI+Watershed of the simulation for the existing irrigation is 0.73, and for the deficit irrigation scenario is 0.66. Both values are larger than 0.4, indicating unsustainable use of water resources. For the deficit irrigation with rain-fed cultivation, the score is improved at 0.34, a value larger than 0.2 indicating pressure on water resources.
The average WEI+Groundwater for the existing irrigation without the operation of reservoirs (S0) is 2.1, and for existing irrigation with reservoirs is 1.9 for irrigated area A0, and 1.99 for irrigated area A1, which shows severe unsustainable use of groundwater resources. For the deficit irrigation scenario, the scores are improved at 1.55 and 1.63, respectively, and for deficit irrigation with rain-fed cultivation, at 0.75 and 0.81, respectively. However, the values of WEI+Groundwater indicate an unsustainable use of groundwater even with the conjunctive use of water stored in the reservoirs.
The results indicate that the agronomic and water resources management scenarios have a direct effect on water resources balance. However, the existing crop pattern demands large volumes of water for irrigation that cannot be sustainably supplied by the groundwater pumping and the existing and proposed reservoirs. A different crop pattern may alleviate and mitigate the problem of water balance deficit.

3.6.2. Reservoir Reliability

The reservoir reliability of the reservoirs’ operation (α) has been calculated on a monthly timestep for all agronomic and water resources management scenarios. The results of the reliability of reservoirs to address to water demands of urban and agricultural supply are presented in Table 7.
The irrigation Xirias reservoir, as well as the urban water supply Mavromati reservoir, cover the monthly water demands with high reliability. The Klinovos reservoir, in the existing irrigation conditions, has medium reliability. For irrigation area A1, the reservoir is reliable to operate efficiently. For the scenario of deficit irrigation and rain-fed cultivation, Klinovos reservoir can cover the water demands of areas A0 and A1 with high reliability. However, for deficit irrigation scenario, it is evident that it is completely reliable to cover the water demands of irrigation area A1.

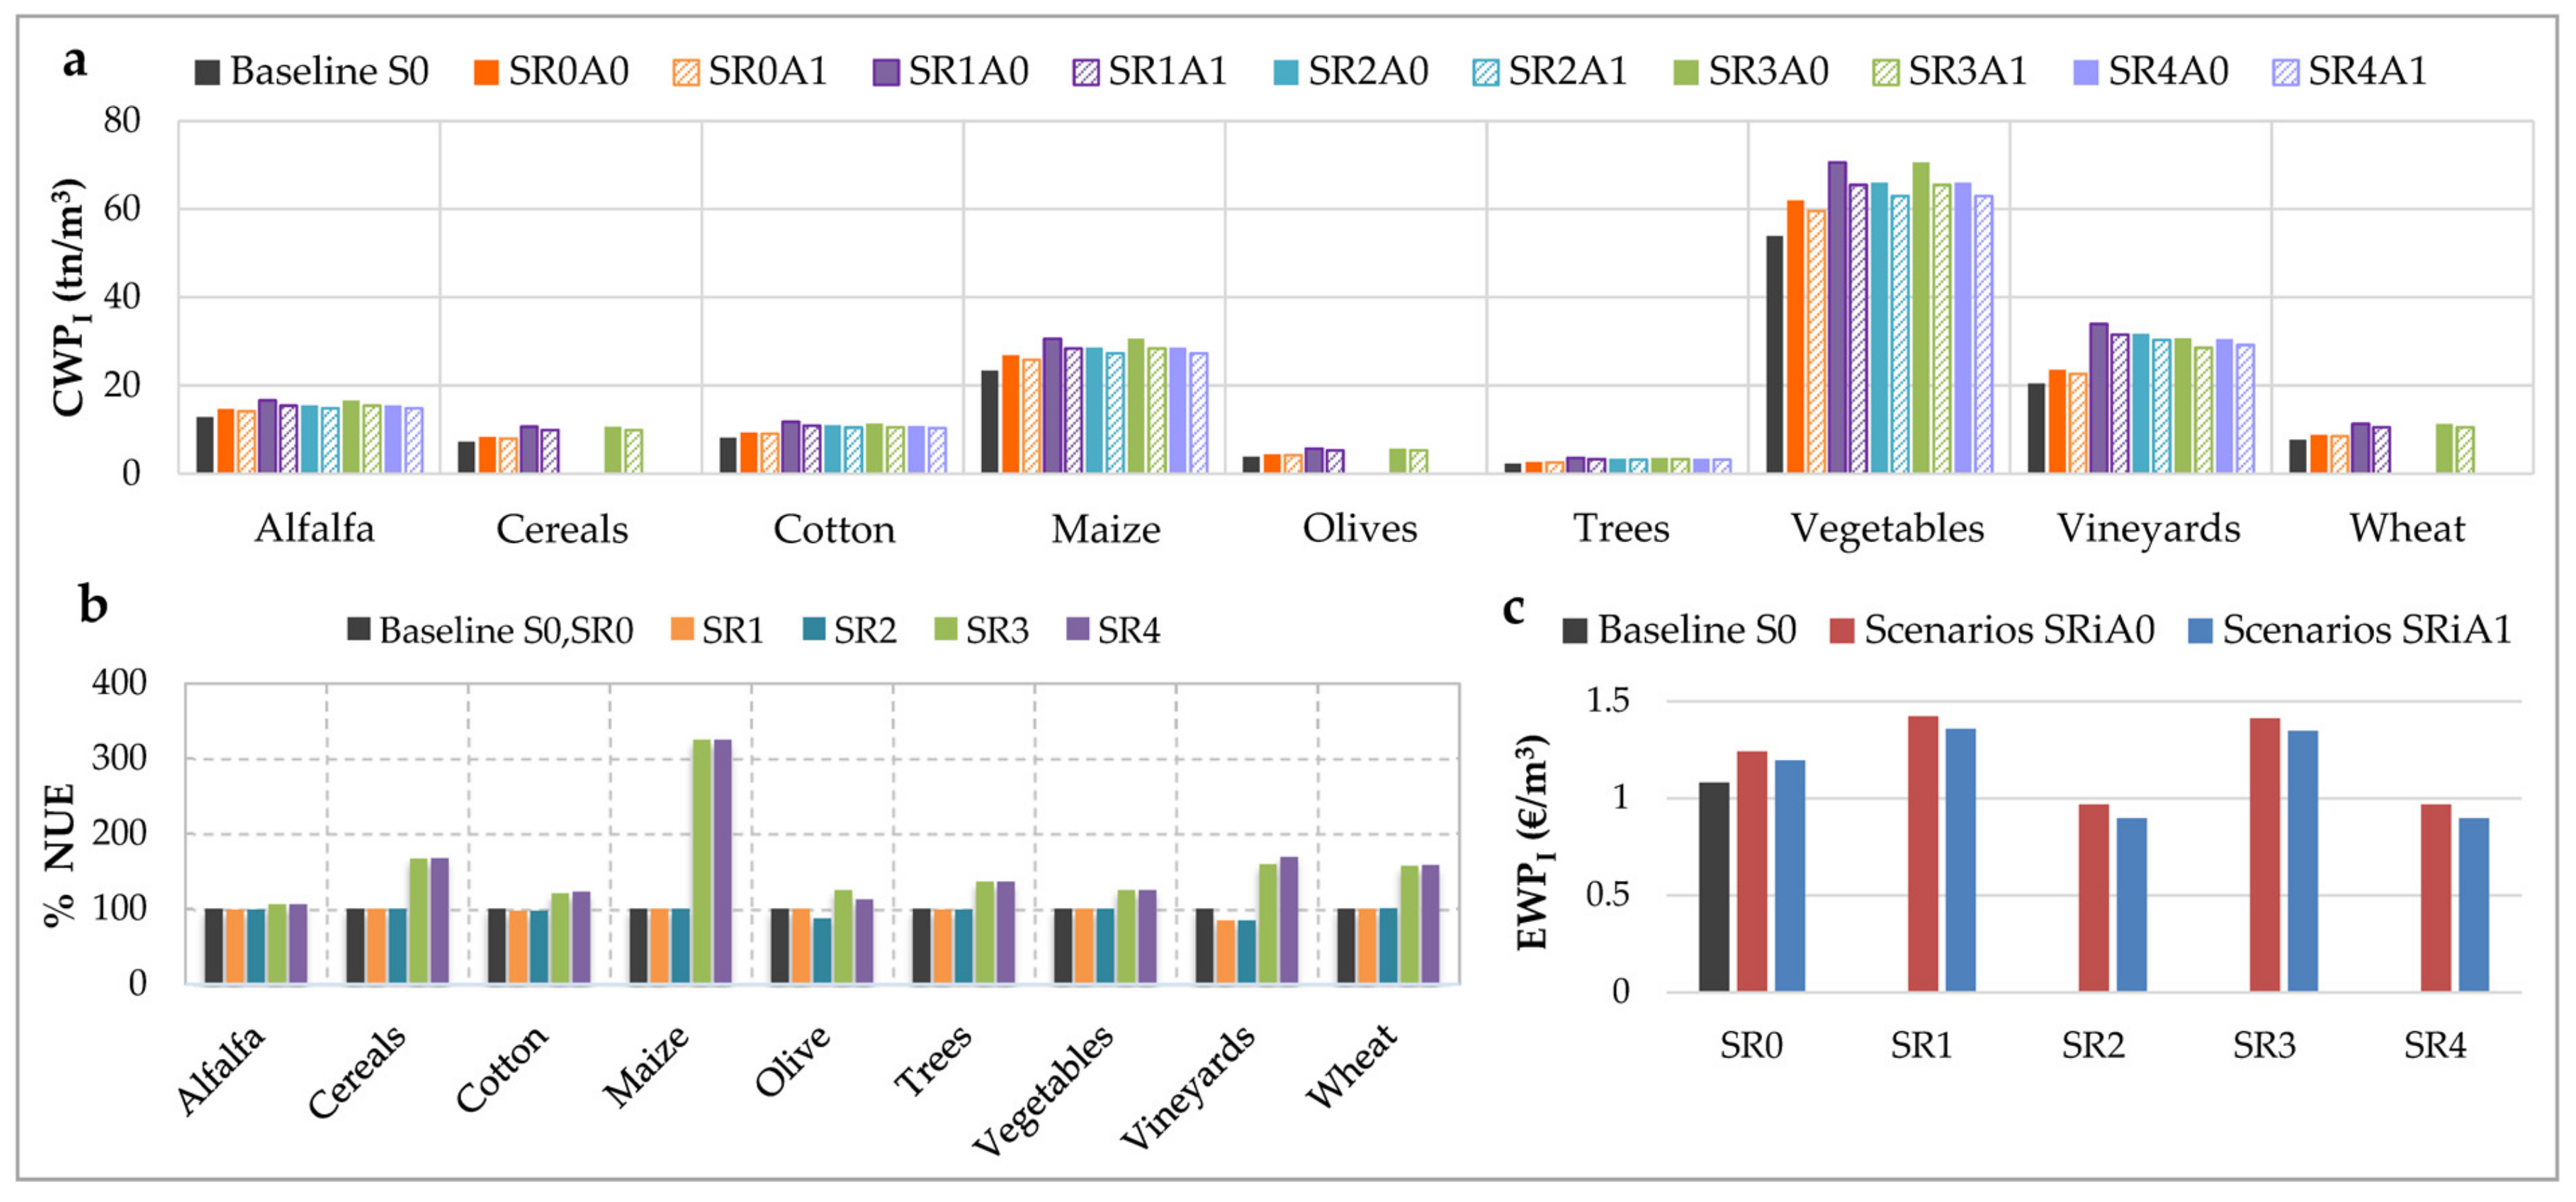
3.6.3. Crop Water Productivity (CWPI)

In light of the results of the REPIC model for grain production and agricultural water requirements for the different scenarios, the Crop Water Productivity (CWPI) score has been calculated for each field crop in the Almyros area, utilizing Equation (2). The averaged values of the cropland for the simulated scenarios are presented in Figure 11a. CWPI of the cropland is more noticeably increased for the deficit irrigation scenario, than for the deficit irrigation and rain-fed cultivation scenario (Figure 11a). All crops reach maximum scores of CWPI for the deficit irrigation scenario. Cotton, vegetables, and vineyards show a slight reduction in CWPI values for the reduced fertilization scenario, but all other crops maintain stable scores of CWPI for existing conditions and reduced fertilization scenario.

3.6.4. Nitrogen Use Efficiency (NUE)

The Nitrogen Use Efficiency (NUE) score for the scenarios of existing and reduced nitrogen application has been calculated for each field crop by Equation (3). The averaged values of NUE of the crops for the simulated scenarios are presented in Figure 11b. An increase in NUE values is observed for reduced fertilization scenarios (SR3 and SR4, for both deficit irrigation and deficit irrigation and rain-fed cultivation scenarios) compared with the existing fertilization conditions. This indicates that the existing fertilization is larger than an optimum fertilization scheme (Figure 11b). Alfalfa, cereals, cotton, vineyards, and wheat exhibit the highest scores of NUE, for the reduced fertilization with deficit irrigation and rain-fed cultivations scenarios. Olive tree cultivation shows the largest scores of NUE for reduced fertilization with deficit irrigation scenario. Maize, trees, and vegetables exhibit the highest values of NUE for the reduced fertilization, regardless of the irrigation practice.

3.6.5. Economic Water Productivity (EWPI)

The Economic Water Productivity (EWPI) index was estimated using Equation (4) for the irrigation water applied. The calculation has been performed on the product prices assuming constant prices that of 2015. The averaged values of the cropland for the simulated scenarios are presented in Figure 11c. The Economic Water Productivity (EWPI) follows the trend of (CWPI) and is greatly increased for the deficit irrigation scenario. EWPI scores are marginally higher for the scenario of reservoir operation (scenarios SR0-A0, A1) compared with the baseline scenario (only groundwater pumping, S0). For the deficit irrigation scenarios either for existing or reduced fertilization, the EWPI values noticeably increase, especially for irrigated area A0 as less water is pumped out of the aquifer than for area A1. For the deficit irrigation and rain-fed cultivation scenario, EWPI values decrease for the irrigated crops. For all scenarios, the contribution of reservoirs for the existing irrigation and deficit irrigation maximizes the gross profits and EWPI. Deficit irrigation is the most profitable irrigation scenario.

4. Discussion

Agronomic and water resources management scenarios have been implemented on the Almyros watershed in Thessaly, Greece. The analysis took place using an Integrated Modeling System developed by [2]. The modeling system consists of coupled models of surface hydrology (UTHBAL), groundwater flow (MODFLOW), crop growth/nitrates leaching (REPIC), contaminant transport/nitrate pollution (MT3DMS), and seawater intrusion (SEAWAT), integrating the reservoir operation model (UTHRL) developed by [16]. The connection of the UTHBAL and UTHRL models has been configured to optimize the irrigated extent of croplands, to ensure the reliability of the supplied water volume by the reservoirs.
The results of groundwater hydraulic heads for existing irrigation indicate that the operation of reservoirs increases the hydraulic heads near the reservoir locations. The positive change in the water table continues to improve as groundwater pumping is reduced with the use of surface water stored in the reservoirs. The results show that, for the deficit irrigation scenario, the water table elevation increases in the central area and mostly nearby Klinovos reservoir while, for the deficit irrigation and rain-fed cultivation scenario, the water table increases over the whole area of the aquifer.
The nitrates leaching, as simulated by the REPIC model, show a small increase in the deficit irrigation which is attributed to the smaller dilution of the contaminant. In deficit irrigation and rain-fed practice, the nitrate leaching are reduced significantly in the southern part of the aquifer, which is attributed to the absence of irrigation return flow of the rain-fed crop cultivations of olive groves, cereals, and wheat. Regarding the contaminant species fate under the scenario schemes, the nitrates concentrations, as simulated by the MT3DMS model, seem to inversely follow the water table’s course of change for all scenarios. For the existing fertilization and irrigation (baseline) scenario, the nitrates concentrations are especially reduced in the irrigated areas of Xirias and Klinovos reservoirs. For the deficit irrigation scenario, the nitrates are reduced across the aquifer and more in the reservoir irrigated areas. The increases in the west part of the aquifer are possibly due to the existing fertilization applications and the reduction in pumping out nitrates through groundwater abstractions. For the deficit irrigation and rain-fed cultivation scenario, the nitrates concentrations are even more reduced in a wide area, and larger reductions are found in certain areas.
Similarly, seawater intrusion is greatly alleviated in all scenarios. For the existing irrigation scenario, no significant decreases occur, while in the southern part of the aquifer, local assimilations occur that are attributed to the hydrogeological conditions, groundwater flow regime, and the reduction in chlorides pumped out, along with groundwater abstractions. For the deficit irrigation scenario, the chlorides are increased in the southern area, but in the coastline the chlorides are extremely reduced. This means that deficit irrigation, along with the reservoirs’ operation, serves as a seawater intrusion barrier. For the deficit irrigation and rain-fed cultivation scenario, chloride changes follow the same pattern as the previous scenarios, but in the coastline the seawater intrusion is more than three times reduced as compared to the baseline (S0) scenario.
The time-series of the average calculated water table elevation, nitrate concentration, and chloride concentration are presented in Figure 12 for the Baseline scenario (S0) and all the agronomic and water resources scenarios. From these graphs, it is evident the mitigating effect of the scenarios and reservoirs’ operation on the water balance and quality of groundwater.
The Water Exploitation Index (WEI+Watershed) in the baseline scenario, S0, indicates that the Almyros basin is under severe water stress. However, the operation of reservoirs, combined with deficit irrigation and/or deficit irrigation and rain-fed cultivations, alleviate the pressure on water resources to cover the water demands of the area. The Water Exploitation Index (WEI+Groundwater) for the baseline scenario (S0) shows that the aquifer of the Almyros basin is overwhelmingly pressured by groundwater abstractions. However, with the implementation of irrigation practices, the pressure is reduced but the aquifer remains under lesser, but still significant, water stress. The WEI+Groundwater scores are validated by the quality status of the aquifer at the end of simulation, where mostly nitrate pollution and seawater intrusion are still present, because the WEI+Groundwater scores are larger than 0.4 and it is considered unsustainable [85].
The CWPI values are larger for deficit irrigation than for deficit irrigation and rain-fed cultivation. For the deficit irrigation scenarios, all crops exhibit larger CWPI values. Cotton, vegetables, and vineyards have comparatively lower nutrient management ratings, however other crops have steady values between both existing as well as reduced fertilization. The results of NUE calculation for the various scenarios indicate that values of NUE are larger for the reduced fertilization scenarios compared with the existing fertilization scenarios. This indicates the existing fertilizer applications may be larger than the optimum application rates. There is a significant increase in NUE values for the reduced fertilization. Alfalfa, cereals, cotton, vineyards, and wheat have larger NUE scores for reduced fertilization under deficit irrigation and rain-fed cultivation scenarios. Olive tree cultivation has the lowest NUE scores for reduced fertilization under deficit irrigation scenarios. Maize, trees, and vegetables have the lowest NUE scores, compared with the other crops, for reduced fertilization irrespectively of irrigation practice.
The operation of reservoirs improves the economic efficiency for all the irrigation and fertilization scenarios. EWPI is considerably increased for deficit irrigation scenarios and the index values decrease for deficit irrigation and rain-fed scenarios. The results indicate that deficit irrigation is the most profitable irrigation scenario for the Almyros basin.

5. Conclusions

The simulation of the agronomic and water resources management scenarios with the Integrated Modeling System for the Almyros basin and its aquifer system proves that improvement of water resources quantity and quality is likely to occur after decades of implementation of good agricultural practices.
The presence and operation of reservoirs to replace the groundwater abstractions is a critical measure in this direction. The target of a good groundwater quantity status is more easily achieved than a good groundwater quality status during the same duration. Seawater intrusion can be minimized or reversed if the proposed schemes are implemented, and nitrate pollution minimization can also be promoted. Nevertheless, local assimilations of contaminants due to natural reasons, even when good agricultural practices are applied, indicate the need for drastic interventional approaches, such as techniques of remediation to be more actively integrated into the policy actions of reaching environmental targets.
The results of the study indicate that priority should be placed upon the deficit irrigation under the reduced fertilization scenario management scheme for the irrigated area A1 by the Klinovos reservoir, because the desirable reservoir reliability is achieved, the economic sustainability is ensured, and the resources sustainability is promoted and safeguarded to the best possible extent.
The presented approach in this study, using the Integrated Modeling System and efficiency indices, can be transferred and applied to other coastal agricultural basins if the necessary data is available. The approach will help to evaluate the water resources status as well with the aims to assess the status and sustainability of water resources, and also design, implement, and evaluate Best Management Practices to reach Sustainable Goals and environmental targets in the modern era.

Author Contributions

Conceptualization, methodology, supervision, writing—original draft-review, and editing, A.L. (Athanasios Loukas); methodology, software, writing—original draft preparation, review, and editing, investigation, data curation, and formal analysis, A.L. (Aikaterini Lyra); writing—original draft preparation, review, and editing, P.S.; writing—original draft preparation, review, and editing, K.V.; and writing—original draft preparation, review, and editing, N.M. All authors have read and agreed to the published version of the manuscript.

Funding

This research is co-financed by Greece and the European Union (European Social Fund—ESF) through the Operational Programme «Human Resources Development, Education and Lifelong Learning» in the context of the project “Strengthening Human Resources Research Potential via Doctorate Research” (MIS-5000432), implemented by the State Scholarships Foundation (ΙΚΥ).

Institutional Review Board Statement

Not applicable.

Informed Consent Statement

Not applicable.

Data Availability Statement

The results of this study are freely available.

Conflicts of Interest

The authors declare no conflict of interest.

References

  1. Tian, H.; Lu, C.; Pan, S.; Yang, J.; Miao, R.; Ren, W.; Yu, Q.; Fu, B.; Jin, F.-F.; Lu, Y.; et al. Optimizing resource use efficiencies in the food–energy–water nexus for sustainable agriculture: From conceptual model to decision support system. Curr. Opin. Environ. Sustain. 2018, 33, 104–113. [Google Scholar] [CrossRef]
  2. Lyra, A.; Loukas, A.; Sidiropoulos, P.; Tziatzios, G.; Mylopoulos, N. An Integrated Modeling System for the Evaluation of Water Resources in Coastal Agricultural Watersheds: Application in Almyros Basin, Thessaly, Greece. Water 2021, 13, 268. [Google Scholar] [CrossRef]
  3. Lyra, A.; Loukas, A.; Voudouris, K.; Mylopoulos, N. Evaluation of water resources management and agronomic scenarios using an integrated modelling system for coastal agricultural watersheds: The case of Almyros Basin, Thessaly, Greece. In Proceedings of the EGU General Assembly Conference Abstracts, Online, 19–30 April 2021; p. EGU21-13137. [Google Scholar] [CrossRef]
  4. Sidiropoulos, P.; Mylopoulos, N.; Vasiliades, L.; Loukas, A. Stochastic nitrate simulation under hydraulic conductivity uncertainty of an agricultural basin aquifer at Eastern Thessaly, Greece. Environ. Sci. Pollut. Res. 2021, 28, 65700–65715. [Google Scholar] [CrossRef] [PubMed]
  5. Kourgialas, N.N.; Karatzas, G.P.; Dokou, Z.; Kokorogiannis, A. Groundwater footprint methodology as policy tool for balancing water needs (agriculture & tourism) in water scarce islands—The case of Crete, Greece. Sci. Total Environ. 2018, 615, 381–389. [Google Scholar] [CrossRef]
  6. Sachs, J.D.; Schmidt-Traub, G.; Mazzucato, M.; Messner, D.; Nakicenovic, N.; Rockström, J. Six Transformations to achieve the Sustainable Development Goals. Nat. Sustain. 2019, 2, 805–814. [Google Scholar] [CrossRef]
  7. Messerli, P.; Murniningtyas, E.; Eloundou-Enyegue, P.; Foli, E.G.; Furman, E.; Glassman, A.; Hernández Licona, G.; Kim, E.M.; Lutz, W.; Moatti, J.-P. Global Sustainable Development Report 2019: The Future Is Now–Science for Achieving Sustainable Development; United Nations Publication: New York, NY, USA, 2019. [Google Scholar]
  8. EU. Directive 2000/60/EC of the European Parliament and of the Council Establishing a Framework for Community Action in the Field of Water Policy—European Environment Agency; The European Parliament, The Council of The European Union, Eds.; European Environment Information and Observation Network (Eionet): Copenhagen, Denmark, 2000; Volume L 327, pp. 1–73. [Google Scholar]
  9. MEE-GSNEW. Nitrates Directive Report (91/676/EEC). Nitrate Pollution Situation in Greece (Reporting Period 2016–2019). Athens. Available online: http://cdr.eionet.europa.eu/gr/eu/nid/index_html (accessed on 20 January 2022). (In Greek).
  10. Page, M.; Fakir, Y.; Aouissid, J. Modeling for integrated water resources. In Water Resources in the Mediterranean Region; Elsevier: Amsterdam, The Netherlands, 2020; pp. 157–190. [Google Scholar]
  11. Tomer, M.D.; Burkart, M.R. Long-Term Effects of Nitrogen Fertilizer Use on Ground Water Nitrate in Two Small Watersheds. J. Environ. Qual. 2003, 32, 2158–2171. [Google Scholar] [CrossRef]
  12. Meals, D.W.; Dressing, S.A.; Davenport, T.E. Lag Time in Water Quality Response to Best Management Practices: A Review. J. Environ. Qual. 2010, 39, 85–96. [Google Scholar] [CrossRef]
  13. Li, M.; Fu, Q.; Singh, V.P.; Liu, D.; Li, T. Stochastic multi-objective modeling for optimization of water-food-energy nexus of irrigated agriculture. Adv. Water Resour. 2019, 127, 209–224. [Google Scholar] [CrossRef]
  14. Dogrul, E.C.; Kadir, T.N.; Brush, C.F.; Chung, F.I. Linking groundwater simulation and reservoir system analysis models: The case for California’s Central Valley. Environ. Model. Softw. 2016, 77, 168–182. [Google Scholar] [CrossRef]
  15. Mani, A.; Tsai, F.T.C.; Kao, S.-C.; Naz, B.S.; Ashfaq, M.; Rastogi, D. Conjunctive management of surface and groundwater resources under projected future climate change scenarios. J. Hydrol. 2016, 540, 397–411. [Google Scholar] [CrossRef] [Green Version]
  16. Loukas, A.; Mylopoulos, N.; Vasiliades, L. A Modeling System for the Evaluation of Water Resources Management Strategies in Thessaly, Greece. Water Resour. Manag. 2007, 21, 1673–1702. [Google Scholar] [CrossRef]
  17. Sudha, V.; Venugopal, K.; Ambujam, N.K. Reservoir operation management through optimization and deficit irrigation. Irrig. Drain. Syst. 2008, 22, 93–102. [Google Scholar] [CrossRef]
  18. Ahmad, Z.; Butt, M.J. Environmental Study of Water Reservoirs for the Watershed Management in Pakistan. Earth Syst. Environ. 2019, 3, 613–623. [Google Scholar] [CrossRef]
  19. Fathy, I.; Ahmed, A.; Abd-Elhamid, H.F. Integrated management of surface water and groundwater to mitigate flood risks and water scarcity in arid and semi-arid regions. J. Flood Risk Manag. 2021, 14, e12720. [Google Scholar] [CrossRef]
  20. Georgiou, P.E.; Papamichail, D.M. Optimization model of an irrigation reservoir for water allocation and crop planning under various weather conditions. Irrig. Sci. 2008, 26, 487–504. [Google Scholar] [CrossRef]
  21. Hao, L.; Sun, G.; Liu, Y.; Qian, H. Integrated Modeling of Water Supply and Demand under Management Options and Climate Change Scenarios in Chifeng City, China. JAWRA J. Am. Water Resour. Assoc. 2015, 51, 655–671. [Google Scholar] [CrossRef]
  22. Rocha, J.; Carvalho-Santos, C.; Diogo, P.; Beça, P.; Keizer, J.J.; Nunes, J.P. Impacts of climate change on reservoir water availability, quality and irrigation needs in a water scarce Mediterranean region (southern Portugal). Sci. Total Environ. 2020, 736, 139477. [Google Scholar] [CrossRef]
  23. Salem, A.; Dezső, J.; El-Rawy, M.; Lóczy, D. Hydrological Modeling to Assess the Efficiency of Groundwater Replenishment through Natural Reservoirs in the Hungarian Drava River Floodplain. Water 2020, 12, 250. [Google Scholar] [CrossRef] [Green Version]
  24. Mereu, S.; Sušnik, J.; Trabucco, A.; Daccache, A.; Vamvakeridou-Lyroudia, L.; Renoldi, S.; Virdis, A.; Savić, D.; Assimacopoulos, D. Operational resilience of reservoirs to climate change, agricultural demand, and tourism: A case study from Sardinia. Sci. Total Environ. 2016, 543, 1028–1038. [Google Scholar] [CrossRef] [Green Version]
  25. López-Moreno, J.I.; Zabalza, J.; Vicente-Serrano, S.M.; Revuelto, J.; Gilaberte, M.; Azorin-Molina, C.; Morán-Tejeda, E.; García-Ruiz, J.M.; Tague, C. Impact of climate and land use change on water availability and reservoir management: Scenarios in the Upper Aragón River, Spanish Pyrenees. Sci. Total Environ. 2014, 493, 1222–1231. [Google Scholar] [CrossRef] [Green Version]
  26. Ashofteh, P.S.; Haddad, O.B.; Mariño, M.A. Climate Change Impact on Reservoir Performance Indexes in Agricultural Water Supply. J. Irrig. Drain. Eng. 2013, 139, 85–97. [Google Scholar] [CrossRef]
  27. Nunes, J.P.; Jacinto, R.; Keizer, J.J. Combined impacts of climate and socio-economic scenarios on irrigation water availability for a dry Mediterranean reservoir. Sci. Total Environ. 2017, 584–585, 219–233. [Google Scholar] [CrossRef] [PubMed]
  28. Sofroniou, A.; Bishop, S. Water Scarcity in Cyprus: A Review and Call for Integrated Policy. Water 2014, 6, 2898–2928. [Google Scholar] [CrossRef] [Green Version]
  29. Tzanakakis, V.A.; Angelakis, A.N.; Paranychianakis, N.V.; Dialynas, Y.G.; Tchobanoglous, G. Challenges and Opportunities for Sustainable Management of Water Resources in the Island of Crete, Greece. Water 2020, 12, 1538. [Google Scholar] [CrossRef]
  30. Dariane, A.B.; Ghasemi, M.; Karami, F.; Azaranfar, A.; Hatami, S. Crop pattern optimization in a multi-reservoir system by combining many-objective and social choice methods. Agric. Water Manag. 2021, 257, 107162. [Google Scholar] [CrossRef]
  31. Kang, M.G.; Park, S.W. Combined Simulation-Optimization Model for Assessing Irrigation Water Supply Capacities of Reservoirs. J. Irrig. Drain. Eng. 2014, 140, 04014005. [Google Scholar] [CrossRef]
  32. Ahmad, A.; El-Shafie, A.; Razali, S.F.M.; Mohamad, Z.S. Reservoir Optimization in Water Resources: A Review. Water Resour. Manag. 2014, 28, 3391–3405. [Google Scholar] [CrossRef]
  33. Zhao, T.; Zhao, J. Optimizing Operation of Water Supply Reservoir: The Role of Constraints. Math. Probl. Eng. 2014, 2014, 853186. [Google Scholar] [CrossRef]
  34. Sidiropoulos, P.; Mylopoulos, N.; Loukas, A. Reservoir-aquifer combined optimization for groundwater restoration: The case of Lake Karla watershed, Greece. Water Util. J. 2016, 12, 17–26. [Google Scholar]
  35. EU. Regulation (EC) No 1221/2009 of the European Parliament and of the Council of 25 November 2009 on the Voluntary Participation by Organisations in a Community Eco-Management and Audit Scheme (EMAS), Repealing Regulation (EC) No 761/2001 and Commission Decisions 2001/681/EC and 2006/193/EC; EUROPEAN COMMISSION, Ed.; Official Journal of the European Union: Online, 2019; Available online: http://data.europa.eu/eli/reg/2009/1221/2019-01-09 (accessed on 20 January 2022).
  36. MEECC. River Basin Management Plans. Hellenic Democracy, Government Gazette: Central Macedonia, Thessaly, Attiki, Eastern Central Greece, Northern, Eastern and Western Peloponnese; MEECC: Athens, Greece, 2014. [Google Scholar]
  37. WHO (Ed.) Guidelines for Drinking-Water Quality: First Addendum to the Fourth Edition; WHO: Geneva, Switzerland, 2017. [Google Scholar]
  38. Ward, M.H.; Jones, R.R.; Brender, J.D.; De Kok, T.M.; Weyer, P.J.; Nolan, B.T.; Villanueva, C.M.; Van Breda, S.G. Drinking water nitrate and human health: An updated review. Int. J. Environ. Res. Public Health 2018, 15, 1557. [Google Scholar] [CrossRef] [Green Version]
  39. IARC. Ingested Nitrate and Nitrite, and Cyanobacterial Peptide Toxins; v. 94; IARC Working Group on the Evaluation of Carcinogenic Risks to Humans: Lyon, France, 2010; pp. 1–464. Available online: https://monographs.iarc.who.int/wp-content/uploads/2018/06/mono94.pdf (accessed on 20 January 2022).
  40. NCESD. Greece, State of the Environment Report, Summary; National Center of Environment and Sustainable Development: Athens, Greece, 2018; pp. 70–71. ISBN 978-960-990-333-2. [Google Scholar]
  41. EU. Report from the Commission: In Accordance with Article 3.7 of the Groundwater Directive 2006/118/EC on the Establishment of Groundwater Threshold Values; European Commission: Brussels, Belgium, 2010. [Google Scholar]
  42. Hanson, B.; Grattan, S.R.; Fulton, A. Agricultural Salinity and Drainage; University of California Irrigation Program, University of California, Davis: Davis, CA, USA, 1999. [Google Scholar]
  43. Fixen, P.E. Crop Responses to Chloride. In Advances in Agronomy; Sparks, D.L., Ed.; Academic Press: Cambridge, MA, USA, 1993; Volume 50, pp. 107–150. [Google Scholar] [CrossRef]
  44. Bohn, H.L.; Myer, R.A.; O’Connor, G.A. Soil Chemistry; John Wiley & Sons: Hoboken, NJ, USA, 2002. [Google Scholar]
  45. Geilfus, C.-M. Review on the significance of chlorine for crop yield and quality. Plant Sci. 2018, 270, 114–122. [Google Scholar] [CrossRef] [PubMed]
  46. Xu, G.; Magen, H.; Tarchitzky, J.; Kafkafi, U. Advances in Chloride Nutrition of Plants. In Advances in Agronomy; Sparks, D.L., Ed.; Academic Press: Cambridge, MA, USA, 1999; Volume 68, pp. 97–150. [Google Scholar] [CrossRef]
  47. Grieve, C.M.; Grattan, S.R.; Maas, E.V. Plant salt tolerance. ASCE Man. Rep. Eng. Pract. 2012, 71, 405–459. [Google Scholar]
  48. Tomaz, A.; Palma, J.F.; Ramos, T.; Costa, M.N.; Rosa, E.; Santos, M.; Boteta, L.; Dôres, J.; Patanita, M. Yield, technological quality and water footprints of wheat under Mediterranean climate conditions: A field experiment to evaluate the effects of irrigation and nitrogen fertilization strategies. Agric. Water Manag. 2021, 258, 107214. [Google Scholar] [CrossRef]
  49. Zhang, J.; Ren, W.; An, P.; Pan, Z.; Wang, L.; Dong, Z.; He, D.; Yang, J.; Pan, S.; Tian, H. Responses of Crop Water Use Efficiency to Climate Change and Agronomic Measures in the Semiarid Area of Northern China. PLoS ONE 2015, 10, e0137409. [Google Scholar] [CrossRef] [PubMed]
  50. Pereira, L.S.; Cordery, I.; Iacovides, I. Improved indicators of water use performance and productivity for sustainable water conservation and saving. Agric. Water Manag. 2012, 108, 39–51. [Google Scholar] [CrossRef]
  51. Fernández, J.E.; Alcon, F.; Diaz-Espejo, A.; Hernandez-Santana, V.; Cuevas, M.V. Water use indicators and economic analysis for on-farm irrigation decision: A case study of a super high density olive tree orchard. Agric. Water Manag. 2020, 237, 106074. [Google Scholar] [CrossRef]
  52. Ullah, H.; Santiago-Arenas, R.; Ferdous, Z.; Attia, A.; Datta, A. Chapter Two—Improving water use efficiency, nitrogen use efficiency, and radiation use efficiency in field crops under drought stress: A review. In Advances in Agronomy; Sparks, D.L., Ed.; Academic Press: Cambridge, MA, USA, 2019; Volume 156, pp. 109–157. [Google Scholar] [CrossRef]
  53. Kuscu, H.; Turhan, A.; Ozmen, N.; Aydinol, P.; Demir, A.O. Optimizing levels of water and nitrogen applied through drip irrigation for yield, quality, and water productivity of processing tomato (Lycopersicon esculentum Mill.). Hortic. Environ. Biotechnol. 2014, 55, 103–114. [Google Scholar] [CrossRef]
  54. Fernández García, I.; Lecina, S.; Ruiz-Sánchez, M.C.; Vera, J.; Conejero, W.; Conesa, M.R.; Domínguez, A.; Pardo, J.J.; Léllis, B.C.; Montesinos, P.J.W. Trends and challenges in irrigation scheduling in the semi-arid area of Spain. Water 2020, 12, 785. [Google Scholar] [CrossRef] [Green Version]
  55. Watto, M.A.; Mugera, A.W. Econometric estimation of groundwater irrigation efficiency of cotton cultivation farms in Pakistan. J. Hydrol. Reg. Stud. 2015, 4, 193–211. [Google Scholar] [CrossRef] [Green Version]
  56. Fixen, P.; Brentrup, F.; Bruulsema, T.; Garcia, F.; Norton, R.; Zingore, S. Nutrient/fertilizer use efficiency: Measurement, current situation and trends. In Managing Water and Fertilizer for Sustainable Agricultural Intensification; Drechsel, P., Heffer, P., Magen, H., Mikkelsen, R., Wichelns, D., Eds.; International Fertilizer Industry Association (IFA), International Water Management Institute (IWMI), International Plant Nutrition Institute (IPNI), and International Potash Institute (IPI): Paris, France, 2015; Volume 270, Available online: https://ageconsearch.umn.edu/record/208412/files/managing_water_and_fertilizer_for_sustainable_agricultural_intensification.pdf (accessed on 20 January 2022).
  57. Lyra, A.; Loukas, A.; Sidiropoulos, P. Impacts of irrigation and nitrate fertilization scenarios on groundwater resources quantity and quality of the Almyros Basin, Greece. Water Supply 2021, 21, 2748–2759. [Google Scholar] [CrossRef]
  58. YPETHE (Ed.) Thessaly Water Utilization Projects; Water Resources and Environment of Thessaly: Online, 2022; Volume 2022, p. Smaller Regional Projects. Available online: www.ypethe.gr (accessed on 20 January 2022).
  59. MINAGRIC. Amending Project for the Construction of Xirias Reservoir in Almyros, Magnesia Prefecture; Directorate of Technical Works and Rural Infrastructure, Hellenic Ministry of Rural Development and Food: Athens, Greece, 2018.
  60. Dervisis, S. Design, Analysis and Evaluation of Operation of the Water Resources System in Sourpi Hydrological Watershed, in Magnesia Prefecture. Master’s Thesis, Department of Civil Engineering, University of Thessaly, Volos, Greece, 2010. [Google Scholar] [CrossRef]
  61. Loukas, A.; Dervisis, S.; Mylopoulos, N. Analysis and Evaluation of a Water Resources System: Sourpi Basin, Greece. In Proceedings of the Protection and restoration of the environment XI, Thessaloniki, Greece, 3–6 July 2012; pp. 233–242. [Google Scholar]
  62. Mylopoulos, N.; Mentes, A.; Karamanlidou, M. Sustainable water resources management in the wider hydrological basin of Volos. In Water Resources Management; Brebbia, C.A., Anagnostopoulos, P., Katsifarakis, K.L., Cheng, A.H.-D., Eds.; WIT Press: Southampton, UK, 2001; Volume 48, pp. 99–108. [Google Scholar] [CrossRef]
  63. Harbaugh, A.W.; Banta, E.R.; Hill, M.C.; McDonald, M.G. MODFLOW-2000, The U.S. Geological Survey Modular Ground-Water Model—User Guide to Modularization Concepts and the Ground-Water Flow Process; 2000-92; U.S. Geological Survey: Reston, VA, USA, 2000. [CrossRef] [Green Version]
  64. Pobuda, M. Using the R-ArcGIS Bridge: The Arcgisbinding Package. Available online: https://r.esri.com/assets/arcgisbinding-vignette.html (accessed on 20 January 2022).
  65. Williams, J.; Jones, C.; Dyke, P. The EPIC model and its application. In Proceedings of the ICRISAT-IBSNAT-SYSS Symposium on Minimum Data Sets for Agrotechnology Transfer, ICRISAT Center, Hyderabad, India, 21–26 March 1984; pp. 111–121. [Google Scholar]
  66. Zheng, C.; Wang, P.P. MT3DMS: A Modular Three-Dimensional Multi-Species Transport Model for Simulation of Advection, Dispersion and Chemical Reactions of Contaminants in Groundwater Systems, Documentation and User’s Guide; Contract Report SERDP-99-1; U.S. Army Engineer Research and Development Center: Vicksburg, MS, USA, 1999. [Google Scholar]
  67. Guo, W.; Langevin, C.D. User’s Guide to SEAWAT; A Computer Program for Simulation of Three-Dimensional Variable-Density Ground-Water Flow; 06-A7; Techniques of Water-Resources Investigation; U.S. Geological Survey: Reston, VA, USA, 2002. [CrossRef]
  68. ESDAC. European Soil Data Centre, Joint Research Centre, European Commission. Available online: www.esdac.jrc.ec.europa.eu (accessed on 20 January 2022).
  69. Lyra, A.; Pliakas, F.; Skias, S.; Gkiougkis, I. Implementation of DPSIR framework in the management of the Almyros basin, Magnesia Prefecture. In Bulletin of the Geological Society of Greece, Proceedings of the 14th International Congress; Bulletin of the Geological Society of Greece: Athens, Greece, 2016; Volume L, pp. 825–834. [Google Scholar] [CrossRef] [Green Version]
  70. Lyra, A.; Pliakas, F.; Kazakis, N. Implementation of CSDA framework in the management of Almyros basin, Magnesia Prefecture, Greece. In Proceedings of the 11th International Hydrogeological Congress of Greece, Athens, Greece, 4–6 October 2017; pp. 331–340. [Google Scholar]
  71. MEE-GSNEW. Ministry of Environment and Energy, Secretariat of Natural Environment and Water. Available online: http://lmt.ypeka.gr/public_view.html (accessed on 20 January 2022).
  72. Djaman, K.; Smeal, D.; Koudahe, K.; Allen, S. Hay Yield and Water Use Efficiency of Alfalfa under Different Irrigation and Fungicide Regimes in a Semiarid Climate. Water 2020, 12, 1721. [Google Scholar] [CrossRef]
  73. Pardo, J.J.; Martínez-Romero, A.; Léllis, B.C.; Tarjuelo, J.M.; Domínguez, A. Effect of the optimized regulated deficit irrigation methodology on water use in barley under semiarid conditions. Agric. Water Manag. 2020, 228, 105925. [Google Scholar] [CrossRef]
  74. Polychronides, M.; Galanopoulou-Sendouca, S.; Aggelides, S.; Danalatos, N.G. The Effect of Irrigation and Fertilization on Cotton Growth and Development under Greek Conditions. In Proceedings of the World Cotton Research Conference, Athens, Greece, 6–12 September 1998; pp. 405–407. [Google Scholar]
  75. Arampatzis, G.; Pisinaras, V.; Pavlidou, E.; Kourgialas, N.; Psarras, G.; Koubouris, G.; Hatzigiannakis, E.; Sismani, G.; Panagopoulos, A. Improving water use efficiency at farmers’ organization level. In Proceedings of the 6th International Conference on Olive Treeand Olive Products, Seville, Spain, 15–19 October 2018. [Google Scholar]
  76. LIFE14 CCA/GR/000389—AgroClimaWater. Deliverable C2: Report on Assessment of Water Efficiency of the Participant FORs before LIFEAgroClimaWater; 2016. Available online: http://www.lifeagroclimawater.eu/site_application/assets/editor/deliverables/C.2/Deliverable%20C2%20-%20Report%20on%20Assessment%20of%20Water%20efficiency.pdf (accessed on 20 January 2022).
  77. Thomidis, T.; Zioziou, E.; Koundouras, S.; Karagiannidis, C.; Navrozidis, I.; Nikolaou, N. Effects of nitrogen and irrigation on the quality of grapes and the susceptibility to Botrytis bunch rot. Sci. Hortic. 2016, 212, 60–68. [Google Scholar] [CrossRef]
  78. Barati, V.; Ghadiri, H.; Zand-Parsa, S.; Karimian, N. Nitrogen and water use efficiencies and yield response of barley cultivars under different irrigation and nitrogen regimes in a semi-arid Mediterranean climate. Arch. Agron. Soil Sci. 2015, 61, 15–32. [Google Scholar] [CrossRef]
  79. Polychronaki, E.; Douma, C.; Giourga, C.; Loumou, A.J.P. Assessing nitrogen fertilization strategies in winter wheat and cotton crops in northern Greece. Pedosphere 2012, 22, 689–697. [Google Scholar] [CrossRef]
  80. Archontoulis, S.; Struik, P.; Vos, J.; Danalatos, N. Maize and sorghum biomass and protein accumulation under adequate and limited supply of water and nitrogen in Greece. In Proceedings of the Agro2010/XIth ESA Congress, Montpellier, France, 29 August–3 September 2010; pp. 569–570. [Google Scholar]
  81. EEA. Use of Freshwater Resources in Europe. Available online: https://www.eea.europa.eu/data-and-maps/indicators/use-of-freshwater-resources-3/assessment-4 (accessed on 20 January 2022).
  82. Raskin, P.; Gleick, P.; Kirshen, P.; Pontius, G.; Strzepek, K. Water Futures: Assessment of Long-Range Patterns and Problems. In Comprehensive Assessment of the Freshwater Resources of the World; SEI: Stockholm, Sweden, 1997. [Google Scholar]
  83. Hashimoto, T.; Stedinger, J.R.; Loucks, D.P. Reliability, resiliency, and vulnerability criteria for water resource system performance evaluation. Water Resour. Res. 1982, 18, 14–20. [Google Scholar] [CrossRef] [Green Version]
  84. Thornthwaite, C.W. An Approach toward a Rational Classification of Climate. Geogr. Rev. 1948, 38, 55–94. [Google Scholar] [CrossRef]
  85. Fan, L.; Wang, H.; Liu, Z.; Li, N. Quantifying the Relationship between Drought and Water Scarcity Using Copulas: Case Study of Beijing–Tianjin–Hebei Metropolitan Areas in China. Water 2018, 10, 1622. [Google Scholar] [CrossRef] [Green Version]
Figure 1. Map of Almyros basin, aquifer, sub-watersheds, irrigated agricultural areas, and location of the Xirias reservoir (under construction), the Klinovos reservoir (planned), and the Mavromati reservoir (constructed—not operated).
Water 14 01086 g001
Figure 2. Results of previous groundwater simulation for existing agricultural and water management conditions and water supplied by groundwater pumping: (a) hydraulic heads, (b) nitrate leaching, (c) chloride concentrations, and (d) nitrate concentration in September 2018 (as simulated by Lyra et al. 2021 [57]).
Water 14 01086 g002
Figure 3. Reservoirs and the respective urban and agricultural water demand areas for (a) area A0 and (b) area A1, of the Almyros basin.
Water 14 01086 g003
Figure 4. Flowchart of the Modeling System and the Reservoir Simulation-Optimization Module.
Water 14 01086 g004
Figure 5. Stored Water Volume for (a) Xirias reservoir, (b) Mavromati reservoir, (c) Klinovos reservoir for Area A0, and (d) Klinovos reservoir for Area A1 for the various irrigation scenarios.
Water 14 01086 g005
Figure 6. Hydraulic head changes of Almyros aquifer at the end of the simulation period (September 2018) between the baseline scenario (S0) and the various water resources and fertilization scenarios: (a) S0—(SR0-A0), (b) S0—(SR1, SR3-A0), (c) S0—(SR2, SR4-A0), (d) S0—(SR0–A1), (e) S0—(SR1, SR3–A1), and (f) S0—(SR2, SR4–A1).
Water 14 01086 g006
Figure 7. Spatial differences of averaged nitrates leached between the baseline scenario (S0) and the agronomic and water resources management scenarios of the simulation period 1991 to 2018. (a) S0—(SR1-A0, A1), (b) S0—(SR2-A0, A1), (c) S0—(SR3-A0, A1), and (d) S0—(SR4-A0, A1).
Water 14 01086 g007
Figure 8. Nitrates concentration (NO3−) change in (mg/L) of Almyros aquifer at the end of the simulation period (September 2018) between the baseline scenario (S0) and the various water resources and fertilization scenarios. (a) S0—(SR0-A0), (b) S0—(SR0-A1), (c) S0—(SR1-A0), (d) S0—(SR1-A1), (e) S0—(SR2-A0), (f) S0—(SR2-A1), (g) S0—(SR3-A0), (h) S0—(SR1-A1), (i) S0—(SR4-A0), and (j) S0—(SR4-A1).
Water 14 01086 g008
Figure 9. Chlorides Concentrations Change in (mg/L) of Almyros aquifer at the end of the simulation period (September 2018) between the baseline scenario (S0) and the various water resources and fertilization scenarios. (a) S0—(SR0-A0), (b) S0—(SR1, SR3-A0), (c) S0—(SR2, SR4-A0), (d) S0—(SR0-A1), (e) S0—(SR1, SR3-A1), and (f) S0—(SR2, SR4-A1).
Water 14 01086 g009
Figure 10. Annual values of (a) Basin Water Exploitation Index (WEI+Watershed) and (b) Aquifer Water Exploitation Index (WEI+Groundwater).
Water 14 01086 g010
Figure 11. Annual average values of (a) Crop Water Productivity (CWPI), (b) Nitrogen Use Efficiency (NUE), and (c) Economic Water Productivity (EWPI) for the period 1991–2018.
Water 14 01086 g011
Figure 12. Monthly values of (a) Mean Water Table Elevation (m), (b) Mean Nitrates concentration (NO3−) (mg/L), and (c) Chlorides Concentration (mg/L) of Almyros aquifer for the period 1991–2018.
Water 14 01086 g012
Table 1. Characteristics of sub-watershed areas contributing to the inflows of the reservoirs.
Sub–BasinXirias
Upstream
Xirias
Downstream
Mavromati
Upstream
Mavromati Downstream
and Klinovos Upstream
Klinovos
Downstream
Area (km2)81.32136.143.6540.48129.04
Mean Elevation (m)930.8297.51054.5641.9174.4
Curve Number (CN)54.9359.9560.0854.850.65
Table 2. Urban Demand Sites linked to Mavromati Reservoir.
LocationElevation (m)Water Demand 1991 (hm3)Water Demand 2001 (hm3)Water Demand 2011 (hm3)
1. Achileio140.060.050.06
2. Agia Triada660.030.030.02
3. Agios Ioannis5000.010.0050.03
4. Agioi Theodoroi1800.030.030.03
5. Drumonas1200.020.030.02
6. Gavriani2700.020.020.02
7. Pteleos1080.160.110.12
8. Sourpi290.150.160.13
9. Vrunaina4500.050.040.03
Industry and Tourism 10.030.030.03
Sum0.560.490.48
1 Estimated.
Table 3. Summary of the agronomic and water resources management Scenarios.
ScenarioSource of WaterKlinovos Reservoir
Irrigated Area
IrrigationFertilization
S0Groundwater-ExistingExisting
SR0-A0Reservoirs and GroundwaterA0Existing Existing
SR0-A1Reservoirs and GroundwaterA1ExistingExisting
SR1-A0Reservoirs and GroundwaterA0Deficit Existing
SR1-A1Reservoirs and GroundwaterA1DeficitExisting
SR2-A0Reservoirs and GroundwaterA0Deficit and Rain–fed cultivationExisting
SR2-A1Reservoirs and GroundwaterA1Deficit and Rain–fed cultivationExisting
SR3-A0Reservoirs and GroundwaterA0DeficitReduced
SR3-A1Reservoirs and GroundwaterA1DeficitReduced
SR4-A0Reservoirs and GroundwaterA0Deficit and Rain–fed cultivationReduced
SR4-A1Reservoirs and GroundwaterA1Deficit and Rain–fed cultivationReduced
Table 4. Statistics of area extent of irrigated croplands from the storage water works of Xirias and Klinovos for the two cases simulated for the period 1991–2018.
Irrigated Cropland in km2AlfalfaCerealsCottonMaizeOlivesTreesVegetablesVineyardsWheatSum
Xirias0.81.90.50.20.600.30.12.26.5
Klinovos Area A02.525.40.66.30.10.90.25.423.3
Klinovos Area A11.10.81.60.23.900.40.1210.2
Table 5. Mean annual values of input meteorological data and simulated results of the UTHBAL model for the reservoir sub-watersheds of Almyros basin.
Reservoir
Sub-Watershed
Xirias
Upstream
Xirias
Downstream
Mavromati
Upstream
Mavromati Downstream/Klinovos UpstreamKlinovos
Downstream
Temperature °C1315.712.41416.2
Precipitation (mm)697539727670560
PET (mm)757865735798889
Runoff (mm)1599614614493
Recharge (mm)7535785915
Table 6. Mean annual crop yields in (tn/ha) for the various scenarios (period 1991–2018).
Crop Yield (tn/ha)Baseline SR1SR2SR3SR4
Alfalfa 111.411.311.311.311.3
Cereals2.42.42.42.42.4
Cotton 13.33.33.33.13.2
Maize9.09.09.09.09.0
Olives 12.02.01.82.01.8
Trees1.21.21.21.21.2
Vegetables 114.514.414.414.414.4
Vineyards 16.45.45.44.85.2
Wheat2.62.62.62.62.6
1 sensitive crop.
Table 7. Mean monthly reservoir reliability to satisfy water demands.
Reservoir
Reliability α (%)
MavromatiXiriasKlinovos Area A0Klinovos Area A1
Existing (SR0)97.210068.589.8
Deficit (SR1, SR3)97.210073.8100
Deficit and Rain-fed (SR2, SR4)97.210099.7100
Publisher’s Note: MDPI stays neutral with regard to jurisdictional claims in published maps and institutional affiliations.

