1. Introduction
According to estimates by the World Health Organization, 2.2 billion people globally rely on drinking water sources that are not safely managed, and even those with improved sources sometimes travel substantial distances to reach the source [
1].
Members of households without an improved water source suffer detrimental effects from water-borne diseases such as cholera, typhoid, and schistosomiasis [
2,
3]. These diseases are especially dangerous to children, as they can cause severe diarrhea, killing 361,000 children under 5 every year [
4]. Point-of-use water treatment (POUWT) technologies provide an inexpensive, effective solution to reduce waterborne diseases by allowing for households to treat water in the home shortly before consumption, minimizing the risk of recontamination, which can happen during transport and storage [
5].
It has long been known that ionic silver deactivates waterborne pathogenic bacteria [
6,
7]. Incorporating silver into POUWT technologies has been shown to disinfect bacterial pathogens in water just as well as chlorine, which is used widely in water purification, providing up to a 4.2-log reduction in total coliform bacteria in drinking water [
8,
9]. Recently, silver has been shown to be capable of inactivating Adenovirus and Cryptosporidium parvum [
10,
11]. Research has shown that copper can also be an effective disinfectant [
12]. In addition to their disinfection efficacy, silver and copper do not alter the taste or odor of water at concentrations required for water treatment, a common adverse side-effect of chlorination [
7,
13]. Silver has been incorporated into ceramic water filters [
14,
15,
16], MadiDrops [
8,
17,
18], Folia Water paper filters [
19,
20], and SilverDYNE [
21] and has been shown to effectively treat water while maintaining effluent silver concentrations below the World Health Organization (WHO) guideline of 100 µg/L [
22]. Of these devices, SilverDYNE (We Are Clean Water, LLC, Los Angeles, CA, USA.) and the MadiDrop (Silivhere Technologies, Inc., Charlottesville, VA, USA) clean stored water for the purpose of disinfection but do not combine treatment with filtration. While these devices are effective, the silver ions produced from the MadiDrop can take up to 8 h for adequate disinfection [
18]. In addition, SilverDYNE uses silver nanoparticles, which have shown to be less efficient for disinfection than silver ions [
21].
Disinfecting water via electrolysis has been examined for a variety of water treatment applications but never in an inexpensive, POUWT system designed for resource-limited settings [
6,
23,
24,
25,
26,
27,
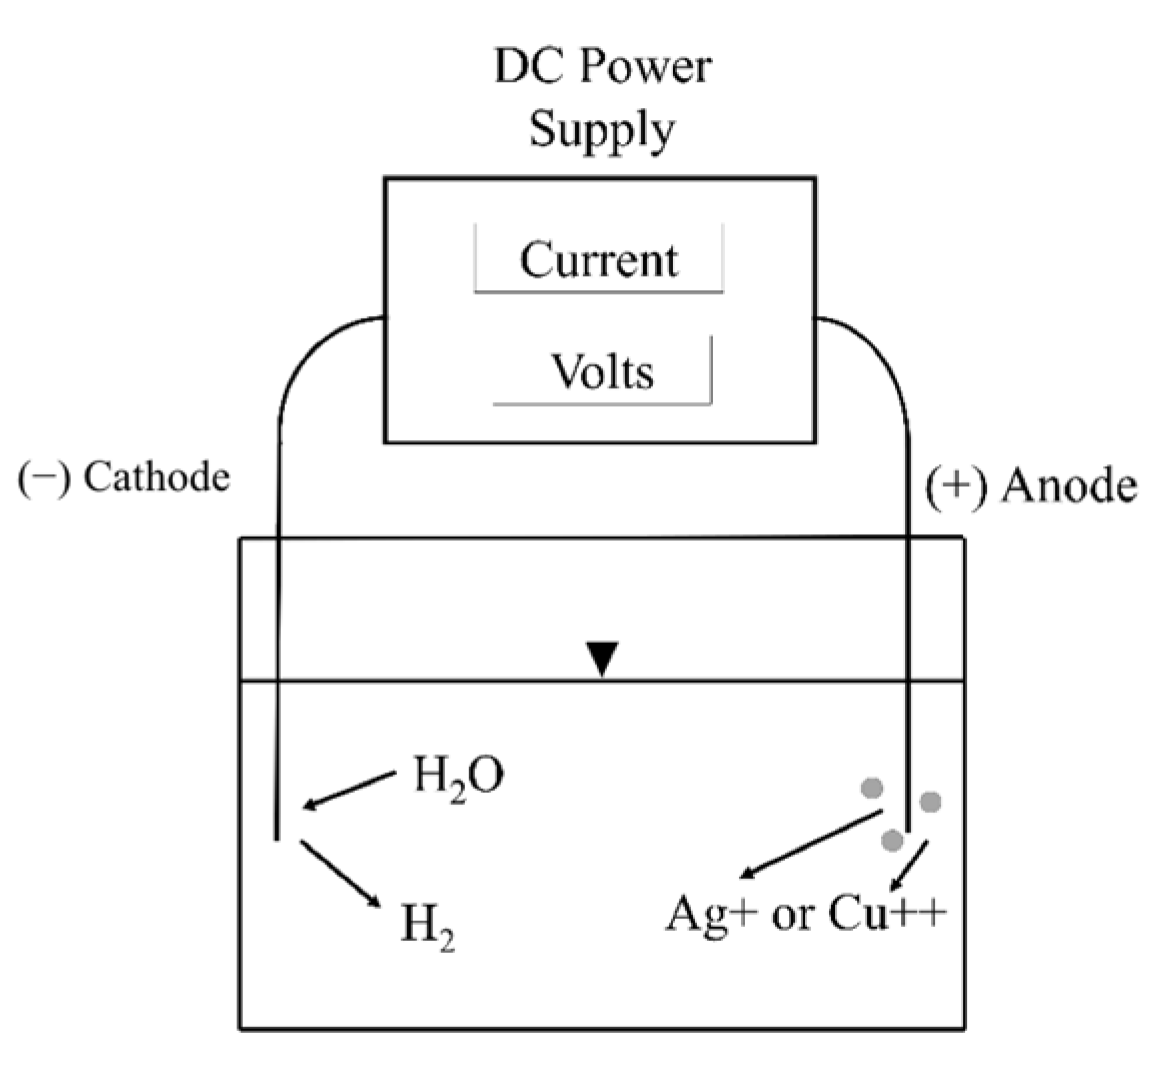
28]. Electrolytic water disinfection is the process of generating metal ions by inserting a negatively charged metal cathode and positively charged metal anode into the water to be disinfected and applying an electric current [
7]. This process causes the anode to release metal ions as the metal of interest is reduced, while the free electron is used to synthesize hydrogen gas and hydroxide ions from water at the cathode. The reactions at the anode are Ag → Ag
+ + e
− and Cu → Cu
2+ + 2e
−. The reaction at the cathode is H
2O + e
− → ½H
2 + OH
−. Electrolysis has the potential to deliver a target amount of metal ions quickly to contaminated water, and the small amount of metal required for treatment allows for a single anode and cathode pair to treat water daily for a long period of time.
This paper seeks to establish the potential of silver and copper electrolysis as a mechanism to provide adequate disinfection to untreated water via a POUWT technology for low-resource settings. To address this, proof-of-concept experiments were conducted to examine the effect of various parameters on metal ion release in a POUWT configuration. Based on this work, an electrolytic POUWT prototype was developed to deliver a fixed amount of silver ions to 10 L of stored household water. To the authors’ knowledge, this is the first development of a device that uses electrolytically generated silver for the purpose of treating drinking water in a low-resource setting. Additionally, such a device has not been tested in households before this study. This paper discusses both the proof-of-concept laboratory experiments and the field performance of the resulting POUWT device over four weeks of use in the Limpopo Province, South Africa.
2. Materials and Methods
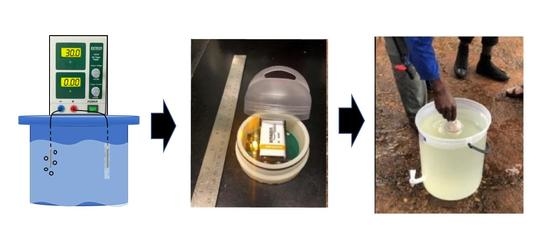
For proof-of-concept experiments conducted in the laboratory at the University of Virginia, two pieces of either silver or copper wire were submerged into synthetic groundwater (SGW). SGW consisted of 1.2 g of MgSO
4, 1.92 g NaHCO
3, 0.08 g KCl, and 1.2 g of CaSO
4 per 20 L in a plastic container, as per the moderately hard synthetic water recipe provided by the U.S. Environmental Protection Agency [
29]. SGW is estimated to have a pH and alkalinity range of 7.4–7.8 and 57–64, respectively. A current was applied to the configuration via a direct current (DC) power supply, as depicted in
Figure 1. All water samples tested for silver and copper analysis were prepared with trace metal grade nitric acid (Fisher Chemical, Fair Lawn, NJ, USA) and were tested on a calibrated graphite furnace (HGA 900, Perkin-Elmer, Waltham, MA, USA) atomic absorption spectrometer (AA2100, Perkin-Elmer) (GFAAS). Prepared solutions of 10 µg/L were run intermittently throughout the silver and copper analyses to confirm instrument performance. Experiments were performed in triplicate, except for the longevity of use and disinfection potential trials, which were performed in duplicate due to resource limitations.
2.1. Varying Parameters and Associated Ion Release
To investigate the effect of wire diameter on metal ion release, 0.25 mm, 0.5 mm, or 1 mm thick wires were submerged 2.5 cm into 400 mL of SGW. Then, 5 V was applied via a DC current for 120 min. Each wire thickness was tested through three trials, and this procedure was conducted for both copper and silver wire. Four-milliliter water samples were taken every 20 min and analyzed for silver or copper concentration.
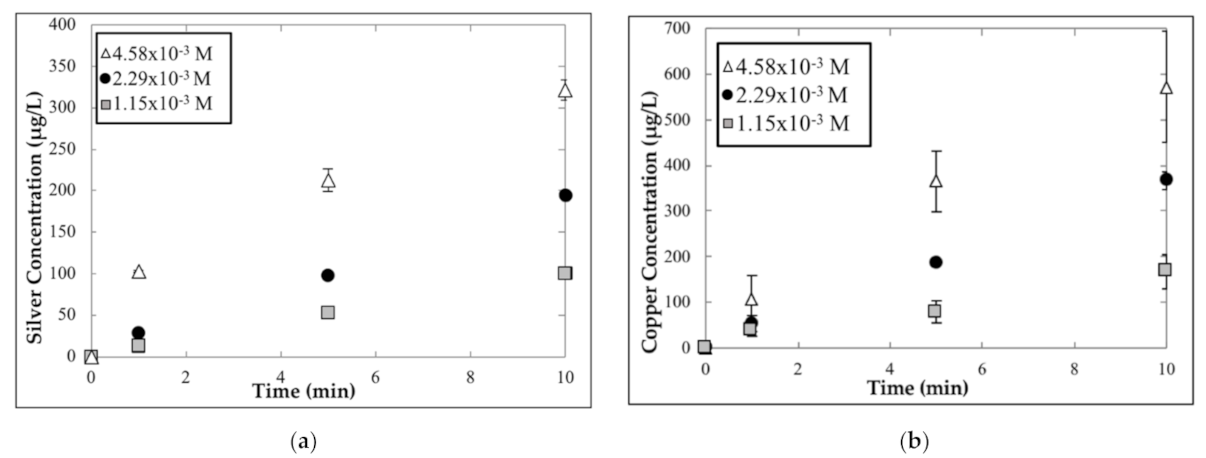
An experiment was conducted to test the relationship between the ionic strength of the water being treated and the release of metal ions. The ionic strength of 100% SGW was calculated from the concentration and charges of reagents added to deionized water. Then, 2.5 cm of 1 mm-diameter wire was submerged in 400 mL of either 100% SGW, 50% SGW and 50% deionized water, or 25% SGW and 75% deionized water. Five volts were applied to the apparatus via a DC current for ten minutes. Water samples were taken at 0, 1, 5, and 10 min and analyzed for silver or copper concentration. This process was completed three times for each concentration of SGW, and experiments were conducted for both copper and silver wire.
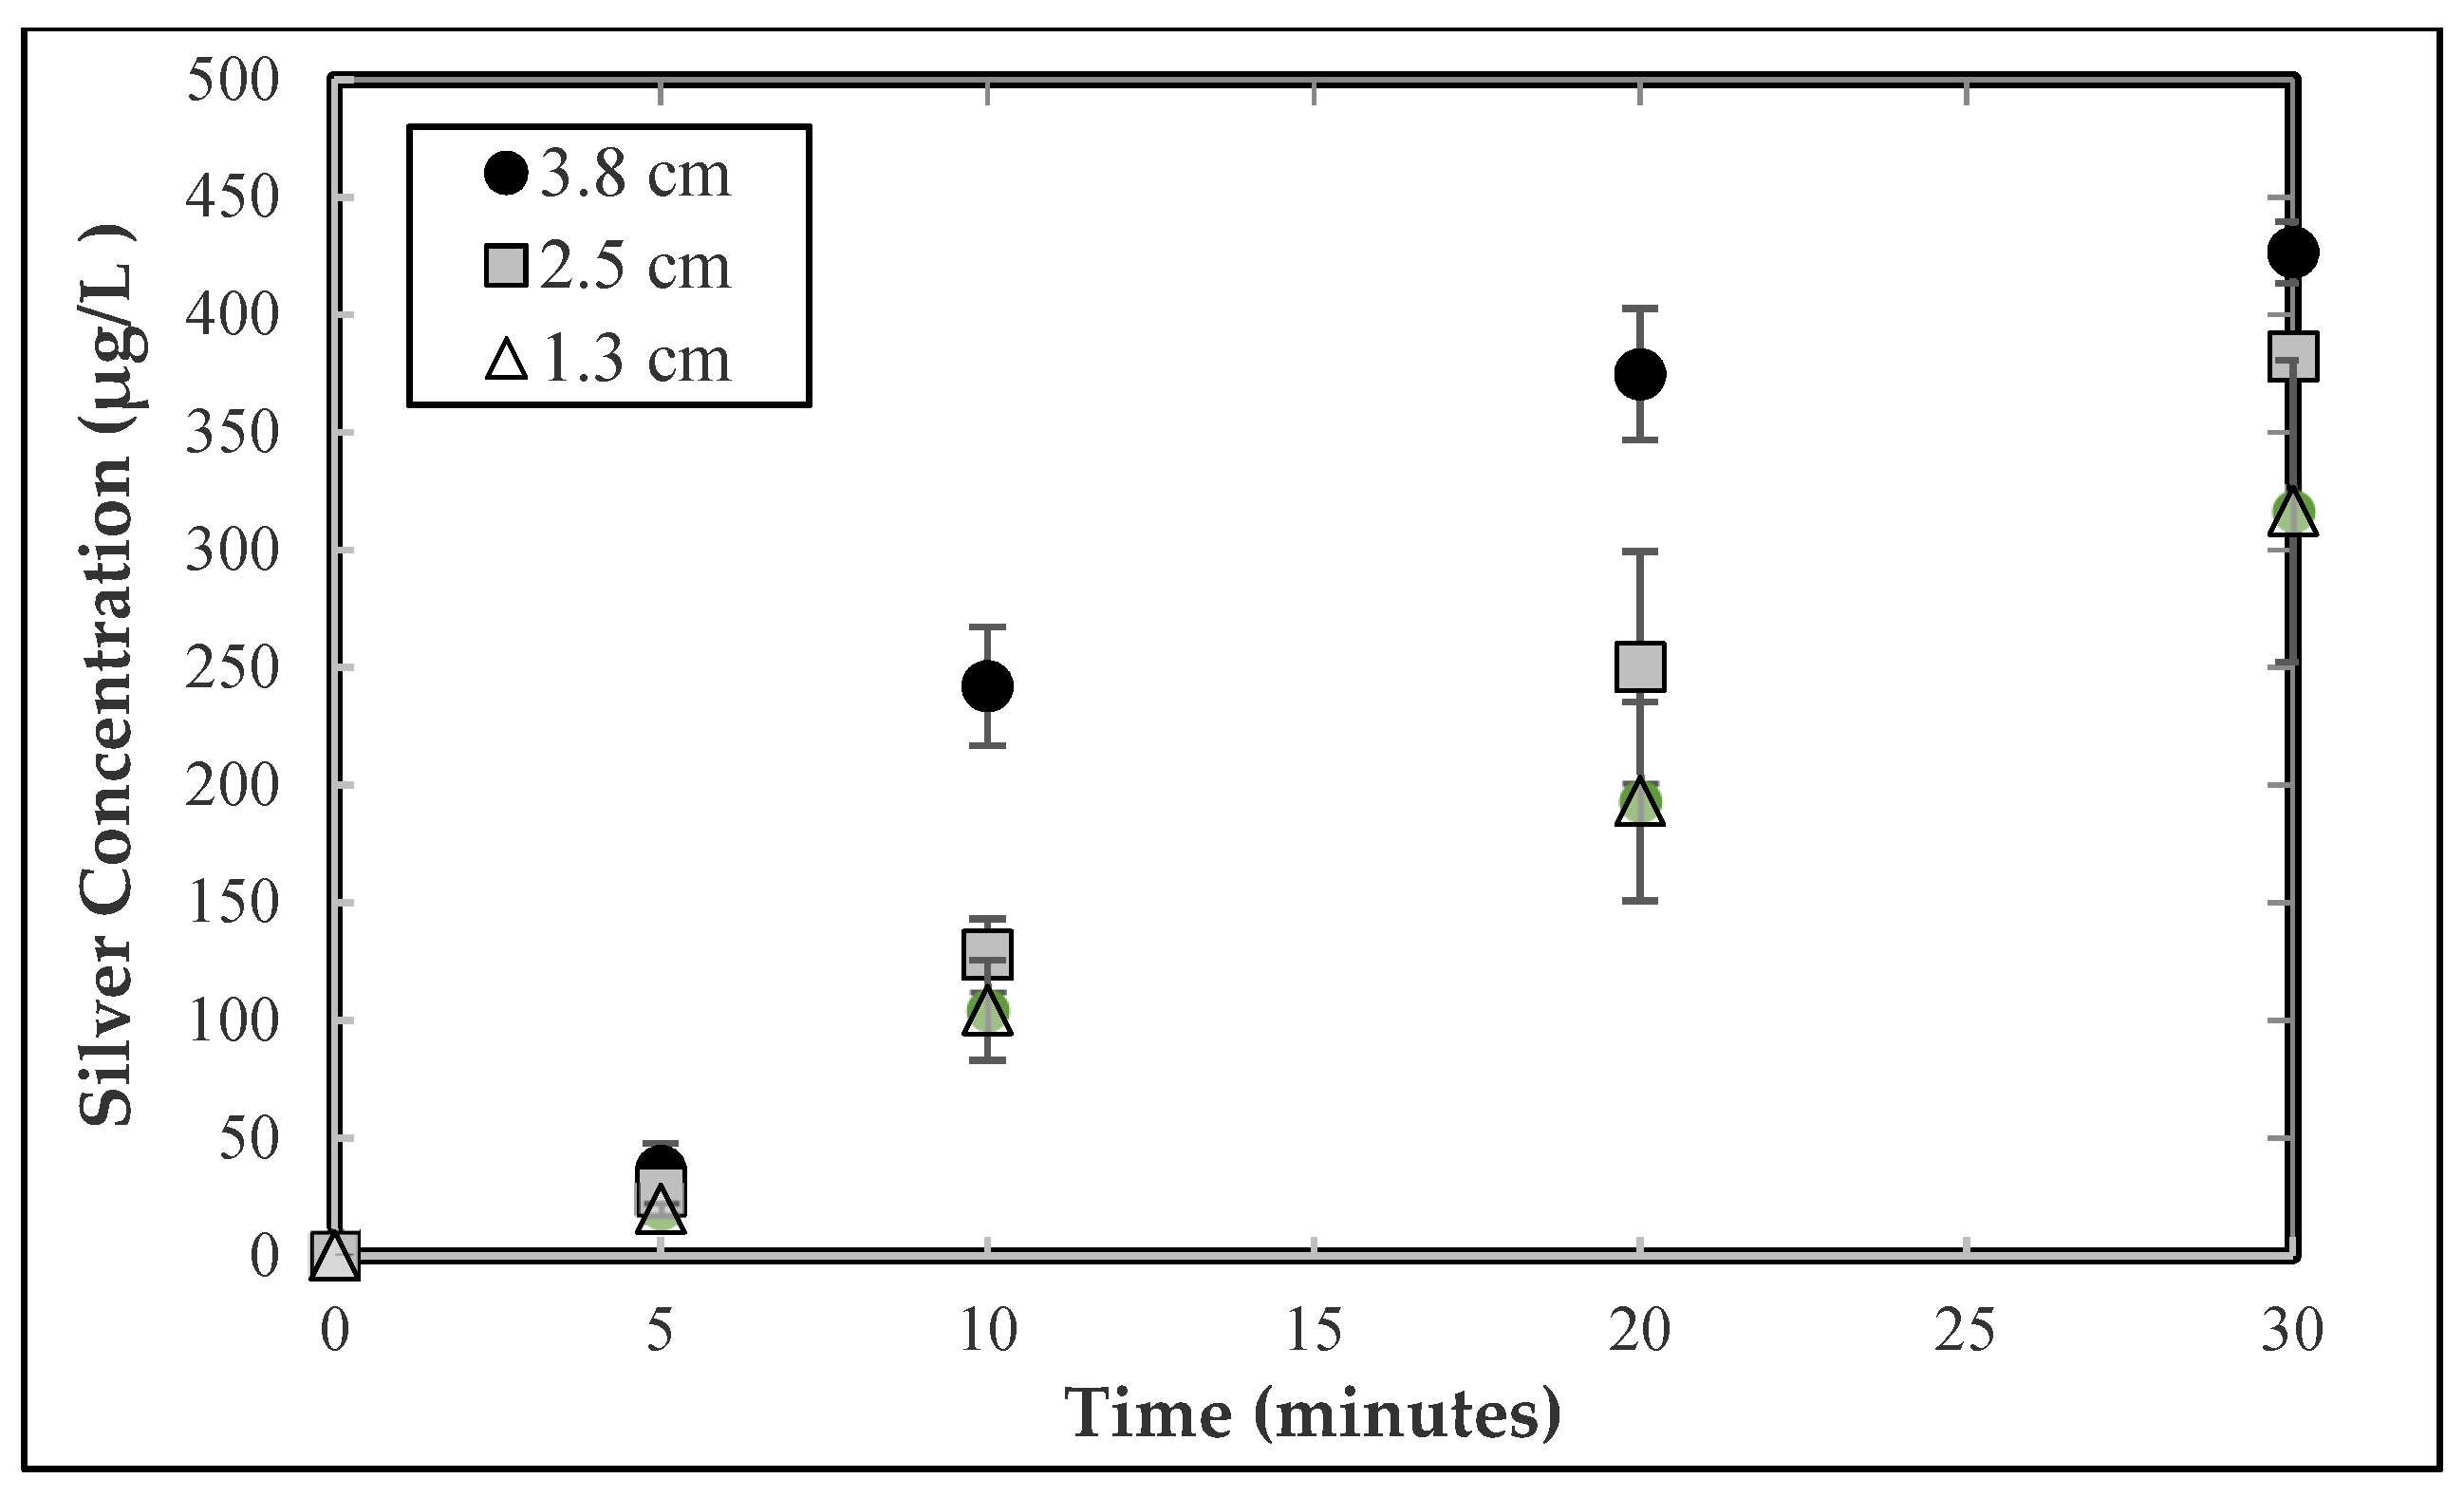
A set of experiments examined the relationship between the depth of wire submerged into untreated water and the release of metal ions. Different lengths—1.3 cm, 2.5 cm in, or 3.8 cm—of 1 mm-diameter silver wire was submerged into 10 L of SGW. Nine volts were applied to the apparatus via a DC current for 30 min. Water samples were taken at 0, 5, 10, 20, and 30 min and analyzed for silver concentration. This process was completed three times for each wire depth.
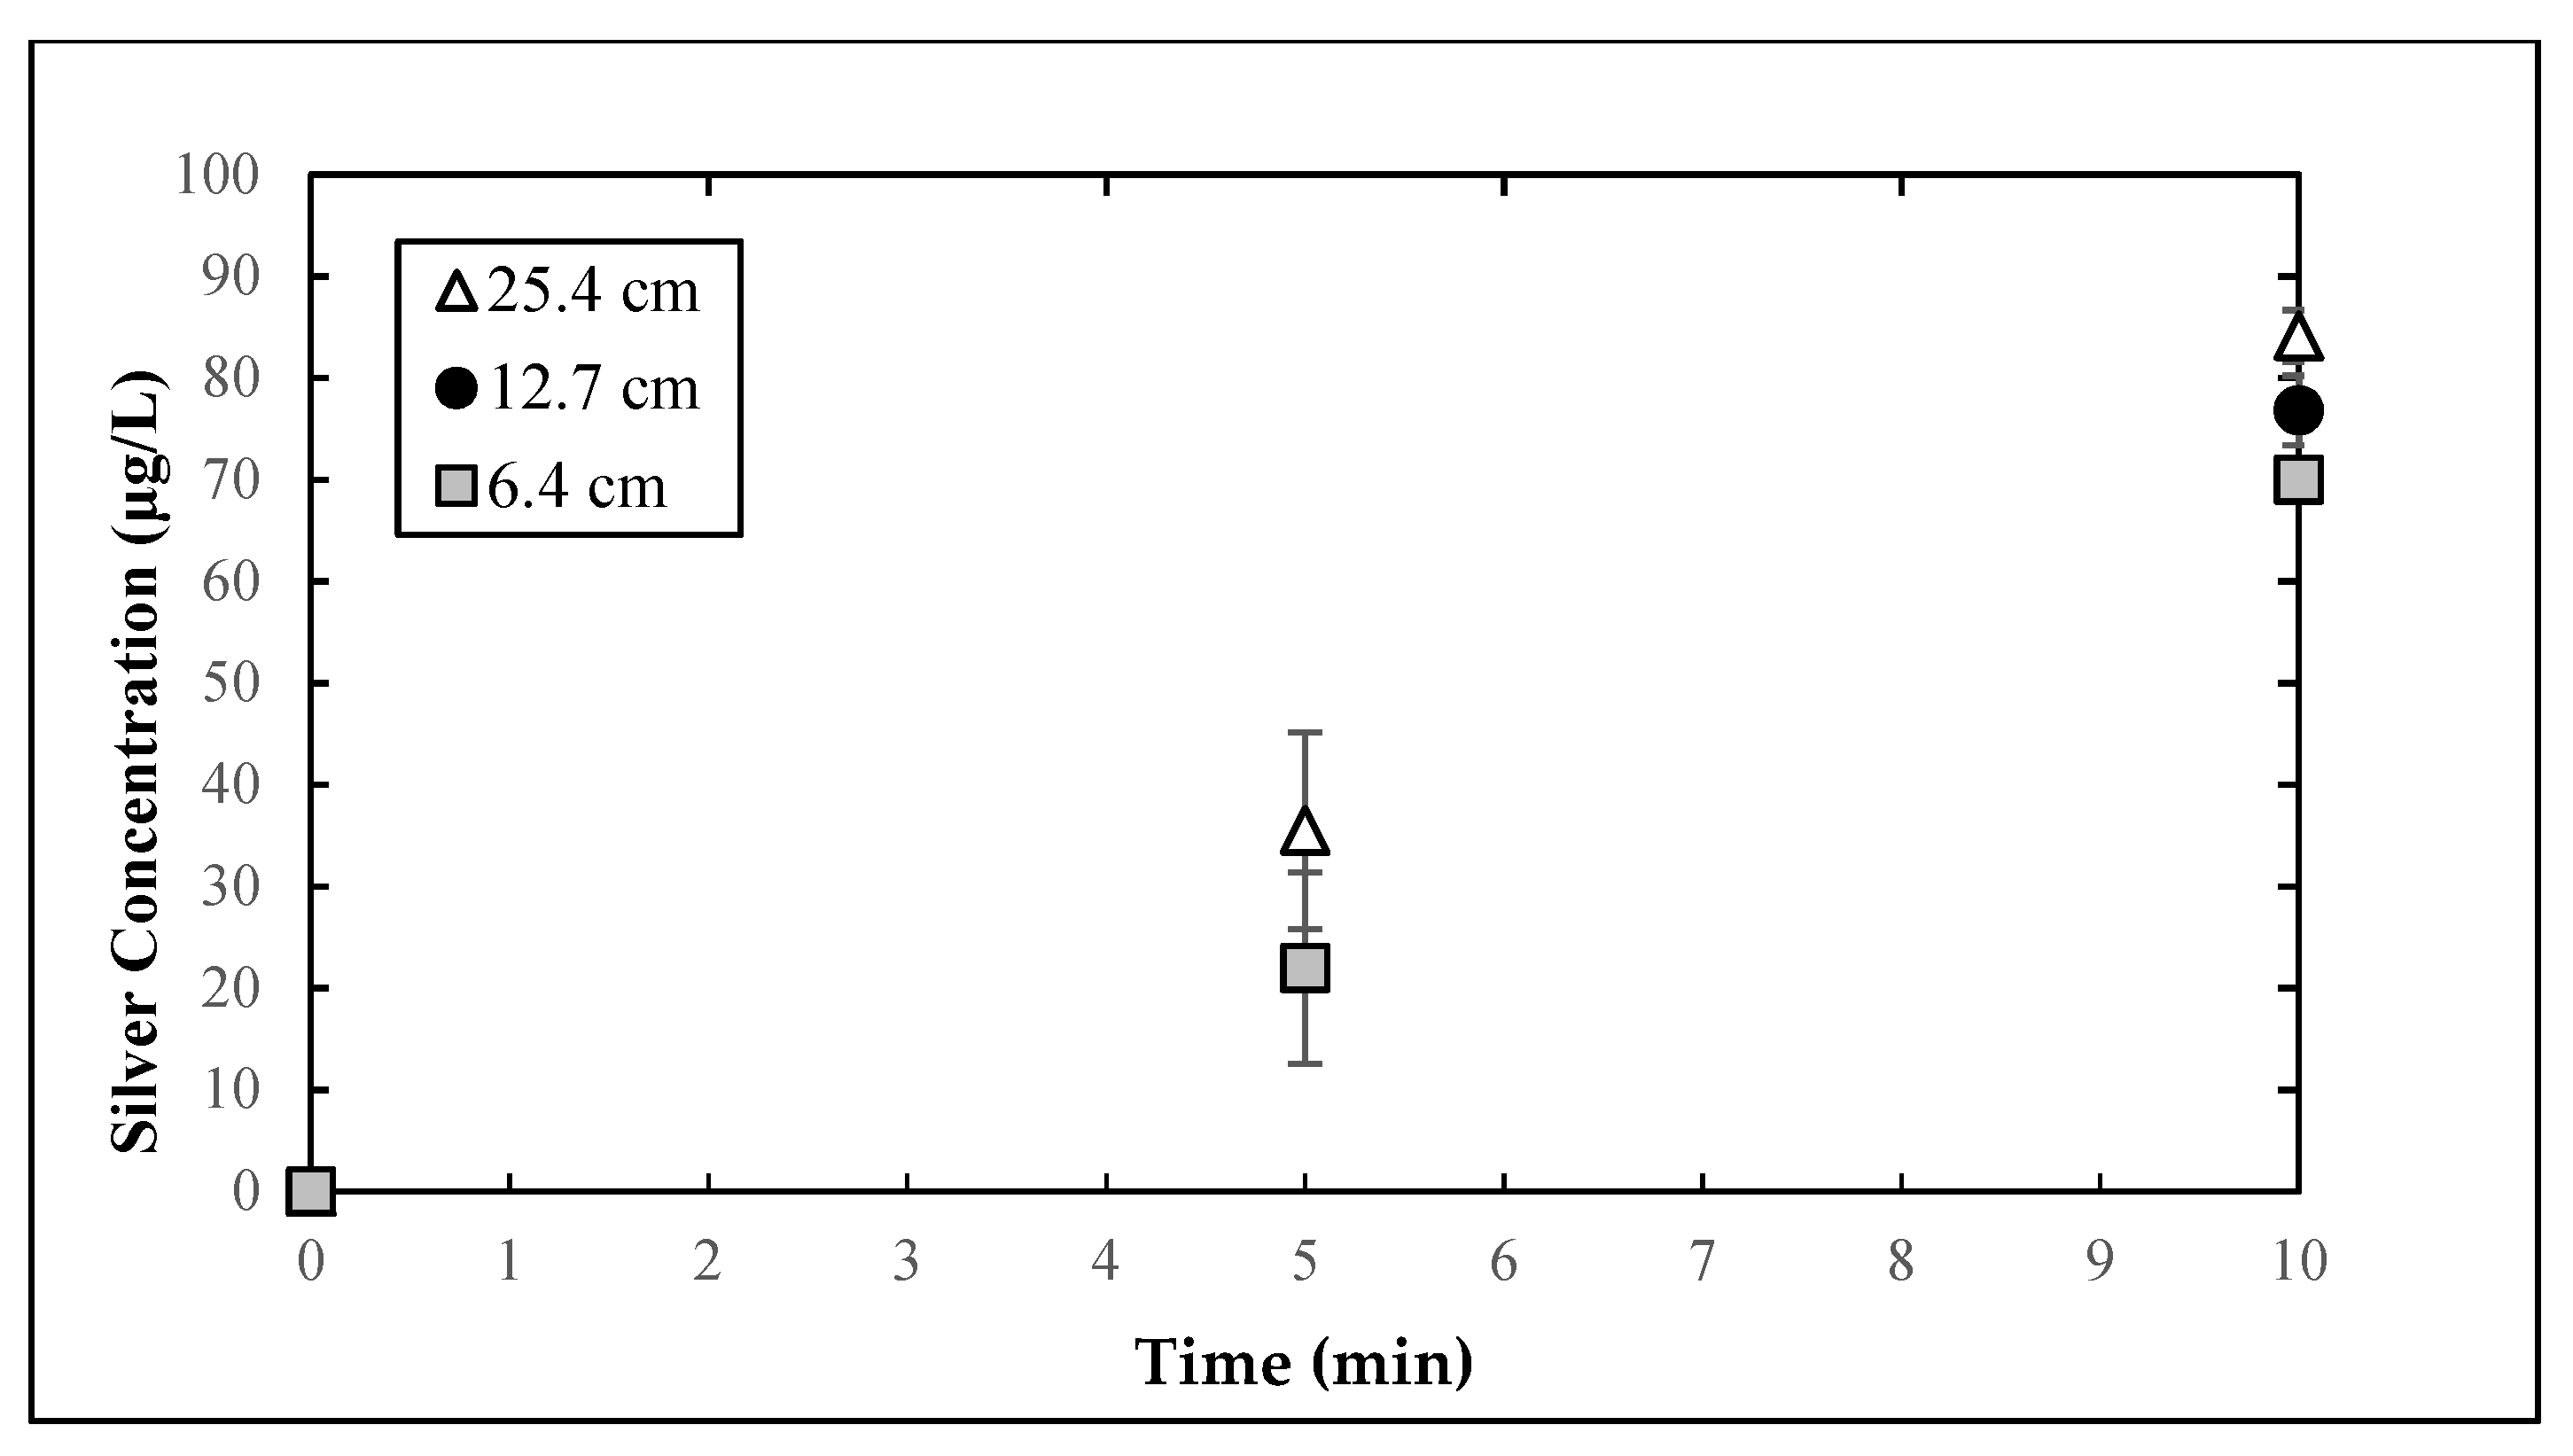
Finally, the relation of the distance between the electrodes and the release of metal ions was determined. Silver electrodes were separated 6.4, 12.7, and 25.4 in 10 L of SGW. Then, 4.5 V was applied to the configuration, and silver concentration was measured at 5 and 10 min. This process was completed three times for each distance setting. Both these tests and those examining the depth of submerged wire examined only silver, not copper. This is because results from other experiments indicated that copper should not be used as the sole disinfection mechanism but used to supplement silver in a potential device.
Each of these processes was tested through three trials and became the basis for the design of an electrolysis POUWT prototype. Due to the linear relationship between ion release and time in an electrolytic system, the rate of release at each setting for a single parameter (e.g., diameter) was divided by the rate of release for the most minimum setting tested (e.g., 0.25 mm). This determined the factor by which increasing a variable increased ion release rate.
2.2. Time to Desired Ion Concentrations
Experiments were performed both to understand the impact of applied voltage on metal ion release and establish the time required to release enough metal ions to provide adequate disinfection in a potential POUWT device. To create a configuration that resembled an electrolytic water treatment device in a volume of water required for treatment in a home, 2.5 cm of 1 mm-diameter wire was submerged in a 20-L plastic container filled with 10 L of synthetic groundwater. The wire was attached to a DC power source set at either 4.5 or 9 V and ran for 30 min; 4.5 and 9 V were chosen because these values correspond to three AAA batteries or one 9 volt battery, respectively. Water was sampled at 0, 1, 5, 10, 20, and 30 min and analyzed for silver and copper concentration. This process was conducted three times for each desired voltage for both copper and silver. The target concentration of ions determined for the prototype was 50 ug/L and 500 ug/L for silver and copper, respectively, as these values are half of the EPA secondary drinking water safety standards for these metals [
30]. Using the equation for the linear trendline for each voltage, the time required to release target concentrations of 50 µg/L and 500 µg/L silver and copper, respectively, were calculated.
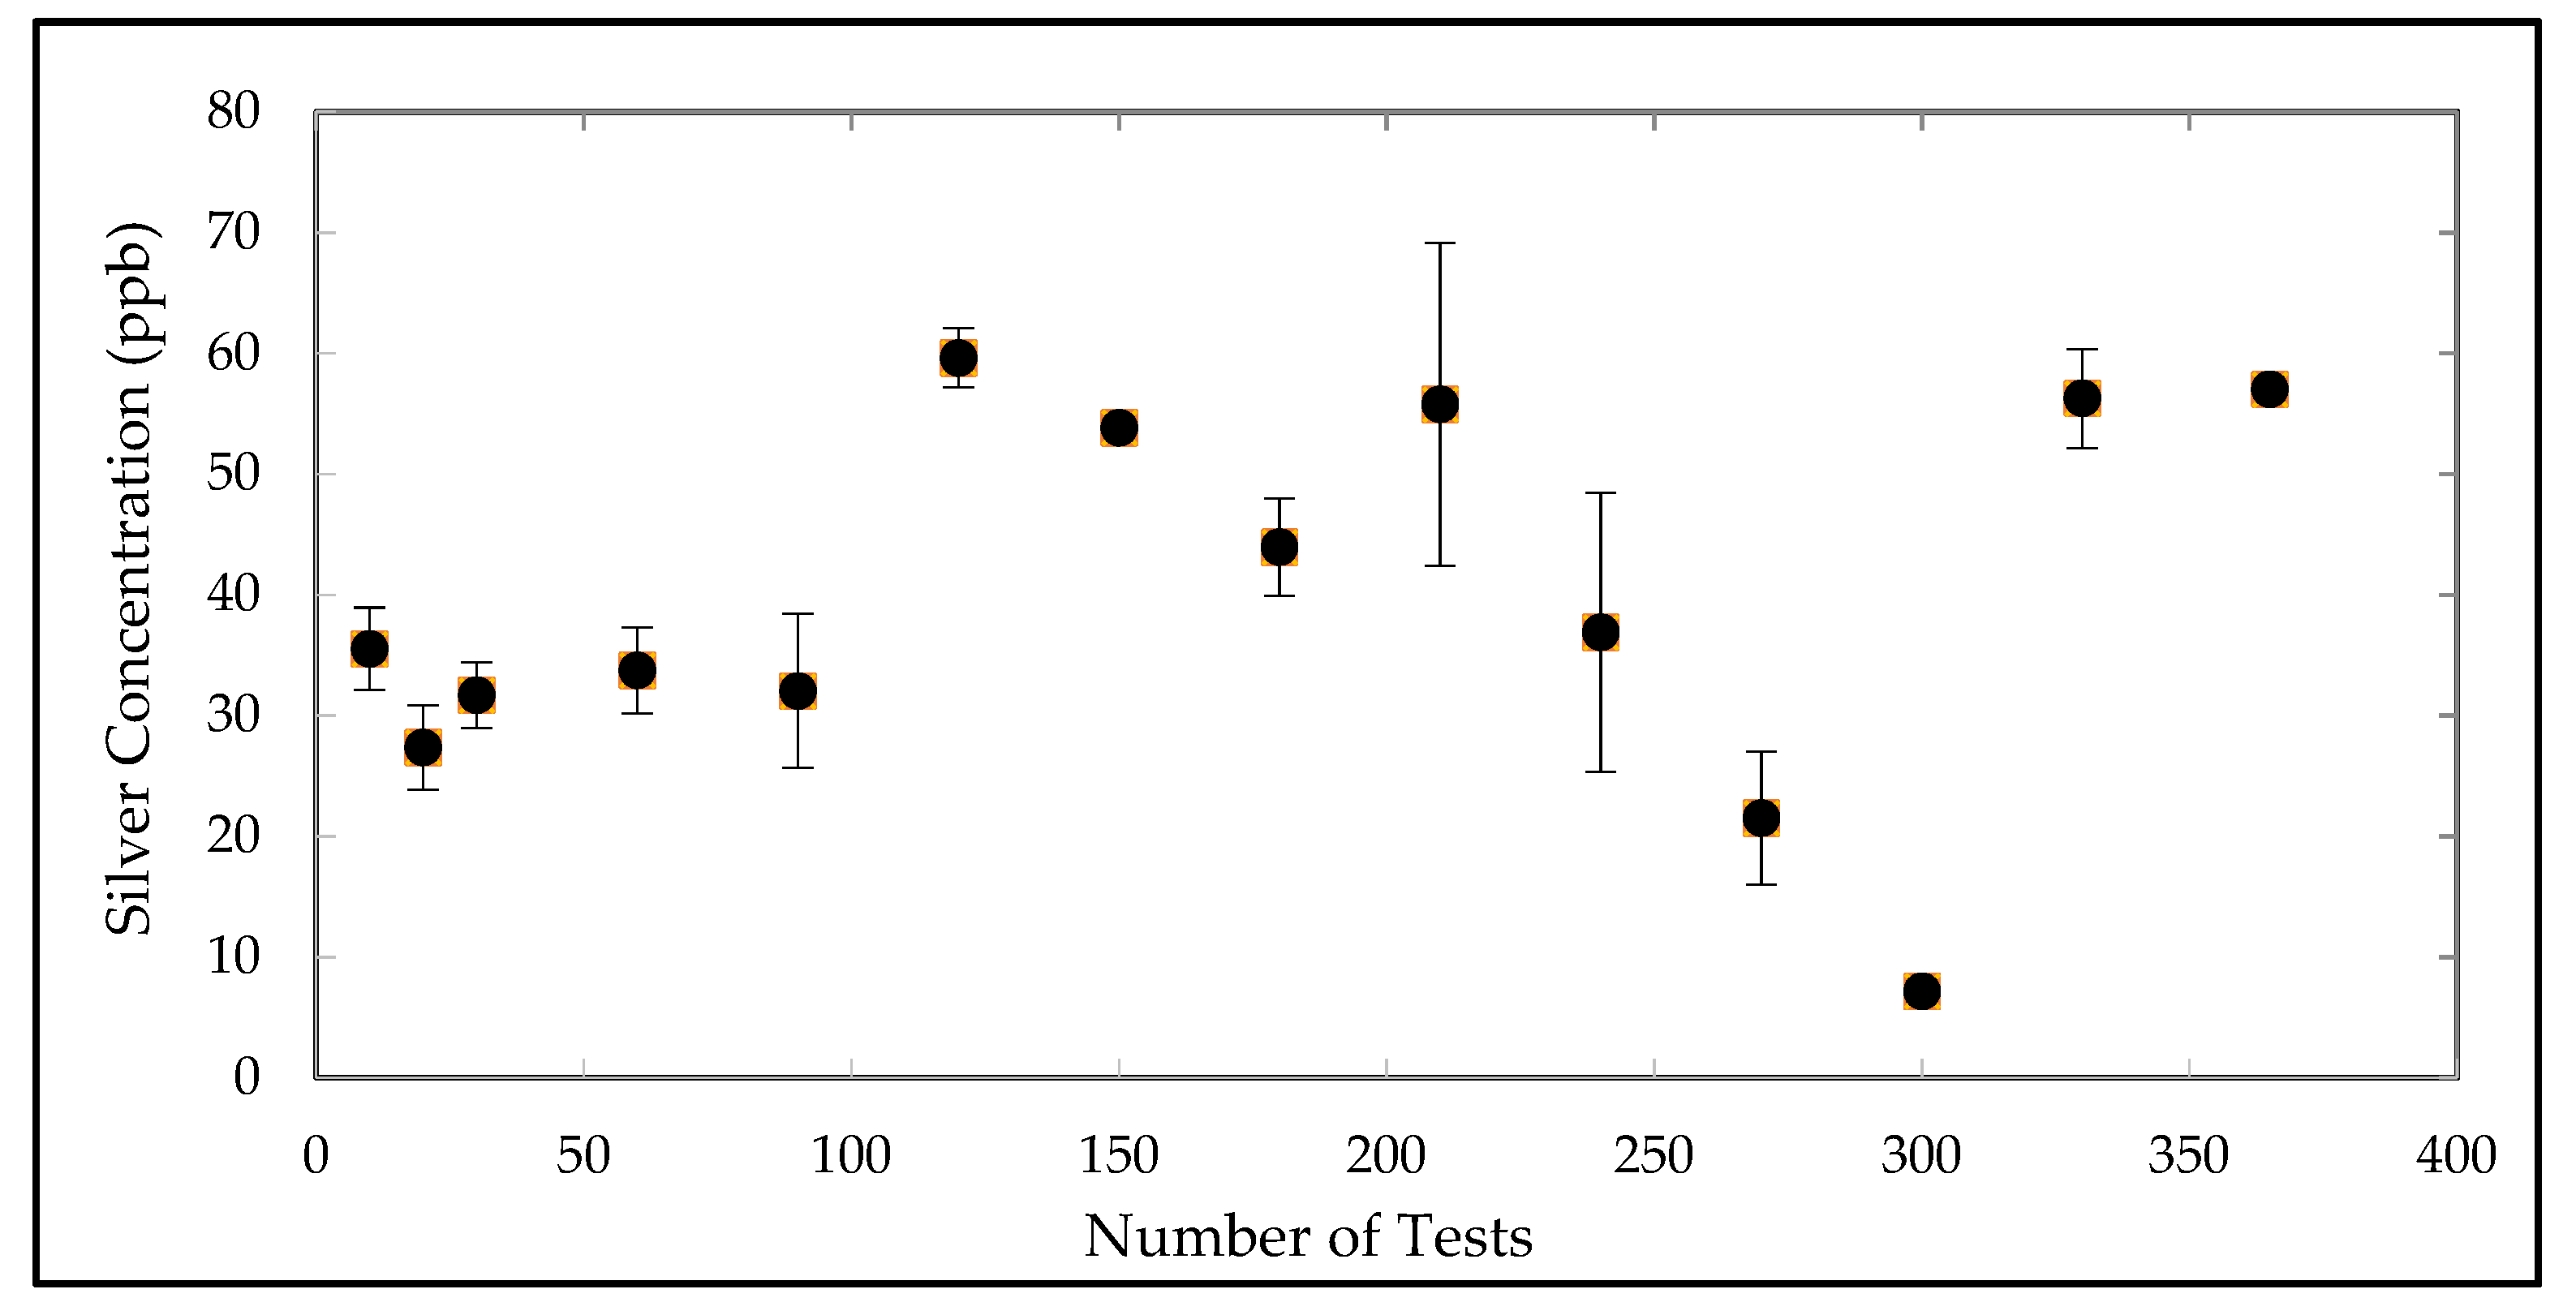
2.3. Longevity of Use
Using the configuration in
Figure 1, 9 V were applied via a DC current for 2 min to release a target 50 µg/L silver into 10 L synthetic groundwater. This procedure was repeated 365 times on a single anode/cathode set to simulate daily use for a year, with water being changed out before each sampled run. Four-milliliter samples were taken at runs 0, 10, 20, 30, and multiples of 30 and analyzed for silver concentration. The final sampling was taken at 365 runs instead of 360. This was tested in two trials. A longevity experiment was run only for silver, not copper, because results from other experiments rendered that copper should not be used as the sole disinfection mechanism but used to supplement silver in a potential device.
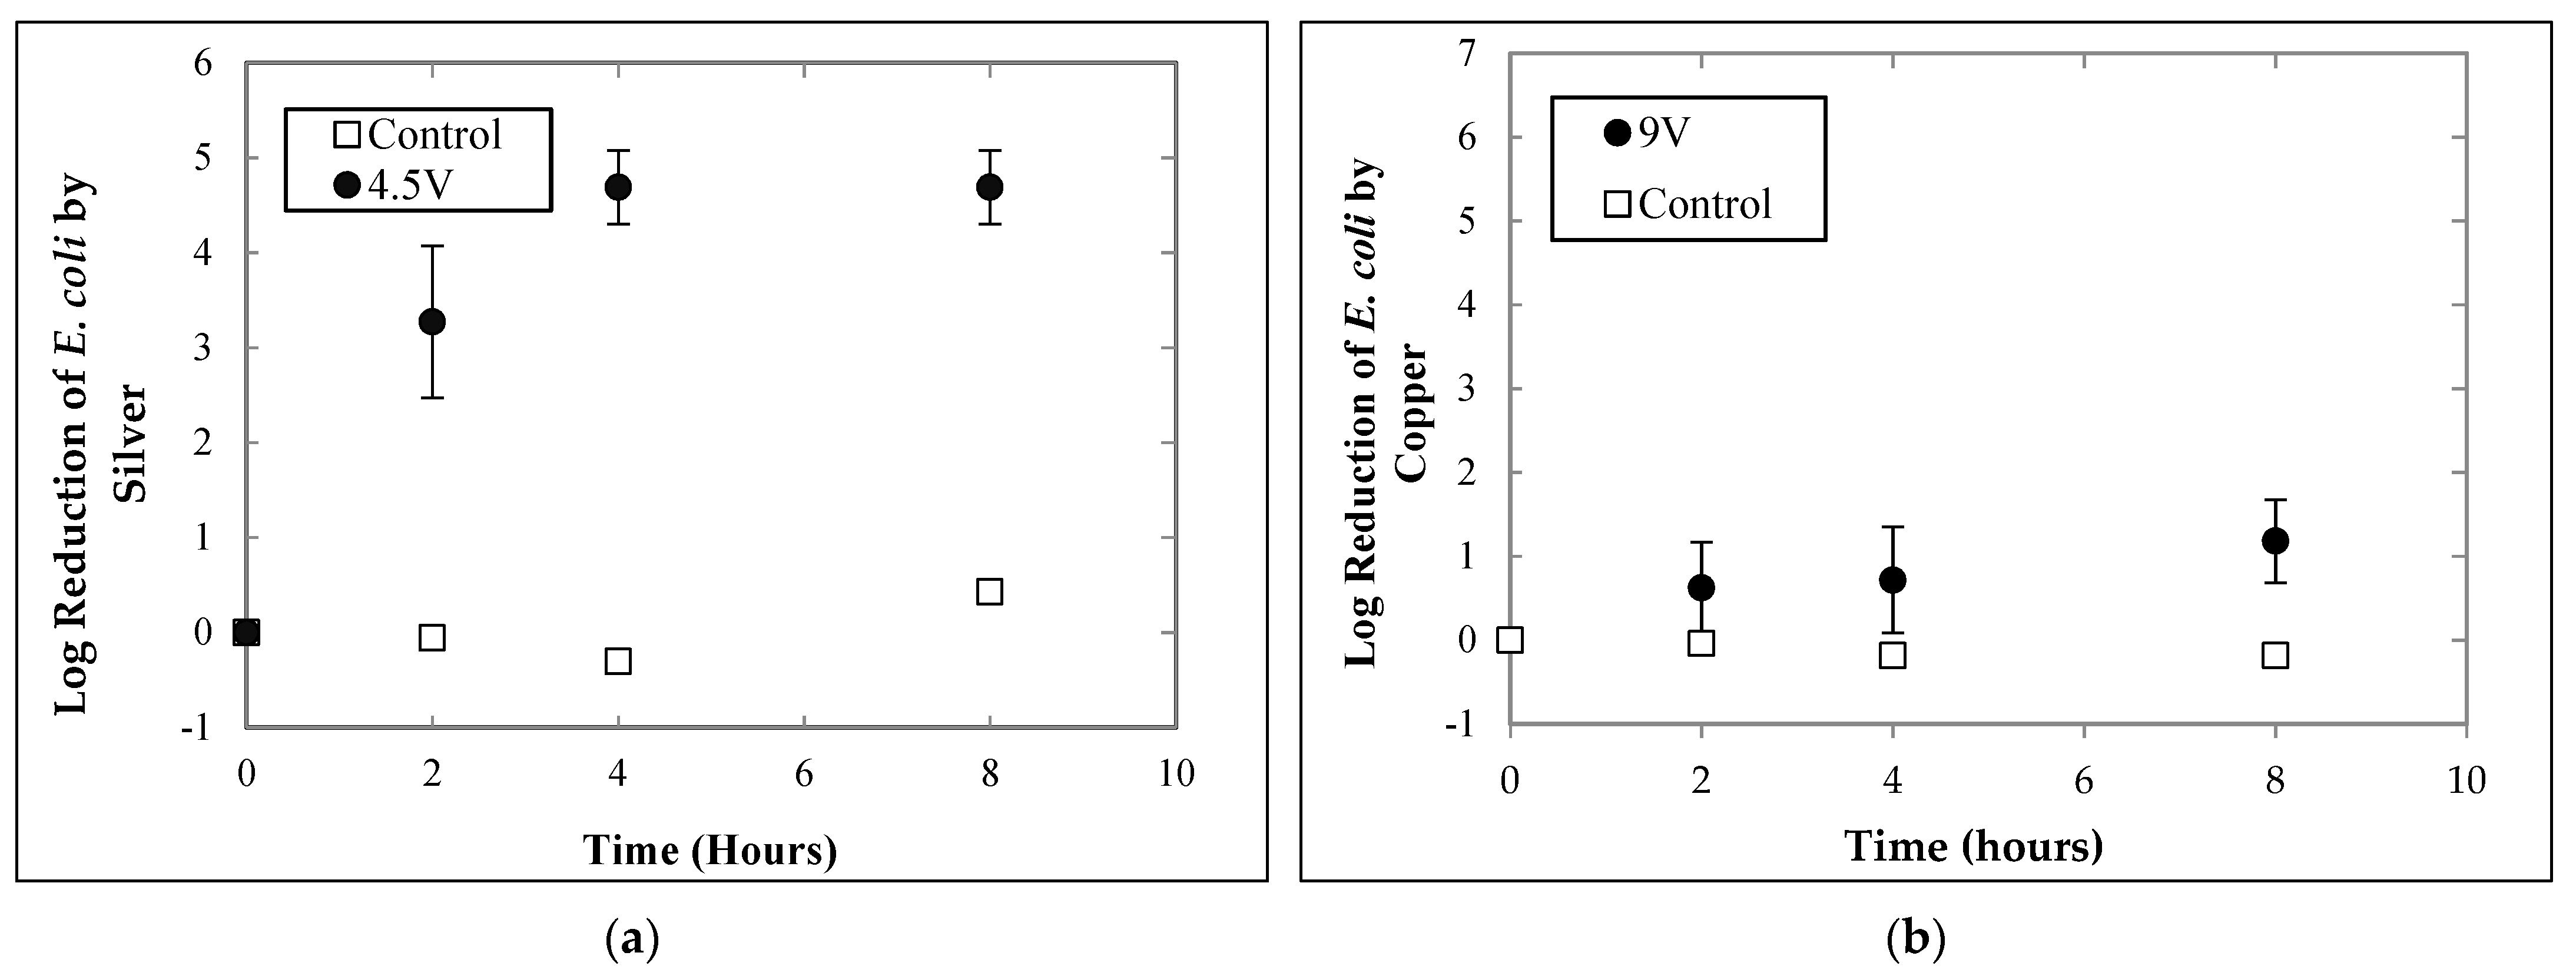
2.4. Disinfection Potential
The disinfection efficacy of a potential device was measured by the ability of the configuration to disinfect Escherichia coli (
E. coli C300, American Type Culture Collection. Predetermined by the time to desire concentration experiments, 4.5 V was applied via a DC current for 5 min to release approximately 50 µg/L of silver. Similarly, a 9 V applied via a DC current for 68 min was applied to achieve the release of approximately 500 µg/L copper.
E. coli bacteria was added to the 10 L of water, electrolysis was applied, and 100-mL water samples were taken at 0, 2, 4, and 8 h after ion release was finished. The
E. coli concentration of these samples was determined using the IDEXX Colilert Test Method for the Simultaneous Detection of Total Coliform and
E. coli in water [
31].
E. coli was cultured using the m-Endo broth from EMD Millipore, Billerica, MA, USA. The disinfection efficacy was measured by calculating the log reduction in
E. coli bacteria after exposure to either 4.5 V for 5 min with silver wire or 9 V for 68 min with copper wire for approximately 50 µg/L silver and 500 µg/L copper, respectively. Log reduction was calculated by subtracting the log of the
E. coli bacteria in the water at each time point from the log of the
E. coli bacteria at the beginning of the experiment. Disinfection efficacy was tested for two trials of each voltage and a control bucket with no added metal ions.
2.5. Production of Electrolytic POUWT Device
Electrolytic POUWT devices were developed based on the previously described proof of concept experiments and were manufactured in Charlottesville, Virginia. Given that diameter did not affect metal release, the biggest difference in wire thickness in the device is not the rate of metal release but the durability of the product in the home. Due to the relatively thin, fragile nature of the 0.25 mm and 0.5 mm silver wires, the 1 mm wire was selected for the final POUWT device design. Though the cost of a potential device increases as the thickness of the wire increases, the selection of a thicker, more durable wire enabled the device to be used for a greater period of time without replacement. While the proximity of electrodes impacts resistivity and could have affected the electrolysis rate, the range of proximity of these electrodes under consideration with respect to the ionic strength of the water and applied voltage were such that this was not the case.
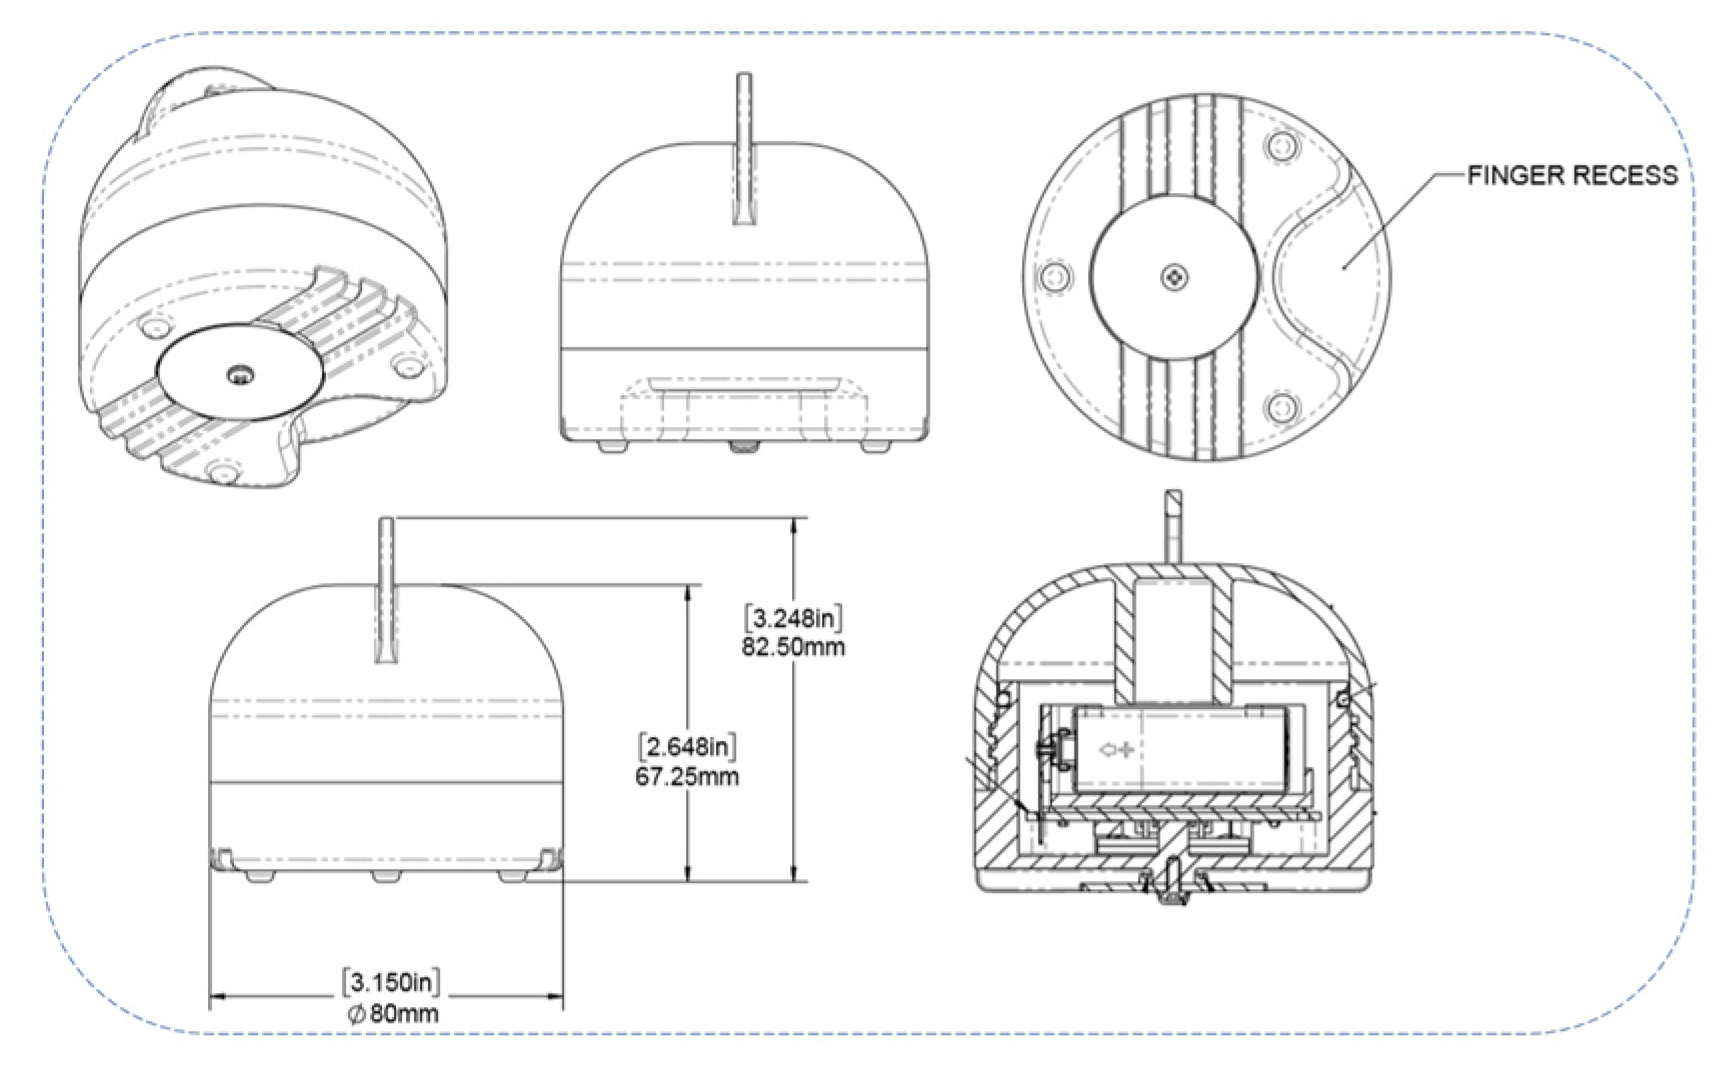
The final design initiates electrolysis on silver wires to release silver ions into 10–20 L of water. The silver anode and cathode wires were designed to be on the bottom of the enclosure where water makes contact with the device. A capacitive touch sensor is located in a recess on the bottom of the device where the user activates the prototype with their finger before placing the device into untreated water. The prototype, depicted in
Figure 2, was designed to float so that the handle on top of the device will not make contact with the water, allowing for the user to take the device out of the water without the risk of recontamination.
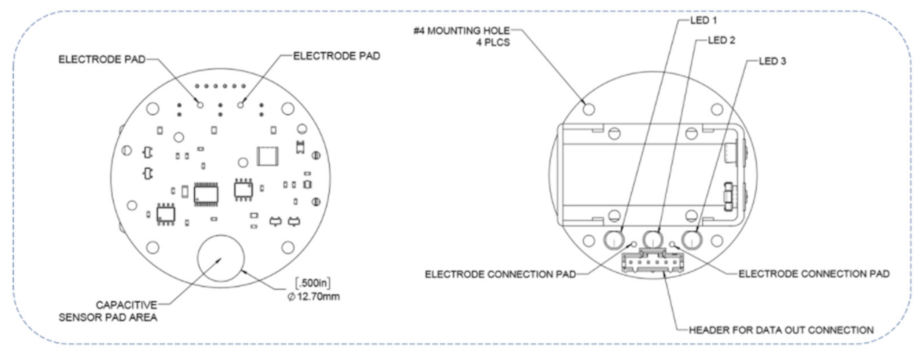
The device is powered by a single 9 V battery and is controlled using the MSP430G2553 low-power microcontroller (Texas Instruments, Dallas, TX, USA). Additionally, the device includes a 3.3 V regulator (Texas Instruments, Dallas, TX, USA), silver release control, comparator A+ and ADC control (Texas Instruments, Dallas, TX, USA), capacitive touch sensor control, SPI serial flash control (Texas Instruments, Dallas, TX, USA), JTAG and UART control (Texas Instruments, Dallas, TX, USA), and LED control (Texas Instruments, Dallas, TX, USA). To account for the broad range of ionic strengths in natural waters, the device operates at a constant charge. The set amount of charge allowed for a controlled release of ions, regardless of the untreated water’s ionic strength. Red, yellow, and green LED lights in the enclosure communicate to the user the different stages of the water treatment process. A solid yellow light signals that the device was activated by the capacitive touch sensor. Once solid yellow, the user places the device into the water container. The device then senses the introduction of water and begins to blink yellow every 8 s. The yellow LED blinks for the following four hours to let the user know that the device is functioning, but the water is not ready to be consumed. After four hours, the device blinks green every 8 s, indicating to the user that the water is safe to drink and that the device can be removed from the treated water. In the device, there is a software lock that limits silver release to once every twelve hours. This ensures that silver levels did not exceed 100 ug/L in 24 h. If the user tries to activate the device before the software lock is lifted, the device emits four red flashes. A schematic of the device’s circuitry is depicted in
Figure 3. In the laboratory, each prototype was tested in 10 L synthetic groundwater to ensure that the amount of silver released was below the WHO guideline but sufficient for disinfection before field deployment. To ensure this, a 4 mL water sample was taken from water treated by the device and analyzed for silver concentration using the GFAAS.
2.6. Participant Enrollment and Field Study Design
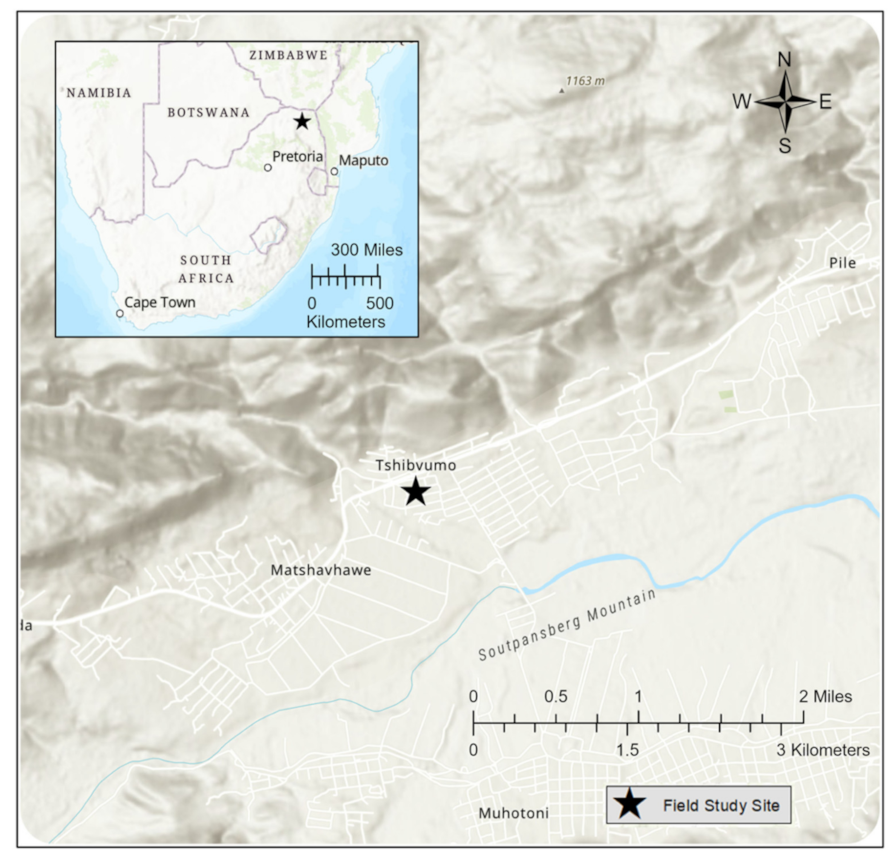
The protocol for this study was approved by the University of Virginia Institutional Review Board for Health Sciences Research (IRB-HSR #21809) and the University of Venda Research Ethics Committee (SES/19/HWR/02/0612). The study was conducted in the Dzimauli community in Limpopo, South Africa, in February 2020. The site (see
Figure 4 for location) was chosen because it was previously found that only 15% of households treat their drinking water in Dzimauli [
32]. Twenty randomly selected households were enrolled in the study. Community participants were eligible if the head of the household was at least 18 years of age and they did not have chlorinated water piped into the home. They were then asked to participate, and verbal consent was obtained. A baseline questionnaire was conducted to obtain demographics and drinking water information. Afterwards, the household received a 20 L safe-storage water container and an electrolytic water treatment device. With assistance from the translator, the participants were given a demonstration of how to use the device. Prior to treatment, participants were instructed to continue storing water the way they were prior to receiving the device. At the conclusion of the study, each household was given the device and an extra battery to continue treating their water. They were also instructed how to replace the battery in their water treatment device for continued use. The protocol for this study was approved by the University of Virginia Institutional Review Board for Health Sciences Research (IRB-HSR #21809) and the University of Venda Research Ethics Committee (SES/19/HWR/02/0612).
2.7. Field Sample Collection and Analysis
Water samples were collected twice a week for four consecutive weeks using Sterile Whirlpak sample bags. Two samples were taken during each visit: 500 mL of water collected from the spigot of the bucket treated with the device (effluent) and 500 mL of the untreated source water that the household used to refill their safe-storage water containers (influent). Samples were transported in coolers with ice from households to the laboratory at the University of Venda and analyzed within six hours of collection.
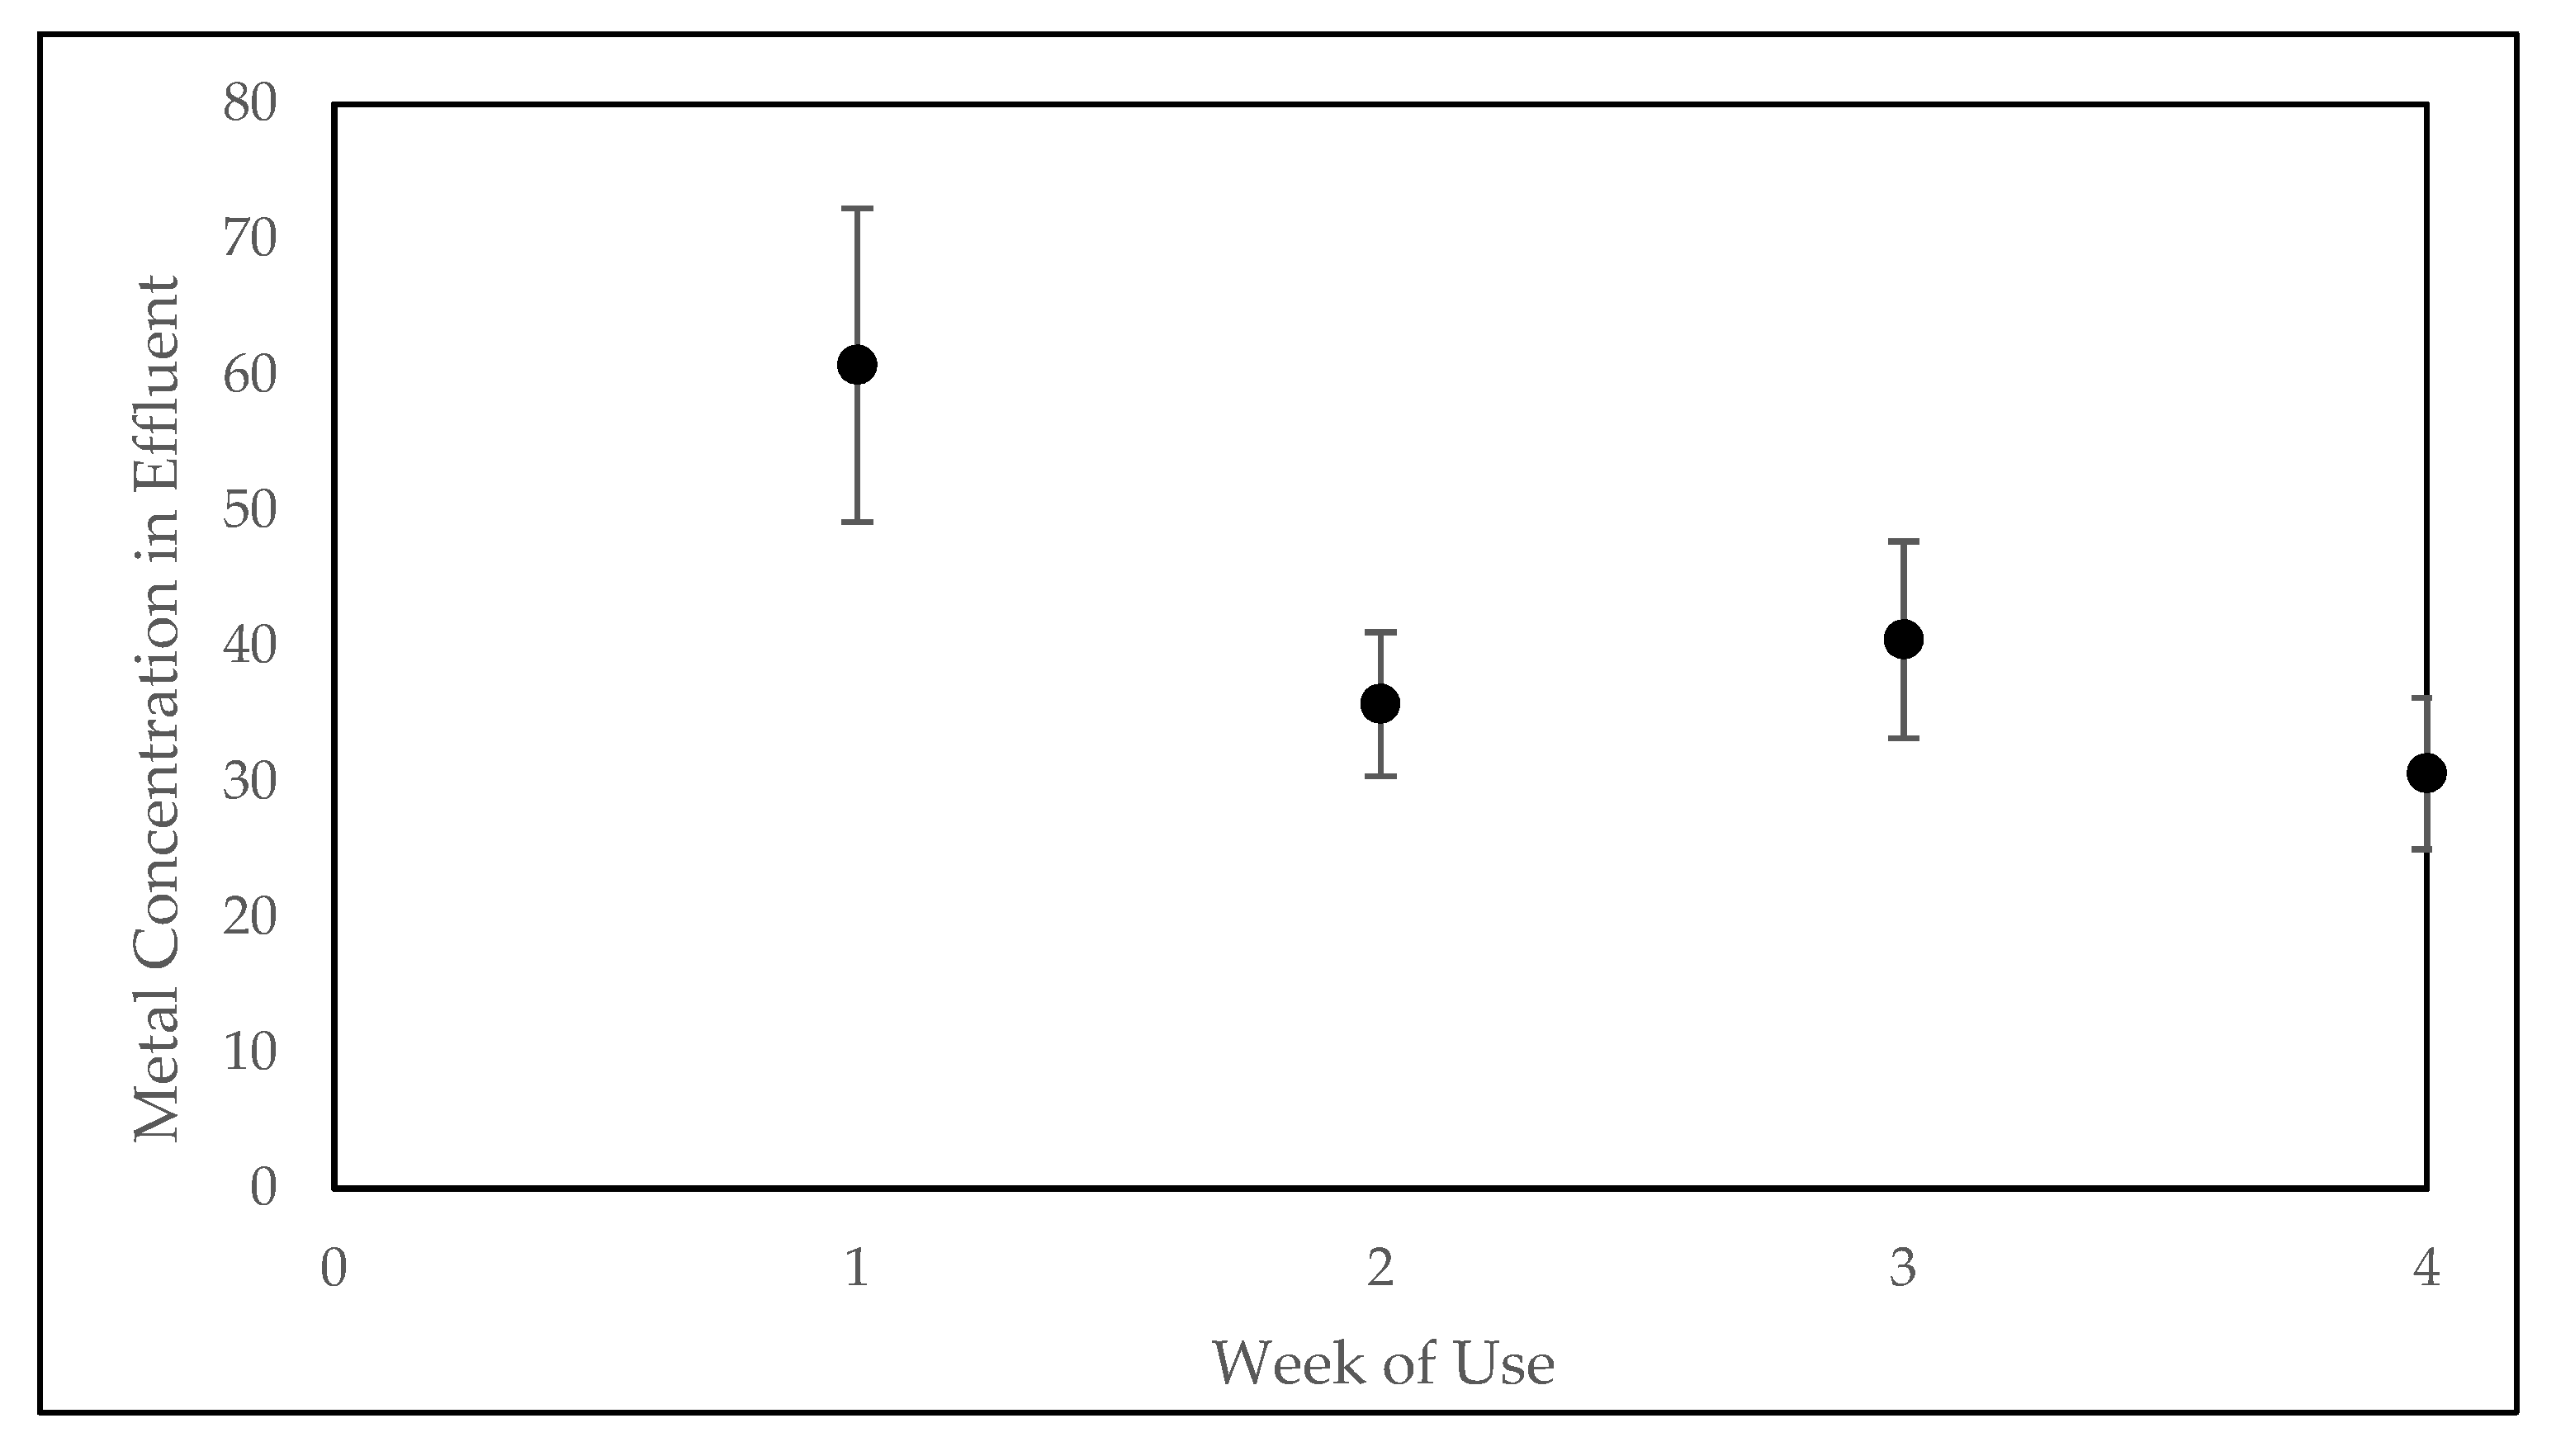
The total silver concentration in effluent water samples was measured weekly with the Hach RapidSilver™ Visual Test Kit. Total coliform and
E. coli concentration were quantified twice a week using membrane filtration for both influent and effluent water samples as previously described by Ehdaie et al. [
8]. A total of 100 mL of a sample or diluted sample was passed through a 0.45 Millipore filter and placed in a sterile Petri dish containing m-Coliblue24 growth media (Millipore) and incubated for 24 h at 37 °C. Bacteria counts for each dish quantified bacteria concentrations for the corresponding sample. A total of 100 mL of deionized water was passed through the membrane filtration system as a negative control for the first and last sample analyzed each day.
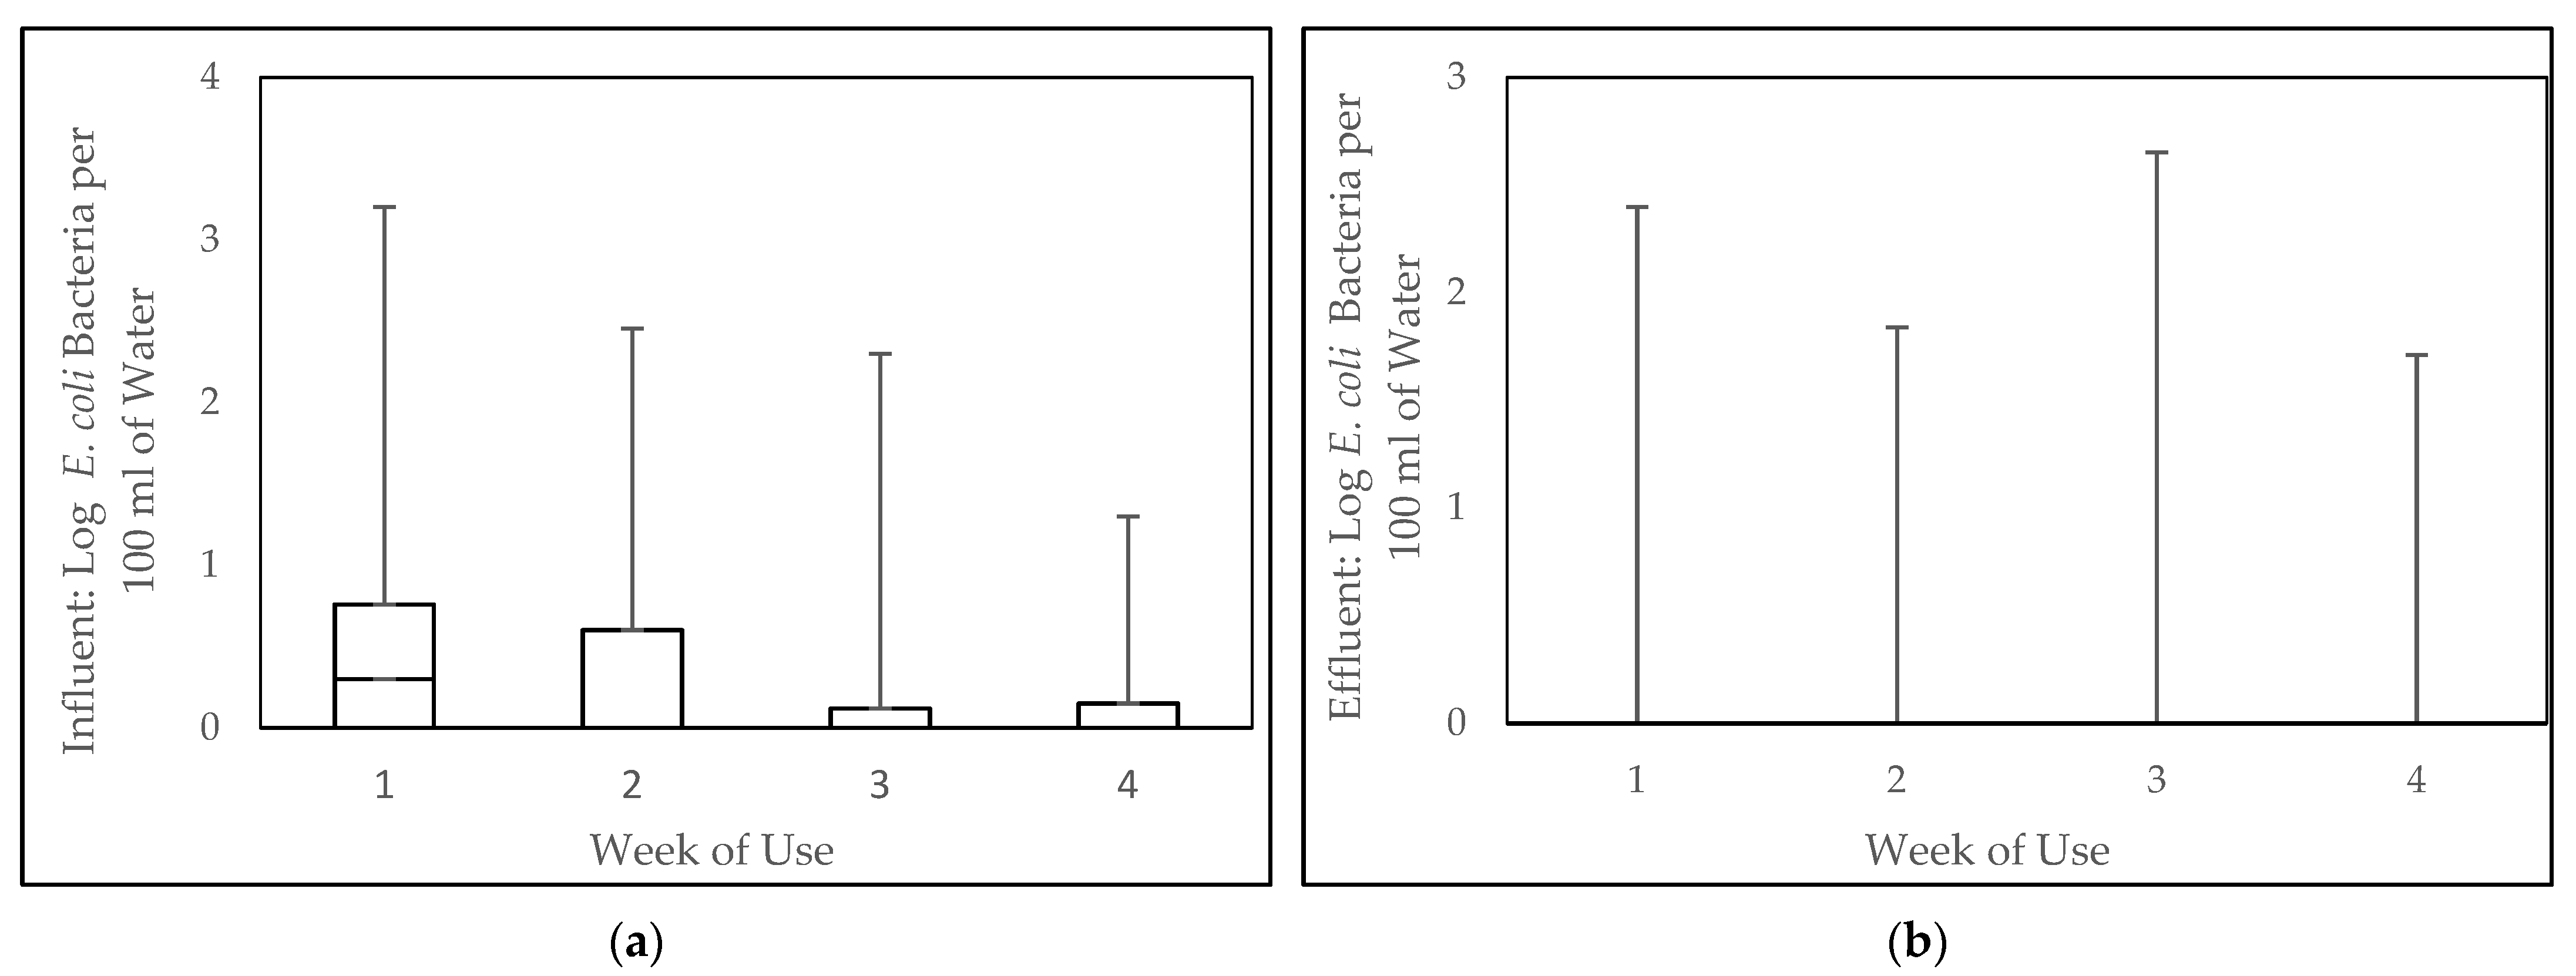
To quantify the disinfection efficacy of the device, the concentration of total coliform and E. coli bacteria from influent and effluent samples were used to calculate the log reduction at each household. To calculate this, the log of the total coliform bacteria or E. coli concentrations in the effluent was subtracted from those in the influent.
4. Discussion
This paper evaluates the viability of using silver and copper electrolysis in a POUWT device to deliver metal ions into stored water for disinfection. It was confirmed that silver ion concentrations sufficient for pathogenic disinfection could be electrolytically generated in 10 L using a voltage typically found in 3 AAA (4.5 V) batteries or one 9 V battery for a year. We found that 50 µg/L of silver, an amount sufficient for disinfection but half of the EPA secondary drinking water standard, was generated in 10 L of water with an ionic strength of 4.58 × 10
−3 M when 4.5 and 9 V were applied to the system for approximately 5 and 2 min, respectively. This is a significant improvement on current water treatment technologies that use silver ions, which require much longer release rates. For example, the time required for the MadiDrop to release the amount of silver required for disinfection is up to 8 h [
8]. Moreover, 50 µg/L of electrolytically generated silver ions also proved to provide more than a 5-log reduction in
E. coli in untreated water in a laboratory setting, performing similarly to the MadiDrop [
8]. Free chlorine (1 ppm) achieved a higher reduction (5- to 6-log) [
6], but there are numerous drawbacks to using free chlorine, including a change in water, taste, and odor, and dependency on temperature and pH values of the water [
25]. An electrolytic system with silver also proved to reliably produce ionic silver concentrations sufficient for disinfection for 12 months, demonstrating the system’s potential as a long-term POUWT.
Electrolytically generated silver significantly disinfected contaminated drinking water, while copper was not as effective. Generating 500 µg/L of copper, an amount sufficient for disinfection but half of the EPA secondary drinking water standard, required more than an hour of electrolysis even when applying 9 V, making copper a less suitable choice for the primary disinfectant in a POU water purification technology. Copper’s provision of less than a 2-log reduction in E. coli after 8 h of exposure further confirms it as a less suitable choice. After obtaining these results, it was decided to exclude copper from further prototype development. Instead, silver was chosen to be the sole disinfectant in the field portion of the study and evaluated for the distance between electrodes and longevity of use. Due to silver’s relatively high ion release rate in comparison to technologies that use silver for water treatment, silver electrolysis alone could be sufficient in a POUWT device.
The device was tested in households in a low-resource setting to evaluate the disinfection potential of the device with natural variations in water chemistry that could not be captured in the laboratory. The results from the field study suggest that electrolysis is a promising disinfection mechanism for a POUWT device and that improvements should be made to make the device easier to use. During proof-of-concept experiments, 50 µg/L of electrolytically generated silver ions showed more than a 5-log reduction in
E. coli bacteria in a laboratory setting. This corresponds to the World Health Organization’s top performance classification for bacteria removal, “comprehensive protection” [
34]. However, when examining field results, the prototype achieved less than a 2-log reduction. This is comparable to the field performance of other POUWT technologies: silver-impregnated ceramic water filters (1.8-log reduction total coliform) [
35], boiling water (1.82-log
E. coli reduction) [
36], biosand filters (2-log reduction
E. coli) [
37], and a low dose (2 mg/L) of Procter and Gamble’s water purification sachet (1.9-log reduction total coliform) [
38]. A high dose (3.5 mg/L) of the Procter and Gamble sachet and the MadiDrop performed better than the electrolysis prototype, achieving 3- and 3.2-log reduction in total coliform bacteria, respectively [
35,
38]. Silver impregnated filter paper achieved a 4.2-log reduction in total coliform bacteria in a laboratory setting, lower than that achieved by electrolysis in the laboratory [
20]. The performance of a water treatment device in the lab is typically better than that in the field due to the variability of human use of the device.
While the ≥2-log reduction in total coliform bacteria is less than the 5-log reduction observed in laboratory experiments, given the unpredictability of field use and various human factors, these results are promising for the first prototype, particularly if the design is optimized for the user. The ≥2-log reduction achieved by the intervention is particularly impressive because the initial concentration contamination levels were lower than what would allow for a 5-log reduction in bacteria. In fact, most untreated water samples would only allow for the detection of a 3-log reduction in coliform bacteria even if no coliform was detected in the effluent. This is reflected in
Figure 13 as the median log total coliform bacteria was greater than 3 in the influent and less than 1 in the effluent. Future work is required to evaluate the effect of other water quality parameters, such as pH, turbidity, or contaminants, on disinfection from this POUWT device, but it is beyond the scope of this work.
During the laboratory evaluation and during the field study, the prototype consistently released target silver levels that were below the World Health Organization guideline. This showed the device was able to produce enough silver sufficient for disinfection but still safe to drink. The silver concentrations detected in effluent from the electrolysis device during weeks 2–4 were comparable to mean silver levels detected in households with MadiDrops and silver-impregnated ceramic filters [
35]. Additionally, the costs of the MadiDrop and the electrolytic device are comparable. The MadiDrop costs between USD 0.0008–0.002 per liter of water treated. The electrolytic device can cost between USD 0.003–0.03 per liter of water treated, depending on the scale of production. Although the MadiDrop costs less, the quick release of silver provided through electrolysis may be an advantage over the MadiDrop and filter.
In a future version of this prototype, it may be possible to incorporate copper so that the device releases both silver and copper ions into untreated water for disinfection. There is evidence that combining silver and copper results in synergistic disinfection of bacteria and viruses [
39,
40]. Synergism between the two metals would shorten the contact time required to achieve the same removal of microbial pathogens from silver alone. This could increase the disinfection potential as the device could release up to 100 µg/L silver and 1000 µg/L copper while still staying within WHO guidelines [
22]. Using the maximum concentrations of silver and copper can have a stronger combined purification power than either ion at the EPA-set secondary drinking water standard alone, as it allows greater numbers of metal ions in the water without exceeding each individual ionic concentration limit [
22].
After observing user patterns in the study, several design aspects of the prototype were identified that could be changed to improve ease of use. Improving the ease of use of the device may improve device frequency of use and improve disinfection performance. During this study, the prototype floated inside of the safe-storage water container on top of the untreated water and was removed after it flashed green, indicating that the water was clean to drink. While there was a handle at the top of the device to mitigate contamination from users’ hands, the user still needed to open the safe storage container and reach inside to remove the device after treatment. In addition, while the safe storage containers were translucent, the green light on the prototype might have been difficult to distinguish, causing users to uncover the bucket intermittently during treatment to check the status of the device. A more user-friendly prototype for this technology could incorporate an electrolysis device that is fixed on the outside of the safe-storage water container. This way, the LED light indicating the state of the water would be easily visible and fixing the device to the outside of the safe water storage container would minimize possible contamination as well as increase ease of use. It was also observed that users had difficulty changing the battery inside of the device, and the capacitive touch button was not intuitive as there was no physical button for the user to press on the finger recess. Because of this, improvements could be made to the battery holder to make replacement easier and to add a physical button for the user to make it clear that they’ve activated the device. All the described improvements will improve the experience for the user, which enhances the correct use of the device, increasing its disinfection efficacy.
The use of electrolysis in a POUWT device is promising technology. The disinfection of total coliform bacteria coupled with silver levels that are sufficient for disinfection by below the WHO guidelines suggest that such a technology could be incorporated into a low-resource setting. With the proposed adjustments to the prototype design and the addition of copper, an electrolytic POUWT device has the potential to provide clean water to households in low-resource settings.


 ,
, 


