
Human-Dominated Land Use Change in a Phosphate Mining Area and Its Impact on the Water Environment


Beijing Key Laboratory of Resource Environment and Geographic Information System, Capital Normal University, Beijing 100048, China
*
Author to whom correspondence should be addressed.
Water 2022, 14(7), 1074; https://doi.org/10.3390/w14071074
Submission received: 22 February 2022
/
Revised: 21 March 2022
/
Accepted: 25 March 2022
/
Published: 29 March 2022
(This article belongs to the Special Issue Management and Monitoring of Water and Soils Associated with Mining Activities)
Abstract
:The Peace River is a critical water source in southwest Florida, United States. The watershed contains many phosphate mines that decrease water safety. Whether phosphate mining leads to a reduction in surface runoff and affects water quality in the Peace River Basin has been a highly controversial subject. Thus, the environmental impacts of phosphate mining in the Peace River were assessed. The Soil and Water Assessment Tool (SWAT) model is a widely used physical-mechanism-based distributed hydrological model that uses spatial distribution data, such as topography, soil, land use, and weather, to predict water, sediment, nutrient, pesticide, and fecal bacteria production. Based on a SWAT model, runoff, total nitrogen (TN) load, and total phosphorus (TP) load at the outlet of the Peace River Basin from 2001 to 2018 were investigated. The applicability of the four uncertainty methods in the hydrological simulation of the basin was assessed. The runoff at five stations in a specified mining area was simulated to analyze the impact of human-dominated land use changes caused by phosphate mining on the water environment. The results for the pre- and post-mining periods showed that the land use transfer in the study area experienced large fluctuations and that the land use change had a significant impact on the runoff (the outlet site decreased by 44.14%), indicating that phosphate mining has a significant effect on reducing runoff in the basin. An analysis of three scenarios (pre-mining [s1], post-mining [s2], and reclamation [s3]) showed that during s1–s2–s3, the change in mining land area is large (increased by 142.86%) and that TN and TP loads increased, indicating that human activities mainly affect the water environment through phosphate mining. This is mainly because a large amount of wastewater containing high concentrations of inorganic chemicals, which is produced in the process of phosphate mining and processing, overflows directly or from the sedimentation tank into the river. In summary, the simulation results showed that the changes in runoff and pollutants were attributed to phosphate rock mining. Therefore, strengthening the management of phosphate mining and adopting effective protection measures is of substantial significance for the effective protection of water resources. By analyzing the measured data, this study can help people understand more actual situations and further evaluate the impact of phosphate mining activities on the water environment. The simulation results can also be used to predict the future trend of runoff and water quality in the Peace River Basin and provide a decision-making basis for government management departments to issue water resource protection measures.
1. Introduction
With the development of modern industry and science and technology, human demand and exploitation of phosphate mineral resources have increased, leading to progressively more serious pollution and damage to the environment [1,2]. These include the hazards of general mining, such as the wasting of land and destruction of vegetation caused by collapses, landslides, the cracking of geological bodies, and the random piling of slag [3,4]. Damage to the ecological environment and pollution affect not only the sustainable development of the economy and society but also individuals’ health, which has become a prominent human issue. Nonpoint source pollution from phosphate mining areas is a potential risk to ecosystems in many parts of the world [5,6,7]. The environmental problems of phosphate mining affecting the river basin environment have attracted attention worldwide [8,9]. Many scholars have conducted in-depth research on this subject, and their topics can be broadly categorized into TP pollution, heavy metal pollution, and radioactive pollution [3,8,9].
Phosphate mining in Florida began in the late 19th century [10]. There are 27 phosphate mines in Florida, covering more than 1821 km2. Phosphate mining disturbs between 12 to 24 km2 annually in Florida. Approximately 25–30% of these lands are wetlands or other surface waters [11]. There has been a longstanding debate among residents and government officials in Florida on the impact of phosphate mining on runoff [9,10,12,13,14]. Furthermore, the flow of the Peace River was less in 1970–1999 than in 1940–1969. The Peace River is the source of drinking water for four coastal counties in southwest Florida, and the debate has intensified with the increasing dependence of the downstream water on surface water flow [15,16,17]. In addition, the use of the Peace River to treat phosphate and other waste has generated local and statewide attention because of the resulting river water pollution. Recently, this concern has expanded to its potential impact on the groundwater supply. If contaminants enter the ground and mix with freshwater, the problem will become much worse. In recent years, increases in mining activities and the number of chemical plants have increased the amount of waste discharged into rivers.
In 2004, a survey of the Southwest Florida Water Management District (SWFWMD) indicated that the decrease or increase in the Peace River flow relative to larger flows could be attributed to substantial differences in rainfall and that the impact of phosphate mining on runoff could not be confirmed [18]. However, over the past 70 years, several serious man-made accidents (some in the last few years) attributed to Florida’s phosphate industry caused highly adverse environmental impacts on Florida’s original “one class” of ecological areas. Along the upper Peace River, a progressive long-term decline in streamflow has occurred since 1931 due to a lowering of the potentiometric surface of the Upper Floridan aquifer by as much as 18.3 m because of intensive ground-water withdrawals for phosphate mining and agriculture [19]. A decrease was observed in the flow of the Peace River from 1965–1984 due to factors other than rainfall, for example, phosphate mining in Florida [20].
Although there have been some studies on runoff from phosphate mining areas [8,9,14,21,22], they have mainly used biochemical or mathematical analysis methods to study runoff or water quality, while using hydrological models to study the land use changes caused by human activities (phosphate mining) and the impact on the environment is still relatively rare. Mineral exploitation activities lead to changes in the type of land use in the mining area, affecting the degree of pollution of the surface water environment [14,23,24,25,26,27]. Among the many hydrological models, the Soil and Water Assessment Tool (SWAT) is a widely used and distributed hydrological model based on physical mechanisms [28,29,30] that has unique advantages in simulating runoff and water quality. This study simulated the runoff and total nitrogen and total phosphorus loads of the Peace River from 2001 to 2018, which can effectively evaluate and predict the impact of multi-year phosphate mining activities on the water environment to provide a direct reference for better protection of the water environment.
The purpose of this study was to investigate whether phosphate mining has harmed the river environment that contributes to the Peace River. In this study, (1) the SWAT hydrological model was used to simulate the runoff and TN and TP loads at the outlet of the Peace River Basin from 2001 to 2018; (2) the applicability of four uncertainty methods in the hydrological simulation of the basin was assessed; (3) the runoff at five stations in the specified mining area was simulated to analyze the impacts of the land use change caused by phosphate mining on the water environment; and (4) three scenario analyses (pre-mining [s1], post-mining [s2], and reclamation [s3]) were conducted to assess the effect of phosphate mining on water quality. The research results provide evidence on whether phosphate mining reduces surface water flow and affects water quality and provide a basis for the management of phosphate mining activities and the planning of reclamation projects.
2. Materials and Methods
2.1. Study Area
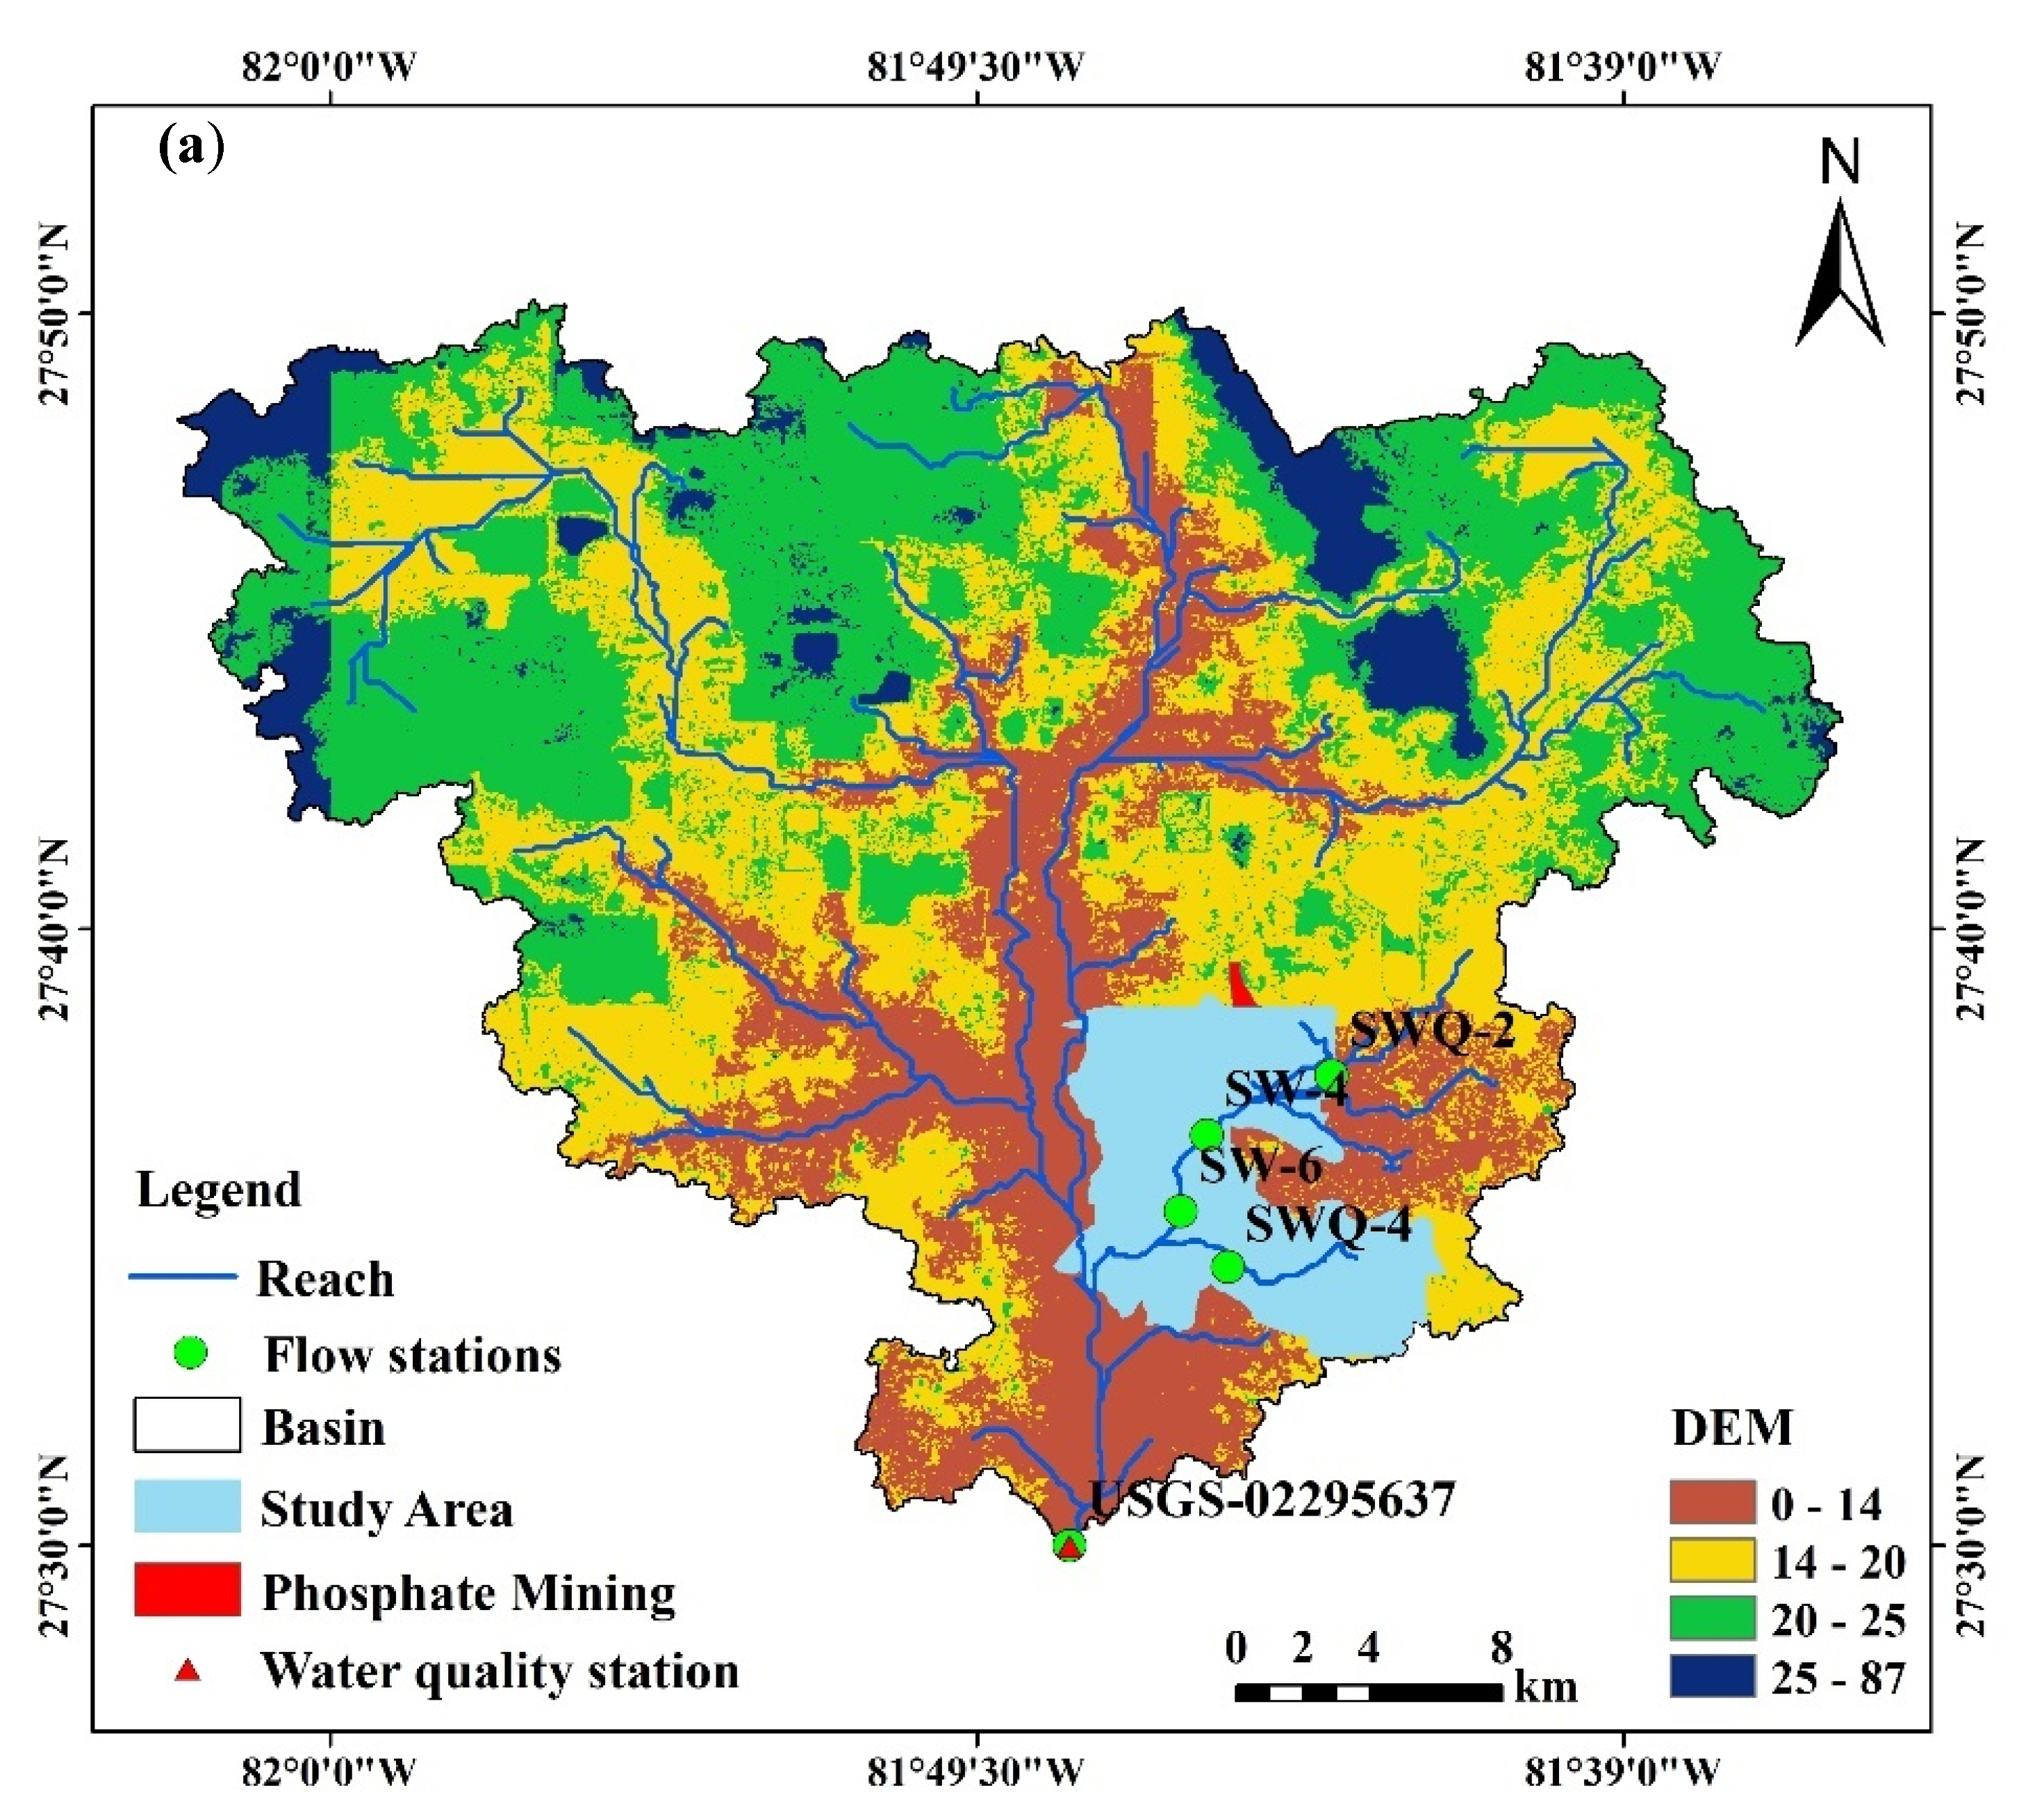
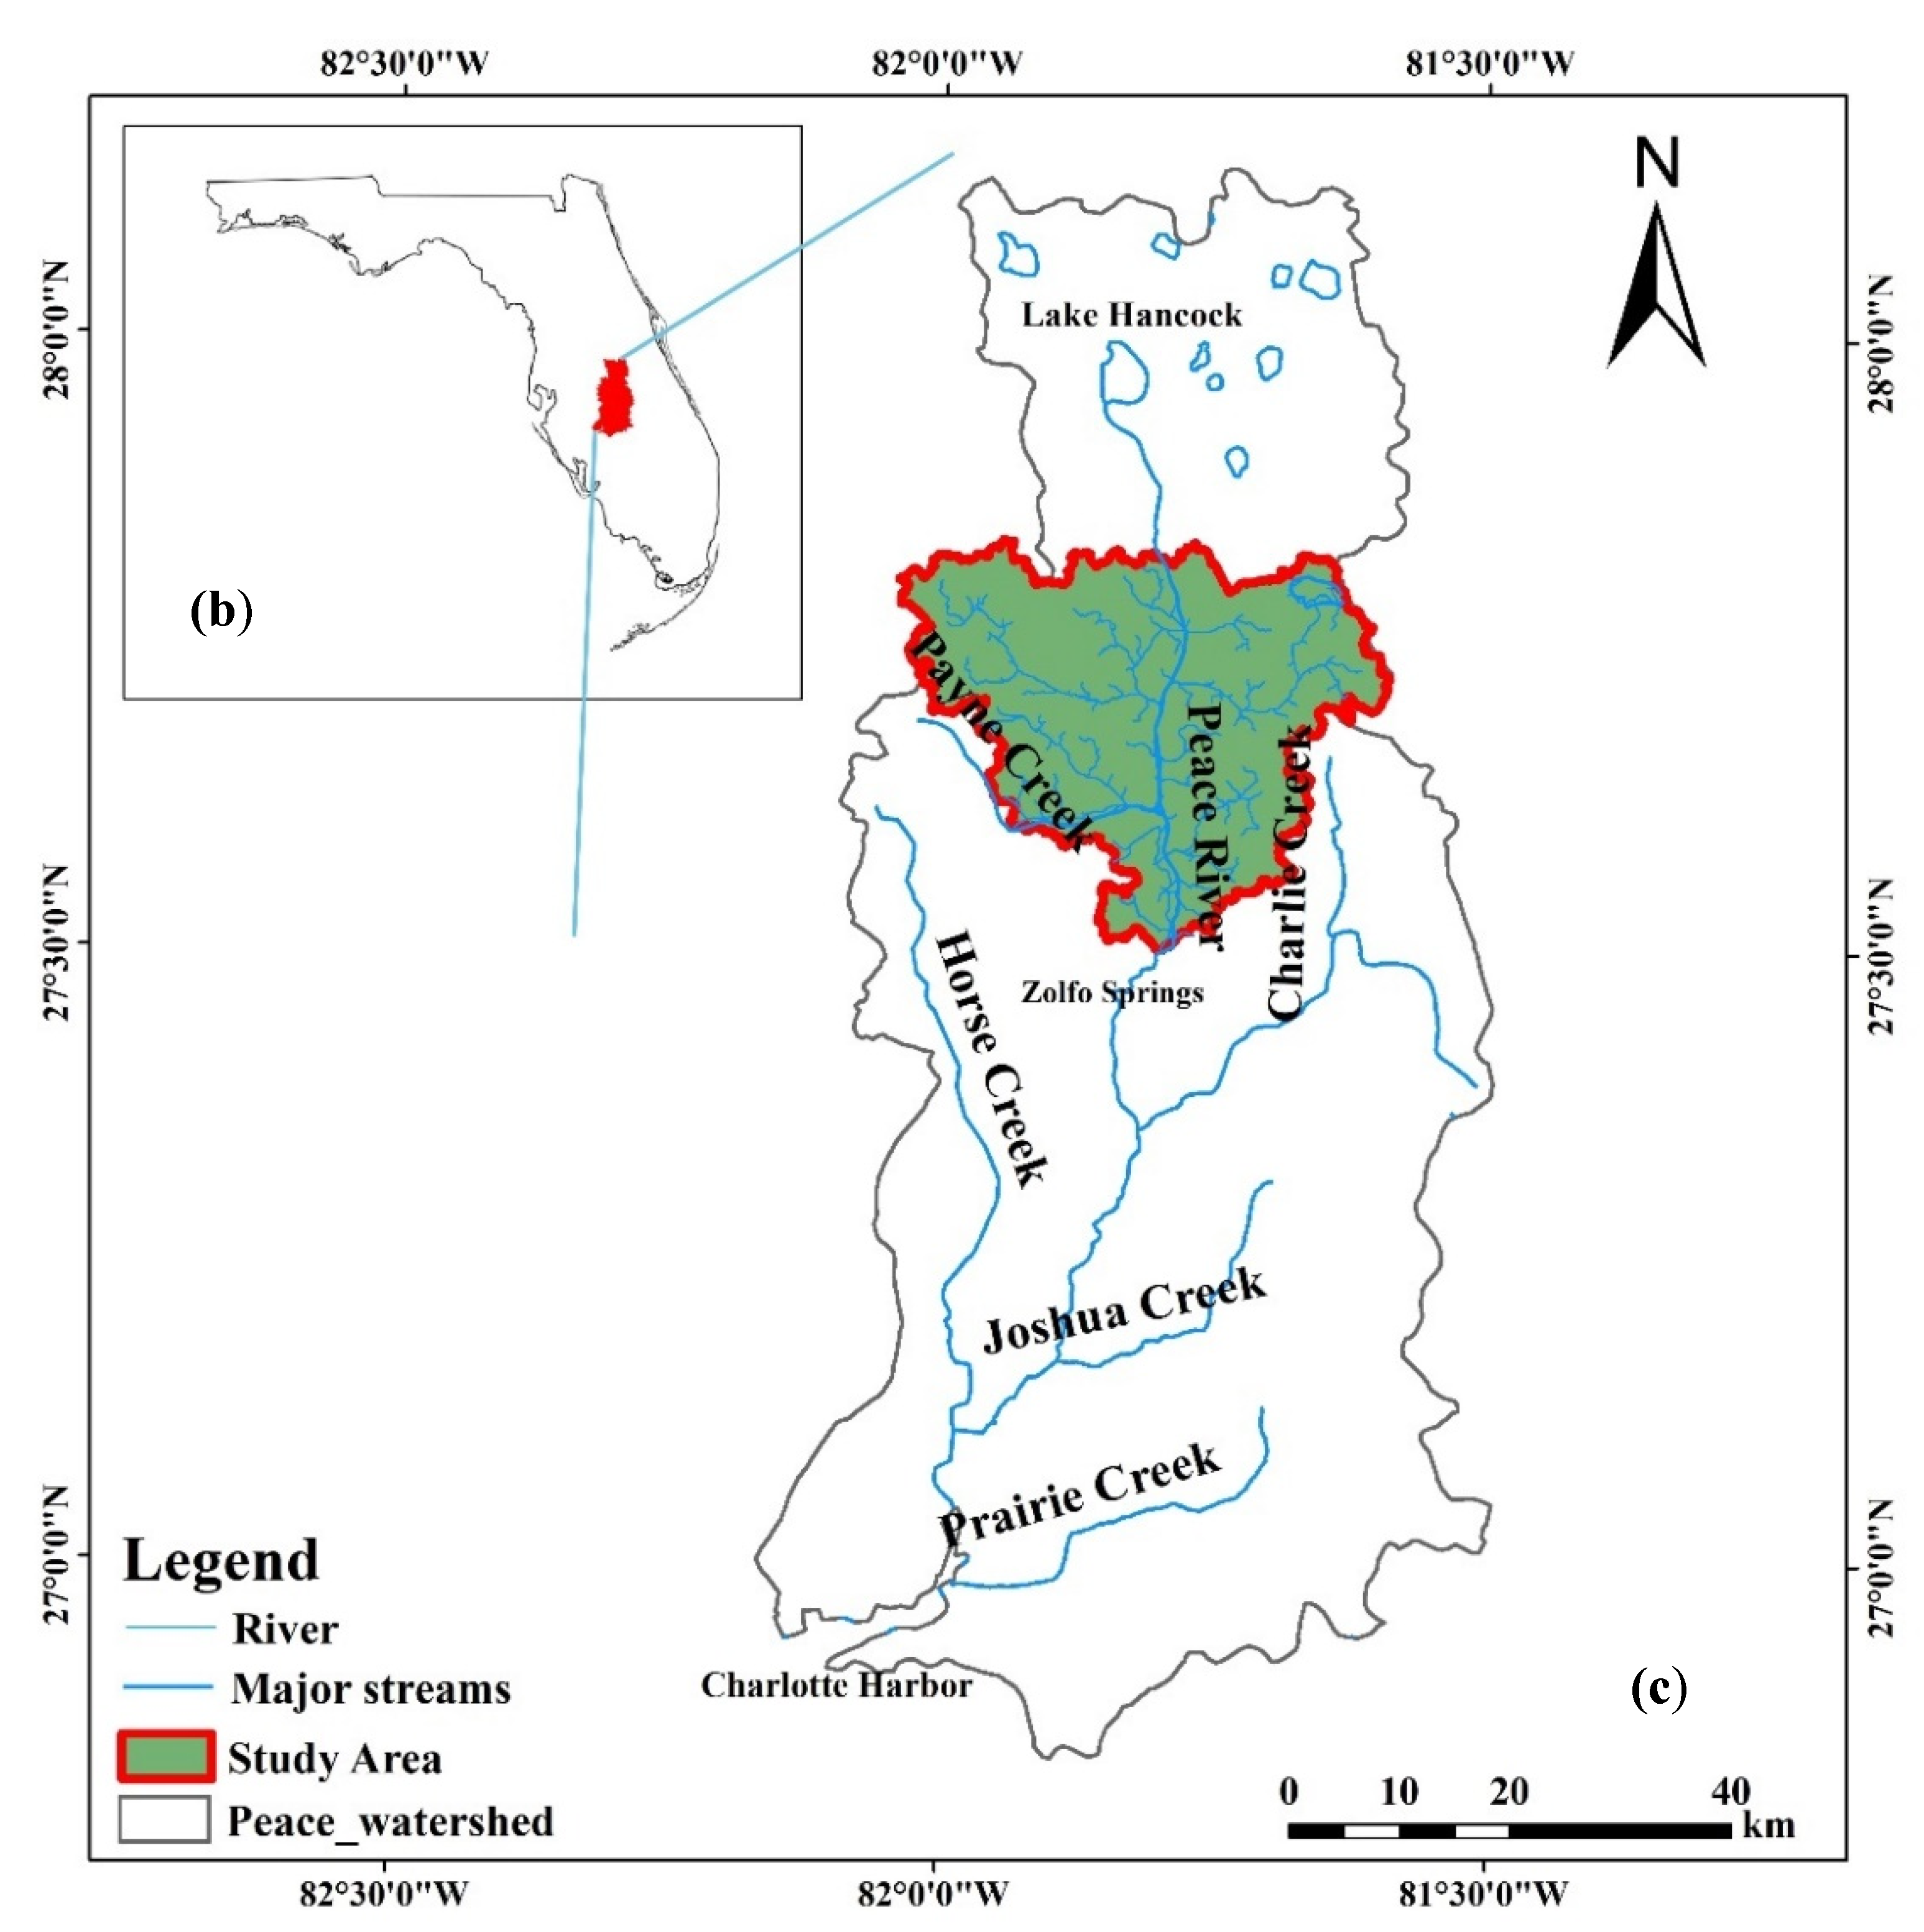
The study area (960 km2) is located in the southwestern part of Florida (27°29′45″–27°50′5″ N, 81°34′0″–82°3′35″ W). It has the characteristics of the coastal plain; for example, it has high drainage density, encompasses many streams and rivers, and is connected to the Peace River. Starting from Hancock Lake (1828 ha) in Polk County, south-central Florida, the river flows southwest (211 km) through Hardy and De Soto Counties and then flows into the Charlotte Harbor Estuary in Charlotte County (Figure 1).
Fresh water from the Peace River is essential for maintaining the subtle salinity of Charlotte Harbor, which has various endangered species, is home to fisheries (shrimp, crab, and fish), and is used for recreation. The Peace River has always been an important source of water for nearby residents. On a good-flow day, the Peace River provides approximately 22.7 million liters of drinking water to residents of Charlotte, Sarasota, and De Soto Counties. The upstream and downstream communities rely on the river to provide drinking water; high-quality wildlife habitats; and support for key industries, such as fisheries, agriculture, and ecotourism [5,31].
In 1886, high-grade phosphates were discovered along the Peace River. Mining activity along the Peace River proceeded both in the river itself and on the adjacent land [32]. In the southwestern part of the county, water fluctuations associated with phosphate mining substantially affected groundwater levels. The United States Geological Survey (USGS) stated that there are areas prone to sinkhole formation in southwest Florida that may be affected by large amounts of water (phosphate open pit) [33]. According to data from the SWFWMD, the Peace River has been at risk of “serious hazards” due to reduced water production, in part due to phosphate mining. There is widespread concern that mining has reduced will continue to reduce downstream water quality and quantity. In 2004, the American Rivers Organization declared the Peace River as one of the most endangered rivers in the United States [34]. In making this designation, they listed the proposal to expand the mining of phosphate belts as a major risk. Open-pit mining deprives the natural surface profile of the land, changing the water quality and quantity of the flow into the Peace River. The small amount of water flowing into the Peace River has a much higher mineral content than that commonly found in the river. This difference affects the water content in Port Charlotte, a residential community.
2.2. Data Collection
The digital elevation model (DEM) used in this study was based on Shuttle Radar Topography Mission data with a resolution of 30 m. The DEM data of the study area were obtained by splicing, cutting, and tamping the data. The land use types in the study area were divided into six types.
The necessary meteorological data for the SWAT model included daily precipitation, daily minimum and maximum temperatures, daily wind speed, daily relative humidity, and daily solar radiation data. The meteorological data of the study area were obtained from the Bowling Green weather station. The Peace River runoff and water quality data were measured by the Zolfo Spring station of the USGS (site number USGS02295637), and the measured data were monthly flows from 2001 to 2018. The relevant data sources are presented in Table 1 and were used to create the SWAT model.
2.3. Research Methods
2.3.1. SWAT Calibration and Uncertainty Programs
The SWAT model was developed by the US Department of Agriculture Agricultural Research Service. It was used to predict the impact of land management measures on water, sediment, and agrochemical production in large and complex watersheds with different soil, land use, and management conditions [40]. SWAT calibration and uncertainty programs (SWAT-CUP) were used to calibrate the SWAT model. This software can be used to perform calibration, validation, sensitivity analysis (one-at-a-time or global), and uncertainty analysis [41]. SWAT-CUP also has a graphical module for viewing watershed visualizations and statistical reports using graphs of simulation results, uncertainty ranges, and sensitivity.
2.3.2. Sequential Uncertainty Fitting Version Method
The sequential uncertainty fitting version (SUFI-2) method is based on the difference between the simulated and observed variables [42]. It consists of a Bayesian framework that determines the uncertainty through sequential and fitting processes. SUFI-2 performs a combination optimization and uncertainty analysis using a global search method and processes many parameters through Latin hypercube sampling. SUFI-2 is a semi-automated method that makes the calibration process easier to execute in an achievable time range [43]. Researchers use this model because, if it is conducted manually, adding many parameters to the model means a more complex calibration process and a larger amount of calculation.
2.3.3. Generalized Likelihood Uncertainty Estimation Method
The generalized likelihood uncertainty estimation (GLUE) method can estimate the non-uniqueness of the best parameter set in the parametric model. This analysis is an uncertainty analysis inspired by importance sampling or regional sensitivity analysis. Similar to SUFI-2, GLUE explains all sources of uncertainty because the likelihood metrics are associated with the parameter sets and reflect any impact of all of these error sources [44].
2.3.4. Parameter Solutions Method
The parameter solutions (ParaSol) method aggregates objective functions (OFs) into global optimization criteria (GOC), minimizes these OFs or GOC by using the stochastic compound evolution algorithm (SCE-UA), and chooses between two statistical concepts to perform an uncertainty analysis. The SCE-UA method is a global search method for the minimization of a single function of as many as 16 parameters [45].
2.3.5. Particle Swarm Optimization Method
Particle swarm optimization (PSO) is initialized with a set of random particles (solutions), and the best value is then searched by updating the algebra. In each iteration, each particle is updated using the following two “best” values: the best solution thus far, called pbest, and the other “best” value tracked by the particle swarm optimizer is the best value obtained by any particle in the population to date, called gbest. When a particle has a partial population as its topological neighbor, the best value is the local optimum, called lbest. After finding the two best values, the particles update their speed and position [46].
2.3.6. Land Use Transfer Matrix
The Markov transfer matrix can further describe the mutual transformation of land use types [47,48,49]. The transfer matrix can reflect the structure of land use types in different periods and show the transfer changes among different land types. Thus, the spatiotemporal evolution of land use patterns can be understood more intuitively [50].
In Equation (1), Pij is the transfer probability from land use type i to land use type j, where 0 ≤ Pij ≤ 1, , and the sum of the elements in each row is 1.
The conversions of land use types can be classified into four types:
- (1)
- conversion from one type to another;
- (2)
- a first transformation of one type into a second type and then to a third type;
- (3)
- a first transformation into a second type and then back to the first type;
- (4)
- a transformation from one secondary type to another within a type.
2.3.7. Sensitivity Analysis
In this study, the SUFI-2 method embedded in SWAT-CUP was used to analyze the parameter sensitivity of the Peace River Basin. The widely used SUFI-2 method considers the uncertainty of the input data, model structure, parameters, and observational data and reflects it in the calibrated parameter range [51,52]. The method uses two indicators, the p-factor and the r-factor, to evaluate the uncertainty of the parameters; the p-factor represents the percentage of observed data included in the 95% confidence interval, and the r-factor represents the density of the samples within the 95% confidence interval. In theory, the closer the p-factor is to 1 and the closer the r-factor is to 0, the closer the simulation results are to the observed data [53].
3. Results and Discussion
3.1. Sensitivity Analysis of Parameters
There are many parameters involved in the calculation of the SWAT model, which leads to a long running time of the model and increases the uncertainty of the simulation results of the model to a large extent [54]. In order to improve the applicability of the model as much as possible and reduce the phenomenon of “similar parameters and same effects”, it is necessary to conduct a sensitivity analysis of related parameters. In this study, eight parameters, including the groundwater delay time (GW_DELAY), effective hydraulic conductivity in main channel alluvium (CH_K2), baseflow alpha factor (ALPHA_BF), and average slope steepness (HRU_SLP), were selected to calculate the sensitivity of each parameter respectively. The specific results are shown in Table 2. Among them, t-stat represents the relative significance of the parameter; the larger its absolute value, the more sensitive the parameter is. The p-value represents the confidence level of the parameter, and the closer its value is to 0, the more important the parameter is. It can be seen in Table 2 that the top four parameters of sensitivity are GW_DELAY, CH_K2, ALPHA_BF, and HRU_SLP.
3.2. Runoff Simulation Analysis at the Mining Area Outlet
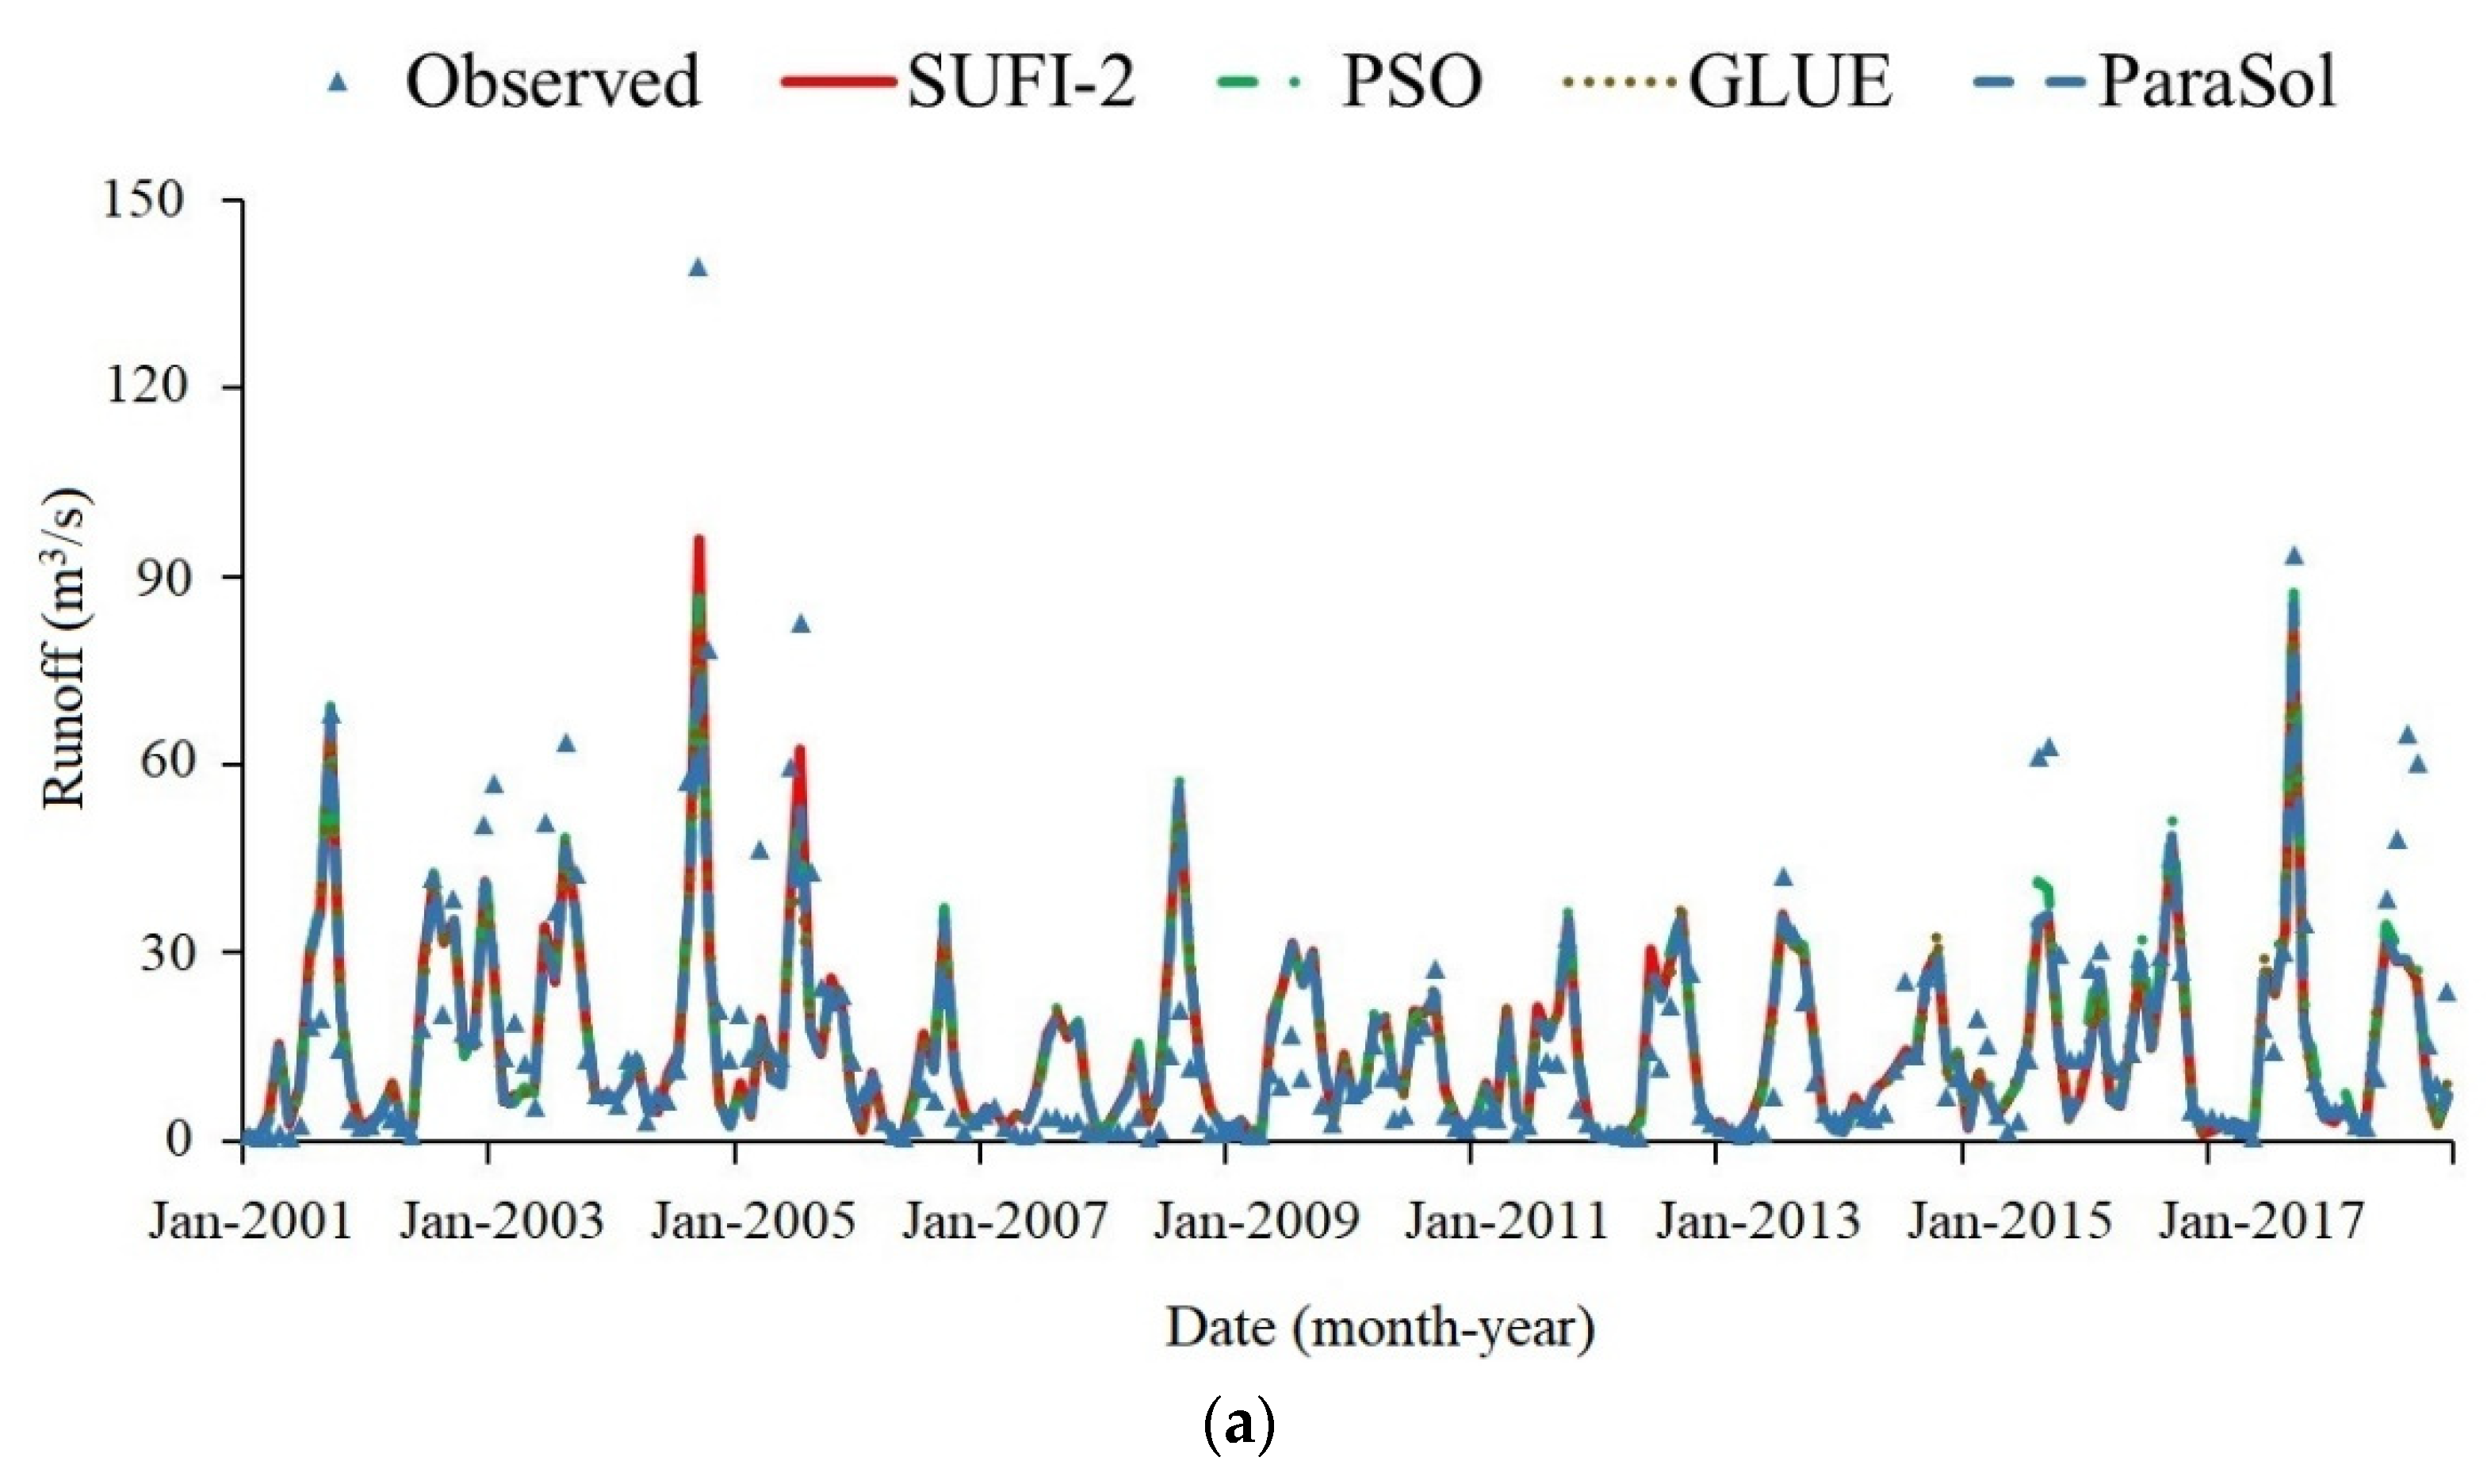
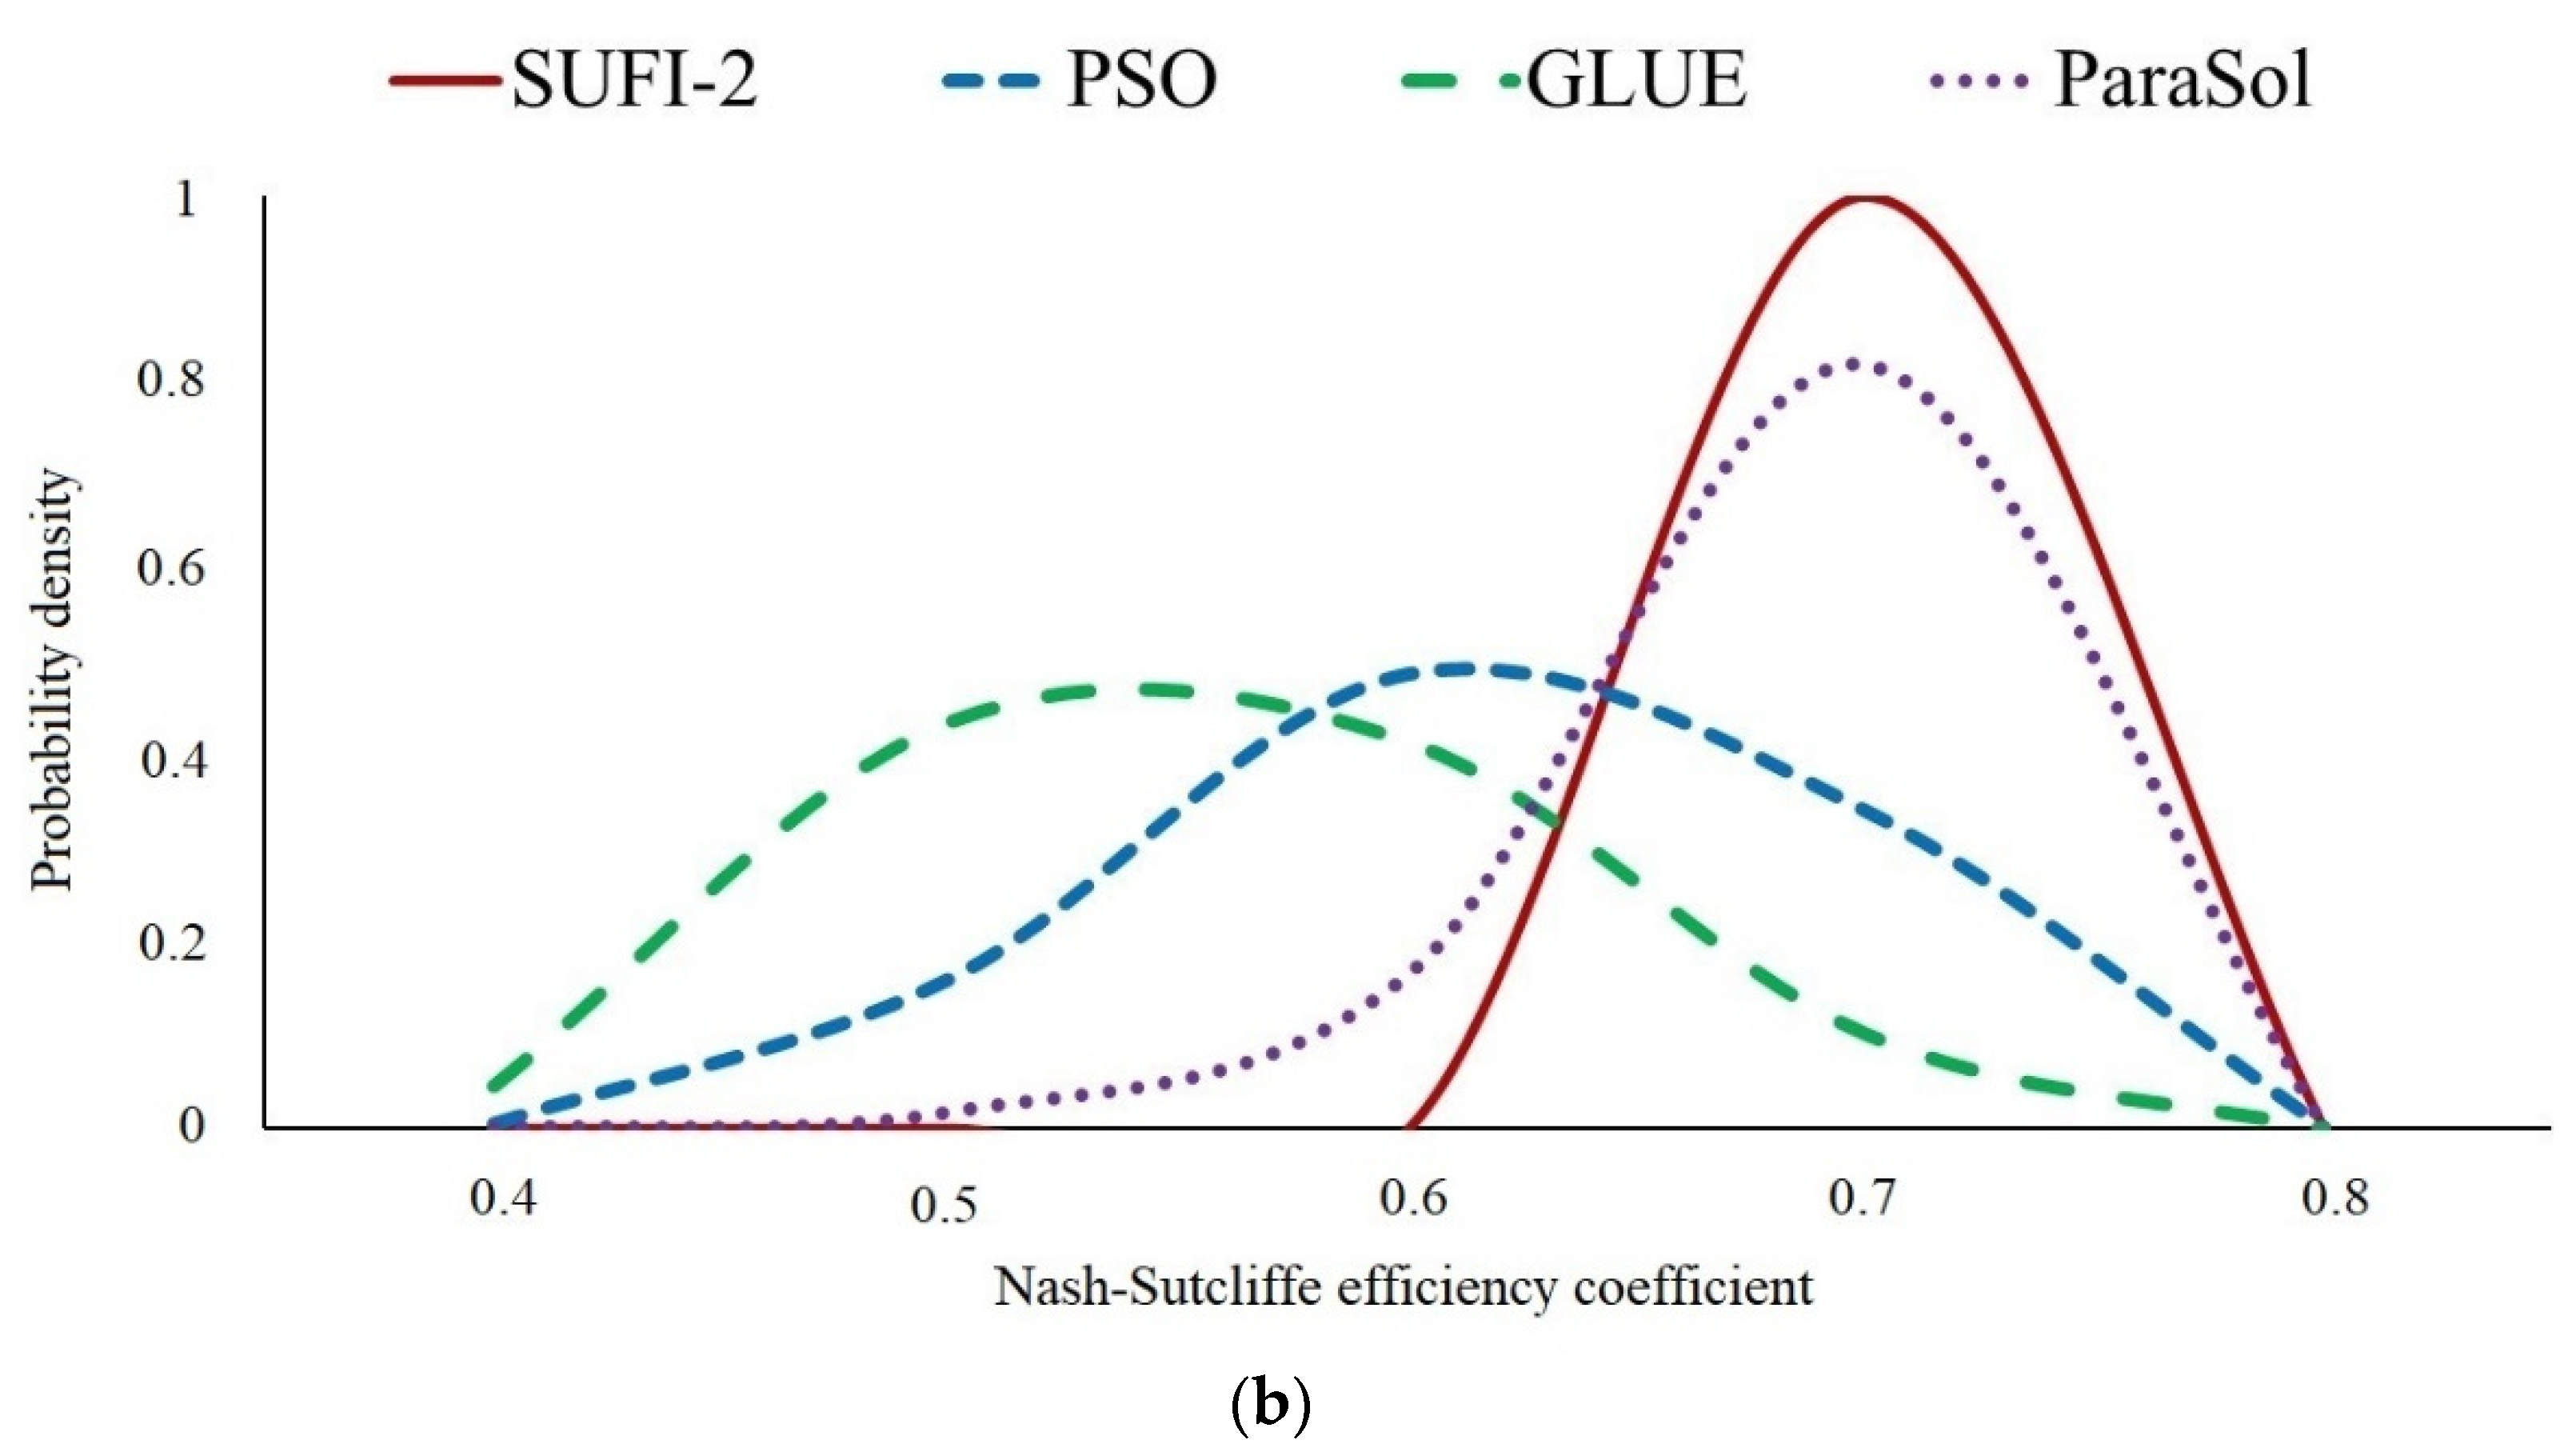
The calibration and validation of the parameters of this study were based on monthly data from January 2001 to December 2018, measured at the outlet station (USGS02295637), with 1999–2000 as the warm-up period, 2001–2014 as the calibration period, and 2015–2018 as the validation period. The Nash—Sutcliffe efficiency coefficient (NSE), determination coefficient (R2), p-factor, and r-factor were used as evaluation indexes of the simulation results. The fitting results of the measured values of runoff and the simulated values are shown in Figure 2a, and the behavior parameter probability density distributions of the four uncertainty methods are shown in Figure 2b. The statistical results of the four uncertainty methods are presented in Table 3.
As shown in Table 3, the model results fulfill the requirements for the four uncertainty methods in the calibration and validation periods, in compliance with the standards of NSE ≥ 0.5 and R2 ≥ 0.6. The NSE and R2 of the SUFI-2 and GLUE methods in the validation period were higher than those of the other two methods. Thus, subsequent TN and TP load simulations were based on the SUFI-2 and GLUE methods.
3.3. Simulation of Total Nitrogen and Total Phosphorus Loads of Nonpoint Source Pollution at Outlet
3.3.1. Calibration and Validation
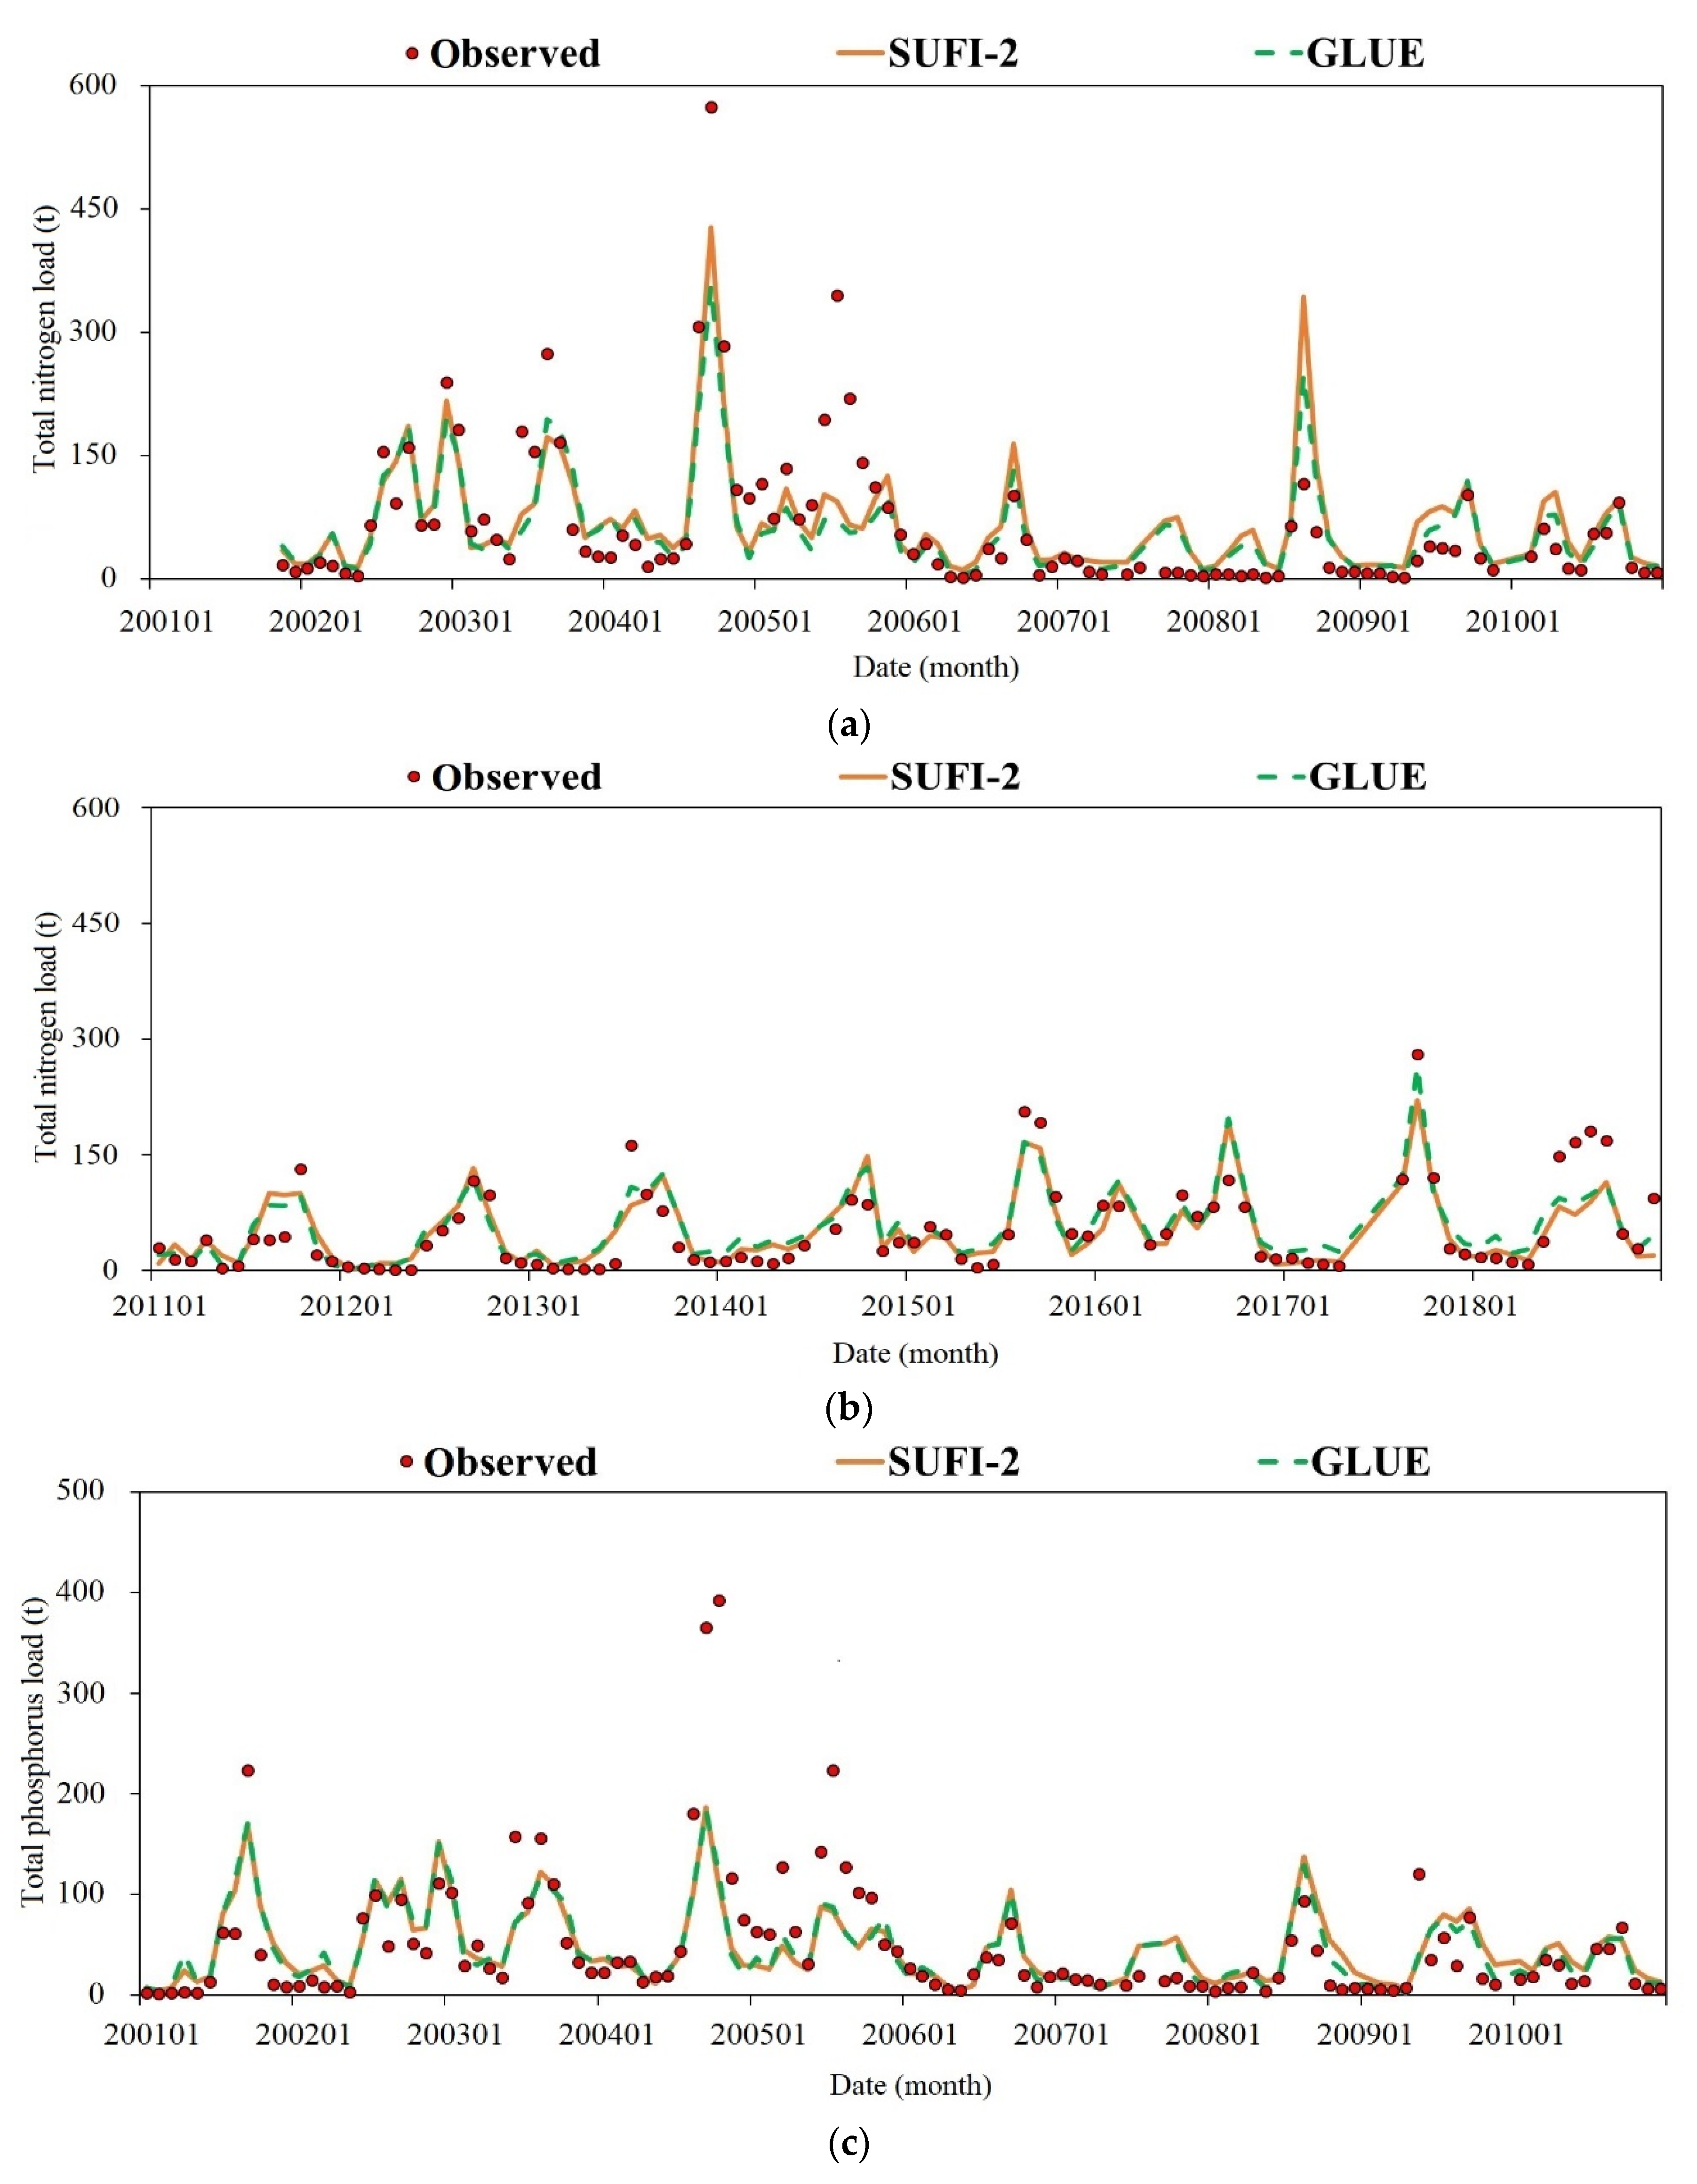
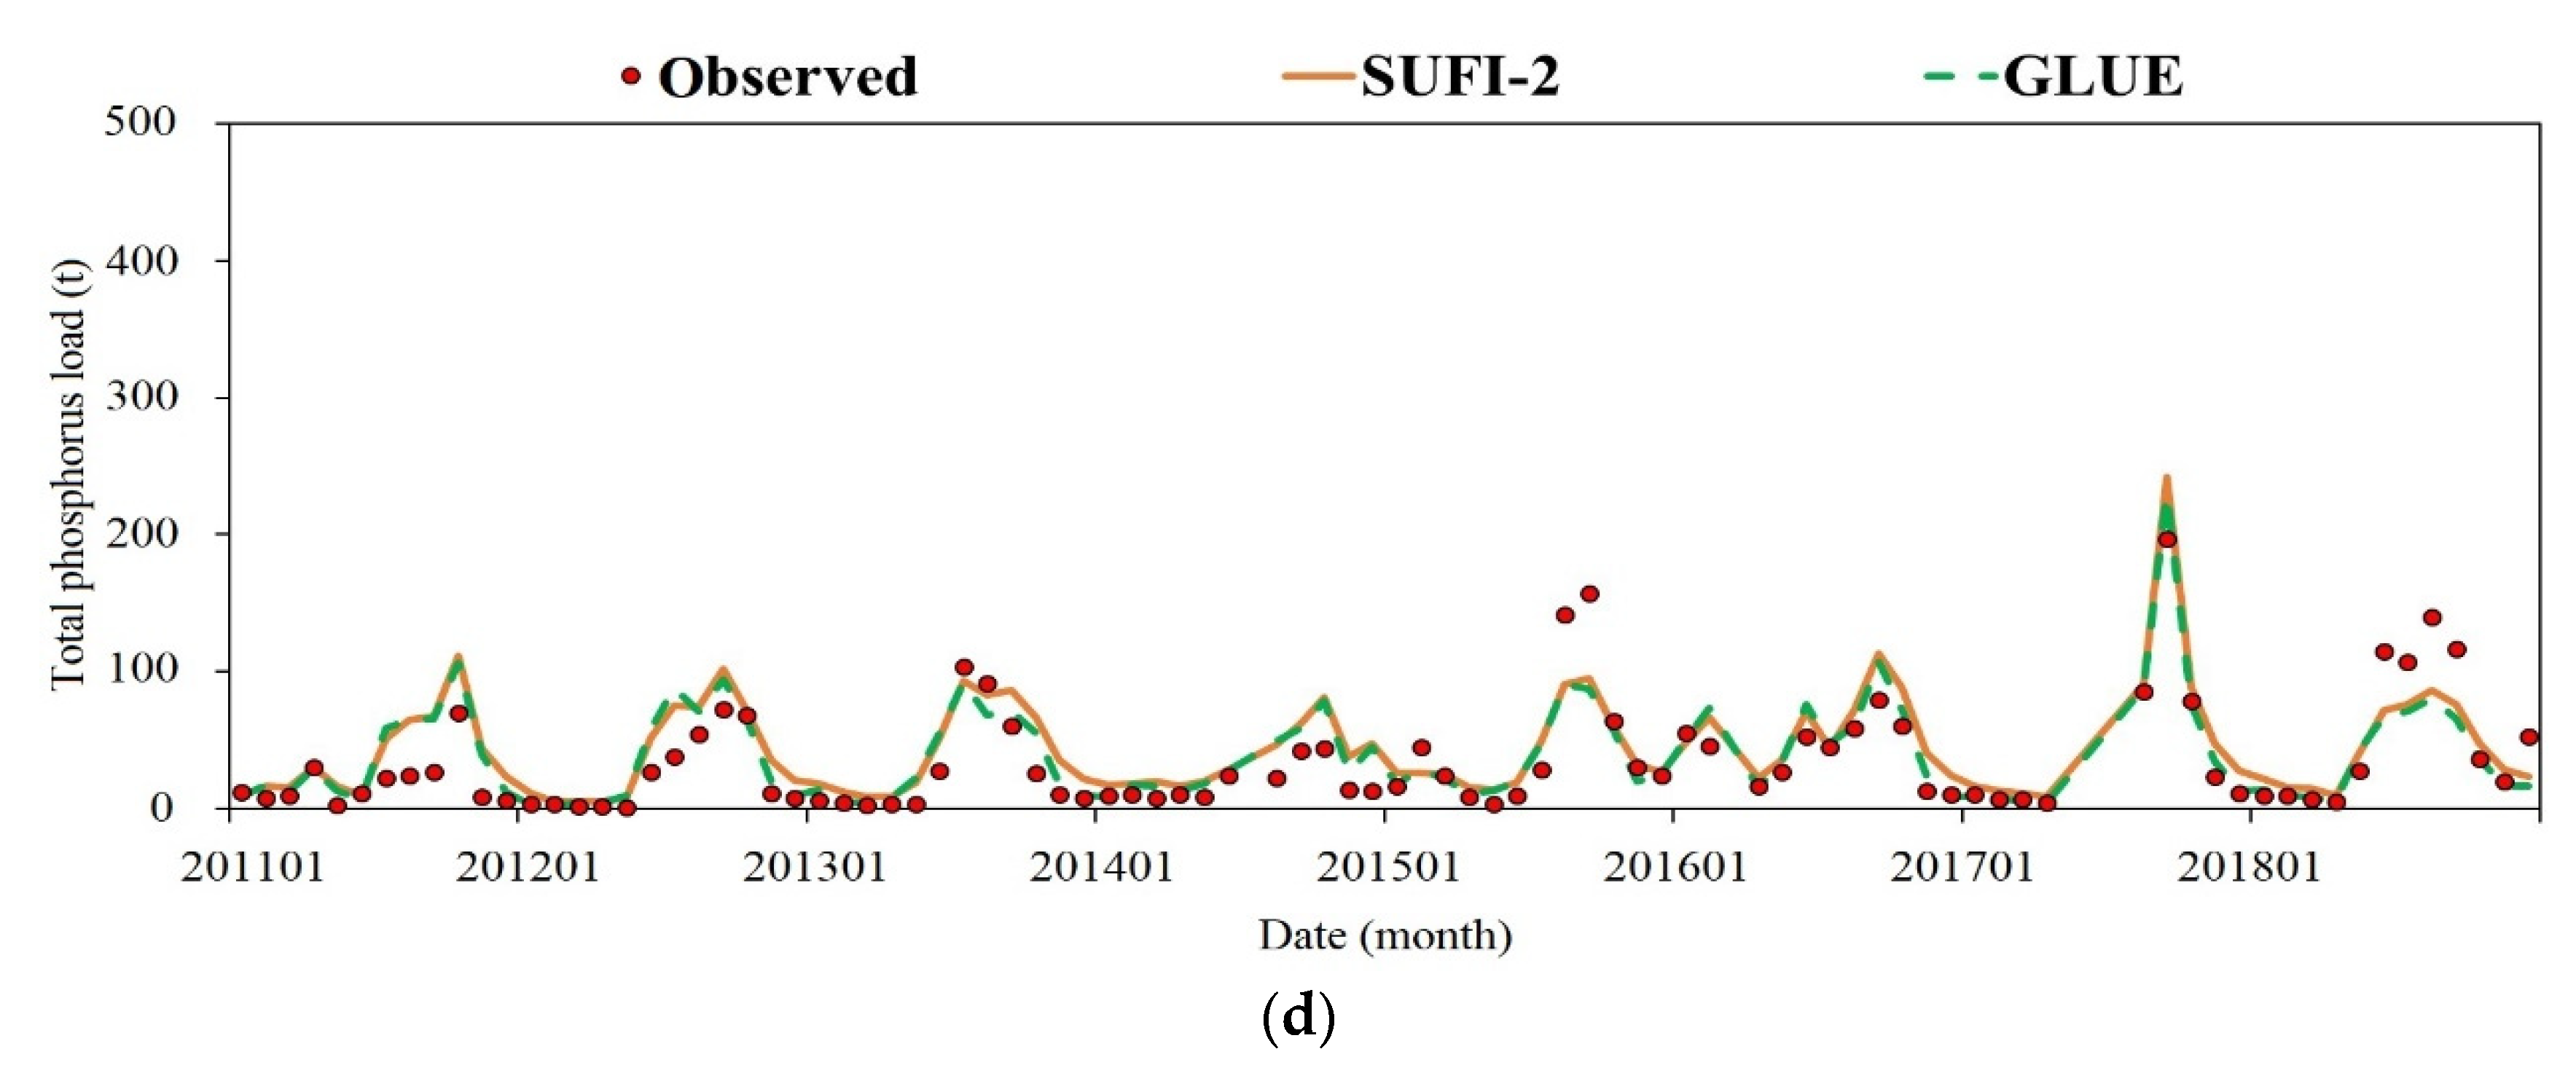
Accurate simulation of the flow rate is the basis of the water quality simulation. This study selected 1999–2000 as the preheating period, 2001–2010 as the calibration period, and 2011–2018 as the validation period. After calibrating the runoff, the loads of TN and TP were calibrated and validated. The model TP and TN load simulations obtained using the SUFI-2 and GLUE methods are shown in Figure 3. The evaluation indicators of the final results are presented in Table 4. As shown in Table 4, for the TN load simulation, the result of the GLUE method is better than that of the SUFI-2 method as a whole (NSE and R2 are higher in both the calibration and validation periods). For the TP load simulation, the simulation results of the GLUE and SUFI-2 methods are basically the same.
3.3.2. Probability Density of Behavior Parameters
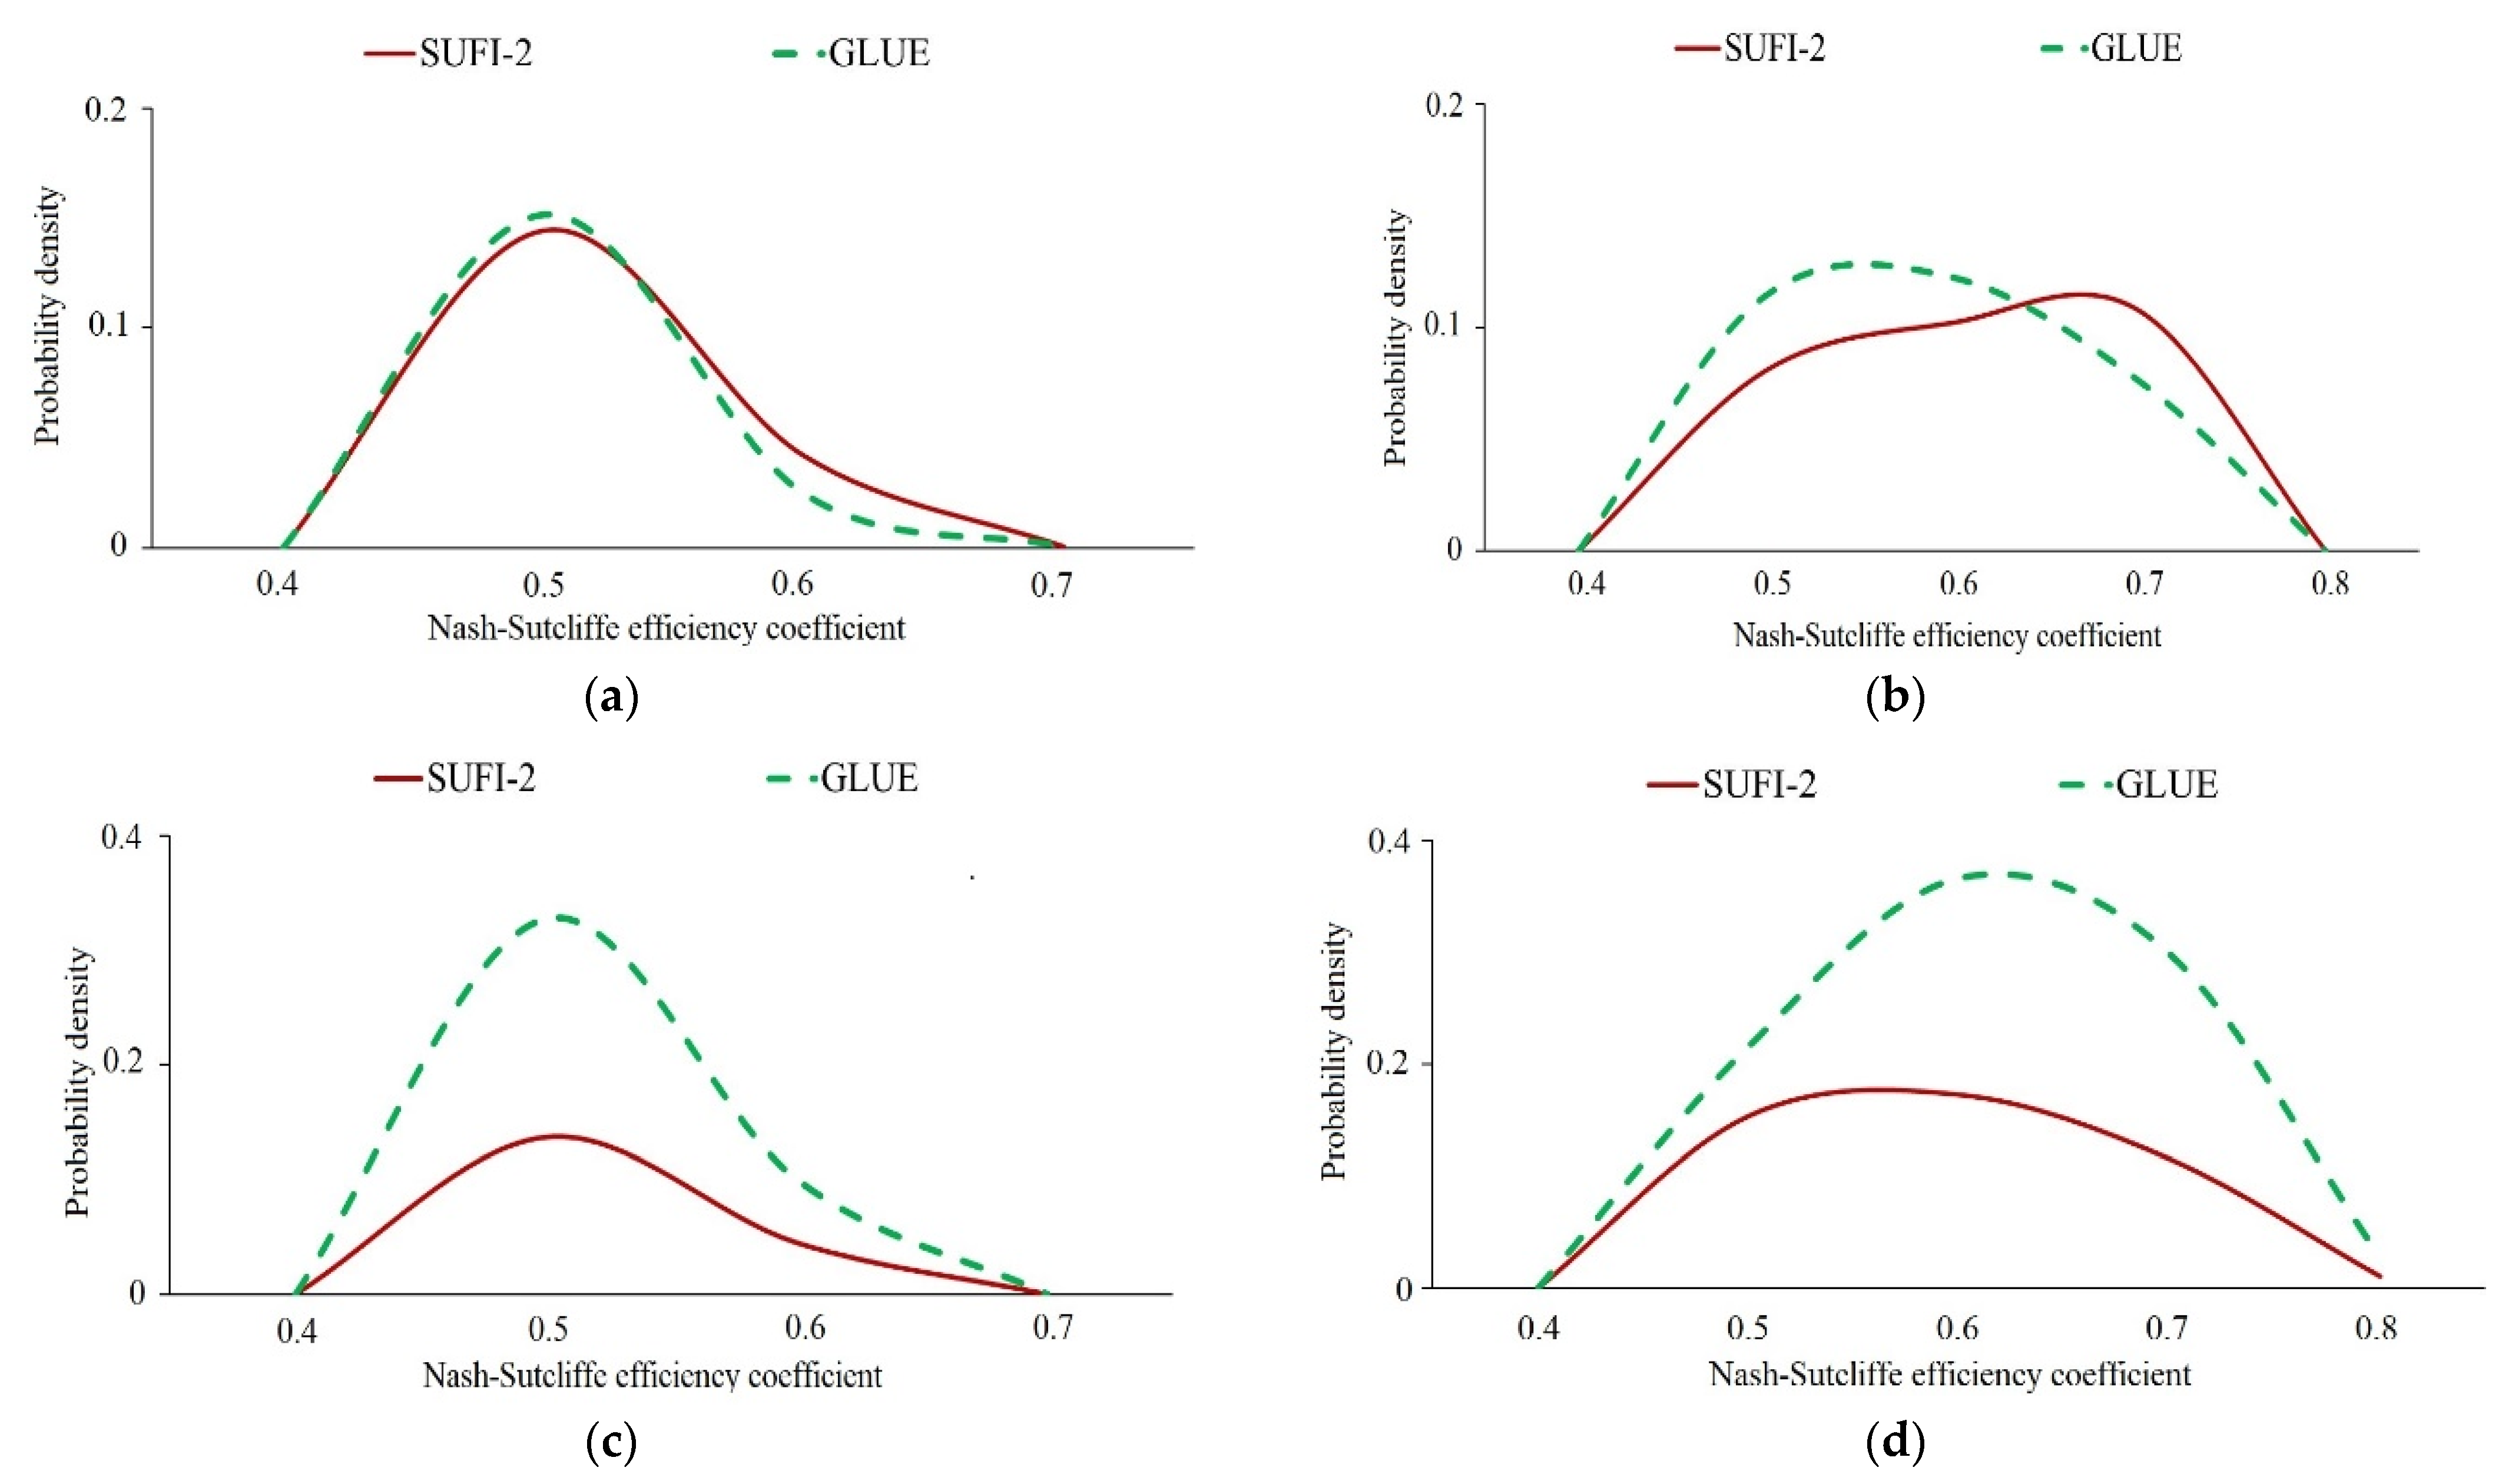
The behavior parameter probability density distributions of the TN and TP loads are shown in Figure 4 for the calibration and verification periods. As shown in Figure 4a, when simulating the TN load, the probability density of the GLUE method was greater than that of the SUFI-2 method when the calibration period NSE was approximately 0.5, whereas the probability density of the GLUE method was smaller than that of the SUFI-2 method when the NSE was approximately 0.6. As shown in Figure 4b, in the validation period, the probability density of the GLUE method for the TP load was greater than that of the SUFI-2 method when the NSE was approximately 0.5, whereas the probability density of the GLUE method was smaller than that of the SUFI-2 method when the NSE was approximately 0.7. The results when simulating the TN load show that the GLUE method has a lower probability of obtaining a higher NSE than the SUFI-2 method and that the GLUE method requires more runs and a longer run time to obtain a better NSE.
As shown in Figure 4c,d, when simulating the TP load, the probability density of the GLUE method in the calibration and validation periods is greater than that of the SUFI-2 method; therefore, the GLUE method is superior to the SUFI-2 method and has a greater probability of achieving a higher NSE.
Therefore, we have demonstrated that the GLUE method is better than the SUFI-2 method for the simulation of TN and TP loads. Xue reached a similar conclusion when calibrating sediment based on the SWAT model in the upper reaches of the Huolin River Basin [55].
3.3.3. Parameter Uncertainty Analysis of Total Nitrogen and Total Phosphorus Loads
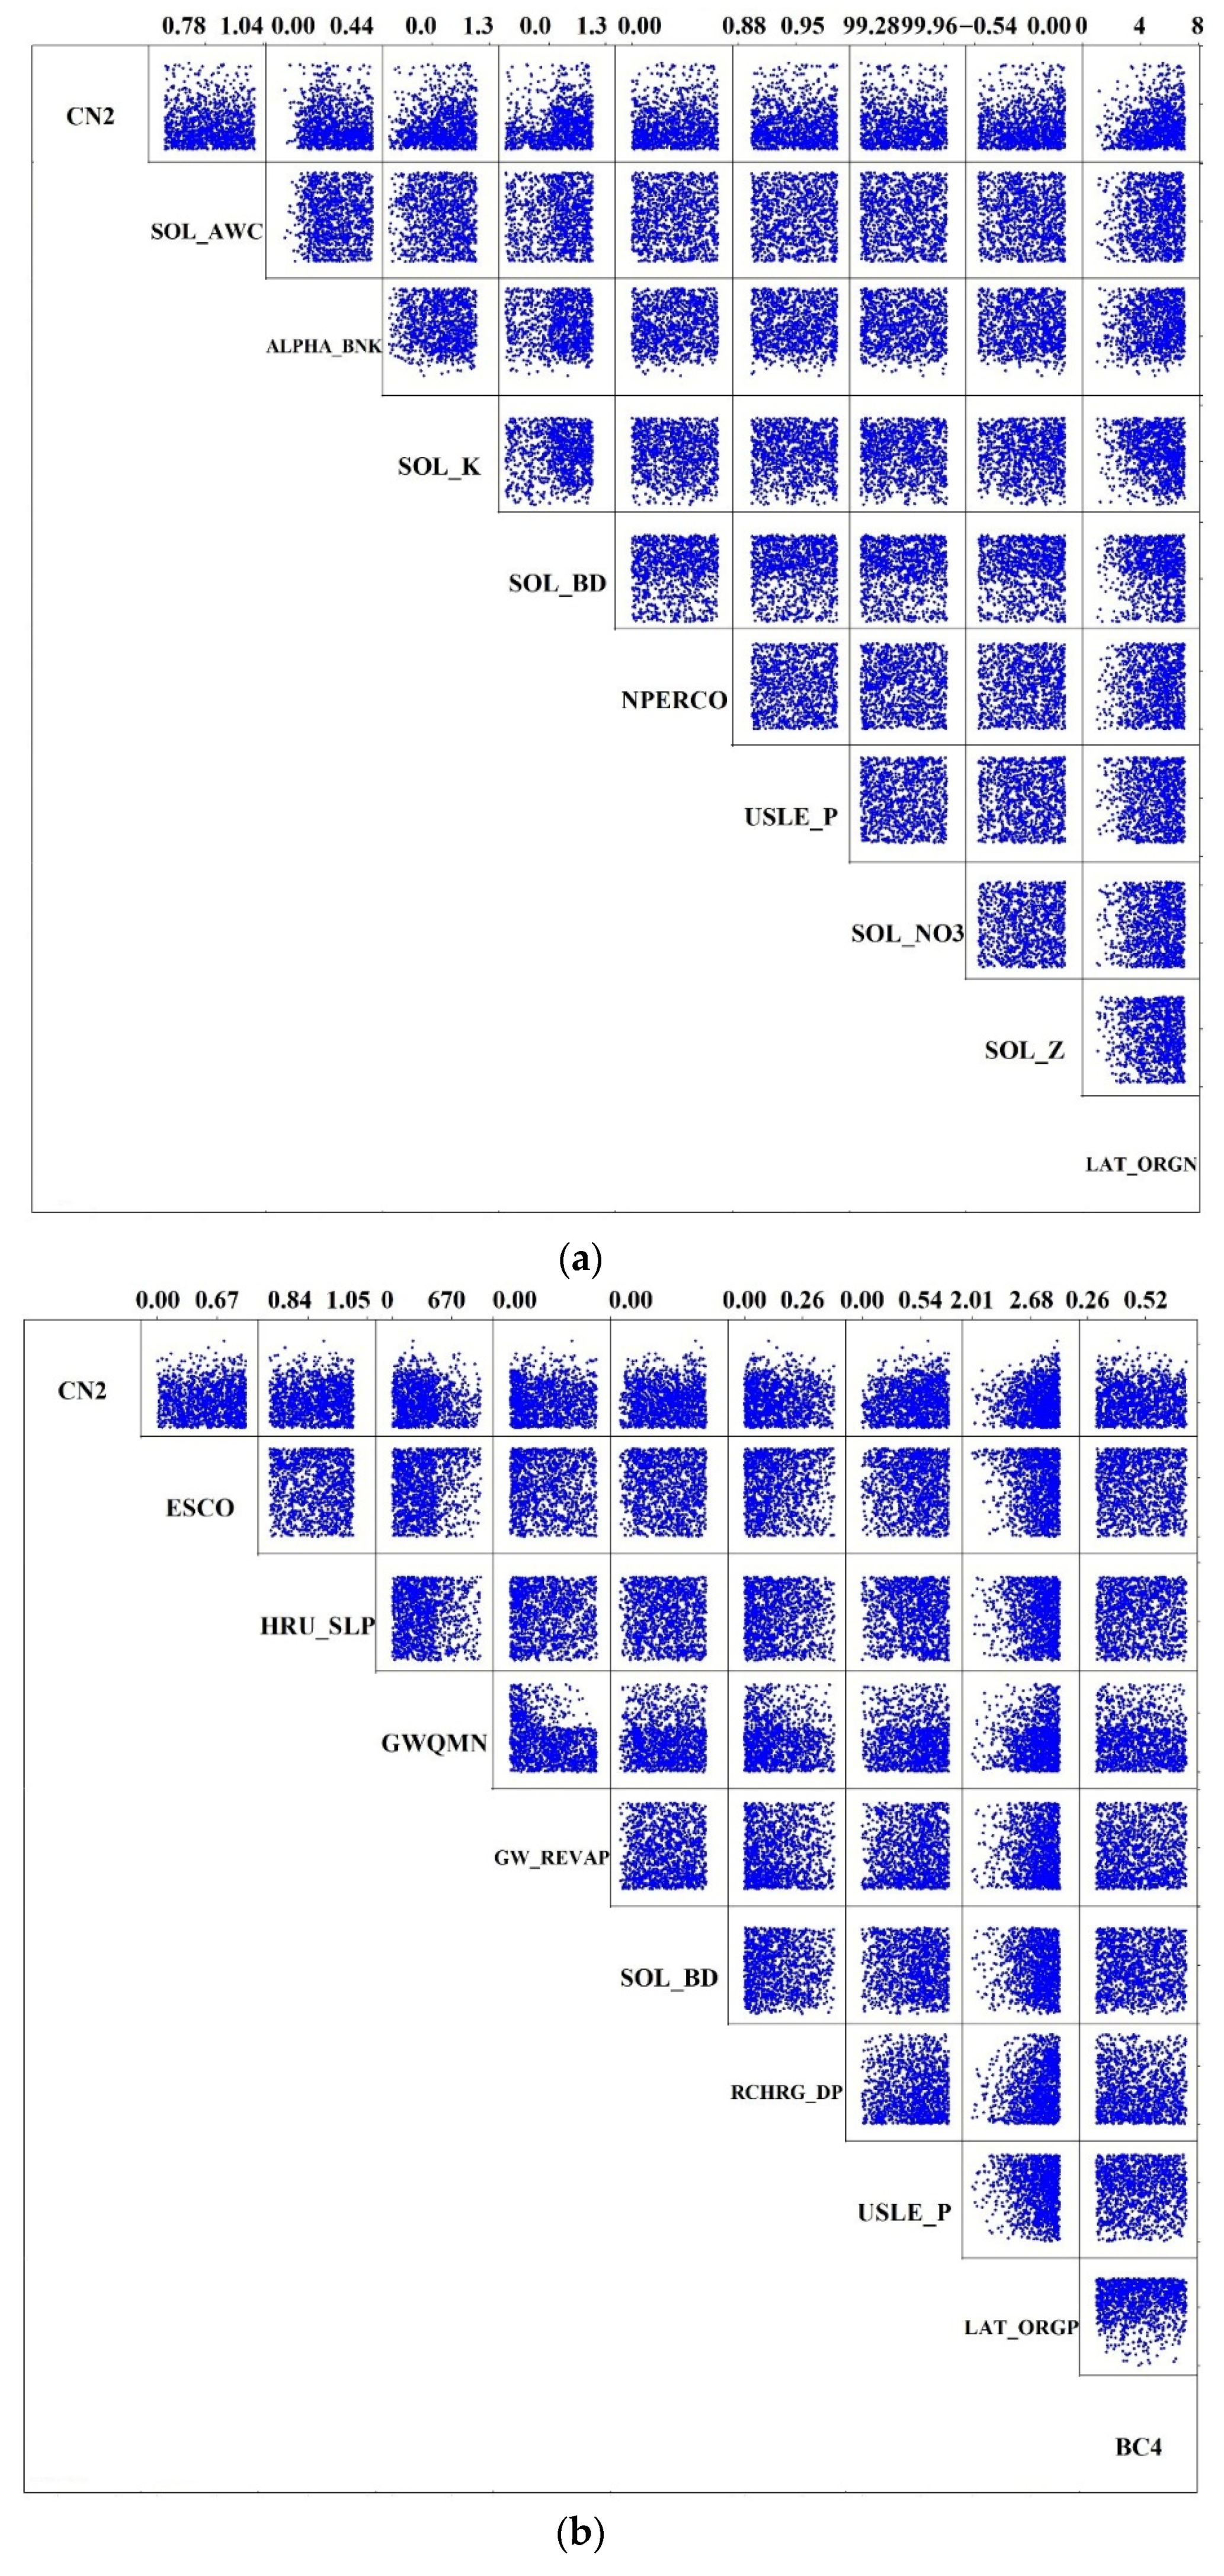
The following parameters were selected: ALPHA_BNK (basic flow α coefficient of riverbank water storage), LAT_ORGN (organic nitrogen in basic flow, mg/L), CN2 (SCS runoff curve number), OV_N (Manning value of land flow), SOL_K (soil saturated hydraulic conductivity, mm/h), SOL_Z (thickness of the soil surface to the bottom of each soil layer), HRU_SLP (average slope), SOL_ORGN (initial organic nitrogen concentration in the soil layer, mg/L), LAT_ORGP (organophosphorus in the basic flow, mg/L), USLE_P (factors of soil and water conservation measures based on the USLE equation), SOL_BD (fresh soil bulk density, g/cm3), CH_K2 (effective hydraulic conductivity of the main river, mm/h), GWQMN (initial water depth in the shallow impoundment necessary when the regression flow is generated, mm), P_UPDIS (distribution parameters of phosphorus uptake by plants). Figure 5a indicates that for the TN load simulation, correlations between CN2 and SOL_K, CN2 and LAT_ORGN, and SOL_K and LAT_ORGN are strongly positive, positive, and negative correlations, respectively. The scatter distribution of NSE varies with the values of some parameters. According to the results, in the final parameter range, corrected based on GLUE, when the SOL_Z parameter value is large and ALPHA_BNK and CN2 take the middle value of the parameter range, it is easier to obtain the best runoff simulation effect.
As shown in Figure 5b, for the TP load simulation, correlations between the parameter LAT_ORGP and the other parameters, except for BC4, are strong. The results show that it is easier to obtain the optimal runoff simulation effect when the LAT_ORGP value is large. They also show that the parameter LAT_ORGP has a greater impact on the uncertainty of the model simulation results than the other parameters.
Compared with GLUE running 5000 times for both the TN and TP load simulations, as the number of GLUE runs increases (from 5000 to 20,000 times), the number of parameters showing correlation decreases, and the correlation becomes more obvious.
3.4. Effect of Land Use Change on the Phosphate Mining Area
The types of land use in the study area include grassland, woodland, cultivated land, towns, mines, and water. Historic and sustainable phosphate mining in the Peace River Basin has disrupted the land and affected the water quantity and quality of the river. Most of the activity in the Peace River Basin is open-pit phosphate mining and recycling.
Five stations were selected in the study area, and the daily flow was used as the observational data. Phosphate mining began in June 2004. This study defined “pre” as the period before mining, and the corresponding land use data were from the land use map for 2004. It defined “post” as the period after mining, and the corresponding land use data were from the 2006 land use map. The flow data observations of all stations during this period were completed from June 2004 to July 2005.
In addition to the pre- and post-land use data, this study compared and analyzed the land use data of the study area in 2014 (reclamation). Statistics of the land use types in the pre, post, and reclamation study areas are shown in Table 5.
As shown in Table 6, before and after phosphate mining (pre–post), the change in cultivated land area is very small (increased by 1.24%), indicating that the impact of agricultural activities on the water environment can be ignored; the change in urban land area is very small (decreased by 3.51%); and the change in mining land area is large (increased by 142.86%), indicating that human activities mainly affect the water environment through phosphate mining. The total area of grassland, forest land, and water area changed very little (decreased by 0.66%), indicating that changes in the water environment were mainly affected by human activities.
As shown in Table 6, from phosphate mining to reclamation (post-2014), the cultivated land area changed greatly (decreased by 81.14%), indicating that the negative impact of agricultural activities on the water environment decreased; the change in urban land area was very small (decreased by 1.91%); and the change in mining land area was large (increased by 1527.94%), indicating that human activities mainly affect the water environment through phosphate mining. The total area of cultivated land, grassland, forest land, and water area decreased (16.26%), indicating that changes in the water environment were mainly affected by human activities.
3.4.1. Land Use Change from before to after Phosphate Rock Mining (Pre–Post)
As shown in Table 7, the land use type transfer from pre to post in the study area was mainly from the water area, urban land, and grassland to arable land and forest. Among these changes, the most drastic change was that in the water area to arable land and forest; the changed areas were 0.67 km2 and 1.96 km2, respectively.
3.4.2. Land Use Change from after Phosphate Mining (Post) to 2014 (Reclamation)
As shown in Table 8, the most drastic change in land use from post to 2014 was the change in arable land, which transformed into grassland and mining land; the transformed areas were 28.67 km2 and 8.65 km2, respectively.
3.5. Simulated Runoff Changes before and after the Mining of Phosphate
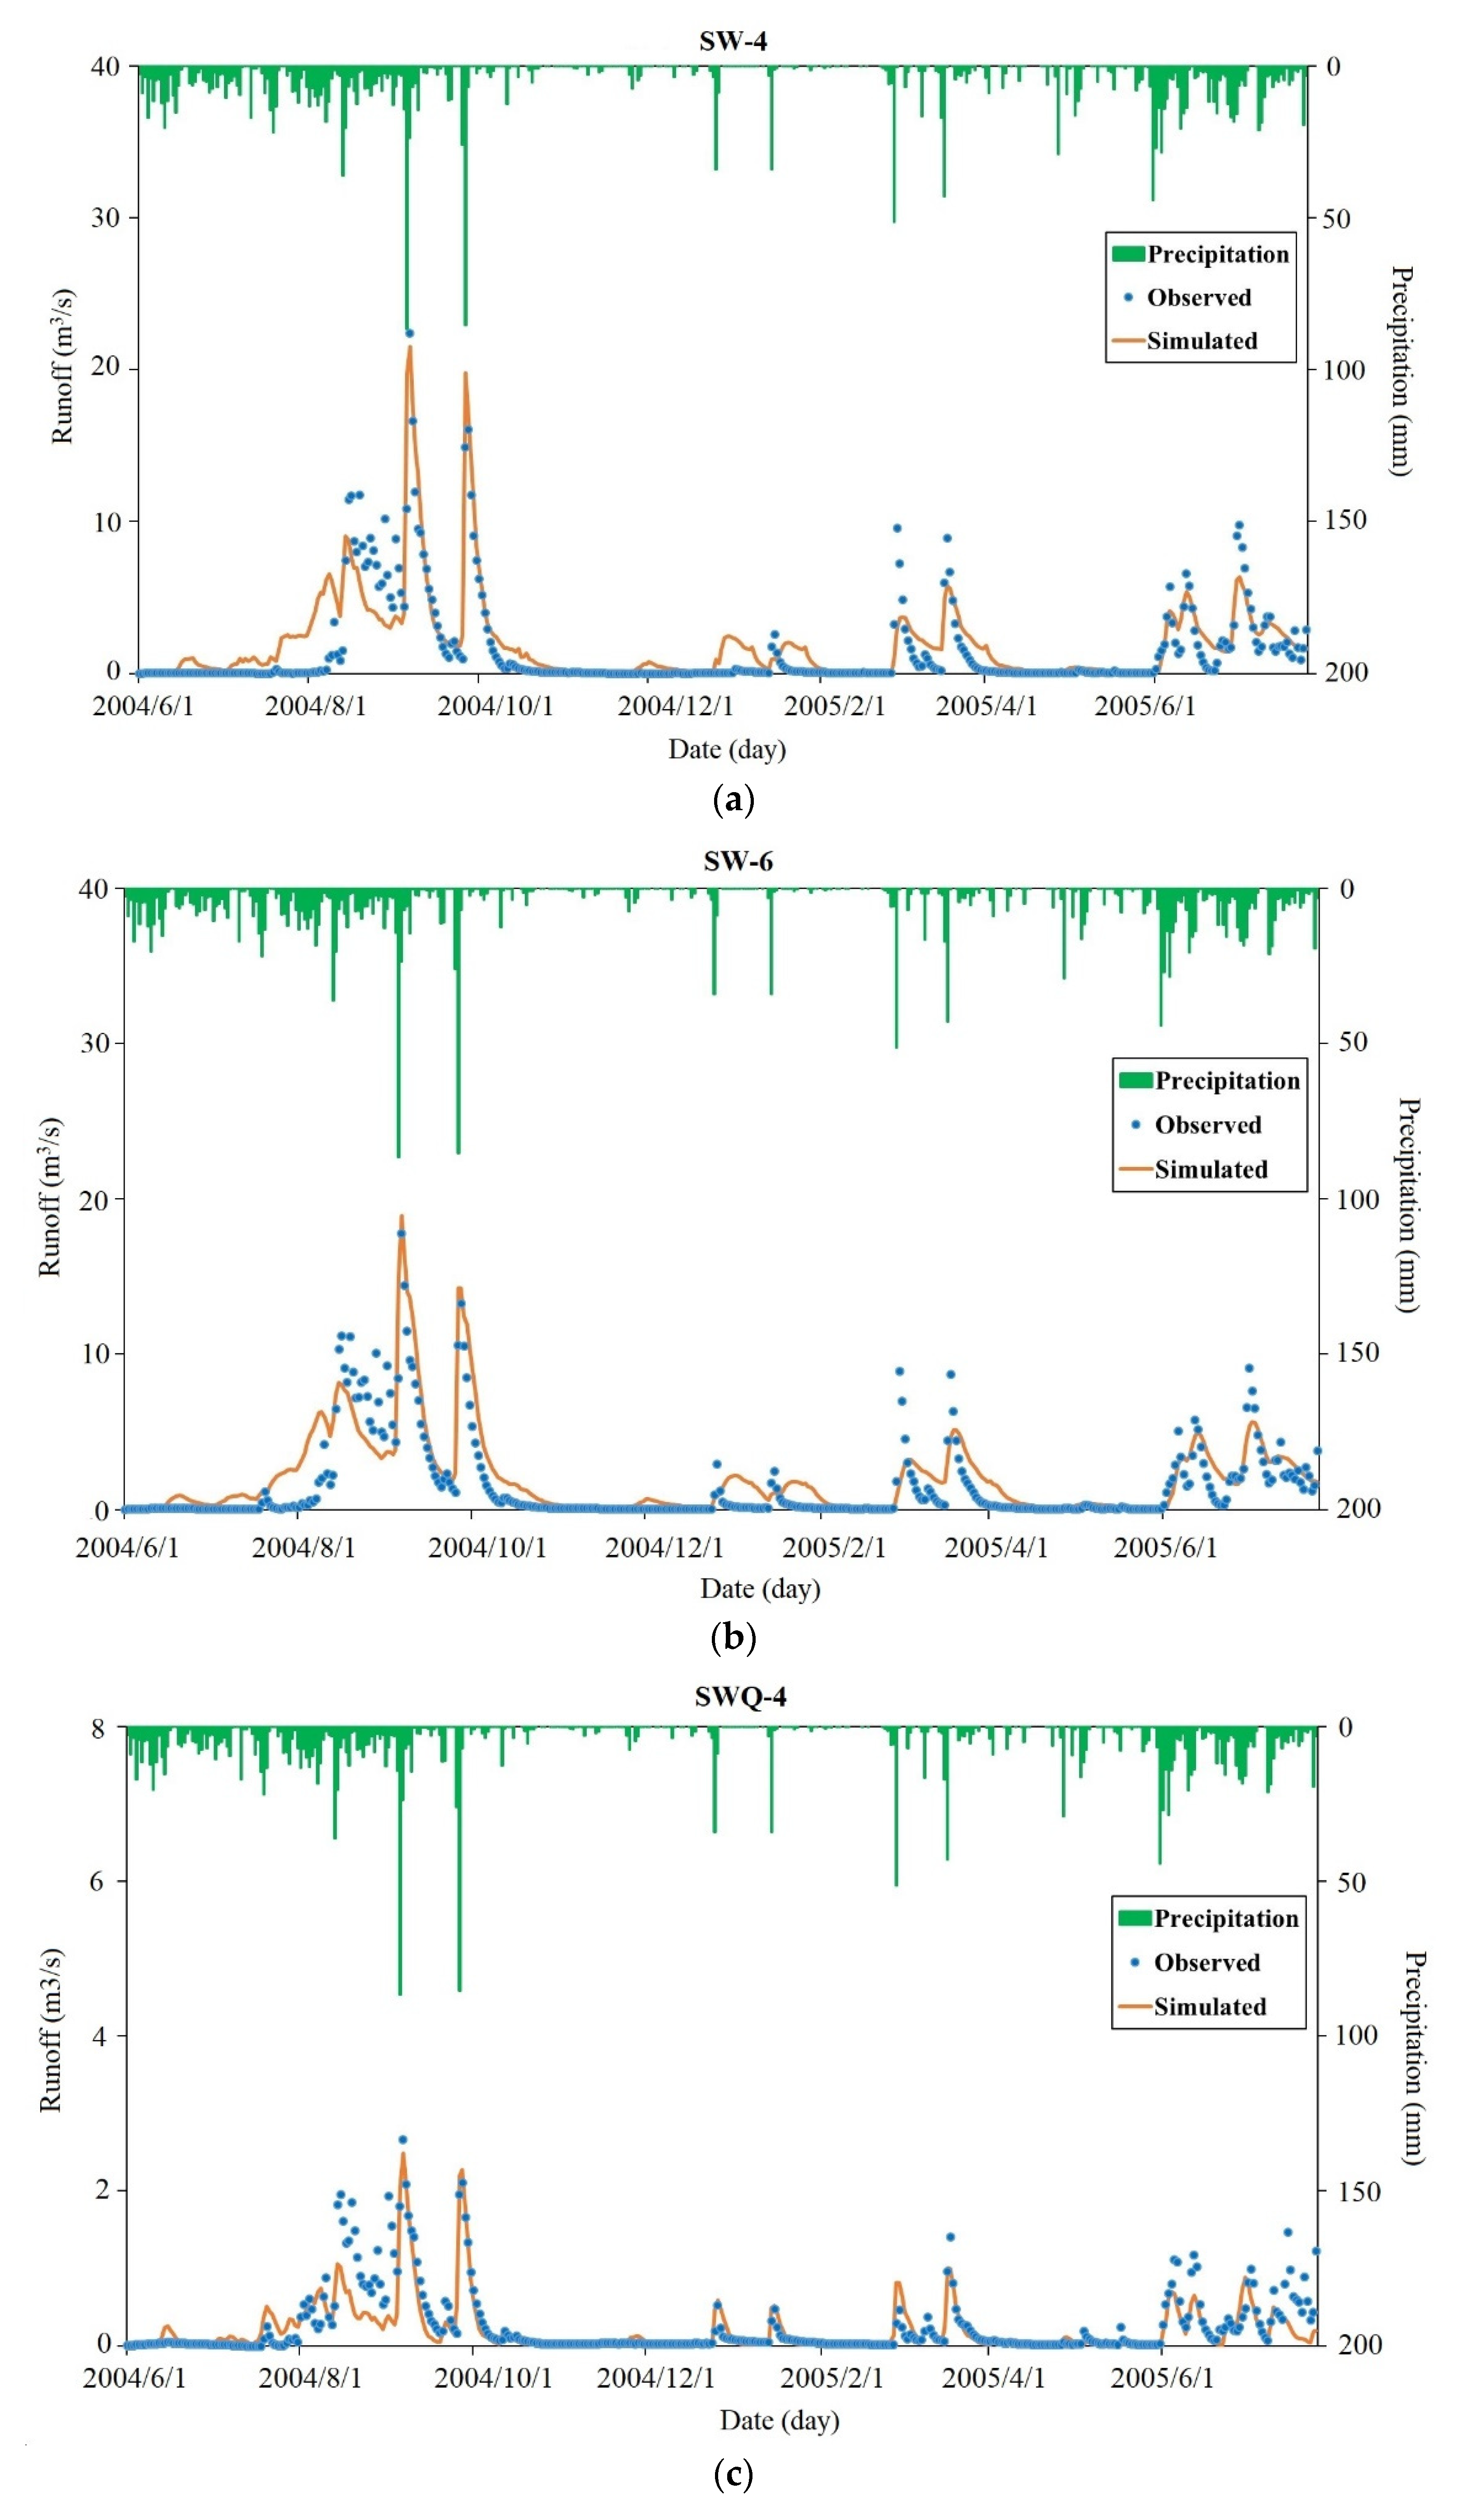
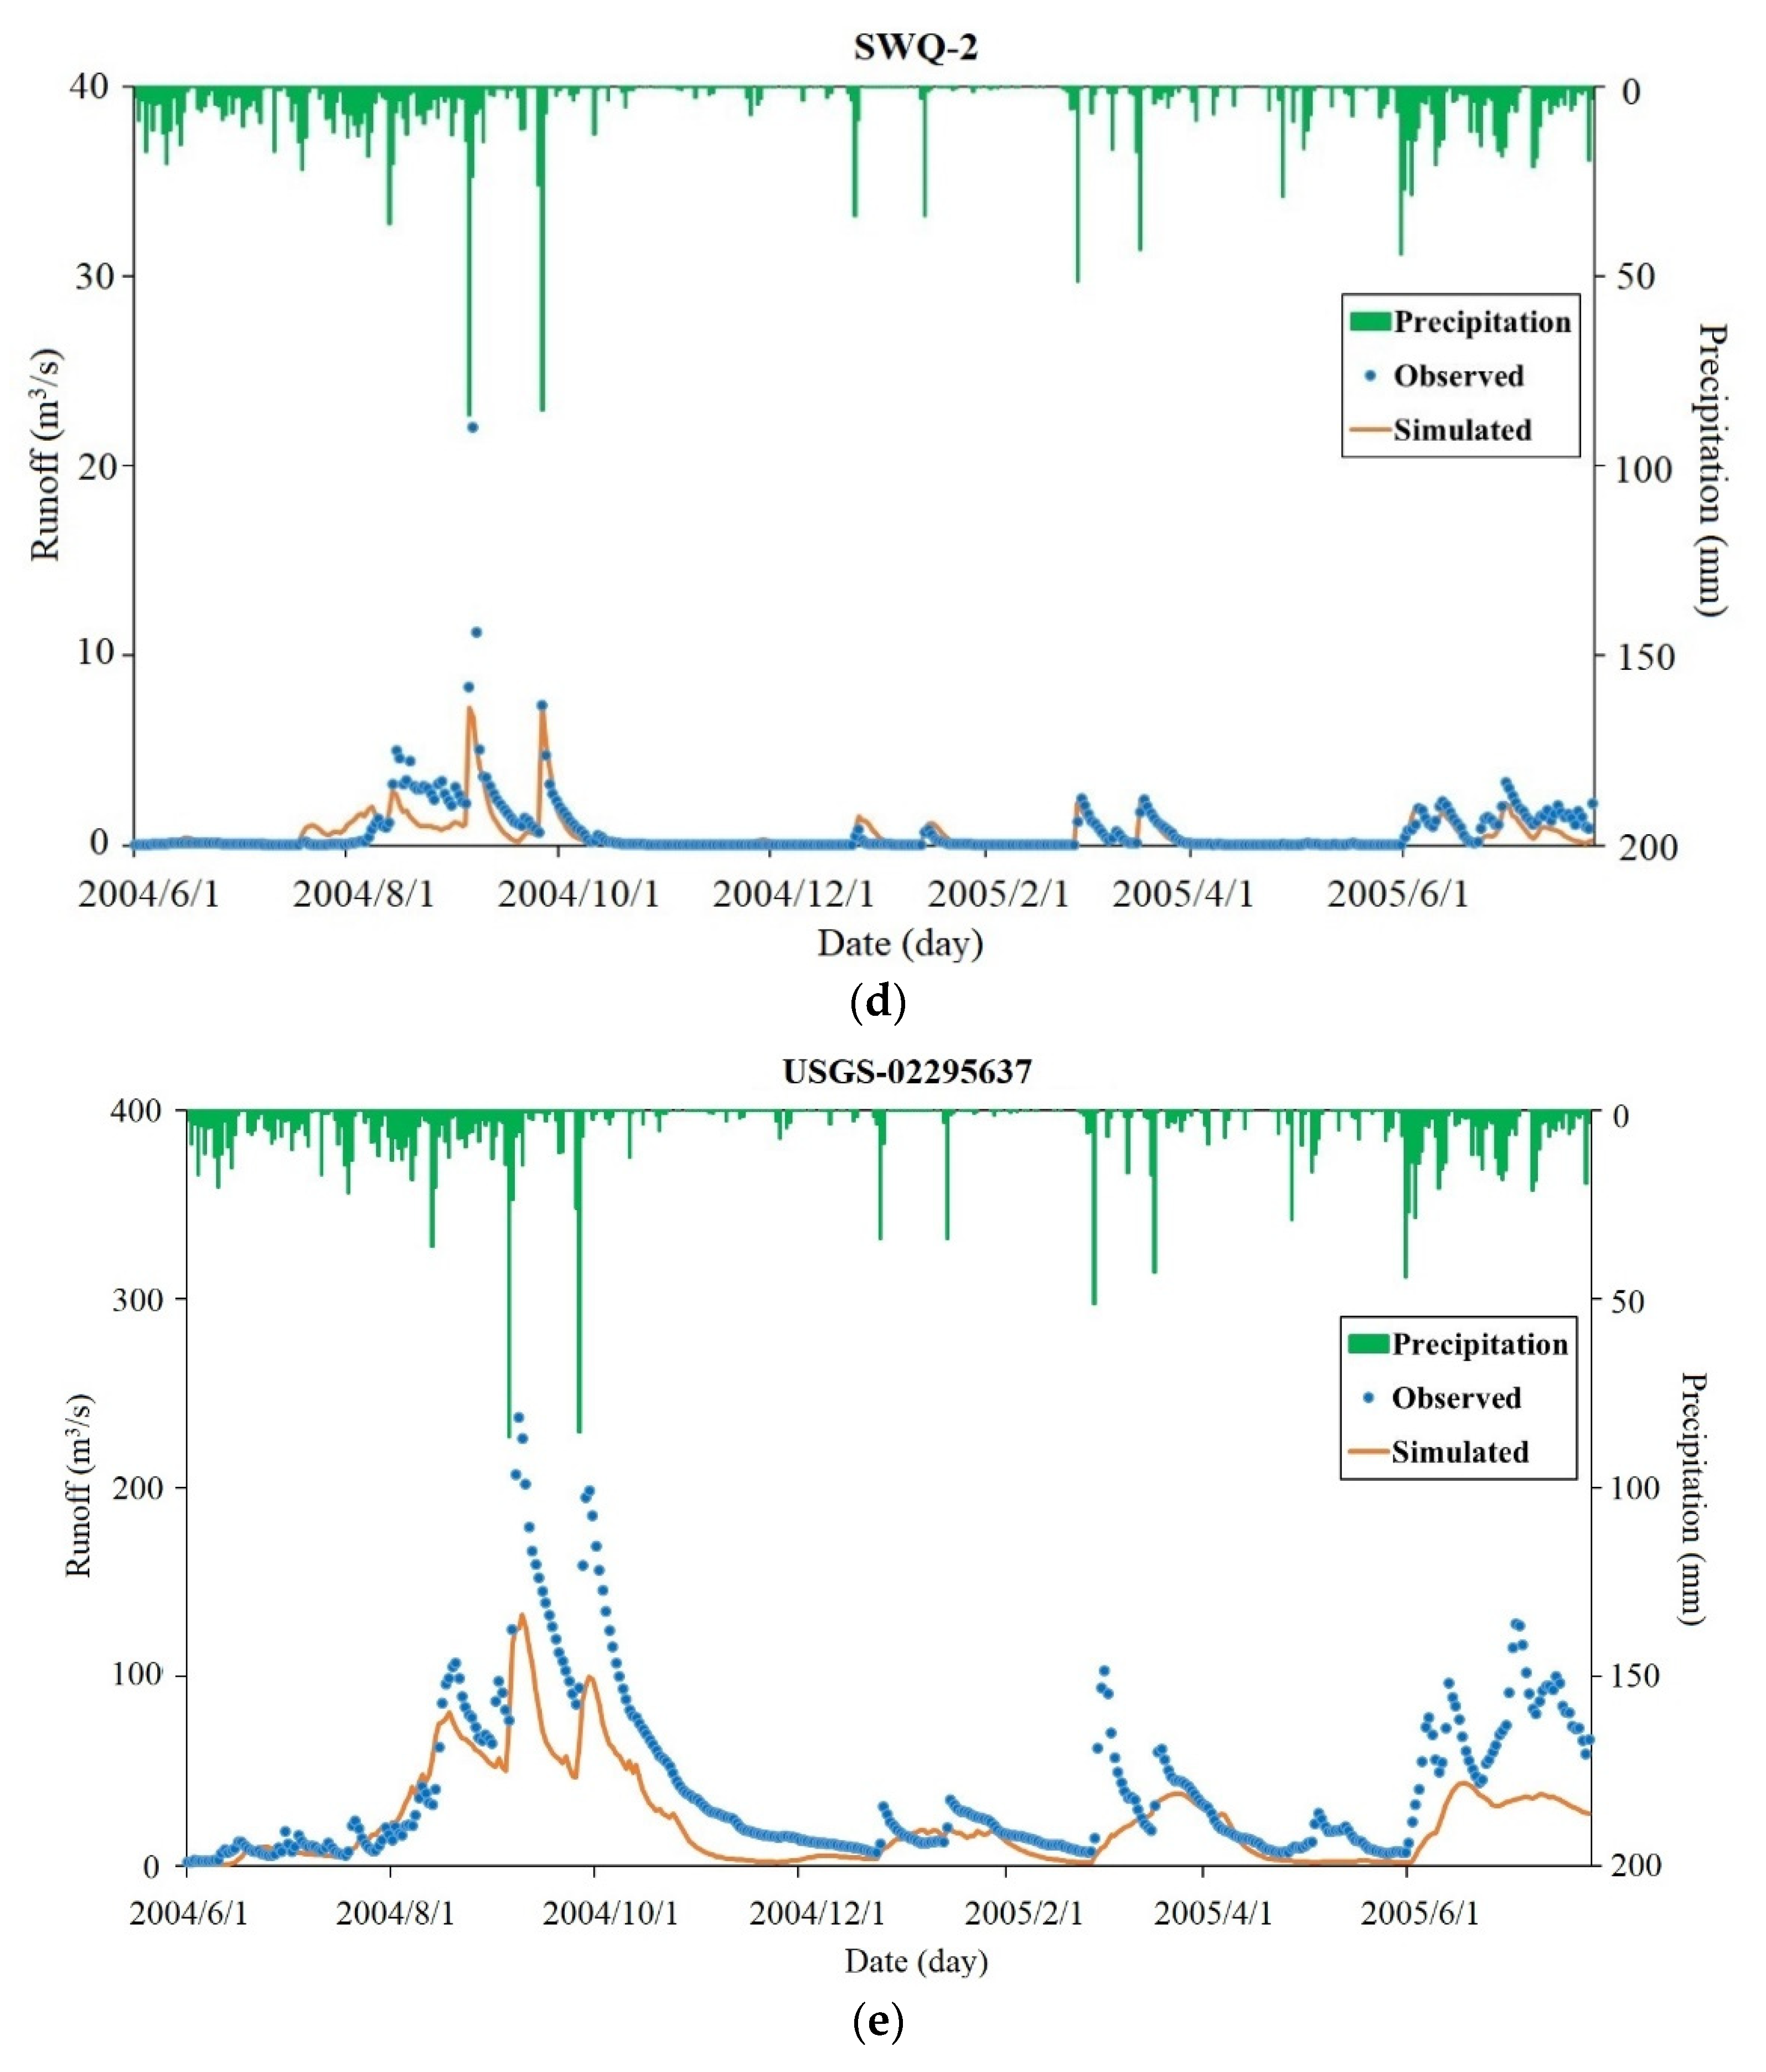
Phosphate mining in the Peace River Basin, which began in 2004, has been conducted mainly in the southeastern part of the basin. Thus, this study focused on an area of 69 km2 in this region (Figure 1). The daily flow data from five hydrological stations during the period of mining from June 2004 to July 2005 were used to create the SWAT model. We defined three scenarios: 2004 (pre-phosphorus mining, denoted as “pre”), 2006 (after phosphate mining, denoted as “post”), and 2014 (denoted as reclamation). Due to the short observation time (June 2004–July 2005, this study adopted a multi-site calibration method. Sites SW-4, SW-6, and SWQ-4 were selected from among the five sites for calibration, and sites SWQ-2 and outlet USGS02295637 were selected for verification (Figure 1). The daily runoff simulation results for the five sites are shown in Figure 6. The relevant evaluation indexes of the final simulation results of the model obtained by the SUFI-2 method are shown in Table 9, and the results fulfill the standards.
By using the calibrated SWAT model and retaining the meteorological and soil data as unchanged, a land use type map of the pre- and post-mining periods was substituted into the model to simulate the daily runoff of the five sites in the study area and to analyze the influence of the land use change caused by phosphate mining on the runoff. The simulated daily cumulative flow results for each site were calculated and are shown in Table 10.
As shown in Table 10, the flow at site SWQ-2 increased slightly (1.16%) after phosphate mining, indicating that the land use type of the site was basically unchanged. Notably, two of the five sites (SW-6 and SW-4) showed a flow increase of 34.6% and 29.47%, respectively. This may be due to an increase of 2.29 km2 in forest area and a decrease of 2.67 km2 in water area, resulting in a decrease in surface evaporation and an increase in runoff.
By contrast, the flow at the other two sites decreased significantly during the same period: USGS02295637 (outlet) by 44.14% and SWQ-4 by 23.45%. After phosphate mining, the water area and recharge decreased, leading to a decreased flow. As the mining land area increased (142.86%), surface water was trapped in the mining area during the mining process, reducing runoff. This situation must occur; otherwise, sand, silt, clay, pollutants, and other mining by-products flow downstream and reduce the water quality. In addition, pumping operations require a large amount of water, which contributes to the decomposition of ore and also leads to a reduction in surface runoff.
Table 10 shows that the runoff of four of the five sites was almost unchanged from post to reclamation. However, the flow of the outlet station (USGS02295637) in the basin decreased significantly during this period, by 105.82 m3/s. The area of mining land in 2014 was 10.39 km2 larger than that of the post, the area of cultivated land was decreased by 41.77 km2, and the total area of forest and grassland was increased by 29.61 km2. The decrease in cultivated land, corresponding to the decrease in irrigation water and the increase in vegetation area, is conducive to an increase in runoff, but the total discharge of the water outlet of the river basin was still significantly reduced, indicating that the continuous mining of phosphate rock had a great effect on the decrease in runoff of the river basin (surface water is retained in the mining area during the mining process; pumping operations require a lot of water).
In addition, from the pre- to post-mining period, the outlet site flow decreased by 44.14%, and SWQ-4 decreased by 23.45%. However, from the post-mining period to reclamation, the total water outlet flow decreased by 0.01%, and SWQ-4 decreased by 0.06%. The proportion of the decrease is lower because the decrease in cultivated land corresponds to the decrease in irrigation water, and the increase in vegetation area is conducive to the increase in runoff. In addition, it shows that reclamation and restoration are effective in restoring runoff.
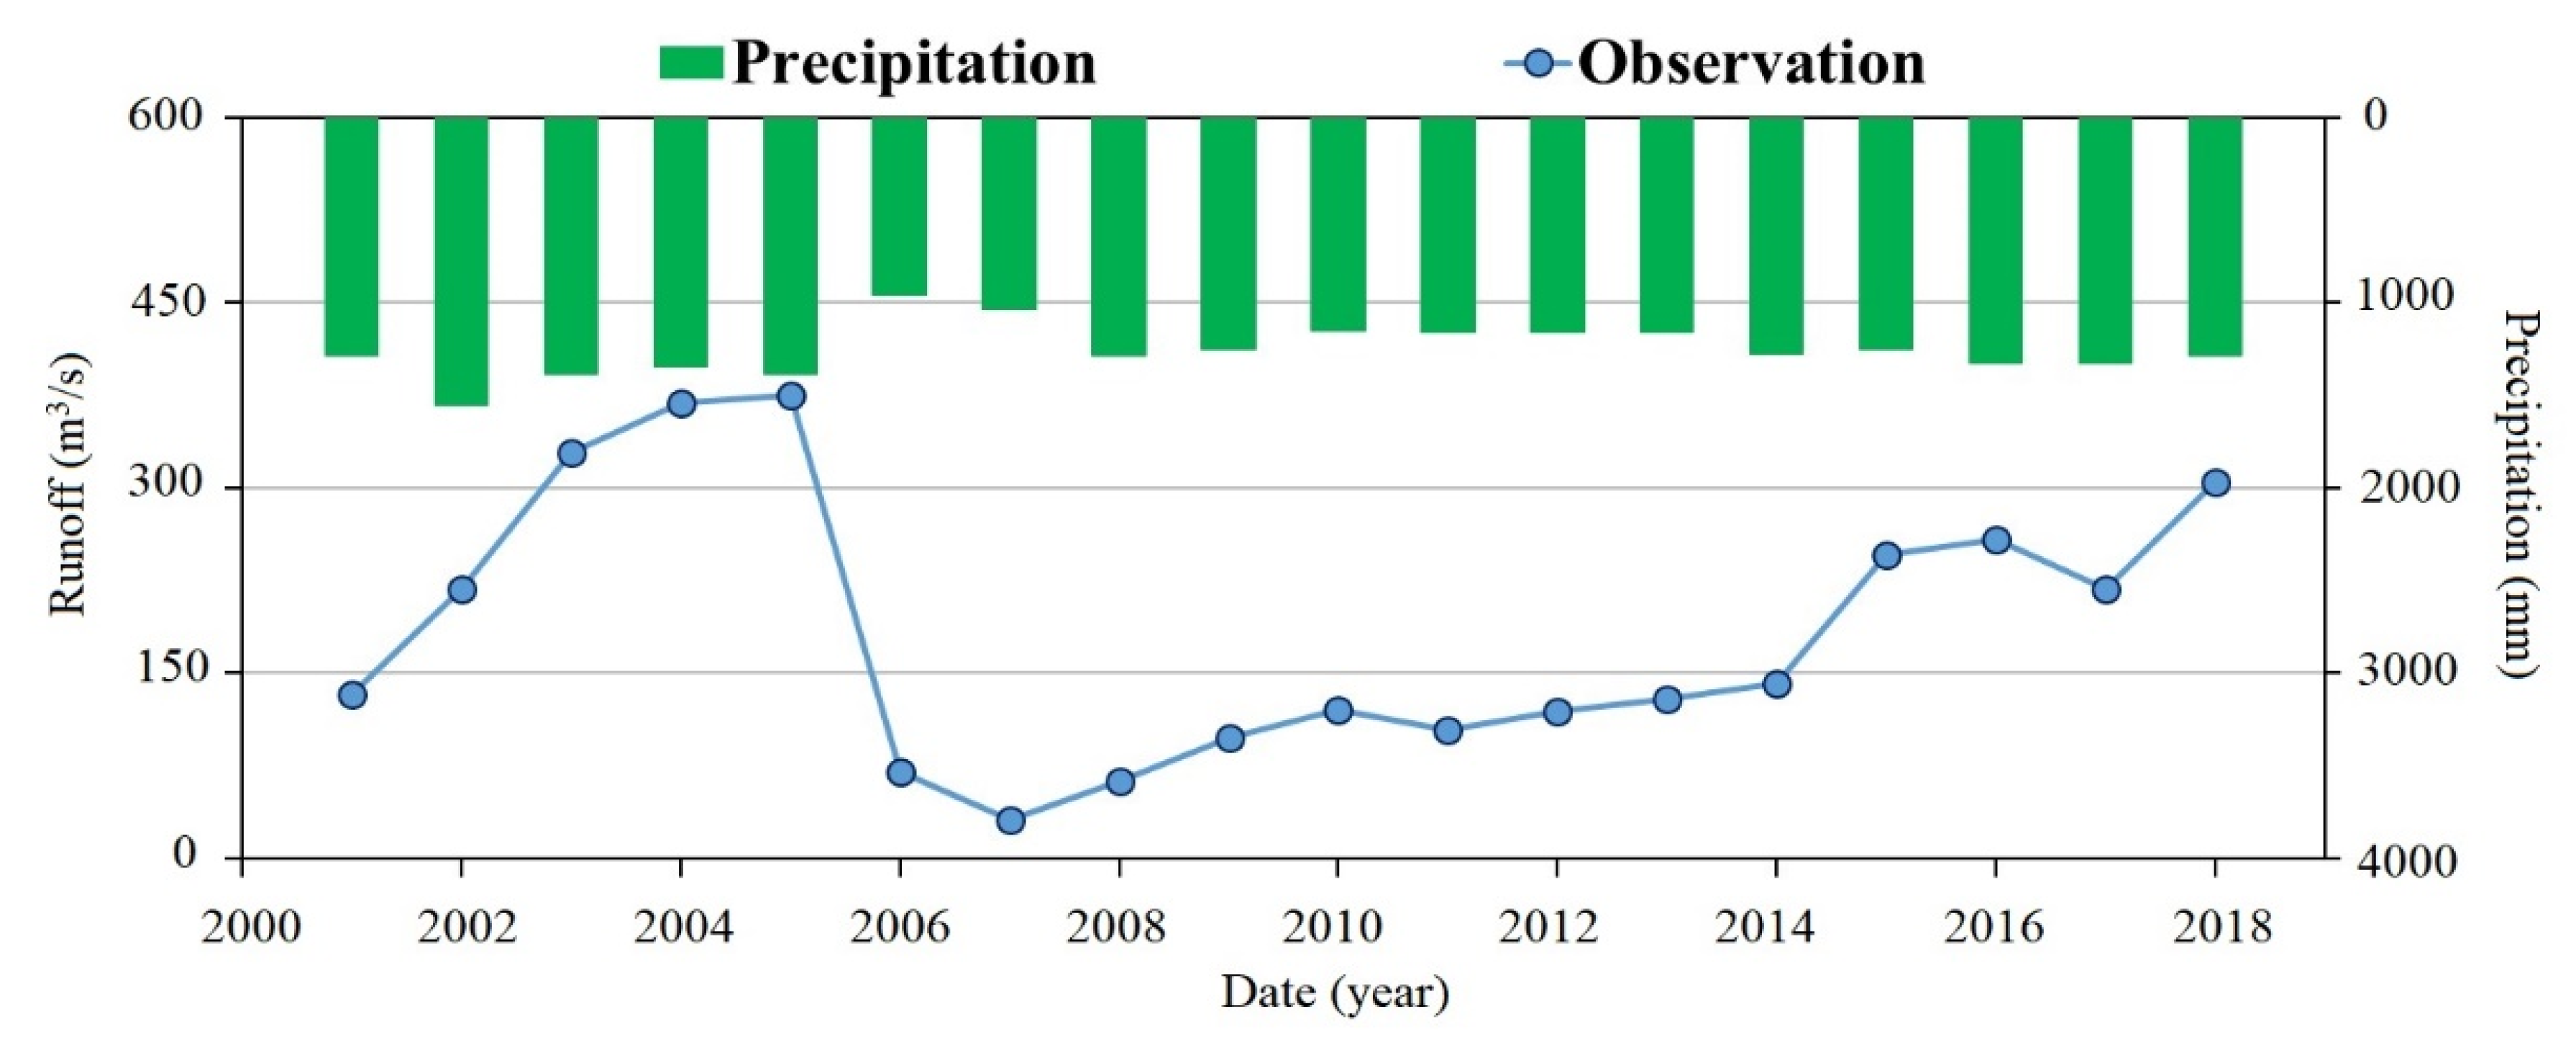
Figure 7 shows the annual runoff and precipitation at the total water outlet site from 2001 to 2018. Phosphate mining began in June of 2004. As shown in Figure 7, the runoff in 2004 (before phosphate mining) and 2005 (during phosphate mining) of the total water outlet site of the basin was greater than that in 2006 (after phosphate mining) and 2014. The runoff in 2006 was smaller than that in 2014, mainly because the rainfall in 2014 was higher than that in 2006, resulting in a corresponding increase in runoff. Overall, the runoff before 2005 (2001–2005) was greater than that after 2005 (2005–2018), indicating that the continuous mining of phosphate rock had a greater effect on reducing runoff in the river basin. After 2006, the runoff increased gradually because the decrease in irrigation water and the increase in vegetation area promoted an increase in runoff. Therefore, phosphate mining would lead to decreased runoff in river basins.
3.6. Effects of Land Use Change on the Total Phosphorus and Total Nitrogen Loads in the Phosphate Mining Area
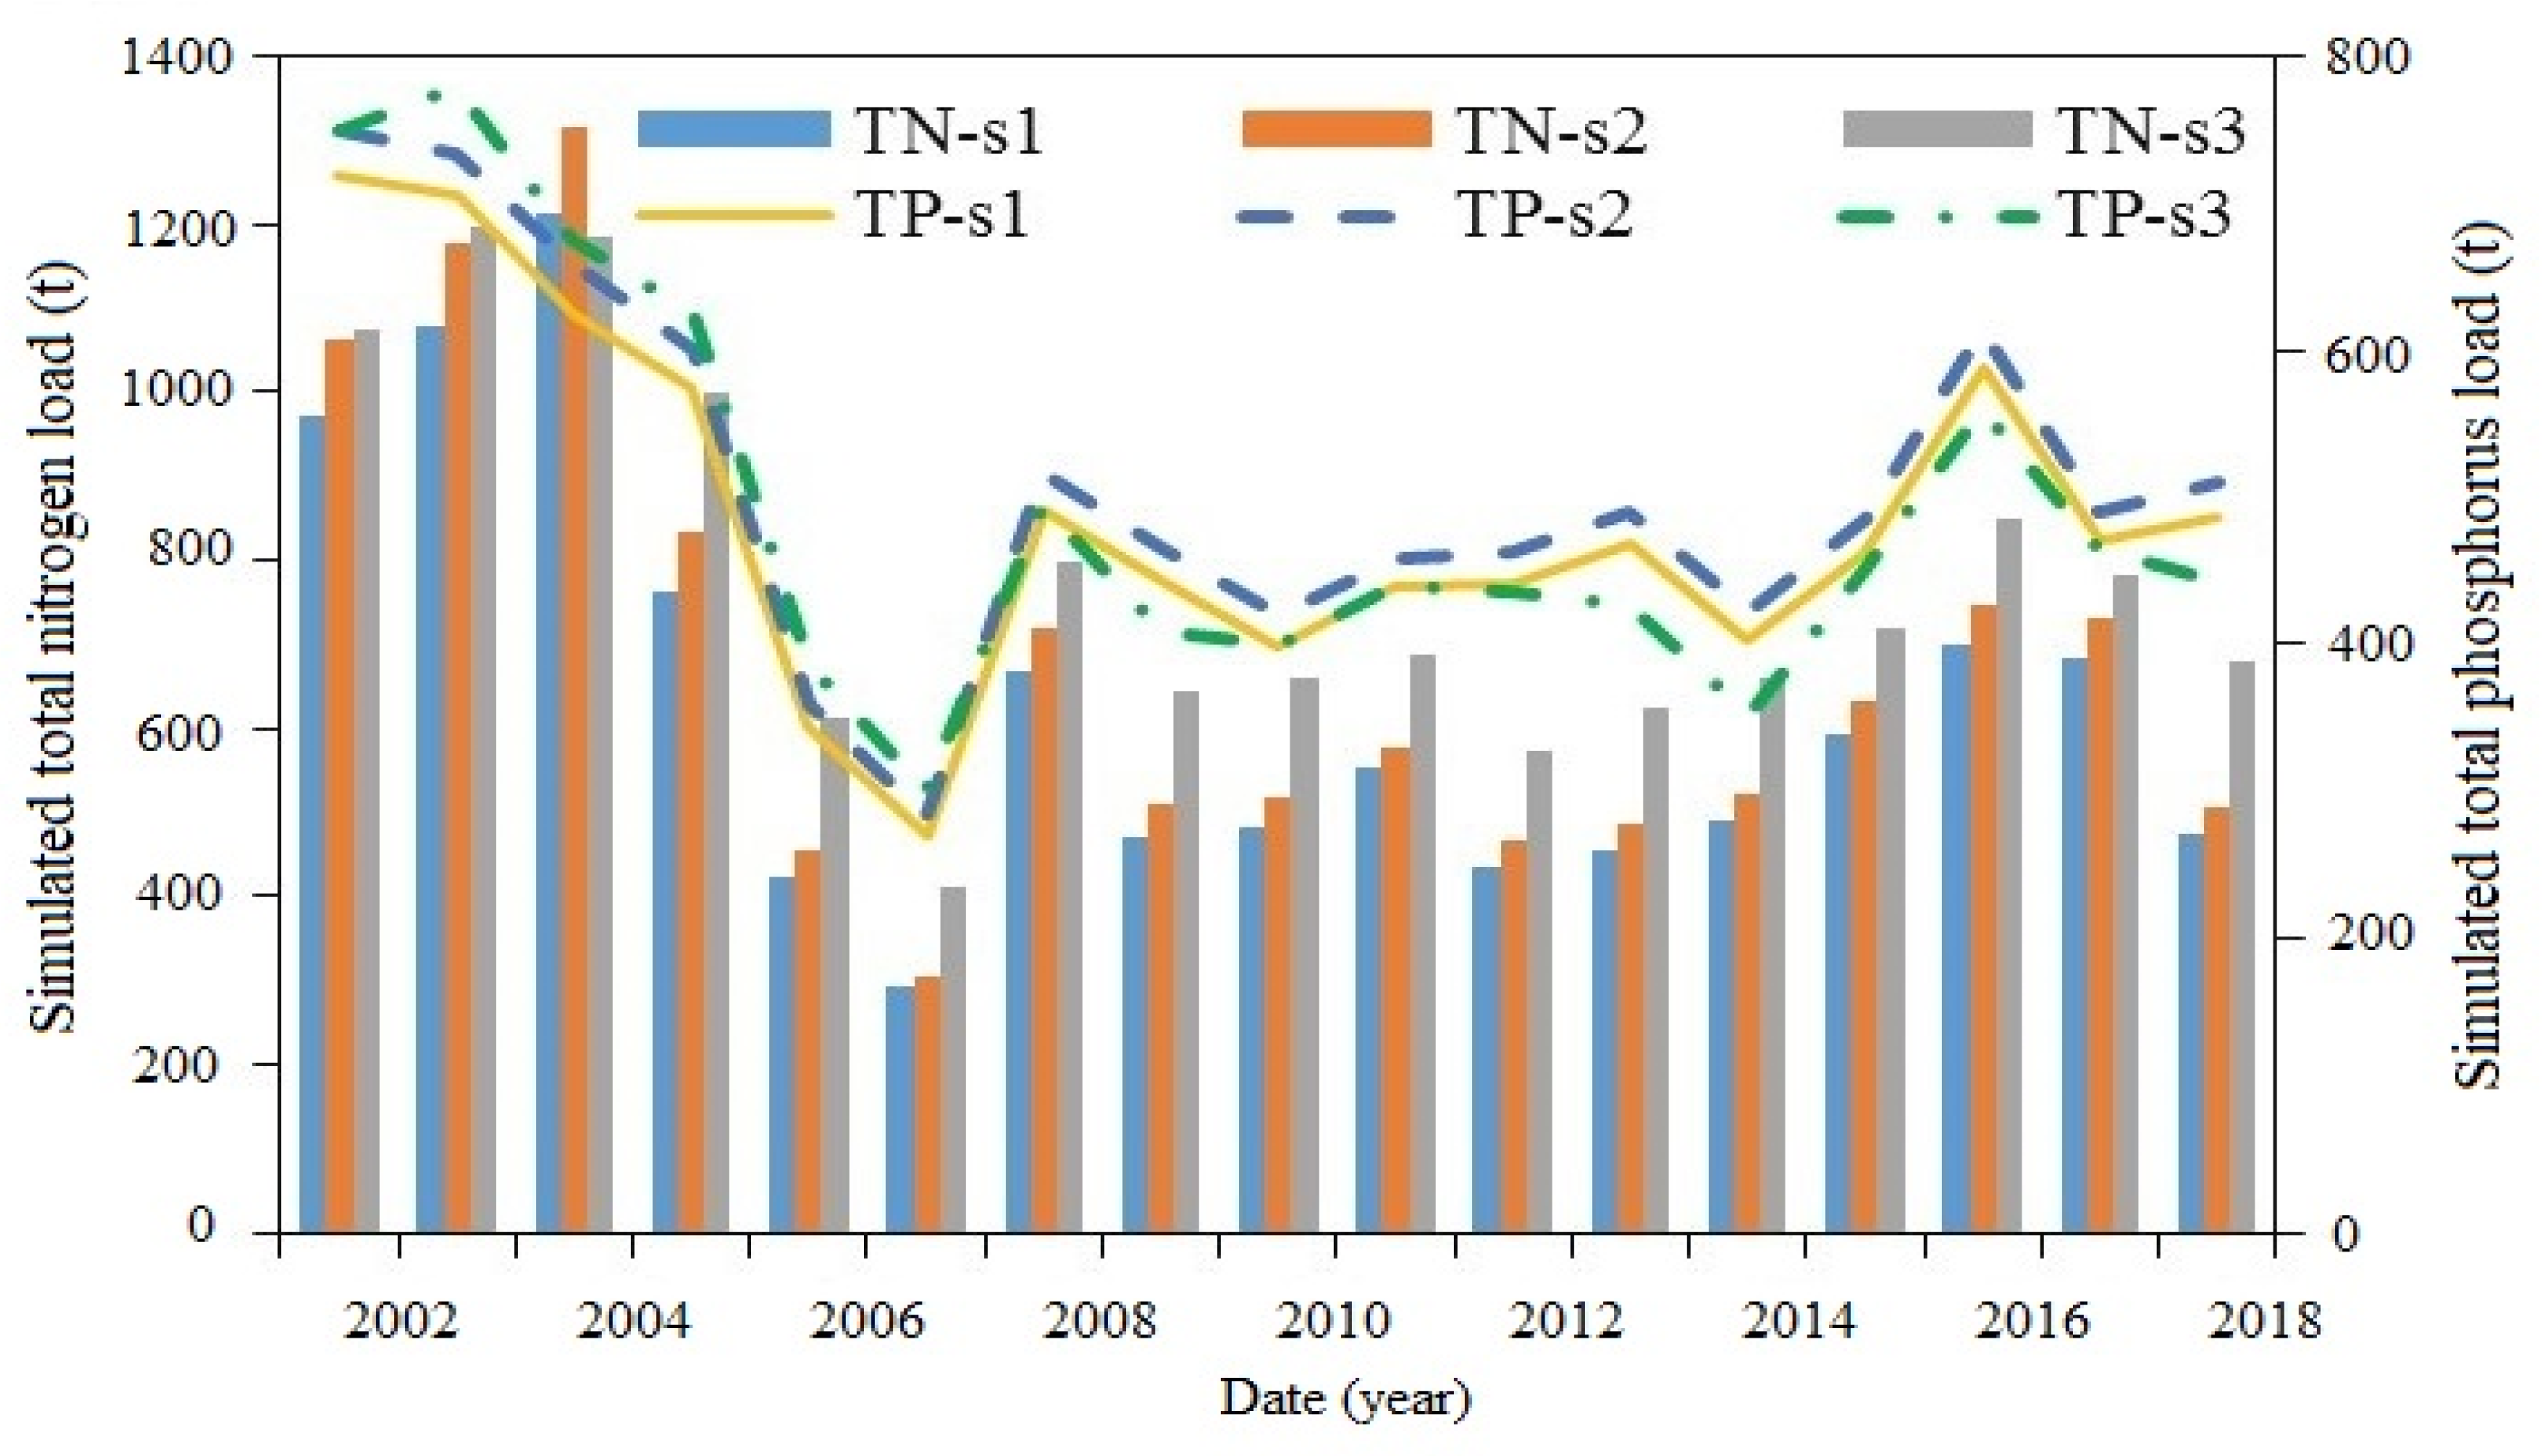
The TN and TP loads from 2001 to 2018 were simulated at the outlet, and the results fulfilled the requirements. Among these, the result of the GLUE method was better than that of SUFI-2; hence, the following sections use the simulation results obtained using the GLUE method. Using a calibrated SWAT model and maintaining the weather and soil data constant, we set the land use type map of 2004 as scenario 1 (s1), 2006 as scenario 2 (s2), and reclamation as scenario 3 (s3). The TN and TP loads in the study area from 2001 to 2018 were simulated, and the effects of land use change on these parameters were analyzed. The simulation results are shown in Figure 8. As shown in Figure 8, the multi-year TN load simulation results under the three scenarios were ranked as s1 < s2 < s3, and the multi-year TP load simulation results were s1 < s2 and s2 > s3.
From before to after phosphate mining (s1–s2), the forest area increased, the water area decreased, and the TN and TP loads increased. This occurred mainly because of the large amount of wastewater containing high concentrations of inorganic chemicals produced by phosphate mining being processed directly or spilled from the sedimentation tank into the stream, increasing the TN and TP loads in the river.
As the area of mining land continued to increase (s2–s3), the area of cultivated land decreased, and the total area of forest and grassland increased. The decrease in the TP load was mainly due to the decrease of arable land and urban areas, which leads to the reduction in the fertilization of agricultural land and urban parks as well as the reduction in domestic wastewater. Furthermore, vegetation absorbs nutrients, and the increase in forest and grassland areas reduces the dissolved pollutants in water. The increase in the TN load was mainly due to the increase in the mining area, which led to a continuous increase in the TN content of the discharged wastewater.
4. Conclusions
The Peace River is a critical water source in southwest Florida, United States. The watershed contains many phosphate mines that decrease water safety. Whether phosphate mining leads to a reduction in surface runoff and affects water quality in the Peace River Basin has been a highly controversial subject. Thus, the environmental impacts of phosphate mining in the Peace River were assessed. In this study, (1) the SWAT hydrological model was used to simulate the runoff and TN and TP loads at the outlet of the Peace River Basin from 2001 to 2018; (2) the applicability of four uncertainty methods (GLUE, ParaSol, PSO, and SUFI-2) in the hydrological simulation of the basin was assessed; (3) the runoff at five stations in the specified mining area was simulated to analyze the impacts of land use change caused by phosphate mining on the water environment; and (4) three scenario analyses (pre-mining [s1], post-mining [s2], and reclamation [s3]) were conducted to assess the effect of phosphate mining on water quality.
The results showed that (1) the simulation results of the SWAT model in the study area of runoff, TN and TP loads meet the requirements and have reasonable NSE and R2 values. (2) When simulating runoff, SUFI-2 and GLUE are better than the ParaSol and PSO methods; when simulating TN and TP loads, GLUE is better than the SUFI-2 method. (3) From before to after phosphate mining (pre–post), two of the five hydrological stations showed increased flow; at one station, the flow was almost unchanged, and the other two showed significantly reduced flow, with the flow at the outlet site decreasing by 44.14%. From post-mining to reclamation, the outlet flow of the basin decreased significantly, diminishing by 105.82 m3/s. Overall, the run-off before 2005 (2001–2005) was greater than the runoff after 2005 (2005–2018), indicating that continuous phosphate mining has significantly reduced the runoff in the basin. (4) Before and after phosphate mining (pre–post), the TN load simulation result is s1 < s2, and the TN load increased by 7.66%; the TP load simulation result is s1 < s2 and the TP load increased by 4.62%. This is mainly because a large amount of wastewater containing high concentrations of inorganic chemicals, which is produced during phosphate mining and processing, overflows directly or from the sedimentation tank into the river. From phosphate mining to reclamation (post-2014), the TN load simulation result was s2 < s3, and the TN load increased (13.80%), which was mainly due to the wastewater discharged during phosphate mining and processing. The TP load simulation result was s2 > s3, and the TP load decreased (3.50%), which was mainly due to the reduction in chemical fertilizers required by agricultural activities.
In summary, land use change affects the water environment. Through the analysis of land use change, it was proven that the change of water environment is mainly affected by human activities, and human activities mainly affect the water environment through phosphate mining. The simulation results show that phosphate mining has a large impact on changes in runoff and pollutants. Therefore, government management departments should be more cautious when issuing mining licenses to phosphate rock companies. At the same time, they should strengthen day-to-day supervision of the mining and reclamation processes. In addition, a scientific long-term plan for water resource protection should be formulated as early as possible to ensure the safety of water for production and domestic use.
5. Future
The results of this study provide two resources: a reference pertinent to the debate on whether phosphate mining reduces surface water flow and affects the polluted water environment and a basis for the management of phosphate mining activities and water resource protection planning.
Author Contributions
Conceptualization, J.Z.; methodology, J.Z.; software, Y.S. and M.L.; validation, M.L.; formal analysis, M.L.; resources, J.Z.; writing—original draft preparation, M.L.; writing—review and editing, J.Z. and Y.S.; supervision, J.Z. All authors have read and agreed to the published version of the manuscript.
Funding
This research was funded by the National Natural Science Foundation of China, grant number 41271004.
Institutional Review Board Statement
Not applicable.
Informed Consent Statement
Not applicable.
Data Availability Statement
Some or all data, models, or code that support the findings of this study are available from the corresponding author upon reasonable request.
Conflicts of Interest
The authors declare no conflict of interest.
References
- Magnan, A.; Duvat, V. Phosphate mining risks atoll culture. Nature 2015, 522, 156. [Google Scholar] [CrossRef] [PubMed] [Green Version]
- Cui, R.; Zhang, Y.; Guo, J.; Guo, Z.; Xiao, Y. Development strategy of phosphate rock in China under global allocation of resources. Strateg. Study Chin. Acad. Eng. 2019, 21, 128–132. [Google Scholar] [CrossRef]
- Yang, Y.Y.; Wu, H.N.; Shen, S.L.; Horpibulsuk, S.; Xu, Y.S.; Zhou, Q.H. Environmental impacts caused by phosphate mining and ecological restoration: A case history in Kunming, China. Nat. Hazards 2014, 74, 755–770. [Google Scholar] [CrossRef]
- Pan, S.; Liu, D.; Wang, Z.; Zhao, Q.; Zou, H.; Hou, Y.; Liu, P.; Xiong, L. Runoff Responses to Climate and Land Use/Cover Changes under Future Scenarios. Water 2017, 9, 475. [Google Scholar] [CrossRef] [Green Version]
- Lamoreaux, P.E. Water Development for Phosphate Mining in a Karst Setting in Florida-A Complex Environmental Problem. Environ. Geol. Water Sci. 1989, 14, 117–153. [Google Scholar] [CrossRef]
- Kuo, Y.M.; Muñoz-Carpena, R. Simplified modeling of phosphorus removal by vegetative filter strips to control runoff pollution from phosphate mining areas. J. Hydrol. 2009, 378, 343–354. [Google Scholar] [CrossRef]
- Liu, Y.; Li, H.; Cui, G.; Cao, Y. Water quality attribution and simulation of non-point source pollution load flux in the Hulan River basin. Sci. Rep. 2020, 10, 3012. [Google Scholar] [CrossRef] [Green Version]
- Wang, K.; Lin, Z.; Zhang, R. Impact of phosphate mining and separation of mined materials on the hydrology and water environment of the Huangbai River basin, China. Sci. Total Environ. 2016, 543, 347–356. [Google Scholar] [CrossRef]
- Reta, G.; Dong, X.; Li, Z.; Su, B.; Hu, X.; Bo, H.; Yu, D.; Wan, H.; Liu, J.; Li, Y.; et al. Environmental impact of phosphate mining and beneficiation: Review. J. Hydrol. 2018, 2, 424–431. [Google Scholar] [CrossRef] [Green Version]
- Beavers, C.; Ellis, R.; Hanlon, C.D.E.; MacDonald, G. An overview of Phosphate Mining and Reclamation in Florida. Master’s Thesis, University of Florida, Gainesville, FL, USA, 2013. [Google Scholar]
- Phosphate|Florida Department of Environmental Protection. Available online: https://floridadep.gov/water/mining-mitigation/content/phosphate (accessed on 21 February 2022).
- Murphy, K.E.; Rains, M.C.; Kittridge, M.G.; Stewart, M.T.; Ross, M.A. Hydrology of Clay Settling Areas and Surrounding Landscapes in the Phosphate Mining District, Peninsular Florida 1. J. Am. Water Resour. Assoc. 2008, 44, 980–995. [Google Scholar]
- Pechenik, N. Lateral Macropore Dominated Flow on a Clay Settling Area in the Phosphate Mining District, Peninsular Florida. Master’s Thesis, University of South Florida, Tampa, FL, USA, 2009. [Google Scholar]
- Duan, S.; Banger, K.; Toor, G.S. Evidence of Phosphate Mining and Agriculture Influence on Concentrations, Forms, and Ratios of Nitrogen and Phosphorus in a Florida River. Water 2021, 13, 1064. [Google Scholar] [CrossRef]
- Brown, M.T. Landscape restoration following phosphate mining: 30 years of co-evolution of science, industry and regulation. Ecol. Eng. 2005, 24, 309–329. [Google Scholar] [CrossRef]
- Zhang, J.; Ross, M. Hydrologic modeling impacts of post-mining land use changes on streamflow of Peace River, Florida. Chin. Geogr. Sci. 2015, 25, 728–738. [Google Scholar] [CrossRef] [Green Version]
- Peace River and Phosphate Mining. Available online: http://www.sarasota.wateratlas.usf.edu/upload/documents/EndangeredPeaceRiver.pdf (accessed on 21 February 2022).
- Kelly, M. Florida River Flow Patterns and the Atlantic Multidecadal Oscillation. River Res. Appl. 2008, 24, 598–616. [Google Scholar] [CrossRef]
- Lewelling, B.R.; Tihansky, A.B.; Kindinger, J.L. Assessment of the Hydraulic Connection between Ground Water and the Peace River, West-Central Florida; US Geological Survey: Reston, VA, USA, 1998.
- Hammett, K.M. Land Use, Water Use, Streamflow Characteristics, and Water-Quality Characteristics of the Charlotte Harbor Inflow Area, Florida; USGPO: Washington, DC, USA, 1990.
- Smyntek, P.M.; Lamagna, N.; Cravotta, C.A., III; Strosnider, W.H. Mine drainage precipitates attenuate and conceal wastewater-derived phosphate pollution in stream water. Sci. Total Environ. 2022, 815, 152672. [Google Scholar] [CrossRef]
- Gabay, T.; Rotem, G.; Gillor, O.; Ziv, Y. Understanding changes in biocrust communities following phosphate mining in the Negev Desert. Environ. Res. 2022, 207, 112200. [Google Scholar] [CrossRef]
- Gbedzi, D.D.; Ofosu, E.A.; Mortey, E.M.; Mortey, E.M.; Obiri-Yeboah, A.; Nyantakyi, K.E.; Siabi, E.K.; Abdallah, F.; Domfeh, M.K.; Amankwah-Minkah, A. Impact of mining on land use land cover change and water quality in the Asutifi North District of Ghana, West Africa. Environ. Chall. 2022, 6, 100441. [Google Scholar] [CrossRef]
- Siddiqui, A.U.; Jain, M.K. Change analysis in land use land cover due to surface mining in Jharia coalfield through Landsat time series data. Mater. Today Proc. 2022, 49, 3462–3468. [Google Scholar] [CrossRef]
- Khare, D.; Patra, D.; Mondal, A.; Kundu, S. Impact of landuse/land cover change on run-off in the catchment of a hydro power project. Appl. Sci. 2017, 7, 787–800. [Google Scholar] [CrossRef]
- Rogger, M.; Agnoletti, M.; Alaoui, A.; Bathurst, J.C.; Bodner, G.; Borga, M.; Chaplot, V.; Gallart, F.; Glatzel, G.; Hall, J.; et al. Land use change impacts on floods at the catchment scale: Challenges and opportunities for future research. Water Resour. Res. 2017, 53, 5209–5219. [Google Scholar] [CrossRef] [Green Version]
- Guzha, A.C.; Rufino, M.C.; Okoth, S.; Jacobs, S.; Nóbrega, R.L.B. Impacts of land use and landcover change on surface runoff, discharge and low flows: Evidence from East Africa. J. Hydrol. Reg. Stud. 2018, 15, 49–67. [Google Scholar] [CrossRef]
- Neitsch, S.L.; Arnold, J.G.; Kiniry, J.R.; Williams, J.R. Soil and Water Assessment Tool Theoretical Documentation Version 2009; Texas Water Resources Institute: College Station, TX, USA, 2011. [Google Scholar]
- Dile, Y.T.; Daggupati, P.; George, C.; Srinivasan, R.; Arnold, J. Introducing a new open source GIS user interface for the SWAT model. Environ. Model. Softw. 2016, 85, 129–138. [Google Scholar] [CrossRef]
- Fukunaga, D.C.; Cecílio, R.A.; Zanetti, S.S.; Oliveira, L.T.; Caiado, M.A.C. Application of the SWAT hydrologic model to a tropical watershed at Brazil. Catena 2015, 125, 206–213. [Google Scholar] [CrossRef]
- Martinez-Escobar, D.F.; Mallela, J. Assessing the impacts of phosphate mining on coral reef communities and reef development. Sci. Total Environ. 2019, 692, 1257–1266. [Google Scholar] [CrossRef] [PubMed]
- Samreen, S.; Kausar, S. Phosphorus Fertilizer: The original and commercial sources. In Phosphorus-Recovery and Recycling; Springer Nature: Berlin/Heidelberg, Germany, 2019; pp. 1–14. [Google Scholar]
- Tihansky, A.B. Sinkholes, west-central Florida. Land Subsid. United States US Geol. Surv. Circ. 1999, 1182, 121–140. [Google Scholar]
- America’s Most Endangered Rivers of 2004. Available online: https://www.americanrivers.org/wp-content/uploads/2016/02/2004-mer-report.pdf (accessed on 21 February 2022).
- LPDAAC—Homepage. Available online: https://lpdaac.usgs.gov/ (accessed on 21 February 2022).
- Southwest Florida Water Management District Geospatial Open Data Portal. Available online: https://data-swfwmd.opendata.arcgis.com/ (accessed on 21 February 2022).
- Global Data|SWAT|Soil & Water Assessment Tool. Available online: https://swat.tamu.edu/data/ (accessed on 21 February 2022).
- NASA POWER|Prediction of Worldwide Energy Resources. Available online: https://power.larc.nasa.gov/ (accessed on 21 February 2022).
- USGS Water Data for the Nation. Available online: https://waterdata.usgs.gov/nwis (accessed on 21 February 2022).
- Arnold, J.G.; Williams, J.R.; Srinivasan, R.; King, K.W. Soil and Water Assessment Tool; Soil and Water Research Laboratory: Temple, TX, USA, 1996; p. 808. [Google Scholar]
- Abbaspour, K.C.; Rouholahnejad, E.; Vaghefi, S.; Srinivasan, R.; Yang, H.; Kløve, B. A continental-scale hydrology and water quality model for Europe: Calibration and uncertainty of a high-resolution large-scale SWAT model. J. Hydrol. 2015, 524, 733–752. [Google Scholar] [CrossRef] [Green Version]
- Rostamian, R.; Jaleh, A.; Afyuni, M.; Mousavi, S.F.; Heidarpour, M.; Jalalian, A.; Abbaspour, K.C. Application of a SWAT model for estimating runoff and sediment in two mountainous basins incentral Iran. Hydrol. Sci. J. 2008, 53, 977–988. [Google Scholar] [CrossRef]
- Sloboda, M.; Swayne, D. Autocalibration of environmental process models using a PAC learning hypothesis. In International Symposium on Environmental Software Systems; Springer: Berlin/Heidelberg, Germany, 2011; pp. 528–534. [Google Scholar]
- Khoi, D.N.; Thom, V.T. Parameter uncertainty analysis for simulating streamflow in a river catchment of Vietnam. Glob. Ecol. Conserv. 2015, 4, 538–548. [Google Scholar] [CrossRef] [Green Version]
- Van, G.A.; Meixner, T.A. Global and efficient multi-objective auto-calibration and uncertainty estimation method for water quality catchment models. J. Hydroinformatics 2007, 9, 277–291. [Google Scholar]
- Li, C. Particle Swarm Optimization in Stationary and Dynamic Environments. Ph.D. Thesis, University of Leicester, Leicester, UK, 2011. [Google Scholar]
- López, E.; Bocco, G.; Mendoza, M.; Duhau, E. Predicting land-cover and land-use change in the urban fringe a case in Morelia city, Mexico. Landsc. Urban Plan. 2001, 55, 271–285. [Google Scholar] [CrossRef]
- Liu, B.; Pan, L.; Qi, Y.; Guan, X.; Li, J. Land Use and Land Cover Change in the Yellow River Basin from 1980 to 2015 and Its Impact on the Ecosystem Services. Land 2021, 10, 1080. [Google Scholar] [CrossRef]
- Azócar, G.; Romero, H.; Sanhueza, R.; Vega, C.; Aguayo, M.; Muñoz, M.D. Urbanization patterns and their impacts on social restructuring of urban space in Chilean mid-cities: The case of Los Angeles, Central Chile. Land Use Policy 2007, 24, 199–211. [Google Scholar] [CrossRef]
- Zhu, H.Y.; Li, X.B. Discussion on the method of regional land use change index model. Acta Geogr. Sinica 2003, 58, 643–650. [Google Scholar]
- Vaghefi, S.A.; Mousavi, S.J.; Abbaspour, K.C.; Srinivasan, R.; Yang, H. Analyses of the impact of climate change on water resources components, drought and wheat yield in semiarid regions: Karkheh River Basin in Iran. Hydrol. Process. 2014, 28, 2018–2032. [Google Scholar] [CrossRef]
- Chen, H.; Luo, Y.; Potter, C.; Moran, P.J.; Grieneisen, M.L.; Zhang, M. Modeling pesticide diuron loading from the San Joaquin watershed into the Sacramento-San Joaquin Delta using SWAT. Water Res. 2017, 121, 374–385. [Google Scholar] [CrossRef]
- Abbaspour, K.C. SWAT-CUP-2012. In SWAT Calibration and Uncertainty Program—A User Manual; Swiss Federal Institute of Aquatic Science and Technology: Dübendorf, Switzerland, 2012. [Google Scholar]
- Arnold, J.G.; Moriasi, D.N.; Gassman, P.W.; Abbaspour, K.C.; White, M.J.; Srinivasan, R.; Santhi, C.; Harmel, R.D.; van Griensven, A.; Van Liew, M.W. SWAT: Model use, calibration, and validation. Trans. ASABE 2012, 55, 1491–1508. [Google Scholar] [CrossRef]
- Xue, L.; Yang, F.; Yang, C.; Wei, G.; Li, W.; He, X. Hydrological simulation and uncertainty analysis using the improved TOPMODEL in the arid Manas River basin, China. Sci. Rep. 2018, 8, 4512–4521. [Google Scholar] [CrossRef] [Green Version]
Figure 1.
Location of (a) the phosphate mine and sites in study area, (b) the Peace River Basin in Florida, and (c) the study area in the Peace River Basin.
Figure 1.
Location of (a) the phosphate mine and sites in study area, (b) the Peace River Basin in Florida, and (c) the study area in the Peace River Basin.


Figure 2.
Outlet site USGS02295637 in the calibration (2001–2014) and validation (2015–2018) periods: (a) observation and simulation runoff; (b) behavior parameter probability density distributions of the four uncertainty methods: the sequential uncertainty fitting version (SUFI-2), generalized likelihood uncertainty estimation (GLUE), parameter solutions (ParaSol), and particle swarm optimization (PSO).


Figure 3.
Simulation results of (a) total nitrogen load in calibration period and (b) total nitrogen load in verification period and (c) total phosphorus load in calibration period and (d) total nitrogen load in verification period at the outlet (USGS02295637).
Figure 3.
Simulation results of (a) total nitrogen load in calibration period and (b) total nitrogen load in verification period and (c) total phosphorus load in calibration period and (d) total nitrogen load in verification period at the outlet (USGS02295637).


Figure 4.
Probability density distributions of behavioral parameters for (a) total nitrogen load during calibration and (b) total nitrogen load loading during validation and (c) total phosphorus load during calibration and (d) total phosphorus load during validation.
Figure 4.
Probability density distributions of behavioral parameters for (a) total nitrogen load during calibration and (b) total nitrogen load loading during validation and (c) total phosphorus load during calibration and (d) total phosphorus load during validation.

Figure 5.
Behavior parameter correlation graph of (a) the total nitrogen load and (b) the total phosphorus load with the GLUE method (20,000 runs).
Figure 5.
Behavior parameter correlation graph of (a) the total nitrogen load and (b) the total phosphorus load with the GLUE method (20,000 runs).

Figure 6.
Daily runoff simulation of the five sites (a) SW-4, (b) SW-6, (c) SWQ-4, (d) SWQ-2, and (e) USGS-02295637.
Figure 6.
Daily runoff simulation of the five sites (a) SW-4, (b) SW-6, (c) SWQ-4, (d) SWQ-2, and (e) USGS-02295637.


Figure 7.
Annual runoff and precipitation at the outlet site from 2001 to 2018.

Figure 8.
Interannual variation of the simulated total nitrogen and total phosphorus loads under the three land use scenarios.
Figure 8.
Interannual variation of the simulated total nitrogen and total phosphorus loads under the three land use scenarios.


Table 1.
Data required for model operation and their sources.
| Data Type | Source | Format |
|---|---|---|
| Digital elevation model (DEM) data | Land Processes Distributed, NASA (30 m resolution) [35] | GRID |
| Land use data | Florida Southwest Water Management District (SWFWMD) [36] | GRID |
| Soil type data | SWAT US SSURGO Soils Database [37] | GRID |
| Meteorological data | NASA POWER Project [38] | TXT |
| Hydrological data | US Geological Survey (USGS) [39] | TXT |
Table 2.
Results of the parametric sensitivity analysis.
| Parameter Name | Physical Meaning | Modification | Ranges | T-Stat | p-Value | Order |
|---|---|---|---|---|---|---|
| GW_DELAY | Groundwater delay time | v | 0~150 | −68.63 | 0.00 | 1 |
| CH_K2 | Effective hydraulic conductivity in main channel alluvium | v | 0~350 | 48.04 | 0.00 | 2 |
| ALPHA_BF | Baseflow alpha factor | v | 0.4~1 | −25.19 | 0.00 | 3 |
| HRU_SLP | Average slope steepness | v | 0~0.05 | −12.10 | 0.00 | 4 |
| CN2 | Initial SCS runoff curve number for moisture condition II | r | −1~−0.2 | 3.18 | 0.00 | 5 |
| ESCO | Soil evaporation compensation factor | v | 0.1~0.5 | 2.15 | 0.03 | 6 |
| SLSUBBSN | Average slope length | r | 0~1 | 2.06 | 0.04 | 7 |
| SOL_AWC | Available water capacity of the soil layer | r | 0.5~1 | −1.14 | 0.26 | 8 |
v means to replace the existing parameter value with the given value, r means to multiply the existing parameter value by (1 + a given value).
Table 3.
Evaluation indexes of the simulation results in the calibration period (2001–2014) and the validation period (2015–2018).
Table 3.
Evaluation indexes of the simulation results in the calibration period (2001–2014) and the validation period (2015–2018).
| Index | Period | SUFI-2 | PSO | GLUE | ParaSol |
|---|---|---|---|---|---|
| Nash–Sutcliffe efficiency coefficient (NSE) | calibration validation | 0.65 | 0.65 | 0.65 | 0.64 |
| 0.76 | 0.68 | 0.70 | 0.67 | ||
| Determination coefficient (R2) | calibration validation | 0.65 | 0.65 | 0.65 | 0.66 |
| 0.79 | 0.76 | 0.77 | 0.77 | ||
| p-factor | calibration validation | 0.51 | 0.33 | 0.48 | 0.26 |
| 0.46 | 0.31 | 0.29 | 0.25 | ||
| r-factor | calibration validation | 0.45 | 0.44 | 0.23 | 0.24 |
| 0.42 | 0.38 | 0.16 | 0.23 |
Table 4.
Evaluation indexes of the total nitrogen and total phosphorus load simulation results.
| Uncertainty Method | Index | Period | Total Nitrogen Load | Total Phosphorus Load |
|---|---|---|---|---|
| SUFI-2 | NSE | calibration validation | 0.62 | 0.6 |
| 0.75 | 0.76 | |||
| R2 | calibration validation | 0.63 | 0.6 | |
| 0.75 | 0.75 | |||
| GLUE | NSE | calibration validation | 0.64 | 0.6 |
| 0.76 | 0.75 | |||
| R2 | calibration validation | 0.66 | 0.6 | |
| 0.77 | 0.77 |
Table 5.
Land use types in the study area.
| Year | Urban | Mining Land | Cultivated | Grassland | Forest | Water Area | |
|---|---|---|---|---|---|---|---|
| Area/km2 | Pre | 5.42 | 0.28 | 50.85 | 0.5 | 1.93 | 10.26 |
| Post | 5.23 | 0.68 | 51.48 | 0.04 | 4.22 | 7.59 | |
| Reclamation | 5.13 | 11.07 | 9.71 | 29.53 | 4.34 | 9.45 | |
| Proportion/% | Pre | 7.83 | 0.4 | 73.44 | 0.72 | 2.79 | 14.82 |
| Post | 7.55 | 0.98 | 74.35 | 0.06 | 6.09 | 10.96 | |
| Reclamation | 7.41 | 15.99 | 14.03 | 42.65 | 6.27 | 13.65 |
Table 6.
Change in land use types.
| Land Use Type | Pre–Post | Post–Reclamation | ||
|---|---|---|---|---|
| Changed Area/km2 | Variation Range/% | Changed Area/km2 | Variation Range/% | |
| Urban | −0.19 | −3.51 | −0.1 | −1.91 |
| Mining land | 0.4 | 142.86 | 10.39 | 1527.94 |
| Cultivated land | 0.63 | 1.24 | −41.77 | −81.14 |
| Grassland | −0.46 | −92 | 29.49 | 73725 |
| Forest | 2.29 | 118.65 | 0.12 | 2.84 |
| Water area | −2.67 | −26.02 | 1.86 | 24.51 |
Table 7.
Land use transition matrix from pre to post (km2).
| Land Use | Arable Land | Forest | Grassland | Mining | Urban | Water Area | Total |
|---|---|---|---|---|---|---|---|
| Arable land | 50.10 | 0.09 | 0.04 | 0.28 | 0.27 | 0.08 | 50.86 |
| Forest | 0.14 | 1.69 | 0.07 | 0.00 | 0.03 | 1.93 | |
| Grassland | 0.09 | 0.41 | 0.00 | 0.00 | 0.50 | ||
| Mining Land | 0.28 | 0.00 | 0.28 | ||||
| Urban | 0.48 | 0.06 | 4.87 | 0.01 | 5.42 | ||
| Water | 0.67 | 1.96 | 0.06 | 0.10 | 7.47 | 10.26 | |
| Total | 51.48 | 4.22 | 0.04 | 0.68 | 5.23 | 7.59 | 69.24 |
Table 8.
Land use transition matrix from post to reclamation (km2).
| Land Use | Arable Land | Forest | Grassland | Mining | Urban | Water Area | Total |
|---|---|---|---|---|---|---|---|
| Arable land | 9.68 | 3.12 | 28.67 | 8.65 | 0.68 | 0.67 | 51.47 |
| Forest | 0 | 1.15 | 0.16 | 0.95 | 0.07 | 1.88 | 4.22 |
| Grassland | 0 | 0.03 | 0.01 | 0.04 | |||
| Mining land | 0.68 | 0.68 | |||||
| Urban | 0.03 | 0 | 0.61 | 0.11 | 4.37 | 0.1 | 5.23 |
| Water area | 0 | 0.03 | 0.08 | 0.67 | 0.01 | 6.8 | 7.59 |
| Total | 9.71 | 4.34 | 29.53 | 11.07 | 5.13 | 9.45 | 69.23 |
Table 9.
Evaluation indexes of the daily runoff simulation results of the five sites.
| Time | Site | NSE | R2 |
|---|---|---|---|
| Calibration | SW-4 | 0.72 | 0.76 |
| SW-6 | 0.68 | 0.74 | |
| SWQ-4 | 0.69 | 0.71 | |
| Verification | SWQ-2 | 0.67 | 0.66 |
| USGS02295637 | 0.64 | 0.8 |
Table 10.
Total cumulative simulated flow changes among the pre-mining, post-mining, and reclamation periods at the five sites (m3/s).
Table 10.
Total cumulative simulated flow changes among the pre-mining, post-mining, and reclamation periods at the five sites (m3/s).
| Site | Pre | Post | 2014 | Pre–Post Variation (m3/s) | Pre–Post Change (%) | Post–Reclamation Variation (m3/s) | Post–Reclamation Change (%) |
|---|---|---|---|---|---|---|---|
| SW-4 | 637.24 | 825.03 | 821.61 | 187.79 | 29.47 | −3.42 | 0.00 |
| SW-6 | 638.99 | 860.11 | 855.17 | 221.12 | 34.60 | −4.94 | −0.01 |
| SWQ-4 | 108.66 | 83.18 | 78.08 | −25.48 | −23.45 | −5.1 | −0.06 |
| SWQ-2 | 232.29 | 234.98 | 232.32 | 2.69 | 1.16 | −2.66 | −0.01 |
| USGS02295637 | 17,293.72 | 9660.85 | 9555.03 | −7632.87 | −44.14 | −105.82 | −0.01 |
Publisher’s Note: MDPI stays neutral with regard to jurisdictional claims in published maps and institutional affiliations. |
© 2022 by the authors. Licensee MDPI, Basel, Switzerland. This article is an open access article distributed under the terms and conditions of the Creative Commons Attribution (CC BY) license (https://creativecommons.org/licenses/by/4.0/).
Share and Cite
MDPI and ACS Style
Zhang, J.; Liu, M.; Song, Y. Human-Dominated Land Use Change in a Phosphate Mining Area and Its Impact on the Water Environment. Water 2022, 14, 1074. https://doi.org/10.3390/w14071074
AMA Style
Zhang J, Liu M, Song Y. Human-Dominated Land Use Change in a Phosphate Mining Area and Its Impact on the Water Environment. Water. 2022; 14(7):1074. https://doi.org/10.3390/w14071074
Chicago/Turabian StyleZhang, Jing, Mingliang Liu, and Yongyu Song. 2022. "Human-Dominated Land Use Change in a Phosphate Mining Area and Its Impact on the Water Environment" Water 14, no. 7: 1074. https://doi.org/10.3390/w14071074
Note that from the first issue of 2016, this journal uses article numbers instead of page numbers. See further details here.