Article

An Integrated Approach to Assess the Water Efficiency of Introducing Best Management Practices: An Application to Sugarcane Mechanisation in Brazil

1
Research Center for the Management of Environmental and Agricultural Risks (CEIGRAM), Technical University of Madrid, 28040 Madrid, Spain
2
Department of Civil and Natural Resources Engineering, University of Canterbury, Christchurch 8041, New Zealand
3
International Institute for Applied Systems Analysis (IIASA), 2361 Laxenburg, Austria
4
Instituto de Energia e Ambiente, University of São Paulo, São Paulo 05508-010, Brazil
*
Author to whom correspondence should be addressed.
Water 2022, 14(7), 1072; https://doi.org/10.3390/w14071072
Submission received: 16 December 2021 / Revised: 7 March 2022 / Accepted: 24 March 2022 / Published: 29 March 2022

Abstract

:
Management practices reputed to be the best are being introduced widely in the agricultural sector. The identification of what these best management practices are for a given cultivation area requires thorough assessment, using indicators that reduce the risk of unintended impacts and that help manage environmental and economic trade-offs. We propose an integrated assessment that includes two indicators in water footprint sustainability assessment: water apparent productivity and ecosystem services value, thereby considering the trade-offs in the two ecosystem services of water provisioning and erosion potential. The approach was tested in Mogí-Guaçú Pardo (Brazil), a basin that has been subjected to intensive land-use changes through the expansion of sugarcane plantations. Here, regulatory changes have also promoted the introduction of the new management practice of mechanised harvesting, thereby phasing out the practice of burning the fields before manual harvest. A probabilistic approach was applied to account for uncertainty in model parameters. The results reveal that sugarcane has a comparably high economic value but is a less efficient land-use type from a water-use perspective. The total green and blue water footprint in the basin increased by 12% from 2000 to 2012, mainly due to the increase in sugarcane area (+36%). The intensification in sugarcane harvesting practices led to improved economic water-use efficiency and also lowered erosion costs. Adding the new indicators and considering trade-offs linked to new management practices and/or land-use changes allow for more robust decision making.

1. Introduction

Growth in food and agricultural production has been achieved mainly by extending and improving irrigation, increasing agricultural inputs, land expansion, and productivity increases through improved crop varieties [1,2]. However, in many regions the potential for irrigation expansion without threatening environmental sustainability is limited [1]. As the planetary boundary for land-system change is in the ‘increasing risk zone’ [3], further extensions of rainfed agriculture may also be limited. Therefore, further improving land and water productivity is required to increase agricultural production without exceeding natural limits and to curb the ability of ecosystems to support human activities by affecting the water system [2,4]. There is a growing consensus regarding the need to create land systems that increase the value of the services provided [5].
In support of addressing these challenges, Hoekstra and Hung [6] introduced the water footprint concept, which provides a means to evaluate the appropriation of water resources for human activities. Next to assessments of water use for different sectors and at different spatial scales [7,8,9,10,11], or to specifically contrast water use and surface and groundwater availability [12,13,14,15], this indicator has also been used to evaluate the physical and economic productivity of water use, to both assess the efficiency of water usage in specific production systems [16,17] and to inform the discussion on water allocation between different uses [10,18,19,20].
Agriculture and forestry are multifunctional activities with direct and indirect effects on natural processes and various social groups. These processes and effects often lead to trade-offs between provision and regulation or to supporting ecosystem services (ES) [5,21]. Therefore, a valuation of water resources is more complete if these relations are considered [22]. Both the developments in crop management practices and land-use changes have implications for the hydrological cycle, as they lead to different partitioning between infiltration and runoff or to decreased/increased soil moisture [23]. Related to these variables, natural processes such as erosion and sediment transport, nutrient leaching, and accumulation of agrochemicals may be altered. Such effects aggregated over a river basin can modify peak and low flow levels and water quality [24,25], thereby not only potentially affecting blue water resources but also green water availability. Green water is defined as the water stored in the soil and used by vegetation, in particular natural vegetation and rainfed crop production [26]. It is connected to the rest of the hydrological cycle through surface/subsurface runoff and groundwater recharge. Agricultural water management and productivity evaluations need to take this resource into account (ibid.). The economic value of green water is closely linked to existing land use, and in this regard its opportunity cost is at least that of the land use [18,27].
The concept of ecosystem services, defined as “benefits people obtain from ecosystems” [5,28], has been applied to land uses such as agriculture [29,30]. Ecosystem services valuation is a measure of the economic benefits obtained by human beings through the environmental functions linked to an activity, and it has been proposed as a tool for the recognition and inclusion of these benefits into the economic system and decision making [31]. This allows for the inclusion and valuation of unaccounted effects of land use change [29,32]. Grizetti et al. [33] make a case for use of the ES valuation and the inclusion of all hidden benefits of aquatic ecosystems in river basin management plans. Ellison et al. [34] encourage setting the analysis of the hydrological functions of forests as a priority in conservation policy and decision making. Tadeu [35] carried out an analysis of the growth of eucalyptus plantations over pastures and compared both uses to natural areas in terms of water balance, water footprint, and ecosystem services. Tadeu found that evapotranspiration (ET) and water provisioning services were similar among the three uses, and the pressure on the water quality of eucalyptus led to potential negative effects in the basin in the case of the substitution of natural areas by eucalyptus. In the work by Quinteiro et al. [36], the impacts on both green water flows and on reductions in blue water production caused by green water deficits due to land-use change were investigated. These authors conclude that different impacts on green water flows and on blue water production are obtained, depending on the alternative reference land use.
The review paper by Bordonal et al. [37] provides a comprehensive summary of state-of-the-art and main advances made in the sugarcane sector in Brazil. It addresses major environmental impacts and calls for the best management practices as a research priority. However, it lacks an assessment from an economic point of view. El Chami et al. [38], in their review of the impacts of sugarcane production on ecosystem services and human well-being, point out that the literature that was studied failed to include inter-linkage in the effects of sugarcane production and therefore failed to evaluate ecosystem services and account for existing trade-offs. We hypothesise that there is a clear necessity to not only include physical efficiency and water economic valuation in the evaluation of water use in a river basin but also to analyse the ES provided by them. This allows for a broader perspective on the social gains from land and water use for different land uses. We therefore add two indicators, water apparent productivity and ecosystem services value, to the water footprint concept. To demonstrate the use of the additional information that these indicators provide, this paper addresses the effects of past sugarcane developments in Brazil, specifically mechanisation and land-use changes that occurred at the river basin scale, on the efficiency of water use. The analysis is performed in a case study in the Mogí-Guaçú Pardo river basin in São Paulo in the state of Brazil, for the period 2000–2012. This period reflects strong transitions in land use and land management as well as regulatory changes in the region. This is a situation in which the economic value of agricultural production can increase, but at the same time, the ecosystem service value can decrease, or vice versa.
The Water Footprint Assessment (WFA) framework developed by Hoekstra et al. [39] provides the conceptual basis for the developments introduced here. In terms of economic sustainability, the WFA framework states that “water needs to be allocated and used in an economically efficient way. The benefits of a (green, blue or grey) water footprint that results from using water for a certain purpose should outweigh the full cost associated with this water footprint, including externalities, opportunity costs and a scarcity rent. If this is not the case, the water footprint is unsustainable”. The aim of this study is to use additional indicators—water provisioning and erosion costs—to evaluate sugarcane water productivity in relation to the main land uses in terms of economic value and ecosystem services generated, calculated as a function of vegetation evapotranspiration and its green and blue water footprint. The goal is to provide decision makers with an option to further increase the robustness of the decision-making process by employing integrated water footprints, ecosystem services, and economic assessments.

2. Methods and Data

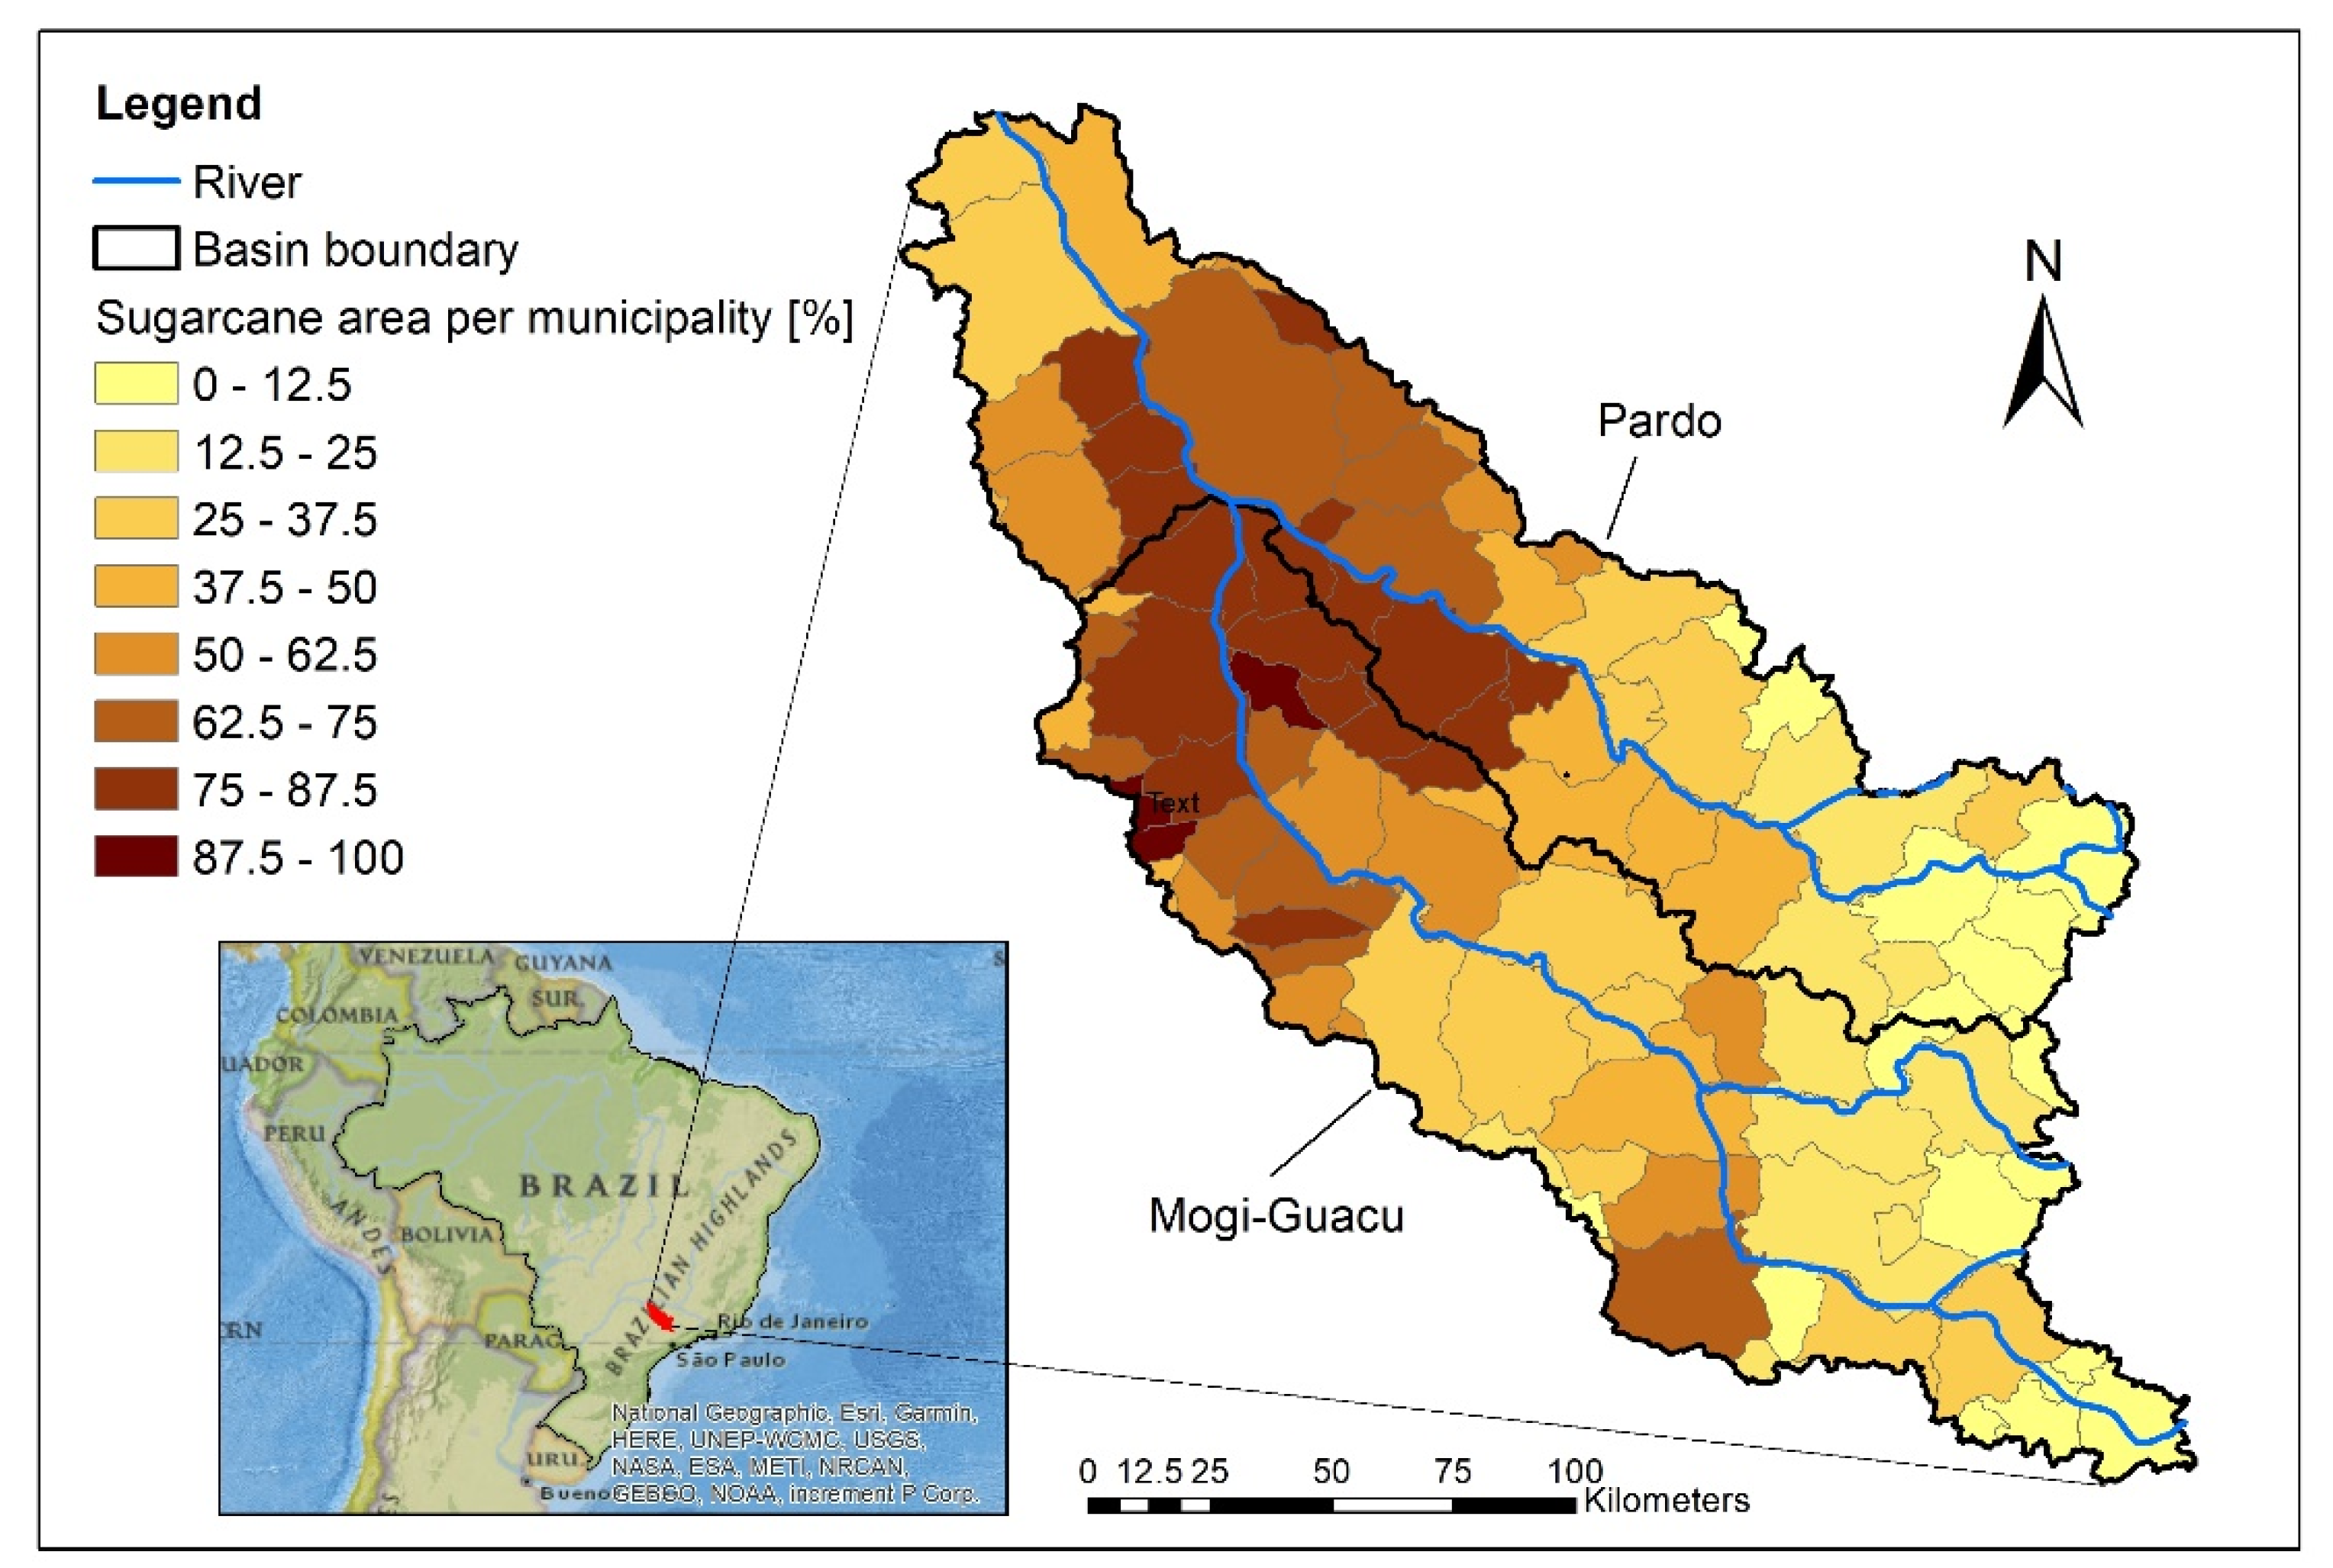
2.1. Case Study Area
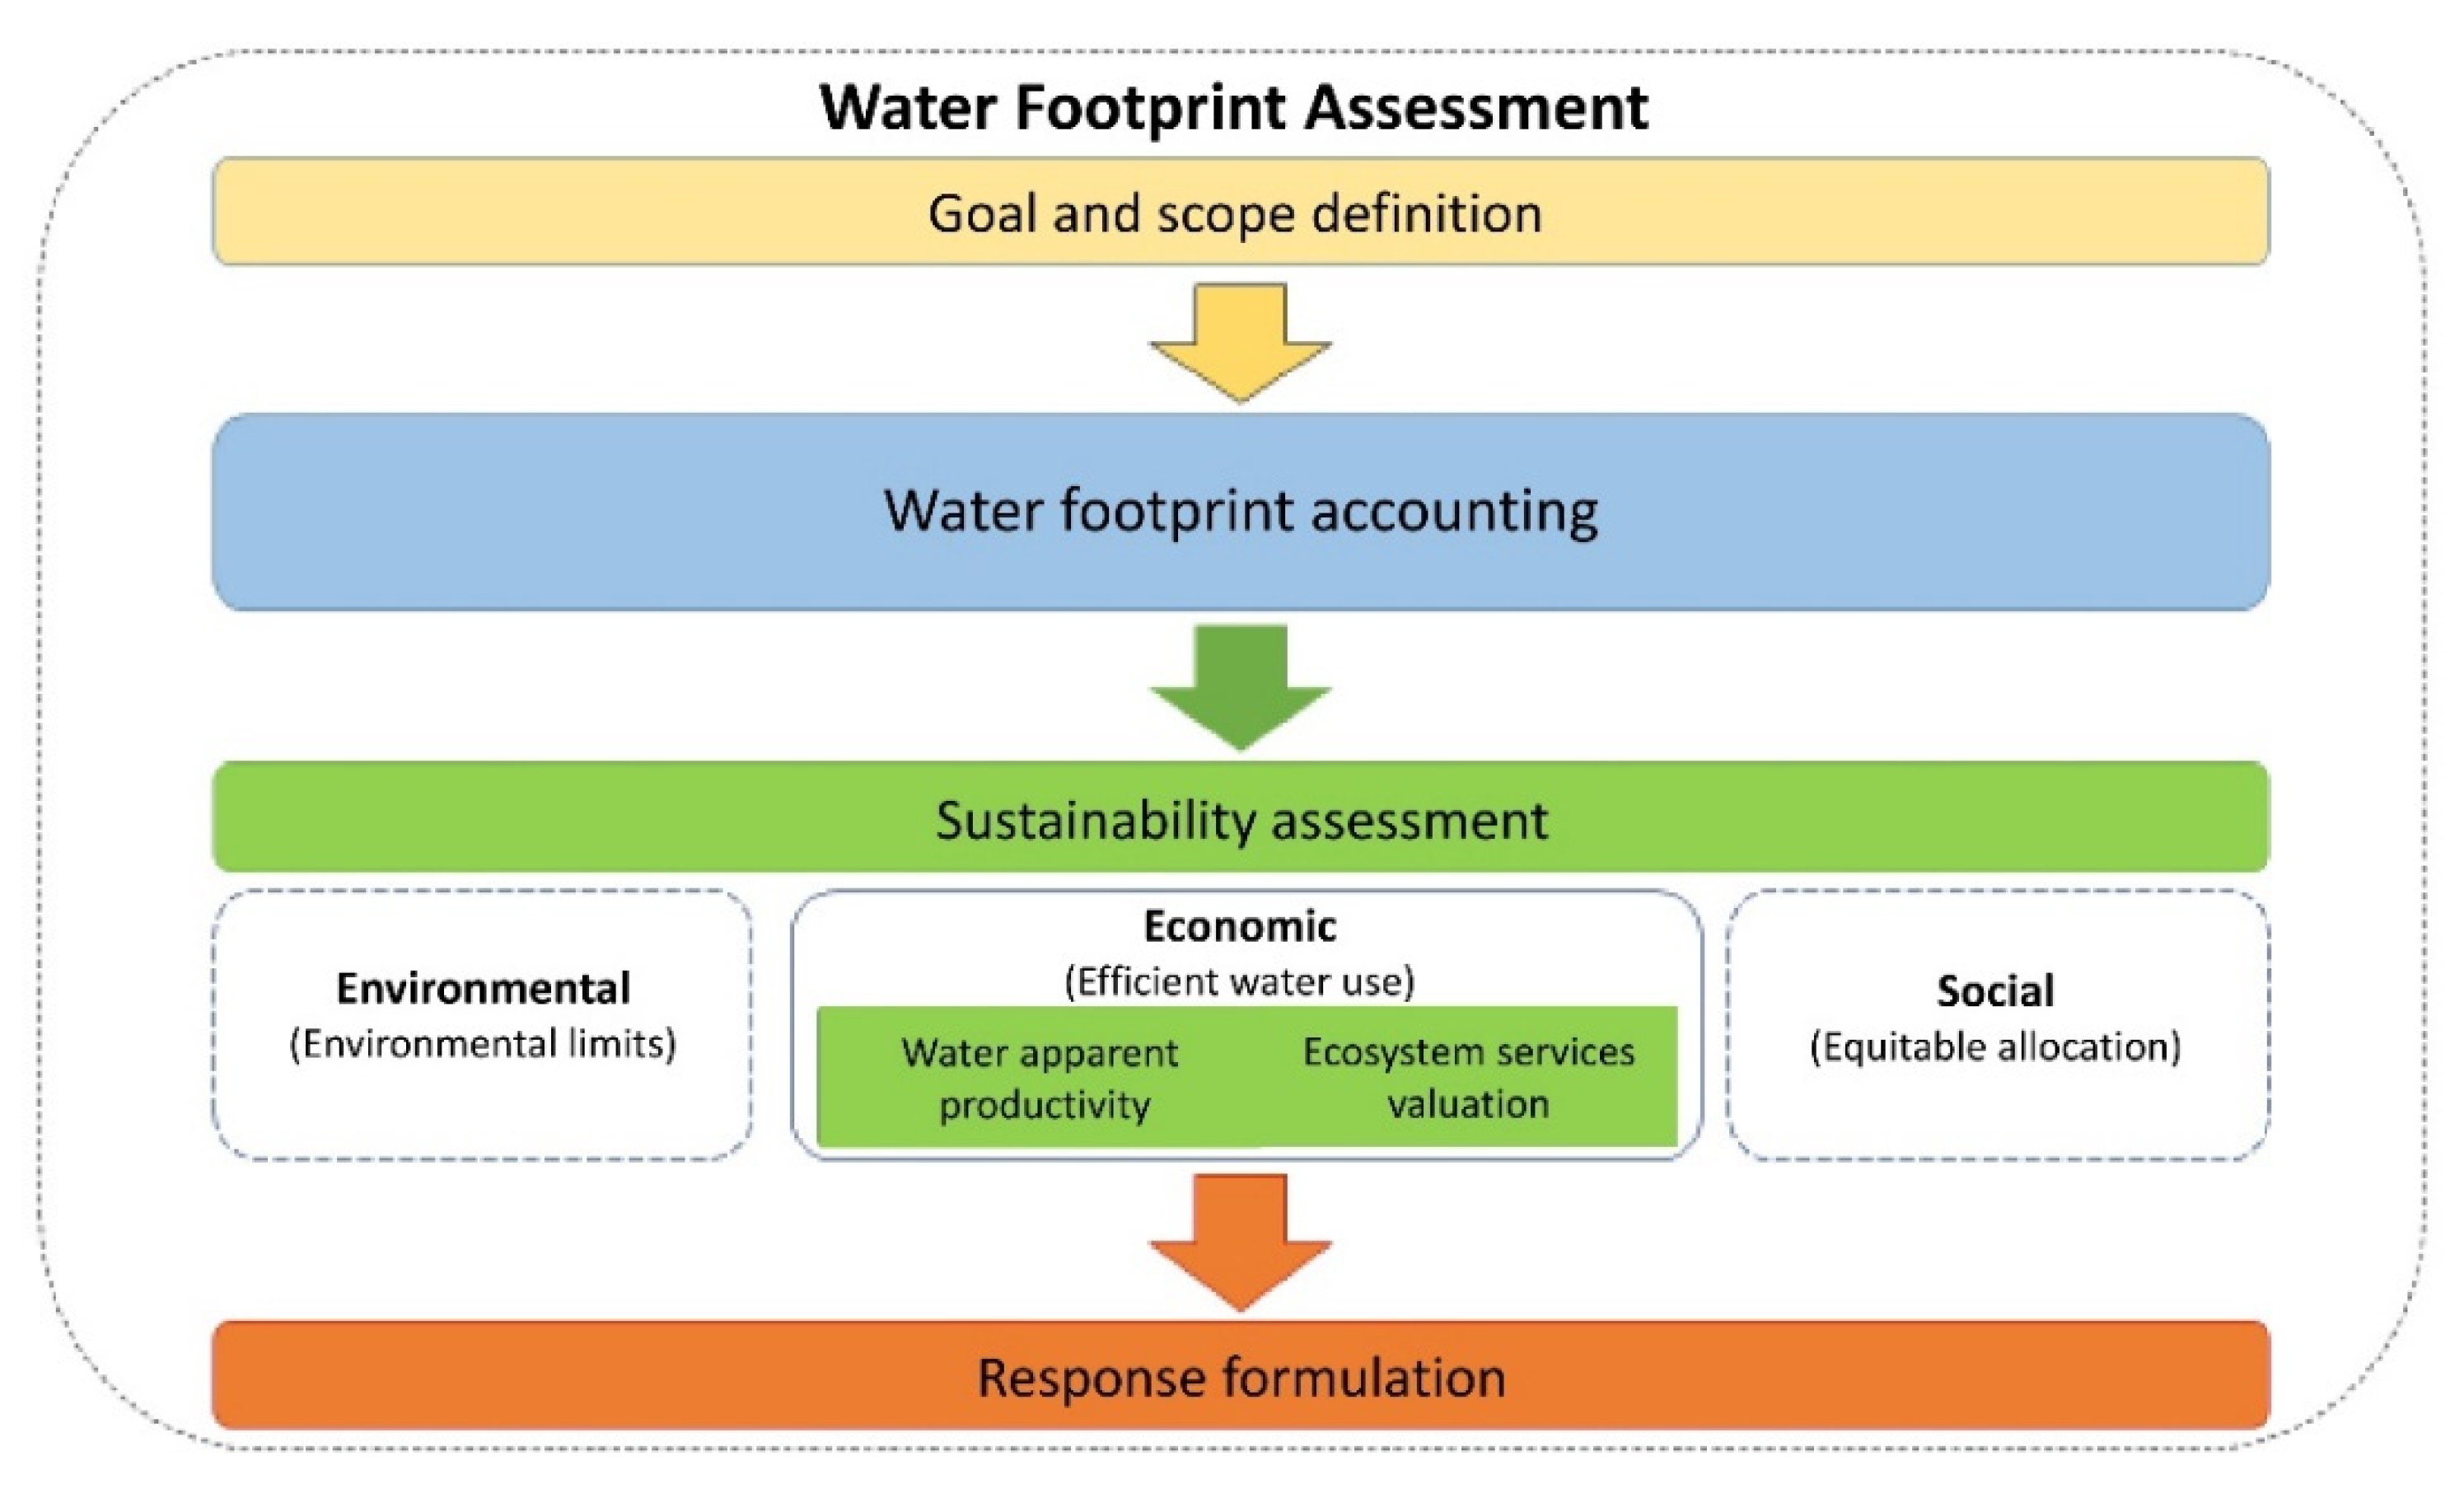
The study region is the São Paulo (SP) state segment of the Mogí-Guaçú Pardo (MGP) river basin in Brazil (see Figure 1). In the last few decades, sugarcane production in SP underwent a process of intensification. Fields were traditionally set on fire to ease manual harvesting. This raised concerns about medical, toxicological, and environmental impacts [40,41]. The alternative is mechanical harvesting, which leaves crop straw on the field. The sugarcane sector implemented a state regulation on sugarcane burning (Etanol verde, [42]), and even committed to move beyond the proposed goals [43]. Through this commitment, the sugar–ethanol sector pledged to gradually phase out burning by 2014 in more suitable areas for mechanical harvesting and by 2017 in the remaining areas. As part of its commitment, the sector also pledged to protect natural riparian areas, and to introduce measures to reduce erosion. Rudorff et al. [43] regarded the commitment as successful by the year 2008, when over 50% of the areas suitable for mechanisation had already abandoned burning practices. Based on CANASAT data, in 2012, 72.6% of sugarcane harvested area in the SP state was mechanically harvested (CANASAT project, see [44]).
The change in sugarcane harvesting from straw burning to mechanical harvesting has effects on the amount of straw left on the field [45] and consequently on the soil’s chemical [40] and physical properties. This results in lower erosion rates and higher infiltration rates [46,47]. The degree of straw cover after a harvest is one of the determining factors in preventing erosion. Reported values of sugarcane erosion rates show great variability [48]. The literature reports average values from 2 t ha−1 [49] to 20 t ha−1 [50] for mechanical harvesting, and erosion rates of 4 t ha−1 [49] to 279 t ha−1 [50]. Andrade et al. [46], in a study carried out in the Araras municipality in the Mogí-Guaçú Pardo (MGP) river basin, report average values of 4 t ha−1 for mechanical harvesting and 14 t ha−1 for manual harvesting with burning.
Data on area per land use as well as on crop and animal production per municipality were obtained from the database of the Institute of Agricultural Economy (IEA) of the São Paulo State Agriculture Secretariat database [51]. Figure 2 shows the average areas per land use in the MGP river basin for the years 2000 and 2012. Sugarcane is the main land use in the MGP river basin, followed by pastures, annual crops, and, to a lesser extent, natural areas (Figure 2). Agriculture is concentrated mostly in the northern part of the basin, where municipalities dedicate 60–80% of their area to sugarcane, the remaining area being devoted to annual crops (corn, soybeans, beans, and sorghum, including a small share of irrigated area), orange orchards, and pastures. Other minor land uses have not been considered. In the study period (2000–2012), sugarcane area has grown 36% at the basin level, whereas pasture areas have diminished by 23% and annual crops (corn, sorghum, soybeans, and groundnuts) have diminished by 33%. This transition has been the main land use change in the MGP between 2000 and 2012.
With respect to annual crops, in this region two harvests per year can be achieved, but over the period of investigation, second harvests have decreased from 50% to 38%. More steep areas to the east of the basin present a varied mosaic of pastures, natural areas, eucalyptus, and coffee plantations. Eucalyptus and coffee plantations have slightly grown in area by 6% and 7%, respectively. Orange orchards have declined at the basin level by 22%. The share of natural land has increased, growing from 187,237 ha in 2000 to 277,008 ha in 2012 (7.7% to 10.6%, respectively) [51]. The basin encompasses the two most relevant biomes of southeastern Brazil: the tropical humid forest (the Mata atlántica) and the savannah-like areas with a marked dry season (locally called Cerrado), which in some places are substituted by semi-deciduous dry land forests (also called Cerradão). The growth in the natural land in Mata atlántica areas was up to 86%, whereas Cerrado areas have remained stable, and Cerradão increased from 50,205 ha to 56,690 ha from 2000 to 2012.
As for the development of sugarcane mechanical harvesting, in the MGP river basin, a total of 881,529 ha was manually harvested in the year 2000—93% of the total sugarcane area—whereas in the year 2012 this number had decreased to 394,674 ha, or 30%. Data for the municipal share of manual or mechanical harvesting were obtained from the CANASAT project [44]. The change is not distributed homogeneously throughout the basin. Areas where mechanisation is difficult (i.e., the steeper areas in the southwest of the river basin) show lower productivities, thereby affecting farm profitability and investment in mechanisation and subsequently leading to land abandonment and restoration of natural areas [43].

2.2. Methodology

We introduce two additional elements, water apparent productivity and ecosystem services valuation, into the sustainability assessment phase of WFA to further increase the robustness of the assessment of the efficient use of water.
In the accounting phase and focusing on the water consumption in production, the green and blue water footprints of the selected land uses in the basin are calculated as well as the value of the ES generated for each land-use type. In the sustainability assessment phase, the efficiency of water use for sugarcane production is assessed by comparing the economic and ES value generated and by relating it to the main land uses of the basin. This is achieved through the evaluation of the water apparent productivity (USD m−3) and complementing it with the results of the ES valuation per unit of land and water (Figure 3).
It must be noted that this study covers the period 2000–2012, (a time period reflective of a strong transition in land use and management, and regulatory change) specifically chosen to demonstrate the usefulness of the added sustainability assessment indicators.
In the water footprint accounting phase, the water footprint per unit of land use is calculated by estimating green (i.e., rainfall stored in the soil matrix) and blue (i.e., surface and groundwater) water consumption per unit of area of each land use (m3 ha−1). Data to determine blue and green water consumption per crop according to Allen et al. [52] were assembled from various sources. Data on crop coefficient values (Kc) were obtained from Allen et al. [52]. Climate data at the municipal level were obtained from Rolim et al. [53] and Sentelhas et al. [54]. Sugarcane is partly irrigated, whereby fertigation is practised. Fertigation was estimated based on the plant’s K2O needs of 135 kg/ha [55]. It was assumed that 33% of the cultivated area was fertigated with vinasse [55], according to the potassium fertilisation needs of sugarcane.
In the case of eucalyptus, tropical areas, or savannah-like Cerrados, the method of Allen et al. [52] is not applicable. The literature provides a varied range of water consumption relative to precipitation and reference evapotranspiration (ETo) for these land uses. In the case of pastures, there is high uncertainty in the estimation of the water consumption using values from [52]. For this reason, we used the semi-empirical approach proposed by Zhang et al. [56] to estimate the water consumption of these land uses (Equation (1)).
E T i , m = P m × ( 1 + ω i × E T o , m P m ( 1 + ω i × E T o , m P m ) + ( P m E T o , m ) ) ,
where ETi,m is evapotranspiration (mm year−1) per land use i and municipality m; Pm is the annual precipitation (mm year−1) per municipality m; ETo,m is the reference evapotranspiration per land use i and municipality m (mm year−1); and ωi is the non-dimensional water availability factor per land use i, which is equivalent to the crop water coefficient proposed by Allen et al. [52] and whose value varies from one plant species to another depending on its physiology and plant architecture [56].
The result of the evapotranspiration thus calculated is largely dependent on the selection of the water availability coefficient ω, a non-dimensional factor describing the ability of each type of vegetation to use water available in the soil. In this work we considered the high variability and uncertainty in the estimation of water consumption in pastures, eucalyptus plantations, and natural areas by using a probabilistic approach for this factor, which allows the building of a continuous probability distribution for ET.
In the sustainability assessment phase, we introduced two indicators. The first indicator is the economic sustainability component of sugarcane, which is measured in relative terms, comparing the sugarcane economic value of water to other land uses in the river basin. The economic value of water is reflected here by the water apparent productivity (WAP), estimated as the market price of production (USD t−1) divided by the total green and blue water footprint per land use.
W A P i ,   y , m = P r o d i , y × P r i , y W F i , y , m ,
where WAPi,y,m is the water apparent productivity (USD m−3) per land use i, municipality m, and year y; Prodi,y is the annual production (t ha−1) per land use i and year y; Pri,y is the price per product; and WFi,y,m is the water consumption (green plus blue) per land use i, municipality m, (m3 ha−1 year−1) and year y. The economic value of the production with respect to the different land uses is calculated by multiplying the production per ha (t ha−1) with the market price of production (USD t−1). Eucalyptus plantations were valued based on prices given by the National Statistics Institute [57] on wood as well as on wood for cellulose production. To estimate eucalyptus wood productivity, the national average data (2008–2011) provided by the Brazilian Association of Forestry Sector Producers for eucalyptus plantations were used and projected to the remaining years [58]. Pasture areas were assessed by dividing the value of bovine meat and milk per municipality, among the natural and managed pastures and fodder crop areas. Data on prices for animal and crop products were obtained from the IEA price database [51]. No economic value was associated with natural areas.
The second indicator is ecosystem services valuation, which is a two-step procedure: estimation of the biophysical dimension (the amount of service provided) and a valuation thereof. In the present study we quantified, in biophysical and economic terms, the capacity of the different land uses of the MGP to supply two key water-related services: water provisioning and soil erosion. Among the range of ES that agricultural areas, forests, and natural areas contribute to the water cycle and water management, the ones prioritised in this work are those that more directly affect water management for downstream users, and in particular the water supply for people and production.
Water provisioning by land use is estimated as a measure of the potential for runoff generation. Following the InVEST methodology [59], the economic value of water provisioning is determined as
W P S i , m , y = ( 1 W F i , m , y P m , y ) × P m , y × A i , m , y × P w ,
where WPSi,m,y is the economic value of water provisioning per land use i, year y, and municipality m (USD year−1); WFi,m,y is the WF (either green or blue plus green) (m3 ha−1 year−1) and Pm is the annual precipitation (mm year−1); Ai,m,y is the area per land use, municipality, and year (ha); and Pw is the price of water. Pw is represented as a random variable as well in order to cover the full range of water prices as provided by the São Paulo state, an average of 0.01–0.033 USD/m3, which is the range of water prices indicated in the legislation for water abstraction and consumption.
The effect of erosion is analysed both in terms of the economic cost treatment of suspended solids in water supply plants and of sediment dredging to prevent reservoir silting up downstream, following [60].
E C i , m , y = ( C t u r b i , m , y + C d r e d i , m , y ) × A i , m , y ,
where ECi,m,y are the erosion costs per land use i, year y, and municipality m (USD year−1); Cturbi,m,y is the cost of the treatment of water turbidity associated to erosion; and Cdredi,m,y the cost of sediment removal per land use i, year y, and municipality m (USD year−1). The costs associated with the generation of turbidity are estimated according to de Sousa Jr. [60] and are based on the calculation of the fraction of eroded material that is carried by surface waters as suspended solids and on the costs of treating the resulting river turbidity to reach drinking water standards, using a series of empirical models from Teixeira and Senhorelo [61]. Potential suspended solid generation is defined as a function of soil loss, sediment generation fraction, and potential runoff. Potential runoff per land use and municipality was estimated with Equation (3). Soil loss was estimated as the erosion rate. Sediment generation rate is a parameter reflecting the amount of sediment in water flows generated from soil erosion in a river basin. A range of values from 0.12 to 0.75 with an average of 0.13, as reported by Chaves [62], was used in the present study.
In a similar way, the costs of sediment dredging in downstream reservoirs are a function of soil loss, sediment generation rate, and unit costs of sediment removal. The costs of sediment dredging that was used follow the indication of de Sousa Jr. [60] of a range from 6.7 to 20 USD t−1 of sediment with an average of 16.7 USD t−1.
Erosion rates per land use (t ha−1) were obtained from the literature review performed by Anache et al. [63] for all the land uses except for sugarcane. For sugarcane, a literature review of potential erosion rates per harvesting method was performed. Data on the percentage of sugarcane harvested mechanically per municipality was obtained from Aguiar et al. [44].
To show the results of the ES value generated in terms of water use, we employed the concept of ES value per unit of water as the relation between ES value generated to the water footprint, which has been calculated as
E S W P i , m , y ,   c = W P S i , m , y E C i , m , y ,   c W F i , y , m ,
where ESWPi,m,y is the ES value per unit of water per land use i, year y, and municipality m as well as the erosion rate level in the case of sugarcane (USD m−3). Since erosion effects are considered a cost instead of a benefit, their valuation is negative.
We randomised selected variables by defining a continuous probability distribution, fitting the literature’s values per land use, and then we modelled the results in a Monte Carlo analysis. A summary of the probabilistic variables used is shown in Table A1 in Appendix A. Water availability factor (ω) distributions were considered normal and parametrised, and therefore the resulting ET values fit the literature’s values. In the case of pasture areas, we distinguished between managed and natural pastures and adjusted ω, and therefore the average could be fit the ET modelled by following Allen et al. [64] and using the Kc values from the same publication. In the case of eucalyptus plantations and tropical rainforest, the resulting ET followed the values reported by Salemi et al. [23] and Almeida and Soares [65], which were 52% to 96% of precipitation. For savannah-like areas, (Cerrado and Cerradão; open and closed savannah) the resulting ET in mm day−1 followed the results from Giambelluca et al. [66] and Olivera et al. [67]. The best fit for erosion rates reported by Anache et al. [63] was found to be the exponential distribution.

3. Results

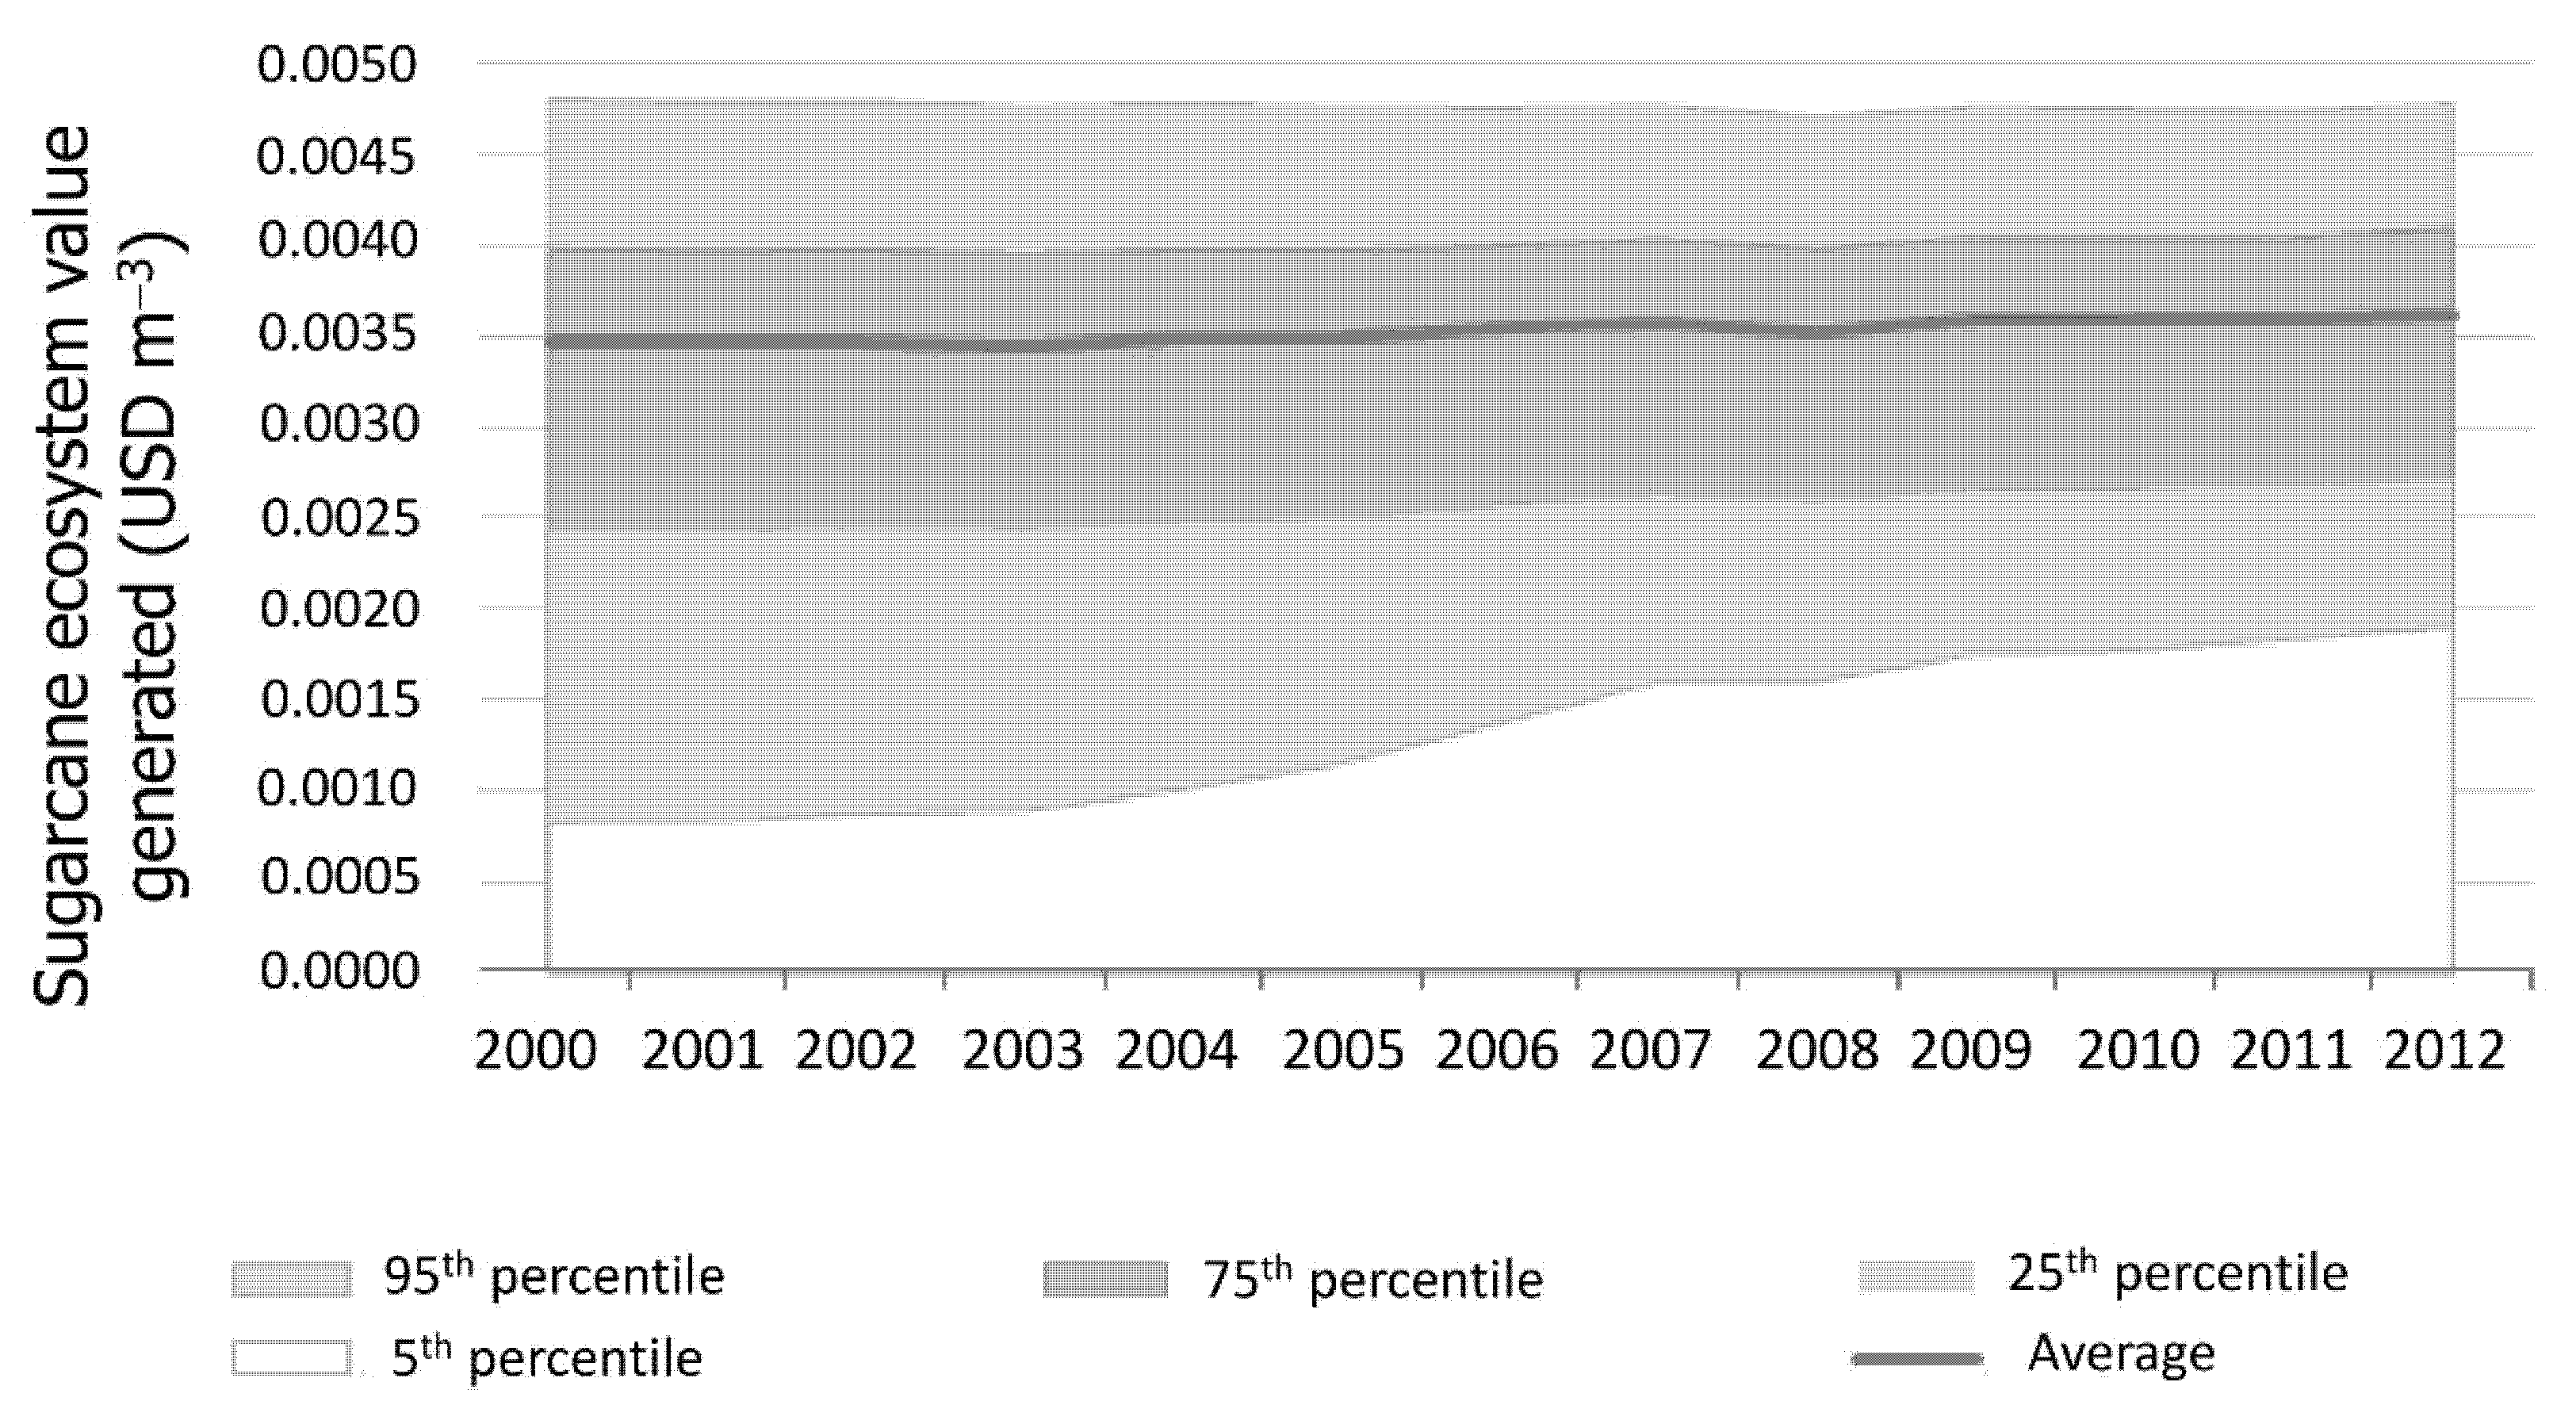
3.1. Sugarcane Economic and Water Productivity

Table 1 summarises the total economic value, WF, value of water provisioning, cost associated with erosion, and ES value per land use class in the years 2000 and 2012. Between 2000 and 2012 the total economic value generated by sugarcane production increased by 410%, from 865 to 4412 million USD. This is related to the increase in price from 13 USD t−1 to 48 USD t−1 in the period studied. As a result, WAP has increased from 0.09 USD m−3 to 0.25 USD m−3. The total blue and green WF of sugarcane also increased in parallel to the increase in cultivated area. Although yield is another factor that can condition the WF results and hence the WAP of crops, in this case sugarcane yields in the basin, on average 72.03 t ha−1, have shown little growth, with an average annual increase of 0.5% throughout the period assessed.
The total ES value generated is the sum of the value of water provisioning service and erosion costs, whereby the latter are a negative contribution. At the basin level, for sugarcane the average value of water provisioning increased by 35%, which is linked to the increase in cultivated area from 39.02 to 52.53 million USD year−1. The average of erosion costs, however, has decreased by 13%, from 5.31 to 4.64 million USD year−1. As a result, the value of ES generated in sugarcane areas has increased, both in absolute and relative terms, throughout the period under consideration. This change is associated with a decrease in the share of sugarcane area using burning practices and manual harvesting.
Figure 4 shows the probability distribution of the sugarcane ES value generated per unit of water consumption considering the distribution of erosion rates. The greatest improvement occurs in the lower end of the range. The uncertainty of the estimation of erosion costs, understood as the difference between the 5th and 95th percentiles, has decreased throughout the period. Average erosion rates in manual harvesting are not only higher but also more variable than average erosion rates in mechanically harvested sugarcane. As a result, as more area shifts from manual to mechanical harvesting, average erosion costs tend to diminish, and the estimation shows less variability.

3.2. Water Productivity in the MGP River Basin

In order to understand what these developments imply for the economic impacts of water and land-use management at the river basin level, we evaluated land uses in the basin using the different indicators per unit of land and unit of water. Average values of water consumption (m3 ha−1), economic value (USD ha−1), water apparent productivity (USD ha−1), value of water provisioning (USD ha−1), erosion costs (USD ha−1), and total value of ES (USD ha−1) per land use in the river basin for the time period 2000–2012 are shown in Table 2.
The relative benefits, from a water resource perspective, in terms of economic value or ecosystem services can be assessed using the indicators WAP and total ecosystem service value. Coffee plantations have the highest WAP of 0.32 USD m−3 averaged over 2000–2012, followed by annual crops (0.25 USD m−3), sugarcane (0.20 USD m−3), and orange orchards (0.17 USD m−3). In strict economic terms, the highest returns on water consumption for the time period 2000–2012 are linked to coffee plantations. However, WAP increased during this time period for all land uses in line with changes in cultivated area per land use, related water footprint, and the growth in prices (Figure 5).
The total ES value averaged over 2000–2012 was the highest for pastures with 66.5 USD ha−1, whereas sugarcane had a value of 35.8 USD ha−1. In terms of ES value per unit of water, pastures, natural areas, and eucalyptus plantations provide the highest values, with an average of 0.0079 USD m−3, 0.0071 USD m−3, and 0.0069 USD m−3, respectively. Despite the differences in the average values, the variability in the results does not allow the ability to define sharp differences among these three land uses (Figure 6). Orange orchards and annual crops have lower values than these land uses, with values of 0.0068 USD m−3 and 0.0075 USD m−3 on average. Relative to their water consumption, sugarcane and coffee plantations are not efficient water uses in terms of ES generation, with 0.0035 and 0.0046 USD m−3 of ES value generated during 2000–2012, despite their improvement over the years.
In the case of annual crops, this result differs from the provision of ES per unit of land in which they performed worse than all the other land uses. As modelled in the present study, the main harvest of annual crops (mostly corn) takes place throughout the summer, the rainy season. The second harvest (mainly soybean) happens during spring and winter, which are drier months than the summer. Therefore, the water provisioning service generation linked to the main crops is higher than that linked to the secondary crops, both in terms of ES value per area and per unit of water consumed. Hence, as the area with secondary crops decreases, the result is that, on average, annual crops show higher water productivity values.

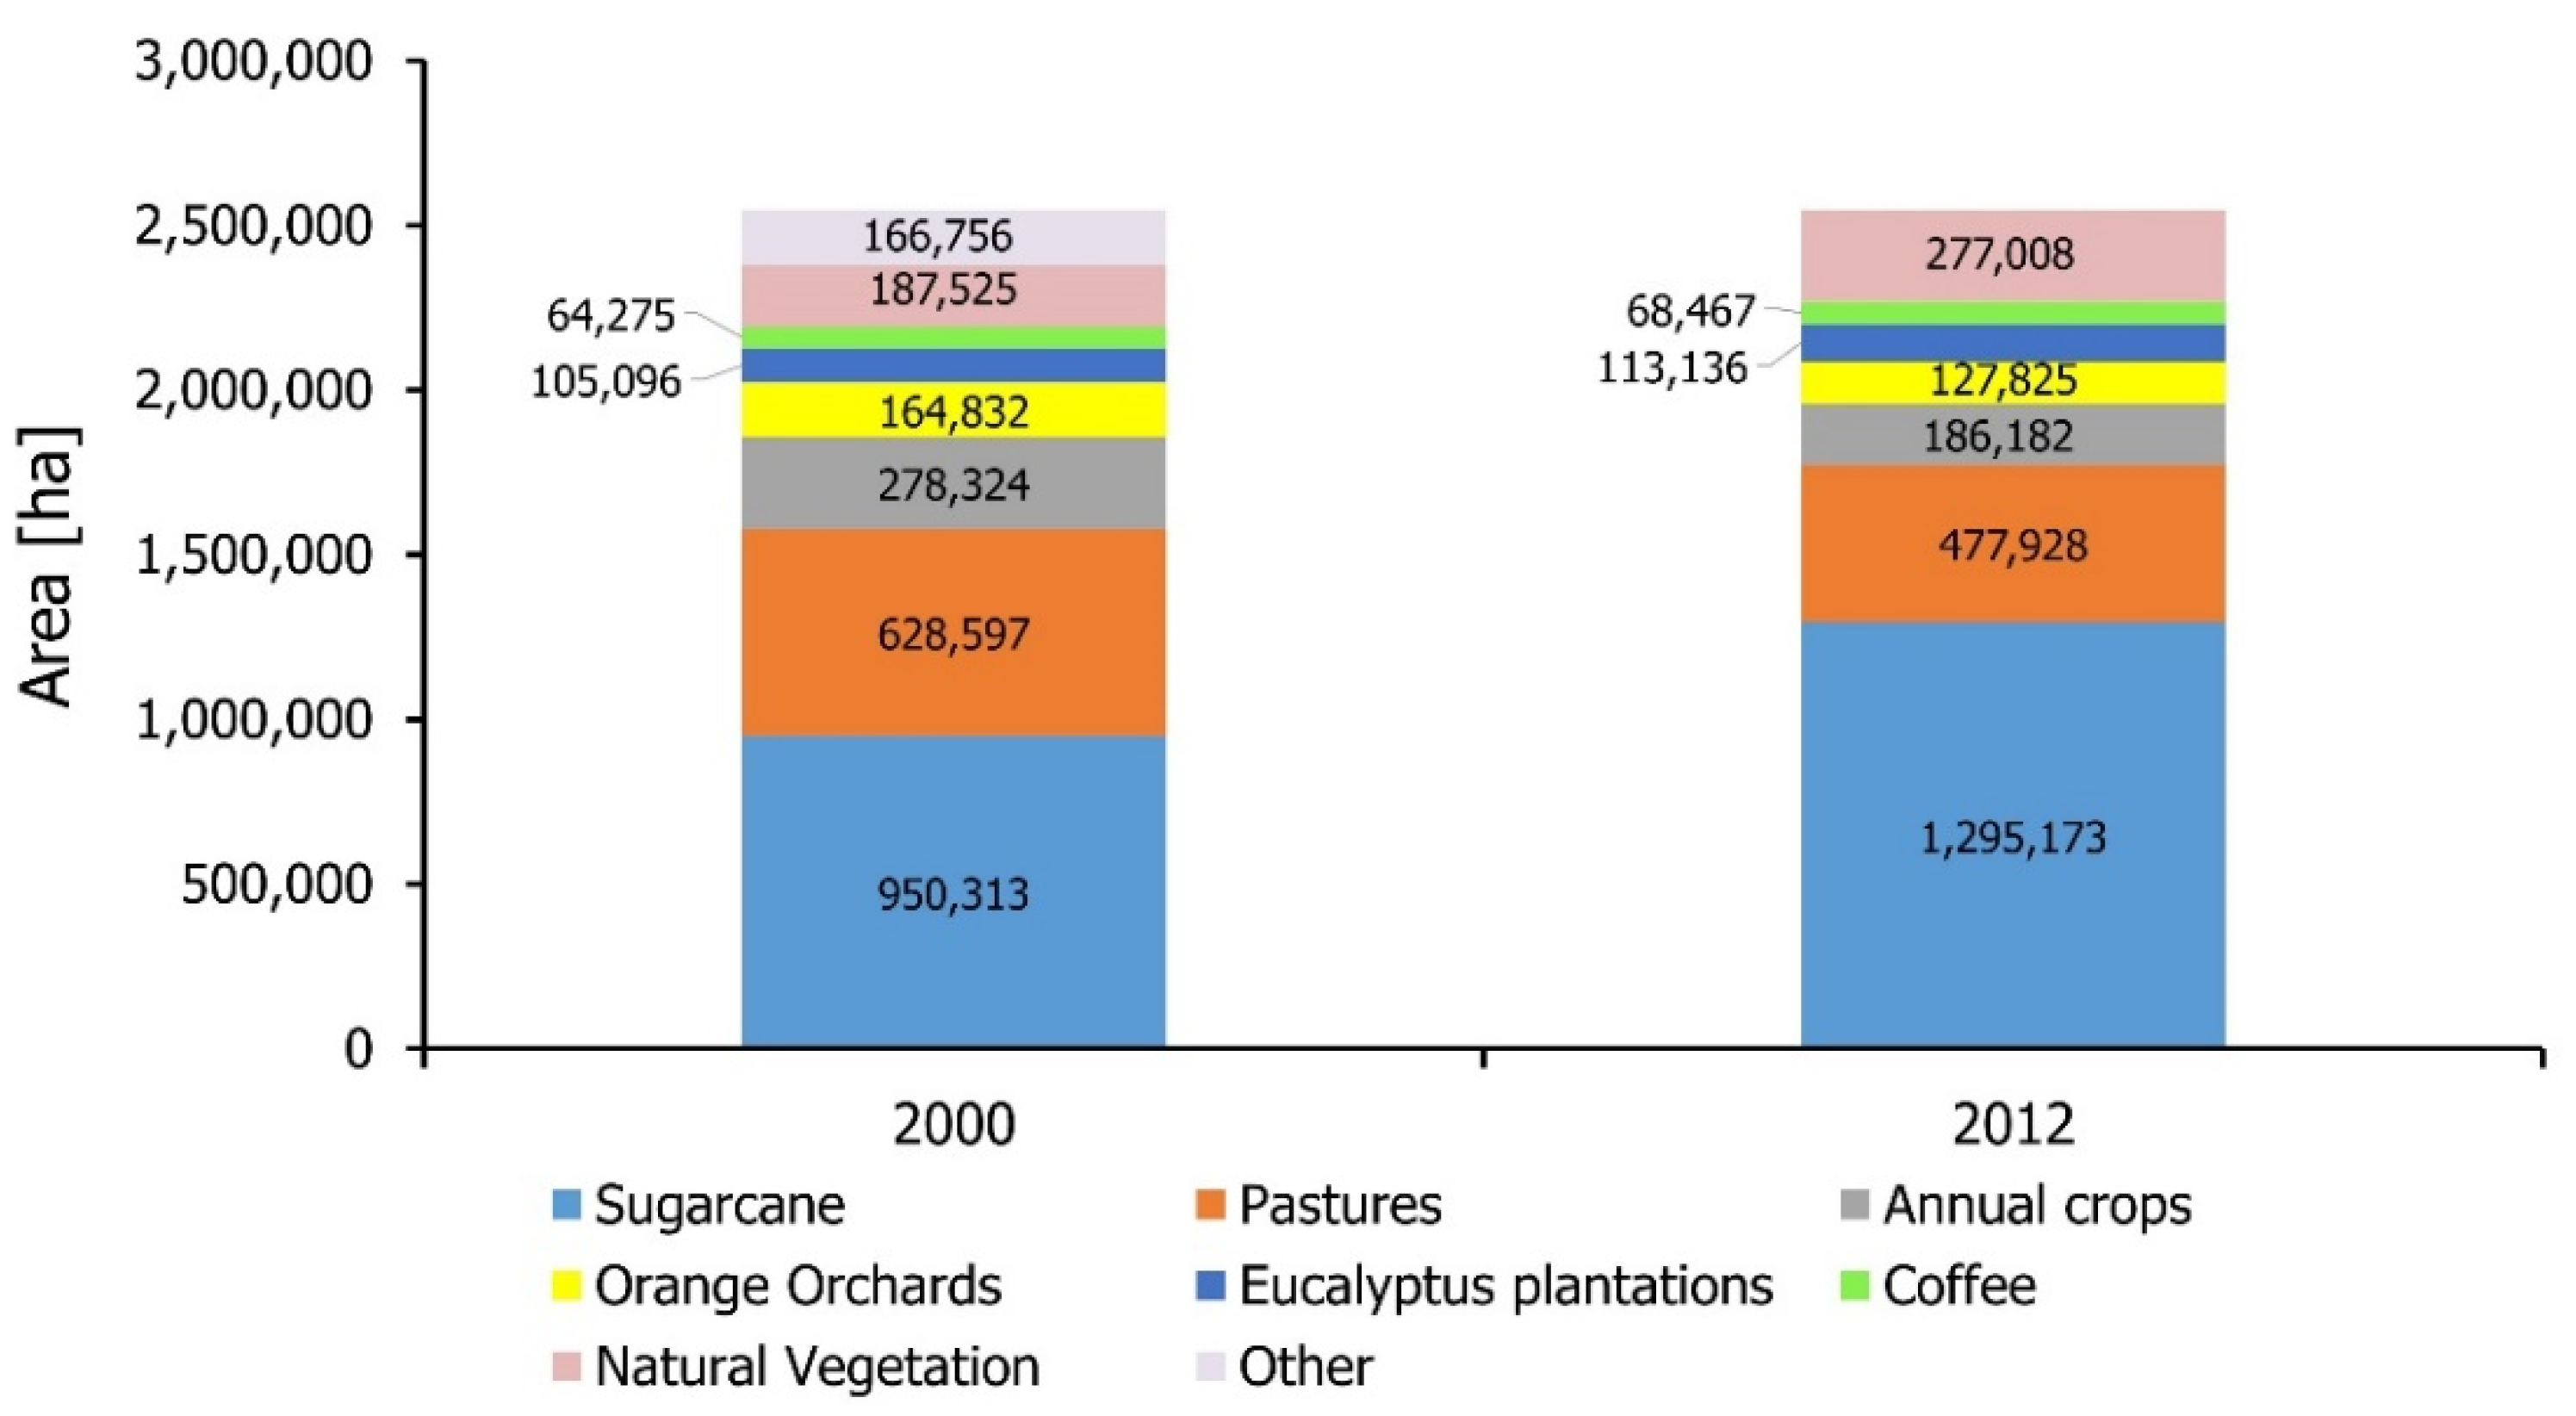
3.3. Economic and Environmental Consequences of Land-Use Changes in the MGP River Basin

Comparing the basin situation in the years 2000 and 2012, it can be seen that the total economic value, WF, and the value of ES per land use class are correlated with cultivated area development (Table 1). In addition to this, in the case of sugarcane the value of ES per land use class is also strongly influenced by management practices. The total water footprint for all land uses in the basin increased by 38%, from 20,926 Mm3 year−1 to 28,891 Mm3 year−1 (96% and 97% green water footprint, respectively) from 2000 to 2012 as a result of land-use changes. Key reasons for the change are the decrease in pastures (−24%) and annual crops (−33%) together with the increase in sugarcane area (+36%).
At the river basin level, pasture areas are the main land-use type providing ES, which is related to water provision and their low potential erosion rates. However, pasture areas have decreased by 24%, which is reflected in the lower value of ES provided in 2012 compared to 2000. The decrease in area has been higher than the decrease in ES provisioning, implying that this land use became more efficient in the provision of these services.
Despite the small share of the area that the natural areas represent at the river basin level, their growth contributes to higher provisions of ES diminishing erosion problems and its effect on water quality at the basin level. As a result of their limited relevance in terms of area, orange orchards do not appear to be an influential land use class at the basin level.
Sugarcane is the dominant land use in the MGP river basin. Its cropping area is increasing mostly over pasture and field crop areas. However, although sugarcane is more profitable, it has a lower WAP than other land uses in the river basin, i.e., coffee orchards and field crops, and all other land uses in terms of ES value per unit of water. The results show that sugarcane is a less efficient land-use type from a water resources perspective, despite its sharp relative improvement in terms of ES over time.
In addition to the land-use substitution effect, at the field level there have been two relevant developments in the study period: the change of sugarcane to mechanised harvesting and the decrease in annual crops’ second harvest. Although both developments represent an improvement in ES generation per unit of water (USD m−3) and area (USD ha−1), only the change in sugarcane mechanisation has had an effect at the basin level. The mechanisation of sugarcane harvesting has lowered the erosion potential of this crop and thus has helped to balance the negative effects of its expansion in terms of area cultivated over pastures. The evolution of the annual crops’ second harvest, though relevant at the field level, has had little effect on the basin average results due to their smaller significance in area terms.

4. Discussion

In Brazil the combination of policies promoting demand, as well as institutional arrangements promoting supply, have resulted in continuous cultivation area and productivity increases over the last few decades [48,68]. The State of São Paulo is one of the country’s most important agricultural regions and the largest sugarcane producer in Brazil. State production has continued to grow from 189.04 million tons in 2000 to 370.96 million tons in 2018, with sugarcane covering 62% of the state’s cultivated area in 2018 [69].
Although this development has brought socio-economic benefits [48], it has also led to environmental and social challenges [40,70]. Until recently, the focus of research in this area has been placed on the direct and indirect effects of sugarcane expansion during the 1990s and early 2000s, when sugarcane was pushing pasture areas beyond the agricultural frontier and leading to deforestation in the biodiversity-rich savannah, the Cerrado [37,41]. According to Sparovek et al. [71], in the SP state sugarcane expanded mostly over existing pastures and annual crops, without causing any direct deforestation on natural areas. There are signs that the land-use succession, from deforestation, to large-scale cattle ranching, extensive crop production, and finally to crop intensification of the more profitable productions with reforestation processes, is advanced in the state [72,73].
Numerous studies have assessed the effects of land-use changes and crop management in the context of Brazilian agricultural production, thereby focusing on individual indicators such as the water use [74,75,76], soil greenhouse gas emissions associated with sugarcane production [77,78,79], or soil erosion [80,81,82,83]. Multiple pressures due to land-use change have also been studied [84]. Here, we combine ES with WF assessment for the evaluation of water productivity in economic terms. Specifically, we have embedded water apparent productivity and ES valuation in WFA. The focus is on consumptive water use (green and blue water footprint) linked to different land uses, rather than on the amount of fresh water required to assimilate pollutants to meet specific water quality standards (grey water footprint). The indicators that were added to the sustainability assessment phase of WFA are complementary. Whereas economic water productivity provides an overview of water efficiency in its contribution to the economic system and to farmers’ livelihoods, the ES approach allows us to provide, through its valuation, a dimension of the contribution to natural processes that bring a value to society. It is a way of considering the synergies and trade-offs between sometimes opposed and sometimes aligned societal benefits of an economic activity. The objective of this assessment is to include a valuation of the externalities linked to land use, water use, and land-use change. We contend that a range of factors needs to be assessed in a combined manner to identify the most efficient and sustainable land use, which should then be incentivised by government policy.
Sartori et al. [85] applied a global biophysical model to estimate soil erosion rates, which are converted into land productivity losses and subsequently were inserted into a global market simulation model. Soil erosion by water is estimated to incur a global annual cost of eight billion US dollars to the global GDP, with a concomitant reduction in global agri-food production and accompanied by a rise in agri-food world prices, depending on the food product category. Furthermore, Sartori et al. [85] conclude that pressure is to increase in order to use more marginal land, which in turn is to drive abstracted water volumes upward. Gomes et al. [83] stress that agricultural expansion in the Brazilian Cerrado is increasing the area of severe erosion, creating agricultural productivity decline and soil nutrient depletion. Bordonal et al. [37], also studying the issues in the Brazilian context and focusing on sugarcane production, report that sugarcane plantations did not contribute to direct deforestation, and its expansion on degraded pastures with the attendant increased yields of food crops and livestock intensification decreased land competition between food and sugarcane. Our current study provides an evaluation of economic sustainability for the Brazilian context in relative terms between dominant land uses in an area, including natural areas and considering the impacts of evolving management practices. This is a further step in the development of assessment tools to support the selection of agricultural production practices that lead to the most efficient land uses in the basin from an environmental, social, and economic point of view, and to manage the trade-offs linked to intensification and land-use change. Gomes et al. [83] point out that government policy should be directed to ensure the sustainable use of soils. The implementation of the best management practices is key due to potential increases in soil erosion resulting from cropland expansion [81,86].
In the current study it has been shown that for sugarcane the value of water provisioning increased by 35%, due to an increase in cultivated area from 39.0 to 52.5 million USD year−1. On the other hand, the average erosion cost has decreased by 13%, from 5.3 to 4.6 million USD year−1. These results suggest that sugarcane substitution of pastures and annual crops may affect the provision of the selected ecosystem services linked to the hydrological cycle. The results clearly point to the need to contextualise the evaluation of water and land-use efficiency of crop production, thereby considering associated land-use changes. The resulting ES values per unit of water are two orders of magnitude lower than the resulting water-apparent productivities. This implies that, given the selection of ES used in this work, water consumption for the sole purpose of ES generation is significantly less productive than water consumption for the purpose of direct economic revenues. However, both evaluations are complementary and address different spheres for water valuation.
The results vary significantly due to the wide range of erosion rates accounted for in sugarcane (both in manual and mechanical harvesting) and the other uses considered in this study. However, in general our findings are supported by the work by Bordonal et al. [37], who state that non-burning sugarcane harvesting is a win-win strategy because of its benefits involving agronomic and environmental aspects, but they caution that soil compaction is among the main issues in sugarcane cropping systems. The Monte Carlo analysis applied in the current work serves to assess the variability in the results and test their robustness to the wide range of erosion rates extracted from the literature. This approach allows for the consideration of uncertainty in the model parameters in the absence of spatially explicit information, and at the same time it avoids the use of single case study values to extract conclusions. This argument applies also to the estimation of water consumption from eucalyptus, pastures, and natural areas, reflecting the uncertainty in the estimation of water consumption for these land uses.
Selection of the best policy choice is not the scope of the present work. It is recommended to apply the integrated approach used here to assess both the time period since 2012 to characterise changes since the transition, and potential land-use and land-management scenarios to support future planning. Furthermore, additional indicators to assess environmental and social consequences should be included. Aspects such as biodiversity loss or ‘jobs per drop’ are key to arriving at the optimal solution. Our focus in the current work is to further refine the sustainability assessment phase of WFA and to demonstrate its usefulness by way of a specifically well-suited case that includes both a change in land use and management practices.
In future work, the approach applied here can be further expanded. One important service that should be considered is the regulation of the hydrological cycle that can affect baseflow regimes and flood risk. Moreover, in the current study cultural services have not been considered. Lastly, the social-ecological component requires attention. An example is the financial hardship that farmers on marginal land, in particular, may face due to the implementation of new legislation and associated implementation costs. In order to monitor implications of land-use and land-management changes, scenario analysis should be carried out.

5. Conclusions

Applying the two indicators that were embedded in WFA, water apparent productivity and ecosystem services value, revealed a number of results that past studies were not able to consider. The land-use changes that occurred in the basin from 2000–2012, overall led to greater economic revenues from water use and to an increase in the value of the services provided per unit of water consumed. The net effect of changes in sugarcane production, both in management practices and expansion, is shown to depend also on the relative substitution of the crop over other land uses. The resulting effect at the basin level from the land-use changes is dependent on the relative performance between land uses, which in turn is conditioned by predominating crop management practices. The evolution from pastures or annual crops to sugarcane areas can improve the economic returns on water use in the first case or decrease them in the latter, but the effects on the provision of ES linked to the hydrological cycle are projected to be negative and very dependent on sugarcane erosion rates. Changes in the management practices for the other land uses, such as the decrease in annual crops’ second harvest or the increase in the share of managed pastures over natural ones, also contribute to the overall water-use efficiency and ES provision in the basin. These findings contribute to the discussions over land-use change and the relation between conservation of natural areas and agricultural intensification. The combined approach employed here (water footprint, ecosystem services, and economic) allows for an assessment of the trade-offs or unintended consequences that may be linked to introducing land-use change and/or agricultural management practices. Hence, the approach can be used as a planning tool. The importance of considering the uncertainty in the calculations is also demonstrated.

Author Contributions

Conceptualization, D.C., M.P., B.A.W., P.S. and A.G.; Data curation, D.C.; Formal analysis, D.C.; Methodology, D.C. and A.G.; Supervision, M.P. and A.G.; Visualization, D.C. and M.P.; Writing—original draft, D.C.; Writing—review and editing, D.C., M.P., B.A.W., P.S. and A.G. All authors have read and agreed to the published version of the manuscript.

Funding

This research received no external funding.

Institutional Review Board Statement

Not applicable.

Informed Consent Statement

Not applicable.

Data Availability Statement

Data on area per land use as well as on crop and animal production per municipality were obtained from the database of the Agricultural Economics Institute (IEA) of the São Paulo State Agriculture Secretariat database (http://www.iea.agricultura.sp.gov.br, last accessed 16 December 2021). Pricing information was obtained from the National Statistics Institute (www.ibge.gov, last accessed 16 December 2021) and the Brazilian Association of Forestry Sector Producers (http://www.ipef.br, last accessed 16 December 2021). Various other data sets were collected from references cited in the paper. These data can be obtained by contacting the authors.

Conflicts of Interest

The authors declare no conflict of interest.

Appendix A

Table A1. Parameters used in the estimation of water consumption per land use.
VariableLand-Use TypeLand UseDistribution Functions
Water availability factor (ω)PastureNatural pasturesCrop ω~Normal (1, 0.55)
Managed pasturesω~Normal (1.9, 0.5)
EucalyptusEucalyptusω~Normal (1.9, 1.75)
Natural vegetationTropical humid forest (Mata atlántica)ω~Normal (2, 2)
Open savannah (Cerrado)ω~Normal (0.9, 1.3)
Wooded savannah (Cerradão)ω~Normal (1.5, 1.65)
Erosion rates (t ha−1)Annual cropsMaize, main harvest, second harvestErosion rate~Exponential (6.2)
Beans, main harvest, second harvestErosion rate~Exponential (13.3)
Soybeans, second harvestErosion rate~Exponential (26.7)
Peanuts, main harvest, second harvestErosion rate~Exponential (8.2)
Sorghum, main harvest, second harvestErosion rate~Exponential (10.21)
Coffee plantationsCoffee plantationsErosion rate~Exponential (2.8)
Orange orchardsOrange orchards, irrigated orange orchardsErosion rate~Exponential (2.94)
SugarcaneManual harvestingErosion rate~Exponential (11.901)
Mechanical harvestingErosion rate~Exponential (5.332)
PastureNatural pastures, managed pasturesErosion rate~Exponential (1.181)
EucalyptusEucalyptusErosion rate~Exponential (0.0903)
Natural vegetationTropical humid forest (Mata atlántica)Erosion rate~Exponential (0.096)
Natural vegetationOpen savannah (Cerrado), Wooded savannah (Cerradão)Erosion rate~Exponential (0.038)
Sediment generation rate--Sediment generation rate~Normal (0.13, 0.013)
Water cost (USD m−3)--Water cost~
Uniform (0.01–0.013)
Unit cost of sediment dredging (USD t−1)--Unit cost sediment dredging~
Normal (16.7–1.67)

References

  1. Jägermeyr, J.; Gerten, D.; Schaphoff, S.; Heinke, J.; Lucht, W.; Rockström, J. Integrated crop water management might sustainably halve the global food gap. Environ. Res. Lett. 2016, 11, 025002. [Google Scholar] [CrossRef]
  2. Müller, N.D.; Gerber, J.S.; Johnston, M.; Ray, D.K.; Ramankutty, N.; Foley, N.A. Closing yield gaps through nutrient and water management. Nature 2012, 490, 254–257. [Google Scholar] [CrossRef] [PubMed]
  3. Steffen, W.; Richardson, K.; Rockström, J.; Cornell, S.E.; Fetzer, I.; Bennett, E.M.; Biggs, R.; Carpenter, S.R.; de Vries, W.; de Wit, C.A.; et al. Plane-tary boundaries: Guiding human development on a changing planet. Science 2015, 347, 736. [Google Scholar] [CrossRef] [PubMed] [Green Version]
  4. Clarke-Sather, A.; Tang, X.; Xiong, Y.; Qu, S.J. The impact of green water policies on household agricultural water productivity in a semi-arid region: A survey based assessment. Water 2018, 10, 11. [Google Scholar] [CrossRef] [Green Version]
  5. Ellis, C.E.; Pascual, U.; Mertz, O. Ecosystem services and nature’s contribution to people: Negotiating diverse values and trade-offs in land systems. Curr. Opin. Environ. Sustain. 2019, 38, 86–94. [Google Scholar] [CrossRef]
  6. Hoekstra, A.Y.; Hung, P.Q. Virtual Water Trade: A Quantification of Virtual Water Flows between Nations in Relation to International Crop Trade; Value of Water Research Report Series, No.11; UNESCO: Paris, France, 2002. [Google Scholar]
  7. Mekonnen, M.M.; Hoekstra, A.Y. A global and high-resolution assessment of the green, blue and grey water footprint of wheat. Hydrol. Earth Syst. Sci. 2010, 14, 1259–1276. [Google Scholar] [CrossRef] [Green Version]
  8. Hoekstra, A.Y.; Mekonnen, M.M. The water footprint of humanity. Proc. Natl. Acad. Sci. USA 2012, 109, 3232–3237. [Google Scholar] [CrossRef] [Green Version]
  9. Marston, L.; Ao, Y.; Konar, M.; Mekonnen, M.M.; Hoekstra, A.Y. High-resolution water footprints of production of the United States. Water Resour. Res. 2018, 54, 2288–2316. [Google Scholar] [CrossRef]
  10. Novo, P.; Dumont, A.; Willaarts, B.A.; Lopez-Gunn, E. More cash and jobs per illegal drop? The legal and illegal water footprint of the Western Mancha Aquifer (Spain). Environ. Sci. Policy 2015, 51, 256–266. [Google Scholar] [CrossRef]
  11. Xu, Z.; Chen, X.; Wu, S.R.; Gong, M.; Du, Y.; Wang, J.; Li, Y.; Liu, J. Spatial-temporal assessment of water footprint, water scarcity and crop water productivity in a major crop production region. J. Clean. Prod. 2019, 224, 375–383. [Google Scholar] [CrossRef]
  12. Gleeson, T.; Wada, Y.; Bierkens, M.; van Beek, L.P.H. Water balance of global aquifers revealed by groundwater footprint. Nature 2012, 488, 197–200. [Google Scholar] [CrossRef]
  13. Hoekstra, A.Y.; Mekonnen, M.M.; Chapagain, A.K.; Mathews, R.E.; Richter, B.D. Global monthly water scarcity: Blue water footprints versus blue water availability. PLoS ONE 2012, 7, e32688. [Google Scholar] [CrossRef] [PubMed]
  14. Zeng, Z.; Liu, J.; Savenije, H. A simple approach to assess water scarcity integrating water quantity and quality. Ecol. Indic. 2013, 34, 441–449. [Google Scholar] [CrossRef]
  15. Multsch, S.; Pahlow, M.; Ellensohn, J.; Michalik, T.; Frede, H.G.; Breuer, L. A hotspot analysis of water footprints and groundwater decline in the High Plains aquifer region, USA. Reg. Environ. Chang. 2016, 16, 2419–2428. [Google Scholar] [CrossRef]
  16. Chico, D.; Santiago, A.D.; Garrido, A. Increasing efficiency in ethanol production: Water footprint and economic productivity of sugarcane ethanol under nine different water regimes in north-eastern Brazil. Span. J. Agric. Res. 2015, 13, e1203. [Google Scholar] [CrossRef]
  17. Pahlow, M.; van Oel, P.R.; Mekonnen, M.M.; Hoekstra, A.Y. Increasing pressure on freshwater resources due to terrestrial feed ingredients for aquaculture production. Sci. Total Environ. 2015, 536, 847–857. [Google Scholar] [CrossRef] [Green Version]
  18. Garrido, A.; Llamas, M.R.; Varela-Ortego, C.; Novo, P.; Rodríguez Casado, R.; Aldaya, M.M. Water Footprint and Virtual Water Trade in Spain: Policy Implications; Observatorio del Agua. Fundación Marcelino Botín: Santander, Spain, 2010; p. 153. [Google Scholar]
  19. Pahlow, M.; Snowball, J.; Fraser, G. Water footprint assessment to inform water management and policy making in South Africa. Water SA 2015, 41, 300–313. [Google Scholar] [CrossRef] [Green Version]
  20. Zhao, D.; Liu, J. A new approach to assessing the water footprint of hydroelectric power based on allocation of water footprints among reservoir ecosystem services. Phys. Chem. Earth 2015, 79–82, 40–46. [Google Scholar] [CrossRef] [Green Version]
  21. Bryan, B.A. Incentives, land use, and ecosystem services: Synthesizing complex linkages. Environ. Sci. Policy 2013, 27, 124–134. [Google Scholar] [CrossRef] [Green Version]
  22. Giordano, M.; Turral, H.; Scheierling, S.M.; Tréguer, D.O.; McCornick, P.G. Beyond “More Crop per Drop”: Evolving Thinking on Agricultural Water Productivity; IWMI Research Report 169; International Water Management Institute (IWMI): Colombo, Sri Lanka; The World Bank: Washington, DC, USA, 2017; 53p. [Google Scholar]
  23. Salemi, L.F.; Groppo, J.D.; Trevisan, R.; de Moraes, J.M.; Ferraz, S.F.; Villani, J.P.; Duarte-Neto, P.J.; Martinelli, L.A. Land-use change in the Atlantic rainforest region: Consequences for the hydrology of small catchments. J. Hydrol. 2013, 499, 100–109. [Google Scholar] [CrossRef]
  24. Locatelli, B.; Vignola, R. Managing watershed services of tropical forests and plantations: Can meta-analysis help? For. Ecol. Manag. 2009, 258, 1864–1870. [Google Scholar] [CrossRef] [Green Version]
  25. Neill, C.; Coe, M.T.; Riskin, S.H.; Krusche, A.V.; Elsenbeer, H.; Macedo, M.N.; McHorney, R.; Lefebvre, P.; Davidson, E.A.; Sheffler, R.; et al. Watershed responses to Amazon soya bean cropland expansion and intensification. Philos. Trans. R. Soc. B 2013, 368, 20120425. [Google Scholar] [CrossRef] [PubMed] [Green Version]
  26. Falkenmark, M.; Röckstrom, J. The new blue and green water paradigm: Breaking new ground for water resources planning and management. J. Water Resour. Plan. Manag. 2006, 132, 129–132. [Google Scholar] [CrossRef]
  27. Lathuillière, M.J.; Coe, M.T.; Johnson, M.S. A review of green- and blue-water resources and their trade-offs for future agricultural production in the Amazon Basin: What could irrigated agriculture mean for Amazonia? Hydrol. Earth Syst. Sci. 2016, 20, 2179–2194. [Google Scholar] [CrossRef] [Green Version]
  28. MEA. Millennium Ecosystem Assessment: Ecosystems and Human Well-Being: Synthesis; Island Press: Washington, DC, USA, 2005. [Google Scholar]
  29. Gordon, L.J.; Finlayson, C.M.; Falkenmark, M. Managing water in agriculture for food production and other ecosystem services. Agric. Water Manag. 2010, 97, 512–519. [Google Scholar] [CrossRef]
  30. Power, A.G. Ecosystem services and agriculture: Tradeoffs and synergies. Philos. Trans. R. Soc. B 2010, 365, 2959–2971. [Google Scholar] [CrossRef]
  31. Constanza, R.; de Groot, R.; Sutton, P.C.; van der Ploeg, S.; Anderson, S.; Kubiszewski, I.; Farber, S.; Turner, R.K. Changes in the global value of ecosystem services. Glob. Environ. Chang. 2014, 26, 152–158. [Google Scholar] [CrossRef]
  32. Bateman, I.J.; Harwood, A.R.; Mace, G.M.; Watson, R.T.; Abson, D.J.; Andrews, B.; Binner, A.; Crowe, A.; Day, B.H.; Dugdale, S.; et al. Bringing ecosystem services into economic decision-making: Land use in the United Kingdom. Science 2013, 341, 45–50. [Google Scholar] [CrossRef]
  33. Grizetti, B.; Lanzanova, D.; Liquete, C.; Raynaud, A.; Cardoso, A.C. Assessing water ecosystem services for water resource management. Environ. Sci. Policy 2016, 61, 194–203. [Google Scholar] [CrossRef]
  34. Ellison, D.; Morris, C.E.; Locatelli, B.; Sheil, D.; Cohen, J.; Murdiyarso, D.; Gutierrez, V.; Noordwijk, M.; van Creed, I.F.; Pokorny, J. Trees, forests and water: Cool insights for a hot world. Glob. Environ. Chang. 2017, 43, 51–61. [Google Scholar] [CrossRef]
  35. Tadeu, N.D. Assessment of Water Impacts of Eucalyptus Monoculture in the Portion of the Basin of the Paraíba do Sul River in São Paulo (Brasil). Master’s Thesis, Graduate Program of Environmental Science, Universidade de São Paulo, São Paulo, Brazil, 2014. [Google Scholar]
  36. Quinteiro, P.; Dias, A.C.; Silva, M.; Ridoutt, B.G.; Arroja, L. A contribution to the environmental impact assessment of green water flows. J. Clean. Prod. 2015, 93, 318–329. [Google Scholar] [CrossRef]
  37. Bordonal, R.D.O.; Carvalho, J.L.N.; Lal, R.; de Figueiredo, E.B.; de Oliveira, B.G.; La Scala, N., Jr. Sustainability of sugarcane production in Brazil. A review. Agron. Sustain. Dev. 2018, 38, 13. [Google Scholar] [CrossRef] [Green Version]
  38. El Chami, D.; Daccache, A.; El Moujabber, M. What are the impacts of sugarcane production on ecosystem services and human well-being? A review. Ann. Agric. Sci. 2020, 65, 188–199. [Google Scholar] [CrossRef]
  39. Hoekstra, A.Y.; Chapagain, A.K.; Aldaya, M.M.; Mekonnen, M.M. The Water Footprint Assessment Manual: Setting the Global Standard; Earthscan: London, UK, 2011. [Google Scholar]
  40. Martinelli, L.M.; Garrett, R.; Ferraz, S.; Naylor, R. Sugar and ethanol production as a rural development strategy in Brazil: Evidence from the state of São Paulo. Agric. Syst. 2011, 104, 419–428. [Google Scholar] [CrossRef]
  41. Goldemberg, J.; Coelho, S.T.; Guardabassi, P. The sustainability of ethanol production from sugarcane. Energy Policy 2008, 36, 2086–2097. [Google Scholar] [CrossRef]
  42. Environment Secretary of São Paulo State. Lei Estadual Nº 11.241, De 19 de Setembro de 2002. 2002. Available online: www.al.sp.gov.br/norma/?id=217. (accessed on 16 December 2021).
  43. Rudorff, B.F.T.; de Aguiar, D.A.; da Silva, W.F.; Sugawara, L.M.; Adami, M.; Moreira, M.X. Studies on the rapid expansion of sugarcane for ethanol production in São Paulo State (Brazil) using Landsat data. Remote Sens. 2010, 2, 1057–1076. [Google Scholar] [CrossRef] [Green Version]
  44. Aguiar, D.A.; Rudorff, B.F.T.; Silva, W.F.A.; Adami, M.; Mello, M.P. Remote sensing images in support of environmental protocol: Monitoring the sugarcane harvest in São Paulo state, Brazil. Remote Sens. 2011, 3, 2682–2703. [Google Scholar] [CrossRef] [Green Version]
  45. Cantalice, J.R.B.; Bezerra, S.A.; Oliveira, O.F.L.; Melo, R.O. Hidraulica e taxas de erosão em entressulcos sob diferentes declividades e doses de cobertura morta. Caatinga 2009, 22, 68–74. [Google Scholar]
  46. Andrade, D.C.; Sobrinho, R.P.; Tôsto, S.G. Valoração econômico-ecológica de serviços ecossistêmicos: Ilustração preliminar para o caso do soloa agrícola de Araras, São Paulo. Ciência Ambiente 2015, 50, 117–134. [Google Scholar]
  47. Kornecki, T.S.; Fouss, J.L. Sugarcane residue management effects in reducing soil erosion from quarter drains in southern Louisiana. Appl. Eng. Agric. 2011, 27, 597–603. [Google Scholar] [CrossRef]
  48. Filoso, S.; Carmo, J.B.; Mardegan, S.F.; Lins, S.R.M.; Gomes, T.F.; Martinelli, L.Z. Reassessing the environmental impacts of sugarcane ethanol production in Brazil to help meet sustainability goals. Renew. Sustain. Energy Rev. 2015, 52, 1847–1856. [Google Scholar] [CrossRef]
  49. Martins Filho, M.V.; Liccioti, T.T.; Pereira, G.T.; Marques, J.; Sanchez, R.B. Soil and nutrients losses of an alfisol with sugarcane crop residue. Eng. Agrícola 2009, 29, 8–18. [Google Scholar] [CrossRef] [Green Version]
  50. Sparovek, G.; Schnug, E. Temporal erosion-induced soil degradation and yield loss. Soil Sci. Soc. Am. J. 2001, 65, 1479–1486. [Google Scholar] [CrossRef]
  51. IEA Institute for Agricultural Economics, Luiz de Queiroz College of Agriculture, University of São Paulo. Statistics of Agricultural Production in São Paulo, Brazil. 2016. Available online: www.iea.sp.gov.br/out/bancodedados.html (accessed on 16 December 2021).
  52. Allen, R.G.; Pereira, L.S.; Raes, D.; Smith, M. Crop Evapotranspiration—Guidelines for Computing Crop Water Requirements—FAO Irrigation and Drainage Paper 56; Food and Agriculture Organization: Rome, Italy, 1998. [Google Scholar]
  53. Rolim, G.S.; Sentelhas, P.C.; Barbieri, V. Planilhas no ambiente ExcelTM para os cálculos de balanços hídricos: Normal, sequencial, de cultura e de produtividade real e potencial. Rev. Bras. Agrometeorol. 1998, 6, 133–137. [Google Scholar]
  54. Sentelhas, P.C.; Pereira, A.R.; Marin, F.R.; Angelocci, L.R.; Alfonsi, R.R.; Caramori, P.H.; Swart, S. BH-BRASIL—Balanços Hídricos Climatológicos de 500 Localidades Brasileiras; ESALQ/USP: Piracicaba, Brazil, 1999. [Google Scholar]
  55. Korndörfer, G.H. Improving nutrient management in sugarcane cultivation. In Achieving Sustainable Cultivation of Sugarcane; Rott, P., Ed.; Burleigh Dodds: Cambridge, UK, 2017. [Google Scholar]
  56. Zhang, L.; Dawes, W.R.; Walker, G.R. Response of mean annual evapotranspiration to vegetation changes at catchment scale. Water Resour. Res. 2001, 37, 701–708. [Google Scholar] [CrossRef]
  57. IBGE, Brazilian Institute of Geography. Statistics of Value of Forest Products and Forestry. 2016. Available online: www.ibge.gov.br (accessed on 16 December 2021).
  58. Bracelpa, Associação Brasileira de Celulose e Papel. Relatório Florestal, Statistical Yearbook. 2014. Available online: http://www.ipef.br (accessed on 16 December 2021).
  59. Tallis, H.T.; Ricketts, T.; Guerry, A.D.; Wood, S.A.; Sharp, R.; Nelson, E.; Ennaanay, D.; Wolny, S.; Olwero, N.; Vigerstol, K.; et al. InVEST 2.5.6 User’s Guide; The Natural Capital Project: Stanford, USA, 2013. [Google Scholar]
  60. de Sousa, W.C., Jr. Pagamento por Serviços Ecossistêmicos: Mata Ciliar, Erosão, Turbidez e Qualidade de Água; Technical Report 2011. Projeto de Recuperação de Matas Ciliares; São Paulo State Environmental Agency: Sao Paulo, Brazil, 2011. [Google Scholar]
  61. Teixeira, E.C.; Senhorelo, A.P. Avaliação de correlação entre turbidez e concentração de sólidos suspensos em bacias com uso e ocupação diferenciada. In Proceedings of the Congresso Brasileiro de Engenharia Sanitaria e Ambiental, Rio de Janeiro, Brazil, 2–6 October 2000; Associação Brasileira de Engenharia Sanitária e Ambiental: Rio de Janeiro, Brazil, 2000; Volume 22. [Google Scholar]
  62. Chaves, H.M.L. Incertezas na predição da erosão com a USLE: Impactos e mitigação. Rev. Bras. Ciência Solo 2010, 34, 2021–2029. [Google Scholar] [CrossRef]
  63. Anache, J.A.A.; Wendland, E.C.; Oliveira, P.R.S.; Flanagan, D.C.; Nearing, M.A. Runoff and soil erosion plot-scale studies under natural rainfall: A meta-analysis of the Brazilian experience. Catena 2017, 152, 29–39. [Google Scholar] [CrossRef]
  64. Allen, R.G.; Pruitt, W.O.; Wright, J.L.; Howell, T.A.; Ventura, F.; Snyder, R.; Itenfisu, D.; Steduto, P.; Berengena, J.; Baselga Yrisarry, J.; et al. A recommendation on standardized surface resistance for hourly calculation of reference ETo by the FAO56 Penman-Monteith method. Agric. Water Manag. 2016, 81, 1–22. [Google Scholar] [CrossRef]
  65. Almeida, A.C.; Soares, J.V. Comparação entre uso de agua em plantações de Eucalyptus grandis e floresta obbrofila densa (Mata atlântica) na costa leste do Brasil. Árvore 2003, 27, 159–170. [Google Scholar] [CrossRef] [Green Version]
  66. Giambelluca, T.W.; Scholz, F.G.; Bucci, S.J.; Meinzer, F.C. Evapotranspiration and energy balance of Brazilian savannas with contrasting tree density. Agric. For. Meteorol. 2009, 149, 1365–1376. [Google Scholar] [CrossRef]
  67. Oliveira, R.S.; Bezerra, L.; Davidson, E.A.; Pinto, F.; Klink, C.A.; Nepstad, D.C.; Moreira, A. Deep root function in soil water dynamics in cerrado savannas of central Brazil. Funct. Ecol. 2005, 19, 574–581. [Google Scholar] [CrossRef]
  68. Furtado, A.T.; Scandiffio, M.I.G.; Cortez, L.A.B. The Brazilian sugarcane innovation system. Energy Policy 2011, 39, 156–166. [Google Scholar] [CrossRef]
  69. IBGE—Brazilian Institute of Statistics. Censo Agropecuario. Statistics of Municipal Agricultural Production. 2018. Available online: www.ibge.gov.br/estatisticas/economicas/agricultura-e-pecuaria/9117-producao-agricola-municipal-culturas-temporarias-e-permanentes.html?=&t=o-que-e (accessed on 16 December 2021).
  70. Lapola, D.M.; Martinelli, L.A.; Peres, C.A.; Ometto, J.P.; Ferreira, M.E.; Nobre, C.A.; Aguiar, A.P.D.; Bustamante, M.M.C.; Cardoso, M.C.; Costa, M.H.; et al. Pervasive transition of the Brazilian land-use system. Nat. Clim. Chang. 2014, 4, 27–35. [Google Scholar] [CrossRef] [Green Version]
  71. Sparovek, G.; Berndes, G.; Egeskog, A.; de Freitas, F.L.M.; Gustafsson, S.; Hansson, J. Sugarcane ethanol production in Brazil: An expansion model sensitive to socioeconomic and environmental concerns. Biofuels Bioprod. Biorefining 2007, 1, 270–282. [Google Scholar] [CrossRef]
  72. Farinacci, J.S.; Ferreira, L.d.C.; Batistella, M. Forest transition and ecological modernization: Eucalyptus forestry beyond good and bad. Ambiente Soc. 2013, 16, 25–46. [Google Scholar]
  73. Calaboni, A.; Tambosi, L.R.; Igari, A.T.; Farinaci, J.S.; Metzger, J.P.; Uriarte, M. The forest transition in São Paulo, Brazil: Historical patterns and potential drivers. Ecol. Soc. 2018, 23, 7. [Google Scholar] [CrossRef]
  74. Lathuillière, M.J.; Coe, M.T.; Castanho, A.; Graesser, J.; Johnson, M.S. Evaluating water use for agricultural intensification in southern Amazonia using the water footprint sustainability assessment. Water 2018, 10, 349. [Google Scholar] [CrossRef] [Green Version]
  75. Flach, R.; Skalský, R.; Folberth, C.; Balkovic, J.; Jantke, K.; Schneider, U.A. Water productivity and footprint of major Brazilian rainfed crops—A spatially explicit analysis of crop management scenarios. Agric. Water Manag. 2020, 233, 105996. [Google Scholar] [CrossRef]
  76. Multsch, S.; Krol, M.S.; Pahlow, M.; Assunção, A.L.C.; Barretto, A.G.O.P.; De Jong Van Lier, Q.; Breuer, L. Assessment of potential implications of agricultural irrigation policy on surface water scarcity in Brazil. Hydrol. Earth Syst. Sci. 2020, 24, 307–324. [Google Scholar] [CrossRef] [Green Version]
  77. De Oliveira, M.E.D.; Moraes, S.O. Modeling approaches for agricultural N2O fluxes from large scale areas: A case for sugarcane crops in the state of São Paulo—Brazil. Agric. Syst. 2017, 150, 1–11. [Google Scholar] [CrossRef]
  78. Gonzaga, L.C.; Zotelli, L.D.; de Castro, S.G.Q.; de Oliveira, B.G.; Bordonal, R.D.O.; Cantarella, H.; Carvalho, J.L.N. Implications of sugarcane straw removal for soil greenhouse gas emissions in São Paulo state, Brazil. Bioenergy Res. 2019, 12, 843–857. [Google Scholar] [CrossRef] [Green Version]
  79. Meurer, K.H.E.; Boenecke, E.; Franko, U. Evaluating emissions of nitrous oxide from cropland soils under different rotations in Mato Grosso, Brazil: A scenario simulation study. Pedosphere 2019, 29, 432–443. [Google Scholar] [CrossRef]
  80. Merten, G.H.; Minella, J.P.G. The expansion of Brazilian agriculture: Soil erosion scenarios. Int. Soil Water Conserv. Res. 2013, 1, 37–48. [Google Scholar] [CrossRef] [Green Version]
  81. Borrelli, P.; Robinson, D.A.; Fleischer, L.R.; Lugato, E.; Ballabio, C.; Alewell, C.; Meusburger, K.; Modugno, S.; Schütt, B.; Ferro, V.; et al. An assessment of the global impact of 21st century land use change on soil erosion. Nat. Commun. 2017, 8, 2013. [Google Scholar] [CrossRef] [Green Version]
  82. Colman, C.B.; Oliveira, P.T.S.; Almagro, A.; Soares-Filho, B.S.; Rodrigues, D.B.B. Effects of climate and land-cover changes on soil erosion in Brazilian Pantanal. Sustainability 2018, 11, 7053. [Google Scholar] [CrossRef] [Green Version]
  83. Gomes, L.; Simões, S.J.C.; Dalla Nora, E.L.; de Sousa-Neto, E.R.; Forti, M.C.; Ometto, J.P.H.B. Agricultural expansion in the Brazilian Cerrado: Increased soil and nutrient losses and decreased agricultural productivity. Land 2019, 8, 12. [Google Scholar] [CrossRef] [Green Version]
  84. Grecchi, R.C.; Gwyn, Q.H.J.; Bénié, G.B.; Formaggio, A.R.; Fahl, F.C. Land use and land cover changes in the Brazilian Cerrado: A multidisciplinary approach to assess the impacts of agricultural expansion. Appl. Geogr. 2014, 55, 300–312. [Google Scholar] [CrossRef]
  85. Sartori, M.; Philippidis, G.; Ferrari, E.; Borrelli, P.; Lugato, E.; Montanarella, L.; Panagos, P. A linkage between the biophysical and the economic: Assessing the global market impacts of soil erosion. Land Use Policy 2019, 86, 299–312. [Google Scholar] [CrossRef]
  86. Panagos, P.; Borrelli, P.; Robinson, D. FAO calls for actions to reduce global soil erosion. Mitig. Adapt. Strateg. Glob. Chang. 2020, 25, 789–790. [Google Scholar] [CrossRef] [Green Version]
Figure 1. Mogí-Guaçú Pardo (MGP) river basin and average sugarcane area in percent per municipality for the time period 2000–2012 (Data source [51]).
Water 14 01072 g001
Figure 2. Main cultivated areas per land-use type for the years 2000 and 2012 in the MGP river basin (Data source [51]). Other minor land uses in the area not considered.
Water 14 01072 g002
Figure 3. Water apparent productivity and ecosystem services valuation embedded in the sustainability assessment phase of Water Footprint Assessment.
Water 14 01072 g003
Figure 4. Average, as well as 5th, 25th, 75th, and 95th percentiles of sugarcane ES value per unit of water (USD m−3).
Water 14 01072 g004
Figure 5. Water apparent productivity WAP for all land uses for the years 2000 and 2012.
Water 14 01072 g005
Figure 6. Box-and-whisker plots of ES value generated per unit of water (USD m−3) per land use type for the years 2000 and 2012.
Water 14 01072 g006
Table 1. Total economic value (EV), WF, value of water provisioning (WPS), cost associated with erosion (EC), and ES value per land use class in the years 2000 and 2012.
Land Use ClassYearTotal EVTotal WFTotal WPSTotal ECTotal ES
(106 USD year1)(106 m3 year1)(106 USD year1)(106 USD year1)(106 USD year1)
Annual crops2000159.35140711.491.939.56
2012496.765167.950.907.05
Sugarcane2000864.85971339.025.3133.71
20124412.2417,40352.534.6447.89
Coffee2000114.055962.70.082.62
2012515.318233.390.093.30
Orange Orchards2000120.2313979.590.249.35
2012365.2914817.430.187.25
Eucalyptus plantations200024.199346.420.056.37
201289.3613377.010.056.96
Pastures2000176.86525942.290.6141.68
2012542.07439232.350.4731.88
Natural Vegetation20000162011.590.0111.58
20120293916.950.0116.94
TOTAL 200020001459.5320,926123.108.22114.87
TOTAL 201220126421.0328,891127.616.35121.27
Table 2. The percentage share of the total land area per land use and average values of water consumption (WF) (m3 ha−1), economic value (EV) (USD ha−1), water apparent productivity (WAP) (USD ha−1), value of water provisioning (WPS) (USD ha−1), erosion costs (EC) (USD ha−1), and total ES value (USD ha−1) per land use.
Land Use ClassShare of Total AreaWFEVWAPWPSECTotal ES Value
(%)(m3 ha1)(USD ha1)(USD m3](USD ha1)(USD ha1)(USD ha1)
Annual crops9.4417610600.2536.24.9831.2
Sugarcane45.610,20720470.2040.74.9335.8
Coffee2.710,38933260.3248.91.3747.5
Orange orchards5.9846814030.1758.61.9256.7
Eucalyptus plantations4.488644520.0561.10.4460.7
Pastures22.583955060.0667.50.9666.5
Natural vegetation9.4869700.0061.5061.5
Publisher’s Note: MDPI stays neutral with regard to jurisdictional claims in published maps and institutional affiliations.

